Embed Size (px)
Citation preview

9/23/2010
1
Global WarmingGlobal Warmingto the Mass Audienceto the Mass Audience
ExplainingExplaining
Glenn SchwartzGlenn SchwartzChief Meteorologist NBC10
PhiladelphiaChief Meteorologist NBC10
Philadelphia
Global WarmingGlobal WarmingVisual EvidenceVisual Evidence
Shepard Glacier-1913Glacier National Park, Montana
Shepard Glacier-1913Glacier National Park, Montana
Shepard Glacier-2005Glacier National Park, Montana
Shepard Glacier-2005Glacier National Park, Montana
To help protect your privacy, PowerPoint prevented this external picture from being automatically downloaded. To download and display this picture, click Options in the Message Bar, and then click Enable external content.
Comparison ph
9/23/2010
2
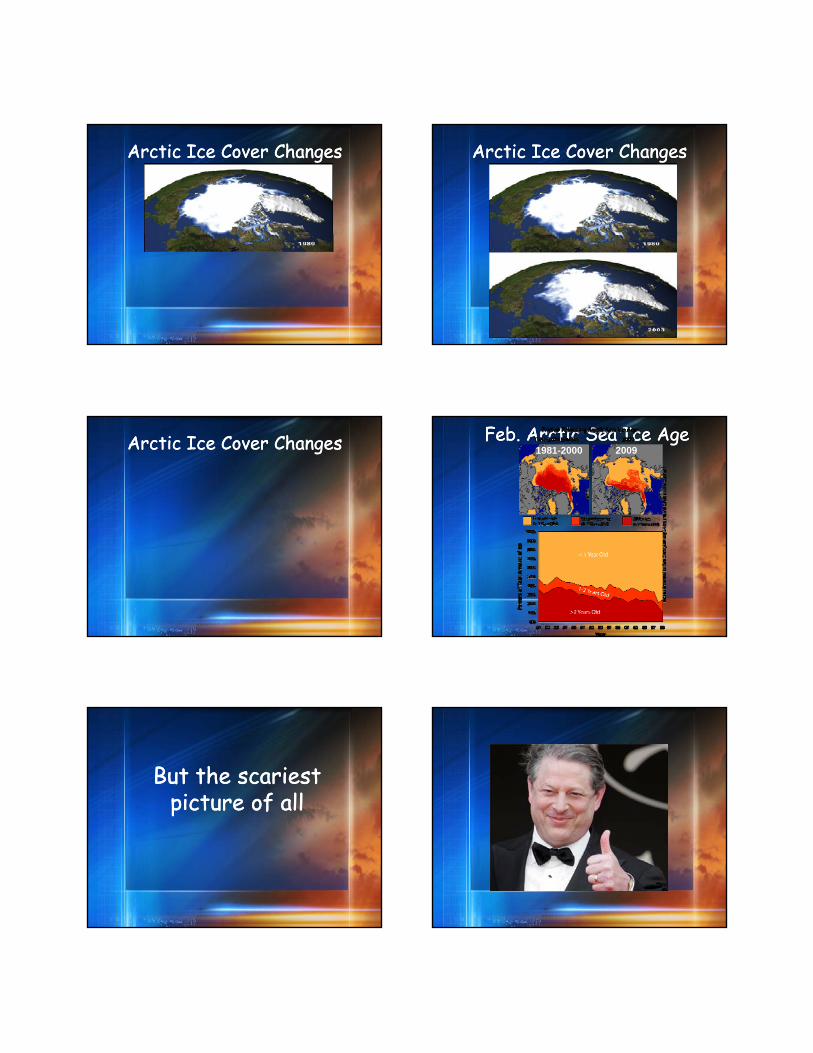
Arctic Ice Cover ChangesArctic Ice Cover Changes Arctic Ice Cover ChangesArctic Ice Cover Changes
Arctic Ice Cover ChangesArctic Ice Cover Changes Feb. Arctic Sea Ice AgeFeb. Arctic Sea Ice Age1981-2000 2009
But the scariestpicture of all
But the scariestpicture of all

9/23/2010
3
Debate Used to be About Science
Now It’s About Politics
To help protect your privacy, PowerPoint prevented this external picture from being automatically downloaded. To download and display this picture, click Options in the Message Bar, and then click Enable external content.
The Debate RagesThe Debate RagesBastardi: winter snowstorms prove global warming hoax
Washington Times: February Snow Storms “Undermine the Case for Global Warming One
“More Mega-Snowstorms Coming -- Global Warming to Blame?Get used to heavy U.S. snowstorms, scientists say.”
-OR-Flake at a Time”
To help protect your privacy, PowerPoint prevented this external picture from being automatically downloaded. To download and display this picture, click Options in the Message Bar, and then click Enable external content.
Are we scaring our children?
Are we scaring our children?
From a child who is yet to lose all her baby teeth: "I worry about [global warming] because I don't want to die."
One out of three children aged 6 to 11 fears that Ma Earth won't exist when they grow up,
75 percent of black children and 65 percent of Hispanic children believe that the planet will be irrevocably damaged by the time they reach adulthood.
Global WarmingGlobal WarmingBack to the ScienceBack to the Science
Greenhouse EffectGreenhouse Effect• Atmosphere is
transparent to incoming solar radiation
• Outgoing Longwave infrared radiation is trapped by greenhouse gasses
• Atmosphere is transparent to incoming solar radiation
• Outgoing Longwave infrared radiation is trapped by greenhouse gassesgasses
• The most dominant greenhouse gas is water vapor
• Changes in the composition of the atmosphere interfere with these energy flows
gasses• The most dominant
greenhouse gas is water vapor
• Changes in the composition of the atmosphere interfere with these energy flows
Mauna Loa Monthly Mean Carbon Dioxide1955 - 2005
Mauna Loa Monthly Mean Carbon Dioxide1955 - 2005

9/23/2010
4
Global WarmingGlobal WarmingEvidence in Ice CoresEvidence in Ice Cores
World Carbon Emission1750 - Present
World Carbon Emission1750 - Present

9/23/2010
5
North America Carbon Emission1780 - Present
North America Carbon Emission1780 - Present Past 1000 Years (“Hockey Stick Graph”)Past 1000 Years (“Hockey Stick Graph”)
Controversial
Another Study – Past 2000 YearsAnother Study – Past 2000 Years
Controversial
To help protect your privacy, PowerPoint prevented this external picture from being automatically downloaded. To download and display this picture, click Options in the Message Bar, and then click Enable external content.
Globalwarmingart.comGlobalwarmingart.comGreat GraphicsGreat Graphics
p gjpg
Global WarmingGlobal WarmingEvidence from Weather
InstrumentsEvidence from Weather
Instruments
Earth’s Temperature ChangesEarth’s Temperature Changes

9/23/2010
6
It’s Warming Again!It’s Warming Again! Global Temperature ChangesPast 10 Years
Global Temperature ChangesPast 10 Years
Winter Temp ChangeWinter Temp Change Summer Temp ChangeSummer Temp Change
Global WarmingGlobal WarmingComputer ModelsComputer Models
“Hindcasting” Past 100 Years“Hindcasting” Past 100 Years

9/23/2010
7
Forecasting Next 100 YearsForecasting Next 100 YearsGlobal WarmingGlobal WarmingIs Abrupt Climate Change
Possible?Is Abrupt Climate Change
Possible?
Greenland Ice Sheet FlowsGreenland Ice Sheet Flows• Accelerating Since 1996• Accelerates Glacier
Sliding• May be much faster
than Computer Models
• Accelerating Since 1996• Accelerates Glacier
Sliding• May be much faster
than Computer Models than Computer Models Indicate
• Can Further Melting Result in Large Sea Level Rises in 100s of years instead of 1000s of years?
than Computer Models Indicate
• Can Further Melting Result in Large Sea Level Rises in 100s of years instead of 1000s of years?
Temperature Change ForecastTemperature Change Forecast• Lower End is
significant• High End is
catastrophic
• Lower End is significant
• High End is catastrophicp
• Middle Area is most likely
• Even that is MAJOR
p
• Middle Area is most likely
• Even that is MAJOR
Sea Level Rise ForecastSea Level Rise Forecast• Lower End causes
storms to flood more
• Higher End floods coastal cities
• Lower End causes storms to flood more
• Higher End floods coastal citiescoastal cities
• Middle End is most likely statistically
• More rapid rise is possible
coastal cities
• Middle End is most likely statistically
• More rapid rise is possible
Global WarmingGlobal WarmingA Response to Skeptics
QuestionsA Response to Skeptics
Questions

9/23/2010
8
It’s All Because of the Sun
It’s All Because of the SunSunSun
The Warming Ended in 1998
The Warming Ended in 199819981998
Actual Temperature TrendActual Temperature Trend
The Warming Ended in 1998The Warming Ended in 1998• That was a Strong El Nino year that
added to the warming• 2005 about as warm, but had no El Nino
to Skew the data
• That was a Strong El Nino year that added to the warming
• 2005 about as warm, but had no El Nino to Skew the data In the 70s they said an
i iIn the 70s they said an
i iice age was comingice age was coming

9/23/2010
9
In the 70s they said an ice age was comingIn the 70s they said an ice age was coming• This was more in the popular media than
the scientific articles• A book by a non-scientist called “The
Cooling” became a best-seller• But it was NOT the prevailing scientific
i t th ti (I th )
• This was more in the popular media than the scientific articles
• A book by a non-scientist called “The Cooling” became a best-seller
• But it was NOT the prevailing scientific i t th ti (I th )view at the time (I was there)
• Even the National Geographic and Newsweek suggested the possibility of warming due to CO2 in the future
view at the time (I was there)• Even the National Geographic and
Newsweek suggested the possibility of warming due to CO2 in the future
It was just as warm in the Medieval warm
It was just as warm in the Medieval warm the Medieval warm
period as todaythe Medieval warm
period as today
Medieval Warm PeriodMedieval Warm PeriodIt was just as warm in the Medieval warm
period as today It was just as warm in the Medieval warm
period as today • Maybe it was warmer in Europe, but
there’s no evidence that it was that warm worldwide
• This is GLOBAL warming, not regional
• Maybe it was warmer in Europe, but there’s no evidence that it was that warm worldwide
• This is GLOBAL warming, not regional
Ice core records show that CO2 increase comes AFTER the
Ice core records show that CO2 increase comes AFTER the comes AFTER the warming. So does
warming increase CO2?
comes AFTER the warming. So does
warming increase CO2?
Vostok Ice Core RecordsVostok Ice Core Records

9/23/2010
10
Does warming increase CO2?Does warming increase CO2?
• Warming did start about 800 years before CO2 increase
• Some other forcing (Milankovich) started the warming
• Warming oceans release CO2
• Warming did start about 800 years before CO2 increase
• Some other forcing (Milankovich) started the warming
• Warming oceans release CO2• CO2 then causes temp to rise, which
causes more CO2 (feedback!)• CO2 could be stored in deep ocean during
ice ages, and then released when warmed• We can not explain temperature
variations WITHOUT CO2
• CO2 then causes temp to rise, which causes more CO2 (feedback!)
• CO2 could be stored in deep ocean during ice ages, and then released when warmed
• We can not explain temperature variations WITHOUT CO2
Why are the Antarctic i h t i ?
Why are the Antarctic i h t i ?ice sheets growing?ice sheets growing?
Why are the Antarctic ice sheets growing?Why are the Antarctic ice sheets growing?
• It doesn’t have to warm everywhere• Ice sheet thickens due to more snow due
to warming
• It doesn’t have to warm everywhere• Ice sheet thickens due to more snow due
to warming We Can’t even predict the weather next week. H di t 100
We Can’t even predict the weather next week. H di t 100 How can we predict 100
years?How can we predict 100
years?
How can we predict 100 years?How can we predict 100 years?
• Climate vs. weather• Averaging over time removes random
nature• We can predict tomorrow with near 90%
accuracy, and computer models of the t h th i h
• Climate vs. weather• Averaging over time removes random
nature• We can predict tomorrow with near 90%
accuracy, and computer models of the t h th i hatmosphere are the main reason why
• Testing models by going back and predicting up to today is pretty good (the trends are right)
atmosphere are the main reason why• Testing models by going back and
predicting up to today is pretty good (the trends are right)
The computer models already proven to be The computer models already proven to be already proven to be
too warmalready proven to be
too warm

9/23/2010
11
Hansen Forecasts and ActualHansen Forecasts and Actual Computer models too warmComputer models too warm
• 3 scenarios from IPCC. Middle one is doing well
• Models correctly predicted cooling of stratosphere
• Models correctly predicted big warming f ti
• 3 scenarios from IPCC. Middle one is doing well
• Models correctly predicted cooling of stratosphere
• Models correctly predicted big warming f tiof arctic
• Models correctly predicted oceans to warm
• Models correctly predicted cooling rate due to volcanic eruptions
of arctic• Models correctly predicted oceans to
warm• Models correctly predicted cooling rate
due to volcanic eruptions
Climate models don’t take clouds into
Climate models don’t take clouds into take clouds into
accounttake clouds into
account
Models don’t take clouds into accountModels don’t take clouds into account
• ALL models DO take clouds into account• The type of clouds is very important and
there is uncertainty
• ALL models DO take clouds into account• The type of clouds is very important and
there is uncertainty
Some places are cooling; others have
record cold days.
Some places are cooling; others have
record cold days. record cold days. Doesn’t that disprove
it?
record cold days. Doesn’t that disprove
it?
Cooling and record cold disprove?Cooling and record cold disprove?
• The whole earth doesn’t warm uniformly-some places will cool
• But there are MANY more record highs than record lows around the world
• The whole earth doesn’t warm uniformly-some places will cool
• But there are MANY more record highs than record lows around the world
![Reed BRANCHING OUT.ppt - Sahraweb.sahra.arizona.edu/education2/wrtt/lecs/Reed_BRANCHING_OUT_… · Microsoft PowerPoint - Reed_BRANCHING _OUT.ppt [Compatibility Mode] Author: Jim](https://img.pdfslide.us/doc/110x75/5f70cbae7c69ad5c6e7b5e2f/reed-branching-outppt-microsoft-powerpoint-reedbranching-outppt-compatibility.jpg)