Embed Size (px)
Citation preview
www.elsevier.com/locate/cogsys
Cognitive Systems Research 8 (2007) 192–207
Global vs. local information processing in visual/spatialproblem solving: The case of traveling salesman problem
Action editor: Fabio del Missier
Xiaohui Kong, Christian D. Schunn *
Learning Research and Development Center, University of Pittsburgh, PA 15260, United States
Received 21 February 2007; accepted 11 June 2007Available online 3 July 2007
Abstract
Human visual/spatial problem solving often requires both global and local information to be processed. But the relationship betweenthose two kinds of information and the way in which they interact with one another during problem solving has not been thoroughlydiscussed. In the particular setting of solving the traveling salesman problem (TSP), we investigated into the relative roles of global andlocal information processing. An experiment was conducted to measure the importance of global information and the possible con-straints of global information processing on search. A model was built to simulate human TSP performance and was used to investigatefurther the relationship between global information processing and local information processing. Our model was compared with thehuman data we collected and with other models of human TSP solving.� 2007 Elsevier B.V. All rights reserved.
Keywords: Visual/spatial problem solving; Traveling salesman problem; Global/local information processing
1. Introduction
Visual/spatial information in the world exists at manygrain-sizes. One strategy for studying visual/spatial process-ing is to focus on a particular grain-size. But, as suggestedby Gestalt psychologists, information processing at onegrain-size is often influenced by more global patterns(gestalts) at the next grain size up. From an informationprocessing perspective, core questions about global–localinformation interactions concern storage and processinglimitations: (a) how can global patterns be stored efficientlyto effectively influence processing of local information?, and(b) how can global patterns be constructed without firstinvoking complex or large scale local pattern processes?
In this paper, we test two broad predictions about thenature of global information that is stored and used toinfluence local information. The first prediction is that
1389-0417/$ - see front matter � 2007 Elsevier B.V. All rights reserved.doi:10.1016/j.cogsys.2007.06.002
* Corresponding author. Tel.: +1 412 624 8807.E-mail addresses: [email protected] (X. Kong), [email protected] (C.D.
Schunn).
global information consists of low spatial frequencyinformation because it is easily processed in peripheralvision and because it contains few bits of informationthat are processed quickly. This prediction is in contrastto global models that use contour information or isolatedfeature maps, which can contain many, many bits ofinformation.
The second prediction is that the stored informationmust be sufficient to usefully guide local search. In otherwords, the global information must be generally effectivefor reducing the scope of local search throughout visualproblem solving. This prediction is in contrast to modelsthat emphasize contour maps because the contour providesguidance for only the points near the contour rather thangenerally throughout local search.
We examine these hypotheses in the context of the trav-eling salesman problem because it is a well-studied problemthat highlights the importance of integrating global visual/spatial information into local search.
The (Euclidean) traveling salesman problem (ETSP) isto find a path of minimum Euclidean distance between

X. Kong, C.D. Schunn / Cognitive Systems Research 8 (2007) 192–207 193
points in a plane, which includes each point exactly onceand returns to its starting point. As a NP-hard combina-tory optimization problem, the traveling salesman problem(TSP) is believed to be ‘‘intractable’’ in computer sciencefor large inputs as long as exact optimal path is concerned.
Recently there has been some interest in the travelingsalesman problem in cognitive science because humansare able to easily find near-optimal solutions of small sizeETSP with little apparent effort (MacGregor & Ormerod,1996). This result seems to be contradictory with the gen-eral assumption that a large problem space implies a diffi-cult problem (Newell & Simon, 1972), since even a smallsize (n < 30) ETSP has a huge problem space. Simpletrial-and-error search in the original problem space couldnot explain human performance on this problem.
Several hypotheses have been proposed to account forthe human strategy on TSP solving from either a quantita-tive explanation (MacGregor & Ormerod, 1996; Victers,Lee, Dry, & Hughes, 2003; Van Rooij, Stege, & Schact-man, 2003) or qualitative modeling perspective (Best,2005; Graham, Joshi, & Pizlo, 2000; MacGregor, Ormerod,& Chronicle, 2000). Although different explanations andmodels use different measures and heuristics, the globalinformation processing vs. local information processinghas been one of the central issues under discussion.
Ormerod and Chronicle (1999) first provided supportfor the hypothesis that human cognition is capable of per-ceiving and utilizing global information in the identifica-tion of TSP solutions. MacGregor et al. (2000) thenproposed a model using the convex hull as the global infor-mation and developing a TSP path from it, where the con-vex hull is the smallest convex containing all the points init. In the model by Graham et al. (2000), several layers ofglobal information are perceived and developed in a cas-cade to approximate the final solution, which they calledthem a pyramid.
By contrast, Van Rooij et al. (2003) argued that purelylocal search based on a nearest neighbor approach couldhelp to form some kind of global clustering informationby eliminating the majority of potential intersections. How-ever, some recent studies by Best (2005) suggest that after aglobal information-processing phase, human participantsonly perform local search in the rest of the TSP solvingprocedure.
Two important questions about global information usedin human TSP solving remained unaddressed. First, whatkind of global information is perceived and utilized? Sec-ond, how important is the global information? To answerthose questions, we conducted an experiment, built amodel, and evaluate the fit to human data of this modelagainst other models.
2. Previous models of TSP
We begin by considering the rest of models previouslyproposed for human performance on the TSP.
2.1. Nearest neighbor
The most basic model of TSP is the nearest neighbormodel (Rosenkrantz, Stearns, & Lewis, 1977) in whichthe problem solver always selects the closest next point tothe current point, i.e., simply following a hill-climbing heu-ristic. The model is elegant in that it only assumes a singleheuristic that is already known to be part of the humaninformation-processing repertoire (Newell & Simon,1972). However the model makes no use at all of globalinformation and tends to produce solutions that are notas good as those found by humans (Ormerod & Chronicle,1999).
2.2. Convex hull
The next simplest model of TSP is the convex hull model(Golden, Bodin, Doyle, & Stewart, 1980), which assumesthat people compute a traversal around the perimeterpoints, including inner points opportunistically along theway using a minimal insertion rule. The global informationused by this model is the Convex Hull contour, which maybe rather complex, and thus require significant workingmemory. The minimal insertion rule is applied globally ateach point in time during path computation, and pointsare added that cause the smallest increase in total pathlength. It is somewhat implausible that people would beable to compute these minimal insertions (a local process-ing task) at the global level.
2.3. Sequential convex hull model
MacGregor et al. (2000) adapted the convex hull modelto more plausible incremental local search version of theconvex hull model. In support of this adaptation, theyfound that humans perform better on problems with fewerinterior points within the convex hull (MacGregor & Orm-erod, 1996). Second, their experiments provided supportfor their hypothesis that human participants are sensitiveto global information (Ormerod & Chronicle, 1999). Wewould call this model the sequential convex hull model.The outline of the model is as follows (MacGregor et al.,2000):
1. Sketch the connections between adjacent boundarypoints of the convex hull.
2. Select a starting point and a direction randomly.3. If the starting point is on the boundary, the starting
node is the current node. The arc connecting the currentnode to the adjacent boundary node in the direction oftravel is referred to as the current arc. Proceed immedi-ately to Step 4. If the starting point is not on the bound-ary, apply the insertion rule to find the closest arc on theboundary. Connect the starting point to the end node ofthe closest arc, which is in the direction of travel. Thisnode becomes the current node.

194 X. Kong, C.D. Schunn / Cognitive Systems Research 8 (2007) 192–207
4. Apply the insertion criterion to identify which uncon-nected interior point is closest to the current arc.Apply the insertion criterion to check whether theclosest node is closer to any other arc. If not, pro-ceed to Step 5. If it is, move to the end node ofthe current arc. This becomes the current node.Repeat Step 4.
5. Insert the closest node. The connection between the cur-rent node and the newly inserted node becomes the cur-rent arc. Retaining the current node, return to Step 4and repeat Steps 4 and 5 until a complete tour isobtained.
2.4. Pyramid model
Graham et al.’s model (2000) of traveling salesmanproblem was inspired by a hierarchical architecture ofhuman visual and spatial perception. Their model firstGaussian-blurs the original set of points into a variety ofdegrees and stores those blurred images in different layersof hierarchy with the most blurred image on the top. Themore blurred images serve as the global information forthe less blurred images. Each layer directly guides the nextlayer below it each time the model develops a node into thepath. So layers in the hierarchy change in a repeatedly cas-caded process. The pyramid model computes TSP solutionsin the following steps:
1. Gaussian-blur the original n-points TSP image intok � 1 different degrees and store them in a k-layerpyramid with the original TSP image on the bottomand the most blurred image on the top.
2. Calculate Li modes of the image in each layer i.Consider those modes in each layer as nodes in areduce-sized TSP problem. The top layer has 3 nodesand the bottom layer has n nodes. Layer k has n
bk nodes.(The parameter b is the reduction ratio. Bottom layer islayer 1.)
3. Layer n (top layer) has 3 nodes and forms a uniquetour.
4. Generate a tour of the TSP in each layer by insertingthem into the tour on the previously higher layer withthe following rules: (a) Sort the intensity level of themode locations in each layer. (b) Insert these modesinto the tour in descending order of their intensity, soas to produce the minimum increase in tour length.Repeat Step 4 until the algorithm generates a tour inthe bottom layer.
2.5. Global/local TSP solver
In the global/local TSP solver (Best, 2004), global infor-mation-processing and local information-processing phasesare clearly separated. The outline of the GL-TSP solver isas follows.
2.5.1. Global information-processing phase
Using the CODE theory of human perceptual clustering(Compton & Logan, 1993; Van Oeffelen & Vos, 1982) bysetting a threshold parameter, a certain number of clustersof points were generated. Global planned path among clus-ters is calculated using the convex hull heuristic.
2.5.2. Local information-processing phase
Starting from the current point, the next point to visit onthe exact path is chosen from the current cluster by using a6-points look-ahead rule and the global planned path asconstraints.
The global information posited by this model is muchsmaller in size than that posited by the convex hull models.
In all but the nearest neighbor model, some kind of glo-bal information processing was engaged and extracted glo-bal information was used to guide the local search. Thesequential convex hull model used the convex hull and con-vex contour; the pyramid model used layers of pyramid;the GL-TSP solver used the clustering result and plannedpath between clusters. So what kind of global informationis perceived and utilized by human cognition, due to itsown constraints? How important is the global information?To answer those questions we did the followingexperiment.
3. Experiment
3.1. Method
3.1.1. Participants
Twenty eight graduate students participated in theexperiment.
3.1.2. Materials and methods
The materials were 20 TSPs. Ten are real world prob-lems borrowed from TSPLIB (http://www.iwr.uni-heidel-berg.de/groups/comopt/software/TSPLIB95/) ranging insize from 16 points to 100 points. Those real world prob-lems are generally more structured. An example would bethe cities on a map where they tend to form some denseclusters (Fig. 1a). The remaining 10 were randomly pre-generated according to a uniform distribution rangingfrom 10 to 80 points. Fig. 1b shows an example of ran-domly generated TSP. Note that all participants saw theexact same 20 TSP problems but in a random order, whichallows us to examine how well the models predict the per-formance on particular TSP problems rather than just gen-eral trends for the effect of number of points.
The problems were displayed in an 800 * 800 pixels win-dow on a 17-in. computer screen with resolution1440 * 900 pixels. Participants sit about 17–20 in. awayfrom the computer screen. So all the problem lies in thehuman visual field with maximum angle of 10–13�. Partic-ipants were asked to find the shortest possible path andindicate the path using mouse-clicks. The programrecorded all the click data. Participants were randomly

Fig. 1. Examples of a natural TSP (right) and a random TSP (left).
X. Kong, C.D. Schunn / Cognitive Systems Research 8 (2007) 192–207 195
assigned into one of the following three groups. The groupswere designed to examine the influence of the global andlocal information.
3.1.3. Control (10 participants)Each participant was asked to solve the TSP problems
while all point locations remained on the screenthroughout.
3.1.4. Global preview (9 participants)
Each participant was asked to solve the same TSPs as inthe control condition, with three distinct phases for eachTSP.
1. The full TSP is shown, but paths cannot yet be clicked.Each participant was given a pen and a piece of paper todraw the global information they would need in the laterphases. Participants were also asked to pick a start pointto begin their TSP trip (Fig. 2a).
2. The TSP problem points were clustered into 5–12clusters using a K-Means algorithm (MacQueen,1967). The k-means centroids (geometric centers) weredisplayed as larger dots. Participants were asked to picka path through just the centroids to determine the orderin which the clusters show up in phase 3 (Fig. 2b).
Fig. 2. Illustrations of Global Preview con
3. All points were hidden. Then subsets of points were pre-sented one cluster at a time, and participants had to picka path through all the points within a cluster. When allthe points in the current cluster were visited, the nextcluster of points would become visible (Fig. 2c).
3.1.5. No global preview (9 participants)
This condition was identical to the Global Preview con-dition in that only one cluster worth of points is shown at atime during the path selection process (i.e., phase 3), exceptthat participants did not first see the full set of points (i.e.,phases 1 and 2 were skipped). So there was no global infor-mation available during any part of the process.
The No Global Preview vs. Global Preview comparisontests the effect of access to global information on localsearch quality, and whether the global information can fitin working memory (as opposed to it being important thatglobal information be externally available). If those twoconditions do not differ in solution performance, then thecontrol condition assesses whether even continuously avail-able global information is helpful. If the Global Previewand No Global Preview conditions do differ, then the Con-trol condition assesses whether to what extent continuouslyavailable global information further shapes local search.
dition phase 1, 2, 3 (left, mid, right).

Fig. 3. Mean accuracy of each individual problem within each condition.
Fig. 4. A typical scratch note from a participant in the group with globalpreview.
196 X. Kong, C.D. Schunn / Cognitive Systems Research 8 (2007) 192–207
Finally, the Control condition also provides baseline TSPproblem solving data against which the computationalmodels can be compared.
After each participant finished all 20 TSPs, there was apost-experiment measurement on how fast the participantclicked the mouse. This step involved re-presenting all 20TSPs, but instead of finding the shortest path, participantswere asked to click through all the points as fast as possiblein an arbitrary order. From this data, we will estimate par-ticipants’ thinking time by subtracting mouse-clicking timefrom solution time.
3.2. Results and discussion
Accuracy and reaction time were calculated as our mea-surements of performance. Accuracy was calculated as theratio of participant path length over the optimal pathlength. Reaction time was calculated as difference betweenthe time to finish the TSP and the time to click through allthe points. So accuracy is a number larger than 1. The clo-ser the value is to 1, the better the performance is. The reac-tion time is an approximation of participant thinking time.
ANOVAs on accuracy and reaction time revealed signif-icant effect on both accuracy (p < .0001) and on reactiontime (p = .0001). But the condition effect of reaction time(f = 9.0) is much weaker than that of accuracy(f = 172.1), while they have the same degree of freedom.The control group had the best accuracy ðX ¼ 1:05Þ buthighest RT ðX ¼ 76 sÞ. The global preview group had mid-dle levels on both (accuracy = 1.11, RT = 54 s). The NoGlobal preview group had the worst accuracy ðX ¼ 1:16Þbut fastest RT ðX ¼ 42 sÞ. Post-hoc Tukey comparisonsfound significant pair-wise difference between all groupson accuracy (p < .0001). That the control condition is sig-nificantly slower than the no global preview condition(p < .0001) and the global preview condition (p = .0074)suggests that processing global information does take time.That the condition effects are very strong on accuracy(f = 172.1) and much weaker on RT (f = 9.0) suggest thata simple speed-accuracy tradeoff could not explain theoverall condition effect.
As it can be seen in Fig. 3, the accuracy of each groupslowly goes up (less accurate) when the size of the problemgoes up. The accuracy of control condition fits well to a lin-ear trend (R2 = .689). The accuracies of the other two con-ditions basically follow linear trends (R2 = .33 and .21).The control group has the highest accuracy performance.This result is consistent with our hypothesis that humanparticipants utilized both global information and localinformation to solve the problem. The control group hasall points visible during the entire problem solving proce-dure; the points on the screen appear to help them to retainthe global information through some kind of active mem-ory during the solution process.
The global preview group has better accuracy than thegroup w/o global preview. This result confirmed the impor-tance of global information in the human TSP solving pro-
cedure. A typical example of the scratch notes ofparticipants in the global preview group is in Fig. 4. Notall participants sketched a Spline-curve. Some participantsjust recorded the relative position of each cluster and somejust left the scratch paper blank. But when connectionsbetween clusters were drawn, they tended to resemblesplines.
In sum, it appears that global information stored onlymentally does help local search. Global information pre-sented throughout problem solving helps even more. Thus,global information computed in global preview condition,either slightly exceeds capacity limits, and/or is not storedwith the same fidelity as global information that is sup-ported with continual visual input. One could interpretthe results as a support that human TSP problem solvingrelies heavily on compact global representations suggestedby the notes of global preview condition. However, one

Fig. 5. Effects of problem size on accuracy separately for random andnatural problems.
X. Kong, C.D. Schunn / Cognitive Systems Research 8 (2007) 192–207 197
could also argue that human TSP may use elaborate globalinformation that is dependent upon constant peripheralvisual input, since control condition has better accuracythan global preview condition. So the question is whetherthe recorded global information in global preview condi-tion is close to the one used in control condition or it’s onlyan abstract of it. Precise modeling of the exact human datain the control condition may help to resolve this.
3.2.1. Natural vs. random
We used two categories of traveling salesman problemsin our experiment. Ten problems were randomly generatedaccording to uniform distribution (random problems). Theother 10 were borrowed from TSPLIB (natural problems),most of which are data collected from real world (such ascities in a country, etc.).
The overall accuracy performance of the control groupbetween natural problems and random problems is theonly significant difference we found (p < .001). There isno significant difference between natural points and ran-dom points on the other two groups’ accuracy (p > .5) orRT (p > .8) values.
The control group has better accuracy on random prob-lems than natural problems and there is an interaction withnumber of points (Fig. 5). For the natural TSP problems,the accuracy value (the larger the worse) was higher thanrandom problems for small problem size. As problem sizeincreases, accuracy value of natural problem increases ata slower rate than that of random problem. That this effectonly appeared in the control group suggests that the addedstructure contained in natural problems is subtle and noteasily stored in working memory.
4. TSP global vs. local information processing
Having conducted an experiment to test the role of glo-bal information in TSP performance, we now turn to amore detailed theoretical examination of global vs. localinformation processing in TSP models. More advancedexisting TSP models used a certain kind of global informa-tion to guide their local information processing. In thesequential convex hull model, the local information pro-cessing of individual nodes relies on the global information
of the convex hull contour developed through Step 1 toStep 3 and the previous iterations of Steps 4 and 5. Inthe pyramid model, the global information is containedin all layers of the pyramid except the bottom layer wherethe exact node locations are stored. The top-to-bottom cas-cade iteration of the pyramid model is to specify the globalinformation layer by layer until a tour of the original TSPis constructed on the bottom.
A recent study provided support for the hypothesis thatseparated processing phases of global and local informa-tion are an important characteristic of human TSP solving(Best, 2005). This naturally leads to the question of whatkind of global information is used in the global informa-tion-processing phase? There are several criterions that glo-bal information should meet:
1. The global information should be sufficient to guide thelocal search. It should remain fixed or change onlylocally in the local search phase.Since the global infor-mation processing and local information processingare in two separate phases, the global information isbasically fixed after the global information-processingphase. Therefore, the global information should be suf-ficient to guide the local information processing. Localinformation processing should only help to maintainor slightly change the local part of the globalinformation.
2. The global information should be compact in size to fitwell in active human visual/spatial modelrepresentations.
Since the global information is processed during the firstseveral seconds of the problem solving procedure, it shouldbe compact in size. Also it should have the form of the rep-resentation that fits human working memory well, so that itwould remain in the working memory during the localinformation-processing phase.
In the model developed by MacGregor et al. (2000), theconvex hull contour serves as the global information. In theglobal information-processing phase, the original convexhull is perceived as the global information. But this convexhull does not contain enough information to guide eachlocal search, so the convex hull contour is modified eachtime in the local search phase. The modification of the con-tour could change it a lot. Before connecting to the nextnode, the model would need to generate some number oftemporary edges that constitute the temporary state ofthe convex hull contour. Those temporary edges are invis-ible to human participants, so they have to be stored invisual/spatial working memory. But sometimes the numberof temporary edges could be quite large and keeping allthose edges in visual/spatial working memory may not befeasible. So the convex hull itself does not fit to our crite-rion of sufficiency, and the convex hull contour does notfit to our criterion of compactness.
Fig. 6 visualizes the convex hull contour used by thesequential convex hull model as the global information in
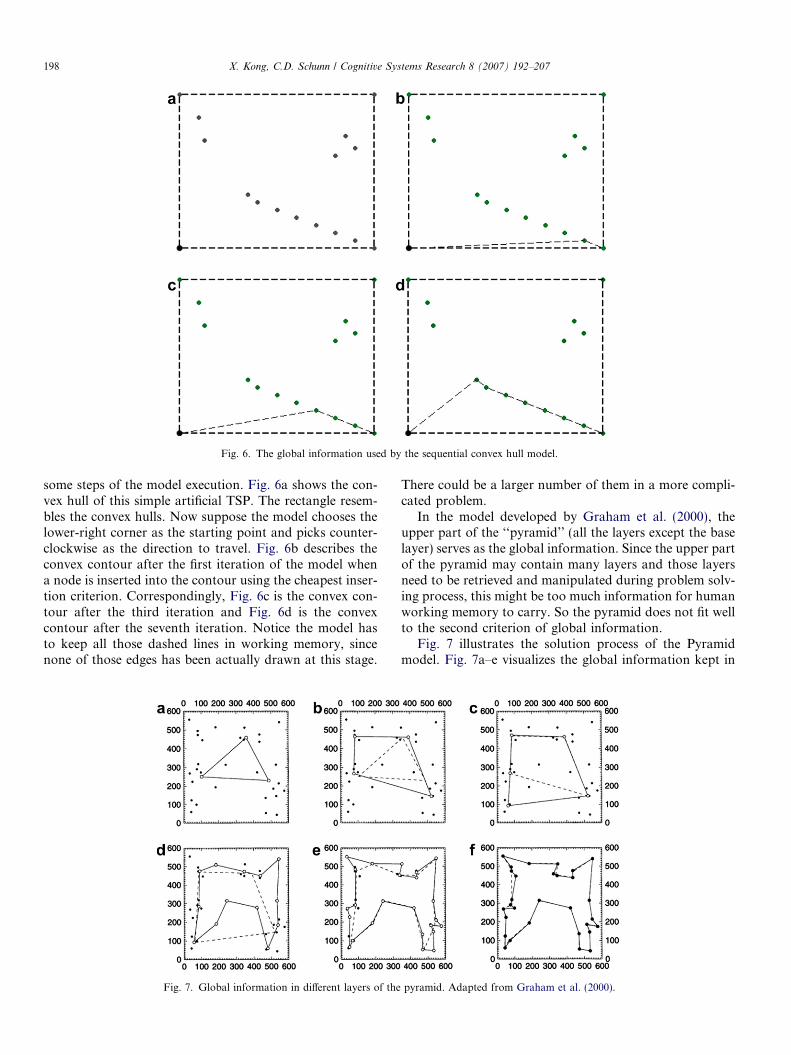
Fig. 6. The global information used by the sequential convex hull model.
198 X. Kong, C.D. Schunn / Cognitive Systems Research 8 (2007) 192–207
some steps of the model execution. Fig. 6a shows the con-vex hull of this simple artificial TSP. The rectangle resem-bles the convex hulls. Now suppose the model chooses thelower-right corner as the starting point and picks counter-clockwise as the direction to travel. Fig. 6b describes theconvex contour after the first iteration of the model whena node is inserted into the contour using the cheapest inser-tion criterion. Correspondingly, Fig. 6c is the convex con-tour after the third iteration and Fig. 6d is the convexcontour after the seventh iteration. Notice the model hasto keep all those dashed lines in working memory, sincenone of those edges has been actually drawn at this stage.
Fig. 7. Global information in different layers of the
There could be a larger number of them in a more compli-cated problem.
In the model developed by Graham et al. (2000), theupper part of the ‘‘pyramid’’ (all the layers except the baselayer) serves as the global information. Since the upper partof the pyramid may contain many layers and those layersneed to be retrieved and manipulated during problem solv-ing process, this might be too much information for humanworking memory to carry. So the pyramid does not fit wellto the second criterion of global information.
Fig. 7 illustrates the solution process of the Pyramidmodel. Fig. 7a–e visualizes the global information kept in
pyramid. Adapted from Graham et al. (2000).
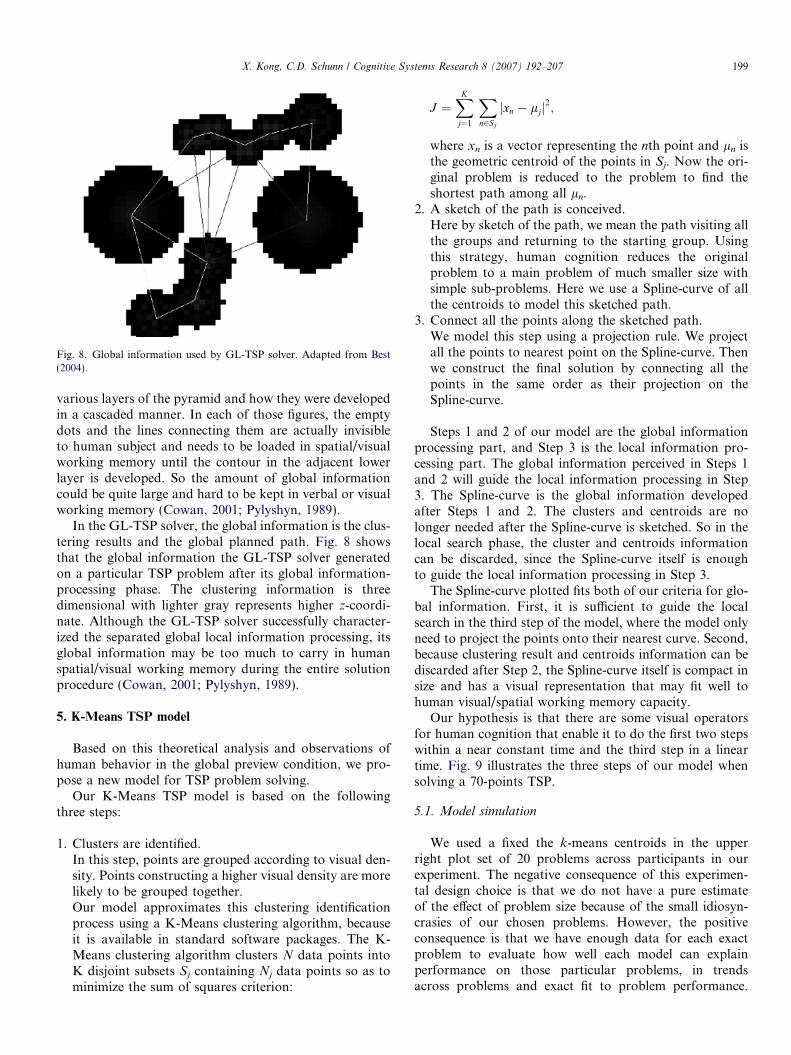
Fig. 8. Global information used by GL-TSP solver. Adapted from Best(2004).
X. Kong, C.D. Schunn / Cognitive Systems Research 8 (2007) 192–207 199
various layers of the pyramid and how they were developedin a cascaded manner. In each of those figures, the emptydots and the lines connecting them are actually invisibleto human subject and needs to be loaded in spatial/visualworking memory until the contour in the adjacent lowerlayer is developed. So the amount of global informationcould be quite large and hard to be kept in verbal or visualworking memory (Cowan, 2001; Pylyshyn, 1989).
In the GL-TSP solver, the global information is the clus-tering results and the global planned path. Fig. 8 showsthat the global information the GL-TSP solver generatedon a particular TSP problem after its global information-processing phase. The clustering information is threedimensional with lighter gray represents higher z-coordi-nate. Although the GL-TSP solver successfully character-ized the separated global local information processing, itsglobal information may be too much to carry in humanspatial/visual working memory during the entire solutionprocedure (Cowan, 2001; Pylyshyn, 1989).
5. K-Means TSP model
Based on this theoretical analysis and observations ofhuman behavior in the global preview condition, we pro-pose a new model for TSP problem solving.
Our K-Means TSP model is based on the followingthree steps:
1. Clusters are identified.In this step, points are grouped according to visual den-sity. Points constructing a higher visual density are morelikely to be grouped together.Our model approximates this clustering identificationprocess using a K-Means clustering algorithm, becauseit is available in standard software packages. The K-Means clustering algorithm clusters N data points intoK disjoint subsets Sj containing Nj data points so as tominimize the sum of squares criterion:
J ¼XK
j¼1
X
n2Sj
jxn � ljj2;
where xn is a vector representing the nth point and ln isthe geometric centroid of the points in Sj. Now the ori-ginal problem is reduced to the problem to find theshortest path among all ln.
2. A sketch of the path is conceived.Here by sketch of the path, we mean the path visiting allthe groups and returning to the starting group. Usingthis strategy, human cognition reduces the originalproblem to a main problem of much smaller size withsimple sub-problems. Here we use a Spline-curve of allthe centroids to model this sketched path.
3. Connect all the points along the sketched path.We model this step using a projection rule. We projectall the points to nearest point on the Spline-curve. Thenwe construct the final solution by connecting all thepoints in the same order as their projection on theSpline-curve.
Steps 1 and 2 of our model are the global informationprocessing part, and Step 3 is the local information pro-cessing part. The global information perceived in Steps 1and 2 will guide the local information processing in Step3. The Spline-curve is the global information developedafter Steps 1 and 2. The clusters and centroids are nolonger needed after the Spline-curve is sketched. So in thelocal search phase, the cluster and centroids informationcan be discarded, since the Spline-curve itself is enoughto guide the local information processing in Step 3.
The Spline-curve plotted fits both of our criteria for glo-bal information. First, it is sufficient to guide the localsearch in the third step of the model, where the model onlyneed to project the points onto their nearest curve. Second,because clustering result and centroids information can bediscarded after Step 2, the Spline-curve itself is compact insize and has a visual representation that may fit well tohuman visual/spatial working memory capacity.
Our hypothesis is that there are some visual operatorsfor human cognition that enable it to do the first two stepswithin a near constant time and the third step in a lineartime. Fig. 9 illustrates the three steps of our model whensolving a 70-points TSP.
5.1. Model simulation
We used a fixed the k-means centroids in the upperright plot set of 20 problems across participants in ourexperiment. The negative consequence of this experimen-tal design choice is that we do not have a pure estimateof the effect of problem size because of the small idiosyn-crasies of our chosen problems. However, the positiveconsequence is that we have enough data for each exactproblem to evaluate how well each model can explainperformance on those particular problems, in trendsacross problems and exact fit to problem performance.

Fig. 9. Three steps of the Kmeans-TSP model on solving a 70 points TSP. ‘‘+’’ indicate the locations of the Kmeans centroids in the upper right plot.
1 The code for the pyramid model was downloaded from http://www2.psych.purdue.edu/tsp/workshop/downloads.html in November2005. The code is an improved version of the model described in Grahamet al. (2000).
200 X. Kong, C.D. Schunn / Cognitive Systems Research 8 (2007) 192–207
The number of clusters is the only parameter setting inthis model. In our simulation we set it to#Clusters ¼ 2�
ffiffiffiffiffiffiffiffiffiffiffiffiffiffiffiffi#pointsp
. This setting was based onthe intuition that we do not want points to be too faraway from its cluster centriod to avoid too much error.If recursion has to happen for large TSPs, we want thedepth of recursion to be no more than one. In order todraw the Spline-curve around all the centroids in steptwo of the model, we need a TSP path around all cent-roids. In our simulation we used a recursive call to ourmodel until the size of the problem is below 6, whenwe can easily use an exhaustive search function to findthe shortest path around the remaining points. For ourcurrent set of problems, the depth of recursive calls isat most two. Since the K-Means clustering algorithmmay converge to a local minimum and may yield differentclustering results on different runs, we ran through ourmodel on all the 20 problems 40 times.
The mean accuracy of the 40 runs is pretty close to theaccuracy performance of participants in the global pre-view group. Since our model employed a naı̈ve localsearch strategy and the group with global preview hadincomplete local information, the closeness of accuracybetween them is what we expected. However, the mini-mum accuracy generated by the 40 runs of our model isvery close to the accuracy performance of the controlgroup. The reason might be sometimes the naı̈ve projec-tion rule in our local search fits to the generated globalinformation very well, so it produced a similar result asthe more sophisticated local search strategy used byhuman cognition.
6. Model evaluation
To evaluate our model in depth, we did a comparisonbetween our model and other models against the humanperformance in the control condition along four dimensionof TSP behavior across the 20 TSP problems used in ourexperiment. We focused on the control condition becausethat condition best represents full use of global informa-tion. We calculated three results on the set of solutions thateach model produced on the twenty traveling salesmanproblems used in our experiment: number of intersections,mean accuracy, standard deviation of accuracy and exactpath chosen. Both trends and exact values are importantmeasurements on how well a model fits human perfor-mance data (Schunn & Wallach, 2001). Pearson correla-tions between model and human data are used tomeasure fit to trends; average signed errors are used tomeasure fit to exact value.
We compared our model with the following models andheuristics: the Pyramid model1 (Graham et al., 2000),Sequential Convex-Hull model (MacGregor et al., 2000),Nearest Neighbor and Convex Hull. Table 1 summarizesthe global and local information strategies used by eachof the models.
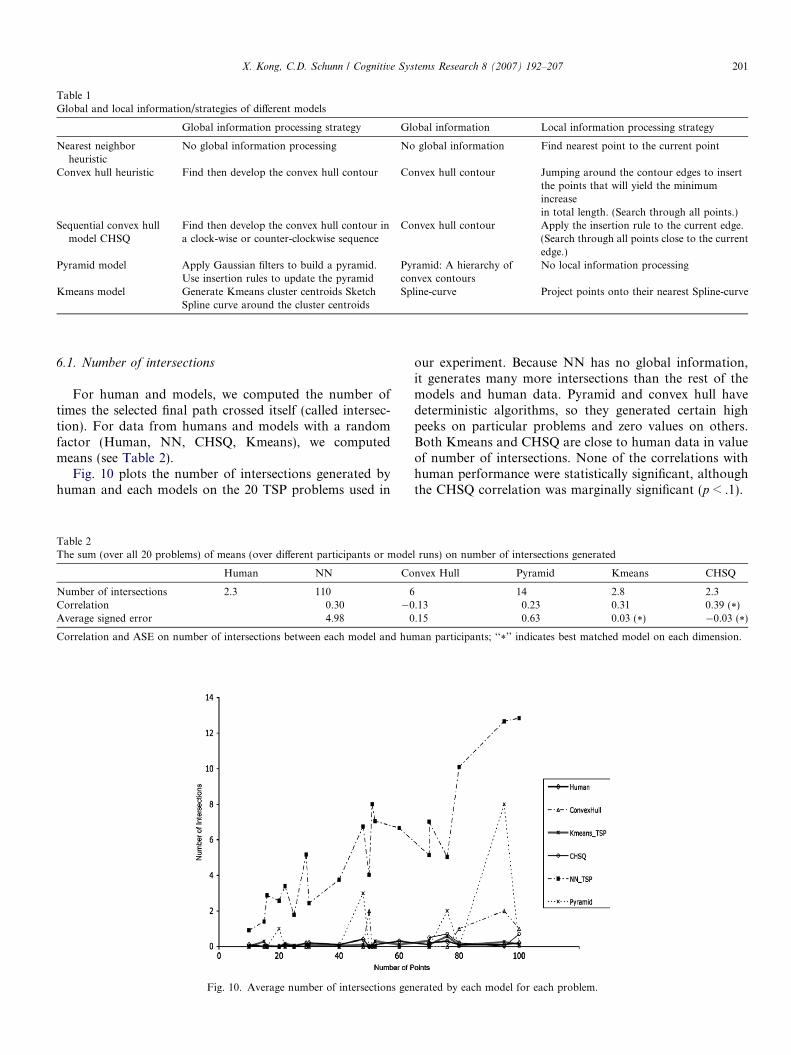
Table 1Global and local information/strategies of different models
Global information processing strategy Global information Local information processing strategy
Nearest neighborheuristic
No global information processing No global information Find nearest point to the current point
Convex hull heuristic Find then develop the convex hull contour Convex hull contour Jumping around the contour edges to insertthe points that will yield the minimumincreasein total length. (Search through all points.)
Sequential convex hullmodel CHSQ
Find then develop the convex hull contour ina clock-wise or counter-clockwise sequence
Convex hull contour Apply the insertion rule to the current edge.(Search through all points close to the currentedge.)
Pyramid model Apply Gaussian filters to build a pyramid.Use insertion rules to update the pyramid
Pyramid: A hierarchy ofconvex contours
No local information processing
Kmeans model Generate Kmeans cluster centroids SketchSpline curve around the cluster centroids
Spline-curve Project points onto their nearest Spline-curve
X. Kong, C.D. Schunn / Cognitive Systems Research 8 (2007) 192–207 201
6.1. Number of intersections
For human and models, we computed the number oftimes the selected final path crossed itself (called intersec-tion). For data from humans and models with a randomfactor (Human, NN, CHSQ, Kmeans), we computedmeans (see Table 2).
Fig. 10 plots the number of intersections generated byhuman and each models on the 20 TSP problems used in
Table 2The sum (over all 20 problems) of means (over different participants or mode
Human NN Co
Number of intersections 2.3 110 6Correlation 0.30 �0Average signed error 4.98 0
Correlation and ASE on number of intersections between each model and hu
Fig. 10. Average number of intersections gen
our experiment. Because NN has no global information,it generates many more intersections than the rest of themodels and human data. Pyramid and convex hull havedeterministic algorithms, so they generated certain highpeeks on particular problems and zero values on others.Both Kmeans and CHSQ are close to human data in valueof number of intersections. None of the correlations withhuman performance were statistically significant, althoughthe CHSQ correlation was marginally significant (p < .1).
l runs) on number of intersections generated
nvex Hull Pyramid Kmeans CHSQ
14 2.8 2.3.13 0.23 0.31 0.39 (*).15 0.63 0.03 (*) �0.03 (*)
man participants; ‘‘*’’ indicates best matched model on each dimension.
erated by each model for each problem.

Table 3Correlation and ASE on accuracies between models and humanparticipants
NN Convex hull Pyramid Kmeans CHSQ
Correlation 0.70 0.62 0.41 0.84 (*) 0.67Average signed error 0.17 �0.01 0.02 0.04 0.00 (*)
‘‘*’’ indicates best matched model on each dimension.
202 X. Kong, C.D. Schunn / Cognitive Systems Research 8 (2007) 192–207
6.2. Mean accuracy
As shown in Table 3, NN is much worse than the humanperformance in term of mean accuracy. Convex Hull, Pyr-amid, Kmeans and CHSQ are close to human accuracy lev-els as has been found in the part. Kmeans model did departfrom the human data and the other three models as thenumber of points got larger. One reason for this is Kmeansmodel employed a naı̈ve local search strategy that projectpoints onto their nearest Spline-curve. As the number ofpoints going bigger, the ratio of centroids to points is smal-ler. So the Spline-curve is more inaccurate in characterizingthe detail local information. In this situation a moresophisticated local search strategy should be employed.
All but the Pyramid model led statistically significantcorrelation with (human data). The Kmeans model corre-lated with the trend of human performance best amongthe models we compared. Our hypothesis is that the globalinformation Kmeans model utilizes is the best approxima-tion to the global information human use, so it generate asimilar trend with human performance. Fig. 11 plots themeans of accuracy of human performance and each model.
6.3. Standard deviation
In addition to accounting for overall and problem-spe-cific differences in mean accuracy, a model could also tryaccount for overall and problem-specific differences in thevariability across participants in accuracy (as measuredby standard deviations). These differences in variability
Fig. 11. Accuracy performance of mod
might reflect the degree of garden path effects from differ-ent start points (i.e., small choices made early have largedown-the road consequences). A Levene Test shows thatthere are statistically significant differences in the standarddeviations of human accuracies on different problems.
At the level of overall standard deviations, the pyramidand Convex Hull models fail outright because they aredeterministic, and thus predict standard deviations of zero.The nearest neighbor model predicts standard deviationsthat are too large. The Kmeans and CHSQ models areclose to observed human levels overall (Fig. 12). In termsof predicting problems specific differences in variability,none were statistically significant. It may be because thata few participants who were using different strategies thanothers (see Table 4).
6.4. Natural vs. random performance
We also tested the performance of the models on the twodifferent set of points: natural and random. Recall that nat-ural paths start with worse accuracy but have smallerdecrease in accuracy as the number of points increase.None of the current models could predict the main effectof problem type nor the interaction with numbers of cities.However, a variation of the Kmeans model was successful:The minimum error in the 40 runs of Kmeans model for agiven TSP problem generated the same pattern shown inthe human performance. As we discussed earlier, there isno significant different between natural and random prob-lems in term of accuracy performance in the other two par-ticipant groups. So only when both global and localinformation are available, the participants will generatethis pattern of difference between natural and randomproblems. When we took the shortest path generated byour model across 40 runs, the accuracy performance forthe two kinds of problems generated by our best modelrun (Fig. 13a) matched the solution accuracy generatedby human participants (Fig. 13b). This is additional evi-
els and humans on each problem.

Table 4Mean standard deviation, correlation and ASE of the standard deviationsbetween human participants and models
Human NN Kmeans CHSQ
Mean 0.03 0.07 0.03 0.02Correlation 0.06 0.11 0.22Average signed error 0.04 0.01 (*) �0.01 (*)
‘‘*’’ indicates best matched models.
Fig. 12. Standard deviation on accuracy of human participants and the three models with any variability.
X. Kong, C.D. Schunn / Cognitive Systems Research 8 (2007) 192–207 203
dence that there exists a spline-curve generated by ourmodel that captured the global information human uses.The reason that the Kmeans model in average did not cap-ture this phenomenon may be because it generated toomany ‘‘bad’’ clusterings. In other words, only the ‘‘best’’clustering generated by K-Means clustering algorithmand the spline-curve it follows would resemble the globalinformation used by human cognition.
As the number of points goes up, the average number ofpoints in each cluster becomes bigger ð#Clusters ¼2�
ffiffiffiffiffiffiffiffiffiffiffiffiffiffiffiffi#pointsp
Þ. The global information generated by ourmodel becomes less accurate in guiding the local search,which results in the decrease in accuracy. However, in
Fig. 13. Accuracy trends on natural/random problems for
mid-size natural TSPs, there are some dense clusters. Thosedense clusters contain much more points than average.Since the clusters are so dense, that accuracy is not muchaffected by the possible detours around the points insidethose dense clusters. The number of points in the rest ofthe clusters remains small. So the global information is stillquite accurate. In other words, because of an uneven distri-bution, the complexity of global information for naturalpoints increased at a slower rate as the number pointsincreases.
6.5. Exact path correlations
A good model of human TSP problem solving shouldnot only predict the accuracy of the total path length thata human would generate on a TSP problem but also shouldbe able to predict the likelihood of human participant tak-ing a particular path. We used the following method to cal-culate the exact path correlation between human-generatedand model-generated solutions. For each TSP problemwith n cities, build a matrix of n · n, where each cellM(i, j) equals the numbers of observed paths between city
human participants (left) and Kmeans best run (right).

Fig. 14. Exact path correlation between human participants and eachmodel.
204 X. Kong, C.D. Schunn / Cognitive Systems Research 8 (2007) 192–207
i and city j. Then compare the similarity between the mod-els and the participants at the individual path level by lin-earizing the matrix and compute the correlation betweenthe two resulting vectors. Fig. 14 shows the mean correla-
Table 5Mean correlations between participant and model solutions on each of the20 problems
NN CH Pyramid Kmeans CHSQ
Mean correlation 0.83 0.78 0.77 0.89* 0.87
‘‘*’’ indicates best matched models.
Fig. 15. Chosen paths for a 50-point TSP
tion between the participant solutions and model solutionson each problem.
As Table 5 shows, the Kmeans model correlates best withthe participants’ choices on exact paths. The Kmeans modeloutperforms other models especially on larger size problems(n > 50), as Fig. 14 shows. One possible reason for this phe-nomenon is that as the size of the problem grows larger,human participants display a larger diversity of possible pathchoices. Our model captured this characteristic of humanTSP solving by generating different paths on each run.
We visualized the characteristic by plotting the fre-quency of an edge selection by participants or each modelas its thickness. Fig. 15 shows the solutions of a 50-pointsTSP generated by participants, Kmeans, CHSQ and Pyra-mid models. The arrows point to areas where participant-generated paths and Kmeans-generated paths displayed agreat similarity in both pattern (path choices) and thickness(path frequency). The same kind of similarity could not befound in other models.
This visualization technique also helps us to identify rea-sons for why the Kmeans model departed from human data.As we can see in Fig. 16, the main outside contour of theKmeans model displayed a large number of zigzags (as thearrows identifies) while the participants, the Pyramid andCHSQ models did not. The zigzags in the Kmeans modelare the result of its naı̈ve local search rule of projection.Since the Kmeans model connects points that have the near-est projections on the Spline-curve, those points themselvescould be far away if one point is inside the Spline-curve andthe next one is outside it. Through repeated crossing of theSpline-curve, the zigzag pattern is generated.
generated by participants and models.

Fig. 16. Chosen paths for a 100-point TSP generated by participants and models.
X. Kong, C.D. Schunn / Cognitive Systems Research 8 (2007) 192–207 205
6.6. Efficiency of global information representation
As the simulation results shown, the Kmeans model andCHSQ model are the best two in predicting human perfor-mance. But we have argued that the Kmeans model shouldpredict human performance better than other models inpart because it has a more compact representation of glo-bal information. Here we formulize this intuition, specifi-cally by comparing the efficiency of the spline-curve ofthe Kmeans model with the traditional convex hull for rep-resenting global information in TSP.
Fig. 17 shows the convex hull and a spline-curve gen-erated by our model on the same 70 points TSP. Both
Fig. 17. Convex hull (left) and splin
have 11 turning points, by which one could argue thatthey occupy approximately the same amount of visualworking memory. But the spline-curve contains moreinformation of the original problem so that it would bea better guide to the local search. Less information isrequired to be processed to build a path in the local infor-mation-processing phase using the spline-curve than theconvex hull as the global information. This idea can beformalized as follows:
1. I(S) � I(C).2. I(PathjS) < I(PathjC).3. IðSÞ
IðPathjSÞ >IðCÞ
IðPathjCÞ.
e-curve (right) of 70 points TSP.

206 X. Kong, C.D. Schunn / Cognitive Systems Research 8 (2007) 192–207
I(S) is the information contained in the spline-curve, andI(C) is the information contained in the convex hull, whichare approximations of their size in human visual/spatialworking memory. I(PathjS) is the conditional informationof the TSP path given the spline-curve as the global infor-mation, which is an approximation of the amount of infor-mation-processing in the local search phase. I(PathjC) isthe same information conditional on the given convex hull.As we can see, the spline-curve yields a higher ratio ofinformation efficiency.
7. Conclusion
In this paper, we proposed an alternative model ofhuman performance on the TSP, to test general predictionsabout the nature of global visual information that guideslocal visual information search. It has been previouslyargued that human cognition utilizes both global informa-tion and local information to solve the traveling salesmanproblem. Our model has separate phases of global informa-tion processing and local information processing, consis-tent with that of Best (2005). Result of our experimentand model simulations has shown that global informationis important for human TSP solving and humans tend touse spline-like low-frequency curves around clusters to rep-resent the global information.
We proposed two criteria for the global information:compactness and sufficiency. We defined the global infor-mation in our model to be a Spline-curve generated fromthe Kmeans cluster centroids. This global information iscompact in size to be able to easily fit human visual/spatialworking memory constrains. It is also sufficient to guidethe local search without high search costs. Our local searchstrategy is very simple. By doing a simple projection ontothe Spline-curve, our local information-processing phaseguarantees the linearity on reaction time as a function ofnumber of points. This local information processing partof the Kmeans model also processes points in a sequentialway as suggested in previous research (Best, 2005; MacGr-egor et al., 2000).
To evaluate our model, we compared the models withhuman performance data that we collected. Our model fitsthe human performance well in number of intersections andthe mean standard deviations of accuracy. The accuracyperformance of the Kmeans model departs did a little bitfrom the human data when the number of points was large.This departure might be a result of an overly simplisticlocal search strategy, and/or our assumption that the globalinformation is fully processed in the beginning no longerholds for large TSPs due to its complexity and workingmemory requirement. But our model generates a high cor-relation with the trend of human performance on differentproblems, suggesting that we have captured important ele-ments of the global information that human use.
The presented ideas in modeling the global informationprocessing in the TSP solving could also be adopted in
other problem solving domains. When a certain factor inthe problem solving process can not be directly observedor can only be weakly measured, it might be helpful tobuild a computational model of the problem solving pro-cess and compare its fitness in different dimensions as theuncertain factor is manipulated.
8. Future work
Currently our model is based on the hypothesis that glo-bal information is fully processed in the beginning of TSPsolving. Furthermore, the global information used in con-trol condition is not directly observable. It would be inter-esting to explore the possibility of interleaved global/localinformation processing when the size of TSP is large. Aneye-tracking experiment would be helpful to further inves-tigate these issues.
A more sophisticated local search strategy should alsobe developed to substitute the naı̈ve projection rule. To fur-ther test our hypothesis about the nature of the globalinformation processing, some other visual problem solvingtasks, such as map reading and navigation, would be inter-esting to look at.
MacGregor and Ormerod (1996) and MacGregor, Orm-erod, and Chronicle (1999) suggest that the difficulty of aTSP is affected by the number of points inside the convexhull and the layout of points. Our result in this paper fur-ther points to the direction that the complexity of the glo-bal information, instead of merely the number of pointsinside, caused the difficulty. So a qualitative analysis ofthe relationship between the complexity of global informa-tion and the difficulty of the problem would be interestingtoo.
Acknowledgement
Work on this project was supported by grants N00014-02-1-0113 and N00014-03-1-0061 to the second authorfrom the Office of Naval Research.
References
Best, B. J. (2004). Modeling human performance on the travelingsalesperson problem: Empirical studies and computational simulations(Doctoral dissertation, Carnegie Mellon University, 2004). Disserta-
tion Abstracts International, 66, 6302.Best, B. J. (2005). A model of fast human performance on a computa-
tionally hard problem. In Proceedings of the 27th annual conference of
the cognitive science society (pp. 256–262).Compton, B. J., & Logan, G. D. (1993). Evaluating a computational
model of perceptual grouping by proximity. Perception and Psycho-
physics, 53, 403–421.Cowan, N. (2001). The magical number 4 in short-term memory: A
reconsideration of mental storage capacity. Behavioral and Brain
Sciences, 24, 87–185.Golden, B. L., Bodin, L. D., Doyle, T., & Stewart, W. Jr., (1980).
Approximate traveling salesman algorithms. Operations Research, 28,694–711.
Graham, S., Joshi, A., & Pizlo, Z. (2000). The traveling salesman problem:A hierarchical model. Memory and Cognition, 28, 1191–1204.

X. Kong, C.D. Schunn / Cognitive Systems Research 8 (2007) 192–207 207
MacGregor, J. N., & Ormerod, T. C. (1996). Human performance on thetraveling salesman problem. Perception and Psychophysics, 62,527–539.
MacGregor, J. N., Ormerod, T. C., & Chronicle, E. P. (1999). Spatial andcontextual factors in human performance on the traveling salespersonproblem. Perception, 28, 1417–1427.
MacGregor, J. N., Ormerod, T. C., & Chronicle, E. P. (2000). A model ofhuman performance on the traveling salesperson problem. Memory
and Cognition, 28, 1183–1190.MacQueen, J. B. (1967). Some methods for classification and analysis of
multivariate observations. In The Proceedings of the fifth Berkeley
symposium on mathematical statistics and probability (pp. 281–297).Berkeley, CA: University of California Press.
Newell, A., & Simon, H. A. (1972). Human problem solving. EnglewoodCliffs, NJ: Prentice-Hall.
Ormerod, T. C., & Chronicle, E. P. (1999). Global perceptual processes inproblem solving: The case of the traveling salesperson. Perception and
Psychophysics, 61, 1227–1238.
Pylyshyn, Z. W. (1989). The role of location indexes in spatial perception:A sketch of the FINST spatial-index model. Cognition, 32, 65–97.
Rosenkrantz, J. D., Stearns, R. E., & Lewis, M. P. II, (1977). An analysisof several heuristics for the traveling salesman problem. SIAM Journal
on Computing, 6, 563–581.Schunn, D. C., & Wallach, D. (2001). Evaluating goodness-of-fit in
comparison of models to data. http://www.lrdc.pitt.edu/schunn/gof/.Van Oeffelen, M. P., & Vos, P. G. (1982). Configurational effects on the
enumerations of dots: Counting by groups. Memory and Cognition, 10,296–404.
Van Rooij, I., Stege, U., & Schactman, A. (2003). Convex hull andtour crossings in the Euclidean traveling salesperson problem: Impli-cations for human performance studies. Memory and Cognition, 31,215–220.
Victers, D., Lee, M., Dry, M., & Hughes, P. (2003). The roles of theconvex hull and the number of potential intersections in performanceon visually presented traveling salesperson problems. Memory and
Cognition, 31, 1094–1104.