Embed Size (px)
Citation preview

GLOBAL & USA CANCER BIOMARKER MARKET to 2018
© Kelly Scientific Publications 2014
GLOBAL & USA CANCER BIOMARKER MARKET to 2018
© Kelly Scientific Publications 2014
GLOBAL & USA CANCER BIOMARKER MARKET to 2018 (Identification, Technologies,
Market Analysis, Competitor Profiles, Companion Diagnostic Co-Development, Business
Strategies, Industry Trends, and Pipeline Analysis)
Table of Contents
1.0 Executive Summary 13 1.1 Objectives of Report 13 1.2 Data Sources and Methodology 15 1.3 Key Findings and Observations 15 1.3.1 What Makes Cancer Biomarkers so Important for the Healthcare Industry? 15 1.3.2 What Technologies are Used to Identify Novel Biomarkers? 16 1.3.3 Increase in Cancer Prevalence is Propelling the Oncogenic Biomarker Market 16
1.3.4 Global and US Economic Impact of Cancer 16 1.3.5 How Cancer Biomarkers are Revolutionizing Cancer Treatment 17 1.3.6 What are the most Significant and Strategic Cancer Biomarkers? 17 1.3.7 Global Biomarker Test Market Analysis 18 1.3.8 Global Cancer Biomarker Market Analysis 18 1.3.9 Oncology Biomarker Market Main Industry Players 19 1.3.10 Drivers, Restraints, Opportunities and Challenges of the Cancer Biomarker Market 19
2.0 Global Burden of Cancer 20 2.1 Global Cancer Statistics 20 2.2 Lung Cancer Globally 25 2.3 Lung Cancer Mutation Analysis 28 2.4 Colorectal (Bowel) Cancer Globally 29
2.5 Prostate Cancer Globally 31 2.6 Breast Cancer Globally 33 2.7 Global Economic Impact of Cancer 39 2.8 Cancer in the USA 40 2.9 Breast Cancer in the US 43 2.10 Lung Cancer in the US 44 2.11 Colorectal Cancer in the US 45 2.12 Prostate Cancer in the US 50
2.13 Skin Cancer in the US 52 3.0 Oncogenic Biomarkers – An Overview 54 3.1 Biomarker Discovery to Clinical Validation 56 3.2 Specific Technologies Used in Biomarker Discovery 57 3.2.1 Proteomics 57 3.2.2 Mass Spectrometry Based Technologies 57
3.2.3 Principles of Diagnostic Mass Spectrometry 58 3.2.4 Liquid Chromatography Tandem Mass Spectrometry (LC-MS/MS) 58 3.2.5 Nano LC-MS/MS 59 3.2.6 MALDI-TOF 59 3.3 Glycomics 60 3.4 Metabolomics 61 3.5 Peptidomics 62
3.5.1 Enzyme-Linked Immunosorbent Assay (ELISA) 62 3.6 Selected (Multiple) Reaction Monitoring 66 3.7 DNA Based Techniques 67 3.7.1 Microarrays 67 3.7.2 Small Molecule Real Time (SMRT) DNA Sequencing 69 3.7.3 Digital PCR 69 3.7.4 Next Generation Sequencing 70

GLOBAL & USA CANCER BIOMARKER MARKET to 2018
© Kelly Scientific Publications 2014
3.7.5 Second-Generation Sequencing Platforms 71 3.7.6 Whole Genome Sequencing 71 3.7.7 Epigenomics 72 3.7.8 Bioinformatics and Next Generation Sequencing 72
3.7.9 Third Generation Sequencing 72 4.0 Biomarker Validation 73 4.1 Introduction 73 4.2 Phases of Biomarker Validation 73 4.3 Biomarker Validation and Clinical Trials 75 5.0 Current and Prospective Oncogenic Biomarkers 77
5.1 Catalogue of Somatic Mutations in Cancer (COSMIC) 77 5.2 P53 Transcription Factor Oncogenic Mutations 78 5.2.1 Current Clinical Trials Investigating P53 as an Oncogenic Biomarker 83 5.3 Epidermal Growth Factor Receptor (EGFR) 84 5.3.1 EGFR-Activating and Resistance Mutations 85 5.3.2 Clinically Validated Resistance Mechanisms to EGFR Inhibitors 86 5.3.3 Current Strategies to Defeat Resistance to EGFR-Mediated Cancer Therapeutics 87
5.4 BRCA- Mutant Cancers 87 5.5 PARP-Inhibitors are Making a Comeback 90 5.5.1 Olaparib – A Pipeline PARP-Inhibitor 90 5.5.2 Niraparib (MK4827) in Phase III trials 91 5.5.3 Rucaparib 91 5.5.4 Veliparib 91 5.5.5 Novel Biomarkers in the PARP-Inhibitor Response Pathway 92
5.6 PTEN – Current Leader in Pipeline Onocogenic Biomarkers 92 5.7 Ataxia Telangiectasia Mutated (ATM) – A Pipeline Target 93 5.8 TMPRSS2-ERG – A Promising Prostate Cancer Biomarker 94 5.9 MiR-17/92 Cluster – The Oncomir with Biomarker Potential 95 5.9.1 Altered MiR-17/92 Expression Correlates with Cancer Pathogenesis 95 5.9.2 MiR-17/92 Cluster and Colorectal Cancer 96 5.9.3 MiR-17/92 Cluster and Breast Cancer 96 5.9.4 MiR-17/92 Cluster and Ovarian Cancer 97
5.9.5 MiR-17/92 Cluster and Lung Cancer 97 5.9.6 MiR-17/92 Cluster and Renal Cancer 97 5.9.7 MiR-17/92 Cluster and Head and Neck Cancer 97 5.9.8 MiR-17/92 Cluster and Pancreatic Cancer 97 5.9.9 MiR-17/92 Cluster and Liver Cancer 98 5.9.10 MiR-17/92 Cluster and Acute Myeloid Leukaemia 98 5.9.11 MiR-17/92 Cluster and B-Cell Lymphoma 98
5.9.12 MiR-17/92 Cluster and B-Cell Chronic Lymphocytic Leukemia 98 5.9.13 Transcriptional Regulators of MiR-17/92 Cluster 98 5.9.14 Significant Molecular Targets of MiR-17/92 99 6.0 Cancer Biomarker Test Market Analysis 2013-2018 101 6.1 Economic Burden of Cancer Worldwide 101 6.2 Economic Burden of Cancer in the US 101
6.3 Global Biomarker Test Market Analysis 102 6.4 Oncology Biomarkers Dominate the Biomarker Market 103 6.5 Global Cancer Profiling Technology Market 105 6.6 Global Cancer Biomarker Market Analysis 105 6.7 Market Share of Oncology Market Within Total Biomarker Market 108 6.8 US Cancer Biomarker Market 108 6.9 Oncology Biomarker Market is Fuelled by Year-on-Year Expansion of Research Publications 109

GLOBAL & USA CANCER BIOMARKER MARKET to 2018
© Kelly Scientific Publications 2014
6.10 Proteomic and Genomic Technologies are Preferred as Methods of Detection by End-Users 114
7.0 Oncology Biomarker Market Main Industry Players 115 7.1 23andMe 115
7.2 Affymetrix 116 7.3 Ambry Genetics 118 7.4 Astex Pharmaceuticals 119 7.5 Atossa Genetics 121 7.6 CuraGen 122 7.7 Celera Corporation (Quest Diagnostics) 122 7.8 Celldex Therapeutics 122 7.9 deCode Genetics (Amgen) 124
7.10 Foundation Medicine 124 7.11 Illumina 125 7.12 Genelex 126 7.13 Genomic Health 126 7.14 Myriad 126 7.15 Nodality 127 7.16 OriGene Technologies 130
7.17 Randox 130 7.18 Qiagen 131 8.0 Oncology Biomarker Market Products and Kits 133 8.1 Oncology Companion Diagnostic Tests 133 8.1.1 HER2 Tests in Breast Cancer Patients 133 8.2 23andMe 135
8.3 Affymetrix 139 8.4 Ambry Genetics 140 8.4.1 BRCAPlus 140 8.4.2 BreastNext 141 8.4.3 CancerNext 141 8.4.4 ColoNext 141 8.4.5 OvaNext 142 8.4.6 PancNext 142
8.4.7 RenalNext 142 8.4.8 Hereditary Diffuse Gastric Cancer Test 145 8.5 Astex Pharmaceuticals 150 8.6 Atossa Genetics 150 8.6.1 Mammary Aspirate Specimen Cytology Test (MASCT™) 150 8.6.2 ForeCYTE Breast Health Test (SM) 150 8.6.3 ArgusCYTE Breast Health Test(SM) 151
8.6.4 FullCYTE Breast Health Test 151 8.6.5 NextCYTE Breast Health Test 151 8.7 BioMerieux 151 8.7.1 THxID™ -BRAF Kit 151 8.8 Celera (Quest Diagnostics) 151 8.9 deCode Genetics 153 8.9.1 deCODE Breast Cancer™ 153
8.9.2 deCODE Prostate Cancer™ 153 8.9.3 deCODE AF™ 153 8.9.4 deCODE Complete™ 153 8.9.5 deCODE Cancer™ 154 8.9.6 deCODE Services 154 8.10 Foundation Medicine 155 8.10.1 FoundationOne 155

GLOBAL & USA CANCER BIOMARKER MARKET to 2018
© Kelly Scientific Publications 2014
8.10.2 FoundationOne Heme 155 8.11 Illumina 157 8.11.1 Illumina New-Generation Sequencing Technology 157 8.11.2 Illumina HiSeq 2500/1500 158
8.11.3 Illumina HiSeq 2000/1000 158 8.11.4 Genome Analyzer IIx 159 8.11.5 Illumina MiSeq 159 8.11.6 Illumina HiScanHQ 159 8.11.7 Illumina HiScan and iScan Array 159 8.12 Genelex 160 8.13 Genomic Health 160 8.13.1 Oncotype DX Breast Cancer Test 160
8.13.2 Oncotype DX Colon Cancer Test 161 8.13.3 Oncotype DX Prostate Cancer Assay 161 8.14 Myriad Genetics 163 8.14.1 BRACAnalysis® 163 8.14.2 Comprehensive BRACAnalysis® 165 8.14.3 BRACAnalysis® Rearrangement Test (BART) 165 8.14.4 Single Site BRACAnalysis® 165
8.14.5 Multisite 3 BRACAnalysis® 165 8.14.6 COLARIS®/COLARIS AP® 166 8.14.7 MELARIS® 166 8.14.8 PANEXIA® 166 8.14.9 OnDose® 167 8.14.10 PREZEON™ 167 8.14.11 THERAGUIDE® 5FU 167
8.14.12 Prolaris® 167 8.15 Nodility 168 8.16 OriGene 168 8.16.1 TissueScan™ Cancer cDNA Arrays 168 8.17 Randox 172 8.17.1 Tumor PSA Marker Array 172 8.17.2 Tumor Marker Array 3 172 8.17.3 KRAS/ BRAF/PIK3CA Array 172
8.18 Qiagen 173 8.18.1 Genotyping Products 173 8.18.2 QIAsymphony Platform 175 8.18.3 Therascreen® EGFR RGQ PCR Kit 176 8.18.4 Therascreen KRAS RGQ PCR System 176 8.18.5 Therascreen® IDH1/2 test 176 8.19 Roche 177
8.19.1 Cobas® EGFR Mutation Test 177 9.0 Market Participant Financial and Business Strategy Analysis 178 9.1 23andMe 178 9.2 Affymetrix 180 9.3 Astex Pharmaceuticals (Otuska Pharamceutical) 189
9.4 Atossa Genetics 192 9.5 BioMerieux 195 9.6 Celera (Quest Diagnostics) 200 9.7 Celldex Therapeutics 206 9.8 deCode Genetics (Amgen) 207 9.9 Foundation Medicine 208 9.10 Illumina 210

GLOBAL & USA CANCER BIOMARKER MARKET to 2018
© Kelly Scientific Publications 2014
9.11 Genelex 213 9.12 Genomic Health 213 9.13 Myriad 214 9.14 Nodality 218
9.15 Qiagen 220 10.0 Objective Business and Strategic Analysis of the Cancer Biomarker Market 225 10.1 Drivers of Oncogenic Biomarker Market 225 10.1.1 High demand and Unmet Need Enhances the Global Biomarker Market 225 10.1.2 Biomarkers are Highly Specific Diagnostic and Prognostic Clinical Tools 225 10.1.3 Increasing Cancer Prevalence Globally 226 10.1.4 FDA Support Increases Biomarker Development 226
10.1.5 More Streamlined Clinical Trials 227 10.1.6 Significant Growth of High-Impact Oncogenic Biomarker Research 227 10.1.7 Advancements in Discovery Technologies 227 10.2 Challenges of the Oncogenic Biomarker Market 228 10.2.1 Variability of Biomarkers within Different Cancer Subtypes 228 10.2.2 Integration of Genomics and Biomarker Diagnostics into the Healthcare System 228 10.2.3 Ethical Considerations 228
10.3 Restraints of the Cancer Biomarker Market 229 10.3.1 Initial Investment into Biomarker Discovery and Development 229 10.3.2 Are Biomarkers Profitable for Smaller Companies? 229 10.4 Opportunities for the Cancer Biomarker Market 230 10.4.1 Personalized Medicine Market Opportunities 230 10.4.2 Companion Diagnostics 230
List of Figures
Benefits of Investing in our Cutting-Edge Reports
Clients receive complementary content* with mid-level and enterprise wide licences
Post-sale complementary consultation with senior expert analyst is included
Use of tables and figures in your own reports and presentations is permitted
Each report provides straight-talking strategic analysis & sector intelligence
All reports are updated each quarter to give you the most up-to-date information
WE WANT TO MAXIMIZE YOUR BUSINESS POTENTIAL
* Subject to terms & conditions negotiated with Kelly Scientific Publications prior to sale

GLOBAL & USA CANCER BIOMARKER MARKET to 2018
© Kelly Scientific Publications 2014
Figure 2.1: Global Cancer Statistics – Key Facts 20 Figure 2.2: Number of Lung, Breast and Colorectal Cancer Diagnoses Globally, 2012 21 Figure 2.3: Percentage of Lung, Breast and Colorectal Cancer Diagnoses Globally, 2012 21
Figure 2.4: Number of Lung, Liver and Stomach Cancer Deaths Globally, 2012 22 Figure 2.5: Percentage of Lung, Liver and Stomach Cancer Deaths Globally, 2012 22 Figure 2.6: Global Cancer Incidence, Men 2012 (per 100,000) 23 Figure 2.7: Global Cancer Mortality, Men 2012 (per 100,000) 23 Figure 2.8: Global Cancer Incidence, Women 2012 (per 100,000) 24 Figure 2.9: Global Cancer Mortality, Women 2012 (per 100,000) 24 Figure 2.10: Number (Millions) of Smokers (Men and Women) in China, Russia, India, the UK and USA 25
Figure 2.11: Incidence and Mortality Rates of Global Lung Cancer (Male and Female) 27 Figure 2.12: Incidence and Mortality Rates of Global Colorectal Cancer (Male and Female) 30 Figure 2.13: Incidence and Mortality Rates of Global Prostate Cancer 32 Figure 2.14: Global Incidence and Mortality of All Cancer Types (excl non-melanoma skin-cancer) per 100,000, Male and Female 34 Figure 2.15: Combined Global Prostate, Breast, Colorectal, Lung and Bladder Cancer Incidence and Mortality by Male and Female 35
Figure 2.16: Cancer Deaths in Women, Globally according to Cancer Type 36 Figure 2.17: Estimated Age-Standardised Incidence Rate per 100,000 of Breast Cancer Globally 36 Figure 2.18: Top Three Cancers Leading to Global Economic Burden of Cancer ($ Billion) 40 Figure 2.19: Top 20 Cancers in the USA, Adults (Male and Female) 41 Figure 2.20: Top Adult Male Cancers, USA, Estimated Five Year Prevalence 2012-2017 42 Figure 2.21: Top Adult Female Cancers, USA, Estimated Five Year Prevalence 2012-2017 42 Figure 2.22: US Age Adjusted Cancer Death Rates Per 100,000 (Male) by Cancer Type, 1930-2009 43
Figure 2.23: US Age Adjusted Cancer Death Rates Per 100,000 (Female) by Cancer Type, 1930-2009 43 Figure 2.24: Incidence and Mortality of Lung Cancer (Male) Patients in the Americas 44 Figure 2.25: Incidence and Mortality of Lung Cancer (Female) Patients in the Americas 45 Figure 2.26: Incidence and Mortality of Colorectal Cancer (Male and Female) Patients in the Americas 47 Figure 2.27: Colorectal Cancer Incidence Rates (per 100,000) by Race/Ethnicity and Sex, USA 48 Figure 2.28: Colorectal Cancer Death Rates (per 100,000) by Race/Ethnicity and Sex, USA 48 Figure 2.29: Colorectal Cancer Incidence Rates (per 100,000) by State, USA 48
Figure 2.30: Colorectal Cancer Mortality Rates (per 100,000) by State, USA 49 Figure 2.31: Adults Aged 50–75 Years (%) That are Up-to-Date with Colorectal Test Screening, by State, United States 49 Figure 2.32: Incidence and Mortality of Prostate Cancer (Male) Patients in the Americas 51 Figure 2.33: Incidence and Mortality of Melanoma (Male and Female) Patients in the Americas 53 Figure 3.1: Integration of Oncogenic Biomarker Data to Cancer Diagnosis and Clinical Decisions 55
Figure 3.2: Influence of Biomarker Market on R&D, Molecular Diagnostics, Emerging Diagnostics and Independent Clinical Molecular Diagnostic Services 55 Figure 3.3: Biomarker Discovery to Clinical Assay Development and Validation Process 56 Figure 3.4: Mass Spectrometry Based Technologies in Oncogenic Biomarker Discovery 57 Figure 3.5: Principles of Enzyme-Linked Immunosorbant Assay (ELISA) 63 Figure 4.1: The Different Phases of Fit-For-Purpose Biomarker Validation 74
Figure 4.2: Biomarker Validation Using ELISA Technique 75 Figure 5.1: Frequency of Genetic Mutation by Cancer Subtype 77 Figure 5.2: Oncogenic Biomarker P53 Signalling Pathway: Activators, Effectors, Inhibitors and
Cellular Outcomes 79 Figure 5.3: P53 Somatic Mutation Prevalence by Tumor Site 80
Figure 5.4: P53 Germline Mutation Prevalence by Tumor Site 81
GLOBAL & USA CANCER BIOMARKER MARKET to 2018
© Kelly Scientific Publications 2014
Figure 5.5: EGFR Signalling Pathways and Potential Biomarker Proteins 85 Figure 5.6: Clinically Validated Resistance Mechanisms to EGFR Inhibitors 86 Figure 5.7: BRCA Mutation Increases the Risk of Breast and Ovarian Cancer 89 Figure 5.8: Proactive Cancer Management and Preventative Measures Reduces the Risks of
Developing BRCA-associated Breast and Ovarian Cancer 89 Figure 6.1: Economic Burden of Cancer in the US, Direct and Indirect Costs ($ billion) 101 Figure 6.2: Economic Burden of Cancer in the US, Direct and Indirect Costs (%) 102 Figure 6.3: Global Biomarker Market Worth (Billions) and CAGR (%) 2011-2018 103 Figure 6.4: Oncogenic Biomarker Share of Total Personalized Medicine Biomarker Space 104 Figure 6.5: Oncogenic Biomarker Market Distribution by Cancer Type 104 Figure 6.6: Global Cancer Profiling Technology Market Worth (Billions) and CAGR 2013-2018 105
Figure 6.7: Global Cancer Biomarker Market Worth (Billions) and CAGR (%) 2009-2018 106 Figure 6.8: Global Oncology Biomarker Market as a Percentage of Total Biomarker Market 2013-2018 108 Figure 6.9: USA Cancer Biomarker Market Share Compared to Global Biomarker Market 2013-2018 109 Figure 6.10: Number of Peer-Reviewed Publications in the Area of Oncology Biomarker Research 2008-2013 110 Figure 6.11: Number of Peer-Reviewed Publications ion Oncogenes within Oncogenic Biomarker
Research 2008-2013 110 Figure 6.12: Number of Peer-Reviewed Publications on MicroRNAs Within Oncology Biomarker Research 2008-2013 111 Figure 6.13: Number of Peer-Reviewed Publications on Epigenetic Modifications Within Oncology Biomarker Research 2008-2013 111 Figure 6.14: Number of Peer-Reviewed Publications by the National Cancer Institute Within Oncology Biomarker Research 2008-2013 112
Figure 6.15: Number of Peer-Reviewed Publications on Tumor Suppressor Genes Within Oncology Biomarker Research 2008-2013 112 Figure 6.16: Number of Peer-Reviewed Publications on incRNA Within Oncology Biomarker Research 2008-2013 113 Figure 6.17: Most Popular Proteomic and Genomic Technologies Performed by End-Users 114 Figure 7.1: Celldex Therapeutics Product Pipeline 123 Figure 7.2: Single Cell Network Profiling (SCNP) Technology by Nodality 129
Figure 7.3: Developed Functional Assays that Nodality has explored using new SCNP Technology 129
Figure 8.1: HER2 Testing Algorithm for Breast Cancer 133 Figure 8.2: HER2 Cellular Signalling 133 Figure 8.3: QUICKFACTS: Herceptin – Mechanism of Action 134 Figure 8.4: Illumina New Generation Sequencing Technology Workflow Station 157 Figure 8.5: Genomic Health Studies Used in the Development of the DCIS Score Algorithm 160
Figure 8.6: Genomic Health Gene Panel Used for Oncotype DX Breast Cancer Test 161 Figure 8.7: Genomic Health Gene Panel Used for Oncotype DX Colon Cancer Test 161 Figure 8.8: Genomic Health Oncotype DX Prostate Cancer Test Development Process 162 Figure 8.9: Genomic Health Gene Panel Used for Oncotype DX Prostate Cancer Test 162 Figure 8.10: OriGene’s TissueScan Cancer cDNA Array Sequence of Analysis 169 Figure 9.1: Private Funding Gained by 23andMe 2007-2012 178
Figure 9.2: Affymetrix Revenue by Business Segment (Percentage), 2013 184 Figure 9.3: Affymetrix Revenue by Business Segment (Percentage), 2013 184 Figure 9.4: Affymetrix Total Revenue 2007-2013 185 Figure 9.5: Affymetrix Revenue by Product Division – Consumables, Instruments 2010-2012 186 Figure 9.6: Affymetrix Core Product Sales – Gene Expression, Genetic Analysis & Clinical Applications and Life Science Reagents, 2011-2012 186 Figure 9.7: Affymetrix Revenue Derived from Outside the US, 2009-2012 187

GLOBAL & USA CANCER BIOMARKER MARKET to 2018
© Kelly Scientific Publications 2014
Figure 9.8: Affymetrix Revenue Derived from the US, 2009-2012 187 Figure 9.9: Affymetrix Net Loss, 2009-2012 188 Figure 9.10: Affymetrix Research and Development Funding, 2009-2012 188 Figure 9.11: Affymetrix Revenue Generated within USA (Percentage) 2010-2012 189
Figure 9.12: Astex Pharmaceuticals Priority Pipeline Products SGI-110 and AT13387 by Indication, Clinical Phase and Timeline 190 Figure 9.13: Astex Pharmaceuticals Revenue Generated 2008-2012 191 Figure 9.14: Astex Pharmaceuticals Net Income 2009-2012 191 Figure 9.15: Atossa Genetics Total Revenue (US$) 2011, 2012 194 Figure 9.16: Atossa Genetics Revenue (US$) Generated by MASCT Sales and ForeCYTE & ArgusCYTE Diagnostic Testing, 2012 194 Figure 9.17: Atossa Genetics Percentage Revenue Generated by MASCT Sales and ForeCYTE &
ArgusCYTE Diagnostic Testing, 2012 195 Figure 9.18: Quest Diagnostics Revenue ($ Billions) 2008-2013 201 Figure 9.19: Quest Diagnostics Operating Revenue ($ Billions) 2008-2013 202 Figure 9.20: Quest Diagnostics Net Income ($ Billions) 2008-2013 202 Figure 9.21: Celera (Quest Diagnostics) Historic Revenue Generated 2008-2010 203 Figure 9.22: Celera (Quest Diagnostics) Historic Gross Margin Generated 2008-2010 203 Figure 9.23: Celera (Quest Diagnostics) Historic Revenue Generated– Laboratory Services and
Products 2008-2010 204 Figure 9.24: Celera (Quest Diagnostics) Historic Revenue (%) Generated by Distribution Agreement with Abbott 2008-2010 205 Figure 9.25: Celera (Quest Diagnostics) Historic Research and Development Spending 2008-2010 206
Figure 9.26: deCode Genetics Historic Net Loss Incurred 2004-2008 208 Figure 9.27: Foundation Medicine International Sales – FoundationOne 2012-2013 208 Figure 9.28: Foundation Medicine International Revenue 2012-2013 209
Figure 9.29: Foundation Medicine Geographical (USA) Revenue Percentage 2011-2013 210 Figure 9.30: Illumina Revenue Generated ($ Billions) 2010-2013 212 Figure 9.31: Illumina Net Income Generated ($ Billions) 2010-2013 212 Figure 9.32: Genomic Health Oncotype DX Test Revenue 2008-2013 214 Figure 9.33: Myriad Revenue Generated 2007-2014 216 Figure 9.34: Operating Income Generated by Myriad 2007-2013 217 Figure 9.35: Myriad Revenue Generated by Molecular Diagnostic Testing and Companion Diagnostic Services, 2012-2013 217
Figure 9.36: Future Molecular Diagnostic Pipeline of Myriad 218 Figure 9.37: Customer Profile of Qiagen – Percentage of Net Sales 2012/2013 222 Figure 9.38: Qiagen Global Net Sales 2007-2013 223 Figure 9.39: Qiagen Operating Income 2007-2013 223 Figure 9.40: Qiagen Global Net Income 2007-2013 224
List of Tables

GLOBAL & USA CANCER BIOMARKER MARKET to 2018
© Kelly Scientific Publications 2014
Table 2.1: QUICKFACTs- Top Five Most Frequent Cancers in Men and Women, Globally 20 Table 2.2: Main Clinical Stages of Lung Cancer 26 Table 2.3: Current Therapeutic Options for Lung Cancer 27
Table 2.4: QUICKFACTs- Estimated Age-Standardised Incidence Rate per 100,000 of Breast Cancer per Country, Worldwide 37 Table 2.5: Risk Factors of Colorectal Cancer 47 Table 3.1: Important Advantages of Using Biomarkers as Diagnostic Tools 54 Table 3.2: Biomarkers in Early Drug Development and Decision Making 54 Table 3.3: Biomarkers in Later Drug Development and Decision Making 55 Table 3.4: Functions of Biomarkers within the Healthcare Setting 55
Table 3.5: Ideal Attributes of Clinical Oncogenic Biomarkers 56 Table 3.6: Main Technologies Used in the Discovery of Biomarkers 56 Table 3.7: Proteomic Technologies Used in Biomarker Discovery 57 Table 3.8: Types of Cancer Aided Diagnostically by Mass Spectrometry 58 Table 3.9: Recommendations for Use of MALDI-TOF MS in Cancer Diagnostics 60 Table 3.10: Metabolomic Discovered Potential Oncogenic Biomarkers 62 Table 3.11: Cancer Biomarkers in Clinical Practice Using ELISA Technology 64
Table 3.12: Putative Cancer Biomarkers that can be Detected using ELISA Technology 64 Table 3.13: Advantages of Selected (Multiple) Reaction Monitoring Technique in Biomarker Discovery 67 Table 3.14: Major Advantages of Microarray Assays 67 Table 3.15: Applications of Microarrays 67 Table 3.16: Applications of Microarray Technology in Cancer Diagnostics 68 Table 3.17: Commercially Available Microarray Kits for Cancer Diagnostics 68
Table 3.18: Recommendations for Use of Microarrays in Cancer Diagnostics 69 Table 3.19: Digital PCR in Comparison to Real-time PCR and Traditional PCR 70 Table 3.20: Advantages of Digital PCR 70 Table 3.21: Applications of Digital PCR 70 Table 4.1: Current General Classes of Biomarker Assay as Defined by the American Association of Pharmaceutical Scientists 73 Table 4.2: Comparison of Validative Properties of Different Bioassay Classes 73
Table 5.1: Catalogue of Somatic Mutations in Cancer (COSMIC) Current Statistics 77 Table 5.2: Important Genetic Oncogenic Biomarkers and Their Application in Treatment 78 Table 5.3: P53 Somatic Mutation Prevalence by Tumor Site 80 Table 5.4: P53 Germline Mutation Prevalence by Tumor Site 81 Table 5.5: List of P53 Down-regulated Gene Targets 82 Table 5.6: List of P53 Up-regulated Gene Targets 82
Table 5.7: Positive Regulators of Epidermal Growth Factor Receptor (EGFR) Activity 84 Table 5.8: Types of Cancer Associated with EGFR Over-expression 85 Table 5.9: EGFR-Activating and Resistance Mutations Identified in Lung Adenocarcinoma 86 Table 5.10: Current Next Generation EGFR Inhibitors that Target the T790M Mutation 87 Table 5.11: Prevalence of Deleterious Mutations in BRCA1 and BRCA2 Genes 87 Table 5.12: Prevalence of Deleterious Mutations in BRCA1 and BRCA2 in Individuals of Ashkenazi Ancestry 88
Table 5.13: Risk Factors for Hereditary Breast and Ovarian Cancer (HBOC) 89 Table 5.14: PARP Inhibitors in Late-Stage Development 90 Table 5.15: Novel and Potential Biomarkers Within the PARP-Inhibitor Response Pathway 92 Table 5.16: Negative Regulators of PTEN Protein Expression 92 Table 5.17: Positive Regulators of PTEN Protein Expression 92 Table 5.18: ATM Molecular Targets and Protein Interactions 94 Table 5.19: Key Facts Regarding MiR-17/92 Cluster 95

GLOBAL & USA CANCER BIOMARKER MARKET to 2018
© Kelly Scientific Publications 2014
Table 5.20: Expression Levels of Individual MiR-17/92 Biomarkers in Cancer, Cardiovascular Disease, Alzheimer’s, Multiple Sclerosis, Aging and Normal Development 96 Table 5.21: Functional and Validated Positive Regulators of MiR-17/92 98 Table 5.22: Functional and Validated Negative Regulators of MiR-17/92 99
Table 5.23: Potential Regulators of MiR-17/92 99 Table 5.24: Cellular Signal Transduction Pathways Regulated by the MiR-17/92 Cluster 99 Table 5.25: Specific Cell Death Protein Targets of the MiR-17/92 Cluster 100 Table 5.26: Specific Cell Cycle Arrest Protein Targets of the MiR-17/92 Cluster 100 Table 5.27: Specific Cell Cycle Regulation Protein Targets of the MiR-17/92 Cluster 100 Table 5.28: Specific Heart and Lung Development Protein Targets of the MiR-17/92 Cluster 100 Table 5.29: Specific Cell Proliferation Protein Targets of the MiR-17/92 Cluster 100
Table 6.1: Global Biomarker Market Worth (Billions) and CAGR (%) 2011-2018 102 Table 6.2: Main Diagnostic Areas Within Oncology Biomarker Market 103 Table 6.3: Future Diagnostic Areas With High Potential Within Oncology Biomarker Market 103 Table 6.4: Global Cancer Profiling Technology Market Worth (Billions) and CAGR 2013-2018 105
Table 6.5: Global Cancer Biomarker Market Worth (Billions) and CAGR (%) 2009-2018 106 Table 6.6: USA Cancer Biomarker Market Share Compared to Global Biomarker Market 2013-2018 108
Table 6.7: Main Sub-Sets of Oncogenic Biomarker Research Published 2008-2013 109 Table 7.1: Patent Listing of Affymetrix Array technology 117 Table 7.2: Patent Listing of Affymetrix Genotyping Technology 117 Table 7.3: Patent Listing of Affymetrix Expression and Profiling Technology 118 Table 7.4: Advantages of Astex Pharmaceuticals Pyramid™ Fragment-Drug-Discovery System 119 Table 7.5: Astex Pharmaceuticals Pipeline Portfolio 120
Table 7.6: Astex Pharmaceuticals Pipeline Portfolio Funded Completely by Partner Companies 120
Table 7.7: Potential Business Partnerships of Celldex Therapeutics 123 Table 7.8: Illumina Core Technologies 125 Table 7.9: Illumina Core Technology Applications 125 Table 7.10: Illumina Instrument Product Portfolio 125 Table 7.11: Illumina Assay Product Portfolio 125 Table 7.12: Genetic Test Panel Available from Genelex for Research Institutions and Clinical Trials 126 Table 7.13: Pre-Clinical, Clinical and Commercial Applications of SCNP by Nodality 130
Table 7.14: Qiagen Timeline of Events, 1994-2012 131 Table 7.15: QUICKFACTs - Range of Product Groups from Qiagen 132 Table 8.1: Types of Diagnostic Tests Available to Determine HER2 Status in Breast Cancer Patients 133
Table 8.2: Validated HER2 Tests for Cancer 134 Table 8.3: Advantages and Limitations of IHC HER2 testing applied to breast cancer 134 Table 8.4: In-Situ Hybridization Determination of HER2 Expression by PathVysion® and HER2 FISH
pharmDxTM 134 Table 8.5: HER2 CISH Determination 135 Table 8.7: Validated FISH Kits for HER2 Testing in Breast Cancer 135 Table 8.8: Validated SISH Kits for HER2 Testing in Breast Cancer 135 Table 8.9: Validated CISH Kits for HER2 Testing in Breast Cancer 135 Table 8.10: Advantages and Limitations of ISH Techniques Applied to HER2 Testing in Breast Cancer 135 Table 8.11: 23andMe Disease Risk Genetic Test Panel 136
Table 8.12: 23andMe Carrier Status Genetic Test Panel 137 Table 8.13: 23andMe Drug Response Genetic Marker Test Panel 138 Table 8.14: 23andMe Genetic Traits Test Panel 138 Table 8.15: QUICKFACTs - Product Overview of Affymetrix 139 Table 8.16: Microarray Products by Affymetrix 140 Table 8.17: Affymetrix Research Services Laboratory (ARSL) Premier Services 140 Table 8.18: Genetic Applications of Axiom® Technology by Affymetrix 140

GLOBAL & USA CANCER BIOMARKER MARKET to 2018
© Kelly Scientific Publications 2014
Table 8.19: Clinical Diagnostic Test Kits Available from Ambry Genetics 143 Table 8.20: Ambry Genetics Cancer Test Portfolio and Genetic Biomarkers 143 Table 8.21: Ambry Genetics Comprehensive List of Genetic Tests by Disease and Genetic Biomarkers 143
Table 8.22: Ambry Genetics BRCA1/2 Breast Cancer Test Portfolio 149 Table 8.23: Ambry Genetics Genome Sequencing Services 149 Table 8.24: Ambry Genetics New Generation Sequencing Platform Portfolio & Applications 149 Table 8.25: Range of Small Molecule Therapeutics Available from Astex Pharmaceuticals 150 Table 8.26: Genetic Tests Available from BHL/Celera 152 Table 8.27: Panel of BHL Clinical Diagnostic Tests 152 Table 8.28: Genetic Diagnostic Tests Available from deCode Genetics 153 Table 8.29: Disease States that are Included in the deCODE Complete™ Genetic Screen 154
Table 8.30: Panel of Diseases Screened for in the deCODE Cancer™ Test 154 Table 8.31: deCODE Genetics Genotyping and Sequencing Service 154 Table 8.32: deCODE Genetics Data Management, Protection and Storage Service 154 Table 8.33: deCODE Genetics Sequence Inputation and Data Analysis Service 155 Table 8.34: FoundationOne Assay Technical Specifications 155 Table 8.35: FoundationOne Assay Oncogenic Gene Portfolio 155 Table 8.36: FoundationOne Heme Assay Oncogenic Gene Portfolio 156
Table 8.37: Illumina HiSeq 2500/1500 Performance Parameters 157 Table 8.38: Illumina HiSeq 2000/1000 Performance Parameters 157 Table 8.39: Genome Analyzer IIx Performance Parameters 158 Table 8.40: Illumina MiSeq Product Specifications 158 Table 8.41: Illumina HiScanHQ Product Specifications 159 Table 8.42: Illumina HiScan and iScan Array Product Applications 159 Table 8.43: Illumina HiScan and iScan Array Kits 159
Table 8.44: Predictive Genetic Tests Available from Myriad 163 Table 8.45: Services offered with BRACAnalysis® Testing from Myriad 163 Table 8.46: Advantages of BRACAnalysis® Testing 163 Table 8.47: QUICK FACTs- Prevalence of Deleterious Mutations in BRCA1 & BRCA2 Genes 164 Table 8.48: QUICK FACTs- prevalence of deleterious mutations in BRCA1 and BRCA2 in individuals of
Ashkenazi Ancestry 164 Table 8.49: QUICK FACTs- Risk Factors for Hereditary Breast and Ovarian Cancer (HBOC) 165
Table 8.50: QUICKFACTs- BRACAnalysis® Panel of Assays 165
Table 8.51: COLARIS® Test Range by Myriad 166 Table 8.52: COLARIS AP® Test Range by Myriad 166 Table 8.53: MELARIS® Test Range from Myriad 166 Table 8.54 Personalized Medicine Tests from Myriad 167 Table 8.55: The Prolaris Score for Prostate Cancer 167 Table 8.56: OnDose® Testing Procedure from Myriad 168 Table 8.57: OriGene TissueScan cDNA Array Oncology Product Portfolio 169
Table 8.58: Qiagen Genotyping Products for Sample Collection, stabilization and Storage 171 Table 8.59: Qiagen Genotyping Products for Genomic DNA Isolation and Purification 171 Table 8.60: Qiagen Genotyping Products for PCR Based Genotyping Analysis 171 Table 8.61: Qiagen Products for Genotyping Analysis 174 Table 8.62: Qiagen Genotyping Products for PCR Detection 174 Table 8.63: Qiagen Assays for Genetic Analysis 174 Table 8.64: Qiagen Pyrosequencing-Based Genetic Analysis Products 174
Table 8.65: Specifications and Features of Qiagen’s QIAsymphony and QIAsymphony RGQ 175 Table 9.1: Drug Classes Investigated by 23andMe Using Genome Wide Association Studies 179 Table 9.2: Acquisition Profile of Affymetrix 181 Table 9.3: Genetic Applications of Axiom® Technology by Affymetrix 181 Table 9.4: Diversified Business Units of Affymetrix 181 Table 9.5: Affymetrix AgBio Microarray Portfolio 183

GLOBAL & USA CANCER BIOMARKER MARKET to 2018
© Kelly Scientific Publications 2014
Table 9.6: BioMerieux Immunodiagnostic Product Portfolio 195 Table 9.7: BioMerieux Microbiology Product Portfolio 196 Table 9.8: BioMerieux Molecular Diagnostic Product Portfolio 198 Table 9.9: Celera (Quest Diagnostics) Historic Operating (Loss) (US$) – Laboratory Services and
Products 2008-2010 204 Table 9.10: Diagnostic Test Product Categories Manufactured by BHL/Celera and Exclusively Distributed by Abbott 204 Table 9.11: Celldex Therapeutics R&D Expenses ($) 2010-2012 207 Table 9.12: Price Listing of Genelex Familial Genetic Tests 213 Table 9.13: Myriad - Core Business Decisions and Impact on Industry 217 Table 9.14: Future Test Portfolio of Myriad 218 Table 9.15: Nodality’s Single Cell Network Profiling (SCNP) Technology as a Systems Based
Biology Approach to Drug Discovery and Validation 219 Table 10.1: Drivers of the Oncogenic Biomarker Market 227 Table 10.2: Integration of Genomics and Biomarker Diagnostics into the Healthcare System 228 Table 10.3: Challenges of the Cancer Biomarker Market 228

GLOBAL & USA CANCER BIOMARKER MARKET to 2018
© Kelly Scientific Publications 2014
1.0 Executive Summary
“GLOBAL & USA CANCER BIOMARKER MARKET to 2018 (Identification, Technologies,
Market Analysis, Competitor Profiles, Companion Diagnostic Co-development, Business
Strategies, Industry Trends, and Pipeline Analysis)” by Kelly Scientific Publications is a
comprehensive report on the cancer biomarker industry and its impact on the health system. This report tackles the growing market interest in oncogenic biomarkers, personalized medicine, companion diagnostics and the associated market environment. Cancer biomarkers are molecular or genetic moieties (e.g., cells, proteins/peptides, genetic mutations,
gene products, enzymes, or hormones) that not only are readily identifiable, but easily quantified in
the lab setting. They function primarily to identify or correlate significantly with the severity or
occurrence of a certain disease state. The rise in number of oncogenic biomarkers over the last
number of years has massive potential in the healthcare industry and serves to propel both the
personalized medicine and companion diagnostic markets.
One of the most import aspects of biomarkers is their use to diagnose and assess the progress of
disease states in patients. As quantitative markers, these agents also offer the ability to monitor
response to certain drug treatments and so are important in the area of personalized medicine.
Individualized, targeted or personalized medicine aims to increase the efficacy of therapeutics via genetic testing and companion diagnostics. Personalized therapeutics and associated companion
diagnostics will be more specific and effective thereby giving pharma/biotech companies a significant advantage to recuperate R&D costs. Personalized medicine will reduce the frequency of adverse drug reactions and therefore have a dramatic impact on health economics. Developmental and diagnostic companies will benefit from lower discovery and commercialization costs and more specific market subtypes. This report describes the current technologies that are propelling the cancer biomarker and companion
diagnostic market. It examines the current genetic diagnostic tests and companion diagnostic assays that are in use by the medical and pharmaceutical industry today. Current developments in personalized medicine and the pharmacogenomics revolution are discussed. The emerging trends that appear in the global market and the most developed market (US) are elucidated and analysed. This study reveals market figures of the overall biomarker market and the cancer biomarker space (2013-2018). Forecast projections and future growth rates are provided to give the reader a forthcoming perspective of this growing industry.
The study also provides a comprehensive financial, business strategy and product review of key players in the cancer biomarker industry. Strategic drivers and restraints of this market are revealed and market opportunities and challenges are identified. In summary, the cancer biomarker and associated companion diagnostic market have huge opportunities for growth. This industry will revolutionize the healthcare system and will improve therapeutic effectiveness and reduce the severity of adverse effects. It has enormous potential for
investment and the emergence of genetic-based in vitro diagnostics.
1.1 Objectives of Report
This is a comprehensive account of the market size, segmentation, key players, SWOT analysis, influential technologies, and business and economic environments. The report is supported by 280
tables & figures over 232 pages. This report is presented as follows:

GLOBAL & USA CANCER BIOMARKER MARKET to 2018
© Kelly Scientific Publications 2014
By Company (e.g., 23andMe, AFFYMETRIX, ATOSSA GENETICS, NODALITY, deCode /Amgen, CELERA, MYRIAD, FOUNDATION MEDICINE, GENOMIC HEALTH)
By Geography (Global, US)
By Sub-market (Global Biomarker Market, Cancer Biomarker Market, Global Cancer Profiling Technology Market )
A wealth of financial data & business strategy information is provided including:
Up-to-date company financials, sales & revenue figures
Revenue and market forecasts up to 2018
Business model strategies for diagnostic, pharmaceutical and biotechnology companies
Therapeutics and Companion Diagnostics (e.g., BRAC Analysis, Oncotype Dx , KRAS Mutations)
Comprehensive account of company product financials, portfolios & kits
SWOT, Economic & Regulatory Environment specifics include:
Key strengths, weaknesses and threats influencing leading player position within the market
Technologies driving the market (e.g., New-Generation Sequencing Technologies, Ultra-High
Throughput Sequencing)
Top fastest growing market segments and emerging opportunities
Top pharmaceutical companies within the cancer biomarker market
Comprehensive product portfolios, R&D activity and pipeline therapeutics
M&A activity and future strategies of top companies
Approved biomarker companion diagnostic tests
High demand and Unmet Need Enhances the Global Biomarker Market
FDA Support Increases Biomarker Development
More Streamlined Clinical Trials
Significant Growth of High-Impact Oncogenic Biomarker Research
Advancements in Discovery Technologies
Challenges of the Oncogenic Biomarker Market
Variability of Biomarkers within Different Cancer Subtypes
Integration of Genomics and Biomarker Diagnostics into the Healthcare System
Ethical Considerations
This report highlights a number of significant pharmacos and gives details of their operations, products, financials and business strategy.
• 23andMe • Affymetrix • Ambry Genetics • Astex Pharmaceuticals • Atossa Genetics • BioMerieux
• CuraGen • Celera Corporation (Quest Diagnostics) • Celldex Therapeutics • deCode Genetics (Amgen) • Foundation Medicine • Illumina • Genelex
GLOBAL & USA CANCER BIOMARKER MARKET to 2018
© Kelly Scientific Publications 2014
• Genomic Health • Myriad • Nodality
OriGene Technologies
• Randox • Qiagen 1.2 Data Sources and Methodology
The project leader and author of this research obtained a Ph.D. in Medicine from the Royal College of Surgeons in Ireland, following completion of a M.Sc. in Biotechnology (NUIG) and an honours degree in Biochemistry from Trinity College Dublin. She has extensive experience in genetics,
bionmarker and pharmacogenomic research and development and has conducted post-doctoral studies and lecturing in Trinity College Dublin. With many years of medical writing and publishing the author also has extensive experience and knowledge of molecular biology, immunology, bioinformatics and diagnostic testing. As a pharma/biotech industry analyst she has significant expertise in laboratory diagnostic testing and instrument and reagent development technology. Sources of information for this report were collected and compiled from company specific corporate
websites, annual reports, press-releases, international scientific and medical journals and news and research reports. Graphical and numerical data have been referenced and sourced accordingly. Specific websites were consulted and referenced throughout the completion of this report including that of the Food and Drug Association (www.fda.gov), the National Cancer Institute and other government agencies worldwide. Kelly Scientific Publications has used the most recent statistical and numerical data available. The most reliable of data sources were used in the production of this report, however we cannot guarantee complete accuracy or completeness from secondary information
sources.
1.3 Key Findings and Observations 1.3.1 What Makes Cancer Biomarkers so Important for the Healthcare Industry?
Cancer biomarkers are molecular or genetic moieties (e.g., cells, proteins/peptides, genetic mutations,
gene products, enzymes, or hormones) that not only are readily identifiable, but easily quantified in
the lab setting. They function primarily to identify or correlate significantly with the severity or
occurrence of a certain disease state. The rise in number of oncogenic biomarkers over the last
number of years has massive potential in the healthcare industry and serves to propel both the
personalized medicine and companion diagnostic markets.
One of the most import aspects of biomarkers is their use to diagnose and assess the progress of
disease states in patients. As quantitative markers, these agents also offer the ability to monitor
response to certain drug treatments and so are important in the area of personalized medicine.
Biomarkers offer significant potential in advancing modern medicine with regards to improving
patient diagnosis and treatment options. As many biomarkers are of genetic origin, they can also be
used as predisposition markers. Other advantages of these molecular tools include the stratification of
patient populations and an increased drug specificity to maximize efficacy and minimize toxicity.
Therapies will become more specific as a result of using biomarkers as diagnostic tools, and this will
in turn ensure that patients are more responsive to treatment without experiencing un-necessary
adverse effects
GLOBAL & USA CANCER BIOMARKER MARKET to 2018
© Kelly Scientific Publications 2014
1.3.2 What Technologies are Used to Identify Novel Biomarkers?
The main technologies that are used to discover biomarkers include bioinformatics, genomics, next
generation sequencing, proteomics, nanobiology, systems biology and also the use of stem cells. This
report gives a comprehensive analysis of the most important techniques used in industry and R&D
today, and reveals which technologies hold the most promise within the market. The report also
delves into the complicated practice of biomarker validation and assesses the different phases of
validation – from identification to quality control monitoring.
Table 1: Main Technologies Used in the Discovery of Biomarkers
Genomics
Next Generation Sequencing
Bioinformatics
Proteomics
Metabolomics
Nanobiology
Systems Biology
Imaging Technologies
Stem Cells
1.3.3 Increase in Cancer Prevalence is Propelling the Oncogenic Biomarker Market
Over 32 million people globally are living with cancer in 2014. According to Cancer Research UK,
over 14.1 million new cancer cases were diagnosed in 2012. Of these, 7.4 million men and 6.6 million
women were diagnosed. The most common cancers reported are:
Lung
Breast
Colorectal (bowel)
Prostate
These four cancer subtypes account for 40% of total. In 2012 alone, 8.2 million people died from
cancer globally, with 60% of these occurring in less developed regions. Lung, liver, stomach and
bowel cancers were responsible for the majority of these deaths, with lung cancer the most significant
killer at 20% or 1.59 million deaths. Liver cancer killed 0.8 million in 2012, with stomach cancer
killing 0.7 million.
Cancer is the second most common cause of death in the US today, killing one in every four. The
National Cancer Institute estimates that 13.7 million Americans have had cancer in the past or are
currently suffering from this disease. Recent statistics from the American Cancer Society (ACS)
estimated over 580,000 US citizens died from cancer in 2013. Of these, 174,100 deaths could have
been prevented. The World Cancer Research Fund estimated that up to 33% of US cancers in 2013
were attributed to lifestyle factors.

GLOBAL & USA CANCER BIOMARKER MARKET to 2018
© Kelly Scientific Publications 2014
Table 2: Top Five Most Frequent Cancers in Men and Women, Globally
Men Women Total
Lung Breast Lung
Prostate Colorectum Breast
Colorectum Cervix uteri Colorectum
Stomach Lung Stomach
Liver Stomach Prostate
Figure 1: Percentage of Lung, Breast and Colorectal Cancer Diagnoses Globally
1.3.4 Global and US Economic Impact of Cancer
GLOBOCAN estimates that by 2025, 19.3 million new cancer cases annually will be diagnosed. This
will be primarily due to an aging population. Furthermore, the majority of these cases will occur in
less developed regions of the world.
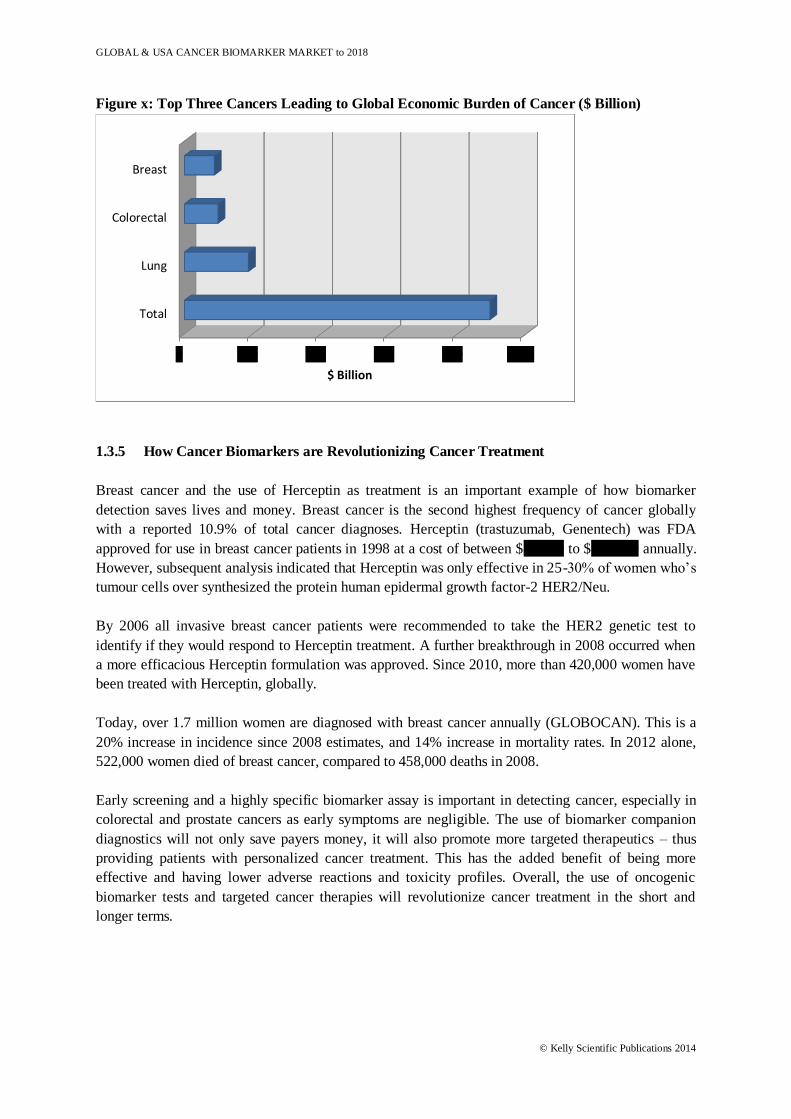
The American Cancer Society estimates that the global economic burden of cancer is in the region of
$900 billion annually. This is 1.5% of worldwide GDP figures. The top cancers that contribute to this
economic burden are lung, colorectal and breast cancer, costing over $188 billion, $99 billion, and
$88 billion respectively.
The National Institutes of Health (NIH) indicated that the economic burden of cancer in the US is
over $200 billion, annually. This is divided into direct medical costs ($77 billion) and indirect
mortality costs ($123 billion) that includes the cost of lost productivity.
19%
9%
9% 63%
Lung Liver Stomach Other
GLOBAL & USA CANCER BIOMARKER MARKET to 2018
© Kelly Scientific Publications 2014
Figure x: Top Three Cancers Leading to Global Economic Burden of Cancer ($ Billion)
1.3.5 How Cancer Biomarkers are Revolutionizing Cancer Treatment
Breast cancer and the use of Herceptin as treatment is an important example of how biomarker
detection saves lives and money. Breast cancer is the second highest frequency of cancer globally
with a reported 10.9% of total cancer diagnoses. Herceptin (trastuzumab, Genentech) was FDA
approved for use in breast cancer patients in 1998 at a cost of between $50,000 to $100,000 annually.
However, subsequent analysis indicated that Herceptin was only effective in 25-30% of women who’s
tumour cells over synthesized the protein human epidermal growth factor-2 HER2/Neu.
By 2006 all invasive breast cancer patients were recommended to take the HER2 genetic test to
identify if they would respond to Herceptin treatment. A further breakthrough in 2008 occurred when
a more efficacious Herceptin formulation was approved. Since 2010, more than 420,000 women have
been treated with Herceptin, globally.
Today, over 1.7 million women are diagnosed with breast cancer annually (GLOBOCAN). This is a
20% increase in incidence since 2008 estimates, and 14% increase in mortality rates. In 2012 alone,
522,000 women died of breast cancer, compared to 458,000 deaths in 2008.
Early screening and a highly specific biomarker assay is important in detecting cancer, especially in
colorectal and prostate cancers as early symptoms are negligible. The use of biomarker companion
diagnostics will not only save payers money, it will also promote more targeted therapeutics – thus
providing patients with personalized cancer treatment. This has the added benefit of being more
effective and having lower adverse reactions and toxicity profiles. Overall, the use of oncogenic
biomarker tests and targeted cancer therapies will revolutionize cancer treatment in the short and
longer terms.
0 200 400 600 800 1000
Total
Lung
Colorectal
Breast
$ Billion

GLOBAL & USA CANCER BIOMARKER MARKET to 2018
© Kelly Scientific Publications 2014
1.3.6 What are the most Significant and Strategic Cancer Biomarkers?
This cutting-edge report provides a wealth of information on the current and prospective biomarkers
in the cancer field. A comprehensive array of the most significant oncogenic biomarker families are
analysed with respect to their mechanism of action, clinical functionality and also current clinical
trials and studies that are investigating the following:
P53 Transcription Factor Oncogenic Mutations
Epidermal Growth Factor Receptor (EGFR)
BRCA- Mutant Breast and Ovarian Cancer biomarkers
PARP-Inhibitors
PTEN – the Tumour Suppressor Gene
Ataxia Telangiectasia Mutated (ATM)
TMPRSS2-ERG
MiR-17/92 Cluster
Significant Molecular Targets of MiR-17/92
A number of cancer types have developed resistance to targeted therapies, and so this report also
identifies current strategies to defeat resistance in certain biomarker types.
1.3.7 Global Biomarker Test Market Analysis
Kelly Scientific Publications estimate that the global biomarker market is currently worth $17.3
billion up from $15 billion in 2012. Over the last number of years it has grown at a CAGR of 14.6%,
however this is expected to rise to 18.5% between 2013 and 2018. By 2018, the global biomarker
market is estimated to be worth over $40 billion.
The global biomarker market is segmented into the following therapeutic areas:
Oncology
Cardiology
Neurology
Infectious disease (e.g., HIV, TB)
Renal disorders
Diabetes
Arthritis
Detailed analysis of this market is provided within this report. The cancer biomarker market is by far
the most established within the biomarker space.

GLOBAL & USA CANCER BIOMARKER MARKET to 2018
© Kelly Scientific Publications 2014
Figure 2: Oncogenic Biomarker Share of Total Personalized Medicine Biomarker Space
1.3.8 Global Cancer Biomarker Market Analysis
As early as 2009, the global cancer biomarker market was worth $4.1 billion and grew to $7.9 billion
in 2013 with a CAGR of 18.1%. Over the next five years the market is expected to grow further, by a
CAGR of 18.22% to reach over $18 billion in 2018. It is estimated that by 2018, 30% of cancer
patients will have a predictive biomarker assay. Currently, 22% of pipeline therapeutics are being
investigated in a subsection of patients defined by using a biomarker assisted assay. The cancer
biomarker market has the largest share of the overall biomarker market at 45.6% in 2013 ($7.9 billion
of $17.3 billion total). By 2018, the oncology biomarker market is expected to be worth $18 billion,
compared to $40 billion in total.
Figure 4: Global Cancer Biomarker Market Worth (Billions) and CAGR (%) 2009-2018
Cancer
Neurodegenerativedisease
Adverse drug reactions
HIV/AIDS
Cardiovascular
0
2
4
6
8
10
12
14
16
18
20
2009 2010 2011 2012 2013 2014 2015 2016 2017 2018
$ B
illio
ns
GLOBAL & USA CANCER BIOMARKER MARKET to 2018
© Kelly Scientific Publications 2014
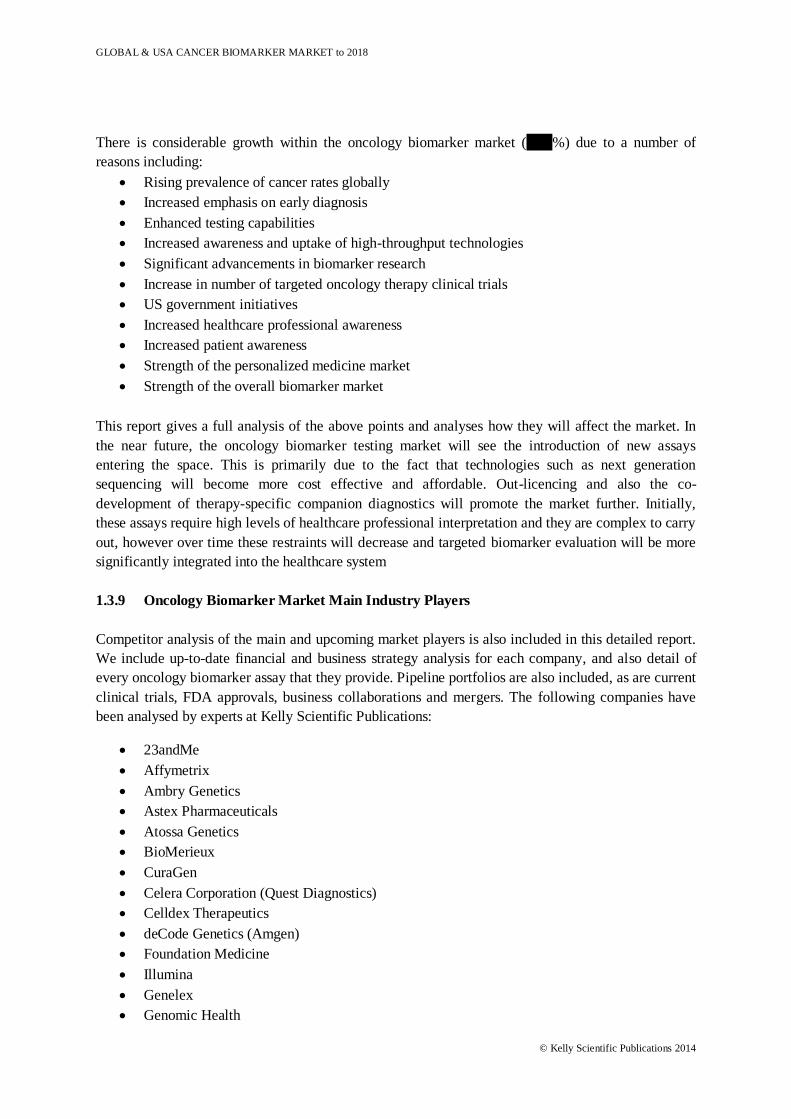
There is considerable growth within the oncology biomarker market (18.2%) due to a number of
reasons including:
Rising prevalence of cancer rates globally
Increased emphasis on early diagnosis
Enhanced testing capabilities
Increased awareness and uptake of high-throughput technologies
Significant advancements in biomarker research
Increase in number of targeted oncology therapy clinical trials
US government initiatives
Increased healthcare professional awareness
Increased patient awareness
Strength of the personalized medicine market
Strength of the overall biomarker market
This report gives a full analysis of the above points and analyses how they will affect the market. In
the near future, the oncology biomarker testing market will see the introduction of new assays
entering the space. This is primarily due to the fact that technologies such as next generation
sequencing will become more cost effective and affordable. Out-licencing and also the co-
development of therapy-specific companion diagnostics will promote the market further. Initially,
these assays require high levels of healthcare professional interpretation and they are complex to carry
out, however over time these restraints will decrease and targeted biomarker evaluation will be more
significantly integrated into the healthcare system
1.3.9 Oncology Biomarker Market Main Industry Players
Competitor analysis of the main and upcoming market players is also included in this detailed report.
We include up-to-date financial and business strategy analysis for each company, and also detail of
every oncology biomarker assay that they provide. Pipeline portfolios are also included, as are current
clinical trials, FDA approvals, business collaborations and mergers. The following companies have
been analysed by experts at Kelly Scientific Publications:
23andMe
Affymetrix
Ambry Genetics
Astex Pharmaceuticals
Atossa Genetics
BioMerieux
CuraGen
Celera Corporation (Quest Diagnostics)
Celldex Therapeutics
deCode Genetics (Amgen)
Foundation Medicine
Illumina
Genelex
Genomic Health

GLOBAL & USA CANCER BIOMARKER MARKET to 2018
© Kelly Scientific Publications 2014
Myriad
Nodality
Randox
Qiagen
1.3.10 Drivers, Restraints, Opportunities and Challenges of the Cancer Biomarker Market
This analyses also provides you with a comprehensive account of the drivers and restraints of the
global and US cancer biomarker markets. There is a general high demand for biomarker assays and
corresponding targeted therapeutics and also an un-met need in the market space. Clinical trials are
supporting market growth as they are more streamlined and increasing FDA and regulatory support is
also proving positive. There has been a significant boost in oncogenic biomarker research publications
over the last five years, and this is further enhancing R&D budgets and investment opportunities. A
number of restraints such as initial investment, sample collection and storage and also regulatory
hurdles were also identified. The cancer biomarker market however, has enormous potential not only
within the overall biomarker space, but also within the personalized medicine and companion
diagnostic markets.