Embed Size (px)
Citation preview
GLOBAL UNIVERSITY RANKINGS
AND THEIR IMPACT
REPORT II
E UA R E P O RT O N R A N K I N G S 2013
Andrejs Rauhvargers
EUA_Ranking_II_RZ_Cover in 4c.indd 1 27.03.13 11:19

Copyright 2013 © by the European University Association
All rights reserved. This information may be freely used and copied for non-commercial purposes, provided that the source is acknowledged (© European University Association).
Additional copies of this publication are available for 20 Euro per copy.
European University Association asbl Avenue de l’Yser 24 1040 Brussels, Belgium Tel: +32-2 230 55 44 Fax: +32-2 230 57 51
A free electronic version of this report is available through www.eua.be
ISBN: 9789078997412 “Six Blind Men and an Elephant” image Copyright © 2011 Berteig Cosulting Inc. Used with permission.

Global University rankinGs
and their impact
– report ii –
e Ua r e p o rt o n r a n k i n G s 2013
andrejs rauhvargers
4
G l o b a l U n i v e r s i t y r a n k i n G s a n d t h e i r i m p a c t – r e p o r t i i –
Editorial 6
Acronyms 8
Introduction 10
PART I: An analysis of new developments and trends in rankings since 2011 11
1. Overview: methodological changes, new rankings and rankings-related services 11
1.1 Changes in methodology (global rankings covered in the 2011 Report) 11
1.2 New rankings (since 2011) 11
1.3 Rankings existing previously but not covered in the 2011 Report 12
1.4 New products and services derived from rankings 12
1.5 Update on EU-supported projects and the OECD’s AHELO feasibility study 14
1.6 Improvements in indicators 15
1.7 IREG ranking audit 16
2. Main trends 17
2.1 A continued focus on elite universities 17
2.2 Relative neglect of the arts, humanities and the social sciences 18
2.3 Superficial descriptions of methodology and poor indicators 19
2.4 Addressing the near exclusiveness of English-language publications 19
2.5 A more self-critical attitude to rankings from the providers 19
2.6 Consolidation of the overall phenomenon of rankings 21
3. The growing impact of rankings 21
3.1 Uses and abuses of rankings 21
3.2 Policy implications of rankings 22
3.3 How universities respond to rankings 24
4. Main conclusions 26
PART II: Methodological changes and new developments in rankings since 2011 27
1. The SRC ARWU rankings 27
ARWU Ranking Lab and Global Research University Profiles (GRUP) 27
Macedonian University Rankings 29
Greater China Ranking 29
2. National Taiwan University Ranking: performance ranking of scientific papers
for world universities 30
Contents

5
G l o b a l U n i v e r s i t y r a n k i n G s a n d t h e i r i m p a c t – r e p o r t i i –
3. Times Higher Education 31
Times Higher Education World University Ranking 31
THE academic reputation surveys and THE World Reputation Ranking 34
THE 100 under 50 ranking 36
4. Thomson Reuters’ Global Institutional Profiles Project 37
5. Quacqarelli-Symonds rankings 39
QS World University Ranking 40
Additional league table information 40
The QS classification 40
QS Stars 42
QS World University Rankings by subject 43
QS Best Student Cities Ranking 46
QS top-50-under-50 Ranking 48
6. CWTS Leiden Ranking 48
7. Webometrics Ranking of World Universities 52
8. U-Map 53
9. U-Multirank 54
10. U21 Rankings of National Higher Education Systems 59
11. SCImago Rankings 62
SCImago Institutional Rankings 63
Other SCImago rankings and visualisations 64
12. University Ranking by Academic Performance 65
13. EUMIDA 66
14. AHELO 68
15. IREG ranking audit 69
Bibliography 73
Annex 1 80
EUMIDA Core Set of Variables 80
Annex 2 82
The International Rankings Expert Group and Berlin Principles 82
6
G l o b a l U n i v e r s i t y r a n k i n G s a n d t h e i r i m p a c t – r e p o r t i i –
Two years after the publication of the first EUA Report on Global University Rankings in 2011 their number continues to increase, methodologies continue to develop and countless new products are being offered to universities. EUA therefore decided to produce a second report as a service to our members, with the intention of documenting the new developments that have taken place since 2011 and also drawing attention to the consolidation of the overall phenomenon of rankings, and their growing impact on universities and in the public policy arena.
There have been countless discussions on rankings and their significance for universities and policy makers in the last two years. EUA hopes that this second report will help to ensure that future debates are well-grounded in reliable information and solid analysis of the methodologies and indicators used, and ensure the usefulness of the new products being developed. We
would also hope that our work contributes to making universities and policy makers alike more aware of the potential uses and misuses of rankings, and their impact, for example, on student recruitment, immigration policies, the recognition of qualifications and choice of university partners. These developments indicate the need to reflect on the extent to which global rankings are no longer a concern only for a small number of elite institutions but have become a reality for a much broader spectrum of universities as they seek to be included in, or improve their position in one or the other rankings. This means that they have started to shape the development of higher education systems as such which is a significant shift bearing in mind that most international rankings in their present form still only cover a very small percentage of the world’s 17,500 universities, between 1% and 3% (200-500 universities), with little consideration given to the rest. As such, they are of direct relevance for only around half of EUA members, but at the same time they still impact the rest of EUA members through the policy influence described above.
Given these developments at a time when higher education is increasingly becoming a global business, with institutions large and small operating in a competitive international environment, the first part of the report focuses on the main trends observed and analyses the different ways in which rankings are affecting universities’ behaviour and having an impact on public policy discussions. Governments’ interest stems from the fact that they see universities as key actors in the globalisation of higher education and research, which they consider as important for national and regional competitiveness and prosperity; hence their interest in having their universities well-placed in global rankings. One effect observed both top-down from the side of governments in some countries and bottom-up at the initiative of individual institutions is that of increasing interest in institutional mergers and consolidation to different degrees with a view to improving competiveness, and thus also positioning in the rankings.
The second part of the report focuses on detailed descriptions and analysis of the changes since 2011 in the methodologies used by the main international rankings and the new products and services on offer. It also refers to rankings that are perceived to be growing in importance and interest, or were not in existence two years ago. As in 2011, the report uses only publically available and freely accessible information. This detailed analysis is intended to support universities in understanding the degree to which the various rankings are transparent, from a user’s perspective, of the relationship between what is said to be measured and what is in fact being measured, how the scores are calculated and what they mean. This is all the more important now that the main ranking providers are offering a whole range of
Editorial

7
G l o b a l U n i v e r s i t y r a n k i n G s a n d t h e i r i m p a c t – r e p o r t i i –
(paying) services to institutions, in most cases based upon the information that institutions have provided to them free of charge.
Looking to the future it is evident that given the increasing internationalisation of higher education and the competitive pressures on institutions, the debate on rankings will continue. EUA will continue to play an active role in these discussions focusing in the coming two years in particular on learning more about their specific impact on higher education institutions. This will also include constructively critical monitoring of the present implementation phase of the U-Multirank initiative.
Acknowledgements
The Editorial Board overseeing this report was chaired until March 2012 by EUA President, Professor Jean-Marc Rapp, former Rector of the University of Lausanne, and since then by his successor Professor Maria Helena Nazaré, and included also: Professor Jean-Pierre Finance, former President of the University of Lorraine and EUA Board member; Professor Howard Newby, Vice-Chancellor of the University of Liverpool; and Professor Jens Oddershede, Rector of the University of Southern Denmark and President of the Danish Rectors’ Conference.
The Editorial Board would like to thank most sincerely the main author of the report, Professor Andrejs Rauhvargers, Secretary General of the Latvian Rectors’ Conference for his commitment, for the enormous amount of time he has invested in researching, describing and analysing the various rankings, ratings and classifications included in the review. It has been a challenging enterprise, not least given the initial decision made to take account only of publically available information on the various rankings included.
The Editorial Board would also like to thank all the EUA staff members who contributed to the preparation, editing and publication of this report.
Last but not least we are honoured that support was also available for this second report from the grant received from the Gulbenkian and the Robert Bosch Foundations.
Maria Helena Nazaré
EUA President and Chair of the Editorial Board Brussels, April 2013

8
G l o b a l U n i v e r s i t y r a n k i n G s a n d t h e i r i m p a c t – r e p o r t i i –
––––––––––––––––––––––––––––––––––––––––––––––––––––––––––––––––––––––––––––––––––––––––––––––––––––––––––––––––––––––––––––––––––––––––––––––––––––––––––––––––––––––––––––––––––––––––––––––––––––––––––––––––––––––––––––––––––––––––––––––––––––––––––––––––––––––––––––––––––1 This means that the Hirsch index of a researcher (or group of researchers, an institution or a journal) is 1 for one publication which is cited once, 2 if he has
two publications cited twice, 3 if three publications cited three times and so on.
SRC ARWU Ranking
The Academic Ranking of World Universities, also known as the Shanghai Ranking, is conducted by researchers at the Centre for World-Class Universities at Shanghai Jiao Tong University and published by ShanghaiRanking Consultancy.
ASJC codes
All Science Journal Classification codes. Journals in Scopus are tagged with an ASJC number, which identifies the principal focal points of the journal in which articles have been published (multidisciplinary journals are excluded).
CPP Number of citations per publication
CWCU Centre for World-Class Universities of Shanghai Jiao Tong University
CWTSCentre for Science and Technology Studies of Leiden University, the provider of the CWTS Leiden Ranking
CEO Chief executive officer
EUMIDAEU-funded project with the aim to test the feasibility of regularly collecting microdata on higher education institutions in all EU-27 member states, Norway and Switzerland
ESI Essential Science Indicators (owned by Thomson Reuters)
FCSm Mean fields citation score, a bibliometric indicator
GPP Thomson Reuters Global Institutional Profiles Project
GRUPGlobal Research University Profiles, a project of the ShanghaiRanking Consultancy
NTU Ranking Taiwan National University Ranking of Scientific Papers for World Universities (up to 2011 the acronym used was HEEACT)
h-index
The Hirsch index, a bibliometric indicator. The h-index value is the highest number of publications (of an individual researcher, group of researchers, university, journal, etc.) matched with the same number of citations.1
Acronyms

9
G l o b a l U n i v e r s i t y r a n k i n G s a n d t h e i r i m p a c t – r e p o r t i i –
IREG International Ranking Expert Group
ISCED
UNESCO/OECD International Standard Classification of Education. The higher education levels in ISCED 1997 classification are: Level 5 – first stage of tertiary education (Bachelor and Master programmes are both in Level 5); Level 6 – tertiary programmes leading to the award of an advanced research qualification, e.g. PhD.
MCS Mean number of citations of the publications of a university
MNCS Mean normalised number of citations of the publications of a university
NUTS
Nomenclature of Territorial Units for StatisticsNUTS 1: major socio-economic regionsNUTS 2: basic regions for the application of regional policiesNUTS 3: small regions for specific diagnoses
QS Quacqarelli-Symonds
R & D Research and development
SCI Science Citation Index
SIR SCImago Institutional Rankings World Report
SRC ShanghaiRanking Consultancy, the publisher of the ARWU ranking
SSCI Social Sciences Citation Index
THE Times Higher Education
TNCS Total normalised number of citations of the publications of a university
U21Universitas 21 is an international network of 23 research-intensive universities in 15 countries established in 1997.
U-Map European Classification of Higher Education Institutions
U-Multirank The Multidimensional Ranking of Higher Education Institutions
URAP University Ranking by Academic Performance ranking
WoS Web of Science (owned by Thomson Reuters)
1 0
G l o b a l U n i v e r s i t y r a n k i n G s a n d t h e i r i m p a c t – r e p o r t i i –
The first EUA report on “Global university rankings and their impact” was published in June 2011. Its purpose was to inform universities about the methodologies and potential impact of the most popular international or global rankings already in existence.
This second report was initially planned as a short update of the first report. However, as work began it became clear that the growing visibility of rankings, their increasing influence on higher education policies and public opinion about them as well as their growing number and diversification since the publication of the first report meant that further investigation and analysis was required.
Hence this second report sets out various new developments since 2011 that we believe will be important for European universities. This includes information on methodological changes in more established rankings, on new rankings that have emerged, and on a range of related services developed as well as an analysis of the impact of rankings on both public policies and universities.
The report is structured in two main parts: Part I provides an overview of the main trends and changes that have emerged over the last two years, including the emergence of new rankings and of additional services offered by the providers of existing rankings, such as tools for profiling, classification or benchmarking, a section on the first IREG audit and insights into how universities perceive rankings and use ranking data.
Part II analyses in greater detail changes in the methodologies of the rankings described in the 2011 Report, as well as providing information on some new rankings and previously existing rankings not addressed in the 2011 Report. Part II also provides information on the additional services that the ranking providers have developed in recent years and that are on offer to universities.
There are also two annexes that refer to EUMIDA variables and IREG audit methodology coverage of the Berlin Principles.
The following principles established for the 2011 Report also underpin this publication:
• It examines the most popular global university rankings, as well as other international attempts to measure performance relevant for European universities.
• It does not seek “to rank the rankings” but to provide universities with an analysis of the methodologies behind the rankings.
• It uses only publicly available and freely accessible information on each ranking, rather than surveys or interviews with the ranking providers, in an attempt to demonstrate how transparent each ranking is from a user’s perspective.
• It seeks to discover what is said to be measured, what is actually measured, how the scores for individual indicators and, where appropriate, the final scores are calculated, and what the results actually mean.
Introduction

1 1
G l o b a l U n i v e r s i t y r a n k i n G s a n d t h e i r i m p a c t – r e p o r t i i –
1. Overview: methodological changes, new rankings and rankings-related services
This first section describes the main changes in rankings and their methodologies as well as other new developments which have occurred since the publication of the 2011 Report.
1.1 Changes in methodology (global rankings covered in the 2011
Report)
While most of the rankings covered in the previous report have altered their methodology in some ways the only major changes worthy of mention concern the CWTS Leiden Ranking and the Webometrics Ranking of World Universities. These two rankings have either amended or entirely replaced all the indicators they used in 2011. Especially interesting is the use by Webometrics since 2012 of a bibliometric indicator, namely the number of papers in the top 10% of cited papers according to the SCImago database, rather than the web analysis by Google Scholar used in previous years.
Other changes include the shift in indicator weights by the Taiwan NTU Ranking (formerly known as Taiwan HEEACT) in 2012 to attribute greater weight to research productivity and impact, and less to research excellence.
The Quacqarelli-Symonds (QS) and Times Higher Education (THE) rankings have also introduced smaller-scale modifications to their methodologies. All these changes are discussed in more detail in Part II of the present report.
1.2 New rankings (since 2011)
Since 2011 a number of entirely new rankings have come into being. Several of them have been developed by providers of existing rankings. For instance, the ShanghaiRanking Consultancy (SRC), which publishes the SRC ARWU Ranking, has now become involved in at least two national rankings. The first was the 2011 Macedonian University Ranking in the Former Yugoslav Republic of Macedonia (FYROM), in which the Centre for World-Class Universities of Shanghai Jiao Tong University (CWCU) was instrumental in the data
PART I: An analysis of new developments and trends in rankings since 2011

1 2
G l o b a l U n i v e r s i t y r a n k i n G s a n d t h e i r i m p a c t – r e p o r t i i –
––––––––––––––––––––––––––––––––––––––––––––––––––––––––––––––––––––––––––––––––––––––––––––––––––––––––––––––––––––––––––––––––––––––––––––––––––––––––––––––––––––––––––––––––––––––––––––––––––––––––––––––––––––––––––––––––––––––––––––––––––––––––––––––––––––––––––––––––––2 In fact, SCImago measures the performance of both universities and research institutions which is another difference from the most popular global rankings.
collection and processing of the indicators determined by FYROM officials; the second has been the 2012 Greater China Ranking (see Part II, section Greater China Ranking).
In 2012 also, the CWTS Leiden Ranking created an additional ranking using indicators similar to its own ranking measuring university collaboration in preparing jointly authored publications.
Almost simultaneously at the end of May 2012, two ranking providers – QS and THE – published new rankings of young universities defined as those founded no more than 50 years earlier, using the data collected for their existing world rankings. THE also published a 2012 Reputation Ranking that is worthy of note as it attributes individual published scores to only the first 50 universities – the score curve fell too steeply for the remaining institutions to be ranked meaningfully (see Part II, section THE Academic Reputation Survey). In the same year QS started a new ranking of Best Student Cities in the World which uses only QS-ranked universities as the input source for indicators and is based on data from universities or students (see Part II, section QS Best Student Cities Ranking).
Another novelty in 2012 was the publication of the Universitas 21 (U21) Ranking, a first experimental comparative ranking of 48 higher education systems which is an interesting new approach. However, from the positions attributed to some countries it could be argued that further refinement of the methodology may be required, for example, the way in which several U21 indicators are linked to the positions of universities in the SRC ARWU Ranking whose indicators are particularly elitist.
1.3 Rankings existing previously but not covered in the 2011 Report
SCImago and the University Ranking by Academic Performance (URAP) are two rankings not covered in the 2011 report which now seem to merit consideration. Although they are markedly different, both of them fill an important gap in the “rankings market” in that their indicators measure the performance of substantially more universities, up to 2 000 in the case of URAP and over 3 000 in SCImago,2 compared to only 400 in THE, 500 in SRC ARWU, NTU Ranking and CWTS Leiden, and around 700 in QS. Like the CWTS Leiden Ranking, both URAP and SCImago only measure research performance. However, unlike URAP, SCImago is not a typical ranking with a published league table, as it does not apply weights to each indicator, which is required for an overall score. Instead, it publishes tables which position institutions with respect to their performance in just a single indicator, giving their scores in relation to other indicators in separate table columns. Further details are provided in Part II.
1.4 New products and services derived from rankings
Since the publication of the 2011 Report most of the leading global ranking providers have extended their range of products enabling the visualisation of ranking results, or launched other new services. Several of them have produced tools for university profiling, classification-type tools or multi-indicator rankings.
ShanghaiRanking Consultancy (SRC)SRC has started a survey known as Global Research University Profiles (GRUP) involving the collection of data from research-oriented universities, which is discussed further in Part II in the section on ARWU

1 3
G l o b a l U n i v e r s i t y r a n k i n G s a n d t h e i r i m p a c t – r e p o r t i i –
Ranking Lab and Global Research University Profiles GRUP. At the end of 2012 the GRUP database contained information from 430 participating universities in addition to the 1 200 universities included in the 2012 SCR ARWU.
GRUP provides:
• a benchmarking tool that allows users to view and compare statistics of 40 indicators, including five SCR ARWU indicators. Comparisons can be made between different groups of universities (but not individual universities); a tool for making estimations. On the basis of a university’s reported (or expected) data, GRUP is able to analyse and forecast the future ranking position of the university in SCR ARWU and help the university to evaluate its current ranking performance and forecast its future global positioning;
• a ranking by single indicator. This tool combines data provided by universities with those from national higher education statistics and international sources to present rankings of universities based on particular indicators. (SRC ARWU, 2012a)
Thomson Reuters Since 2009, Thomson Reuters has been working on the Global Institutional Profiles Project (GPP) with almost 100 indicators, and plans to use the data to develop several other services.
The GPP now includes several applications. For example, it produces individual reports on elite institutions worldwide, combining Thomson Reuter’s reputation survey results with self-submitted data on scholarly outputs, funding, faculty characteristics and other information incorporated in some 100 indicators. Thomson Reuters uses GPP data to prepare profiling reports for individual universities based on 13 groups of six to seven indicators, each of which includes features such as research volume, research capacity and performance. These developments are discussed further in Part II in the section on the Thomson Reuters Global Institutional Profiles Project, and plans are afoot to offer universities more commercial services on the basis of the GPP data which they have largely submitted free of charge (Olds, 2012).
Quacqarelli-Symonds QS has developed the most extensive selection of new products. In addition to ranking of universities less than 50 years old, a simple QS Classification of universities according to the size of the student body, the presence of a specific range of faculties, publications output and age has been drawn up. Other similar initiatives include the QS Stars audit for which universities pay, and may be awarded stars depending on their performance as measured against a broad range of indicators; a benchmarking service for individual universities that enables between six and 30 other selected universities to be compared; and finally its Country Reports, comprising a detailed “overview of the global performance of each unique national higher education system”. The results of both the QS Classification and, where applicable, the QS Stars audit, are posted online next to the score of each university, as additional information in all QS rankings. However, the results of the benchmarking exercise are not publicly available.
CWTS Leiden Ranking The CWTS Leiden Ranking has also developed several additional products. Benchmark analyses are derived from the ranking but provide a much higher level of detail on both the scholarly activities and performance of universities in terms of impact and collaboration at discipline and subject levels. These analyses also enable in-depth comparisons to be made with other universities selected for benchmarking. Trends analysis shows how the academic performance of a university has changed over time, while performance analysis assesses performance with respect to academic disciplines or subjects, institutes, departments or

1 4
G l o b a l U n i v e r s i t y r a n k i n G s a n d t h e i r i m p a c t – r e p o r t i i –
research groups. Finally, science mapping analysis makes use of bibliometric data and techniques to map the scientific activities of an organisation and reveal their strengths and weaknesses (CWTS, 2012).
U21 Ranking of National Higher Education SystemsAn interesting new initiative, also in the light of Ellen Hazelkorn’s observation that “perhaps efforts to achieve a ‘world-class system’ instead of world-class universities might be a preferable strategy” (Hazelkorn, 2012), is the ranking of higher education systems published in May 2012 by Universitas 21 (U21), an international network of 23 research-intensive universities. The indicators used are grouped into four “measures”: resources (with a weight of 25%), environment (25%), connectivity (10%) and output (40%). The secondary use of the SRC ARWU scores in some indicators strengthens the positions of big and rich countries whose universities are strong in medicine and natural sciences.
Observations on new products and the diversification of servicesThese developments demonstrate that the providers are no longer engaged exclusively in rankings alone. Several of them have started data collection exercises, the scope of which goes far beyond the requirements of the original ranking, as is the case of the GRUP survey and the QS Stars audit. Ranking providers now offer different multi-indicator tools, profiling tools, or tailor-made benchmarking exercises, as indicated. However, when ranking providers give feedback and advice to universities, as they often do, essentially on how to improve their ranking positions, it is done on the basis of ranking-related information, such as total scores, scores in individual indicators or combinations of several indicators rather than of the additional products offered.
The current trend is thus for providers to accumulate large amounts of peripheral data on universities. It is ironic that the data submitted by universities free of charge is often sold back to the universities later in a processed form. Commenting on the Thomson Reuters GPP project, Kris Olds (2012) writes:
“Of course there is absolutely nothing wrong with providing services (for a charge) to enhance the management of universities, but would most universities (and their funding agencies) agree, from the start, to the establishment of a relationship where all data is provided for free to a centralized private authority headquartered in the US and UK, and then have this data both managed and monetized by the private authority? I’m not so sure. This is arguably another case of universities thinking for themselves and not looking at the bigger picture. We have a nearly complete absence of collective action on this kind of developmental dynamic; one worthy of greater attention, debate, and oversight if not formal governance.”
1.5 Update on EU-supported projects and the OECD’s AHELO feasibility study
The U-Map project, launched in 2010, and referenced in the 2011 Report has now been concluded. Although universities in several countries, including the Netherlands, Estonia, Belgium (the Flemish Community), Portugal and the Nordic countries (Denmark, Finland, Iceland, Norway and Sweden) submitted data on their higher education institutions, little information on the results is publicly available. Similarly the feasibility phase of the U-Multirank project was also completed in 2011. As a follow-up, on 30 January 2013, the European Commission launched the implementation phase of the project which will run for a two-year period. It is intended as a multidimensional, user-driven approach to global rankings, with first results expected in early 2014. According to the U-Multirank final report 2011 (CHERPA 2011,

1 5
G l o b a l U n i v e r s i t y r a n k i n G s a n d t h e i r i m p a c t – r e p o r t i i –
p. 18) it will incorporate the U-Map classification tool. The renewed U-Multirank webpage, however, makes no reference to U-Map. More information is provided in Part II.
The EUA 2011 Report also described the OECD’s Assessment of Higher Education Learning Outcomes (AHELO) feasibility study. The first volume of initial project findings is now available and the second volume will be finalised in March 2013.3 However, it is worthy of note that the first volume of findings already explains that the methodology used in the feasibility study is not necessarily what will be used in any follow-up study (Trembley et al., 2012).
1.6 Improvements in indicators
There have been several changes in indicators in the last two years, some of which are significant and may possibly be taken over by other rankings.
The CWTS Leiden Ranking has introduced a mean-normalised citation score (MNCS) indicator which is better than the previous field-normalised citation score (CPP/FCSm) indicator (Rauhvargers, 2011, pp. 38-39). However the MNCS indicator has led to problems with a few publications with atypically high citation levels. The CWTS has adopted two remedial solutions: first, it has added the “stability intervals” of indicators as a visualisation option. A wide stability interval is a warning that the results of the indicator are unreliable. This is useful not only in the case of the MNSC indicator but in general. The second solution is to offer a “proportion of top 10% publications indicator” (PPtop 10%), instead of the MNCS indicator, to portray a university’s citation impact, as there is a very high correlation between the results of both indicators, with r = 0.98 (Waltman et al., 2012, p. 10).
While Webometrics has continued to improve indicators which use data obtained over the Internet (Webometrics, 2012), for the first time in 2012 it also included one indicator not derived from the Internet, namely the “excellence” (former “scholar”) indicator based on the number of papers in the top 10% of cited papers.
THE has started using normalised citation and publication indicators, normalising certain indicators that other rankings do not (THE, 2012). As discussed further in Part II, section Times Higher Education World University Ranking, this applies in particular to the “ratio of doctorates to Bachelor degree awards” indicator, and to the research income indicator. Unfortunately, as Part II also points out, not enough helpful information is provided in either case about the methodology of these normalisations, or the data actually used and precisely how it reflects real circumstances in different parts of the world, especially outside the Anglo-Saxon academic environment.
The NTU Ranking and CWTS Leiden Ranking have developed visualisations in which indicators can be displayed either as real (absolute) numbers (derived from publications or citations counts, etc.), or relative values (calculated per academic staff member) that are independent of the size of the institution. In the case of the standard visualisation in NTU Ranking, all eight indicators are displayed as absolute measures, whereas in the “reference ranking” indicators 1 to 4 are presented as relative values. In the case of the CWTS
––––––––––––––––––––––––––––––––––––––––––––––––––––––––––––––––––––––––––––––––––––––––––––––––––––––––––––––––––––––––––––––––––––––––––––––––––––––––––––––––––––––––––––––––––––––––––––––––––––––––––––––––––––––––––––––––––––––––––––––––––––––––––––––––––––––––––––––––3 Further information is not available at the time of writing this report. The outcomes of the feasibility study will be discussed at a conference on 11 and 12 March
2013 and decisions on follow-up will be taken thereafter.

1 6
G l o b a l U n i v e r s i t y r a n k i n G s a n d t h e i r i m p a c t – r e p o r t i i –
Leiden Ranking, all indicators can be displayed in both versions. A set of four new indicators concerning collaborative research and related publications is clarified further in Part II, Table II-7.
Observations on the improvement of indicatorsBibliometric indicators are being improved, with the progression from simple counts of papers and citations, and from field normalisation (CPP/FCSm) to mean normalisation (MNCS). This in turn shows that biases still remain, and that it is therefore safer to measure citation impact by using indicators measuring the proportion of articles in highly cited journals (Waltman et al., 2012). At the same time, field (and mean) normalisation of article and citation counts help more in comparing those fields which are represented in journals, hence present in the Thomson Reuters and Elsevier databases. Thus comparison between medicine, natural sciences and engineering and computer sciences now works better while field normalisation can still be misleading for areas where researchers publish mainly in books.
1.7 IREG ranking audit
The International Ranking Expert Group (IREG) has now started its audit of rankings as mentioned in the editorial of the 2011 EUA Report. IREG was established in 2004 by the UNESCO European Centre for Higher Education (CEPES) and the Institute for Higher Education Policy in Washington. IREG members are ranking experts, ranking providers and higher education institutions.
Rankings in the field of higher education and research that have been published at least twice within the last four years qualify for the audit. They will be reviewed according to the Berlin Principles on Ranking of Higher Education Institutions adopted in 2006. A comparison of the 16 Berlin Principles with the 20 criteria set out in the IREG Ranking Audit Manual (IREG, 2011) reveals that the principles have generally been satisfactorily transposed into the IREG audit criteria (see Annex 2).
Audit teams of three to five members will be appointed by the IREG Executive Committee which also takes the final decision on the audit. Key requirements are that team chairs should in no way be formally associated with an organisation engaged in rankings, while team members should be independent of the ranking(s) under review, and have sufficient knowledge, experience and expertise to conduct the audit.
In audits of national rankings, at least one team member should have a sound knowledge of the national higher education system, and at least one should be an expert from outside the country(ies) covered by the ranking. In audits of global rankings, the team should, as much as possible, represent the diversity of world regions covered. IREG is also aiming to include experts from quality assurance agencies who are experienced in higher education institution evaluation processes in teams.
The procedure is similar to that applied in the external evaluation of higher education institutions, thus starting with a self-evaluation report produced by the ranking organisation.
The assessments will be based on the ranking in its final published form and the report should also include a section on recent and planned changes. It is expected that the procedure will take about 12 months. The ranking organisation will have the right to appeal the audit decision.

1 7
G l o b a l U n i v e r s i t y r a n k i n G s a n d t h e i r i m p a c t – r e p o r t i i –
The success of these audits will greatly depend on the qualifications of audit team members and their willingness to explore ranking methodologies in depth, as well as their ability to access the websites of the ranking organisations and specifically details of the methodology applied. Experience to date, as explained in the first EUA Report, has shown that frequent gaps in the published methodologies exist, and most notably the explanation of how indicator values are calculated from the raw data. As a result, those wishing to repeat the calculation to verify the published result in the ranking table have been unable to do so.
It is to be hoped that the IREG audit will be thorough, taking these concerns into account and lead to substantial improvements in ranking methodologies and the quality of the information provided. More will be known on how this works in practice once the first audit results are available.4
2. Main trends 2.1 A continued focus on elite universities
An analysis of the procedures through which global rankings select universities for inclusion in rankings indicates that the methodologies used by the main global rankings are not geared to covering large numbers of higher education institutions, and thus cannot provide a sound basis for analysing entire higher education systems. This is reflected in the criteria used for establishing how the sample of universities in each case is selected.
SRC ARWU basically selects universities by counting the number of Nobel Prize winners, highly cited researchers, and papers published in Nature or Science. The CWTS Leiden Ranking selects universities with at least 500 publications in the Web of Science (WoS) for five consecutive years, but excludes publications in the arts and humanities. NTU Ranking first selects the 700 institutions with the highest publications and citations counts among institutions listed in Essential Science Indicators (ESI). Then it adds over 100 more after comparing the first 700 with the content of the THE, SRC ARWU and US News and World Report ranking lists (NTU Ranking, 2012). QS also primarily selects its top universities worldwide on the basis of citations per paper before applying other factors such as domestic ranking performance, reputation survey performance, geographical balancing and direct case submission. However, there is no further explanation of how those criteria are applied. The Thomson Reuters GPP uses bibliometric analysis based on publications and citation counts, as well as a reputation survey to identify top institutions. Regarding THE World University Ranking, information on how universities are selected is simply not provided on the THE methodology page.
The way in which academic reputation surveys are organised also leads to the selection of elite universities only. Academics surveyed are asked to nominate a limited number of universities (as a rule no more than 30 but often only 10 to 15) that are the best in their field. The practical implication of this approach is that if none of those surveyed consider a university among the top 30 in their field, the university will not be considered at all.
––––––––––––––––––––––––––––––––––––––––––––––––––––––––––––––––––––––––––––––––––––––––––––––––––––––––––––––––––––––––––––––––––––––––––––––––––––––––––––––––––––––––––––––––––––––––––––––––––––––––––––––––––––––––––––––––––––––––––––––––––––––––––––––––––––––––––––––––––4 The first results of IREG audits are not available at the time of writing this report, but are expected to be released in February 2013.

1 8
G l o b a l U n i v e r s i t y r a n k i n G s a n d t h e i r i m p a c t – r e p o r t i i –
––––––––––––––––––––––––––––––––––––––––––––––––––––––––––––––––––––––––––––––––––––––––––––––––––––––––––––––––––––––––––––––––––––––––––––––––––––––––––––––––––––––––––––––––––––––––––––––––––––––––––––––––––––––––––––––––––––––––––––––––––––––––––––––––––––––––––––––––––5 Defined as the 250 top researchers in each of the 22 ESI fields (Science watch), Retrieved on 14 Mar, 2013 from http://archive.sciencewatch.com/about/met/
fielddef/ 6 Defined as the absolute number of papers from the university concerned, which are included in the 1% of articles by total citations in each annual cohort from each of the 22 ESI fields.
Figure I-1 illustrates the sharp fall in ranking scores within the first 200 to 500 universities which explains why several global rankings stop displaying university scores below a first 200 cut-off point.
Indicators such as the number of Nobel laureates among the staff and alumni of a university (SRC ARWU) are the most telling, as they clearly concern only a very small group of elite universities.
The following are further examples of frequently used indicators which concern only the top group of research universities:
• the number of articles published in Science and Nature, and the number of highly cited researchers based on a pool of 5 500 researchers worldwide;5
• a count of highly cited papers;6
• a count of high-impact papers (Thomson Reuters) defined as the 200 most cited papers from each year in each of the 22 ESI fields (i.e. a total of 4 400 papers);
• the number of publications in high-impact journals.
Finally, it is worth noting that the high ranking positions achieved by a small group of universities are often self-perpetuating The more intensive use of reputation indicators and reputation rankings means that the chances of maintaining a high position in the rankings will only grow for universities already near the top. While this is the case, it has also been pointed out that highly ranked universities also have to fight to keep their places as their rivals are also continuously trying to improve their positions (Salmi, 2010; Rauhvargers, 2011, p. 66).
2.2 Relative neglect of the arts, humanities and the social sciences
The arts, humanities and to a large extent the social sciences remain underrepresented in rankings. This relative neglect stems from persistent biases that remain in bibliometric indicators and field-normalised citation counts, despite substantial methodological improvements (Rauhvargers, 2011, pp. 38-39). This means that citation impact is still determined more reliably through indicators that measure the proportion of articles in intensively cited journals (Waltman et al., 2012), and thus favours those fields in which these articles are concentrated, namely medicine, natural sciences and engineering. These constitute the most prominent fields in the Thomson Reuters and Elsevier databases and therefore determine, to a large degree, performance in the global rankings. In the arts, humanities and the social sciences published research
Figure I-1: The decrease in ranking scores within the first few hundred universities in the SRC ARWU, NTU, THE and QS World Rankings in 2012

1 9
G l o b a l U n i v e r s i t y r a n k i n G s a n d t h e i r i m p a c t – r e p o r t i i –
output is concentrated in books. Until providers tackle the problem of measuring book publication citations impact, this bias in subject focus is unlikely to be overcome.
2.3 Superficial descriptions of methodology and poor indicators
Where bibliometric indicators are normalised, there is often no reference to which normalisation method is being used. While “regional weights”7 are sometimes mentioned, their values remain undisclosed. For example, QS writes in its description of methodology that the world’s top universities are selected primarily on the basis of citations per paper but that several other factors are also considered, such as domestic ranking performance, reputation survey performance, geographical balancing and direct case submission. However, there is no further explanation of how they are applied (QS, 2012b).
Use of poor indicators also persists. In spite of widespread criticism, reliance on reputation indicators is becoming more and more widespread. THE has started a reputation ranking and QS has continued to widen subject rankings in which reputation indicators predominate, and in some subjects they are the only ones used. This has occurred despite the arguably strange results of THE Reputation ranking and the admission by QS that, in reputation surveys, universities can occasionally be nominated as excellent in subjects in which they neither offer programmes nor conduct research. Finally, in spite of the controversy surrounding staff/student ratio indicators, they are still widely used as a means of measuring teaching performance.
2.4 Addressing the near exclusiveness of English-language publications
CWTS research has clearly demonstrated that publications in languages other than English are read by fewer researchers than those in English from the same universities (see van Raan et al., 2010; van Raan et al., 2011). The result is that the non-English-language output of these universities has a lower citation impact and thus a lower position in the rankings. As the only solution under these circumstances – albeit a rather makeshift one – is to exclude non-English-language publications, the CWTS Leiden Ranking default settings deselect them in the calculation of all bibliometric indicators, meaning that their inclusion is solely at the user’s discretion. Another, perhaps more rational, not yet tried-out approach might be to count non-English-language publications in productivity indicators but to exclude them from citation indicators.
In 2012, Brazilian, Portuguese and Arabic versions were added to the seven translated language versions of the questionnaire produced in 2010 as part of the continuing attempts of THE to remedy uneven coverage of different world regions in its Academic Reputation Surveys. This rather limited approach to achieving fairer coverage is discussed further in Part II in the section on the THE Academic Reputation Survey and the World Reputation Ranking.
2.5 A more self-critical attitude to rankings from the providers
Some ranking providers have recently moved from not addressing, or distancing themselves from, the potentially adverse effects of rankings to issuing warnings about how their results may be misused. In a few cases their criticism is even stronger than that of external observers.
––––––––––––––––––––––––––––––––––––––––––––––––––––––––––––––––––––––––––––––––––––––––––––––––––––––––––––––––––––––––––––––––––––––––––––––––––––––––––––––––––––––––––––––––––––––––––––––––––––––––––––––––––––––––––––––––––––––––––––––––––––––––––––––––––––––––––––––––7 No explanation is given by ranking providers but most probably the “regional weights” are factors greater than 1 applied to improve ranking positions of
universities in a particular world region as decided by the ranking provider.

2 0
G l o b a l U n i v e r s i t y r a n k i n G s a n d t h e i r i m p a c t – r e p o r t i i –
A first example is provided by THE through Phil Baty, who has been closely associated with this ranking, and has written:
“Those of us who rank must also be outspoken about the abuses, not just the uses, of our output. There is no doubt that global rankings can be misused […]. “Global university ranking tables are inherently crude, as they reduce universities to a single composite score. […] One of the great strengths of global higher education is its extraordinarily rich diversity, which can never be captured by the THE World University Rankings, which deliberately seek only to compare those research-intensive institutions competing in a global marketplace. [...] No ranking can ever be objective, as they all reflect the subjective decisions of their creators as to which indicators to use, and what weighting to give them. Those of us who rank need to work with governments and policy-makers to make sure that they are as aware of what rankings do not – and can never – capture, as much as what they can, and to encourage them to dig deeper than the composite scores that can mask real excellence in specific fields or areas of performance. […] Rankings can of course have a very useful role in allowing institutions […] to benchmark their performance, to help them plan their strategic direction. But [rankings] should inform decisions – never drive decisions”. (Baty, 2012a)
Such frankness is welcome. However, the introduction of changes that would address these shortcomings would be more helpful. For example, THE ranking results could be displayed by individual indicator, instead of aggregated “ranking criteria” that combine up to five very different indicators such as staff/student ratio, academic reputation and funding per academic staff member.
Thomson Reuters, for its part, has posted the results of an opinion survey showing that the majority of the 350 academics from 30 countries who responded either “strongly” or “somewhat” agreed with the rather critical statements on rankings included in the survey. Among other things the survey found that while analytical comparisons between higher education institutions were considered useful – 85% of respondents said they were“extremely/very useful” or “somewhat useful” (Thomson Reuters, 2010, question 1) – the data indicators and methodology currently used were perceived unfavourably by many respondents (ibid., question 5); 70% of respondents said the use of methodologies and data was not transparent, and 66% claimed that quantitative information could result in misleading institutional comparisons.
As regards the impact of rankings on higher education institutions, the Thomson Reuters survey gave further evidence that rankings encourage institutions to focus on numerical comparisons rather than educating students (71% of respondents), that some institutions manipulate their data to improve their ranking positions (74%), and that institutions that have always been ranked highly tend to retain their positions (66%).
Finally, Thomson Reuters has advised that bibliometric data should be processed and interpreted competently. Misinterpretation of data may have particularly adverse consequences in cases of the uninformed use of citation impact data, for example, in reliance on average citation data that masks huge differences in numbers counted over several years, or on average journal citation counts that result from just one article collecting thousands of citations in a journal, while others have just a single citation or none whatsoever (Miyairi & Chang, 2012).
Among the limitations of rankings identified by Elsevier is the use of one-dimensional forms of measurement for sophisticated institutions, difficulties in allowing for differences in institutional size, and reliance on

2 1
G l o b a l U n i v e r s i t y r a n k i n G s a n d t h e i r i m p a c t – r e p o r t i i –
proxies to measure teaching performance as more relevant criteria are apparently unavailable. Elsevier also warns that excessive reliance on rankings in East Asia, especially in the allocation of research funds, may be detrimental to the development of higher education systems (Taha, 2012).
In conclusion, this growing trend among ranking providers or ranking data providers to discuss openly the possible pitfalls of using their data is very welcome. It is all the more important given the growing perception among policy makers, society at large and, in some world regions even higher education institutions, that rankings are the ultimate measurement of performance and quality in higher education. It is important to make sure that decision-makers are aware of the limitations of the results of rankings, and what they can actually tell us. The growing willingness of providers to speak out is an encouraging first sign that progress may be possible.
2.6 Consolidation of the overall phenomenon of rankings
In spite of the abovementioned trend of the criticism of flawed methodologies and often poor indicators, it is nevertheless clear that the popularity of rankings continues to grow, and given the interest of policy makers in basing decisions on “objective indicators” and their perception that rankings respond to this need, they are being taken into account and used to underpin policy making in higher education as will be described in the following section of this report.
3. The growing impact of rankings 3.1 Uses and abuses of rankings
As stated above, there is no doubt that the impact of global rankings continues to grow. This section seeks to consider why this is the case and to reflect on their broader implications for institutions and higher education systems in the longer term. It is clear that rankings strongly influence the behaviour of universities, as their presence in ranking tables alone heightens their profile and reputation. This in turn obliges institutions to try continuously to improve their position in the rankings. Highly ranked universities have to invest enormous effort just to maintain their positions, and even more in trying to move up further. The considerable attention paid to rankings also places increasing pressure on institutions that do not yet appear in league tables to make efforts to be included.
University rankings are potentially useful in helping students choose an appropriate university, be it in their home country or abroad. However, fully exploiting this would require rankings to provide better explanations of what indicator scores actually mean. The use of a more “democratic indicator” base for selecting universities would also be helpful, as this would mean that rankings would no longer be limited to the world’s top research universities.
Rankings also help by encouraging the collection and publication of reliable national data on higher education (Rauhvargers, 2011), as well as more informed policy making. All higher education institutions are also increasingly called on to use data for decision-making purposes and to document student and institutional success (IHEP, 2009).

2 2
G l o b a l U n i v e r s i t y r a n k i n G s a n d t h e i r i m p a c t – r e p o r t i i –
From an international standpoint, rankings encourage the search for common definitions of those elements on which data is collected. The results of global rankings can stimulate national debate and focused analysis of the key factors determining success in rankings, which in turn may lead to positive policy changes at system level (Rauhvargers, 2011). It has also been argued that rankings may also promote discussion on how to measure institutional success and improve institutional practices (IHEP, 2009); prove to be a useful starting point for the internal analysis of university strengths and weaknesses (van Vught and Westerheijden, 2012); and may also help to convince the general public of the need for university reform (Hazelkorn, 2011).
However, there is also a strong risk that in trying to improve their position in the rankings, universities are tempted to enhance their performance only in those areas that can be measured by ranking indicators (Rauhvargers, 2011). Some indicators reflect the overall output of universities (in terms of their Nobel laureates, articles and citations, etc.), others reflect greater selectivity with a strong emphasis on research and individual reputation rather than on teaching and learning. Most rankings focus disproportionately on research, either directly by measuring research output or indirectly by measuring the characteristics of research-intensive universities (such as low student/staff ratios or peer reputation).
Rankings have a strong impact on the management of higher education institutions. There are various examples of cases in which the salary or positions of top university officials have been linked to their institution’s showing in rankings (Jaschik, 2007), or where improved performance in the rankings is used to justify claims on resources (Espeland & Saunder, 2007; Hazelkorn, 2011).
It is also easier for highly ranked universities to find partners and funders and to attract foreign students. In this way global rankings tend to favour the development or reinforcement of stratified systems revolving around so-called “world-class universities” thus also encouraging a “reputation race” in the higher education sector (van Vught, 2008). There is also evidence that student demand and enrolment increase after positive statements made in national student-oriented rankings, even if these are not used in the same way or to the same extent by all types of students. Ellen Hazelkorn has noted that this trend is more common among cosmopolitan postgraduate students than prospective domestic undergraduates (Hazelkorn, 2011).
As far as the system level is concerned, it has been observed that world-class institutions may be funded at the expense of institutions that further other national goals, with all the challenges that this represents for system-level development. There is a risk that they become more divided, segmented, and hierarchical, with the emergence of a second tier of more teaching-oriented universities. A move in this direction would mean research will come to outweigh teaching activities and there may also be an imbalance between academic fields (Chan, 2012). Among the dangers inherent in such developments, pointed out by various commentators, it is of particular concern that without specific policies and incentives to promote and protect institutional diversity, the premium placed on global research rankings may result in the development of more uniform and mainly vertically differentiated systems (van Vught & Ziegele, 2012, p. 75).
3.2 Policy implications of rankings
The proliferation and growing impact of rankings also appears to be changing behavioural patterns as evidenced, for example, by Bjerke and Guhr’s finding that certain families now insist that their children study at a “ranked” higher education institution, if not the most highly ranked to which they can realistically be admitted (Bjerke & Guhr, 2012).

2 3
G l o b a l U n i v e r s i t y r a n k i n G s a n d t h e i r i m p a c t – r e p o r t i i –
Section 2.6 Consolidation of the overall phenomenon of rankings indicated that rankings are also having an impact on public policy making and decisions. Some of the ways in which this is taking place are described below.
Immigration issuesSince 2008, in the Netherlands, in order to be eligible for the status of “highly-skilled migrant”, applicants must possess one of the two following qualifications, awarded within the previous three years:
• a Master’s degree or doctorate from a recognised Dutch institution […], or
• a Master’s degree or doctorate from a non-Dutch institution of higher education which is ranked in the top 150 establishments (currently changed to top 200) in either the THE, the SRC ARWU or QS rankings (Netherlands Immigration and Naturalisation Office, 2012, p. 1).
In fairness, it should be noted that the ranking-dependent requirement is only part of a broader overall scheme in which applicants go through a “Points Test” which is based on education level, age, knowledge of English and/or the Dutch language, and prior employment and/or studies in the Netherlands.
In Denmark, receiving the green card8 is ranking-dependent. Out of a total of 100 points for the educational level of applicants, up to 15 points may be awarded according to the ranking position of the university from which the applicant graduated (Danish Immigration Service, 2012). The other criteria are the same as those used in the Netherlands.
Eligibility of partner institutions On 1 June 2012, the University Grants Commission in India announced that foreign universities entering into bilateral programme agreements would have to be among the global top 500 in either the THE or SRC ARWU rankings (IBNLive, 2012; Olds & Robertson, 2012). The aim is to ensure that, in the interests of students, only high-quality institutions would be involved in offering these bilateral programmes. This means that there are many good higher education institutions worldwide that will never be eligible for such partnerships because they are more teaching-oriented or concentrate mainly on the arts and humanities.
In 2011 Brazil started a major scholarship programme called “Science Without Borders” in which 100,0009 Brazilian students will be able to go abroad. The intention appears to be to give preference for this ambitious programme to host institutions that are selected on the basis of success in THE and QS rankings (Gardner, 2011).
Recognition of qualificationsOn 25 April 2012, the government of the Russian Federation adopted Decision No. 389 which reads as follows: “to approve the criteria for the inclusion of foreign educational organisations which issue foreign documents regarding the level of education and (or) qualifications that shall be recognised in the Russian Federation, as well as the criteria for inclusion of foreign educational or scientific organisations which issue foreign documents regarding the level of education and (or) qualifications on the territory of the Russian Federation, an organisation has to be (or has been) within the first 300 positions of the SRC’s ARWU, QS and THE rankings.”
––––––––––––––––––––––––––––––––––––––––––––––––––––––––––––––––––––––––––––––––––––––––––––––––––––––––––––––––––––––––––––––––––––––––––––––––––––––––––––––––––––––––––––––––––––––––––––––––––––––––––––––––––––––––––––––––––––––––––––––––––––––––––––––––––––––––––––––––8 The Green Card is a residence permit which also gives the right to carry out paid or unpaid work in Denmark but not to run a business or to be self-
employed. 9 75,000 from government grants and 25,000 extra scholarships requested from the private sector.

2 4
G l o b a l U n i v e r s i t y r a n k i n G s a n d t h e i r i m p a c t – r e p o r t i i –
Universities which have qualified for recognition of their degrees in the Russian Federation are listed in an annex to the decision. The list includes five French universities, three Italian and Danish, two from Spain and one from Finland but none from Eastern Europe. For the rest of the world, the recognition procedure is very cumbersome, unless universities are in countries which have bilateral recognition agreements with the Federation. Automatic recognition of all qualifications from universities in the first 300 is questionable given that ranking scores are based on research rather than on teaching performance and are influenced very little by activities in the arts, humanities or social sciences, meaning that all qualifications will be recognised simply because the university concerned is strong in the natural sciences and medicine.
MergersIn many European countries mergers or other types of groupings and consolidations of institutions are planned or already under way. Even where the purpose of institutional consolidation is not specifically to improve ranking positions, the growing importance of rankings and especially the debate on world-class universities has been an important factor in such national discussions.
The Asian response to rankingsJapan, Taiwan, Singapore and Malaysia, in particular, tend to use university rankings strategically to restructure higher education systems and improve their global competitiveness. It has been noted that the drive to rival leading countries in the West and neighbouring countries in Asia has made the “reputation race” in Asia more competitive and compelling and as a result, rankings have nurtured a “collective anxiety” among Asian countries about not being left behind and that this has led to concern for compliance with international standards or benchmarking and meant that close attention is paid to the results of global rankings (Chan, 2012; Yonezawa, 2012).
This has led all four abovementioned countries to establish excellence schemes to support their top universities. Selected universities in all except Singapore have been given extra funding to improve their research output and level of internationalisation. All four have engaged in a “global talent offensive” designed to attract foreign scholars and students (Chan, 2012).
3.3 How universities respond to rankings
It is becoming increasingly difficult for universities just to ignore the global rankings. For the 1 200 to 1 500 universities included in these rankings, by deciding to submit the data requested by the ranking providers, they are entering into a relationship with them. Highly ranked universities, as already indicated, have to invest in maintaining or improving their position in a highly competitive global environment, and one in which there is also often strong media interest in universities’ performances in the rankings. While national or regional opinion will warmly welcome a high position achieved by “their” university, the media tends to be less understanding if an institution drops down a few places in the rankings. This has led universities to increasingly develop “rankings strategies”. An EUA project “Rankings in Institutional Strategies and Processes” (RISP) will examine this issue in greater depth.
In the meantime, university leaders and administrators are gaining experience by working with rankings, and this has been the subject of debate in many meetings and events held over the last few years. Some of the main points made by institutions engaged in these discussions are as follows:
• Universities gain from establishing an institutional policy on communicating with ranking providers.

2 5
G l o b a l U n i v e r s i t y r a n k i n G s a n d t h e i r i m p a c t – r e p o r t i i –
• Coordination within universities to provide data to the ranking providers is important so that the data is delivered to the providers in a centralised manner, rather than by individual departments or faculties, although they may well be involved in preparing the data.
• Background analysis of ranking results would benefit from being centrally produced and widely distributed; ensuring that there is internal capacity available to follow and explain developments in rankings over a longer period is also helpful.
• In communicating the results of rankings to internal and external university stakeholders, consideration should be given to emphasising average results over a longer period rather than for individual years, as these may fluctuate when providers change their methodologies or for other reasons. Careful thought should be given to issuing information on positive results as experience shows that the situation can easily be reversed, another reason why it is unwise to attach undue significance to the results of rankings.
A growing number of universities have started to use data from rankings for analysis, strategic planning and policy making. The importance for universities in deciding which indicators are of greatest interest in accordance with their strategic priorities, and in focusing on these alone has been underlined (Forslöw, 2012; Yonezawa, 2012). One of the reasons for which universities report using such data is to establish comparisons with rival universities (Proulx, 2012; Hwung & Huey-Jen Su, 2012). It is also a means of maintaining or improving a university’s ranking position at any given time.
According to Proulx, one approach that could prove helpful to universities that have decided that participation in global rankings is strategically important to them is to access the results of rankings via their constituent indicators where available. He suggests that such indicators should be examined at three levels, that of the higher education institution, the broad academic field and the particular specialised subject, and that they should be taken from as many different rankings as possible, such as SRC ARWU, NTU Ranking, CWTS Leiden, QS, SCImago, THE, URAP and Webometrics. In this way various indicators can be brought together – for example, on reputation, research, teaching, resources, the international dimension, etc. – and facilitate benchmarking with similar institutions. Given the existence of well over 20 research indicators, it is possible to subdivide them further (Proulx, 2012). In the context of benchmarking the results can be used, for example, for SWOT analyses (of strengths, weaknesses, opportunities and threats), strategic positioning and for developing key indicators.
Hwung & Huey-Jen Su (2012) have demonstrated how they consider rankings information to underpin the strategic decisions of a university in such a way that strategies tend to be informed by rankings rather than driven by them. However, on the basis of the three following examples it could also be concluded that these show precisely how universities are driven by rankings:
• An analysis of the academic staff/student ratio led to efforts to recruit new scholars and at the same time develop the capabilities of young postdoctoral staff.
• Universities with no prize-winners were prompted to invite many distinguished scholars from abroad as visiting professors.
• The issue of internationalisation has resulted in an increasing number of scholarships and has been an incentive to form multidisciplinary international research teams, but has also boosted the growth of facilities for international students, such as teaching assistant tutoring systems and volunteer reception services.

2 6
G l o b a l U n i v e r s i t y r a n k i n G s a n d t h e i r i m p a c t – r e p o r t i i –
Finally, although the data underlying rankings offers a valuable basis for worldwide comparisons, and thus also for strategic planning, in exploiting the information contained in rankings, it should be borne in mind that the indicators reflect the same biases and flaws as the data used to prepare them.
4. Main conclusions 1. There have been significant new developments since the publication of the first EUA Report in
2011, including the emergence of a new venture, the Universitas 21 Rankings of National Higher Education Systems, methodological changes made in a number of existing rankings and importantly a considerable diversification in the types of products offered by several rankings providers.
2. Global university rankings continue to focus principally on the research function of the university and are still not able to do justice to research carried out in the arts, humanities and the social sciences. Moreover, even bibliometric indicators still have strong biases and flaws. The limitations of rankings remain most apparent in efforts to measure teaching performance.
3. A welcome development is that the providers of the most popular global rankings have themselves started to draw attention to the biases and flaws in the data underpinning rankings and thus to the dangers of misusing rankings.
4. New multi-indicator tools for profiling, classifying or benchmarking higher education institutions offered by the rankings providers are proliferating. These increase the pressure on and the risk of overburdening universities, obliged to collect ever more data in order to maintain as high a profile as possible. The growing volume of information being gathered on universities, and the new “products” on offer also strengthen both the influence of the ranking providers and their potential impact.
5. Rankings are beginning to impact on public policy making as demonstrated by their influence in the development of immigration policies in some countries, in determining the choice of university partner institutions, or in which cases foreign qualifications are recognised. The attention paid to rankings is also reflected in discussions on university mergers in some countries.
6. A growing number of universities have started to use data compiled from rankings for the purpose of benchmarking exercises that in turn feed into institutional strategic planning.
7. Rankings are here to stay. Even if academics are aware that the results of rankings are biased and cannot satisfactorily measure institutional quality, on a more pragmatic level they also recognise that an impressive position in the rankings can be a key factor in securing additional resources, recruiting more students and attracting strong partner institutions. Therefore those universities not represented in global rankings are tempted to calculate their likely scores in order to assess their chances of entering the rankings; everyone should bear in mind that not all publication output consists of articles in journals, and many issues relevant to academic quality cannot be measured quantitatively at all.

2 7
G l o b a l U n i v e r s i t y r a n k i n G s a n d t h e i r i m p a c t – r e p o r t i i –
EUA’s 2011 Report analysed the major global rankings in existence at that time. The report covered the most popular university rankings, in particular: SRC ARWU and THE and QS rankings, rankings focused solely on research such as the Taiwanese HEEACT (since 2012 NTU Ranking) and the CWTS Leiden Ranking. Reference was also made to the outcomes of the EU Working Group on Assessment of University-Based Research (AUBR) which focused on the methodologies of research evaluation rather than on rankings and to the development of multi-indicator resources such as the EU-supported U-Map and U-Multirank, and the OECD AHELO feasibility study on student learning outcomes.
This part of the present report covers both new developments in the global university rankings dealt with in the 2011 Report, and the methodologies of some rankings not covered in 2011 in further detail.
1. The SRC ARWU rankings SRC ARWU World University Ranking (SRC ARWU) is the most consolidated of the popular university-based global rankings. There have been no changes in the core methodology of this ranking since 2010.
ARWU Ranking Lab and Global Research University Profiles (GRUP)
In 2011 the ARWU started ARWU Ranking Lab, a multi-indicator ranking with 21 indicators. However it has since been discontinued with the launch of the ARWU 2012 World University Ranking and GRUP benchmarking (GRUP, 2012a; 2012b).
ARWU Ranking Lab was a partly user-driven resource, in that users could choose whether an indicator was “not relevant”, “fairly relevant”, “relevant”, “very relevant” or “highly relevant”, corresponding to a relative weight of 0, 1, 2, 3 or 4. Its 21 indicators included five indicators from the SRC ARWU, and a further five which expressed their relative values. The latter five indicators were calculated by dividing by the number of academic staff with teaching responsibilities. The remaining 11 indicators were not used in the World University Ranking. All new data in ARWU Ranking Lab was collected via the Global Research University Profiles (GRUP) survey (GRUP, 2012b) which covered 231 universities in 2011.
Of these 21 indicators, eight were absolute and 13 were relative. This means that ARWU Ranking Lab still tended to favour large universities, but substantially less than the World University Ranking itself.10
PART II: Methodological changes and new developments in rankings since 2011
––––––––––––––––––––––––––––––––––––––––––––––––––––––––––––––––––––––––––––––––––––––––––––––––––––––––––––––––––––––––––––––––––––––––––––––––––––––––––––––––––––––––––––––––––––––––––––––––––––––––––––––––––––––––––––––––––––––––––––––––––––––––––––––––––––––––––––––––––10 For an explanation on why indicators using absolute numbers favour large universities see Rauhvargers 2011, section 11 at p. 14.

2 8
G l o b a l U n i v e r s i t y r a n k i n G s a n d t h e i r i m p a c t – r e p o r t i i –
From 231 universities included in the database in 2011, the number grew to 430 in 2012. In addition, the database includes partial data on the 1 200 universities involved in the 2012 World University Ranking.
GRUP serves as a benchmarking tool, an estimations tool and a ranking-by-indicator tool (GRUP, 2012c).
Table II-1: GRUP data collection indicators in 2012
Source: http://www.shanghairanking.com/grup/ranking-by-indicator-2012.jsp
A benchmarking tool allows users to view and compare statistics on all 33 indicators listed in Table II-1 above. Comparisons are made between the following groups of universities: ARWU Universities by Rank Range; ARWU Top 500 Universities by Geographic Location (e.g. USA Top 500, Western Europe Top 500 etc.); ARWU Top 100 Universities by World Region (e.g. ARWU Asia and Oceania Top 100); ARWU Regional Best 20 Universities (e.g. ARWU East Asia Top 20) and National Leading Universities (e.g. Russell Universities in UK; G10 Universities in Canada; best 10 French universities in ARWU).
Student Indicators Resource indicatorsPercentage of graduate students Total amount of institutional income
Percentage of international students Institutional income per student
Percentage of international undergraduate students Institutional income from public sectors
Percentage of international Master’s students Institutional income from student tuition fees
Percentage of international doctoral students Institutional income from tuition fees (per student)
Number of doctorates awarded Institutional income from donations and gifts
Employment rate of Bachelor degree recipients (0-3 months after graduation) Income of institution from its investment
Employment rate of Master’s degree recipients (0-3 months after graduation) Research income: total amount
Employment rate of doctoral degree recipients (0-3 months after graduation) Research income per academic staff member
Research income from public sector
Research income from industry
Academic Staff Indicators ARWU World Ranking Indicators
Total number of academic staff Number of alumni who are Nobel laureates and Fields medallists
Number of academic staff with teaching responsibilities
Number of staff who are Nobel laureates and Fields medallists
Number of academic staff engaged in research only Number of frequently quoted researchers
Percentage of academic staff with doctorates who have teaching responsibilities Number of papers published in Nature and Science
Percentage of academic staff with doctorates who are engaged in research only Number of articles in SCI and SSCI
Percentage of international academic staff engaged in research only
Ratio of academic staff with teaching responsibilities to students
Ratio of all academic staff to students
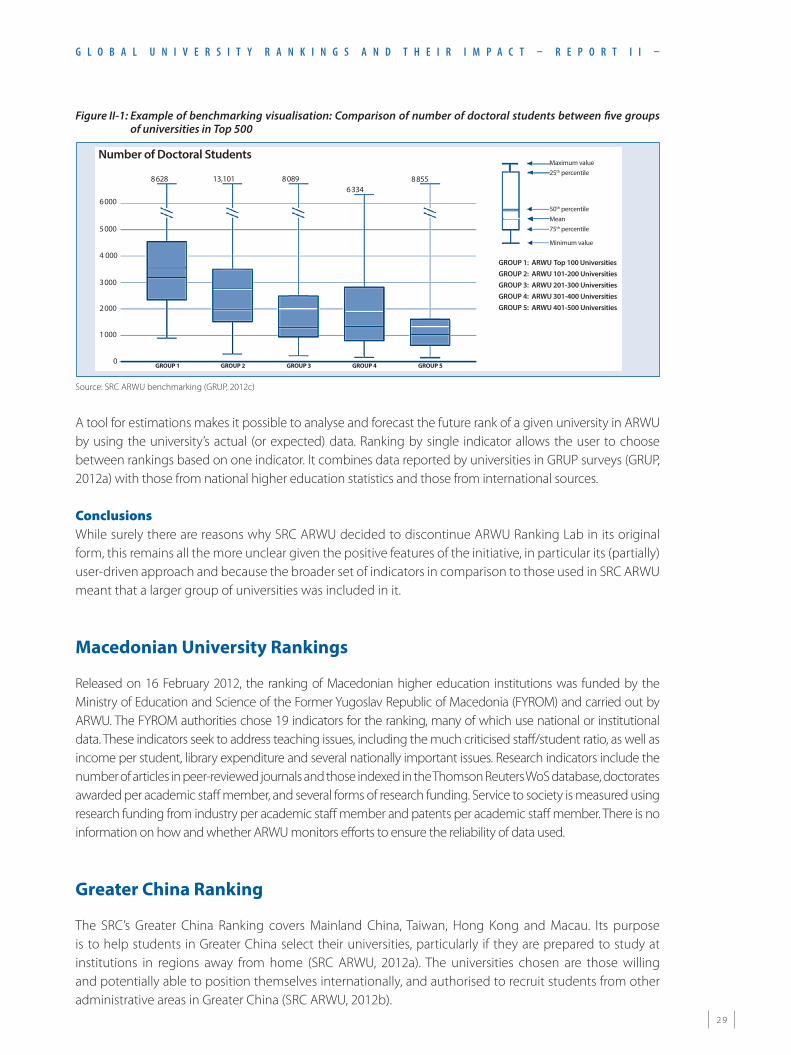
2 9
G l o b a l U n i v e r s i t y r a n k i n G s a n d t h e i r i m p a c t – r e p o r t i i –
Figure II-1: Example of benchmarking visualisation: Comparison of number of doctoral students between five groups of universities in Top 500
Source: SRC ARWU benchmarking (GRUP, 2012c)
A tool for estimations makes it possible to analyse and forecast the future rank of a given university in ARWU by using the university’s actual (or expected) data. Ranking by single indicator allows the user to choose between rankings based on one indicator. It combines data reported by universities in GRUP surveys (GRUP, 2012a) with those from national higher education statistics and those from international sources.
ConclusionsWhile surely there are reasons why SRC ARWU decided to discontinue ARWU Ranking Lab in its original form, this remains all the more unclear given the positive features of the initiative, in particular its (partially) user-driven approach and because the broader set of indicators in comparison to those used in SRC ARWU meant that a larger group of universities was included in it.
Macedonian University Rankings
Released on 16 February 2012, the ranking of Macedonian higher education institutions was funded by the Ministry of Education and Science of the Former Yugoslav Republic of Macedonia (FYROM) and carried out by ARWU. The FYROM authorities chose 19 indicators for the ranking, many of which use national or institutional data. These indicators seek to address teaching issues, including the much criticised staff/student ratio, as well as income per student, library expenditure and several nationally important issues. Research indicators include the number of articles in peer-reviewed journals and those indexed in the Thomson Reuters WoS database, doctorates awarded per academic staff member, and several forms of research funding. Service to society is measured using research funding from industry per academic staff member and patents per academic staff member. There is no information on how and whether ARWU monitors efforts to ensure the reliability of data used.
Greater China Ranking
The SRC’s Greater China Ranking covers Mainland China, Taiwan, Hong Kong and Macau. Its purpose is to help students in Greater China select their universities, particularly if they are prepared to study at institutions in regions away from home (SRC ARWU, 2012a). The universities chosen are those willing and potentially able to position themselves internationally, and authorised to recruit students from other administrative areas in Greater China (SRC ARWU, 2012b).
Number of Doctoral Students
8 628
6 000
5 000
4 000
3 000
2 000
1 000
GROUP 1 GROUP 2 GROUP 3 GROUP 4 GROUP 5
GROUP 1: ARWU Top 100 UniversitiesGROUP 2: ARWU 101-200 UniversitiesGROUP 3: ARWU 201-300 UniversitiesGROUP 4: ARWU 301-400 UniversitiesGROUP 5: ARWU 401-500 Universities
0
13,101 8 0896 334
8 855
Maximum value25th percentile
50th percentileMean75th percentile
Minimum value
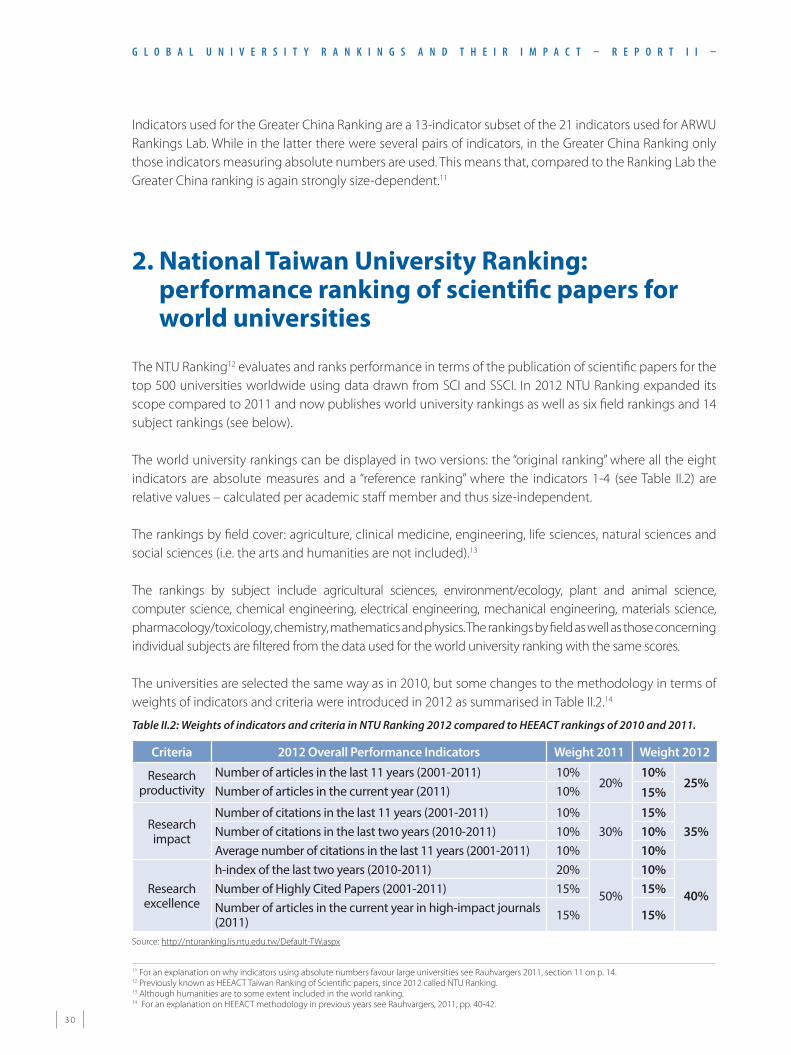
3 0
G l o b a l U n i v e r s i t y r a n k i n G s a n d t h e i r i m p a c t – r e p o r t i i –
––––––––––––––––––––––––––––––––––––––––––––––––––––––––––––––––––––––––––––––––––––––––––––––––––––––––––––––––––––––––––––––––––––––––––––––––––––––––––––––––––––––––––––––––––––––––––––––––––––––––––––––––––––––––––––––––––––––––––––––––––––––––––––––––––––––––––––––––––11 For an explanation on why indicators using absolute numbers favour large universities see Rauhvargers 2011, section 11 on p. 14.12 Previously known as HEEACT Taiwan Ranking of Scientific papers, since 2012 called NTU Ranking.13 Although humanities are to some extent included in the world ranking.14 For an explanation on HEEACT methodology in previous years see Rauhvargers, 2011, pp. 40-42.
Indicators used for the Greater China Ranking are a 13-indicator subset of the 21 indicators used for ARWU Rankings Lab. While in the latter there were several pairs of indicators, in the Greater China Ranking only those indicators measuring absolute numbers are used. This means that, compared to the Ranking Lab the Greater China ranking is again strongly size-dependent.11
2. National Taiwan University Ranking:
performance ranking of scientific papers for world universities
The NTU Ranking12 evaluates and ranks performance in terms of the publication of scientific papers for the top 500 universities worldwide using data drawn from SCI and SSCI. In 2012 NTU Ranking expanded its scope compared to 2011 and now publishes world university rankings as well as six field rankings and 14 subject rankings (see below).
The world university rankings can be displayed in two versions: the “original ranking” where all the eight indicators are absolute measures and a “reference ranking” where the indicators 1-4 (see Table II.2) are relative values – calculated per academic staff member and thus size-independent.
The rankings by field cover: agriculture, clinical medicine, engineering, life sciences, natural sciences and social sciences (i.e. the arts and humanities are not included).13
The rankings by subject include agricultural sciences, environment/ecology, plant and animal science, computer science, chemical engineering, electrical engineering, mechanical engineering, materials science, pharmacology/toxicology, chemistry, mathematics and physics. The rankings by field as well as those concerning individual subjects are filtered from the data used for the world university ranking with the same scores.
The universities are selected the same way as in 2010, but some changes to the methodology in terms of weights of indicators and criteria were introduced in 2012 as summarised in Table II.2.14
Table II.2: Weights of indicators and criteria in NTU Ranking 2012 compared to HEEACT rankings of 2010 and 2011.
Source: http://nturanking.lis.ntu.edu.tw/Default-TW.aspx
Criteria 2012 Overall Performance Indicators Weight 2011 Weight 2012
Research productivity
Number of articles in the last 11 years (2001-2011) 10%20%
10%25%
Number of articles in the current year (2011) 10% 15%
Research impact
Number of citations in the last 11 years (2001-2011) 10%30%
15%35%Number of citations in the last two years (2010-2011) 10% 10%
Average number of citations in the last 11 years (2001-2011) 10% 10%
Research excellence
h-index of the last two years (2010-2011) 20%
50%
10%
40%Number of Highly Cited Papers (2001-2011) 15% 15%Number of articles in the current year in high-impact journals (2011) 15% 15%

3 1
G l o b a l U n i v e r s i t y r a n k i n G s a n d t h e i r i m p a c t – r e p o r t i i –
According to the table above changes made in 2012 decrease the influence of research excellence which was dominant in previous rankings and give greater weight to recent publications and to citation counts. Specifically, the h-index which used to be the indicator with the highest weight in 2010, now only counts for 10% of the total score.
The NTU Ranking providers combine indicators demonstrating long-term performance with indicators showing recent performance. An example of this is that publication and citation count indicators are calculated both for the last 11 years (2001-2011) and for the previous year alone (2011).
“Number of articles in the last 11 years” draws data from ESI, which includes 2001-2011 statistics for articles published in journals indexed by SCI and SSCI. “Number of articles in the current year” relies on the 2011 data obtained from SCI and SSCI. NTU Ranking does not apply field normalisation to indicators based on publication or citation count and as a result the NTU Ranking is heavily skewed towards the life sciences and natural sciences. Regarding the indicators on research excellence, NTU Ranking puts the threshold very high: the Highly Cited Papers indicator only counts papers which are in the top 1% of all papers and as regards publications in the high impact journals, only articles published in the top 5% of journals within a specific subject category will count.
With regard to calculating indicator scores, NTU Ranking has chosen the following method: the result of the university in question is divided by the result of the “best” university in the particular indicator and the quotient is multiplied by 100.
Conclusions The NTU Ranking aims to be a ranking of scientific papers, i.e. it deliberately uses publication and citation indicators only; therefore, data is reliable. However as no field normalisation is used the results are skewed towards the life sciences and the natural sciences. The original ranking strongly favours large universities. The “reference ranking” option changes indicators to relative ones but only shows the overall score, not the scores per academic staff member for individual indicators.
3. Times Higher Education Times Higher Education World University Ranking
The Times Higher Education (THE) ranking excludes universities which
• do not teach undergraduates;
• are highly specialised (teach only a single narrow subject15);
• have published less than 1 000 titles over a five-year period, and not less than 200 in any given year. These are the requirements as of 2011, and they are more stringent than in the past. The term “publications” is assumed to refer to publications indexed in the Thomson Reuters WoS database, and not all publications.
––––––––––––––––––––––––––––––––––––––––––––––––––––––––––––––––––––––––––––––––––––––––––––––––––––––––––––––––––––––––––––––––––––––––––––––––––––––––––––––––––––––––––––––––––––––––––––––––––––––––––––––––––––––––––––––––––––––––––––––––––––––––––––––––––––––––––––––––––15 In the THE lexicon a “subject” is e.g. arts and humanities, natural sciences or social sciences while a “narrow subject” can be history or physics.

3 2
G l o b a l U n i v e r s i t y r a n k i n G s a n d t h e i r i m p a c t – r e p o r t i i –
The THE ranking was first published in 2003 by THE in cooperation with QS. In 2010, THE ended its cooperation with QS and started working with Thomson Reuters.16 THE methodology changed constantly during the 2003-2011 period, though the scale of the changes has varied each year. They were accompanied by prior published announcements and explanatory comments, which was an effective means of focusing attention on the THE website well before publication of the next league table. However, neither the weights nor the definitions of indicators have been changed in 2012; therefore we will focus below on the changes made between 2010 and 2011.
Table II-3: Differences between THE indicators and weights in 2010 and in the 2011 and 2012 rankings
* “Normalisation” may have different meanings in the description of THE methodology; see different variations from: http://www.timeshighereducation.co.uk/world-university-rankings/2012-13/world-ranking/methodology
Cate
gory
wei
ght
2010
Cate
gory
wei
ght
2011
and
201
2
Broad categories/Indicators
Indicators
Indi
cato
rw
eigh
t 20
10
Indi
cato
r wei
ght
2011
and
201
2
2.5% 2.5%Economic activity/Innovation (2010) Industry income: innovation (2011 and 2012)Research income from industry (per academic staff member) 2.5% 2.5%
5% 7.5% International outlookRatio of international to domestic staff Change of weight 3% 2.5%Ratio of international to domestic students Change of weight 2% 2.5%Proportion of published papers with international co-authors, normalised* to account for a university's subject mix
New indicator introduced – 2.5%
30% 30% Teaching: the learning environment
Reputation survey: teaching 15% 15%Ratio of doctorates awarded to number of academic staff, normalised* since 2011
Changes in calculation method due to normalisation 6% 6%
2010: ratio of new (first-year) undergraduates to academic staff members 2011 and 2012: overall student/academic staff ratio17
Change of indicator definition involving different calculation method
4.5% 4.5%
Ratio of doctorates to Bachelor degree awards 2.25% 2.25%
Income per academic staff member 2.25% 2.25%30% 30% Research: volume, income and reputation
Reputation survey: research Change of weight 19.5% 18%Research income (scaled)/ normalised* since 2011
Change of calculation method, Change of weight 5.25% 6%
Published papers per academic staff member/ normalised* by subject since 2011
Change of calculation method, Change of weight 4.5% 6%
Ratio of public research income to total research income No indicator 0.75% –
32.5% 30% Citations: research influenceImpact – average citations per published paper, normalised* since 2010 Change of weight 32.5% 30%
––––––––––––––––––––––––––––––––––––––––––––––––––––––––––––––––––––––––––––––––––––––––––––––––––––––––––––––––––––––––––––––––––––––––––––––––––––––––––––––––––––––––––––––––––––––––––––––––––––––––––––––––––––––––––––––––––––––––––––––––––––––––––––––––––––––––––––––––––16 For details please refer to Rauhvargers, 2011, pp. 27-34. 17 In this table THE terminology is used. However it should be kept in mind that in reality staff/student and not student/staff ratio is used for ranking.

3 3
G l o b a l U n i v e r s i t y r a n k i n G s a n d t h e i r i m p a c t – r e p o r t i i –
Some of the changes in 2011 went further than just shifting weights. In several cases, either the definition of the indicator or the method of calculating the scores changed. The students/staff ratio indicator was calculated in 2010 as the number of first-year undergraduates per academic staff member. In 2011, this was changed to the total number of students enrolled for every academic staff member.
According to the 2012 description of THE methodology, the number of published papers per academic staff member indicator is obtained by counting “the number of papers published in the academic journals indexed by Thomson Reuters per academic, scaled for a university’s total size and also normalised for subject” (THE, 2012a). However, it is not specified whether “a university’s total size” is referring to total student enrolment, academic staff number, or some other criterion. It is also not clear what method is used for “subject normalisation”, or exactly how the indicator score is calculated.
The number of doctorates awarded indicator has been “normalised to take account of a university’s unique subject mix, reflecting the different volume of doctoral awards in different disciplines” (ibid.). This implies that some data on the award of doctoral degrees by subject is used. However, the frequency distribution of doctoral awards by academic subject (field) may be influenced also by other factors; for instance, it may vary in different geographical locations (countries, groups of countries or world regions). THE methodology description (ibid.) does not say anything about this issue.
The research income indicator has been “normalised for purchasing-power parity” and “this indicator is fully normalised to take account of each university’s distinct subject profile, reflecting the fact that research grants in science subjects are often bigger than those awarded for the highest-quality social science, arts and humanities research” (THE, 2012a). Here it seems important to know what data is used to define “standard” grants awarded for research in different subjects, and (again) if potential regional differences are considered.
For the citations per paper indicator “the data are fully normalised to reflect variations in citation volume between different subject areas” (THE, 2012). There are several methods of normalisation for citation indicators, which have been described in the previous EUA Report (Rauhvargers, 2011, pp. 38-39). Readers would understand the methodology better, if they knew which of the methods was being used. At present they have no choice but to accept that the indicator is “fully” normalised.
It is important to note that THE does not publish the scores of individual indicators. Only scores in the five following areas can be viewed:
1. teaching – the learning environment: five different indicators, corresponding to 30% of the overall ranking score;
2. research – volume, income and reputation: three indicators, also with a weight of 30%;
3. citations – research influence: one indicator, with yet a further weight of 30%;
4. industry income – innovation: a weight of 2.5%;
5. international outlook – staff, students and research: this corresponds to three indicators worth 7.5% in total.
The constituent indicators in the “teaching”, “research” and “international outlook” categories are so different in nature (see, for example, “reputation”, “income” and “published papers” in Table II-3) that it would be more

3 4
G l o b a l U n i v e r s i t y r a n k i n G s a n d t h e i r i m p a c t – r e p o r t i i –
helpful to have separate scores for each of them. However since 2010 when THE ended its collaboration with QS, only the overall scores of areas can be viewed.18
Since 2011 the scores of all indicators, except those for the Academic Reputation Survey (Baty, 2011), have been calculated differently (compared to 2010). In fact, this change is a reversion by THE to the use of Z-scores, rather than simply calculating a score for universities as a percentage of the “best” university score. THE first used Z-scores from 2007 to 2009 (with the calculations done by QS), dropped them in 2010 following the switch to Thomson Reuters, and has now readopted them. Z-scores are explained in the previous EUA Report (Rauhvargers, 2011, pp. 30-31).
ConclusionsTHE descriptions of methodology customarily refer solely to the methodological tools used, without always providing enough information about how the scores are actually calculated from raw data (Berlin Principle 6).
Overall there were several – albeit discreet – changes in methodology in the THE World University Ranking in 2010 and 2011, but with nothing further since then. Most of them represent improvements, such as the slight decrease (from 34.5% to 33%) in the total weight of reputation indicators which thus account for one third of the overall score. The reputation indicators in THE World University Ranking and the 2012 THE Reputation Survey are discussed in more detail in the next section.
It is encouraging that THE draws attention to several negative impacts of rankings (Baty, 2012a; 2012b). Warnings about biases or flaws caused by some indicators are included in the 2012 description of methodology (Baty, 2012c).
THE academic reputation surveys and THE World Reputation Ranking
In the surveys for the 2011 THE World University Ranking and 2012 THE World Reputation Ranking, academic staff were invited to nominate up to 15 higher education institutions that, in their view, produce the best research in their region and their own specialised narrow subject field, and then a further 15 institutions with (again in their opinion) the best research output in the same narrow subject field worldwide. This exercise was then repeated with a focus on the best teaching.
Starting from the assumption that academics are more knowledgeable about research in their own specialist subject fields than about teaching quality (THE, 2012), the indicators of “research reputation” and of “teaching reputation” in THE World Reputation Ranking have thus been combined into an overall score. This was done by using weights distributed in favour of research reputation by a ratio of 2 to 1, in accordance with the assumption that there is “greater confidence in respondents’ ability to make accurate judgements regarding research quality” (THE, 2012).
Respondents choose their universities from a preselected list of some 6 000 institutions, to which they are free to add, if they so wish. While in theory this approach makes it possible to include more universities, those present on the original list are certainly favoured and more likely to be nominated. The compilation of preselected lists and the lack of transparency in terms of the criteria used, for example, for leaving out
––––––––––––––––––––––––––––––––––––––––––––––––––––––––––––––––––––––––––––––––––––––––––––––––––––––––––––––––––––––––––––––––––––––––––––––––––––––––––––––––––––––––––––––––––––––––––––––––––––––––––––––––––––––––––––––––––––––––––––––––––––––––––––––––––––––––––––––––––18 As each of the two remaining areas (“citations” and “industry income”) consists of just one indicator the scores are visible.

3 5
G l o b a l U n i v e r s i t y r a n k i n G s a n d t h e i r i m p a c t – r e p o r t i i –
entire education systems, have already been addressed in the 2011 EUA Report. However, there is still no further information available on this topic.
The THE descriptions of the methodology used for the World University Rankings of 2011 and 2012 (Baty, 2011; and Baty, 2012c) report that since 2012 “for the results of the reputation survey, the data are highly skewed in favour of a small number of institutions at the top of the rankings, so last year we added an exponential component to increase differentiation between institutions lower down the scale”. It would be important to have more information on exactly how this has been done.
Assuming from this that information about the “exponential component” is present in the methodology descriptions of the World University Ranking (Baty, 2011; and Baty, 2012c), but not in the methodology descriptions of the reputation surveys (THE 2011; and THE 2012), it is reasonable to conclude that the “exponential component” is applied in the reputation indicators of the World University Ranking but not in the World Reputation Ranking.
In response to criticism from academics about the uneven coverage of different world regions, respondents received the survey questionnaire in 2010 in seven languages, namely English, French, German, Japanese, Portuguese, Spanish and Chinese. Brazilian Portuguese and Arabic were added in 2012, bringing the total to nine language versions. While this is a welcome development it does not alter the fact that the identity of many universities in regions outside North America and Western Europe, and particularly in small countries, remains unknown to most respondents. This difficulty cannot be overcome simply by producing the survey questionnaire in more languages.
The 2011 THE World Reputation Ranking was based on the combined results of the 2011 reputation survey, involving 17,000 academics, and the 2010-2011 survey, so that the total number of respondents amounted to over 30,000. It should be noted that there are methodological differences between the 2010-2011 and 2011-2012 surveys. First, for the surveys in 2010-2011, respondents were asked to choose up to 10 “best” universities in the areas of both research and teaching, whereas in 2011-2012 this number was increased to 15 (THE, 2012). The next THE Reputation Ranking will be released on 4 March 2013.
Since 2010 THE reputation ranking Z-scores haven’t been applied. Instead, each university’s score was simply calculated as a percentage of the indicator value for the “best” university. Reviewers who indicated that teaching accounts for the “highest percentage of time spent” were also asked to identify a single institution in their own specialised field which they would recommend students to attend in order “to experience the best undergraduate and/or graduate teaching environment”.
The result of the 2012 THE World Reputation Ranking is surprising. The scores of reputation-based indicators fall so sharply that the score of the university in 50th position is just 6.9% of the maximal score (see Figure II-2). THE then identifies a further 50 universities without displaying their scores, placing them instead in groups of ten 51-60, 61-70, etc.). The curve of the 2012 THE World Reputation Ranking is much steeper than that of the 2011-2012 THE World University Ranking which uses the same set of reputation survey data.
In addition, the vast majority of universities listed in the top 50 of the THE World Reputation Ranking are generally the same as those in the top 50 of the 2011 THE World University Ranking. More precisely, out of universities in the top 50 of the 2011-2012 THE World University Ranking, only seven are not in the top 50 of the 2012 THE World Reputation Ranking, and even these seven come very close to that first group. Four of them are within the top 51-60 group (Pennsylvania State University, Karolinska Institutet, the

3 6
G l o b a l U n i v e r s i t y r a n k i n G s a n d t h e i r i m p a c t – r e p o r t i i –
––––––––––––––––––––––––––––––––––––––––––––––––––––––––––––––––––––––––––––––––––––––––––––––––––––––––––––––––––––––––––––––––––––––––––––––––––––––––––––––––––––––––––––––––––––––––––––––––––––––––––––––––––––––––––––––––––––––––––––––––––––––––––––––––––––––––––––––––––19 http://www.timeshighereducation.co.uk/world-university-rankings/2012/one-hundred-under-fifty20 http://www.topuniversities.com/university-rankings/top-50-under-50
University of Manchester and the University of California, Santa Barbara), one is in the top 61-70 (the École polytechnique fédérale de Lausanne), one in the top 71-80 (Washington University in St Louis), and one is in the top 81-90 (Brown University).
On the whole, the findings seem to be conditioned by the relatively few universities that respondents could choose, namely 10 in 2010 (Thomson Reuters, 2010) and 15 in 2011. Faced with this limit respondents apparently tended to select those universities most widely regarded as the world’s best, with the easiest way of finding them perhaps being to check in the previous rankings list. If this assumption is valid, the results of reputation surveys should be treated with the greatest caution. As already pointed out, Figure II-2 illustrates how the reputation-based score of universities becomes virtually negligible for those ranked lower than the top 50. This in turn means that for those universities the reputation indicators, despite their high weights in the THE World University Ranking (33%), have virtually no impact on their positions in THE World University Ranking. At the very top of the ranking, the effect is the opposite. As the scores of reputation indicators decrease faster than those of others, the position of the top universities is highly dependent on their reputation.
ConclusionsThe introduction of the reputation survey questionnaire in nine languages is a positive development although solving the basic problems identified above still remains a challenge. Regarding the impact of reputation-based rankings, as the reputation-based score dwindles rapidly from the first top-ranked university down to the 50th, the reputation indicators have a very limited impact on the THE World University Ranking. This implies that rankings based entirely on reputation are of little value. The very steep reputation-based curve means that the influence of reputation is substantial for the first few most highly ranked institutions but quickly decreases in significance thereafter.
THE 100 under 50 ranking
On 31 May 2012 the THE published a ranking of universities established less than 50 years ago, the THE 100 under 50 ranking19 just two days after QS had published the QS top-50-under-50 ranking.20 The main argument given for ranking relatively new universities separately was to draw attention to the fact that it is possible for universities to be able to demonstrate excellence in a relatively short period of time.
The THE 100 under 50 ranking, on the other hand, aims to show which countries are challenging the US and the UK as higher education powerhouses (Morgan, 2012). The data used is the same as for the
Figure II-2: The fall in reputation-based scores with increasing numbers of universities positioned in the 2012 THE World Reputation Ranking, compared to the THE World University Ranking and the SRC’s ARWU
3 7
G l o b a l U n i v e r s i t y r a n k i n G s a n d t h e i r i m p a c t – r e p o r t i i –
––––––––––––––––––––––––––––––––––––––––––––––––––––––––––––––––––––––––––––––––––––––––––––––––––––––––––––––––––––––––––––––––––––––––––––––––––––––––––––––––––––––––––––––––––––––––––––––––––––––––––––––––––––––––––––––––––––––––––––––––––––––––––––––––––––––––––––––––––21 See Institutional profiles: indicator group descriptions, retrieved on 24 July 2012 from:
http://researchanalytics.thomsonreuters.com/researchanalytics/m/pdfs/ip_indicator_groups.pdf
THE World University Ranking, and uses the same set of 13 indicators. However, the weights have been altered in comparison to those applied for the THE World University Ranking although the changes made are not identified. The weights of the research reputation indicator and academic reputation survey have been reduced on the grounds that relatively new universities may not yet have an established reputation. Conversely, the weights of other indicators have been correspondingly increased. They include published papers per academic staff member in the academic journals indexed by Thomson Reuters, university research income per academic staff member, the student to staff ratio, the ratio of doctoral students to undergraduate students, and the number of doctorates awarded.
As might be expected, changes in indicator weights have caused shifts in the relative positions of universities in the THE 100 under 50 table compared to the THE World University Ranking. This has given rise to further discussions, while also concealing that the data used is in fact the same.
4. Thomson Reuters’ Global Institutional Profiles Project
The Thomson Reuters Global Institutional Profiles Project (GPP) is a Thomson Reuters’ copyright. The aim of Thomson Reuters is to create portraits of globally significant institutions in terms of their reputation, scholarly outputs, funding levels, academic staff characteristics and other information, in one comprehensive database (Thomson Reuters, 2012a). GPP is not a ranking as such; however one of the parameters used is the ranking position of institutions. These ranking positions are taken from THE rankings.
The Thomson Reuters’ Global Institutional Profiles Project (GPP) is aimed at providing data for THE rankings but Thomson Reuters itself uses it to create portraits of “globally significant” institutions, combining reputational assessment, scholarly outputs, funding levels.
Institutions are selected according to the following procedure outlined by Thomson Reuters (2012d). First, bibliometric analysis is used with reference to the number of publications and citations in the preceding 10 years, in each of the following six branches: arts and humanities; pre-clinical and health; engineering and technology; life sciences; physical sciences and social sciences. Secondly, the results of the Academic Reputation Survey are used to identify those institutions that perform well. As both bibliometric indicators and reputation surveys are strongly influenced by the results of previous rankings, this gives the advantage once more to institutions which are strong in medicine and natural sciences.
Besides its input into the THE World University Ranking, Thomson Reuters now plans to use the GPP data for other services, such as for preparing customised data sets for individual customer needs (Thomson Reuters, 2012b). It is developing a platform that will combine different sets of key indicators, with the results of reputation surveys and visualisation tools for identifying the key strengths of institutions according to a wide variety of aspects and subjects. In 2010, 42 indicators were used for around 1 500 universities. According to Thomson Reuters in its update (2012b), 564 more universities have joined the GPP which now reportedly uses 100 indicators21 (Thomson Reuters, 2012e).
3 8
G l o b a l U n i v e r s i t y r a n k i n G s a n d t h e i r i m p a c t – r e p o r t i i –
The GPP uses the groups of indicators listed below, with most of the indicators included in more than one group. This is because the aim is not to rank universities but to portray various aspects of them, so the same indicator may relate to several aspects simultaneously. For example, the number of doctorates awarded may indicate something about the research, teaching and size of an institution.
Groups of indicators are as follows:
• research reputation (a single indicator);
• teaching reputation (a single indicator);
• research size: number of research staff; number of doctorates awarded; research income; total number of papers published; total citations count; research strength “per million of research income” (Thomson Reuters 2012e). The currency referred to is curiously enough not specified;
• research capacity and performance: number of academic staff (including research staff ); research income; research; income per academic staff member; number of papers published “per million of research income” (ibid.); number of papers published per (academic and research) staff member; global research reputation;
• research output: research income; total number of papers published; total citations count; doctorates awarded per academic staff member; number of papers published “per million of research income”; academic staff member; global research reputation;
• research performance: normalised citation impact; doctorates awarded per academic staff member; research income as a proportion of institutional income; research income per academic staff member; number of papers published per academic staff member; global research reputation;
• size: numbers of academic staff (including research staff ); undergraduate degrees awarded; doctorates awarded; total number of papers published; total student enrolment; institutional income; research strength;
• scaled characteristics: normalised citation impact; number of undergraduate degrees awarded per academic staff member; overall student/academic staff ratio; number of papers published per million currency units of research income; global teaching reputation; global research reputation;
• institutional performance: number of undergraduate degrees awarded; number of doctorates awarded; overall student/academic staff ratio; institutional ratio income per academic staff member; institutional income per student (in total enrolment); number of doctorates awarded per academic staff member; number of staff engaged exclusively in research as a proportion of all academic staff; global teaching reputation;
• finances: institutional income; research income; institutional income per academic staff member; institutional income per student (in total enrolment); number of papers published per million currency units of research income; income per academic staff member; research income per paper published;
• reputation: normalise citation impact; researcher income per academic staff member; research strength per million currency units of research income; number of citations per academic staff member; global teaching reputation; global research reputation;
• international diversity: international academic staff as a proportion of all academic staff; published papers authored jointly by at least one international academic staff member as a proportion of all papers published; international student enrolment as a proportion of total student enrolment; new international undergraduate intake as a proportion of total new undergraduate intake; international research reputation; international teaching reputation;

3 9
G l o b a l U n i v e r s i t y r a n k i n G s a n d t h e i r i m p a c t – r e p o r t i i –
• teaching performance: overall student/academic staff ratio; proportion of new undergraduate students who obtain undergraduate degrees; number of doctorates; number of academic staff members; ratio of undergraduate degrees awarded to doctorates awarded; proportion of new doctoral students who obtain doctorates; international student enrolment as a proportion of total student enrolment; global teaching reputation (Thomson Reuters, 2012e).
Universities participating in GPP can order a profiling report, to view examples of profiling reports follow the links in footnote.22
Conclusions Analysis of university performance and the development of university profiles are welcome developments in enabling universities to understand their strong and weak points for their own benchmarking purposes. However, even used for these purposes, bibliometric indicators have their own inherent biases and flaws. As far as indicators related to the teaching process are concerned, although there are several, they rely on the same limited basic data, namely the number of academic staff, total student enrolment, the number of international academic staff, international student enrolment, numbers of undergraduate degrees and doctorates awarded, teaching reputation, institutional income and research income. The extent to which such quantitative data can demonstrate or enhance understanding of the quality or conduct of teaching remains uncertain.
A further issue regarding the university profiling reports is that, except in the case of real (absolute) values, such as student enrolments, numbers of academic staff or financial resources, the indicators used are in fact not indicator values but scores; as in the rankings, the result for a particular case is divided by the “best” result and then multiplied by 100.
Finally, 10 out of the 13 groups of indicators include one or two indicators on reputation – despite the results of reputation surveys (Thomson Reuters, 2012e) which show the limitations and flaws of the reputation surveys as documented in the first EUA Report (Rauhvargers, 2011) that reputation surveys at most demonstrate international brand.
5. Quacqarelli-Symonds rankings QS has developed a broad range of ranking products over the last couple of years. Those discussed in this section are:
• QS World University Ranking,
• QS World University Ranking by Subject,
• QS Best Student Cities Ranking,
• QS top-50-under-50 Ranking, and
• Two additional products to supplement QS rankings:
❍ QS classification and
❍ QS stars.––––––––––––––––––––––––––––––––––––––––––––––––––––––––––––––––––––––––––––––––––––––––––––––––––––––––––––––––––––––––––––––––––––––––––––––––––––––––––––––––––––––––––––––––––––––––––––––––––––––––––––––––––––––––––––––––––––––––––––––––––––––––––––––––––––––––––––––––––22 Examples of Thomson Reuters profile reports can be found e.g. for University of Bucharest, Romania, at:
http://www.unibuc.ro/n/despre/docs/2012/mar/19_12_13_57Times_Higher_Education.pdf; University of Arizona, USA: http://grad.arizona.edu/gccouncil/system/files/0190%20University%20of%20Arizona.pdf.
4 0
G l o b a l U n i v e r s i t y r a n k i n G s a n d t h e i r i m p a c t – r e p o r t i i –
QS World University Ranking In 2012 QS published a document listing the various methodological changes made up to this time (QS, 2012a). While some of them are self-explanatory, others are not, and would require further explanation. No further information is available. There have been three main changes. First, self-citations were excluded in 2011 when calculating the scores of the citations indicator (in other systems such as the CWTS Leiden Ranking, self-citations have never been used). Secondly, “academic respondents (who cannot respond for their home institution) are also excluded from the calculation of domestic reputation” (ibid.). Without any further explanation it is still not clear what the “domestic reputation” means. Finally, survey weightings have been amended to compensate for extreme response levels in some countries, although like in the case of other rankings there are no indications given as to how the calculations have changed.
QS selects the world’s top universities primarily on the basis of citations per published paper, while also considering several other factors, such as position of university in domestic ranking, reputation survey performance, geographical balancing and direct case submission (QS, 2012b). However, there is no further explanation about how such criteria are applied.
QS does not include research institutes that do not have students. Institutions which are active in a single “QS faculty area”, e.g. medicine, may be excluded from the overall table (but are shown in faculty area tables). Also, institutions catering for either graduate or undergraduate students only can be excluded from the overall table but left in the faculty area tables (ibid.).
Additional league table information Since 2011, QS has published additional information on its university league tables. Besides viewing the overall score of institutions and individual indicator scores, users may also:
• see how QS has labelled each institution in terms of its size, subject range, research intensity and age (QS classification);
• learn and compare the ranges of estimated tuition fees at different institutions;
• view up to five “QS stars” on condition that an institution has paid for and undergone the QS audit process and that stars were awarded.
The QS classification In 2009, QS started a simple university classification for the first time using alphanumeric notation with a view to grouping institutions by four criteria: size (student population); subject range (number of broad faculty areas in which programmes are provided); number of publications in Scopus within five-year period; and the age of the university concerned (QS, 2011a). Since 2011, this classification data has been shown in the league table for each university, along with its score.
In terms of size the classification distinguishes between universities with extra-large (XL) enrolments (over 30,000 students), large (over 12,000), medium (over 5 000) and small (fewer than 5 000 students).
Subject range comprises four categories: fully comprehensive (FC) for universities with six faculties (arts and humanities, engineering and technology, life sciences, natural sciences, social sciences, medicine);

4 1
G l o b a l U n i v e r s i t y r a n k i n G s a n d t h e i r i m p a c t – r e p o r t i i –
comprehensive (CO) for institutions with all these faculties except medicine; focused (FO) where three or four of these faculties are present; and finally specialised (SP) for universities with only one or two of them.
Research intensity is measured in accordance with the number of published papers indexed by Scopus over a five-year period. It is categorised as very high (VH), high (HI), medium (MD) or low (LO). Category thresholds depend on the size and subject range of the university concerned (see Table II-4).
Table II-4: Number of Scopus-indexed papers required for each category of research intensity, in accordance with the size and subject range of universities
Source: http://www.iu.qs.com/university-rankings/qs-classifications/
Universities are divided into five “age groups”: new for those established less than 10 years ago; young in the case of those founded 10 to 25 years ago; established for universities that have been in existence for 25 to 50 years; mature universities that are 50 to 100 years old; and historic institutions dating back over 100 years.
A new criterion added in 2012 classifies universities according to their status. A threefold distinction is made between public, private-not-for-profit and private-for-profit universities.
Although modest, the QS classification tool may be useful for prospective students who can view some general features of the universities whose data is included.
Research intensity
Subject range
Size
XL L M S
VH FC 13,000 10,000 5 000 2 500
HI FC 4 000 3 000 1 500 750
MD FC 750 500 250 100
LO FC 0 0 0 0
VH CO 7 000 5 000 2 500 1 250
HI CO 2 000 1 500 750 400
MD CO 400 250 100 50
LO CO 0 0 0 0
VH FO 3 500 2 500 1 250 650
HI FO 1 000 750 400 200
MD FO 150 100 50 50
LO FO 0 0 0 0
VH SP 2 x mean for specialist areas
2 x mean for specialist areas
2 x mean for specialist areas
2 x mean for specialist areas
HI SP 1 x mean for specialist areas
1 x mean for specialist areas
1 x mean for specialist areas
1 x mean for specialist areas
MD SP 0.5 x mean for specialist areas
0.5 x mean for specialist areas
0.5 x mean for specialist areas
0.5 x mean for specialist areas
LO SP 0 0 0 0

4 2
G l o b a l U n i v e r s i t y r a n k i n G s a n d t h e i r i m p a c t – r e p o r t i i –
QS Stars QS Stars is a ratings system for higher education institutions based on eight groups of indicators (QS, 2011c). The outcome is that a university can be awarded from none to five stars and even five stars plus, QS Stars rating results are also displayed separately from QS rankings (QS, 2012c). The stars are posted alongside its score in the ranking table and appear in the QS world university rankings by subject, the Latin American and the Asian university rankings. QS Stars is offered as a paying service to universities and stars are awarded for a period of three years. A QS Stars audit costs US$30,400 (QS, 2011b; QS, 2012d). Universities that do not choose to buy into this service, which also includes an audit, will have empty space next to their score in the ranking table, which puts pressure on them to pay for the service.
The references here refer to the description of QS Stars methodology published in early 2012 (QS, 2012d). It is substantially different from previous versions and, in comparison, much simplified. For example, it describes neither how the indicator values are calculated, nor the threshold value at which the maximum points in each indicator are allocated.
The QS Stars rating includes a broader range of criteria than QS rankings. The audit that is included measures institutional performance against each of the 52 indicators which are subdivided into criteria, themselves arranged in the following three groups:
• core: teaching, employability, research and infrastructure;
• advanced criteria: internationalisation, innovation and engagement;
• specialist criteria: rank in specialist subjects.
As indicated, an institution can have up to five stars overall, and at the same time also gain up to five stars in each of the four areas of: research, specialisation, innovation and facilities. The possibility of receiving two kinds of stars is a little confusing. As regards the total number of stars gained by an institution, there is a description of how many points have to be collected and the additional requirements that may need to be satisfied. However, the “full methodology” brochure (QS, 2012d) does not specify how the number of stars is assigned in each of the abovementioned work areas.
The weights of each indicator – and consequently of the corresponding criterion – are expressed in maximum points. Altogether, a university can gain up to 1 000 points. The translation of these points into stars is described below (QS, 2012d):
• one star: an institution has collected 100 points and must be authorised to run valid degree level programmes in its own name;
• two stars: 250 points have been obtained;
• three stars: 400 points have been collected;
• four stars: an institution has obtained 550 points, but must also have:
❍ more than 75 academic referees or at least two citations per faculty member;
❍ at least 20 employer referees;
❍ at least 1% of students who are “international”.
• five stars: institutions with 700 points, which must also have:
❍ at least 150 academic referees, or three citations per faculty member;

4 3
G l o b a l U n i v e r s i t y r a n k i n G s a n d t h e i r i m p a c t – r e p o r t i i –
––––––––––––––––––––––––––––––––––––––––––––––––––––––––––––––––––––––––––––––––––––––––––––––––––––––––––––––––––––––––––––––––––––––––––––––––––––––––––––––––––––––––––––––––––––––––––––––––––––––––––––––––––––––––––––––––––––––––––––––––––––––––––––––––––––––––––––––––––23 There is no explanation as to why the employer reputation indicator was included despite the low number of responses. In fact, it is clear from
http://www.topuniversities.com/university-rankings/world-university-rankings/2012/subject-rankings/ that all 11 academic subjects that failed to meet the 300-response threshold (pharmacy, materials science, earth sciences, statistics, sociology, philosophy, English language and literature, linguistics, environmental science, geography and history) had an employer reputation indicator.
❍ at least 5% of academic staff and 5% of students who are “international”;
❍ at least 20 employer referees;
❍ a minimum of 80 points in the “infrastructure” category of the “core criteria”.
• “five stars plus”: institutions with 900 points and five stars in all areas.
Conclusions QS Stars is a paid service to universities. Despite the fee indicated above, three universities in the UK, sixteen in the US and twelve in Australia received stars without being audited.
Greater transparency is always welcome and QS stars might enable prospective students or other stakeholders to obtain more information about universities than the ranking table on its own. While universities are free to decide whether or not to take part in a QS Stars audit, when a good university does not appear to have stars questions arise and university leaders are under pressure to take part in the QS Stars exercise.
QS World University Rankings by subject
QS has divided all study programmes into a total of 52 subjects (QS, 2012f ). In 2012 the QS rankings covered 29 of them. QS subject rankings are based on three indicators: academic reputation, employer reputation and citations (ibid.). They mainly use data collected for the QS World University Ranking.
The selection of subjects for inclusion in the ranking depends on the availability of data. In some cases there were too few respondents in the academic reputation survey; in others there were too few respondents in the employer survey; and in a third group, the number of publications and citations was insufficient. The thresholds QS uses are as follows (ibid.):
• It includes a subject in its subject rankings if at least 150 respondents have taken part in the academic reputation survey. In practice, the number of respondents in the 2012 subject rankings varies substantially from 379 in pharmacy to 2 563 in physics. However this result is potentially misleading, given that the figures are not responses in the current year, but totals reached cumulatively from surveys over three consecutive years.
• For the inclusion of an employer reputation indicator, the required threshold is 300 responses. However, in reality the figure has varied between 147 respondents in pharmacy23 and 3 805 in computer science.
• For a university to be included in a subject ranking it must have:
❍ over 20 responses from academics and employers combined;
❍ a published papers total in the subject higher than the five-year (2006-2010) threshold, which ranged from 10 publications in subjects such as accounting and finance, linguistics and philosophy, to 190 in medicine. English linguistics and literature has a zero threshold and no citation indicator is used for it;
❍ undergraduate or taught postgraduate programmes in the subject concerned;
❍ at least 6 000 published papers for a particular academic subject to have a citations’ indicator (ibid.).

4 4
G l o b a l U n i v e r s i t y r a n k i n G s a n d t h e i r i m p a c t – r e p o r t i i –
For the academic and employer reputation indicators, as the data for both QS World University Ranking and Subject Rankings is collected together, respondents identify themselves indicating (QS, 2011d):
• the world regions and countries with which they are most familiar;
• five broader academic faculty areas with which they are familiar;
• one or two specialised subject areas with which they are most familiar.
In addition they nominate:
• for the purposes of the world university ranking, up to 10 domestic institutions (but not their own) and up to 30 international institutions that they consider the best in each one or more of the five faculty areas with which they claimed to be familiar;
• for the purposes of the subject university ranking, up to 10 domestic institutions and up to 30 international institutions that they consider the best in one or both of the two specialised subject areas with which they claimed to be familiar.
Academic reputation results for subject rankings are derived by filtering out responses in the overall survey for the QS World University Ranking, in accordance with the single-subject expertise identified by respondents.
For the calculation of indicator scores nominations made by domestic respondents count for half of those nominated by international respondents. QS also uses another mathematical device (QS, 2012e): after combing the results of the domestic and international nominations, the square root of each university’s result is calculated and then scaled to 100 a second time to get the indicator score.
The effect of applying square roots instead of indicator values themselves is to raise the lower scores and thus enable far more universities to be included (see Figure II-3). The scores observed on the blue curve become so small that once the 200th ranking is reached further comparisons are ineffective. This is not the same with the square-rooted scores on the red curve, on which the lower results are expanded and become more distinguishable. While this exercise does not change the ranking positions of universities, it still conceals the fact that the real differences are negligible.
For the employer reputation indicator, the respondents are asked to nominate up to 10 domestic institutions and 30 international institutions whose graduates they would recommend.
Figure II-3: The effect of calculating the square root of the scores (the curves in Fig II-3 were calculated to illustrate the effect of applying square roots in any hypothetic ranking)

4 5
G l o b a l U n i v e r s i t y r a n k i n G s a n d t h e i r i m p a c t – r e p o r t i i –
––––––––––––––––––––––––––––––––––––––––––––––––––––––––––––––––––––––––––––––––––––––––––––––––––––––––––––––––––––––––––––––––––––––––––––––––––––––––––––––––––––––––––––––––––––––––––––––––––––––––––––––––––––––––––––––––––––––––––––––––––––––––––––––––––––––––––––––––––24 The number of publications is counted for the five preceding years (for example in 2012, this applied to publications from 2007 to 2011 inclusive).
––––––––––––––––––––––––––––––––––––––––––––––––––––––––––––––––––––––––––––––––––––––––––––––––––––––––––––––––––––––––––––––––––––––––––––––––––––––––––––––––––––––––––––––––––––––––––––––––––––––––––––––––––––––––––––––––––––––––––––––––––––––––––––––––––––––––––––––––––* http://www.iu.qs.com/university-rankings/employer-survey-responses/
According to the QS Intelligence Unit website*, which breaks down the levels of employer responses by region, industry sector, country and job classification, the largest proportion of answers has been from those at a managerial and executive level..
Nominations by domestic and international respondents are counted separately, with the two results scaled as scores out of 100. Both results are then combined using weights of 30% for domestic nominations and 70% for international ones. Finally, as in the case of the academic reputation indicator, the square roots of the combined results are calculated and scaled to 100 a second time to obtain the indicator score (QS, 2012e).
With regard to the citations per paper indicator, it is noteworthy that in contrast to the QS World University Rankings for which citations are counted per faculty (staff member) the count for subject rankings is one of citation per published paper. This is apparently because it is almost impossible to collect reliable academic staff statistics for individual subjects. It has already been shown that the results of the citations per paper indicator may be strongly influenced by just a few frequently cited publications (van Raan et al., 2011). QS has therefore set a minimum publication threshold, which is different for each subject, but never less than 6 000 papers24 in order to avoid anomalies (QS, 2011b, p. 9). Self-citations and multidisciplinary publications are excluded.
Two changes have occurred in 2012. First, higher weights have been assigned if papers are published in journals with All Science Journal Classification (ASJC) codes. Those journals map articles to only one subject area, thus rewarding institutions that are more specialised (QS 2011a). Secondly, lower scores have been assigned to institutions with low published paper counts which qualify nonetheless. Unfortunately, the methodology page (ibid.) does not provide information on how the scores are increased or decreased.
As in the QS World University Ranking, Z-scores are calculated and the results are scaled to a 100-point maximum. Weights are applied twice to indicator results: first when calculating the scores of each indicator, and then between the three indicators when calculating the final score. Different weights are assigned to domestic and international responses. “Domestic responses are individually weighted at half the influence of an international response” in both reputation indicators (QS, 2011b). In addition, “weightings are also applied to balance the representation by region” (ibid.), and different weights depending on whether respondent answers concern the whole institution, its individual faculties or specialised subject areas (ibid.). Within the citation indicator, the weights differ depending on how articles are classified, with more specialised articles allocated higher weights.
Besides the application of weights to calculate indicator scores, they are also used to calculate the overall score. In calculating the final scores of subject rankings the weights applied for each indicator vary depending on the subject which is being ranked. In the case of medicine, biology, earth sciences, material sciences and pharmacy, the citation indicator has a weight of 50%, the employer reputation indicator a weight of 10%, and the academic reputation indicator a weight of 40%. At the other end of the spectrum, the combined weight of the reputation indicators is very high at 80% (for five subjects), 90% (seven subjects) and even 100% (one subject). In the case of both English language and linguistics the citation indicator is not used at all.

4 6
G l o b a l U n i v e r s i t y r a n k i n G s a n d t h e i r i m p a c t – r e p o r t i i –
ConclusionsComparisons between universities (QS, 2012f ) on a subject basis can be much more useful for them than global university league tables that try to encapsulate entire institutions in a single score. Furthermore comparisons made within a single subject lessen the field bias caused by different publishing cultures and citation practices within different fields of research.
In 2012 the QS subject rankings covered 29 of the 52 subject areas defined. These rankings are strongly based on reputation surveys. The methodology used is not sufficiently transparent for users to repeat the calculations and various mathematical adjustments are made before the final score is reached.
In relation to the academic reputation survey QS admits that a university may occasionally be nominated as excellent and ranked in a subject in which it “neither operates programmes nor research” (QS, 2011b, p.11). In an attempt to address this, QS specifies thresholds and conducts a final screening to ensure that listed institutions are, indeed, active in the subject concerned. This demonstrates that academics risk nominating universities on the basis of their previous reputation or reputation in other areas, rather than based on their own real knowledge of the institution. While the measures taken may help to eliminate inappropriate choices, they prevent academics from sometimes nominating universities which have programmes, but no capacity or strength in a given subject.
QS Best Student Cities Ranking The QS Best Student Cities Ranking was launched in 2012. According to QS, the reason why they started the Best Student Cities Ranking is that students, and especially international students, “in particular, have shown that location is second only to the perceived quality of a university and its courses” (O’Leary, 2012). However, this is not quite the only reason as it is also stated that “politicians and local business communities increasingly recognise the importance of students to the economies of university cities, while universities themselves focus particularly on international recruitment”.
Cities are ranked according to the following four categories: student mix, quality of life, employer activity, and affordability (ibid.; QS, 2012g), each of which includes several indicators (see Table II-5).
Table II-5: Ranking categories and indicators in QS Best Student Cities Ranking
Indicators Categories/Description Weight
Rankings category
Number of institutions
Indicator value is the count of the number of QS-ranked institutions in the city. 1
Indexed scoresTotal number of points of all QS-ranked institutions: Top 10, 10 points; Top 20, nine points; Top 30, eight points; Top 100, seven points; a further 1one point less for each of the subsequent 100 positions.
1
Top Score is based on ranking position of the institution with the highest position [in QS ranking].
1
Student mix
Student population Score is based on the number of students at QS-ranked institutions as a proportion of the city’s population. 1
International volume
Score is based on the total number of international students attracted to the city and studying at QS-ranked institutions. 1

4 7
G l o b a l U n i v e r s i t y r a n k i n G s a n d t h e i r i m p a c t – r e p o r t i i –
––––––––––––––––––––––––––––––––––––––––––––––––––––––––––––––––––––––––––––––––––––––––––––––––––––––––––––––––––––––––––––––––––––––––––––––––––––––––––––––––––––––––––––––––––––––––––––––––––––––––––––––––––––––––––––––––––––––––––––––––––––––––––––––––––––––––––––––––––25 The Mercer Quality of Living survey uses 10 categories: political, economic and socio-cultural environment, health and sanitation; education, public
services, recreation, consumer goods, housing and natural indices of affordability are used because there are cities in which property, hence, housing is expensive.
26 QS uses both Big Mac and Mercer Cost of Living Indexes because there are countries in which one of these Indexes is very high while the other is very low. QS considers that use of both Indexes together is more appropriate than using just one alone.
Source: QS, 2012f
It is certainly helpful to try to provide information that will improve international students’ understanding of the cities in which their preferred universities are located. However, it still needs to be demonstrated that a city is a better student location if it has more QS-universities. The first six indicators, thus half of those used to establish this ranking depend on whether universities are (QS) ranked or not, and (if so), on their ranking positions. Universities not in the QS ranking table are not considered and neither are their students (QS, 2012h).
It is worth considering that the overwhelming majority of students worldwide are enrolled in the some 97% of the universities that do not appear in the rankings. It would make sense to also include these students in any serious student cities’ ranking. They too are involved in student-life, contribute to the community and to the environment of the cities in which they live, graduate and find jobs.
ConclusionsIn short, the QS Best Student Cities ranking is yet another new tool by QS, and largely a by-product of the QS global university ranking, reflecting only a very limited perspective on the student experience as a whole.
Indicators Categories/Description Weight
International ratioScore is based on the total number of international students as a proportion of all students studying at QS-ranked institutions in the city.
1
Quality of living
Quality of living Score is based on the Mercer Quality of Living Survey25 but, as Mercer only lists 50 cities, cities outside the above 50 are automatically assigned a minimum of half the available points.
1
Employer activity
Domestic employer popularity
Number of domestic employers who identified at least one institution in the city as producing excellent graduates. 1
International employer popularity
Number of international employers who identified at least one institution in the city as producing excellent graduates. 2
Affordability
Tuition feesIt is not specified whether the tuition fees used for these indicators are fees for international or domestic students, although it is more likely that foreign student fees have been used.
2
Big Mac Index A score based on the Big Mac Index of retail pricing in cities worldwide, published by The Economist. 1
Mercer Cost of Living Index
Mercer compares costs of over 200 items such as housing, transport, food, clothing, household goods, and entertainment.26 1

4 8
G l o b a l U n i v e r s i t y r a n k i n G s a n d t h e i r i m p a c t – r e p o r t i i –
––––––––––––––––––––––––––––––––––––––––––––––––––––––––––––––––––––––––––––––––––––––––––––––––––––––––––––––––––––––––––––––––––––––––––––––––––––––––––––––––––––––––––––––––––––––––––––––––––––––––––––––––––––––––––––––––––––––––––––––––––––––––––––––––––––––––––––––––––27 http://www.topuniversities.com/university-rankings/top-50-under-50 28 The Leiden Ranking provider is the Centre for Science and Technology Studies (CWTS) at Leiden University.29 In the 2013 edition of the Leiden Ranking due for release on 17 April, a number of further improvements are expected. Most importantly, revised data
collection methodology will be applied, while there will also be rankings of broad scientific fields besides that of whole institutions.30 The Leiden Ranking counts a “letter-type” paper as one quarter of an “article”. This assumption is based on the observation that a letter-type publication
receives on average only a quarter of the citations of an article.31 In 2010, the MNCS indicator was also displayed next to the CPP/FCSm indicator but not really part of the ranking.
QS top-50-under-50 Ranking The “new” QS top-50-under-50 ranking27 is little more than a standard QS World University Ranking which has been processed to filter out universities founded less than 50 years ago, but with “QS classification” data added to the list, as in the case of several other QS rankings. It includes data on student enrolment, the number of faculties, publishing frequency and age, and is discussed further in the “QS classification” section above. Compare also the section THE 100 Under 50 ranking above to learn more about the rival ranking produced by THE for the same purpose.
6. CWTS Leiden Ranking The CWTS Leiden Ranking28 has undergone considerable changes in its 2011-201229 edition compared to 2010. These concern the selection of data sources and indicators, additional visualisation options and the inclusion of a four-indicator set representing collaboration among universities.
In contrast to many other rankings, the CWTS Leiden Ranking does not calculate an overall score, so no weights are applied to its indicators. Instead, universities are ranked in accordance with the scores of just one user-selected indicator, while the university scores of other indicators are also made visible.
Universities are selected for the CWTS Leiden Ranking on the basis of the actual (absolute) number of their publications. To qualify for the 2011/12 CWTS Leiden Top 500 universities list, institutions had to have generated over 3 200 publications in the five-year period 2005-2009.
Changes in indicators Number of publications indicator (P): in the 2011-2012 version of the CWTS Leiden Ranking only Web of Science (WoS) (Thomson Reuters) data was used whereas in 2010 data from WoS and Scopus (Elsevier) were combined. The CWTS Leiden Ranking completely excludes publications in the arts and humanities (CWTS 2011; Waltman et al., 2012) and considers only a limited number of document types, namely articles, reviews and letters.30 The CWTS Leiden Ranking also does not cover non-English language publications, by default (Waltman et al., 2012, p. 5), although users can opt for their inclusion.
Mean citation score indicator (MCS): is the average number of citations of the publications emanating from a given university (excluding self-citations). Essentially this is the same indicator as the one called CPP (citations per publication) in 2010, the only difference being that in 2011-2012 all data has come from WoS and is therefore not comparable with that of the 2010 edition.
Mean normalised citation score indicator (MNCS): in the 2011-2012 edition, the MNCS indicator31 has completely replaced the former Leiden Crown indicator corresponding to the “field-normalised citations per publication” (CPP/FCSm). The differences between these two indicators are described in the previous EUA Report (Rauhvargers, 2011, pp. 38-39).

4 9
G l o b a l U n i v e r s i t y r a n k i n G s a n d t h e i r i m p a c t – r e p o r t i i –
The proportion of top 10% publications indicator (PPtop 10%) has also been included for the first time in 2011-2012. It shows the proportion of a university’s publications output within the top 10% most frequently cited titles compared with other similar publications (Waltman et al., 2012, p. 8).
The 2010 “brute force” indicator which was calculated as P*CPP/FCSm appears in 2011-2012 under the new name of the TNCS indicator (see Table II-6).
New Leiden Ranking Visualisation OptionsThe “normalise for university size” option is active by default. While it is helpful to have further scope for amending the indicators to provide absolute and relative quantitative data, the wording “normalise for university size” is not very satisfactory. It suggests that when the option is active, the indicator values are divided by some parameter defining institutional size – usually student enrolment or staff – which is not quite the case.
First, the value corresponding to the total number of the university’s publications remains the same whether the “normalise for university size” option is used or not. Secondly, the MCS indicator is the average number of citations per publication (i.e. not per staff or per student as the name of the option suggests). Deselecting the “normalise for university size” option converts this indicator into the total number of citations of the university’s publications. The choice is therefore between an absolute or relative indicator in terms of number of citations (but not the university size).
Next, the MNCS indicator is the average ratio between the number of citations of a university’s publications and the world’s average number of citations in the same field, year and type of publication. Here, deselecting “normalised for university size” converts the indicator from one based on an average number of citations to one giving their total field-normalised number. Finally, since PP
top 10% is the proportion of the university’s
publications included within the top 10% most frequently cited works of their kind, deselecting the option in this case means that the indicator shows the total number of publications in the same top 10% group.
For convenience and greater clarity, the effects of selecting or deselecting “normalise for university size” are shown in Table II-6.
Table II-6: 2011/12 performance/impact indicators with or without the “normalise for university size” option
“Normalise for university size” boxSELECTED (default option)
“Normalise for university size” box DESELECTED
P Number of publications of a university P Number of publications of a university
MCS Average number of citations of the publications of a university TCS Total number of citations of the
publications of a university
MNCS
Average of ratios between the actual number of citations of each publication of the university and the statistical average number of citations of all papers of the same type worldwide (articles, reviews, letters) same field of research and year of publication.
TNCS
Total number of citations to the university’s publications normalised by research field, type of paper and time of publication. TNCS indicator is replacing the 2010 “brute force” indicator. The difference between the two is that TNCS uses mean normalisation while 2010 indicator used the CPP/FCSm.
PPtop 10%
The percentage of publications of a university in the top 10% of publications by number of citations.
Ptop 10%
Total number of publications of a university in the top 10% of publications by number of citations.

5 0
G l o b a l U n i v e r s i t y r a n k i n G s a n d t h e i r i m p a c t – r e p o r t i i –
The “assign collaborative publications fractionally to universities” option is also active by default. In this case a joint publication will only be counted as a fraction of a publication, based on the number of partner universities. For instance, if the address list of a publication contains five addresses, two of which relate to the same university, then the publication has a weight of 0.4 in calculating the indicators. On this basis, a publication is fully assigned to a university only if all addresses mentioned in the publication list relate to that institution (Waltman et al., 2012, p.13). However letter-type publications are exceptions to the above rule, as they are weighted 0.25.
The “leave out non-English-language publications” default option is essentially the result of the demonstration by the CWTS Leiden Ranking that publications in languages other than English tend to be read by fewer researchers, and therefore attract fewer citations than English-language publications of the same university. As a result, the inclusion of a university’s non-English-language publications tends, relatively, to lower its ranking score (van Raan et al., 2010; van Raan et al., 2011). For this reason users can choose whether to disregard publications in languages other than English, or to deselect the option so that such publications are included.
The “indicator stability intervals” visualisation option is an important new feature of the ranking. The reason for introducing it is that the MNCS indicator (until recently thought to be the best citation impact indicator) is sensitive to publications with atypically high citation levels. The most famous example of this is probably a 2008 publication by Professor George Sheldrick of the University of Göttingen, which was cited over 16,000 times. It appears that the inclusion, or not, of this single publication changed the indicator values so much that it altered the University of Göttingen’s position in the ranking by as many as 237 places.
Stability intervals reveal the full span of a university’s results. A stability interval indicates a range of values of an indicator that are likely to be observed when the underlying set of publications changes (Waltman et al., 2012 p.17). Thus very wide stability intervals indicate that the indicator is unstable and that consequently the university’s position is strongly influenced by just a few heavily cited publications. The stability interval includes 95% of the publications of a university. Furthermore, besides selecting stability intervals for the MNCS indicator, it is also possible to do so for the MCS and PP
top 10% indicators, as well as for
several “collaboration indicators” described in the next section.
New indicators to examine collaboration Combining the bibliometric data and geographical location of universities, the CWTS Leiden has introduced a new set of indicators that seek to represent collaborative publications. The indicators and their definitions are given in Table II-7. Like the performance/impact indicators in Table II-6, Table II-7 shows how indicators change depending on whether the “normalise for university size” option is selected or not.
While the information on collaborative research is without a doubt useful, the eight indicators in Table II-7 appear somewhat simplistic compared to the CWTS Leiden Ranking set of bibliometric indicators. It is also questionable whether the total (or average) distance between the universities concerned is the most important indicator for jointly authored publications. Further clarification as to why collaboration among universities at distances of over 1 000 km from each other is more significant than, for example, at 800 km, would also be helpful.

5 1
G l o b a l U n i v e r s i t y r a n k i n G s a n d t h e i r i m p a c t – r e p o r t i i –
Table II-7: additional set of 2011-2012 collaboration indicators with or without the “normalised for university size” option
Additional Products offered by CWTS LeidenCWTS Leiden Ranking provides several additional products. Benchmark analyses are derived from the Leiden Ranking, and provide a much higher level of details about the scientific activities and scientific performance of a university in terms of impact and collaboration. Analysis is carried out at the level of scientific disciplines or fields. Benchmark analyses allow in-depth comparisons to be made with selected benchmarked universities. Trend analyses show how the scientific performance of a university has changed over time. Performance analysis allows scientific performance to be assessed at the level of disciplines or fields and also at the level of, e.g., institutes, departments, or research groups. Performance analyses allow focusing on the potential performance of a university or its parts rather than on the organisation’s past performance (CWTS, 2012).
Science mapping analyses use bibliometric performance measures combined with science mapping techniques to map scientific activities of an organisation, showing its strengths and weaknesses in these activities. More sophisticated science mapping analyses are based on custom-made classifications of scientific literature, which allow for detailed analyses of the scientific performance of universities and other organisations (ibid.).
According to CWTS the 2013 edition will include a revised data collection methodology and will provide aggregate statistics for all scientific fields combined and also more focused statistics at the level of a number of broad scientific disciplines (CWTS, 2011).
Conclusions Identification of the bias in MNCS indicators given their unusual sensitivity to publications with extremely high citation levels, and the introduction of indicator stability intervals to detect high citation scores possibly resulting from such publications (rather than citations covering a university’s entire publications output) are both positive developments. Yet they are also a warning that new indicators always introduce fresh biases, so that rankings are constantly liable to distortion. Only time will tell whether the new indicator – the proportion of top 10% publications (PP
top 10%) – which currently seems the most reliable will be the best
in the long term or will create fresh problems. However, the inclusion of full counting and proportional counting methods does enable users to select further options as they see fit.
“Normalise for university size” boxSELECTED (default option)
“Normalise for university size” box DESELECTED
PPcollabProportion of a university’s publications jointly authored with other institutions. Pcollab
Total number of a university’s publications jointly authored with other institutions.
PPint_collabProportion of a university’s publications jointly authored with other countries. Pint_collab
Total number of a university’s publications authored with institutions in other countries.
MGCD The average geographical collaboration distance of a university’s publications. TGCD The total geographical collaboration
distance of a university’s publications.
PP>1000kmThe proportion of long distance joint publications. P>1000km
Total number of a university’s publications with a geographical collaboration distance over 1 000 km.

5 2
G l o b a l U n i v e r s i t y r a n k i n G s a n d t h e i r i m p a c t – r e p o r t i i –
––––––––––––––––––––––––––––––––––––––––––––––––––––––––––––––––––––––––––––––––––––––––––––––––––––––––––––––––––––––––––––––––––––––––––––––––––––––––––––––––––––––––––––––––––––––––––––––––––––––––––––––––––––––––––––––––––––––––––––––––––––––––––––––––––––––––––––––––––32 Backlink, also known as incoming links, inbound links, inlinks and inward links, is any link received by a web page or website from another website or web
page (Wikipedia). 33 Backdomain (not referred to by Wikipedia) – the domain originates from a backlink.
Visualisation of newly introduced collaboration indicators is yet another interesting development including four pairs of indicators, as in the case of the performance/impact indicators in Table II-6. The fact that the CWTS Leiden Ranking has changed acronyms for indicators with no further explanation may result in misunderstanding.
Finally, while the Leiden Ranking can claim that no use is made of self-submitted university data, there are questions regarding its overall validity as it remains the case that arts and humanities are not considered at all, and coverage of engineering and social sciences is limited, due to the types of publications selected: articles, reviews and letters but not conference proceedings and/or books.
7. Webometrics Ranking of World Universities Important changes have been introduced in the Webometrics ranking methodology in 2012 (see Table II-8).These relate both to the July 2011 and January 2012 editions of the ranking but also to those covering the period between January and July 2012. For this reason, the comparison is made between the July 2011 and July 2012 editions considered together so as to take account of both stages.
First of all, the former most powerful “visibility” indicator (weight of 50%) in 2012 is based both on the number of external links and the number of domains from which those links originate. In addition, the source of data on the above links and domains has been changed from Yahoo Search to Majestic SEO. Data for the former “size of university web” indicator, called “presence” in 2012, is obtained from Google instead of using several data sources. The 2012 “openness” indicator (“rich files” in 2011) now counts the articles obtained from Google Scholar for the 2007-2011 period. Another significant change is that the “excellence” (former “scholar”) indicator is now based on the number of papers in the top 10% of cited papers. Data was obtained from the SCImago database for the 2003-2010 period.
Table II-8: Changes in Webometrics indicators in 2012
Indicators in 2011 Meaning Weight
in 2011Indicators in
2012 Meaning Weight in 2012
Visibility (external links)
Total number of unique external links received (inlinks) by a site obtained from Yahoo Search
50% Impact
Number of backlinks32 (from Majestic SEO)–––––––––––––––––––––––––––––––––Number of backdomains33 (from Majestic SEO)
50%
Size of university web
Number of pages recovered from: Google, Yahoo, Live Search and Exalead
20% Presence Number of (all) web pages from Google 20%
Rich files
Number of Adobe Acrobat (.pdf), Adobe PostScript (.ps), Microsoft Word (.doc) and Microsoft PowerPoint (.ppt) files
15% OpennessNumber of papers from Google Scholar (2007-11) pdf, doc, docx, ppt
15%
Scholar Number of papers and citations extracted from Google Scholar 15% Excellence
Number of papers belonging to the top 10% of cited papers from the SCImago database (2003-10)
15%

5 3
G l o b a l U n i v e r s i t y r a n k i n G s a n d t h e i r i m p a c t – r e p o r t i i –
ConclusionsThe increased coverage of Webometrics to include over 20,000 higher education institutions allows nearly all higher education institutions worldwide to compare themselves with others. Apart from the addition of the “excellence” indicator based on SCImago bibliometric data, all other indicators used by Webometrics are based on web analysis, and considerably less direct proxies than the indicators used by academic rankings. Webometrics’ continued focus thus remains on providing a rough indication of how an institution performs compared to others.
As the Webometrics team has already noted (Aguillo et al., 2008, p. 235), it is strongly dependent on the functioning of global public search engines, the instabilities of which oblige Webometrics to make the substantial changes mentioned above in the indicators and their weights.
8. U-Map Development of the U-Map classification tool for higher education institutions has been funded by the European Union and is led by the Centre for Higher Education Policy Studies (CHEPS) at the University of Twente in the Netherlands. The methodology of U-Map is described in detail in the EUA 2011 Report (see Rauhvargers, 2011, pp. 51-55) and has not changed since then. The main features of U-Map are as follows:
• U-Map is a profiling/classification tool. It is not a ranking as no composite score is calculated and no indicator weights are used;
• 29 indicators are applied in six profiles, namely “teaching and learning”, “students profile”, “research involvement”, “knowledge exchange”, “regional engagement” and “international orientation”. U-Map is user-driven. By means of the profile finder visualisation tool, users can select universities in accordance with a combination of their own preferred criteria. In the other profile viewer visualisation, up to three selected universities can be compared indicator by indicator.
U-Map updateVery little new information has been posted in the public section of the U-Map website. Since the 2011 EUA Report, only one U-Map update report has been published (U-Map, 2011a). It is concerned with the number of universities and the implementation of U-Map.
According to the update, more than 230 universities had profiles in U-Map. The country distribution of the universities was Estonia (28), the Netherlands (45), Portugal (53), other EU countries (66), non-EU European countries (16) and the rest of the world (26). At the time of finalising this report 333 universities already had their profiles although only the latter 67 can still be accessed publicly. The aim is to have 1 000 European higher education institutions included in a publicly accessible U-Map database by the end of 2013 (U-Map, 2011a, p. 17).
In terms of the implementation of U-Map, Estonia (Kaiser et al., 2011) and Portugal submitted data on all their higher education institutions in 2011 (U-Map, 2011b). In 2012 higher education institutions in all the Nordic countries submitted their information, as did Belgium (the Flemish Community) and the Netherlands (Vercruysse & Proteasa, 2012, p. 23). Nordic countries have carried out a project to prepare
5 4
G l o b a l U n i v e r s i t y r a n k i n G s a n d t h e i r i m p a c t – r e p o r t i i –
U-Map profiles of all their higher education institutions. As regards the countries funded by the Nordic Council of Ministers, a dissemination seminar was held in Copenhagen on 22 October 2012 but the only document publicly available online is the very condensed seminar report (U-Map, 2012).
In all, 179 higher education institutions have been invited to participate in the U-Map Nordic countries project, with 36 from Denmark, 42 from Finland, seven from Iceland, 47 from Norway and 47 from Sweden. However, participation has been lower than expected particularly in Sweden and Denmark, in which less than 30% of institutions submitted fully comprehensive data. At 50%, the highest level of participation was recorded in Finland.
Conclusions According to the report on U-Map in Estonia (Kaiser et al., 2011), the resulting U-Map profiles largely match the expectations of higher education institutions and the Ministry of Education, while the most interesting differences and diversity are observable in the “knowledge exchange” and “international orientation” profiles. However, the country concedes that, because U-Map is designed as a European transparency tool, it is not fully compatible with all national institutional needs. Both Estonia and Portugal acknowledge that it has raised awareness among institutions of their own profile.
Portugal in particular identifies several positive features of U-Map (U-Map, 2011b), including the fact that it provides a good visual snapshot of higher education institutions which may therefore use it to position themselves. This in turn may be useful for strategic planning and in providing straightforward information for the public, politicians and the media. If so, U-Map offers a multidimensional perspective which is more elaborate than traditional rankings (U-Map, 2011b). That said U-Map information is rather general and not directly helpful for quality assurance purposes (ibid., p. 8). There are also concerns that U-Map – and more particularly U-Multirank – may result in an oversimplified perception of institutional mission, quality and performance. The lack of internationally comparable data is yet a further challenge. In the Nordic project (see U-Map, 2012), data verification revealed challenges linked, for example, to the following: the concept of a region (NUTS 2 or NUTS 3); real student enrolments or full-time equivalent (FTE) enrolments; the organisational setting for knowledge transfer activities; the breakdown by expenditure of teaching, research, knowledge transfer and other headings; concerts and exhibitions; and the distinction between general educational qualifications and other more career-oriented degrees.
9. U-Multirank As outlined in the 2011 EUA Report, the European Multidimensional Global University Ranking, commonly known as U-Multirank, is an EU-funded initiative, the feasibility phase of which was completed in 2011. In December 2012 the European Commission announced that it was funding another two-year “implementation phase”, launched in January 2013. U-Multirank presents itself through the project website as “a new multi-dimensional user-driven approach to the international ranking of higher education institutions”. The dimensions included are teaching and learning, research, knowledge transfer, international orientation and regional engagement. The project is being conducted by the CHERPA network led by the CHE Centre for Higher Education (Germany), the Centre for Higher Education Policy Studies (CHEPs) at Twente University (the Netherlands) and also including CWTS Centre for Science and Technology Studies at Leiden University (the Netherlands), Elsevier Publishers, the Bertelsmann Foundation (Germany) and “folge3”, a German software developer.

5 5
G l o b a l U n i v e r s i t y r a n k i n G s a n d t h e i r i m p a c t – r e p o r t i i –
The developers explain their approach to rankings as being, in addition to multi-dimensional and user-driven, stake-holder oriented, providing a multi-level ranking, combining institutional data with field-based rankings, showing the diversity of institutions by including institutions with different profiles. This will allow U-Multirank to compare institutions with similar activity profiles and avoid over-simplified league tables. The intention is to include institutions inside and outside Europe and to offer first results in early 2014.
During the feasibility phase (2009-2011) 316 higher education institutions were invited to participate in piloting the study. Only just over half of them (159 from 57 countries) actually took part (Rauhvargers 2011, p. 21). These included 94 EU institutions, 15 in non-EU European countries, and 50 outside Europe. Most of them (72%) took part in the institutional ranking. The field-based ranking was tested in just three fields: business studies, electrical engineering and mechanical engineering, with most institutions focusing on mechanical engineering (Callaert et al., 2012).
Selection of indicatorsIn the selection of indicators care was taken to check whether they:
• measure what they claim to measure;
• focus on the performance of programmes or institutions;
• are defined so as to measure “relative” characteristics and thus avoid dependence of institutional size;
• are already known as a result of benchmarking or ranking exercises and therefore tantamount to a measure of performance;
• provide comparisons from one situation, system or location to another;
• draw on data which is available in existing databases or at higher education and research institutions, or which can be collected without too much difficulty (Federkeil et al., 2012c).
However it is arguable whether an indicator can be considered acceptable just because it is “already known as a result of benchmarking or ranking exercises” (“face validity”) (ibid.). In this way a poor indicator may gain an unwarranted reputation as a result of its inclusion in several rankings. For instance, the student/staff ratio is a poor and often criticised proxy for teaching quality (Baty, 2009; Espeland & Saunder, 2007; Baty, 2010). As an indicator, it is strongly dependent on definitions of “staff‘’ and “student’’, as well as on the mix of academic subjects taught at an institution (Federkeil et al., 2012c, p. 103). Yet its weaknesses are overlooked because it is used in several other rankings, although its adoption in U-Multirank is confined to the field-based ranking and not the institutional one.
A second comment concerns the feasibility of selecting a particular indicator and the need to check “whether the required data is either available in existing databases and/or in higher education and research institutions” (ibid., p. 98). These two sources differ because material in databases generally results in much more reliable indicators than when data is collected through self-reporting from institutions.
Thirdly, in terms of methodological soundness, the designers of U-Multirank accept that several indicators of questionable feasibility have been retained simply because stakeholders wanted to include them or ensure that enough indicators were present in the particular content categories. Examples of such indicators are the following: interdisciplinary programmes; the relative graduate unemployment rate; art-related outputs per full-time equivalent (FTE) academic staff; continuous professional development courses offered per
5 6
G l o b a l U n i v e r s i t y r a n k i n G s a n d t h e i r i m p a c t – r e p o r t i i –
FTE academic staff; income from third-party funding; income from regional sources; graduates working in the region; students in internships in local enterprises; and degree theses in cooperation with regional enterprises (Callaert et al., 2012, pp. 142-163).
The designers of U-Multirank make a general distinction between the “enabling” stages and “performance” stages. The enabling stages consist of the inputs and creation or production processes, while the performance stages include their outputs and impacts (Federkeil et al., 2012a, p. 89). On the one hand, therefore, “enabling” indicators are further divided into “input” and “process” categories and, on the other, “performance” indicators are further divided into “output” and “impact” categories.
Teaching and learning indicatorsIn the institutional ranking, five indicators have been used to cover the teaching and learning dimension. The first is “expenditure on teaching as a proportion of total expenditure” – a pure input indicator. It is not clear whether this highlights the importance of teaching compared to other commitments, or something else. The proportion of expenditure on teaching and learning also depends on the overall funding level of higher education institutions. In an underfunded institution, this proportion may be greater than in a well-funded one.
The second indicator is “graduation rate” expressed as the proportion of students who graduate within x years of study, where x is the stipulated length of their programme multiplied by 1.5. While institutions with more selective admissions procedures may yield better results, the nature of their selectivity may be regulated by national legislation on the right to enter higher education.
The “interdisciplinarity of programmes” – the third indicator – is measured by the proportion of programmes involving at least two disciplines or academic subjects. As the designers of U-Multirank have pointed out, the indicator is sensitive to the regulatory or accreditation context and the data collection involved may also be problematic (Federkeil et al., 2012c, p. 101).
Next comes the “relative graduate unemployment rate” 18 months after graduation. While the “relative graduate employment rate” might have been chosen instead, the unemployment rate is the most common indicator because data on employment is much harder to obtain. But because employment is replaced by unemployment, the results of the indicator are more influenced by the overall economic situation in the country or region in which the higher education institution is located and also depend on the mix of academic subjects on offer.
The fifth and final “time-to-degree” indicator expresses the average time taken to graduate as a percentage of the official duration of the programme concerned, on the assumption that the smaller this proportion, the better. While slow progression is indeed a problem in some countries, it is a non-issue in others. In fact, the main difficulty with this indicator is that the time taken for students to graduate may also be shortened if they have to satisfy simpler requirements.
For field-based rankings concerned with teaching and learning, two indicators in the institutional rankings – those relating to the interdisciplinarity of programmes and graduate unemployment – are retained and the following five are added: investment in laboratories (in the pilot test used for engineering); the proportion of staff with doctorates; the inclusion of issues relevant to employability in the curriculum (see details at Federkeil et al., 2012c, pp. 102-105); computer facilities comprising hardware, internet access, field-specific software and access to computer support; and student gender balance.

5 7
G l o b a l U n i v e r s i t y r a n k i n G s a n d t h e i r i m p a c t – r e p o r t i i –
––––––––––––––––––––––––––––––––––––––––––––––––––––––––––––––––––––––––––––––––––––––––––––––––––––––––––––––––––––––––––––––––––––––––––––––––––––––––––––––––––––––––––––––––––––––––––––––––––––––––––––––––––––––––––––––––––––––––––––––––––––––––––––––––––––––––––––––––––34 In fact, one more student satisfaction indicator is included in U-Multirank but it concerns the “international orientation” dimension (rather than “teaching
and learning”) and is the same as the “opportunities for a study period abroad” indicator described briefly in the present section.
In addition, U-Multirank uses the following 12 student satisfaction indicators34 for the teaching and learning dimension in these field-based rankings (Federkeil et al., 2012a):
• overall satisfaction with the programme (and higher education institution);
• research orientation of the educational programme, as measured by the research orientation of courses, the teaching of relevant research methods, opportunities for early participation in research, and incentives to give conference papers;
• evaluation of teaching, including satisfaction with the role of students in evaluating it, the relevance of issues included in course evaluation, and information about the outcomes and impact of evaluation;
• facilities as measured by satisfaction with classrooms or lecture halls, availability and ease of access, number of places, technical equipment, laboratories, libraries, and resource centres, availability and accessing electronic journals and other information resources, and electronic and support services;
• programme organisation, including arrangements for graduation on arrangements for time, access to classes and courses, class size, and compatibility between examination requirements and teaching;
• course quality as measured by the range of courses on offer, the overall consistency of modules and courses, teaching staff skills, the stimulation provided by teaching, the quality of teaching or learning materials and of laboratory courses;
• the promotion of employability through the inclusion of work experience, as gauged by support for students during work placements, the organisation, preparation and evaluation of placements and links between practical placements and theoretical training;
• the social climate as measured by interaction among students themselves and with teachers, external attitudes towards students in their city or study location, and security arrangements;
• support by teachers as reflected in the general availability of teachers (personal contacts or email), informal advice and tuition, feedback on homework, assignments, examinations, coaching during laboratory or IT tutorials (engineering only), support during individual study time and suitability of handouts;
• opportunities for a study period abroad as gauged by the attractiveness of university exchange programmes and partner universities, the availability of places, preparatory support and guidance before going abroad, financial support, credit transfer arrangements, and the integration of foreign study periods into the broad course programme;
• student services as reflected in the quality of general information for students, accommodation, financial and career services, international offices and student organisations;
• university webpage is concerned with the quality of student information on the website, as evident from general information on the institution and admissions, information about its programmes, classes and lectures, and English-language information (for international students in non-English-speaking countries).
It is questionable whether student satisfaction indicators are reliable in international comparisons (Federkeil et al., 2012b). It has been argued that it is pointless to speculate whether students openly voice satisfaction or dissatisfaction with their institution, or whether inhibited by loyalty, because they will only be loyal if

5 8
G l o b a l U n i v e r s i t y r a n k i n G s a n d t h e i r i m p a c t – r e p o r t i i –
satisfied (Brown & Mazzarol, 2009). However, this may be different in international comparisons where the influence of different cultures or outlooks, rather than loyalty, may play a role. More generally, it would seem helpful for prospective students, as possible U-Multirank users, to see what other already enrolled students think about the institutions that they might attend.
Research indicatorsThe following U-Multirank indicators are concerned with the research dimension:
• The proportion of expenditure on research is a pure input indicator. It is problematic because it is hard to separate expenditure on research and teaching in a uniform way;
• The proportion of research income from competitive sources: results for this indicator may widely differ between countries and academic subjects, and it may be hard to separate competitive sources and overall public funding (Federkeil et al., 2012c, p. 109);
• The research publication output indicator counts the number of research publications with the selected higher education institution included in the address of at least one author (Web of Science). This indicator is biased towards medicine and exact sciences and excludes arts and humanities. It is not clear why the Thomson Reuters WoS alone has been chosen. If U-Multirank were designed to be more inclusive than conventional rankings, Scopus would provide more types of publications in more journals. The reasons for leaving it out are harder to understand, especially after reading the comparison of the two databases in the U-Multirank publication (Callaert et al., 2012, pp. 127-128).
• Post-docs are based on the number of post-doc positions per FTE academic staff member. However definitions of both post-docs and academic staff may vary from one country to another and relevant data may not be available.
• The interdisciplinarity of programmes is in practice measured by the proportion of research publications authored by multiple units from the same institution. This indicator may be biased by self-reported data.
• Normalised citation rate indicator is determined using the Mean Normalised Citation Score (MNCS) method described in Rauhvargers (2011). “Actual” citation counts are compared to “expected” counts based on the average impact score of all journals assigned to a field. Scores between 0.8 and 1.2 are considered “world average” 1.2 to 1.5 is “good” at international level, and scores above 1.5 have an “excellent” ranking (van Vught & Ziegele, 2011, p. 112);
• The shares of highly cited research publications indicator measures the proportion of top 10% of most highly cited publications, comparing “actual” citation counts to “expected” counts per field; citation impact distributions are calculated by applying a fixed citations window for two document types, articles and reviews, but books and proceedings are disregarded (Federkeil et al., 2012c, p. 110).
A comparison of the U-Multirank sets of research indicators and teaching and learning indicators leads to the same conclusion as in the case of other global rankings. While the bibliometric indicators used for research exhibit well-known biases and flaws, they reliably represent the areas they cover. Meanwhile, the teaching and learning indicators even when considered together do not manage to capture in a satisfactory way the quality of teaching and learning.
Data sources and availability U-Multirank data sources comprise bibliometric data for research indicators taken from CWTS and the Thomson Reuters Web of Science database. It is stated in Callaert et al. (2012) that Elsevier’s Scopus database “is likely to provide an extended coverage of the global research literature in those under-represented

5 9
G l o b a l U n i v e r s i t y r a n k i n G s a n d t h e i r i m p a c t – r e p o r t i i –
fields of science”, referring to arts and humanities and social sciences. However, there is as yet no evidence for this. Patents data is retrieved from the European Patent Office (EPO) and, in particular, the Worldwide Patent Statistical Database also known as PATSTAT. Other data is collected by the following four data-collecting instruments (ibid.):
• The U-Map questionnaire is used for those indicators that are identical to the U-Map indicators.
• The institutional questionnaire is used to collect data from institutions, including material on student enrolment, programme and continuous professional development courses, graduation rates and employment, staff, incomes and expenditure, research and knowledge transfer.
• The field-based questionnaire is used to collect data from individual faculties and departments on staff categories, those with doctorates, post-docs, funding, students and regional involvement, as well as the accreditation status, teaching profile and research profile of departments. The field-based questionnaire also collects information about individual programmes, such as their duration, enrolment procedures, tuition fees, work experience, courses taught in foreign languages, foreign students, credits earned abroad, the degrees finally awarded, the number of graduates and labour market entry data.
• The student survey aims to measure student satisfaction in various aspects of teaching and learning. The questionnaire combines open and multiple-choice questions.
The U-Multirank team has examined the availability of data, and problems in this respect are noted alongside each indicator. According to the U-Multirank team data availability is satisfactory overall, but this may be an overoptimistic conclusion. However U-Multirank is also designed to ensure that lack of data on a particular higher education institution in certain indicators does not cause major problems. The institution will simply not be ranked by the indicator concerned.
Conclusions If U-Multirank meets its objectives, based upon the experience with the feasibility study, and given that the intention is to integrate the already tested U-Map classification tool, it will be substantially different from existing global rankings.
The implementation phase was launched in January 2013 with the financial support of the European Commission and the first rankings are expected for early 2014.
10. U21 Rankings of National Higher Education Systems
Universitas 21 (U21) was established in 1997 as an international network of 23 research-intensive universities in 15 countries. The U21 ranking of National Higher Education Systems was published on 10 May 2012.35 The data collection and analysis were carried out by a team at the Melbourne Institute of Applied Economic and Social Research.
An earlier attempt to rank higher education systems, known as QS SAFE, was released by QS in 2008. It is still available as a QS product but limited in scope as the four QS SAFE indicators all link to the number and
––––––––––––––––––––––––––––––––––––––––––––––––––––––––––––––––––––––––––––––––––––––––––––––––––––––––––––––––––––––––––––––––––––––––––––––––––––––––––––––––––––––––––––––––––––––––––––––––––––––––––––––––––––––––––––––––––––––––––––––––––––––––––––––––––––––––––––––––––35 See http://www.universitas21.com/news/details/61/u21-rankings-of-national-higher-education-systems-2012

6 0
G l o b a l U n i v e r s i t y r a n k i n G s a n d t h e i r i m p a c t – r e p o r t i i –
––––––––––––––––––––––––––––––––––––––––––––––––––––––––––––––––––––––––––––––––––––––––––––––––––––––––––––––––––––––––––––––––––––––––––––––––––––––––––––––––––––––––––––––––––––––––––––––––––––––––––––––––––––––––––––––––––––––––––––––––––––––––––––––––––––––––––––––––––36 For further information on QS SAFE indicators, see: http://www.topuniversities.com/university-rankings/world-university-rankings/methodology/qs-safe 37 The weights of the R1 indicator are increased to 4 whenever data on private expenditure is not available.38 If data on private expenditure is not available, R2 is doubled. 39 In indicators E1 and E2, the scores for the participation of women are put at the maximum level of 100 if the proportion is 50% or higher.
scores of a given country’s universities in the QS top universities league table.36
The U21 ranking is a more thorough attempt to rank higher education systems rather than individual universities and is described in detail in the full project report (Williams et al., 2012). Besides the overall ranking, ranking indicators are grouped into four sub-rankings (“measures”) referring to: resources (with a weight of 25%), environment (25%), connectivity (10%) and output (40%). In the report the sub-rankings are referred to as “rankings in a broad area”, “qualitative variables”, or simply “variables”.
Data sourcesU21 Rankings of National Higher Education Systems use statistical data on education systems obtained from the UNESCO Institute of Statistics, the OECD’s Education at a Glance and, in some cases, the International Monetary Fund. Bibliometric data comes from SCImago and is based on the Scopus database. Employment information is derived from ILO labour statistics. Two indicators are calculated from university scores in the ARWU ranking and one is based on scores in the World Economic Forum Report on Competitiveness. Mixed data sources are used for the indicators on agencies monitoring higher education, including in reference to the status and appointment of academics, and the selection of the CEO (or corresponding top official) at higher education institutions. In the case of European countries, data has mainly been taken from the second EUA report on university autonomy (Estermann et al., 2011).
Table II-9: Indicators and their weights in the U-21 ranking of higher education systems
RESOURCES indicatorsWeights within the Measure 1
Resources
Weights in overall ranking
(U-21 calculation)
R1 Government expenditure on HEIs as a % of GDP, 2008 2(4)37 6.25% (12.5%)
R2 Total expenditure on HEIs as a % of GDP, 200838 2(0) 6.25% (0%)
R3 Annual expenditure per (FTE) student in US dollar purchasing power prices (PPP), 2008 2 6.25%
R4 Expenditure in HEIs on research and development (R&D) as % of GDP, 2009
1 3.125%
R5 Expenditure in HEIs on R&D per capita, PPP, 2009 1 3.125%
ENVIRONMENT indicatorsWeights within the Measure 2 Environment
E1 Proportion of women students in tertiary education,39 2009 10% 2.5%
E2 Proportion of women among academic staff, 2009 10% 2.5%
E3
A rating for data quality. For each quantitative series, the value is 1 if the data is available for the exact definition of the variable, 0.5 if data concerning the variable is available but some informed adjustment is required; otherwise the value is 0.
10% 2.5%
E4 Measure of the policy/regulatory environment 70%

6 1
G l o b a l U n i v e r s i t y r a n k i n G s a n d t h e i r i m p a c t – r e p o r t i i –
––––––––––––––––––––––––––––––––––––––––––––––––––––––––––––––––––––––––––––––––––––––––––––––––––––––––––––––––––––––––––––––––––––––––––––––––––––––––––––––––––––––––––––––––––––––––––––––––––––––––––––––––––––––––––––––––––––––––––––––––––––––––––––––––––––––––––––––––––40 For more information see (Williams et al., 2012, p. 13).41 According to the authors, the measure can be thought of as a rough indicator of the probability of a person in a country attending a university ranked
among the top 500 in the world.
E4.1: Diversity of HEIs: the variable is 1 if less than 90% of students are enrolled in any of the three OECD categories: public, government-dependent private, independent private; otherwise the variable is 0
Weight within E4 composite
indicator: 4
1.59%
E4.2: The ranking uses World Economic Forum scores based on answers to the question “how well does the educational system in your country meet the needs of a competitive economy?” from the Global Competitiveness Report 2011-2012.
Weight within E4 composite
indicator: 16
6.36%
E4.3: This is a composite indicator based on several factors: the existence of national higher education monitoring agencies; academics are not government employees and are free to move between institutions; the CEO is chosen by the university; and there is complete flexibility in the appointment of foreign academics.(No more detailed information is given regarding calculation of the scores).
Weight within E4 composite
indicator: 24
9.55%
CONNECTIVITY indicators Weights within the Measure 3 Connectivity
C1 Proportion of international students in tertiary education, 2009 Not available 5%
C2
Proportion of articles jointly authored with international collaborators, 2005-2009. The data is a weighted average for each country where the weights are the proportion of output from each higher education institution.40
Not available 5%
OUTPUT indicators Weights within the Measure 4
Output
O1 Total articles produced by higher education institutions, 2005-2009 (SCImago data used) 4 13.33%
O2 Total articles produced by HEIs per capita, 2005-2009 1 3.33%
O3A mean-normalised citation impact indicator from the SCImago database, for 2005-2009. The country scores are calculated using as weights the share of national publications contributed by each HEI.
1 3.33%
O4
“Depth of good universities in a country”. A weighted average of the number of HEIs listed in the SRC ARWU Ranking top 500 for 2011 divided by the country’s population.41 The weights used are the scores out of 100 for each university.
1 3.33%
O5 Average score of the three universities with the highest scores in the SRC ARWU Ranking. 1 3.33%
O6 Higher education enrolment as a proportion of the five-year age group following the completion of secondary education, 2009 1 3.33%
O7 Proportion of the population aged over 24 with a tertiary education qualification, 2009 1 3.33%
O8 Number of (FTE) researchers per capita, 2009 1 3.33%
O9Unemployment rates among those with tertiary education aged 25-64, compared to unemployment rates for those with only upper secondary or post-secondary non-tertiary education, 2009.
1 3.33%
Source: Williams et al., 2012

6 2
G l o b a l U n i v e r s i t y r a n k i n G s a n d t h e i r i m p a c t – r e p o r t i i –
––––––––––––––––––––––––––––––––––––––––––––––––––––––––––––––––––––––––––––––––––––––––––––––––––––––––––––––––––––––––––––––––––––––––––––––––––––––––––––––––––––––––––––––––––––––––––––––––––––––––––––––––––––––––––––––––––––––––––––––––––––––––––––––––––––––––––––––––––42 See http://www.universitas21.com/article/projects/?parentID=152
Conclusions While the development of a systems’ level ranking is an interesting new approach, as indicated in Part I there are many open questions. For example, as the weights of the indicators in the overall ranking have not been provided, it is very hard to determine which indicators have the greatest and least impact on the overall score, as the description of indicator weights is also confusing. The required calculations have been performed and the weight of each indicator added in the course of preparing the present report. While it has been assumed that the two “connectivity” indicators are equal in weight, nothing is said about them either in the overall report (Williams et al., 2012) or on the U21 website.42
After calculating the real weights of each indicator for the purposes of this report, it emerged that the most influential single indicator is O1 (“total articles produced by higher education institutions, 2005-2009”), with a weight of 13.33%. Together with the other two bibliometric indicators, O2 and O3, this results in a total weight of 20% for publications and citations.
As regards indicator E4.1, the subdivision of higher education institutions into public, government-dependent private and independent private categories merely specifies their ownership status, and says little about their real diversity. So while readily accessible, the indicator appears to have little meaning. Indicator E4.2, which is derived from the World Economic Forum scores based on country responses regarding their own higher education systems, may vary in accordance with the national traditions or stereotypes determining whether countries regard their higher education systems favourably or unfavourably (see also Milot, 2012). Use of this indicator for the purposes of global comparison is therefore questionable. The secondary use of SRC ARWU Ranking scores in the indicators O4 and O5 strengthens the positions of big or rich countries with universities strong in medicine and natural sciences. Alex Usher (2012) argues that awarding points for the percentage of the population over 24 with a degree (indicator O7) privileges those countries that expanded their higher education systems some time ago (i.e. the US) and also criticises indicators such as researchers per capita (indicator O8).
Thus there is certainly room for methodological improvement, and there are also some more general concerns that should be raised, for example that the broad diversity of higher education systems is unduly condensed into a very few numerical characteristics, and that some indicators are calculated directly from the results of the most elitist existing rankings. Furthermore questions can be raised about the positions of some countries. It is not clear in the overall ranking table, for example, why Ukraine ranks higher than Czech Republic, Poland, Slovenia and Italy; in the sub-ranking on resources the UK is ranked below Iran, and the Ukraine higher than most EU countries; the sub-ranking on environment ranks Switzerland below Chile and in connectivity Canada is below Indonesia. Finally it would be helpful for users to know the weights of individual indicators in the overall score. This information is not available at present.
11. SCImago Rankings
SCImago is a research group engaged in information analysis, representation and retrieval. Its members are researchers from the Instituto de Políticas y Bienes Públicos, the Spanish National Research Council (CSIC), the University of Granada, Carlos III University of Madrid, the University of Extremadura, the University of Alcalá de Henares, the University of Porto and SCImago Lab.

6 3
G l o b a l U n i v e r s i t y r a n k i n G s a n d t h e i r i m p a c t – r e p o r t i i –
––––––––––––––––––––––––––––––––––––––––––––––––––––––––––––––––––––––––––––––––––––––––––––––––––––––––––––––––––––––––––––––––––––––––––––––––––––––––––––––––––––––––––––––––––––––––––––––––––––––––––––––––––––––––––––––––––––––––––––––––––––––––––––––––––––––––––––––––––43 See: http://www.scimagoir.com/methodology.php?page=cross_sectorial 44 This means that if the indicator value is greater than 1, the institution’s citation impact is higher than the world average; if the indicator value is less than 1
then its publications are cited on average less than elsewhere in the world (see also Rauhvargers, 2011, p. 39).45 For further information on the Gini index, see: http://en.wikipedia.org/wiki/Gini_coefficient#Calculation
SCImago Institutional Rankings The SCImago Institutional Rankings (SIR) World Report (SCImago, 2012a) is not another global league table, and like the CWTS Leiden Ranking, it does not present a composite overall score, so no indicator weights are applied. In the SIR table higher education institutions are ranked by their total publication output based on the overall count of research documents in the Scopus database. SIR data is also shown in two other tables: the SIR World Report 2011 and Normalised Impact Report in which the institutions are ranked according to their scores in the normalised impact indicator, and the Excellence Rate Report table in which they are listed in order of their scores in the excellence rate indicator.
SCImago database users can read the ranking tables, and also customise the rankings on the basis of their needs and interests.
SIR is a science evaluation resource to assess universities and other research institutions globally. The status of individual institutions in the ranking table classifies them as higher education institutions (HEIs), government institutions (national academies of sciences or foundations), health-related institutions (e.g. hospitals), private companies and other bodies.43 SCImago rankings are more inclusive than commercial rankings, and ranked 3 290 HEIs and other research institutions in 2012.
There is no explanation why the SIR World Report table ends at precisely 3 290 institutions. It is simply noted that the volume of scientific output analysed exceeds 80% of the world output in the corresponding period. While the last institution listed (no. 3290) still has 161 publications, in another SCImago ranking, the Iberoamerican Ranking, the list goes down to institutions with just one publication, thus probably covering almost all institutions in that region.
SCImago rankings cover only research at higher education institutions and other research establishments. The indicators used are shown in Table II-10.
Table II-10: SCImago ranking indicators
Source: SCImago, 2012a
Indicators Explanation Weights
Output (O) Number of scientific papers published in scholarly journals Not applied
International collaboration (IC) Proportion of articles whose affiliations include more than one country address Not applied
Normalised impact (NI)Normalised impact indicator values show the ratio between the average scientific impact of an institution and the world average impact of publications for the same time, document type and subject area.44
Not applied
High quality publications (Q1)
Ratio of publications of an institution which are published in the journals ranked in the first quartile (25%) in the SCImago Journal Rank (SJR) indicator. Not applied
Specialisation index (SI)
This indicator is calculated in the same way as the Gini index in economics (see below). The value of the Gini index is between 0 and 1. Here, the value 1 means that the institution has publications in one field only, i.e. it is absolutely specialised; small index values mean that the institution is a comprehensive one.45
Not applied
Excellence rate (ER) The indicator value is the proportion of an institution’s journal publications included in the 10% most cited papers in the same scientific field. Not applied
Scientific Leadership Indicator value is the number of papers in which the corresponding author belongs to the institution. Not applied

6 4
G l o b a l U n i v e r s i t y r a n k i n G s a n d t h e i r i m p a c t – r e p o r t i i –
Other SCImago rankings and visualisations As already noted, the SIR World Report offers the following:
• the SIR World Report 2011: a positioning of institutions in accordance with their publications output. Similar World Reports are available for 2010 and 2009;
• two modified World Reports:
❍ World Report 2011: Normalised Impact Report: a positioning of institutions on the basis of the NI indicator (see Table II-10);
❍ SIR World Report 2011: Excellence Rate Report: a positioning of institutions on the basis of the ER indicator (Table II-10).
In addition, Iberoamerican Ranking SIR reports are available for 2012, 2011 and 2010, while other regional supplements for Africa, Asia, Eastern Europe, Latin America, the Middle East, Northern America, Oceania, and Western Europe have been released in various years.
SCImago country rankingsSCImago country rankings enable countries to be compared using each of the following indicators:46
• Total count of documents = total publication output of a country including citable and non-citable documents;
• Count of citable documents;
• Citations count;
• Self-Citations count;
• Citations per Document; and
• h-index.
Users can also customise rankings by:
• narrowing the comparison to one of the world regions;
• comparing countries in terms of either one of the 27 subject areas defined by Scopus, or 313 subcategories of those areas;
• using either the overall data of the period from 1996 to 2010, or narrowing it to any particular year within that period.
SCImago Journal RankingThe SCImago Journal Ranking includes a similar set of indicators as for the country ranking but applies them to journals along with three more, namely the SCImago Journal Rank; references count indicator, and references per document indicator (SCImago, 2007a).
The SCImago Journal Rank (SJR) indicator is a specific feature of journal ranking. It shows the average number of weighted citations received in a given year as a proportion of the number of documents published in the selected journal in the three previous years. Otherwise expressed, this means the ratio of weighted citations received in year X to documents published in the same journal in years X-1, X-2 and X-3. ––––––––––––––––––––––––––––––––––––––––––––––––––––––––––––––––––––––––––––––––––––––––––––––––––––––––––––––––––––––––––––––––––––––––––––––––––––––––––––––––––––––––––––––––––––––––––––––––––––––––––––––––––––––––––––––––––––––––––––––––––––––––––––––––––––––––––––––––––46 There are more detailed explanations of categories at: http://www.scimagojr.com/help.php

6 5
G l o b a l U n i v e r s i t y r a n k i n G s a n d t h e i r i m p a c t – r e p o r t i i –
Presentation of the ranking and additional analysisAdditional visualisations provide for country/country, country/region and region/region comparisons. By means of a map generator, it is possible to visualise joint citation networks that display either 27 subject areas, or 313 subject categories as already indicated. And with bubble charts, users can choose any two country ranking categories for the x and y axes of the diagram and which of those rankings will appear as the size of the bubbles (z). The “compare” option enables up to four world regions and/or countries to be compared against any of the indicators in the SCImago country ranking. Similarly the “compare” option for journals can be used to compare up to four journals against any of the SCImago Journal Rankings.
ConclusionsTools offered by SCImago are useful and available free of charge. One key feature of SCImago is that it covers more than 3 000 institutions thus allowing a large group of institutions to compare themselves with others. Users will nevertheless have to take into account that SCImago does not distinguish between universities and other research organisations. SCImago tools make it possible to compare institutions or countries: in total, by 27 subject areas and numerous narrower subject categories, by countries or regions. Journal rankings are important in the choice of a journal for publication. SCImago also has its limitations, for example only bibliometric data is used. Hence most indicators are absolute numbers which means that it favours large institutions.
12. University Ranking by Academic Performance The Research Laboratory for University Ranking by Academic Performance (URAP) was established at the Informatics Institute of the Middle East Technical University, Ankara, Turkey, in 2009. URAP is interesting because, contrary to most popular university rankings, it has selected a set of indicators that provide sufficient data to be retrieved to publish league tables with 2 000 entries. Therefore more universities than in other rankings are able to compare their performance.
It is not possible from the short descriptions given in the indicators section to find out how universities are selected for ranking, and whether there is a pre-selection or whether the limit of 2 000 universities is set more or less arbitrarily.
Table II-11: URAP indicators
Based on: http://www.urapcenter.org/2011/methodology.php?q=3
Indicators Description Weights
Number of articles Number of articles published in 2010 and indexed by Web of Science. 21%
Citations Total number of citations received in 2010 for the articles published in 2006-2010 and indexed by ISI (now WoS). Self-citations are excluded. 21%
Total documents Total count of documents which covers all scholarly literature: conference papers, reviews, letters, discussions and scripts in addition to journal articles published in 2010. Data from WoS.
10%
Journal impact total
Derived by aggregating the impact factors of journals in which a university published articles in 2006-2011. Source: Journal Impact Factors of ISI.
18%
Journal citation impact total
Calculated from impact factors of journals in which the cited articles are published. Source: Journal Impact Factors of ISI.
15%
International collaboration
The number of publications prepared in collaboration with foreign universities is obtained from the ISI database for the years 2006-2010. 15%

6 6
G l o b a l U n i v e r s i t y r a n k i n G s a n d t h e i r i m p a c t – r e p o r t i i –
Since 2010, the URAP ranking has changed two of its six indicators:
• by using Google Scholar (for journal and conference papers, theses and dissertations, academic books, pre-prints, abstracts, technical reports and other scholarly literature), the “total documents” indicator has been replaced by a “number of articles” indicator which is a count of the articles published in 2010 and indexed by Web of Science;
• a “journal citation impact total” indicator has been introduced, replacing the h-index used in previous versions.
ConclusionsThe greater inclusiveness of URAP compared to the most popular global university rankings is of interest. Its results should be reliable because its content is drawn solely from international bibliometric databases.
At the same time, and despite the words “academic performance” in its name, URAP uses indicators concerned exclusively with research. No indicators related to teaching are included; therefore once more the focus is on research-oriented institutions. Furthermore its six ranking indicators are absolute values and therefore size-dependant. As a result, URAP is strongly biased towards large universities.
Indeed, all the main ranking biases are present in URAP. Publications in books are disregarded, arts and humanities excluded and social sciences under-represented. Neither is there any compensation for different publication cultures, as the results of bibliometric indicators are not field-normalised. The results of the indicator on citation numbers in particular, as well as those on publication counts, are thus skewed towards the natural sciences and especially medicine.
13. EUMIDA The main goal of the EU-funded EUMIDA project has been to test the feasibility of regularly collecting microdata on higher education institutions in all EU-27 member states, Norway and Switzerland (EUMIDA, 2012). The present report comments on data availability, confidentiality, and the resources needed for a full-scale exercise. If successful, this project could impact some of the other initiatives described in this report such as U-Map or U-Multirank.
The EUMIDA data set (see Annex 1) essentially consists of indicators on different aspects of activity at higher education institutions, that are not always transparent and understandable in the way in which they have been created. In this respect, the EUMIDA work should be regarded as a feasibility study on the broader collection of data on institutions concerning different aspects of their activity (EUMIDA, 2012). EUMIDA collects data on institutions at the sub-national level of NUTS regions. With regard to material on research outputs, the present EUMIDA data collection reportedly provides useful information on students at ISCED level 6, which is already available in the core data set but now further differentiated by academic subject and field. EUMIDA claims that this information has been especially relevant for the social sciences and humanities, as well as for smaller institutions insufficiently covered by bibliometric indicators. From the data on ISCED 6 students, it is also possible to derive information on internationalisation (EUMIDA, 2012, p. 866). The first data set has been collected from 2 400 higher education institutions, but the second one covers only 1 365 universities flagged as “research active” (Vertesy et al., 2012, p. 72).

6 7
G l o b a l U n i v e r s i t y r a n k i n G s a n d t h e i r i m p a c t – r e p o r t i i –
Using the EUMIDA data set, regional variables have been computed at NUTS 2 level as shown in Table II-12. According to EUMIDA, the first two variables (“HEI density” and “SI5 intensity”) relate to the performance of education with a warning that their description of higher education is insufficient.
Table II-12: Variables constructed from the EUMIDA data set
Source: EUMIDA, 2012
Data in the remaining five indicators is aggregated into a University Systems Research (USR) performance index. Research performance includes the following indicators:
• IS5 mean: the regional average of the proportion of ISCED 5 international students per HEI;
• SI6 intensity: doctoral student (ISCED 6) intensity (count of ISCED 6 students per population aged 22-30);
• DDA Intensity: intensity of Doctoral Degrees Awarded (DDA per NUTS 2 region)/(population aged 22-30)×1000;
• RAC: the proportion of HEIs defined as “research active”.
However, it is hard to see how the “IS5 Mean” qualifies as an indicator for research performance. The proportion of foreign ISCED 5 students is rather an indication of the quality of higher education or (possibly) competitiveness rather than of research.
EUMIDA have already compared the USR performance index and EU Regional Competitiveness Index and its components (shown in Table II-12) with interesting results (Vertesy et al., 2012).
Some of the indicators are potentially controversial: for example, higher education density, which is the number of higher education institutions per person in the 18-30 age group. But one can ask whether many institutions per young person automatically equals a better higher education system than a few large ones. Higher education policies in most EU member states suggest the opposite, namely that countries concentrate their higher education systems in the belief that many small institutions are inefficient. Because the truth probably lies somewhere in between, reliable use of the HEI density indicator may be difficult.
As to the RAC indicator – the proportion of HEIs defined as “research active” – the result is dependent on the number and size of “research-inactive” institutions. If these institutions are few and large, the region will appear better than if they were small and many.
Variable code Variable name/definition
HEI density Higher education density(count of HEIs per population aged 18-30)
SI5 intensity ISCED 5 student intensity(count of ISCED 5 students per population aged 18-26)
IS5 mean Regional average of the proportion of ISCED 5 international students per HEI
SI6 intensity Doctoral student (ISCED 6) intensity(count of ISCED 6 students per population aged 22-30)
IS6 mean Regional average of the proportion of international doctoral students (ISCED 6) per HEI
RAC The proportion of HEIs defined as “research active”
DDA intensity Intensity of Doctoral Degrees Awarded (DDA per region)/ (population aged 22-30)×1000
SSR mean Regional average of student to staff ratio per HEI

6 8
G l o b a l U n i v e r s i t y r a n k i n G s a n d t h e i r i m p a c t – r e p o r t i i –
ConclusionsThe development of EUMIDA corresponds to the growing need for policy makers to have more extensive Europe-wide, comparable data collection. EUMIDA can therefore be seen as a positive development. In principle, the aggregation of results into an index is a ranking.
14. AHELO The OECD is presently finalising an international feasibility study launched in 2008 of what students in higher education know and can do on graduating, entitled the “Assessment of Higher Education Learning Outcomes” (AHELO).
The study has been divided into two main phases.
Phase 1 – January 2010 to June 2011: this phase saw the development of testing instruments for the generic and discipline-specific skills in economics and engineering and small-scale validation of these instruments.
• The generic skills strand focused on an assessment of generic skills, using the commercial US Collegiate Learning Assessment (CLAA) instrument with adaptations to provide a valid instrument in a transnational context. Countries taking part in this strand included Colombia, Egypt, Finland, Korea, Kuwait, Mexico, Norway, the Slovak Republic and the United States (Connecticut, Missouri and Pennsylvania).
• The economics strand sought to assess discipline-specific skills in economics. The framework and instrument aimed to assess learning outcomes that students should be able to achieve by the end of a Bachelor-type degree, such as demonstrating subject knowledge and understanding, or demonstrating subject knowledge and its application to real-world problems. Countries involved in this strand included Belgium (the Flemish Community), Egypt, Italy, Mexico, the Netherlands, the Russian Federation and the Slovak Republic.
• Likewise, the engineering strand sought to assess discipline-specific skills in civil engineering. The test questions were based on realistic contexts for engineering problems. A variety of contexts were selected from a range of situations involving environmental, structural, geotechnical, urban/rural, coastal and construction engineering such as bridges, buildings and construction sites. Countries/economies taking part in this strand included Abu Dhabi, Australia, Canada (Ontario), Colombia, Egypt, Japan, Mexico, the Russian Federation and the Slovak Republic.
Phase 2 – January 2011 to December 2012: this phase has involved administration of the tests (and contextual questionnaires) in participating institutions. All tests were translated into the students’ own national languages.
Two volumes of findings have recently been published (February and March 2013 respectively – Tremblay et al., 2012; and OECD 2013). An AHELO conference is being organised on 11 and 12 March 2013 to discuss the findings of the feasibility study and OECD countries will decide on future steps following the conference. At present OECD reports that the feasibility study has cost an estimated EUR 8.84 million. It has been financed by the participating countries and through contributions from several foundations or national authorities.

6 9
G l o b a l U n i v e r s i t y r a n k i n G s a n d t h e i r i m p a c t – r e p o r t i i –
Conclusions EUA has been closely involved in monitoring the progress of this feasibility study, along with its partner associations in the US and Canada. The joint concerns of the three associations were raised in a letter sent to the OECD in July 2012 on behalf of the university communities in all three regions. Some of the main questions raised are the following:
• At the end of the feasibility study there still seems to be some lack of clarity in terms of the purpose of AHELO as a global assessment project. Is it to provide a form of transnational accountability? Is it to establish baseline data for institutions to foster improvement of their educational programmes? Are the assessments intended primarily for institutions or governments? Is it fundamentally a project positioned to provide another global ranking system?
• Will a testing tool of this kind be able to take account of the national setting, cultural and language variation, mission, governance, approach to general education, widely differing types of institutions that serve different populations of students and ultimately, significantly different ways of approaching the measurement of institutional quality.
• The feasibility study (Tremblay et al., 2012, p. 185) indicated that “any further development of AHELO will need to be largely funded by countries for the foreseeable future”, but it also suggests that in the longer term, higher education institutions might be expected to contribute financially. Considering the major questions regarding the future funding of an AHELO-type study, would the project be able to achieve a critical mass required to establish a credible international benchmarking?
15. IREG ranking audit The International Ranking Expert Group (IREG) has now started its audit of rankings as mentioned in the editorial of the 2011 EUA Report. IREG was established in 2004 by the UNESCO European Centre for Higher Education (CEPES) and the Institute for Higher Education Policy in Washington. IREG members are ranking experts, ranking providers and higher education institutions.
Audit criteriaRankings in the field of higher education and research that have been published at least twice within the last four years qualify for the audit. The audit reviews them according to the Berlin Principles on Ranking of Higher Education Institutions which were approved at the 2006 IREG conference. A comparison of the 16 Berlin Principles with the 20 criteria set out in the IREG Ranking Audit Manual (IREG, 2011) reveals that the principles have generally been satisfactorily transposed into the IREG audit criteria (see Annex 2, Table A2-1). All the Berlin Principles, except two, are covered by these criteria. Implementation of the first principle (BP1) is largely beyond the control of ranking providers, and more a matter for higher education institutions, governments, employers or society at large. However, providers could emphasise that decisions should not be based solely on information gained from rankings. This point would be important enough to warrant a separate criterion.
Another principle with no specific criterion is Berlin Principle (BP) 10 stating that rankings should “pay due attention to ethical standards and the good practice recommendations articulated in these Principles”. This issue is perhaps covered implicitly in criteria given for other points. Moreover, ethical categories are understandably difficult to measure.

7 0
G l o b a l U n i v e r s i t y r a n k i n G s a n d t h e i r i m p a c t – r e p o r t i i –
For each criterion, the audit will apply a scale from 1 to 6, as follows: 1, not sufficient; 2, marginally applied; 3, adequate; 4, good; 5, strong; 6, distinguished. To balance the influence of different criteria, the IREG ranking methodology has subdivided them into 10 core criteria with a weight of 2, and 10 regular indicators with a weight of 1 (see Table II-13). On the basis of the six-grade scale and the aggregated weighting of 30, the maximum number of points that a ranking can earn is 180.
Table II-13: Summarised IREG Audit Criteria and their weights
Source: IREG, 2011
Groups of criteria Weights
Purpose, target groups, basic approach
1. The purpose of the ranking and the (main) target groups should be made explicit. 2
2. Rankings should recognise the diversity of institutions. 2 3. Rankings should specify the linguistic, cultural, economic and historical contexts of the
educational systems being ranked. 1
Methodology
4. Rankings should choose indicators according to their relevance and validity. 2 5. The concept of quality of higher education institutions is multidimensional and multi-
perspective (...). Good ranking practice would be to combine the different perspectives. 1
6. Rankings should measure outcomes in preference to inputs whenever possible. 1
7. Rankings have to be transparent regarding the methodology used for creating the rankings. 2 8. If rankings are using composite indicators the weights of the individual indicators
have to be published. Changes in weights over time should be limited and initiated for methodological or conception-related reasons.
2
9. Data used in the rankings must be obtained from authorised, audited and verifiable data sources and/or collected with proper procedures for professional data collection. 2
10. The basic methodology should be kept as stable as possible. 1
Publication and presentation of results 11. The publication of a ranking has to be made available to users throughout the year either
by print publications and/or by an online version of the ranking. 1
12. The publication has to deliver a description of the methods and indicators used in the ranking. 1
13. The publication of the ranking must provide scores of each individual indicator used to calculate a composite indicator in order to allow users to verify the calculation of ranking results.
2
14. Rankings should allow users to have some opportunity to make their own decisions about the relevance and weights of indicators. 1
Transparency, responsiveness
15. Rankings should be compiled in a way that eliminates or reduces errors. 1 16. Rankings have to be responsive to higher education institutions included/participating in
the ranking. 2
17. Rankings have to provide a contact address in their publication (print, online version). 1
Quality assurance
18. Rankings have to apply measures of quality assurance to ranking processes themselves. 2
19. Rankings have to document the internal processes of quality assurance. 1
20. Rankings should apply organisational measures that enhance the credibility of rankings. 2
Total 30

7 1
G l o b a l U n i v e r s i t y r a n k i n G s a n d t h e i r i m p a c t – r e p o r t i i –
Despite generally good coverage of the Berlin Principles by the IREG audit criteria, the weights are open to criticism. In particular, they could have been diversified into more values than just 1 or 2. For example, there are a few criteria (e.g. nos. 2, 8 and 18) that appear to merit a weight greater than 2, as well as others (e.g. criteria 5 and 6) that might reasonably be given a weight greater than 1. In addition, some criteria, such as no. 17, are clearly easy to satisfy (Sowter, 2011), whereas for others compliance with the appropriate Berlin Principle requires significant effort.
Audit teams An audit team of three to five members is appointed by the IREG Executive Committee which also appoints the team chair and takes the final decision on the audit. Key requirements are that chairs should in no way be formally associated with an organisation engaged in rankings, while team members should be independent of the ranking(s) under review, and have sufficient knowledge, experience and expertise to conduct the audit.
In audits of national rankings, at least one team member should have a sound knowledge of the national higher education system, and at least one should be an expert from outside the country(ies) covered by the ranking. In audits of global rankings, the team should as far as possible represent the diversity of world regions covered. IREG is also aiming to include in the teams experts from quality assurance agencies who are experienced in higher education institution evaluation processes.
Organisation of auditsThe procedure is similar to that applied in the external evaluation of higher education institutions. It starts with a self-evaluation report produced by the ranking organisation that should include the following:
• a record of previous ranking activities;
• an outline of the purpose and main target groups of the ranking(s);
• information on the scope of the ranking in terms of regional coverage, types of institutions included, academic fields, publication time cycle, etc.;
• a detailed description of the methodology;
• a description of instruments used for the internal quality assurance of the ranking;
• an outline of the publication and use of the ranking;
• as much information as available concerning the impact of the ranking at individual level (e.g. on student choice), as well as at the level of institutions and the higher education system.
Assessment is based on the ranking in its final published form and the report should also include a section on recent and planned changes. Based on the components indicated above the procedure used is as follows and intended to take 12 months:
self-report by ranking organisation -> analysis of self-report by audit team -> additional questions and answers -> on-site visit solely in the event of an (optional) invitation -> drafting of audit report -> checking by audit coordinator -> reactions to the report by ranking organisation -> decision by IREG Executive Committee -> publication of audit results (only positive outcomes are published)
The ranking organisation has the right to appeal against the audit decision.

7 2
G l o b a l U n i v e r s i t y r a n k i n G s a n d t h e i r i m p a c t – r e p o r t i i –
Possible effects of the IREG ranking audit (before its work has begun)There are signs that the providers of global rankings are already paying more attention to the transparency of their methodologies and to general compliance with the Berlin Principles. One clear example is the explicit demonstration by the SRC ARWU that its new Greater China Ranking has used higher weights for outcome indicators in line with the Berlin Principles (SRC ARWU, 2012a).
The success of audits will no doubt greatly depend on the qualifications of audit team members and their willingness to explore ranking methodologies in depth, as well as their ability to access the websites of the ranking organisations and specifically details of the methodology applied. Experience to date, as explained in the first EUA Report, has shown that frequent gaps in the published methodologies exist, and most notably the explanation of how indicator values are calculated from the raw data. As a result, those wishing to repeat the calculation to verify the published result in the ranking table have been unable to do so.
There are also cases in which the methodological content posted in more than one section of the ranking provider’s website is not consistent. While such variations are usually attributable to content relevant to ranking tables in different years, the precise years concerned are not clearly specified. Other rankings refer to the “normalisation” of data but without stating what kind of “normalisation” is meant. The term could thus denote many different things, ranging from the field normalisation of bibliometric indicators to the “normalisation” of indicators to make them relative rather than size-dependent, or to “normalisation” involving the division of a university’s result by that of the “best” university to make the former “dimensionless”.
It is to be hoped that the IREG audit will be thorough, and also take these concerns into account and lead to substantial improvements in ranking methodologies and the quality of the information provided. More will only be known on how this works in practice when the first audit results are available.47
––––––––––––––––––––––––––––––––––––––––––––––––––––––––––––––––––––––––––––––––––––––––––––––––––––––––––––––––––––––––––––––––––––––––––––––––––––––––––––––––––––––––––––––––––––––––––––––––––––––––––––––––––––––––––––––––––––––––––––––––––––––––––––––––––––––––––––––––––47 The first results of IREG audits are not available at the time of writing this report, but are expected to be released in February 2013.
7 3
G l o b a l U n i v e r s i t y r a n k i n G s a n d t h e i r i m p a c t – r e p o r t i i –
Bibliography
Aguillo, I.F., Ortega, J. L., & Fernández, M. (2008), “Webometric Ranking of World Universities: Introduction, Methodology, and Future Developments”, Higher Education in Europe, 33(2/3), pp. 234-244
Baty, P. (2009), “New data partner for World University Rankings”, Times Higher Education, 30 October. Retrieved on 1 November 2010 from: http://www.timeshighereducation.co.uk/story.asp?storycode=408881
Baty, P. (2010), “THE World University Rankings”, Times Higher Education, 27 May. Retrieved on 14 October 2012 from: http://www.timeshighereducation.co.uk/story.asp?storyCode=411739§ioncode=26
Baty, P. (2011), “THE Global Rankings: Change for the better”, Times Higher Education, 6 October. Retrieved on 26 February 2013 from: http://www.timeshighereducation.co.uk/world-university-rankings/2011-12/world-ranking/methodology
Baty, P. (2012a), “Rankings without reason”, Inside Higher Education, 31 May. Retrieved 31 January 2013 from: http://www.insidehighered.com/views/2012/05/31/essay-danger-countries-setting-policy-based-university-rankings
Baty, P. (2012b), “Rankings don’t tell the whole story – Handle them with care”, University World News Global Edition, 227, 26 June. Retrieved from: http://www.universityworldnews.com/article.php?story=20120626171938451
Baty, P. (2012c), “The essential elements in our world-leading formula”, Times Higher Education, 4 October. Retrieved from: http://www.timeshighereducation.co.uk/world-university-rankings/2012-13/world-ranking/methodology
Bjerke, C.H., & Guhr, D.J. (2012), “A View on Existing Rankings and the Introduction of U-Multirank in the Light of Students as Key Rankings Stakeholder”, The Academic Rankings and Advancement of Higher Education: Lessons from Asia and Other Regions, Proceedings, IREG-6 Conference (Taipei, Taiwan, 19-20 April), Higher Education Evaluation and Accreditation Council of Taiwan, pp. 259-266.
Brown, R., & Mazzarol, T. (2009), “The importance of institutional image to student satisfaction and loyalty within higher education”, Higher Education, 58 (1), pp. 81-95.
Callaert, J., Epping, E., Federkeil, G., File, J., Jongbloed, B., Kaiser, F., Roessler, I., Tijssen, R., van Vught, F., & Ziegele, F. (2012), “The pilot test and its outcomes”, in van Vught, F., & Ziegele, F. (Eds.), Multidimensional Ranking: the design and development of U-Multirank (Dordrecht, Heidelberg, London, New York; Springer), pp. 136-166.
Chan, S. (2012), “Enhancing Global Competitiveness: University Ranking Movement in Asia”, The Academic Rankings and Advancement of Higher Education: Lessons from Asia and Other Regions, Proceedings, IREG-6 Conference (Taipei, Taiwan, 19-20 April), Higher Education Evaluation and Accreditation Council of Taiwan, pp. 125-142.
CHERPA (2011), U-Multirank: Design Phase of the Project. Design and Testing the Feasibility of a Multi- dimensional Global University Ranking, CHERPA Network. Retrieved 12 January 2013 from: http://ec.europa.eu/education/higher-education/doc/multirank_en.pdf
CWTS (2011), Methodology. Retrieved on 28 February 2013 from: http://www.leidenranking.com/methodology.aspx

7 4
G l o b a l U n i v e r s i t y r a n k i n G s a n d t h e i r i m p a c t – r e p o r t i i –
CWTS (2012), Products. Retrieved on 25 December 2012 from: http://www.leidenranking.com/products.aspx
Danish Immigration Service (2012), The Greencard scheme, “The official portal for foreigners and integration”. Retrieved on 23 February 2013 from: http://www.nyidanmark.dk/en-us/coming_to_dk/work/greencard-scheme/
Douglas, J.A., Thomson, G., & Chu, M-Z. (2012), “Searching for the Holy Grail of learning outcomes”, Research & Occasional Paper Series, Center for Studies in Higher Education (University of California,Berkeley), 3(12), February. Retrieved on 27 November 2012 from: http://cshe.berkeley.edu/publications/docs/ROPS.JD.GT.MZ.CLA&AHELO.2.21.2012.pdf
Dutch Embassy (2012), Highly skilled migrants. Retrieved on 4 November 2012 from: http://www.dutchembassyuk.org/consular/index.php?i=307
Espeland, W.N., & Saunder, M. (2007), “Rankings and Reactivity: how public measures recreate social worlds”, American Journal of Sociology, 113(1), pp. 1-40.
Estermann, T., Nokkala, T., & Steinel, M. (2011), University Autonomy in Europe II: The Scorecard. (Brussels, European University Association). Retrieved on 28 February 2013 from: http://www.eua.be/Libraries/Publications/University_Autonomy_in_Europe_II_-_The_Scorecard.sflb.ashx
European Commision (2011), Supporting growth and jobs – an agenda for the modernisation of Europe’s higher education systems, European Communication from the Commission to the European Parliament, the Council, the European Economic and Social Committee and the Committee of the Regions, 20 September. Retrieved on 9 August 2012 from: http://ec.europa.eu/education/higher-education/doc/com0911_en.pdf
EUMIDA (2012), Feasibility study for creating a European university data collection. Final study report. Retrieved on 1 November 2012 from: http://ec.europa.eu/research/era/docs/en/eumida-final-report.pdf
Federkeil, G., Kaiser, F., van Vught, F., & Westerhijden, D. (2012a), “Background and Design”, in van Vught, F., & Ziegele, F. (Eds.), Multidimensional Ranking: the design and development of U-Multirank (Dordrecht, Heidelberg, London and New York; Springer), Chapter 6, pp. 85-96.
Federkeil, G., File, J., Kaiser, F., van Vught, F., & Ziegele, F. (2012b), “An Interactive Multidimensional Ranking Web Tool”, in van Vught, F., & Ziegele, F. (Eds.), ibid. Chapter 10, pp. 166-178.
Federkeil, G., Jongbloed, B., Kaiser, F., & Westerheijden, F. (2012c), “Dimensions and Indicators”, in van Vught, F., & Ziegele, F. (Eds.), ibid., Chapter 7, pp. 96-124.
Forslöw, B. (2012), Rankings and competitive metrics from a university perspective, Presentation at NUAS Conference, 13 August. Retrieved from: http://www.webforum.com/nuasconference/getfile.ashx?cid=331413&cc=3&refid=149
Gardner, E. (2011), “Brazil promises 75,000 scholarships in science and technology”, Nature, 4 August 2011. Retrieved on 23 February 2013 from: http://www.nature.com/news/2011/110804/full/news.2011.458.html
GRUP (2012a), Grup Survey Questionnaire. Retrieved on 12 September 2012 from: http://www.arwu.org/GRUP_Survey/GRUP_Survey_Questionnaire_2012.pdf
GRUP (2012b), Global Research University Profiles. Retrieved on 4 February 2013 from: http://www.arwu.org/GRUP_Survey/index.jsp
GRUP (2012c), GRUP 2012. Retrieved on 30 October 2012 from: http://www.shanghairanking.com/grup/index.html

7 5
G l o b a l U n i v e r s i t y r a n k i n G s a n d t h e i r i m p a c t – r e p o r t i i –
Hazelkorn, E. (2011), Rankings and the Reshaping of Higher Education. The Battle for World-Class Excellence (New York, Palgrave Macmillan).
Hazelkorn, E. (2012), “Focusing on the Total Quality Experience”, The Chronicle of Higher Education, 15 May. Retrieved from: http://chronicle.com/blogs/worldwise/focusing-on-the-total-quality-experience/29561
Hwung, H.H., & Huey-Jen Su, J. (2012), “How NCKU Uses Ranking as a Benchmarking Tool to Promote Its Internal Quality and International Visibility: A Case Study”, The Academic Rankings and Advancement of Higher Education: Lessons from Asia and Other Regions, Proceedings, IREG-6 Conference (Taipei, Taiwan, 19-20 April), Higher Education Evaluation and Accreditation Council of Taiwan, pp. 301-308.
IBNLive (2012), “UGC to allow only top 500 foreign universities to enter India”, IBN Live, 3 June. Retrieved on 23 February 2013 from: http://content.ibnlive.in.com/article/03-Jun-2012india/ugc-to-allow-only-top-500-foreign-univs-in-india-263954-3.html
IHEP (2009), Impact of College Rankings on Institutional Decision Making: Four Country Case Studies. Retrieved on 25 December 2012 from: http://www.ihep.org/publications/publications-detail.cfm?id=126
IREG (2006), Berlin Principles on Ranking of Higher Education Institutions. Retrieved on 23 January 2013 from: http://www.ireg-observatory.org/index.php?option=com_content&task=view&id=41&Itemid=48
IREG (2011), The IREG Ranking Audit Manual. Retrieved from: http://www.ireg-observatory.org/pdf/ranking_audith_audit.pdf
Jaschik, S. (2007), “The Mobile International Student”, Inside Higher Ed, 10 October. Retrieved on 23 January 2013 from: http://www.insidehighered.com/news/2007/10/10/mobile
Kaiser, F., Faber, M., Jongbloed, B., File, J., & van Vught, F. (2011), Implementing U-Map in Estonia, 2011 Case Study Report. Retrieved on 27 October 2012 from: http://www.u-map.eu/estonia/UMapReportEstonia.pdf
Liu, N.C. (2009), “The Story of Academic Rankings”, International Higher Education, 54, pp. 2-3.
Marginson, S. (2006), Global university rankings: private and public goods. Paper presented at the 19th Annual CHER conference, Kassel, Germany, 7-9 September.
Milot, B. (2012), “University rankings and system benchmarking reach similar results”, University World News, 238, 9 September. Retrieved on 9 September 2012 from: http://test.universityworldnews.com/article.php?story=2012090414311572
Miyairi, N., & Chang, H-W. (2012), Methods and Examples of Applying Data to Different Levels’ Research Excellence, Proceedings of 2012 HEEACT pre-conference workshop “Using data in research excellence and institutional strategic plan”, pp. 86-95.
Morgan, J. (2012), “THE 100 Under 50 university rankings: results”, Times Higher Education, 31 May. Retrieved on 9 July 2012 from: http://www.timeshighereducation.co.uk/story.asp?storycode=419908
Morphew, C.C., & Swanson, C. (2011), “On the efficacy of raising your university’s rankings”, in Shin, J., Toutkoushian, R., & Teichler, U. (Eds.), University Rankings: Theoretical Basis, Methodology and Impacts on Global Higher Education (Dordrecht, Heidelberg, London and New York; Springer) pp. 185-199.
Netherlands Immigration and Naturalisation Office (2012), A highly educated migrant seeking employment. Retrieved on 28 February 2013 from: english.ind.nl/Images/flyer1211_tcm111-447935.pdf
NTU Ranking (2012), Background and Methodology. Retrieved on 9 December 2012 from: http://nturanking.lis.ntu.edu.tw/BackgroundMethodology/Methodology-enus.aspx

7 6
G l o b a l U n i v e r s i t y r a n k i n G s a n d t h e i r i m p a c t – r e p o r t i i –
OECD (2013), Assessment of Higher Education Learning Outcomes. Feasibility Study Report. Volume 2 – Data Analysis and National Experiences. Retrieved on 5 March 2013 from: http://www.oecd.org/edu/skills-beyond-school/AHELOFSReportVolume2.pdf
Olds, K. (2012), “The Business Side of World University Rankings”. Retrieved on 23 December 2012 from: https://globalhighered.wordpress.com/2012/04/12/the-business-side-of-world-university-rankings/
Olds, K., & Robertson, S.L. (2012), “Towards a Global Common Data Set for World University Rankers”, 4 June. Retrieved on 8 July 2012 from: http://globalhighered.wordpress.com/2012/06/04/towards-a-global-common-data-set-for-world-university-rankers/
O’Leary, J. (2012), “QS Best Student Cities: Responding to Global Demand”, 1 February. Retrieved on 2 March 2013 from: http://www.topuniversities.com/university-rankings-articles/qs-best-student-cities/qs-best-student-cities-responding-global-demand
Proulx, R. (2012), “Using World University Ranking Systems to Inform and Guide Strategic Policy and Decision Making How to Benchmark Rather Than Rank Performance With Application to Canadian Research Universities”, The Academic Rankings and Advancement of Higher Education: Lessons from Asia and Other Regions, Proceedings, IREG-6 Conference (Taipei, Taiwan, 19-20 April), Higher Education Evaluation and Accreditation Council of Taiwan, pp. 187-209.
QS (2011a), How do we classify institutions? Retrieved on 8 September 2012 from: http://www.iu.qs.com/university-rankings/qs-classifications/
QS (2011b), World University Rankings. Subject Tables Methodology. Retrieved on 28 February 2013 from: http://image.guardian.co.uk/sys-files/Education/documents/2011/09/02/METHODOLOGY2011.pdf
QS (2011c), QS Stars Rating system: shining a light on excellence, recognizing diversity in higher education. Retrieved 9 September 2012 from: http://qsiu.files.wordpress.com/2011/11/qs-stars_fall_11_foremail1.pdf
QS (2011d), QS World University Rankings. Subject tables methodology, version 3. QS Intelligence Unit. Retrieved on 28 July 2012 from: http://content.qs.com/wur/qs-world-university-rankings-by-subject-methodology.pdf
QS (2012a), Refinement Chronology. Retrieved on 21 January 2013 from: http://www.iu.qs.com/university-rankings/world-university-rankings/refinement-chronology/
QS (2012b), Inclusion in Rankings. Retrieved on 28 February 2013 from: http://www.iu.qs.com/university-rankings/policies-conditions/
QS (2012c), QS Stars University Ratings – overall. Retrieved on 28 February 28 2013 from: http://www.topuniversities.com/qsstars
QS (2012d), QS Stars Methodology, version 4.0. Retrieved on 5 January 2013 from: http://content.qs.com/qs/Methodologyv4.pdf
QS (2012e), Academic reputation – methodology. Retrieved on 25 October 2012 from: http://www.iu.qs.com/university-rankings/rankings-indicators/methodology-academic-reputation/
QS (2012f ), QS World University Rankings by Subject. Retrieved on 28 July 2012 from: http://www.iu.qs.com/university-rankings/subject-tables/
QS (2012g), Best student cities. Methodology. Retrieved on 28 February 2013 from: http://www.iu.qs.com/university-rankings/qs-best-student-cities/

7 7
G l o b a l U n i v e r s i t y r a n k i n G s a n d t h e i r i m p a c t – r e p o r t i i –
QS (2012h), “What Makes a Top Student City?”. Retrieved on 28 February 2013 from: http://www.topuniversities.com/university-rankings-articles/qs-best-student-cities/what-makes-top-student-city
Rauhvargers, A. (2011), Global University Rankings and their Impact (European University Association, Brussels). Retrieved on 3 March 2013 from: http://www.eua.be/pubs/Global_University_Rankings_and_Their_Impact.pdf
Salmi, J. (2010), “If ranking is the disease, is benchmarking the cure?”, presentation at IREG-5 Conference, Berlin, 7-8 October.
Science watch, Field definitions. Retrieved on 23 January 2013 from: http://archive.sciencewatch.com/about/met/fielddef/
SCImago (2007a), SCImago Journal & Country Rank. Retrieved on 9 June 2012 from: http://www.scimagojr.com
SCImago (2007b), Description of SCImago journal rank indicator. Retrieved on 25 October 2012 from: http://www.scimagojr.com/SCImagoJournalRank.pdf
SCImago (2012a), SIR World Report, 2012: global ranking. Retrieved on 24 November 2012 from: www.scimagoir.com/pdf/sir_2012_world_report.pdf
SCImago (2012b), SCImago country rankings. Retrieved on 4 March 2013 from: http://www.scimagojr.com/countryrank.php
Shin, J., Toutkoushian, R., & Teichler, U. (Eds.) (2011), University Rankings: Theoretical Basis, Methodology and Impacts on Global Higher Education (Dordrecht, Heidelberg, London and New York; Springer).
Sowter, B. (2011), Comments to IREG ranking audit. Retrieved on 1 October 2012 from: http://www.ireg-observatory.org/index.php?option=com_content&task=view&id=119&Itemid=104
SRC ARWU (2012a), Greater China University Ranking Methodology. Retrieved on 19 September 2012 from: http://www.shanghairanking.com/Greater_China_Ranking/Greater-China-ranking-Methodology-2011.html
SRC ARWU (2012b), Ranking of Top Universities in Greater China – 2012. Retrieved on 15 September 2012 from: http://www.shanghairanking.com/Greater_China_Ranking/index.html
Taha, S.M.A (2012), “Developments in research assessment: towards a multidimensional approach”, The Academic Rankings and Advancement of Higher Education: Lessons from Asia and Other Regions, Proceedings, IREG-6 Conference (Taipei, Taiwan, 19-20 April), Higher Education Evaluation and Accreditation Council of Taiwan, pp. 439-451.
THE (2011), “World University Rankings: reputation ranking methodology”, Times Higher Education. Retrieved on 26 February 2013 from: http://www.timeshighereducation.co.uk/world-university-rankings/2011/reputation-ranking/methodology
THE (2012), “Times Higher Education Academic Reputation Survey”, Times Higher Education. Retrieved on 26 February 2013 from: http://www.timeshighereducation.co.uk/world-university-rankings/2012/reputation-ranking/methodology
Thomson Reuters (2010), “Global opinion survey. New outlooks on institutional profiles”. http://ip-science.thomsonreuters.com/m/pdfs/Global_Opinion_Survey.pdf
Thomson Reuters (2012a), Global Institutional Profiles Project. Retrieved on 20 September 2012 from: http://ip-science.thomsonreuters.com/globalprofilesproject/
7 8
G l o b a l U n i v e r s i t y r a n k i n G s a n d t h e i r i m p a c t – r e p o r t i i –
Thomson Reuters (2012b), Global Institutional Profiles Project, Institutional Data Collection. Retrieved on 20 September 2012 from http://ip-science.thomsonreuters.com/globalprofilesproject/gpp-datacollection/
Thomson Reuters (2012c), Global Institutional Profiles Project, Academic reputation survey stages 2 methodology. Retrieved on 20 September 2012 from: http://ip-science.thomsonreuters.com/globalprofilesproject/gpp-reputational/methodology/
Thomson Reuters (2012d), Global Institutional Profiles Project, Academic reputation survey, questionnaire. Retrieved on 20 September 2012 from: http://ip-science.thomsonreuters.com/scientific/m/pdfs/GIP-ReputationSurvey.pdf
Thomson Reuters (2012e), Institutional Profiles Indicator group descriptions. Retrieved on 19 September 2012 from: http://researchanalytics.thomsonreuters.com/researchanalytics/m/pdfs/ip_indicator_groups.pdf
Thomson Reuters (2012f ), latest update to institutional profiles. Retrieved on 3 March 2013 from: http://community.thomsonreuters.com/t5/InCites-Customer-Forum/The-Latest-Update-to-Institutional-Profiles-is-Available-Now/td-p/29607
Thomson Reuters (2012g), Thomson Reuters Improves Measurement of Universities’ Performance with New Data on Faculty Size, Reputation, Funding and Citation Measures. Retrieved on 20 September 2012 from: http://thomsonreuters.com/content/press_room/science/661932
Tremblay, K., Lalancette, D., & Roseveare, D. (2012), Assessment of Higher Education Learning Outcomes. Feasibility Study Report, Volume 1 – Design and Implementation. Retrieved February 2013 from: http://www.oecd.org/edu/skills-beyond-school/AHELOFSReportVolume1.pdf
U-Map (2011a), A University Profiling Tool, 2011 Update Report. Retrieved on 20 October 2012 from: http://www.u-map.eu/U-Map_2011_update_report_print.pdf
U-Map (2011b), U-Map Portugal Dissemination Seminar. Retrieved on 20 October 2012 from: http://www.u-map.eu/portugal/PortugalReportDisseminationSeminar.pdf
U-Map (2012), U-Map Nordic Countries Dissemination Seminar. Retrieved on 22 November 2012 from: http://www.u-map.org/nordic/Report%20Umap%20seminar_191112.pdf
Usher, A. (2012a), “One Response to Ranking Higher Education Systems”, Higher Education Strategy Associates, 15 May. Retrieved on 18 October 2012 from: http://higheredstrategy.com/ranking-higher-education-systems/
van Raan, T., van Leeuwen, T., & Visser,M. (2010), Germany and France are wronged in citation-based rankings. Retrieved on 11 January 2010 from: http://www.cwts.nl/pdf/LanguageRanking22122010.pdf
van Raan, T., van Leeuwen, T., & Visser, M. (2011), “Non-English papers decrease rankings”, Nature, 469, p. 34.
van Vught, F. (2008), “Mission diversity and reputation in higher education”, Higher Education Policy, 21 (2), pp. 151-174.
van Vught, F., & Ziegele, F. (2011), Design and Testing the Feasibility of a Multidimensional Global University Ranking, final report. Retrieved on 12 October 2012 from: http://ec.europa.eu/education/higher-education/doc/multirank_en.pdf
van Vught, F., & Ziegele, F. (Eds.) (2012), Multi-dimensional ranking: the design and development of U-Multirank (Dordrecht, Heidelberg, London and New York; Springer).
van Vught, F., & Westerhijden, D. (2012), “Impact on rankings”, in van Vught, F., & Ziegele, F. (Eds.), ibid., pp. 71-81.

7 9
G l o b a l U n i v e r s i t y r a n k i n G s a n d t h e i r i m p a c t – r e p o r t i i –
Vercruysse, N., & Proteasa, V. (2012), Tranparency tools across the European Higher Education Area. Retrieved on 20 October 2012 from: http://www.ehea.info/Uploads/(1)/brosura_v1_v12_vp_120419_text.pdf
Vertesy, D., Annoni, P., & Nardo, M. (2012), “University Systems: beyond league tables. Poles of excellence or ivory towers?”, The Academic Rankings and Advancement of Higher Education: Lessons from Asia and Other Regions, Proceedings, IREG-6 Conference (Taipei, Taiwan, 19-20 April), Higher Education Evaluation and Accreditation Council of Taiwan, pp. 69-87.
Waltman, L., Calero-Medina, C., Kosten, J., Noyons, N.C., Tijssen, R.J., & Wouters, P. (2012), The Leiden Ranking 2011/2012: Data collection, indicators, and interpretation. Retrieved on 25 October 2012 from: http://arxiv.org/ftp/arxiv/papers/1202/1202.3941.pdf
Webometrics (2012), Methodology. Retrieved on 21 November 2012 from: http://www.webometrics.info/en/Methodology.
Williams, R., Rassenfosse, G., Jensen, P., & Marginson, S. (2012), U21 Ranking of National Higher Education Systems. Retrieved on 24 November 2012 from: http://www.universitas21.com/RelatedFile/Download/279
Yonezawa, A. (2012), “Rankings and Information on Japanese Universities”, The Academic Rankings and Advancement of Higher Education: Lessons from Asia and Other Regions, Proceedings, IREG-6 Conference (Taipei, Taiwan, 19-20 April), Higher Education Evaluation and Accreditation Council of Taiwan, pp. 149-163.

8 0
G l o b a l U n i v e r s i t y r a n k i n G s a n d t h e i r i m p a c t – r e p o r t i i –
Annexes
Annex 1
EUMIDA Core Set of Variables
EUMIDA Table A1-1: List of EUMIDA core set of variables
Source: EUMIDA, 2012
Dimension Indicator Measure/Definition
Identifiers Institutional codeCountry code + numeric identifier Country code + numeric identifier
Name of the institution National language + English translation (if available)
Basic institutional Country Country code (ISO)
Legal status Public/private, following UOE manual
National type National type of institution (university, college, etc.)
Foundation year Year of first foundation
Current status year Year when the institutions got the present status
University hospital Dummy variable (0/1)
Total staff Full Time Equivalents, following UOE manual
Educational activities Students at ISCED 5 level Headcounts
Students at ISCED 6 level Headcounts
Subject specialisation Subject domains with students enrolled (ISC fields)
Distance education Institutions Dummy variable (0/1)
Highest degree delivered Diploma/Bachelor/Master/doctorate
Research activities Research active institution Dummy variable (0/1)
Number of doctorates Degrees at ISCED 6 level
International attractiveness International students Headcounts (ISCED 5)
International doctoral students Headcounts (ISCED 6)
Regional engagement Region of establishment NUTS code of the region of the main seat
Knowledge exchange Not available

8 1
G l o b a l U n i v e r s i t y r a n k i n G s a n d t h e i r i m p a c t – r e p o r t i i –
Table A1-2: List of EUMIDA extended set of variables
Source: EUMIDA, 2012
Category Variable N. ofvariables Breakdown requested
Expenditure Total expenditure 4 Current expenditure
Personnel expenditure
Non-personnel expenditure
Capital expenditure
Revenues Total revenues 3 Core budget
Third-party funding
Student fees
Personnel Number of Personnel 10 Academic and non-academic personnel
For academic personnel: breakdown national/foreign
For academic personnel breakdown by fields of science
Educational activitiesEnrolled students at ISCED 5 and 6
22 By fields of education
Between national and foreign students
By level of education
Number ofgraduations atISCED 5
44 By fields of education
Between national and foreign students
By fields of education
Number ofgraduations atISCED 6
11 Between national and foreign students
Research R&D 1 No breakdown requested
Involvement Expenditure 1 No breakdown requested
Patents 1 No breakdown requested
Spin-off 1 No breakdown requested
Companies 1 No breakdown requested
Private funding 1 No breakdown requested

8 2
G l o b a l U n i v e r s i t y r a n k i n G s a n d t h e i r i m p a c t – r e p o r t i i –
Annex 2
The International Rankings Expert Group and Berlin Principles Table A2-1: Coverage of the Berlin Principles by IREG audit methodology
Berlin Principles (BP) Description of BP principles IREG audit criteria
1. Be one of a number of diverse approaches to the assessment of higher education inputs, processes, and outputs.
Rankings can provide comparative information and improved understanding of higher education, but should not be the main method for assessing what higher education is and does. Rankings provide a market-based perspective that can complement the work of government, accrediting authorities, and independent review agencies.
No criterion
2. Be clear about their purpose and their target groups.
Rankings have to be designed with due regard to their purpose. Indicators designed to meet a particular objective or to inform one target group may not be adequate for different purposes or target groups.
IREG Criteria on Purpose, Target Groups, Basic Approach Criterion 1:The purpose of the ranking and the (main) target groups should be made explicit. The ranking has to demonstrate that it is designed with due regard to its purpose.This includes a model of indicators that refers to the purpose of the ranking.
3. Recognise the diversity of institutions and take the different missions and goals of institutions into account.
Quality measures for research-oriented institutions, for example, are quite different from those that are appropriate for institutions that provide broad access to underserved communities. Institutions that are being ranked and the experts that inform the ranking process should be consulted often.
IREG Criteria on Purpose, Target Groups, Basic ApproachCriterion 2:Rankings should recognise the diversity of institutions and take the different missions and goals of institutions into account. Quality measures for research-oriented institutions, for example, are quite different from those that are appropriate for institutions that provide broad access to underserved communities.The ranking has to be explicit about the type/profile of institutions which are included and those which are not.
4. Provide clarity about the range of information sources for rankings and the messages each source generates.
The relevance of ranking results depends on the audiences receiving the information and the sources of that information (such as databases, students, professors, employers).Good practice would be to combine the different perspectives provided by those sources in order to get a more complete view of each higher education institution included in the ranking.
Criteria on MethodologyCriterion 5:The concept of quality of higher education institutions is multidimensional and multi-perspective and “quality lies in the eye of the beholder”. Good ranking practice would be to combine the different perspectives provided by those sources in order to get a more complete view of each higher education institution included in the ranking. Rankings have to avoid presenting data that reflect only one particular perspective on higher education institutions (e.g. employers only, students only). If a ranking refers to one perspective/one data source, only this limitation has to be made explicit.

8 3
G l o b a l U n i v e r s i t y r a n k i n G s a n d t h e i r i m p a c t – r e p o r t i i –
Berlin Principles (BP) Description of BP principles IREG audit criteria
5. Specify the linguistic, cultural, economic and his torical contexts of the educational systems being ranked.
International rankings in particular should be aware of possible biases and be precise about their objective. Not all nations or systems share the same values and beliefs about what constitutes “quality” in tertiary institutions, and ranking systems should not be devised to force such comparisons.
Criteria on Purpose, Target Groups, Basic ApproachCriterion 3:Rankings should specify the linguistic, cultural, economic, and historical contexts of the educational systems being ranked. International rankings in particular should be aware of possible biases and be precise about their objectives and data.International rankings should adopt indicators with sufficient comparability across various national systems of higher education.
6. Be transparent regarding the me-thodology used for creating the rankings.
The choice of methods used to prepare rankings should be clear and unambiguous. This transparency should include the calculation of indicators as well as the origin of data.
Criteria on MethodologyCriterion 7:Rankings have to be transparent regarding the methodology used for creating the rankings. The choice of methods used to prepare rankings should be clear and unambiguous.Rankings have to be transparent regarding the methodology used for creating the rankings. The choice of methods used to prepare rankings should be clear and unambiguous.It should also be indicated who establishes the methodology and if it is externally evaluated. Ranking must provide clear definitions and operationalisations for each indicator as well as the underlying data sources and the calculation of indicators from raw data. The methodology has to be publicly available to all users of the ranking as long as the ranking results are open to public; in particular, methods of normalising and standardising indicators have to be explained with regard to their impact on raw indicators.
Criterion 8:If rankings are using composite indicators the weights of the individual indicators have to be published. Changes in weights over time should be limited and have to be justified due to methodological or conceptual considerations. Institutional rankings have to make clear the methods of aggregating results for a whole institution. Institutional rankings should try to control for effects of different field structures (e.g. specialised vs. comprehensive universities) in their aggregate result.
7. Choose indicators according to their relevance and validity.
The choice of data should be grounded in recognition of the ability of each measure to represent quality and academic and institutional strengths, and not availability of data. Be clear about why measures were included and what they are meant to represent.
Criteria on Methodology Criterion 4:Rankings should choose indicators according to their relevance and validity. The choice of data should be grounded in recognition of the ability of each measure to represent quality and academic and institutional strengths, and not availability of data.Rankings should be clear about why measures were included and what they are meant to represent.

8 4
G l o b a l U n i v e r s i t y r a n k i n G s a n d t h e i r i m p a c t – r e p o r t i i –
Berlin Principles (BP) Description of BP principles IREG audit criteria
8. Measure outcomes in preference to inputs whenever possible.
Data on inputs is relevant as it reflects the general condition of a given establishment and is more frequently available. Measures of outcomes provide a more accurate assessment of the standing and/or quality of a given institution or programme, and compilers of rankings should ensure that an appropriate balance is achieved.
Criteria on Methodology Criterion 6:Rankings should measure outcomes in preference to inputs whenever possible. Data on inputs and processes is relevant as it reflects the general condition of a given establishment and is more frequently available. Measures of outcomes provide a more accurate assessment of the standing and/or quality of a given institution or programme, and compilers of rankings should ensure that an appropriate balance is achieved.
9. Make the weights assigned to different indicators (if used) prominent and limit changes to them.
Changes in weights make it difficult for consumers to discern whether an institution’s or programme’s status changed in the rankings due to an inherent difference or due to a methodological change.
Criteria on Methodology Criterion 10:Although rankings have to adapt to changes in higher education and should try to enhance their methods, the basic methodology should be kept stable as much as possible. Changes in methodology should be based on methodological arguments and not be used as a means to produce different results compared to previous years. Changes in methodology should be made transparent.
10. Pay due attention to ethical standards and the good practice reco mmen-dations articula ted in these Principles.
In order to assure the credibility of each ranking, those responsible for collecting and using data and undertaking on-site visits should be as objective and impartial as possible.
No Criterion
11. Use audited and verifiable data whenever possible.
Such data has several advantages, including the fact that it has been accepted by institutions and that it is comparable and compatible across institutions.
Criteria on Methodology Criterion 9:Data used in the ranking must be obtained from authorised, audited and verifiable data sources and/or collected with proper procedures for professional data collection following the rules of empirical research (BP11 and 12). Procedures of data collection have to be made transparent, in particular with regard to survey data. Information on survey data has to include: source of data, method of data collection, response rates, and structure of the samples (such as geographical and/or occupational structure).
12. Include data that is collected with proper proce dures for scientific data collection.
Data collected from an unrepresentative or skewed subset of students, faculty, or other parties may not accurately represent an institution or programme and should be excluded.
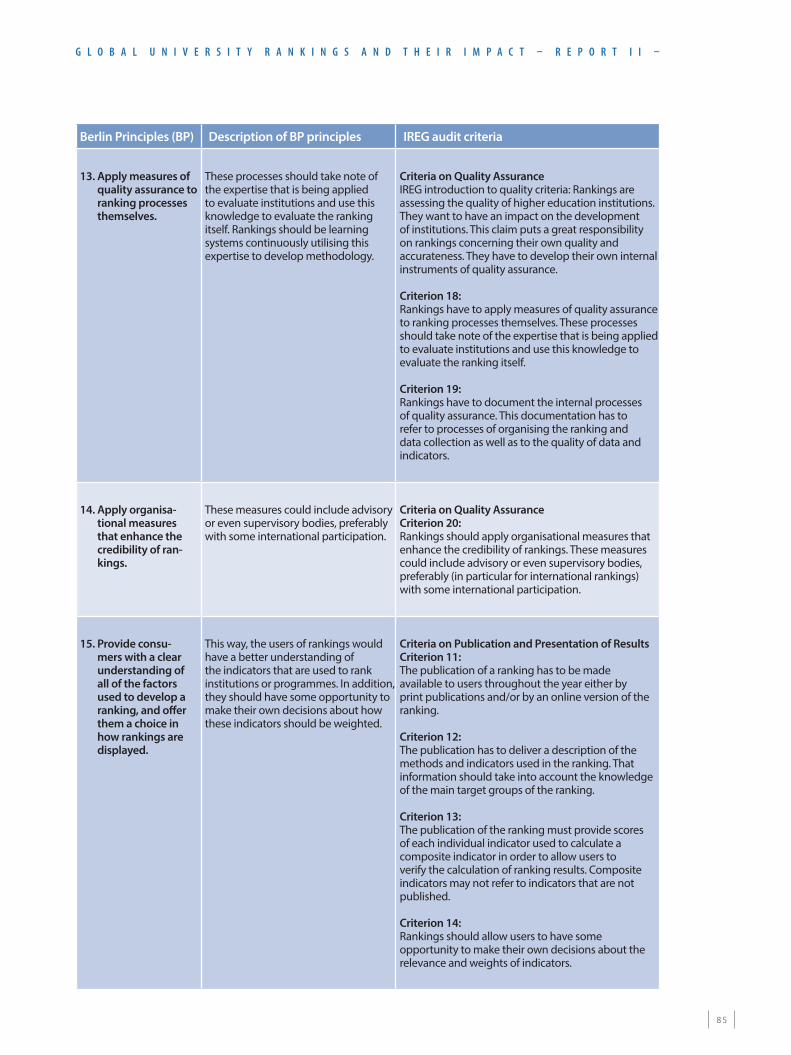
8 5
G l o b a l U n i v e r s i t y r a n k i n G s a n d t h e i r i m p a c t – r e p o r t i i –
Berlin Principles (BP) Description of BP principles IREG audit criteria
13. Apply measures of quality assurance to ranking processes themselves.
These processes should take note of the expertise that is being applied to evaluate institutions and use this knowledge to evaluate the ranking itself. Rankings should be learning systems continuously utilising this expertise to develop methodology.
Criteria on Quality Assurance IREG introduction to quality criteria: Rankings are assessing the quality of higher education institutions. They want to have an impact on the development of institutions. This claim puts a great responsibility on rankings concerning their own quality and accurateness. They have to develop their own internal instruments of quality assurance.
Criterion 18: Rankings have to apply measures of quality assurance to ranking processes themselves. These processes should take note of the expertise that is being applied to evaluate institutions and use this knowledge to evaluate the ranking itself.
Criterion 19: Rankings have to document the internal processes of quality assurance. This documentation has to refer to processes of organising the ranking and data collection as well as to the quality of data and indicators.
14. Apply organisa-tional measures that enhance the credibility of ran-kings.
These measures could include advisory or even supervisory bodies, preferably with some international participation.
Criteria on Quality Assurance Criterion 20:Rankings should apply organisational measures that enhance the credibility of rankings. These measures could include advisory or even supervisory bodies, preferably (in particular for international rankings) with some international participation.
15. Provide consu-mers with a clear understanding of all of the factors used to develop a ranking, and offer them a choice in how rankings are displayed.
This way, the users of rankings would have a better understanding of the indicators that are used to rank institutions or programmes. In addition, they should have some opportunity to make their own decisions about how these indicators should be weighted.
Criteria on Publication and Presentation of ResultsCriterion 11: The publication of a ranking has to be made available to users throughout the year either by print publications and/or by an online version of the ranking.
Criterion 12: The publication has to deliver a description of the methods and indicators used in the ranking. That information should take into account the knowledge of the main target groups of the ranking.
Criterion 13: The publication of the ranking must provide scores of each individual indicator used to calculate a composite indicator in order to allow users to verify the calculation of ranking results. Composite indicators may not refer to indicators that are not published.
Criterion 14:Rankings should allow users to have some opportunity to make their own decisions about the relevance and weights of indicators.

8 6
G l o b a l U n i v e r s i t y r a n k i n G s a n d t h e i r i m p a c t – r e p o r t i i –
Berlin Principles (BP) Description of BP principles IREG audit criteria
16. Be compiled in a way that eliminates or reduces errors in original data, and be organised and published in a way that errors and faults can be corrected.
Institutions and the public should be informed about errors that have occurred.
Criteria on Transparency and Responsiveness Criterion 15:Rankings should be compiled in a way that eliminates or reduces errors caused by the ranking and be organised and published in a way that errors and faults caused by the ranking can be corrected. This implies that such errors should be corrected within a ranking period at least in an online publication of the ranking.
Criterion 16:Rankings have to be responsive to higher education institutions included/participating in the ranking. This involves giving explanations on methods and indicators as well as an explanation of results of individual institutions.
Criterion 17:Rankings have to provide a contact address in their publication (print, online version) to which users and institutions ranked can direct questions about the methodology, feedback on errors and general comments. They have to demonstrate that they respond to questions from users.


European University Association asbl
Avenue de l’Yser 24 · 1040 Brussels, Belgium · Tel: +32 2 230 55 44 · Fax: +32 2 230 57 51 · www.eua.be · Twitter: @euatweets
E UA R E P O RT O N R A N K I N G S 2013
The European University Association (EUA) is the representative organisation of universities and national rectors’ conferences in 47 European countries. EUA plays a crucial role in the Bologna Process and in influencing EU policies on higher education, research and innovation. Thanks to its interaction with a range of other European and international organisations EUA ensures that the independent voice of European universities is heard wherever decisions are being taken that will impact on their activities.
The Association provides a unique exper tise in higher educ ation and research as well as a forum for exchange of ideas and good prac tice among universities. The results of EUA’s work are made available to members and stakeholders through conferences, seminars, website and publications.
EUA_Ranking_II_RZ_Cover in 4c.indd 2 27.03.13 11:19