Embed Size (px)
Citation preview

Global Sugar: Strategic ViewInvestment prospects in a volatile market
ww
w.lm
c.co.
uk
2017 Brochure

The world sugar market is shifting from deficit into surplus and forward positions indicate that prices are expected to be lower in the future. However, forward values remain firm relative to longer-term prices.
What does this tell us about:
• The future and the need for new investment?
• Sugar prices going forward?
In the latest of our annual strategic reports, we analyse the key issues that will shape the sugar market, focusing on investment prospects and the risks that face existing stakeholders and newcomers.
The need for new investment?
Forward curve of No. 11 raw sugar prices
No. 11 raw sugar prices since mid-2000s
2
16
17
18
19
20
21
Mar 17 Jul 17 Mar 18 Jul 18 Mar 19 Jul 19
Cent
s per
lb
0
5
10
15
20
25
30
35
Jan-05 Jan-07 Jan-09 Jan-11 Jan-13 Jan-15 Jan-17
Raw
suga
r (ce
nts/
lb)
Average price since 2000
Basis ICE No.11 futures on 31st January 2017
© 2017 LMC International. All rights reserved.

Is there a need for investment in new capacity and, if so, when and where will expansion take place?
What price is needed to bring these new investments on-line?
Will Brazil’s cost structure continue to be the long-term price setter in the world market?
To answer these questions, visibility is needed on:
• Processing capacity – do we face a capacity challenge in sugar and, if so, when will it show itself?
• Will growing health concerns mean that global consumption grows more slowly in the future?
• Which industries are best placed to expand, and which are likely to contract?
What does this all mean for sugar prices going forward?
Key issues that will shape the world sugar market
World sugar prices versus the cost of producing sugar in C/S Brazil
3
0
15
30
45
60
75
90
105
120
135
150
165
180
195
0
2
4
6
8
10
12
14
16
18
20
22
24
26
00/01 02/03 04/05 06/07 08/09 10/11 12/13 14/15 16/17
Inflation-adjusted exchange rate
Prod
uctio
n co
st (U
S ce
nts/
lb)
Ex factory costs Fobbing costsWorld raw sugar price Real exchange rate

The 2017 Report addresses these critical questions with analysis of the key issues:
1. Macro-economic influences – the commodity price cycle and sugar
2. The size/timing of a capacity crunch and what could change this?
3. Potential sources of supply to meet the future growth in demand
4. Wild cards for the world market –the EU and growing health concerns
5. The implications for world sugar prices and strategic conclusions
Supported by detailed regional reports:
Brazil – can the sugar giant recover?
EU – the end of quotas: higher sugar output & exports?
Eastern Europe – the drive to self sufficiency
Asia – will the region slip further into deficit?
NAFTA – how will potentially greater US protectionism influence sugar trade?
Africa – to what extent can production expand?
MENA – how will its growing deficit be supplied?
For answers – LMC's Global Sugar: Strategic View
4

LMC’s 2017 Global Sugar: Strategic View evaluates the impact of the macro-economy on sugar, identifies the key market drivers, forecasts production and consumption to 2030, and provides a long-run view of the future level of sugar prices.

What Global Sugar provides

Macro-economics continue to exert a major influence on sugar prices. We examine the role of key macro drivers:
Oil prices where are we in the crude oil and wider commodity price cycle?
how will the move by Petrobras to align domestic/international gasoline prices change the sugar market and the role of the Real?
Exchange rates the impact of the strong US$
Crop prices alternative crop prices and the competition for cane and beet
1. Macro‐economic influences
Brent crude oil prices
Exchange rate movements
7
0
20
40
60
80
100
120
Jan 13 Jul 13 Jan 14 Jul 14 Jan 15 Jul 15 Jan 16
US$
/bbl
30
40
50
60
70
80
90
100
110
Jan-13 Jul-13 Jan-14 Jul-14 Jan-15 Jul-15 Jan-16
Exch
ange
rate
mov
emen
t (Ja
n 20
13 =
100
)
Russia Brazil Australia India Thailand China EU

A critical issue facing the global sugar sector is when will there be a capacity crunch and when will the market send a price signal to encourage new investment.
The expected upturn in global sugar output in 2017/18 will end two years of stock drawdown and suggests that there is no imminent capacity challenge.
When will the situation change?
To help answer this question we examine:
• The location and volume of stocks, distinguishing between “free market” and “politically held” stocks
• What is happening to consumption growth and the potential impact of health concerns on demand
• The level and location of processing capacity – is it in the right place?
• The scope to grow more cane/beet in locations where surplus capacity exists
2. When will there be a capacity crunch?
Global sugar supply/demand balance
Global sugar demand versus capacity
8
-16
-12
-8
-4
0
4
8
12
130
140
150
160
170
180
190
200
00/01 04/05 08/09 12/13 16/17
Surplus/deficit (mln m
t, r.v.)Prod
ucti
on/c
onsu
mpt
ion
(mln
m
t, r
.v.)
Surplus/deficit Production Consumption
?
2000 2002 2004 2006 2008 2010 2012 2014 2016 2018
Mill
ion
tonn
es, r
aw v
alue
Total Capacity Production Consumption
?
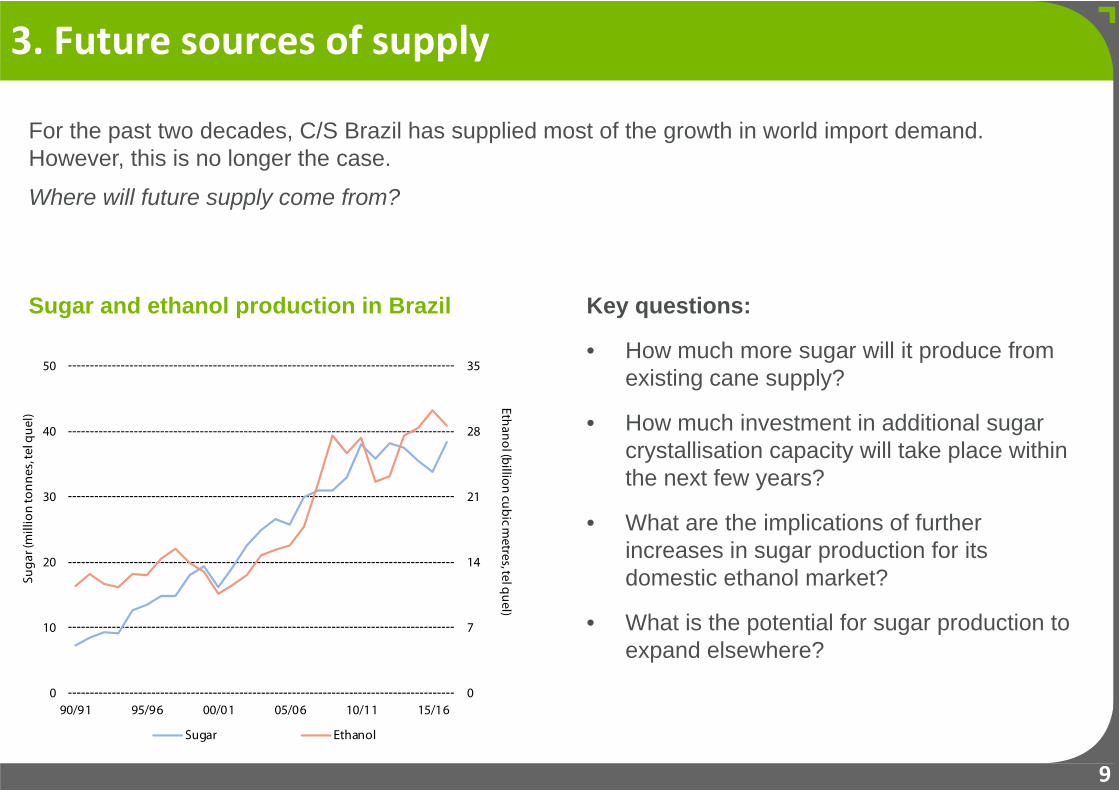
Key questions:
• How much more sugar will it produce from existing cane supply?
• How much investment in additional sugar crystallisation capacity will take place within the next few years?
• What are the implications of further increases in sugar production for its domestic ethanol market?
• What is the potential for sugar production to expand elsewhere?
3. Future sources of supply
For the past two decades, C/S Brazil has supplied most of the growth in world import demand. However, this is no longer the case.
Where will future supply come from?
Sugar and ethanol production in Brazil
9
0
7
14
21
28
35
0
10
20
30
40
50
90/91 95/96 00/01 05/06 10/11 15/16
Ethanol (billion cubic metres, tel quel)
Suga
r (m
illio
n to
nnes
, tel
que
l)
Sugar Ethanol

Rising sugar yields and industry consolidation mean that, post 2017/18, the EU will be in a position to play a much greater role in meeting global demand than it has in the past.
The big question is how much more sugar will the EU produce and export in 2017/18 and beyond? The report will consider the future dynamics that will influence the level of production in the EU and consider the implications for the world market.
4. Potential wild cards – the future role of the EU…
10
Trends in sugar yields in Australia, Brazil and France
60
70
80
90
100
110
120
130
140
150
160
1995 2000 2005 2010 2015
Inde
x (1
995=
100)
C/S Brazil Australia France

Sugar and its impact on health is becoming a growing concern in many developed and developing countries. Per capita consumption exceeds WHO guidelines in many countries. In response, governments are intervening by introducing taxes on sugar-containing products.• Will global demand grow more slowly as a result? • If so, what are the implications of this for global producers?
… and sugar and health
11
0
25
50
75
100
125
Gra
ms p
er d
ay
Daily intake @ 10% of daily calorie intake @ 5% of daily calorie intake
Examples of countries that impose or are considering imposing sugar taxes
Daily intake of sugars versus WHO and SACN recommended levels
Please note that this list is not designed to be exhaustive.
Countries with existing Countries with proposed/pendingtaxes on sugar or containing products taxes on sugar or containing products
Bulgaria IndiaChile Indonesia
France IrelandHungary PhilippinesMauritius PortugalMexico Spain
United States South AfricaUnited Kingdom
Vietnam

Supply/demand projections
A key output of the report is forecasts for production and consumption to 2030 for these regions and countries:
12
W Europe• EU• Other
E Europe• Russia• Ukraine• Other
N & C America• USA• Mexico• Cuba• Guatemala• Other
S America• Brazil• Argentina• Colombia• Other
W & C Africa• Côte d’Ivoire• Nigeria• Senegal• Other
E & S Africa• Ethiopia• Kenya• Malawi• Mozambique• South Africa• Sudan• Tanzania• Zambia• Zimbabwe• Other
MENA• Algeria• Egypt• Iran• Persian Gulf• Saudi Arabia• Syria• Turkey• Other
Indian subcontinent• India• Pakistan• Other
E Asia & Oceania• Australia• Cambodia• China • Indonesia• Laos• Myanmar• Philippines• Thailand• Vietnam• Other

Ultimately, what does all this mean for world sugar prices and the price level that is needed to encourage new investment?
We examine the key benchmarks for world sugar prices:
• The No. 11 price needed for major industries to expand to supply either their domestic or export markets.
• Ethanol parity prices in Brazil (the price at which Brazilian mills are willing to produce more ethanol at the expense of sugar).
and explain how these shift and alter the price outlook.
Opportunities & risks for your business
Building on the key findings, we develop strategic conclusions about the near, medium and long-term market to assist your decision-making.
5. World sugar prices & strategic conclusions
13

Regional reports: prospects in the key regions
Each report examines a region in depth:
• The current situation
• The outlook for supply/demand to 2030
• Policy
• Pricing in that region
14
The service also features “stand-alone” reports on each of 7 regions:
Brazil NAFTA
EU MENA
Eastern Europe Africa
Asia

Global Sugar: Strategic View – Deliverables & timing
15
What you get
• Main Report (approx. 50 pages) – electronic & 2 paper copies
• Executive Summary – PowerPoint
• Regional reports – detailed analysis on the 7 featured regions
• Key data – Excel
• Briefing on the report by senior LMC staff – by webinar or in person
• Reasonable access to LMC staff for questions on the report
When
2017 Report will be available in April

Fees & contacts
16
Fees
• The 2017 report: US$20,000
• Subscribe for 3 years (2017-2019 reports): US$15,500/year
If the briefing is conducted in person and elsewhere than LMC’s offices, travel expenses will be charged, but there will be no additional consulting fee.
For further information please contact:
Philip Digges (Global) +44 1865 [email protected]
Irma Darwis (South East Asia) +6010 221 [email protected]
Michael Schwartz (The Americas) +1 212 [email protected]
www.lmc.co.ukSmb115

LMC client list
LMC has a global client base for its sugar analysis, reports and services. Companies that have used LMC’s services include:
AB SugarAgriculture & Livestock IndustriesAl Khaleej SugarAlveanAmerican Crystal SugarAmerican Sugar RefiningArcher Daniels MidlandAsazguaAsocañaBP BiofuelsBungeCargillCoca‐ColaCopersucar CosanDowDuPontGeneral MillsGordian
Indofood Agri ResourcesIngredionItochuKhonburi SugarKraftHeinzLedesmaManuelitaMexican Sugar ChamberMitr Phol SugarMitsuiMondelēzMonsantoMSM/FeldaNordzuckerOdebrecht AgroindustrialOlam InternationalPantaleonPepsi‐ColaQueensland Sugar
RaizenRusagroSamyangSavolaSüdzuckerSuiker UnieSumitomoSyngentaTate & LyleTereosThai Roong Ruang GroupTongaat‐HulettTotalUS Dept of AgricultureUsina São MartinhoUS SugarWang KanaiWilmar SugarWorld Bank
17

Oxford4th Floor, Clarendon House
52 Cornmarket Street Oxford OX1 3HJ
UK
T +44 1865 791737F +44 1865 791739
New York1841 Broadway
New York, NY 10023USA
T +1 (212) 586-2427F +1 (212) 397-4756
Kuala LumpurB-03-19, Empire Soho
Empire SubangJalan SS16/1, SS1647500 Subang Jaya
Selangor Darul EhsanMalaysia
T +603 5611 [email protected]
Singapore16 Collyer Quay #21-00
Singapore 049318Singapore
T +65 6818 9231