Embed Size (px)
Citation preview
THE TIOGA GROUP Tio g a
Global Strategies for Success
Prepared by The Tioga Group for
Orangeburg County Economic Development Summit
November 12, 2008
Global Strategies Tio g a
2
Table of Contents
Current Trends in Transportation, Distribution & Logistics
• Global Perspective
• National Perspective
• Regional Perspective

Global Strategies Tio g a
Global Perspective: East Asia (China) is producing what the world wants to buy
Corollary: This is part of a “Mega- Trend” - Globalization
Global Strategies Tio g a
Globalization
Joseph Stiglitz, an economist and winner of the Nobel Prize defines Globalization as follows:
Globalization "is the closer integration of the countries and peoples of the world ...brought about by the enormous reduction of costs of transportation and communication, and the breaking down of artificial barriers to the flows of goods, services, capital, knowledge, and people across borders." (from Globalization and its Discontents)
4
Global Strategies Tio g a
5
Freight Transportation and Communication
• Low Cost Freight benefits:• Competition among producers/sellers• Geographic specialization• Large-Scale production• Land values
• Communication Example-ND Pulse Crops

Global Strategies Tio g a
Top 20 = 77% of Current Economic Activity
6

Global Strategies Tio g a
Emerging Economies
7
Global Strategies Tio g a
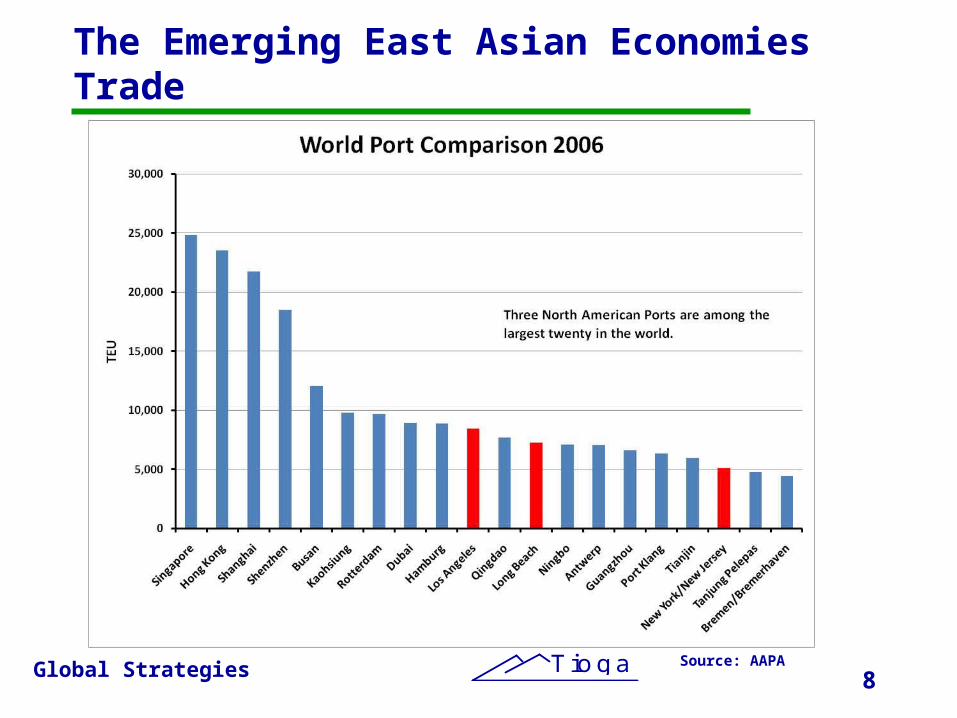
The Emerging East Asian Economies Trade
8Source: AAPA
Global Strategies Tio g a
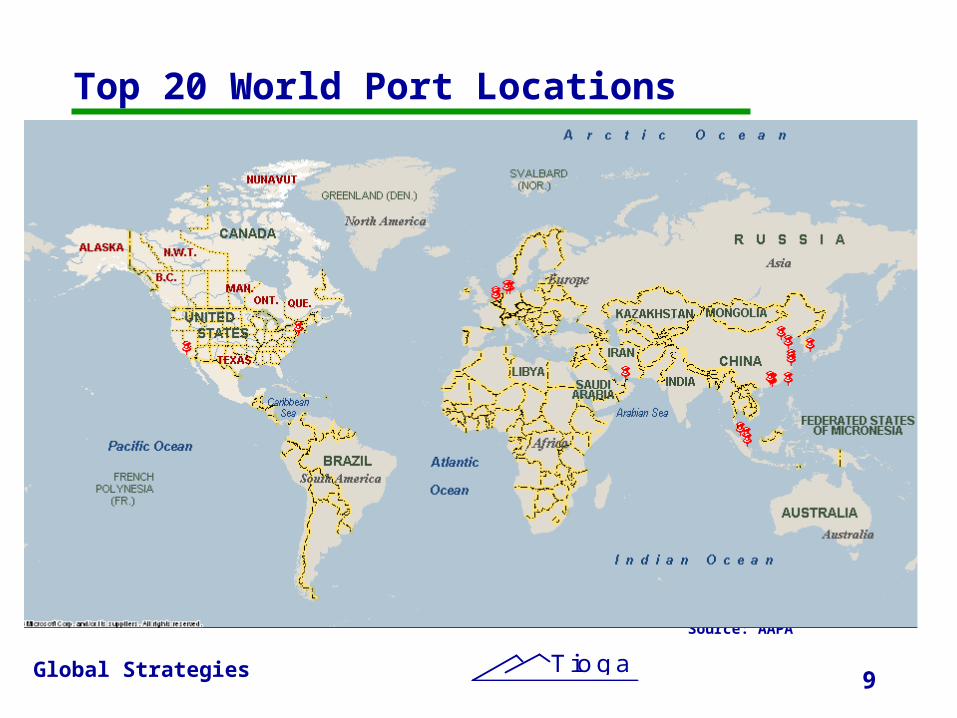
Top 20 World Port Locations
9
Source: AAPA
Global Strategies Tio g a
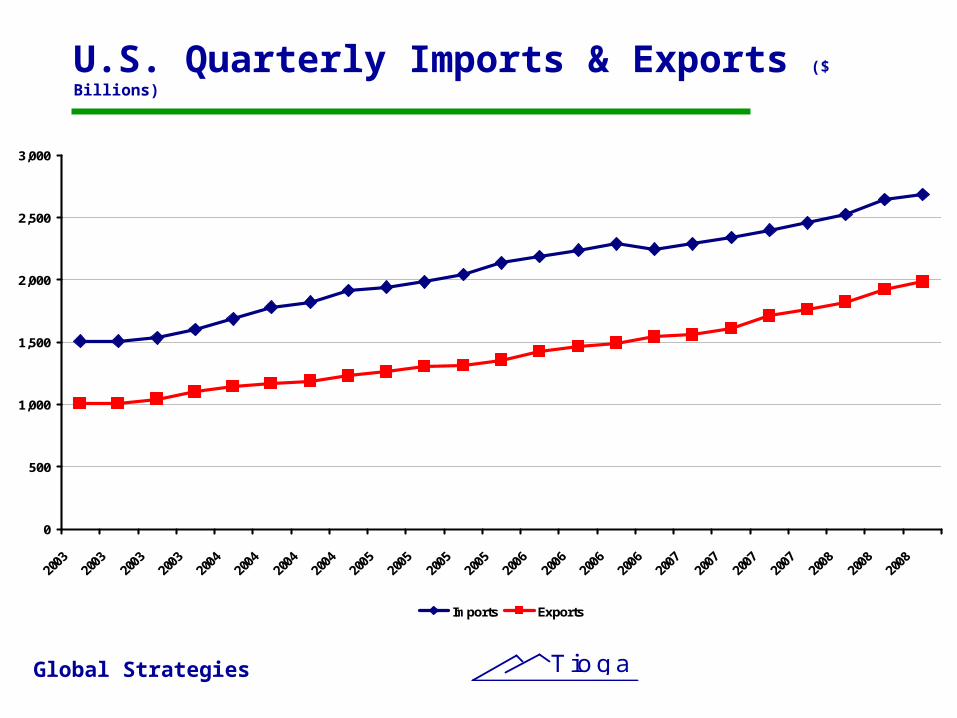
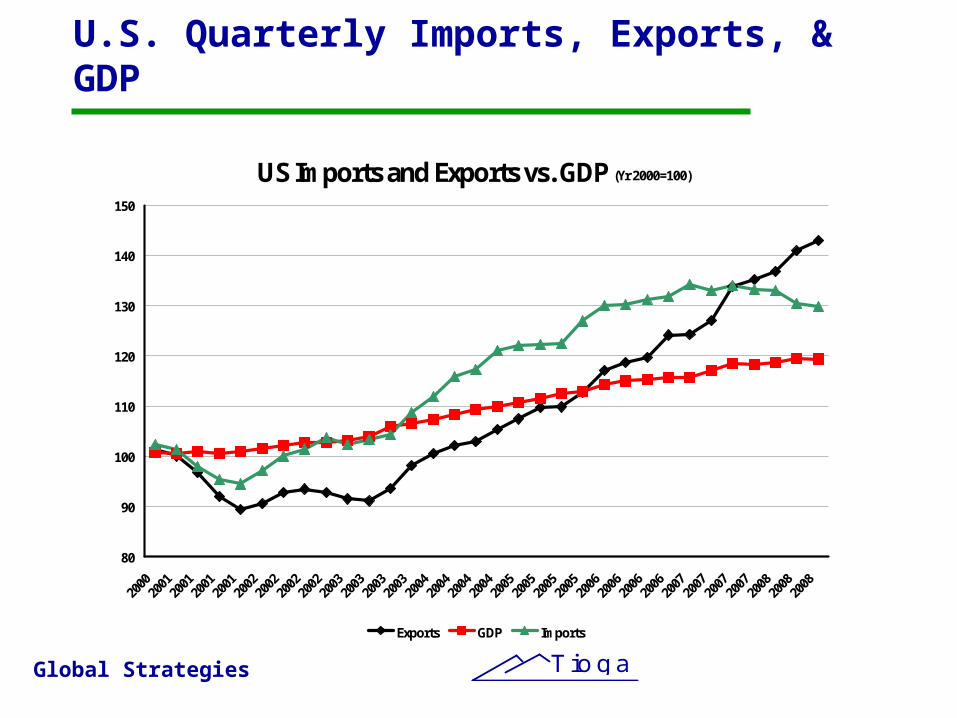
National Perspective: The U.S. involvement in the Global Economy is growing much faster than the rest of economy
Corollary: Development of new land side transportation and distribution facilities is needed
Global Strategies Tio g a
U.S. Quarterly Imports & Exports ($ Billions)
0
500
1,000
1,500
2,000
2,500
3,000
Imports Exports
Global Strategies Tio g a
U.S. Quarterly Imports, Exports, & GDP
US Imports and Exports vs. GDP (Yr 2000=100)
80
90
100
110
120
130
140
150
20002001
20012001
20012002
20022002
20022003
20032003
20032004
20042004
20042005
20052005
20052006
20062006
20062007
20072007
20072008
20082008
Exports GDP Imports
Global Strategies Tio g a
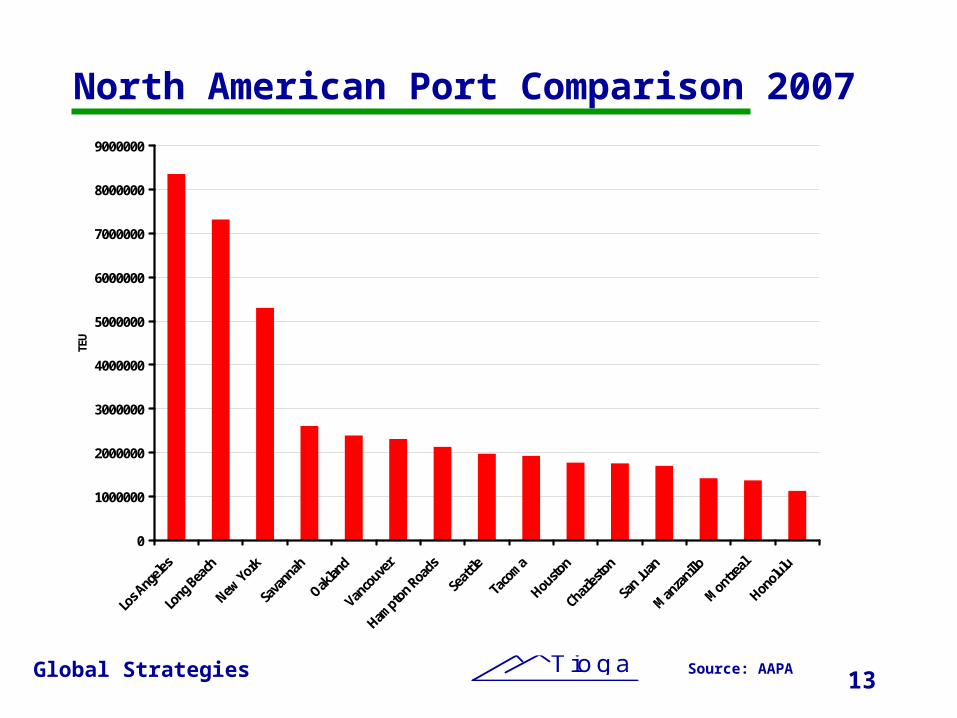
13Source: AAPA
North American Port Comparison 2007
0
1000000
2000000
3000000
4000000
5000000
6000000
7000000
8000000
9000000
Los A
ngeles
Long B
each
New York
Sava
nnah
Oakland
Vancouve
r
Hampton Roads
Seattle
Tacoma
Houston
Charlesto
n
San Ju
an
Manza
nillo
Montre
al
Honolulu
TEU
Global Strategies Tio g a
14
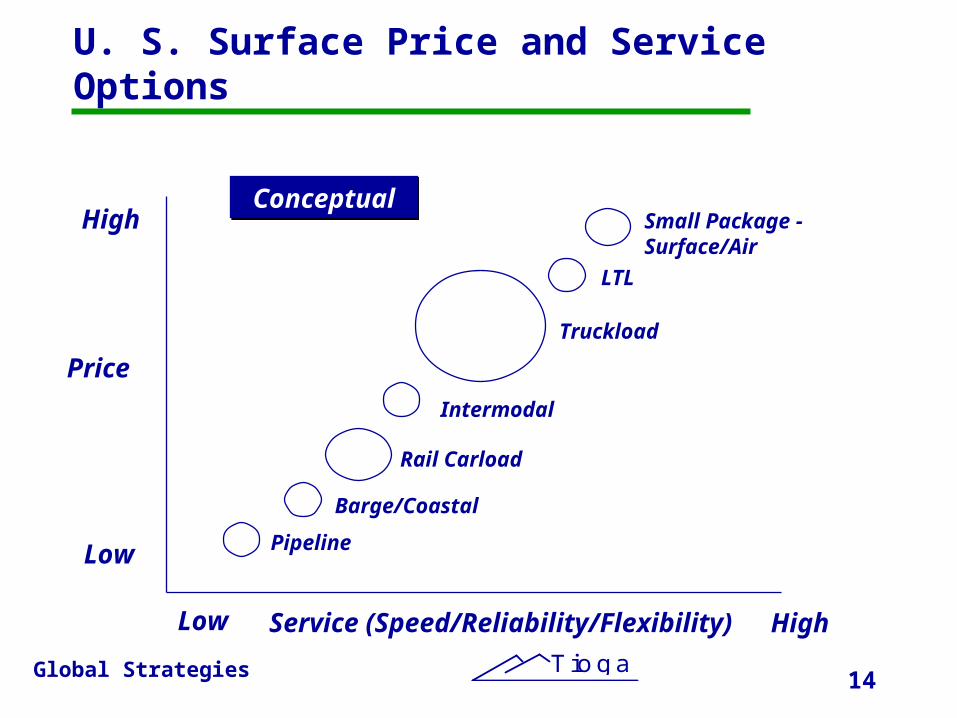
U. S. Surface Price and Service Options
Price
Service (Speed/Reliability/Flexibility)
High
Low
HighLow
ConceptualConceptual
Pipeline
Barge/Coastal
Truckload
Rail Carload
LTL
Small Package - Surface/Air
Intermodal
Global Strategies Tio g a
15
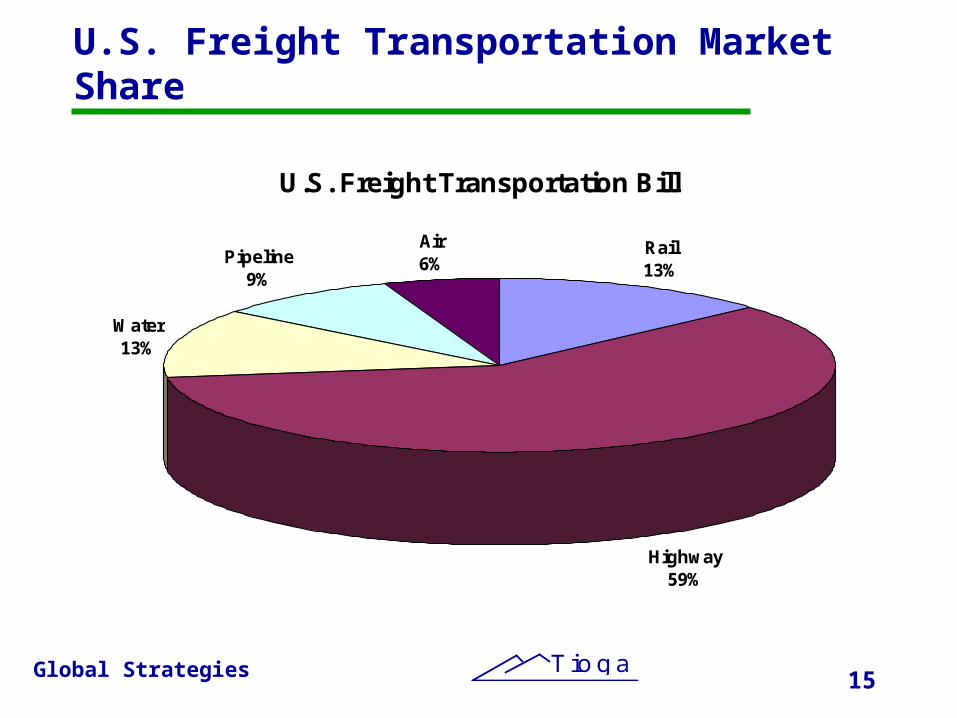
U.S. Freight Transportation Market Share
U.S. Freight Transportation Bill
Rail13%
Highway59%
Water13%
Pipeline9%
Air6%
Source: Eno Foundation, Transportation in America. 2004 Data. Includes international air and water transport.
Global Strategies Tio g a
16
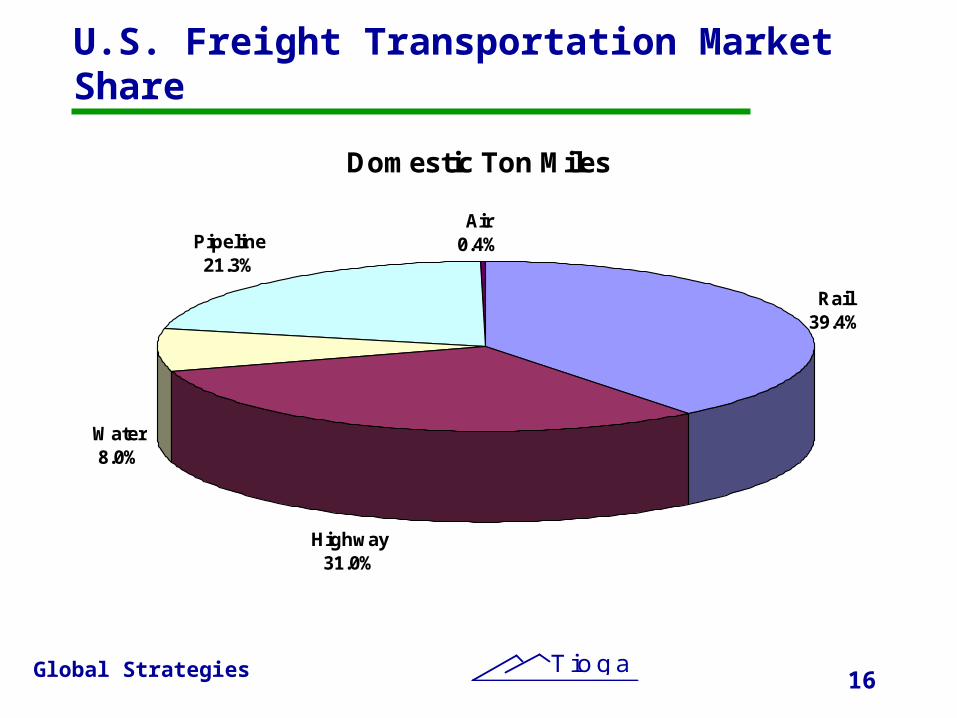
U.S. Freight Transportation Market Share
Domestic Ton Miles
Rail39.4%
Highway31.0%
Water8.0%
Pipeline21.3%
Air0.4%
Source: Eno Foundation, Transportation in America. 2003 Data.
Global Strategies Tio g a
17
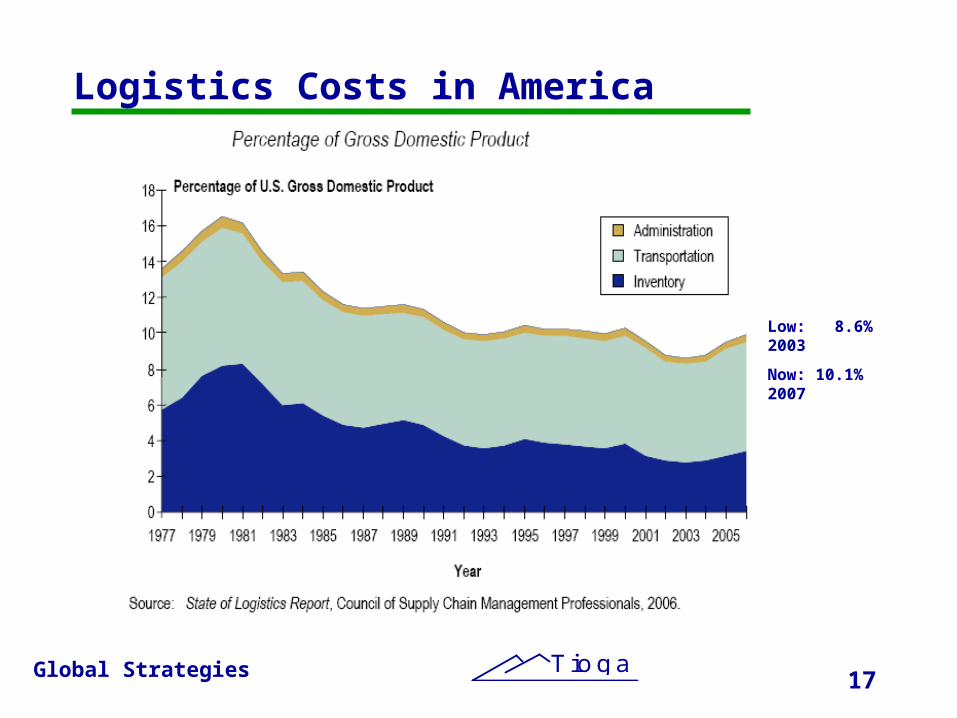
Logistics Costs in America
Low: 8.6% 2003
Now: 10.1% 2007

Global Strategies Tio g a
TransPac and Land Bridge
18
Global Strategies Tio g a
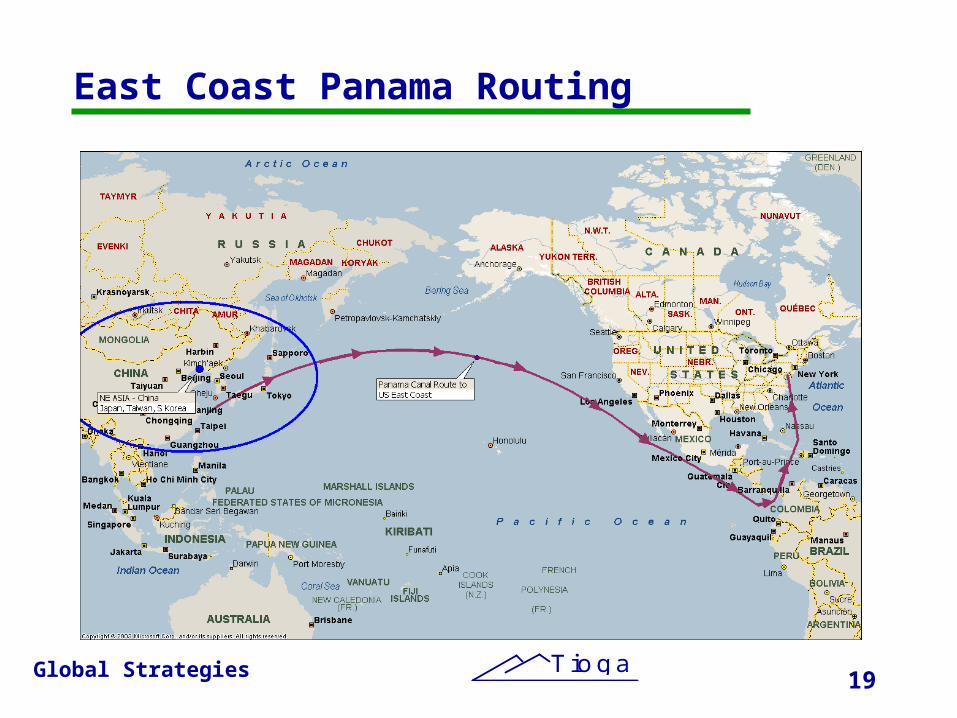
East Coast Panama Routing
19
Global Strategies Tio g a
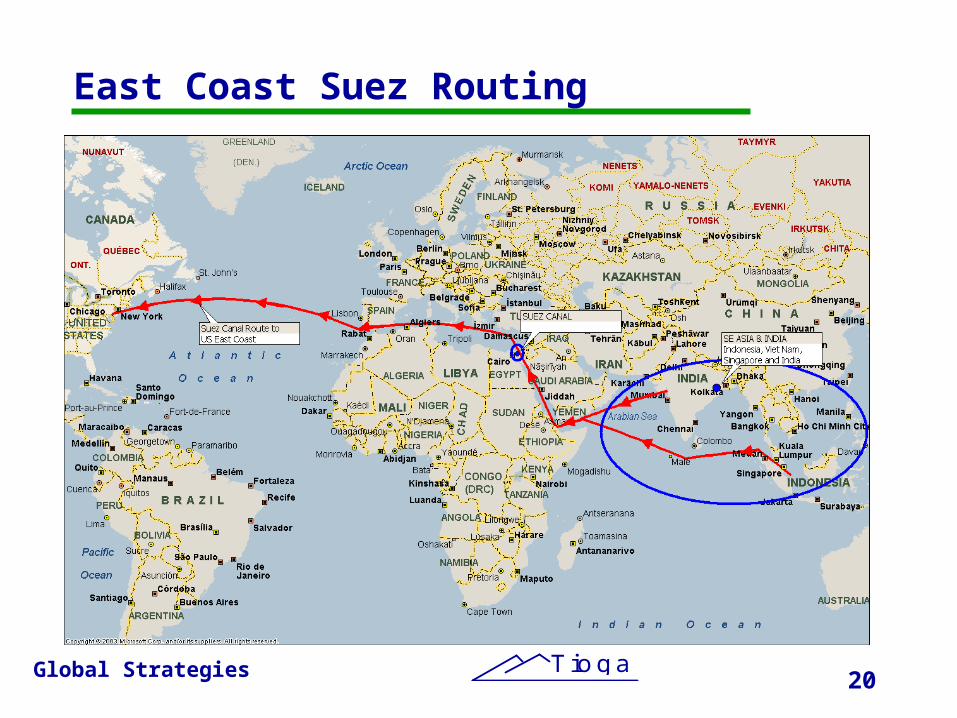
East Coast Suez Routing
20
Global Strategies Tio g a
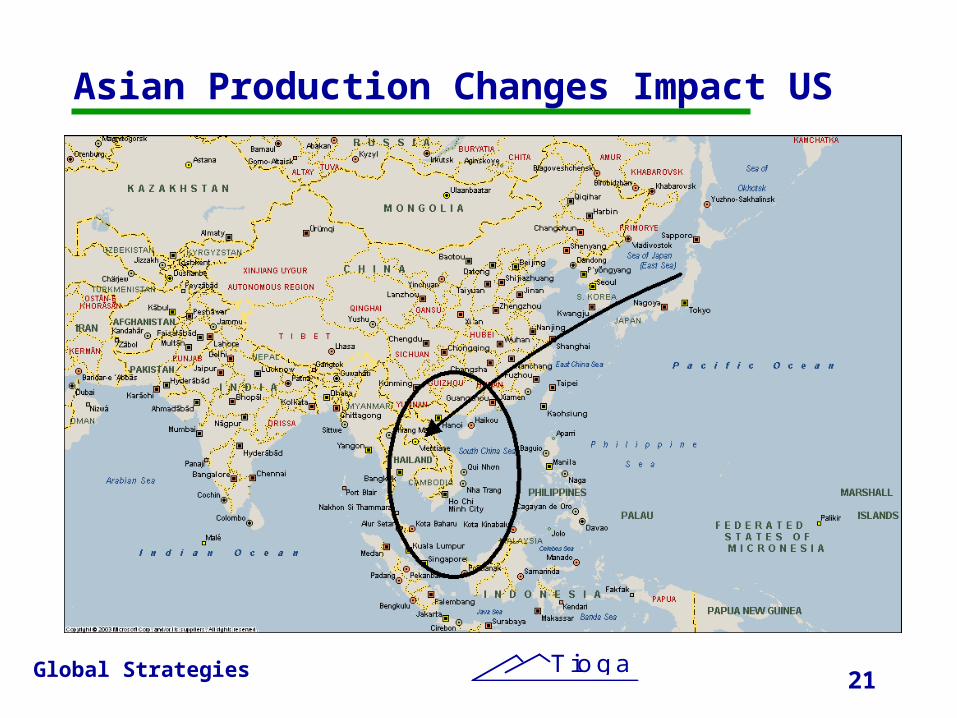
Asian Production Changes Impact US
21
Global Strategies Tio g a
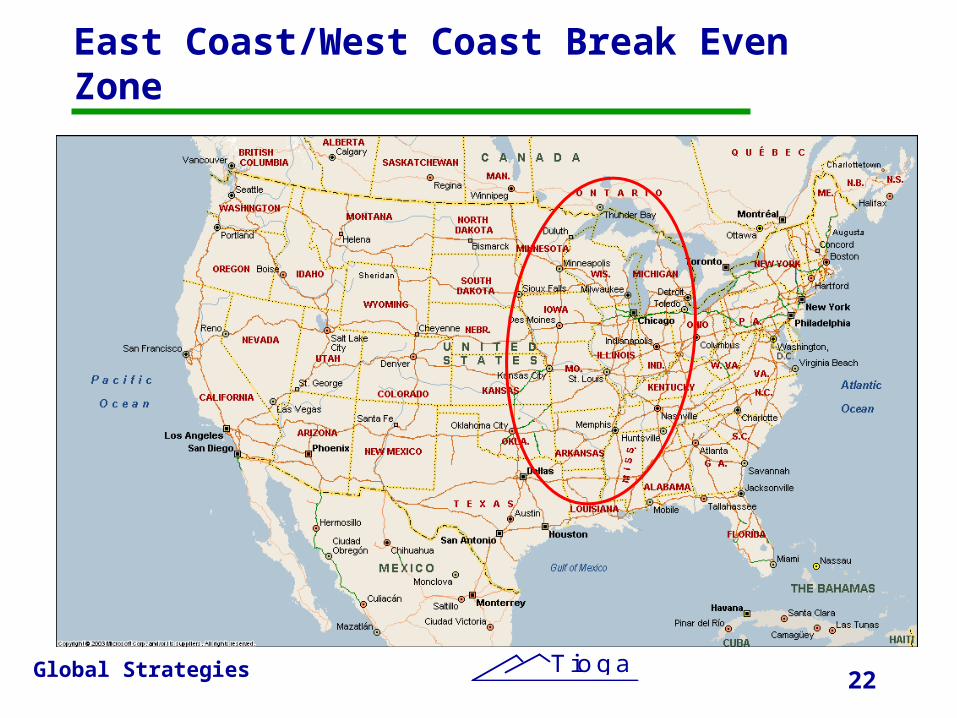
East Coast/West Coast Break Even Zone
22
Global Strategies Tio g a
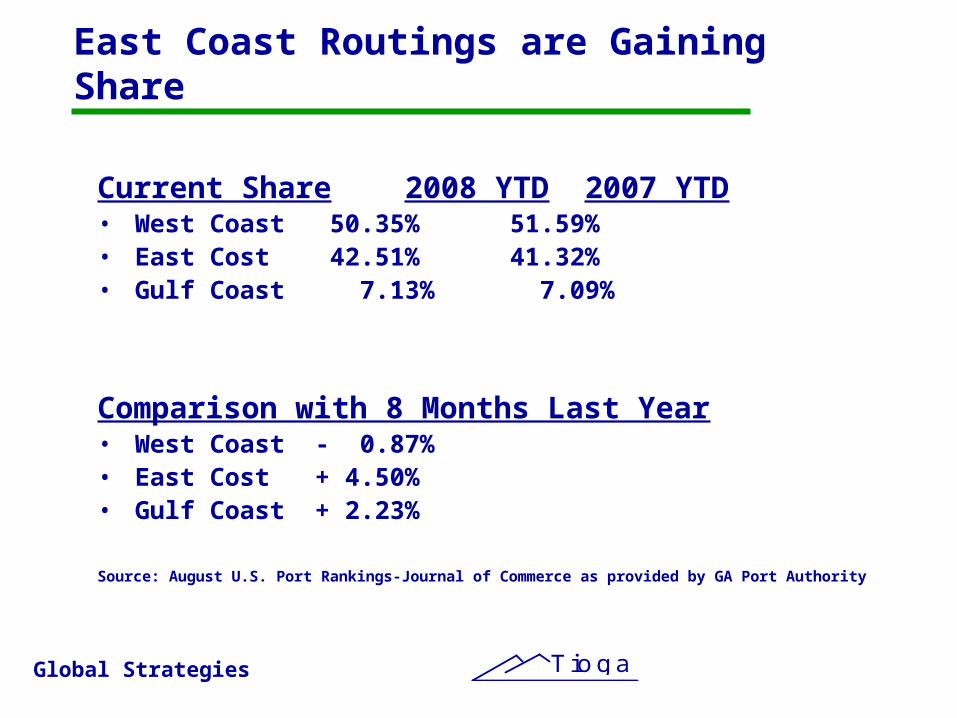
East Coast Routings are Gaining Share
Current Share 2008 YTD 2007 YTD• West Coast 50.35% 51.59%• East Cost 42.51% 41.32%• Gulf Coast 7.13% 7.09%
Comparison with 8 Months Last Year• West Coast - 0.87% • East Cost + 4.50%• Gulf Coast + 2.23%
Source: August U.S. Port Rankings-Journal of Commerce as provided by GA Port Authority
Global Strategies Tio g a
Regional Perspective: A growing southeastern economy will demand increasing international trade
Corollary: Efficiency and economic security require the region to produce and export
Global Strategies Tio g a
25
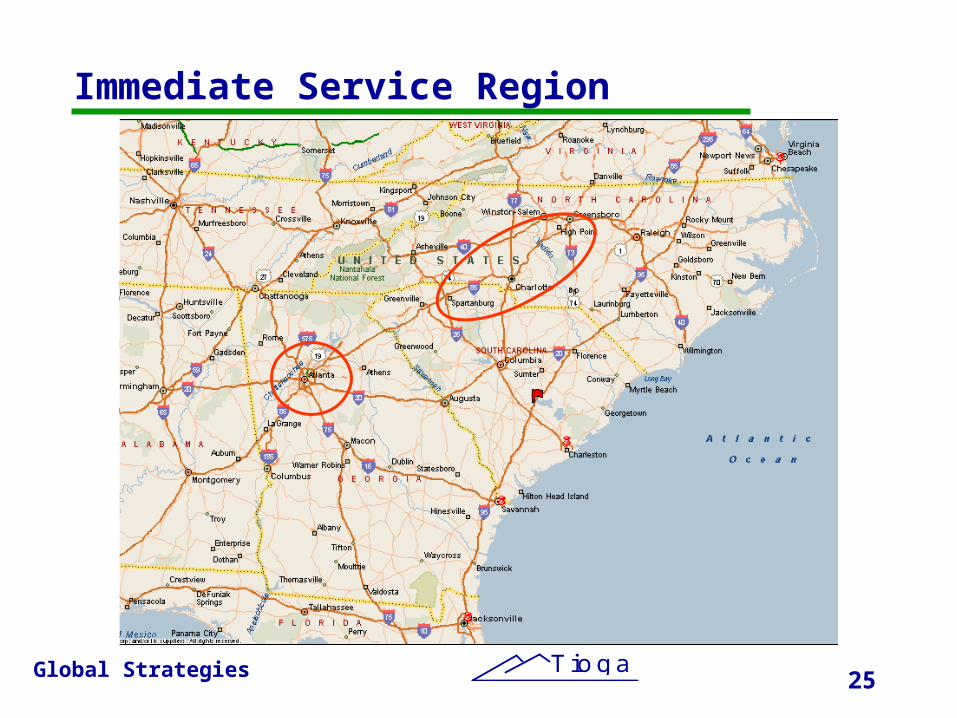
Immediate Service Region

Global Strategies Tio g a
Three Pronged Opportunity
• Distribution• Jobs in warehousing and transportation for goods
moving through the supply chain
• Manufacturing• Long term economic security for an economic region is
producing something the world wants to buy• The need to balance inbound containers provides a
competitive advantage for regional manufacturers
• Environmental• Provide port functions• More through put-less waterside foot print
26

Global Strategies Tio g a
Questions