Embed Size (px)
Citation preview

Global Standard-Setting Organization and Advocate for the Outsourcing Profession
www.IAOP.org
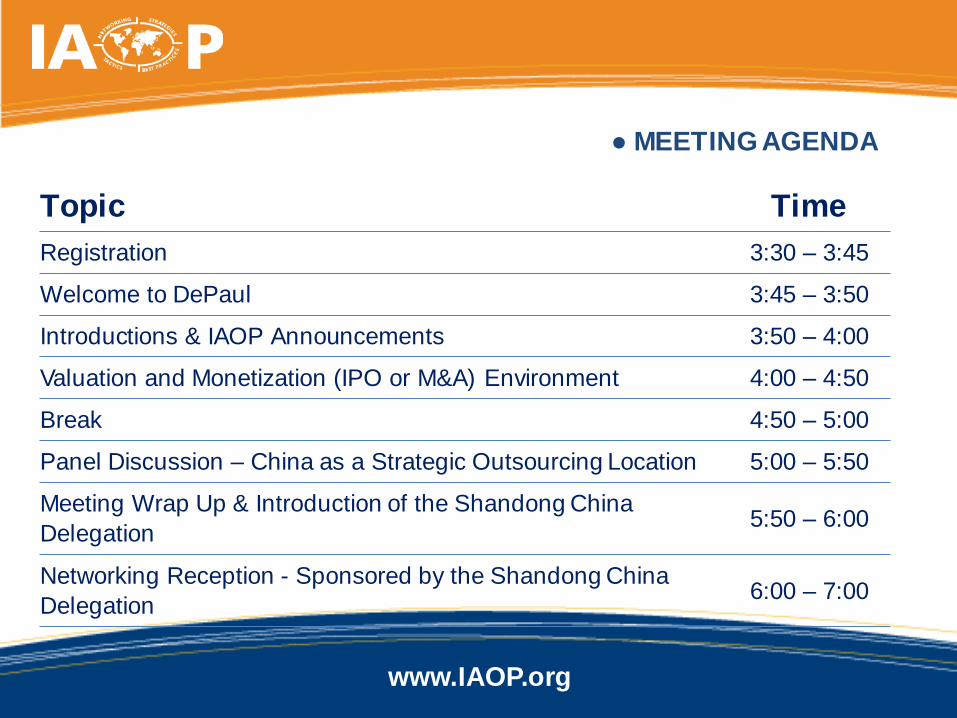
Topic Time
Registration 3:30 – 3:45
Welcome to DePaul 3:45 – 3:50
Introductions & IAOP Announcements 3:50 – 4:00
Valuation and Monetization (IPO or M&A) Environment 4:00 – 4:50
Break 4:50 – 5:00
Panel Discussion – China as a Strategic Outsourcing Location 5:00 – 5:50
Meeting Wrap Up & Introduction of the Shandong China
Delegation5:50 – 6:00
Networking Reception - Sponsored by the Shandong China
Delegation6:00 – 7:00
● MEETING AGENDA
www.IAOP.org
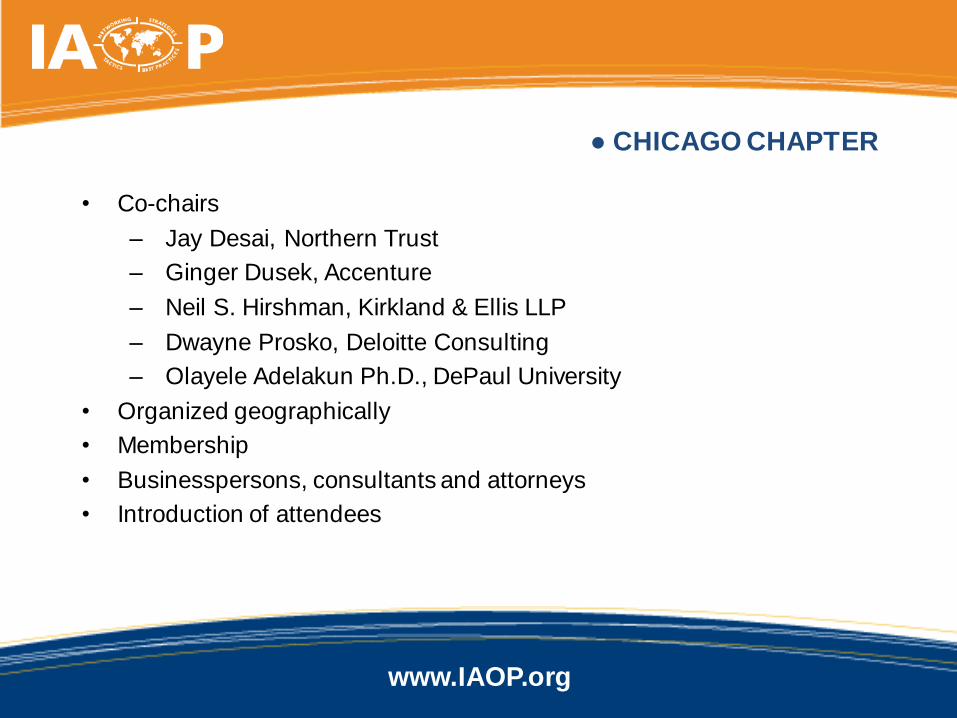
• Co-chairs
– Jay Desai, Northern Trust
– Ginger Dusek, Accenture
– Neil S. Hirshman, Kirkland & Ellis LLP
– Dwayne Prosko, Deloitte Consulting
– Olayele Adelakun Ph.D., DePaul University
• Organized geographically
• Membership
• Businesspersons, consultants and attorneys
• Introduction of attendees
● CHICAGO CHAPTER
www.IAOP.org
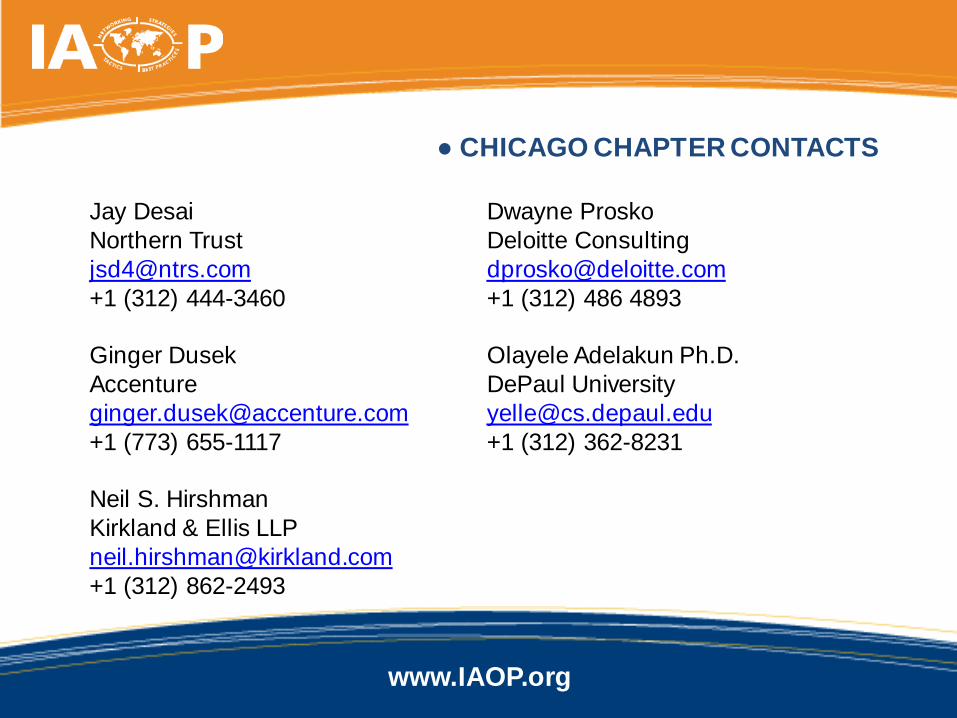
Jay Desai
Northern Trust
+1 (312) 444-3460
Ginger Dusek
Accenture
+1 (773) 655-1117
Neil S. Hirshman
Kirkland & Ellis LLP
+1 (312) 862-2493
Dwayne Prosko
Deloitte Consulting
+1 (312) 486 4893
Olayele Adelakun Ph.D.
DePaul University
+1 (312) 362-8231
● CHICAGO CHAPTER CONTACTS
www.IAOP.org
• Quarterly Meeting – Generally Jan., Apr., Jul., Oct.
• Next Chicago Meeting:
• Date: October 17, 2013
• Topic: “Evaluating Emerging Markets for Outsourcing”
• Location: TBD
• Planning and Hosting Future Meetings
• Evaluation Forms
● CHICAGO CHAPTER UPDATE
www.IAOP.org
● REPORT ON CHICAGO APRIL 18 MEETING
• Held in conjunction with the Governance Chapter at the Chicago office of
Kirkland & Ellis LLP.
• Case study and panel discussion on “Beyond SLAs: Balanced Scorecard and more.” Followed by a workshop.
– Moderator:
Alan Hanson, Neo Group
– Panelists:
Craig Ostrander, Applied MaterialsLynne Peckham, Northern TrustShuchita Singh, Northern Trust
• Networking reception sponsored by Kirkland & Ellis LLP
www.IAOP.org
● ABOUT IAOP
85% of IAOP members credit IAOP for improved outsourcing
outcomes at their organizations and 93% of IAOP’s Certified
Outsourcing Professionals® (COPs) say that the designation has
had a positive impact on their careers.
With a global community of more than 120,000 members and affiliates
worldwide, IAOP is the leading professional association for organizations
and individuals involved in transforming the world of business through outsourcing, offshoring and shared services. Our client-side members
are, on average, responsible for $60 million per year of outsourcing
spending with some overseeing outsourcing programs in the billions of
dollars.
www.IAOP.org
● MEMBER SERVICES
Global Chapter Network – Through its 50+ active and expansive
chapters, IAOP members share their expertise and find knowledge on best practices for specific industry segments, topics and geographic areas.
Conferences & Events – IAOP hosts the world’s best-known and most
highly-respected executive conferences on the topic of outsourcing,
including The Outsourcing World Summit®.
Outsourcing Professional Family of Certifications (OPCF) –
IAOP’s trainings and certifications are the industry’s de facto.
Pulse – The official publication of IAOP features in-depth coverage of the
industry, issues, trends, geographies and vertical sectors and functions; thought leadership and case studies, probing Q&As, C-level interviews and
profiles.
www.IAOP.org
● MEMBER SERVICES
IAOP’s Knowledge Center – This online repository houses more than 1,000
articles, including chapter meeting presentations, conference proceedings, industry whitepapers, research articles and more.
Value Health Check Survey – This web-based diagnostic tool provides
outsourcing customers and service providers with rapid insights to realizing
outsourcing value.
BestOutsourcingJobs.com – Companies seeking the best talent for
outsourcing jobs, as well as professionals looking for employment opportunities,
will benefit from this IAOP member service.
GlobalSupplyRiskMonitor.com – This web-based product enables clients to
monitor, predict and manage the various risks in their service supply chain across
countries, cities and suppliers, in real time.

www.IAOP.org
Be part of the first and only global, professional membership-based organization to establish standards for customers, providers and advisors of outsourced service.
As one IAOP Corporate Member put it:“It’s a tremendous one-stop shop for all things outsourcing!”
Go to https://www.IAOP.org/PMregistration and join today! When asked for an “offer code,” please enter: IAOP-PM-0515.
SPECIAL OFFER FOR ATTENDEES!
Become an IAOP Professional Member at
20% off the Regular Fee of $345/Year ($276/Year Net Fee)
www.IAOP.org
● UPCOMING CHAPTER MEETINGS
August 2013August 20 - Voice of the Customer chapter webinar
August 28 - Bangalore chapter meetingAugust 28 - Southern California chapter meeting
September 2013September 4 - Nordic chapter meeting
September 5 - Minnesota chapter meetingSeptember 18 - New England chapter meeting
Watch for upcoming meetings of the Governance Chapter,Outsourcing Tools & Technology Chapter and numerous chapters
on the West Coast!
IAOP Professional Members
may attend an unlimited
number of chapter meetings.
Associate Members may
attend up to two chapter
meetings as IAOP’s guest.
Go to the chapters’ page at
www.IAOP.org/chapters for
meeting details and to
register.
www.IAOP.org
● AWARDS PROGRAMS
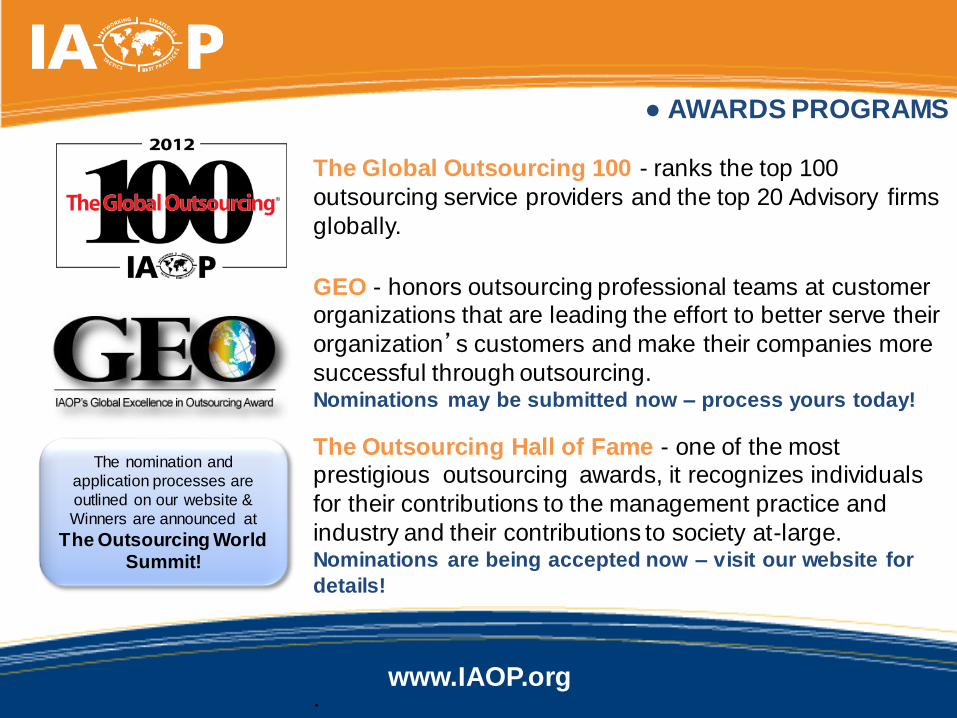
The Global Outsourcing 100 - ranks the top 100
outsourcing service providers and the top 20 Advisory firms
globally.
GEO - honors outsourcing professional teams at customer organizations that are leading the effort to better serve their
organization’s customers and make their companies more
successful through outsourcing.Nominations may be submitted now – process yours today!
The Outsourcing Hall of Fame - one of the most prestigious outsourcing awards, it recognizes individuals
for their contributions to the management practice and
industry and their contributions to society at-large.Nominations are being accepted now – visit our website for
details!
.
The nomination and
application processes are
outlined on our website &
Winners are announced at
The Outsourcing World Summit!
www.IAOP.org
● CONFERENCES AND EVENTS
Process your registrations today for:
The 2013 Asia-Pacific Outsourcing World Summit®October 20-23, 2013Malaysia
The 2013 Latin America Outsourcing SummitDecember 3-5, 2013
InterContinental Hotel
San Jose, Costa Rica
The 2014 Outsourcing World Summit®February 17-19, 2014 – Disney’s Contemporary ResortLake Buena Vista, Florida
www.IAOP.org
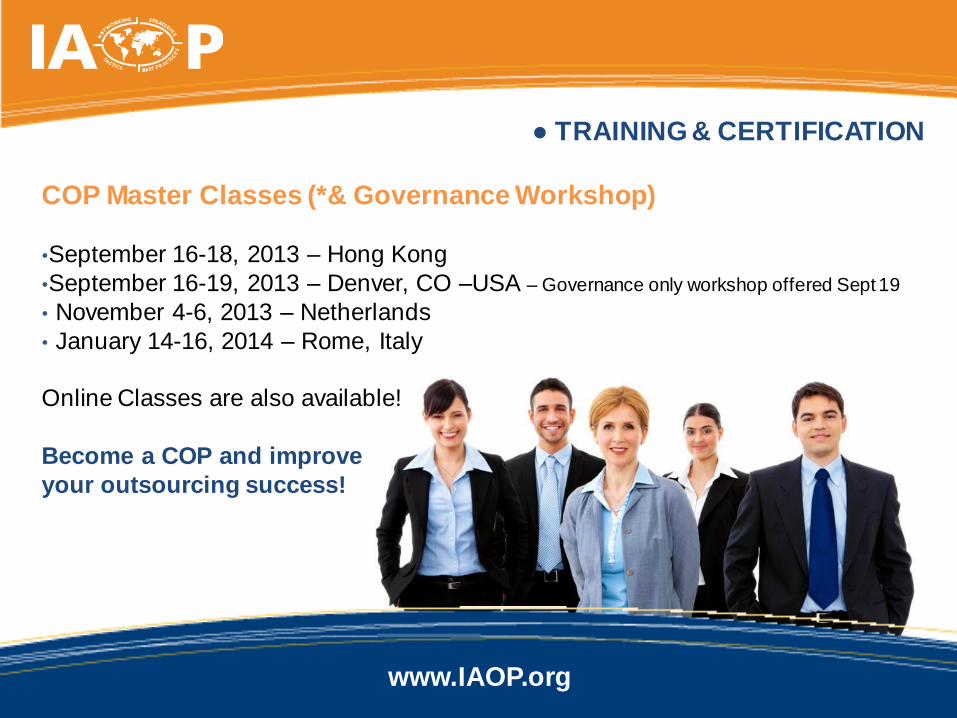
● TRAINING & CERTIFICATION
COP Master Classes (*& Governance Workshop)
•September 16-18, 2013 – Hong Kong
•September 16-19, 2013 – Denver, CO –USA – Governance only workshop offered Sept 19
• November 4-6, 2013 – Netherlands
• January 14-16, 2014 – Rome, Italy
Online Classes are also available!
Become a COP and improve
your outsourcing success!
www.IAOP.org
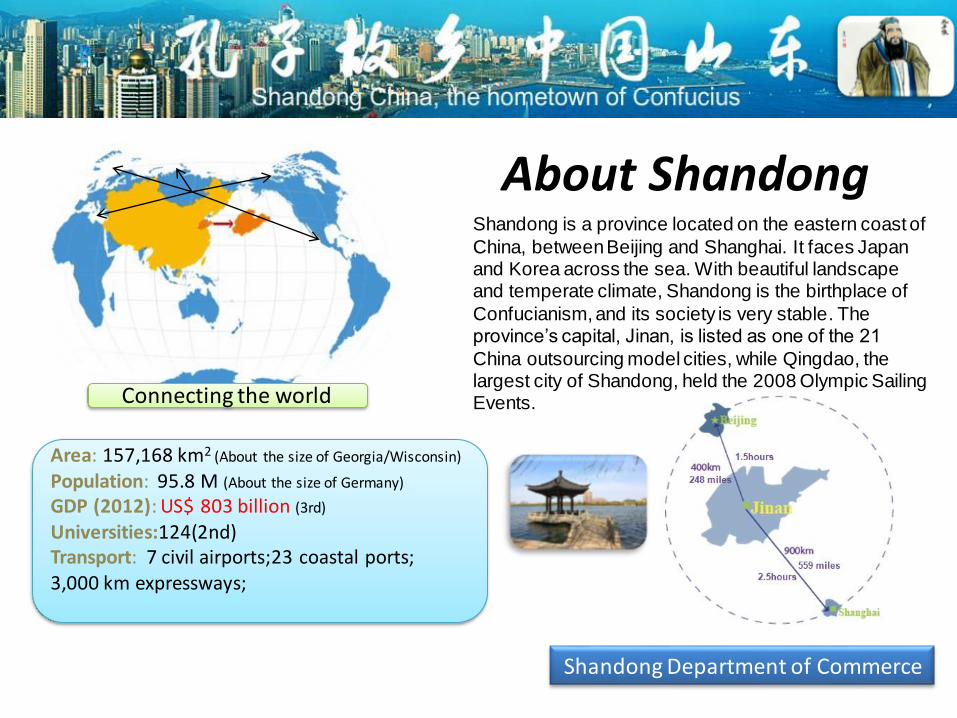
Area: 157,168 km2 (About the size of Georgia/Wisconsin)
Population: 95.8 M (About the size of Germany)
GDP (2012): US$ 803 billion (3rd)
Universities:124(2nd)Transport: 7 civil airports;23 coastal ports; 3,000 km expressways;
About ShandongShandong is a province located on the eastern coast of
China, between Beijing and Shanghai. It faces Japan and Korea across the sea. With beautiful landscape and temperate climate, Shandong is the birthplace of
Confucianism, and its society is very stable. The province’s capital, Jinan, is listed as one of the 21
China outsourcing model cities, while Qingdao, the largest city of Shandong, held the 2008 Olympic Sailing Events.
Shandong Department of Commerce
Connecting the world
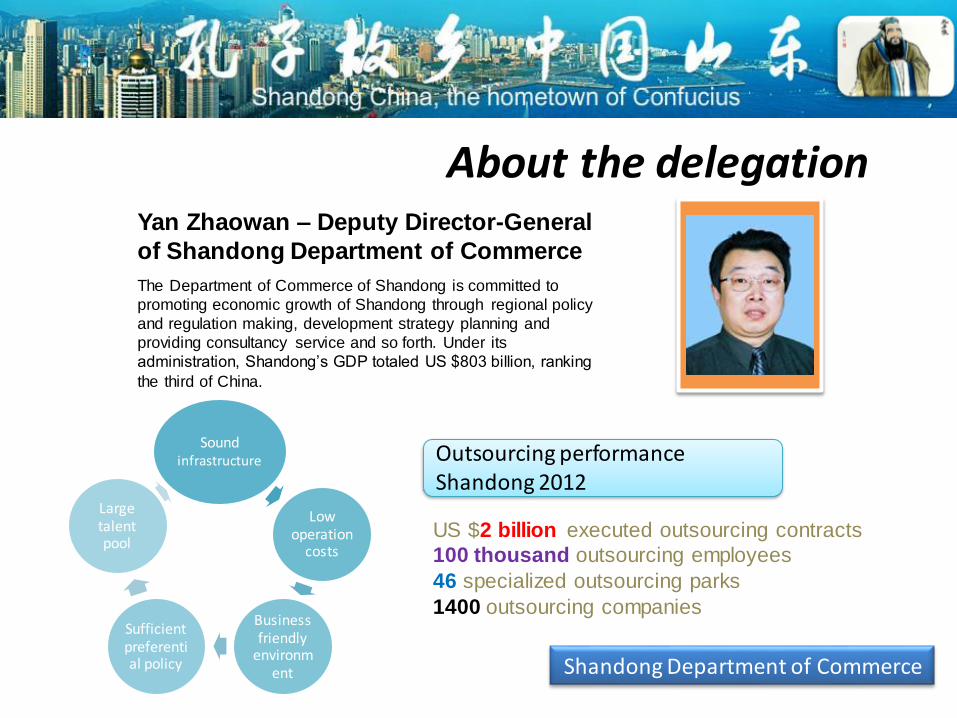
Outsourcing performance Shandong 2012
US $2 billion executed outsourcing contracts
100 thousand outsourcing employees
46 specialized outsourcing parks
1400 outsourcing companies
About the delegation
Shandong Department of Commerce
Yan Zhaowan – Deputy Director-General
of Shandong Department of Commerce
The Department of Commerce of Shandong is committed to
promoting economic growth of Shandong through regional policy
and regulation making, development strategy planning and
providing consultancy service and so forth. Under its
administration, Shandong’s GDP totaled US $803 billion, ranking
the third of China.
Sound infrastructure
Low operation
costs
Business friendly
environment
Sufficient preferential policy
Large talent pool
www.IAOP.org
Valuation and Monetization
(IPO or M&A) Environment
Keynote Speaker:
Tina Longfield, Managing Director and
Global Head of Jefferies’ Technology Services Group
July 2013 / Confidential
Jefferies LLC
Member SIPC
“Outsourcing: How To Create Value”
Jef f eries LLC July 2013 /
Table of Contents
Introduction 1
Basics of Valuation 4
What Drives Value? 8
Ways To Monetize Value 15
Global Outsourcing Market 21
i

Jef f eries LLC July 2013 /
Introduction
1
Jef f eries LLC July 2013 /
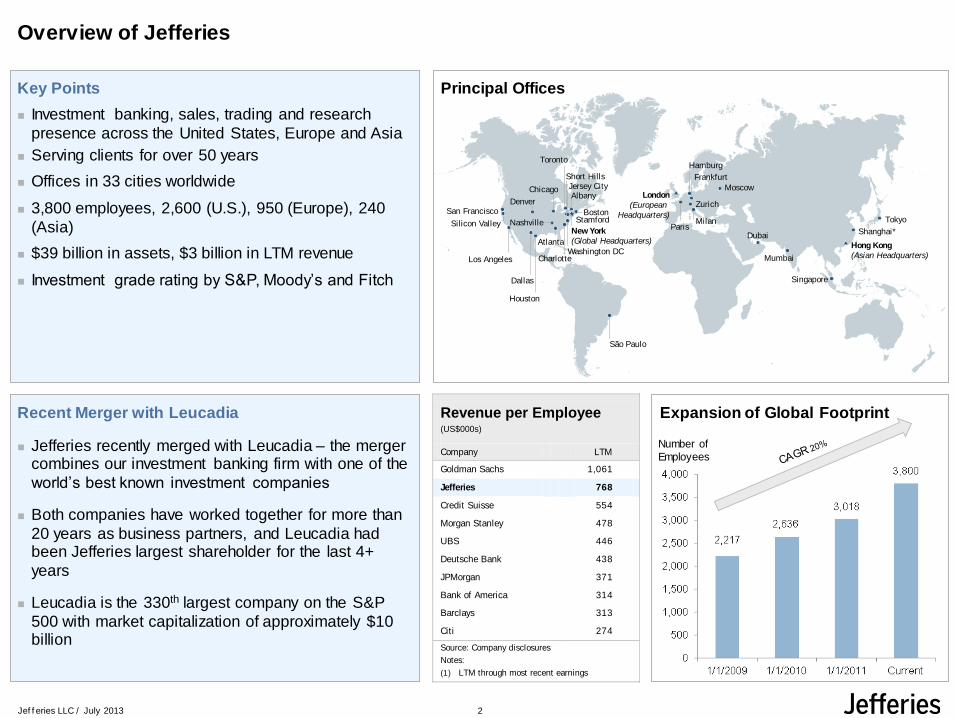
Overview of Jefferies
Principal Offices
Expansion of Global Footprint
Number of
Employees
Revenue per Employee (US$000s)
Company LTM
Goldman Sachs 1,061
Jefferies 768
Credit Suisse 554
Morgan Stanley 478
UBS 446
Deutsche Bank 438
JPMorgan 371
Bank of America 314
Barclays 313
Citi 274
Source: Company disclosures
Notes:
(1) LTM through most recent earnings
Key Points
Investment banking, sales, trading and research
presence across the United States, Europe and Asia
Serving clients for over 50 years
Offices in 33 cities worldwide
3,800 employees, 2,600 (U.S.), 950 (Europe), 240
(Asia)
$39 billion in assets, $3 billion in LTM revenue
Investment grade rating by S&P, Moody’s and Fitch
Recent Merger with Leucadia
Jefferies recently merged with Leucadia – the merger combines our investment banking firm with one of the
world’s best known investment companies
Both companies have worked together for more than
20 years as business partners, and Leucadia had been Jefferies largest shareholder for the last 4+
years
Leucadia is the 330th largest company on the S&P
500 with market capitalization of approximately $10 billion
StamfordBoston
Jersey CityChicago
Charlotte
Houston
Dallas
Los Angeles
Silicon Valley
San Francisco
Short Hills
Denver
Nashville
AtlantaWashington DC
Albany
New York
(Global Headquarters)
Tokyo
Shanghai*
Singapore
Mumbai
Hong Kong
(Asian Headquarters)
London
(European
Headquarters)
Frankfurt
Zurich
MilanParis
Hamburg
Dubai
São Paulo
Toronto
Moscow
2
Jef f eries LLC July 2013 /
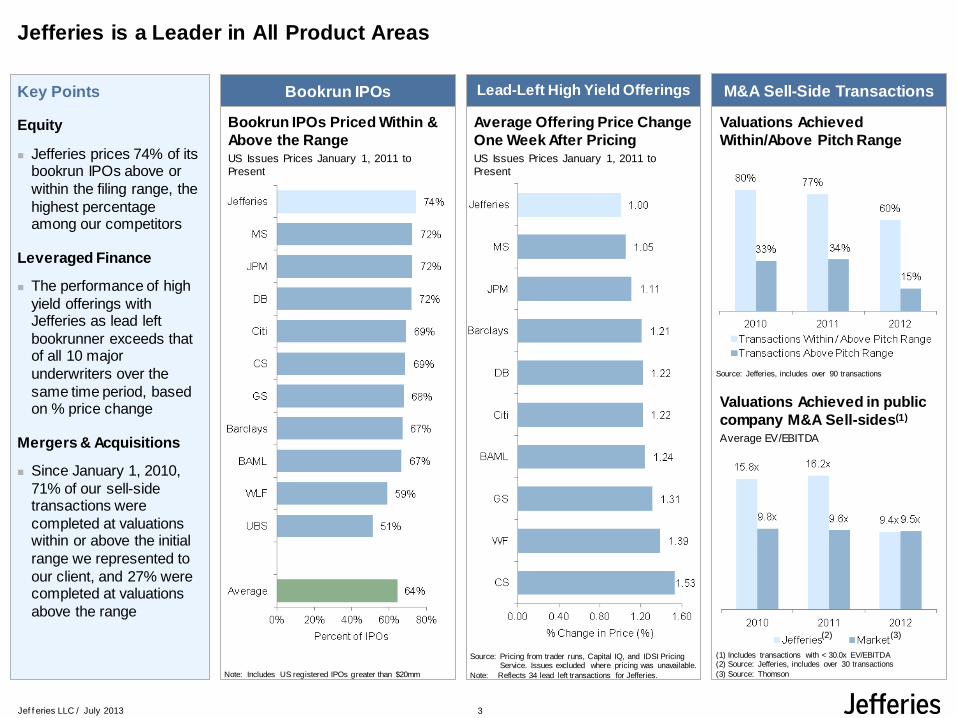
Jefferies is a Leader in All Product Areas
Key Points
Equity
Jefferies prices 74% of its bookrun IPOs above or
within the filing range, the
highest percentage among our competitors
Leveraged Finance
The performance of high
yield offerings with Jefferies as lead left
bookrunner exceeds that of all 10 major
underwriters over the
same time period, based on % price change
Mergers & Acquisitions
Since January 1, 2010,
71% of our sell-side transactions were
completed at valuations within or above the initial
range we represented to
our client, and 27% were completed at valuations
above the range
Valuations Achieved
Within/Above Pitch Range
Valuations Achieved in public
company M&A Sell-sides(1)
Average EV/EBITDA
Average Offering Price Change
One Week After PricingUS Issues Prices January 1, 2011 to
Present
Source: Pricing from trader runs, Capital IQ, and IDSI Pricing Service. Issues excluded where pricing was unavailable.
Note: Reflects 34 lead left transactions for Jefferies.
Source: Jefferies, includes over 90 transactions
(1) Includes transactions with < 30.0x EV/EBITDA(2) Source: Jefferies, includes over 30 transactions
(3) Source: Thomson
(2) (3)
Lead-Left High Yield Offerings M&A Sell-Side Transactions
Bookrun IPOs Priced Within &
Above the RangeUS Issues Prices January 1, 2011 to
Present
Note: Includes US registered IPOs greater than $20mm
Bookrun IPOs
3

Jef f eries LLC July 2013 /
Basics of Valuation
4
Jef f eries LLC July 2013 /
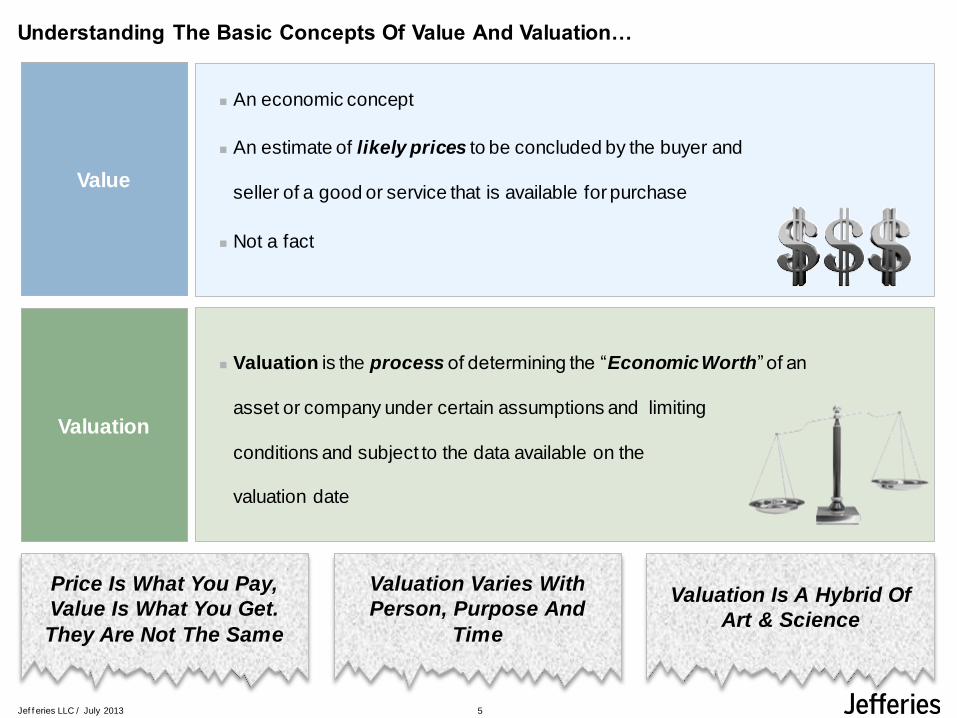
Understanding The Basic Concepts Of Value And Valuation…
Valuation is the process of determining the “Economic Worth” of an
asset or company under certain assumptions and limiting
conditions and subject to the data available on the
valuation date
An economic concept
An estimate of likely prices to be concluded by the buyer and
seller of a good or service that is available for purchase
Not a fact
Value
Valuation
Valuation Varies With
Person, Purpose And
Time
Valuation Is A Hybrid Of
Art & Science
Price Is What You Pay,
Value Is What You Get.
They Are Not The Same
5
Jef f eries LLC July 2013 /
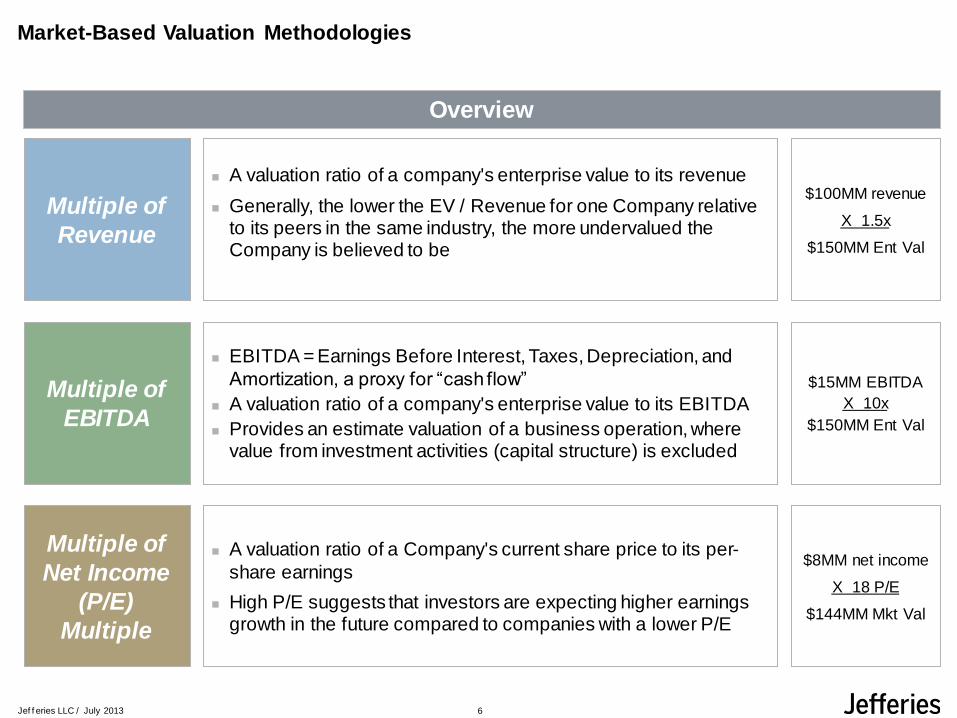
Market-Based Valuation Methodologies
Multiple of
Revenue
Multiple of
EBITDA
Multiple of
Net Income
(P/E)
Multiple
A valuation ratio of a company's enterprise value to its revenue
Generally, the lower the EV / Revenue for one Company relative to its peers in the same industry, the more undervalued the Company is believed to be
EBITDA = Earnings Before Interest, Taxes, Depreciation, and
Amortization, a proxy for “cash flow”
A valuation ratio of a company's enterprise value to its EBITDA
Provides an estimate valuation of a business operation, where value from investment activities (capital structure) is excluded
A valuation ratio of a Company's current share price to its per-
share earnings
High P/E suggests that investors are expecting higher earnings growth in the future compared to companies with a lower P/E
Overview
$100MM revenue
X 1.5x
$150MM Ent Val
$15MM EBITDA
X 10x
$150MM Ent Val
$8MM net income
X 18 P/E
$144MM Mkt Val
6
Jef f eries LLC July 2013 /
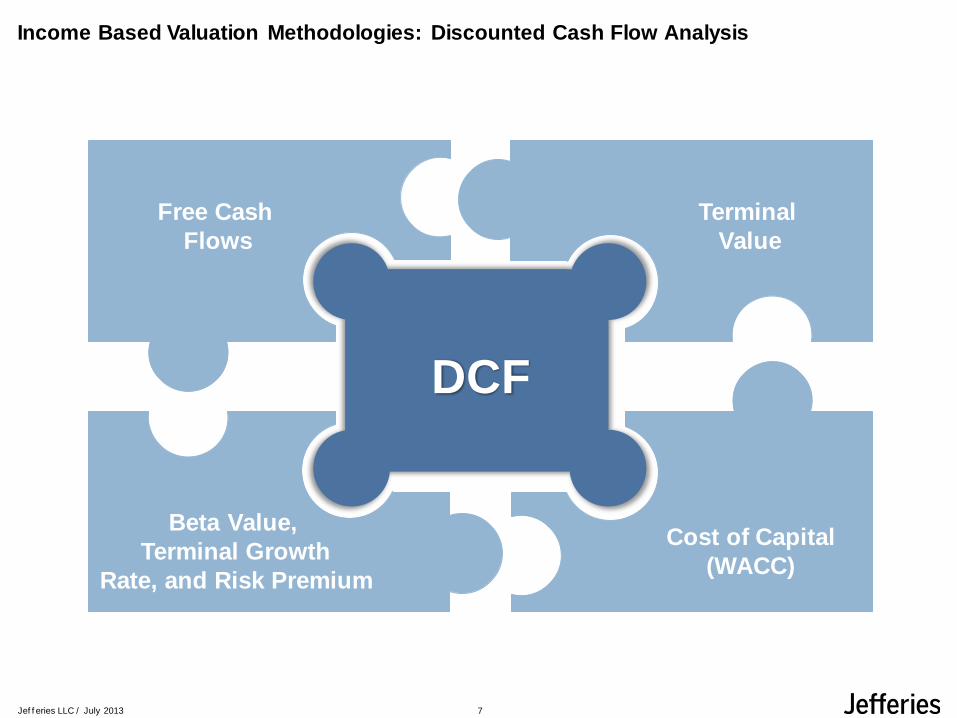
Income Based Valuation Methodologies: Discounted Cash Flow Analysis
Free Cash
Flows
Beta Value,
Terminal Growth
Rate, and Risk Premium
Terminal
Value
Cost of Capital
(WACC)
DCF
7

Jef f eries LLC July 2013 /
What Drives Value?
8
Jef f eries LLC July 2013 /
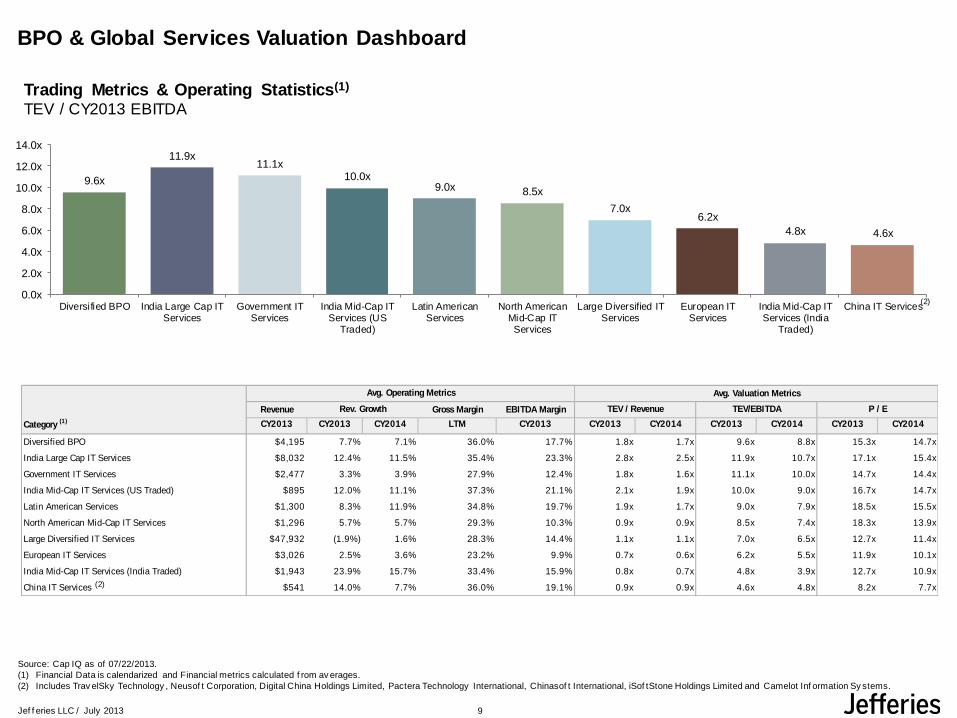
Trading Metrics & Operating Statistics(1)
TEV / CY2013 EBITDA
BPO & Global Services Valuation Dashboard
Source: Cap IQ as of 07/22/2013.
(1) Financial Data is calendarized and Financial metrics calculated f rom av erages.
(2) Includes Trav elSky Technology , Neusof t Corporation, Digital China Holdings Limited, Pactera Technology International, Chinasof t International, iSof tStone Holdings Limited and Camelot Inf ormation Sy stems.
9.6x
11.9x11.1x
10.0x9.0x 8.5x
7.0x6.2x
4.8x 4.6x
0.0x
2.0x
4.0x
6.0x
8.0x
10.0x
12.0x
14.0x
Diversified BPO India Large Cap ITServices
Government ITServices
India Mid-Cap ITServices (US
Traded)
Latin AmericanServices
North AmericanMid-Cap IT
Services
Large Diversified ITServices
European ITServices
India Mid-Cap ITServices (India
Traded)
China IT Services
Avg. Valuation Metrics
Revenue Gross Margin EBITDA Margin
Category (1) CY2013 CY2013 CY2014 LTM CY2013 CY2013 CY2014 CY2013 CY2014 CY2013 CY2014
Diversified BPO $4,195 7.7% 7.1% 36.0% 17.7% 1.8x 1.7x 9.6x 8.8x 15.3x 14.7x
India Large Cap IT Services $8,032 12.4% 11.5% 35.4% 23.3% 2.8x 2.5x 11.9x 10.7x 17.1x 15.4x
Government IT Services $2,477 3.3% 3.9% 27.9% 12.4% 1.8x 1.6x 11.1x 10.0x 14.7x 14.4x
India Mid-Cap IT Services (US Traded) $895 12.0% 11.1% 37.3% 21.1% 2.1x 1.9x 10.0x 9.0x 16.7x 14.7x
Latin American Services $1,300 8.3% 11.9% 34.8% 19.7% 1.9x 1.7x 9.0x 7.9x 18.5x 15.5x
North American Mid-Cap IT Services $1,296 5.7% 5.7% 29.3% 10.3% 0.9x 0.9x 8.5x 7.4x 18.3x 13.9x
Large Diversified IT Services $47,932 (1.9%) 1.6% 28.3% 14.4% 1.1x 1.1x 7.0x 6.5x 12.7x 11.4x
European IT Services $3,026 2.5% 3.6% 23.2% 9.9% 0.7x 0.6x 6.2x 5.5x 11.9x 10.1x
India Mid-Cap IT Services (India Traded) $1,943 23.9% 15.7% 33.4% 15.9% 0.8x 0.7x 4.8x 3.9x 12.7x 10.9x
China IT Services $541 14.0% 7.7% 36.0% 19.1% 0.9x 0.9x 4.6x 4.8x 8.2x 7.7x
TEV / Revenue P / ERev. Growth
Avg. Operating Metrics
TEV/EBITDA
(2)
(2)
9
Jef f eries LLC July 2013 /
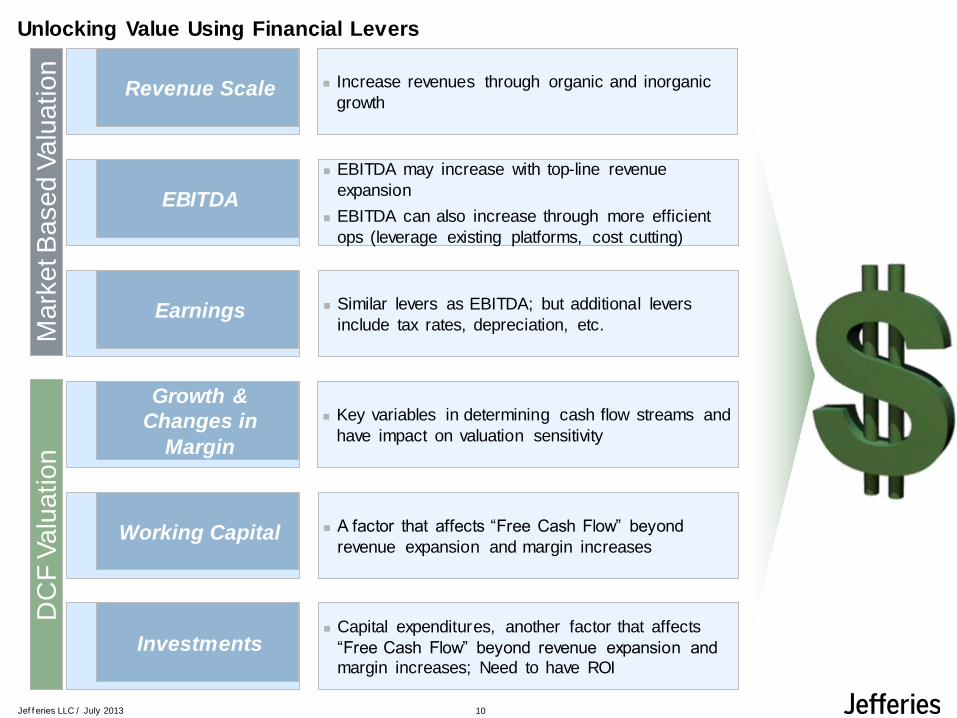
Unlocking Value Using Financial Levers
EBITDA may increase with top-line revenue
expansion
EBITDA can also increase through more efficient
ops (leverage existing platforms, cost cutting)
Similar levers as EBITDA; but additional levers
include tax rates, depreciation, etc.
A factor that affects “Free Cash Flow” beyond
revenue expansion and margin increases
Capital expenditures, another factor that affects
“Free Cash Flow” beyond revenue expansion and
margin increases; Need to have ROI
Key variables in determining cash flow streams and
have impact on valuation sensitivity
Revenue Scale
EBITDA
Earnings
Working Capital
Investments
Growth &
Changes in
Margin
Increase revenues through organic and inorganic
growth
Mark
et B
ased V
alu
ation
DC
F V
alu
ation
10
Jef f eries LLC July 2013 /
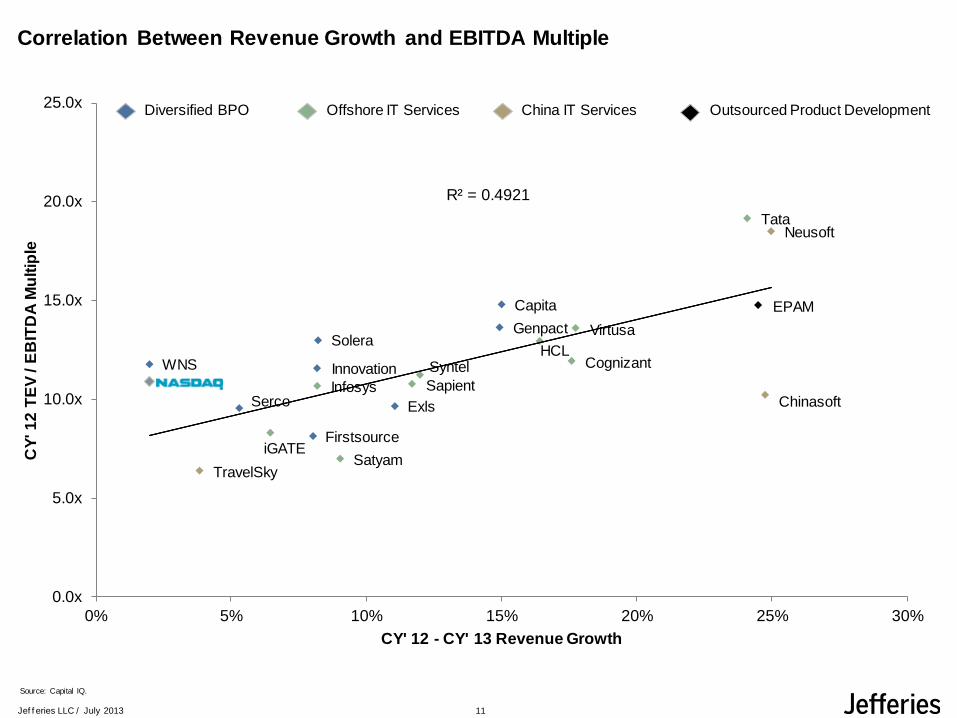
Correlation Between Revenue Growth and EBITDA Multiple
Capita
Serco
GenpactSolera
Exls
WNS Innovation
Firstsource
Tata
Infosys
CognizantHCL
Satyam
Syntel
Sapient
iGATE
Virtusa
TravelSky
Neusoft
Chinasoft
EPAM
R² = 0.4921
0.0x
5.0x
10.0x
15.0x
20.0x
25.0x
0% 5% 10% 15% 20% 25% 30%
CY
' 1
2 T
EV
/ E
BIT
DA
Mu
ltip
le
CY' 12 - CY' 13 Revenue Growth
China IT ServicesDiversified BPO Offshore IT Services Outsourced Product Development
Source: Capital IQ.
11
Jef f eries LLC July 2013 /
Capita
Serco
Virtusa
Exls
WNSInnovation
Firstsource
Tata
Infosys
Cognizant
Wipro
HCL
Sapient
Genpact
Digital China
Pactera
Chinasoft
EPAM
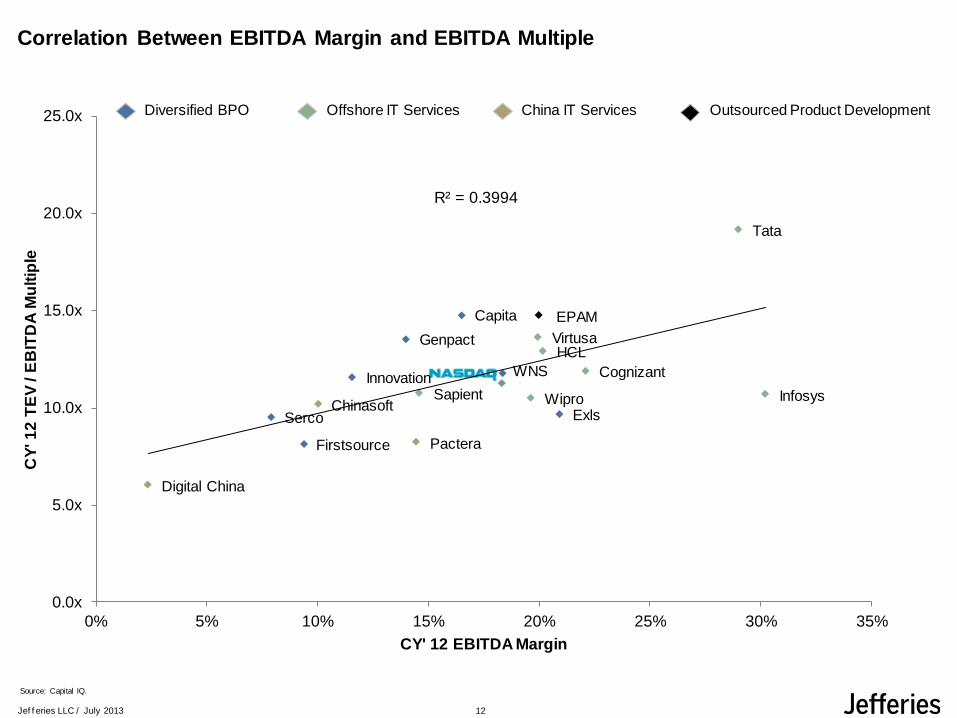
R² = 0.3994
0.0x
5.0x
10.0x
15.0x
20.0x
25.0x
0% 5% 10% 15% 20% 25% 30% 35%
CY
' 1
2 T
EV
/ E
BIT
DA
Mu
ltip
le
CY' 12 EBITDA Margin
Correlation Between EBITDA Margin and EBITDA Multiple
Source: Capital IQ.
China IT ServicesDiversified BPO Offshore IT Services Outsourced Product Development
12
Jef f eries LLC July 2013 /
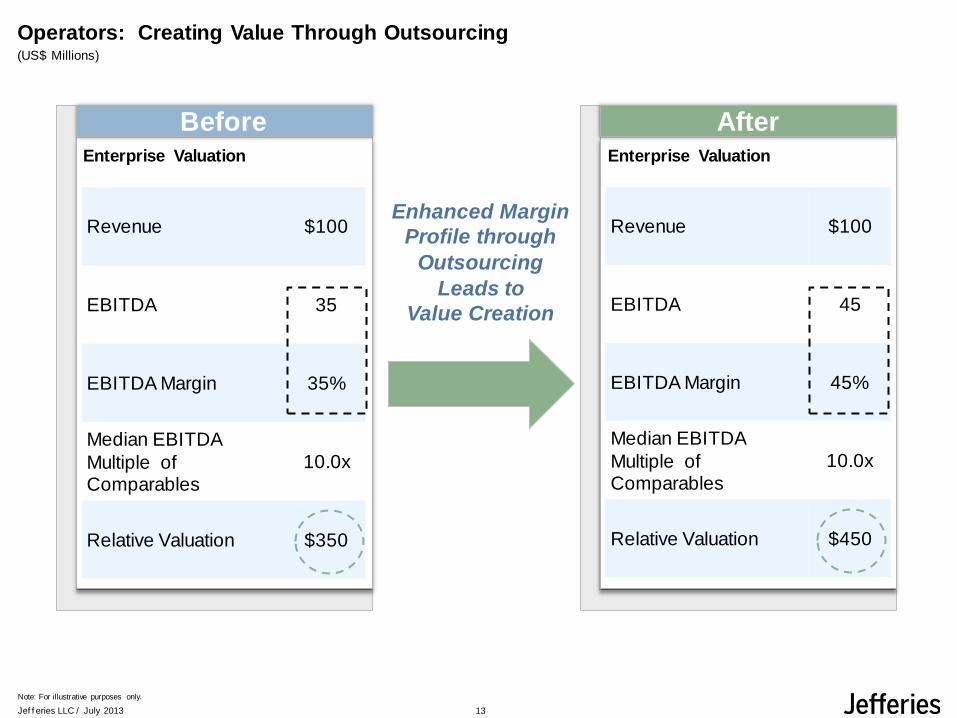
Operators: Creating Value Through Outsourcing (US$ Millions)
Note: For illustrative purposes only.
Enhanced Margin
Profile through
Outsourcing
Leads to
Value Creation
Enterprise Valuation
Revenue $100
EBITDA 35
EBITDA Margin 35%
Median EBITDA
Multiple of Comparables
10.0x
Relative Valuation $350
Enterprise Valuation
Revenue $100
EBITDA 45
EBITDA Margin 45%
Median EBITDA
Multiple of Comparables
10.0x
Relative Valuation $450
Before After
13
Jef f eries LLC July 2013 /
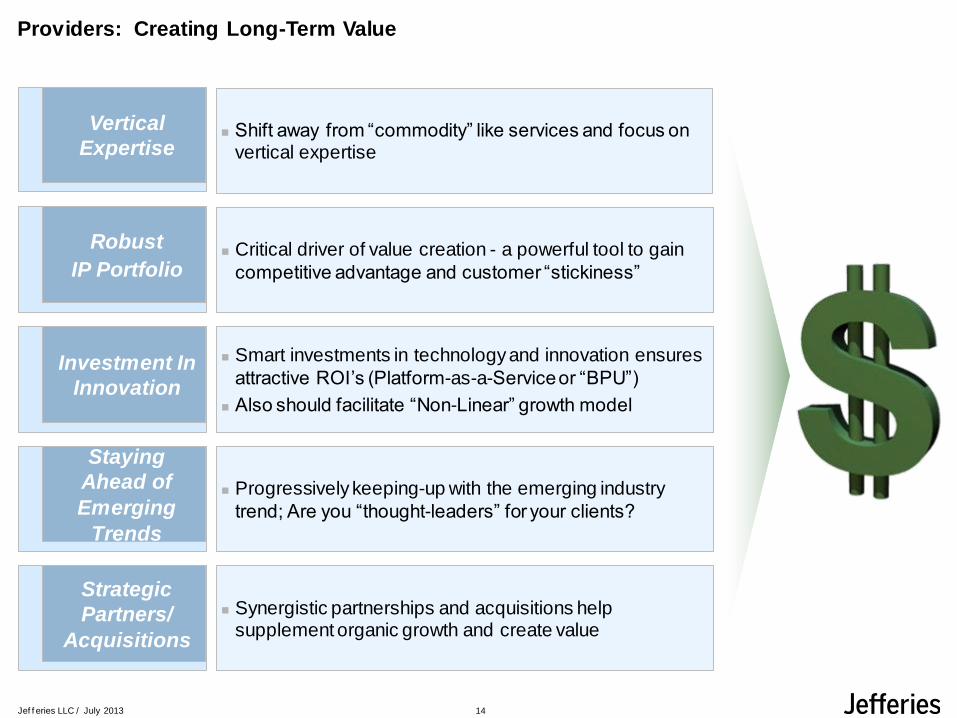
Providers: Creating Long-Term Value
Vertical
Expertise
Robust
IP Portfolio
Investment In
Innovation
Staying
Ahead of
Emerging
Trends
Strategic
Partners/
Acquisitions
Shift away from “commodity” like services and focus on vertical expertise
Critical driver of value creation - a powerful tool to gain
competitive advantage and customer “stickiness”
Smart investments in technology and innovation ensures
attractive ROI’s (Platform-as-a-Service or “BPU”)
Also should facilitate “Non-Linear” growth model
Progressively keeping-up with the emerging industry
trend; Are you “thought-leaders” for your clients?
Synergistic partnerships and acquisitions help supplement organic growth and create value
14
Jef f eries LLC July 2013 /
Ways To Monetize Value
15
Jef f eries LLC July 2013 /
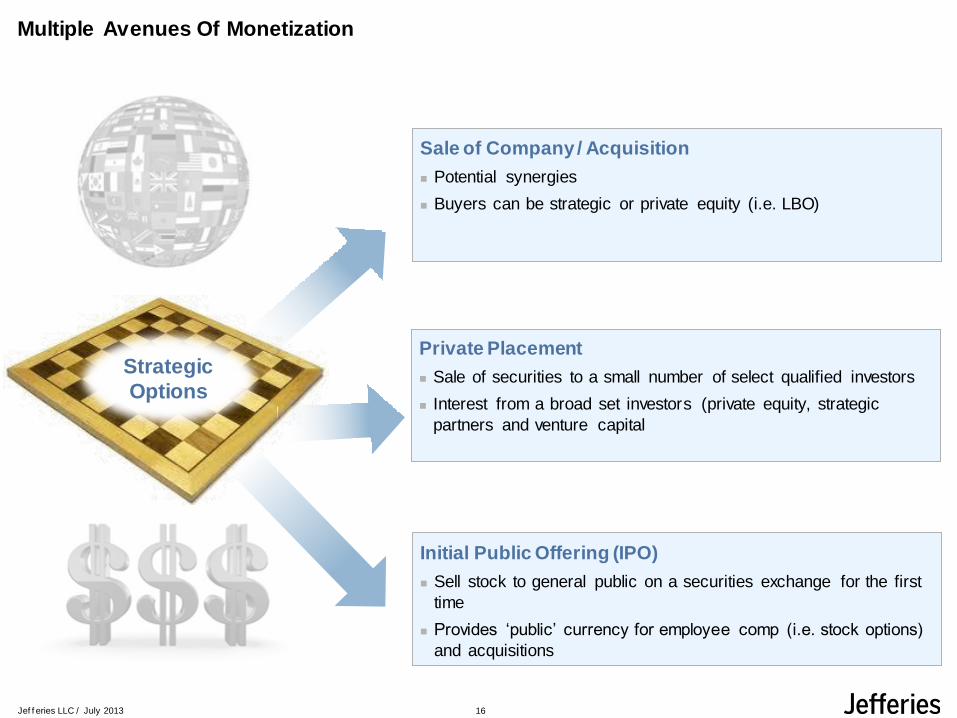
Initial Public Offering (IPO)
Sell stock to general public on a securities exchange for the first
time
Provides ‘public’ currency for employee comp (i.e. stock options)
and acquisitions
Strategic
Options
Sale of Company / Acquisition
Potential synergies
Buyers can be strategic or private equity (i.e. LBO)
Private Placement
Sale of securities to a small number of select qualified investors
Interest from a broad set investors (private equity, strategic
partners and venture capital
Multiple Avenues Of Monetization
16
Jef f eries LLC July 2013 /
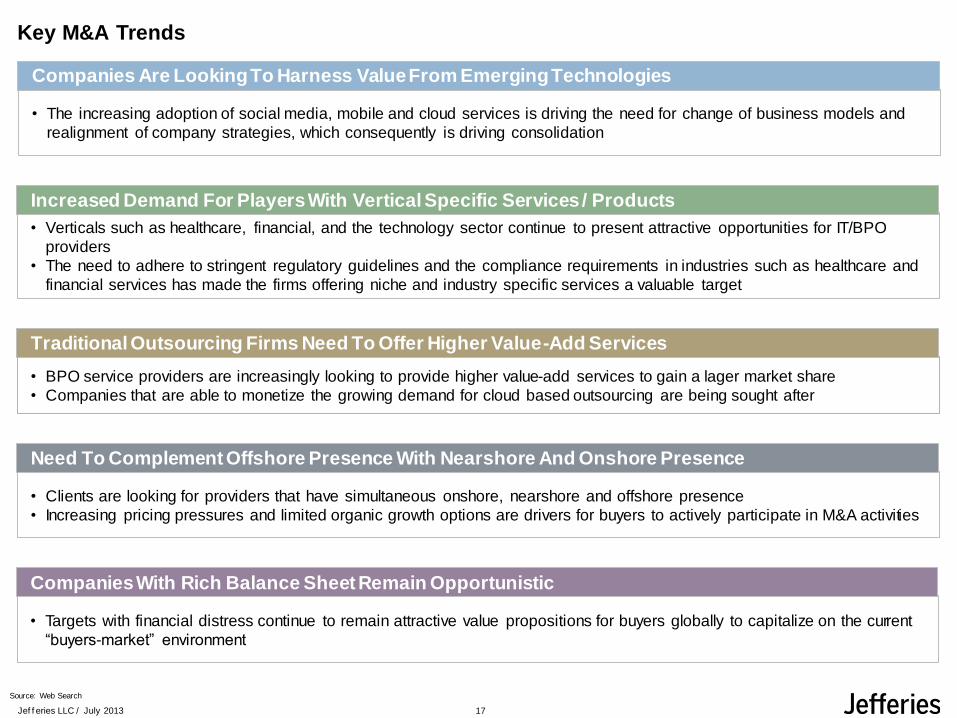
Key M&A Trends
• The increasing adoption of social media, mobile and cloud services is driving the need for change of business models and
realignment of company strategies, which consequently is driving consolidation
Companies Are Looking To Harness Value From Emerging Technologies
• Verticals such as healthcare, financial, and the technology sector continue to present attractive opportunities for IT/BPO
providers
• The need to adhere to stringent regulatory guidelines and the compliance requirements in industries such as healthcare and
financial services has made the firms offering niche and industry specific services a valuable target
Increased Demand For Players With Vertical Specific Services / Products
• BPO service providers are increasingly looking to provide higher value-add services to gain a lager market share
• Companies that are able to monetize the growing demand for cloud based outsourcing are being sought after
Traditional Outsourcing Firms Need To Offer Higher Value-Add Services
• Clients are looking for providers that have simultaneous onshore, nearshore and offshore presence
• Increasing pricing pressures and limited organic growth options are drivers for buyers to actively participate in M&A activities
Need To Complement Offshore Presence With Nearshore And Onshore Presence
• Targets with financial distress continue to remain attractive value propositions for buyers globally to capitalize on the current
“buyers-market” environment
Companies With Rich Balance Sheet Remain Opportunistic
Source: Web Search
17
Jef f eries LLC July 2013 /
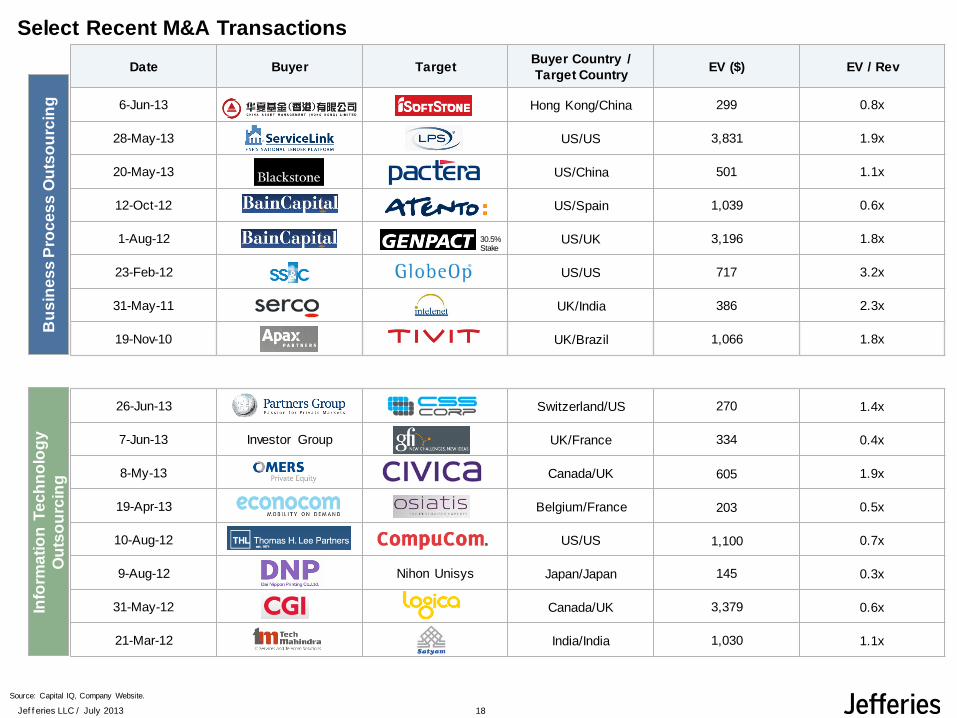
Source: Capital IQ, Company Website.
Date Buyer TargetBuyer Country /
Target Country EV ($) EV / Rev
6-Jun-13 Hong Kong/China 299 0.8x
28-May-13 US/US 3,831 1.9x
20-May-13 US/China 501 1.1x
12-Oct-12 US/Spain 1,039 0.6x
1-Aug-12 US/UK 3,196 1.8x
23-Feb-12 US/US 717 3.2x
31-May-11 UK/India 386 2.3x
19-Nov-10 UK/Brazil 1,066 1.8x
26-Jun-13 Switzerland/US 270 1.4x
7-Jun-13 Investor Group UK/France 334 0.4x
8-My-13 Canada/UK 605 1.9x
19-Apr-13 Belgium/France 203 0.5x
10-Aug-12 US/US 1,100 0.7x
9-Aug-12 Nihon Unisys Japan/Japan 145 0.3x
31-May-12 Canada/UK 3,379 0.6x
21-Mar-12 India/India 1,030 1.1x
Select Recent M&A TransactionsB
us
ine
ss
Pro
ce
ss
Ou
tso
urc
ing
Info
rma
tio
n T
ec
hn
olo
gy
Ou
tso
urc
ing
30.5% Stake
18
Jef f eries LLC July 2013 /
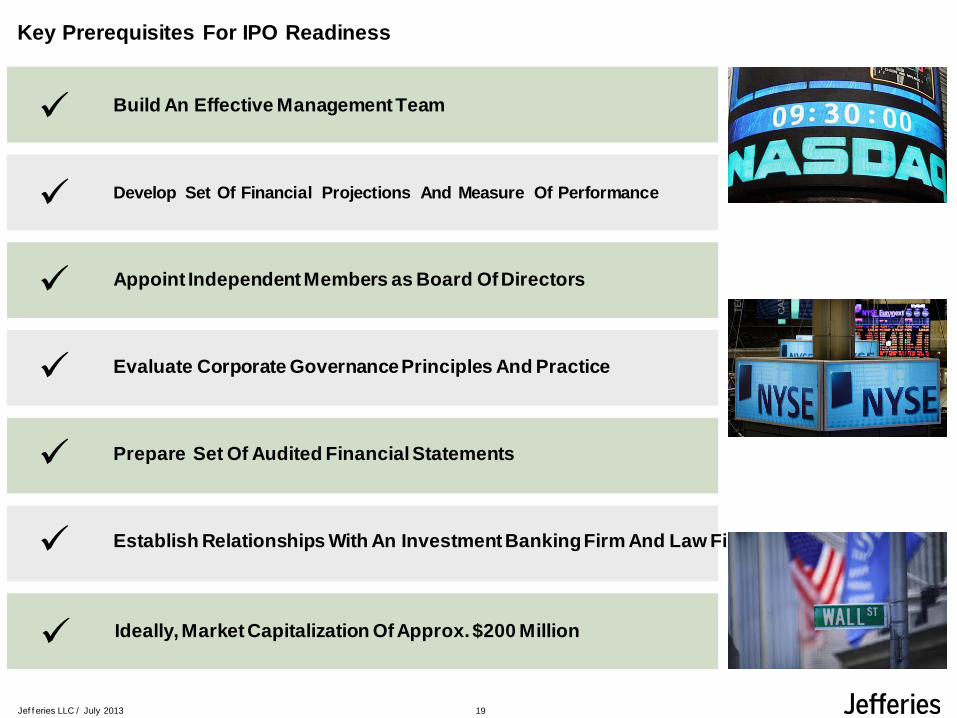
Key Prerequisites For IPO Readiness
Build An Effective Management Team
Develop Set Of Financial Projections And Measure Of Performance
Appoint Independent Members as Board Of Directors
Evaluate Corporate Governance Principles And Practice
Prepare Set Of Audited Financial Statements
Establish Relationships With An Investment Banking Firm And Law Firm
Ideally, Market Capitalization Of Approx. $200 Million
19
Jef f eries LLC July 2013 /
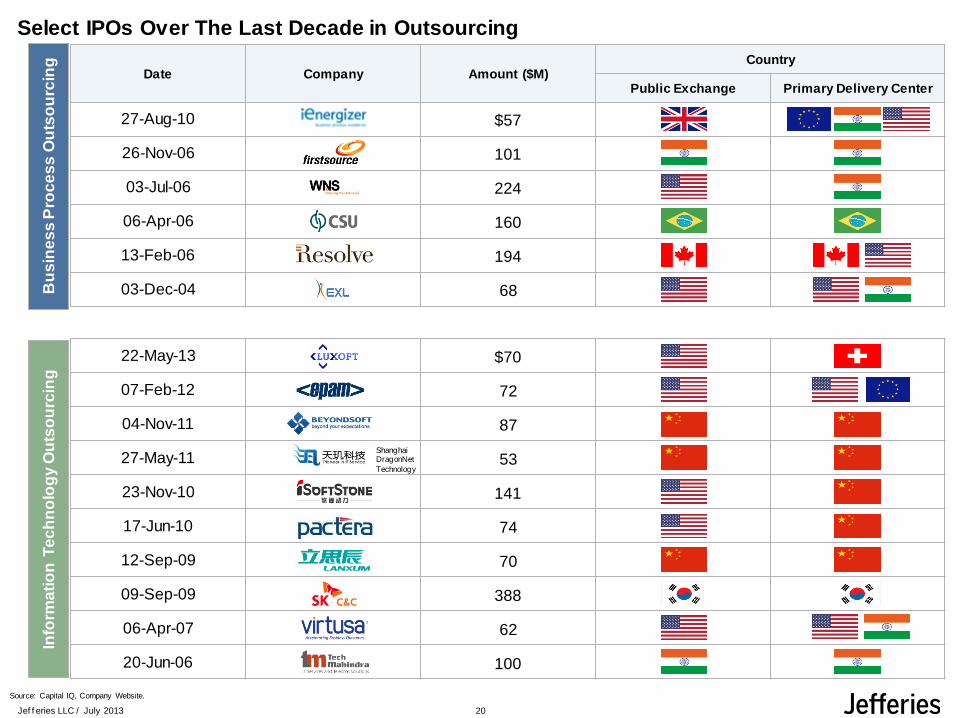
Source: Capital IQ, Company Website.
Date Company Amount ($M)Country
Public Exchange Primary Delivery Center
27-Aug-10 $57
26-Nov-06 101
03-Jul-06 224
06-Apr-06 160
13-Feb-06 194
03-Dec-04 68
22-May-13 $70
07-Feb-12 72
04-Nov-11 87
27-May-11 53
23-Nov-10 141
17-Jun-10 74
12-Sep-09 70
09-Sep-09 388
06-Apr-07 62
20-Jun-06 100
Select IPOs Over The Last Decade in OutsourcingB
us
ine
ss
Pro
ce
ss
Ou
tso
urc
ing
Info
rma
tio
n T
ec
hn
olo
gy
Ou
tso
urc
ing
Shanghai DragonNet
Technology
20
Jef f eries LLC July 2013 /
Global Outsourcing Market
21
Jef f eries LLC July 2013 /
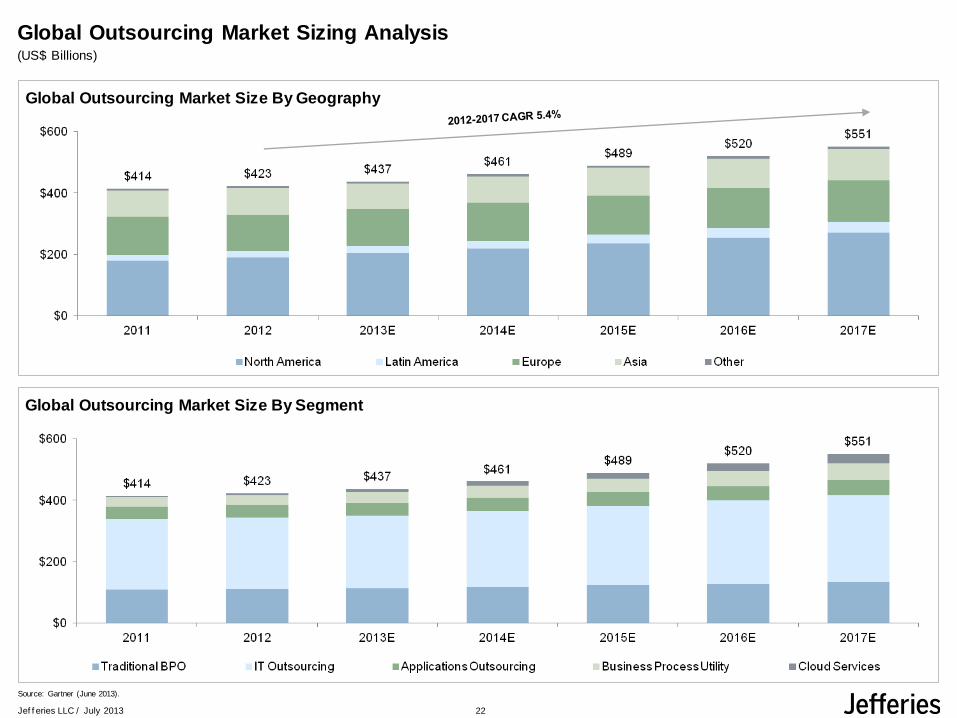
Global Outsourcing Market Sizing Analysis (US$ Billions)
Global Outsourcing Market Size By Geography
Source: Gartner (June 2013).
Global Outsourcing Market Size By Segment
22
www.IAOP.org
Break
www.IAOP.org
China as a Strategic Outsourcing Location
Panelists:
Alan Hanson, SVP, Neo Group
Min Wang, Partner, Kirkland & Ellis LLP
Nick Ionita, VP, FreeWheel
David Watkins, Chairman, ReSource Pro
Moderator:
Jay Desai, SVP-Global Sourcing, Northern Trust
Welcometo
Shandong
Shandong Department of Commerce
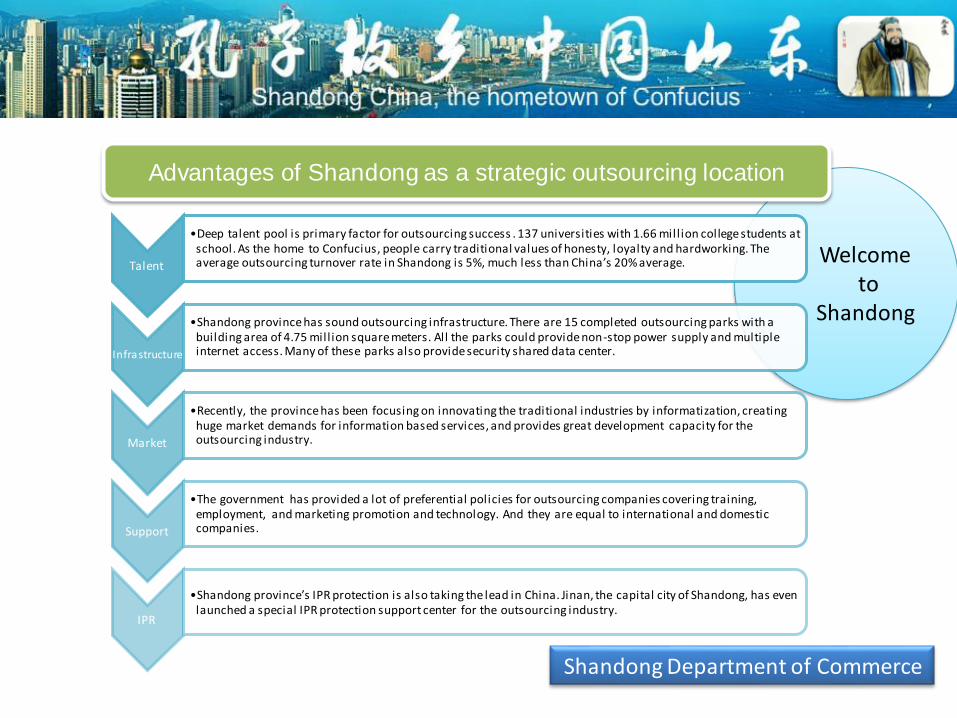
Talent
•Deep talent pool is primary factor for outsourcing success . 137 universities with 1.66 mill ion college students at school. As the home to Confucius, people carry traditional values of honesty, loyalty and hardworking. The average outsourcing turnover rate in Shandong is 5%, much less than China’s 20% average.
Infrastructure
•Shandong province has sound outsourcing infrastructure. There are 15 completed outsourcing parks with a building area of 4.75 mill ion square meters. All the parks could provide non-stop power supply and multiple internet access. Many of these parks also provide security shared data center.
Market
•Recently, the province has been focusing on innovating the traditional industries by informatization, creating huge market demands for information based services, and provides great development capacity for the outsourcing industry.
Support
•The government has provided a lot of preferential policies for outsourcing companies covering training, employment, and marketing promotion and technology. And they are equal to international and domestic companies.
IPR
•Shandong province’s IPR protection is also taking the lead in China. Jinan, the capital city of Shandong, has even launched a special IPR protection support center for the outsourcing industry.
Advantages of Shandong as a strategic outsourcing location
THANK YOU FOR
JOINING US!
For more information on IAOP’s Programs and Services, email [email protected].
www.IAOP.org
Networking Reception
Sponsored by the
Shandong China Delegation