Embed Size (px)
Citation preview

New Perspectives on Global Health Spending for Universal Health Coverage
Global report

GLOBAL REPORT
This WHO report summarizes the latest internationally comparable data on health spending between 2000 and 2015
CONFERENCE COPY FOR CONSULTATION

GLOBAL REPORT
03
Contents
Introduction ..............................................................................................................................4
1. What’s new in this report ............................................................................................... 7
2. How much the world spends on health .................................................................. 10
3. Public spending on health ............................................................................................14
4. The role of external funding .........................................................................................19
5. Global spending on health through out-of-pocket payment .........................23
6. Revealing the sources of social health insurance spending ...........................29
7. Conclusions and future directions .............................................................................33
References ..............................................................................................................................37
ACKNOWLEDGEMENTS
This report was the product of the collective effort of a large number of people around the world, led by the Health Expenditure Tracking team in WHO Headquarters in Geneva. The authors of the report are Ke Xu, Agnes Soucat, Joe Kutzin, Callum Brindley, Elina Dale, Nathalie Van de Maele, Tomas Roubal, Chandika Indikadahena, Hapsa Toure, and Veneta Cherilova.
We are grateful for the contributions of numerous individuals and agen-cies for their support in making this paper possible, and in particular, for their contributions to improving the quality and completeness of the data used for the analysis. We wish in particular to thank Maria Petro Brunal of the Global Fund to Fight HIV, TB and Malaria and the P4H Coordination Desk team for their contributions to the final production of the report. Many people contributed to the collection, improvement, and appropriate classification of the data that form the basis of this report. From within WHO, these include Hélène Barroy, Inke Mathauer, Fahdi Dkhimi, Matthew Jowett, Justine Hsu, Grace Kabaniha, Seydou Coulibaly, Benjamin Nganda, Hyppolite Kalambay Ntembwa, Annie Chu, Maria Pena, Lluis Vinyals, Hui Wang, Priyanka Saksena, Awad Mataria, Ilker Dastan, Tamás Evetovits, Sara Thomson, Melitta Jakab, Baktygul Akkazieva, Camilo Cid and Claudia Pescetto, and many of our country office staff. We also appreciate the support provided by colleagues from the European Observatory on Health Systems and Policies in helping us to identify data on revenue sources for many countries in that region. Thanks also go to the consultants that were contracted by WHO over
the past year for their help in preparing the data publication: Inès Ayadi, Jean-Edouard Doamba, Evgeniy Dolgikh, Julien Dupuy, Natalja Eigo, Mahmoud Farag, Charu Garg, Patricia Hernandez, Wayne Irava, Eddy Mongani Mpotongwe, Simon Nassa, Rachel Racelis, Magdalena Rathe, Nirmala Ravishankar, Shakthi Selvaraj, Katerina Sharapka, Neil Thalagala, Cor van Mosseveld, Fe Vida N Dy-Liacco, and Yuhui Zhang. We also wish to recognize the contributions to data quality improvement made by numerous World Bank staff. Our ongoing collaboration with the OECD Health Accounts Team has played a key role in ensuring the routine production of health expenditure data from most high-income countries. Most important of all, we express our appreciation to the health expend-iture experts in each WHO Member State who made the data available for this report.
We would like to thank the Bill and Melinda Gates Foundation, the Global Fund, Gavi Alliance, United States Agency for International Develop-ment, the Department for International Development of the United King-dom, the European Commission, the Government of Japan, the Govern-ment of the French Republic, the Grand Duchy of Luxembourg, and P4H for their funding support to WHO’s health financing work, which has played a critical role in enabling us to make health expenditure tracking data, and the analysis of these data, a valuable global public good.
Thanks as well to Bruce Ross-Larson for editing the report and FFW Ltd for layout.

GLOBAL REPORT
04
Introduction
In September 2015 the world agreed that health
coverage should be universal. The UN General As-
sembly adopted Universal Health Coverage as part
of the overall commitment to the Sustainable goals.
SDG Goal 3.8 sets the following target for 2030:
“Achieve universal health coverage, including finan-
cial risk protection, access to quality essential health
care services and access to safe, effective, quality,
and affordable essential medicines and vaccines for
all. “
Achieving Universal Health Coverage is an ambitious
goal and will require the commitment of countries
to mobilize sustained amounts of resources. In par-
ticular, progress will depend on the capacity of so-
cieties to collectively mobilize resources for health
and to redistribute them for better health, greater
equity and increased social cohesion. 1
There are reasons for optimism. Over the past
decade many countries have made progress on
delivering health services and providing financial
protection to their people. Poverty has been declin-
ing steadily, and the coverage of essential services
has increased since 2000. The average coverage for
a subset of nine tracer indicators increased by 1.3%
a year, which is roughly a 20% increase from 2000
to 2015.2
Even so, there is still a long way to go to achieve
UHC. At least half the world’s people do not have
full coverage of essential services. More than 1 bil-
lion have uncontrolled hypertension, more than 200
million women have inadequate coverage for family
planning, and over 20 million infants do not receive
a third dose of DTP vaccine. In addition, some 800
million people spend more than 10% of their annual
budget on health care, and 100 million people are
pushed into extreme poverty each year because of
out-of-pocket health expenses. 2
And further progress is possible. Since the publica-
tion of the 2010 World Health Report, 3 WHO has
emphasized that all countries can do something to
move towards UHC. Most countries are capable of
mobilizing the needed resources to achieve some
level of universality, particularly of most essential
services including primary health care. 4 And many
already do. But further progress will require doing
more—and doing better. Economic growth will help
a lot, and current prospects are encouraging. But
economic growth will not be enough. Many coun-
tries will need to invest more in policy reforms to
expand their public purse and invest in providing
quality services.
For health financing the starting point for analysing
what is possible is to have a solid understanding of
the level and mix of funding, the channels for health
expenditures, and their trends over time. WHO has
a long history of documenting and analysing health
expenditures. Indeed, 2017 marks the 50th anniver-
sary of its first publication on the subject, produced
by the late Professor Brian Abel-Smith. 5

GLOBAL REPORT
05
INTRODUCTION
the world. Given the recognition of its importance
for progress towards UHC, 7 an assessment of levels
and trends in public financing for health is con-
tained in Section 3. This is followed by an analysis
of external resource inflows (mostly in the form
of development assistance for health), exploring
what the data suggest with regard to critical issues
such as fungibility between external and domestic
revenues. Section 5 updates and reviews the latest
information on out-of-pocket spending (OOPS),
a key concern with regard to financial protection
and hence of progress towards UHC. 2 Many coun-
tries have tried to reduce OOPS through financing
arrangements referred to as social health insurance
(SHI), and the following section summarizes what
the data tell us about the relative magnitude of
expenditures that flow through SHI as well as the
mix of revenue sources on which it relies. In the final
section of the report, we recap the main findings on
the levels and trends in global health expenditures,
and propose priorities for data quality improvement
going forward.
More and better data are a public good. They are
critical to understand progress and its drivers. For
two decades now, WHO has invested in supporting
countries to track their health expenditures and in
developing a global database. This report renews
and enhances the effort to provide to both citizens
and policymakers an overall picture of comparable
data.
This WHO report summarizes the latest internation-
ally comparable data on health spending in all WHO
Member States between 2000 and 2015. But it does
more than publish the most recent data. For the
first time the report also uses the new international
classification for health expenditures in the revised
System of Health Accounts (SHA-2). 6 These classi-
fications enable presenting detailed information on
the role of governments, households and donors in
funding health services—and the financing arrange-
ments through which these funds are channelled
and spent.
The data come from the 2017 version of WHO’s
Global Health Expenditure Database (GHED), which
includes new estimates of health expenditures in
2015 as well as revised data series for each country
and each year from 2000 to 2015. The new classi-
fications improve the comparability and policy-rel-
evance of the estimates. In addition, WHO has
engaged in a major (and ongoing) effort to improve
data quality, working with each country and, where
relevant, partner agencies.
The aim of this report is to summarize key global
health expenditure patterns and trends, to illustrate
the potential of the new database to inform thinking
about financing reforms to progress towards UHC,
and to raise issues for further research. Follow-
ing this introduction, the first section explains the
unique nature of this global database and notes the
strengths of the new classification as well as the re-
maining limitations of the data. Section 2 then gives
a sense of the size of health in the global economy
and how health expenditures are distributed around

GLOBAL REPORT

GLOBAL REPORT
07
1. What’s new in this report
The potential for new and more policy-relevant interpretations and insightsThe SHA-2 health financing classifications enable
deeper, more policy relevant understanding and
analytic potential then was possible under SHA-1, 8
aligning them with the functional health financing
policy framework in wide use. 9 As such, it is more
flexible and adaptable to the mix of revenue rais-
ing and pooling arrangements that currently exist
as well as that which may emerge in the future.
More specifically, key changes to the classifications
enable new aspects of health expenditures to be
visible for the first time in the Global Health Expen-
diture Database (GHED).
Reporting on the sources of health expendituresUnderstanding both the levels and changes over
time in the share of health spending coming from
different revenue sources is critical for under-
standing health financing. Until this year, the
GHED reported spending by “financing agent,” the
intermediary that executed the payment, such as
a Ministry of Health, Statutory Health Insurance
Fund, or NGO. While useful, this organization of
the data hid the actual sources of these expen-
ditures. For example, it was not possible to see
whether SHI expenditures were funded by general
budget revenues or external donor revenues. These
considerations are critical for those concerned
with sustainable and equitable financing of health
systems for UHC. 10 By depicting the revenue
sources (referred to as the “FS” classifications) of
health spending for the years 2000–2015, the new
GHED provides a valuable disaggregation, offering
new policy insights and opportunities for health
financing research. We highlight some of these
in the report, particularly in relation to the role of
external aid and the funding sources for SHI. At the
more aggregate level, the FS classifications allow
determining the shares of health expenditure that
come from domestic public, domestic private and
external sources.
Revising how health financing arrangements are classifiedThe financing agent categories used until this year
for expenditure reporting were guided mainly by
institutional features (such as ownership), historical
models of health financing and sometimes even
their names. The new GHED replaces this with the
SHA-2 “health financing schemes” (HF) classifi-
cation. a The HF was explicitly designed to foster
more policy relevant and internationally comparable
health expenditure data by using important and
objectively verifiable attributes of health financ-
ing arrangements to separate them into mutually
exclusive categories. The three main distinguishing
criteria are whether participation (coverage) by the
arrangement is automatic, mandatory or voluntary;
whether entitlement to benefits/services is based
on contribution or some other factor (citizenship,
residence, poverty status) and whether there is
inter-personal pooling of the funds. b
a “Schemes” is an unfortunate choice of terms used in SHA-2, and the interpretation of this word is different than what it typically sug-gests to health financing policy analysts. In SHA-2, it refers to a category of health financing arrangements with similar characteristics rather than to a specific institution or pool of funds.
b For details on the criteria used to assign expenditures to different HF categories, see Table 7.2 (“Main criteria of health care financing schemes”) and figure 7.2 (“Criteria tree for health care financing schemes”), as well as the surrounding text, from Chapter 7 of the SHA-2 manual.6
GLOBAL REPORT
08
1. WHAT’S NEW IN THIS REPORT
At the more aggregate level, the HF classification
allows determining the shares of health expenditure
that flow through prepaid and pooled mechanisms
with compulsory or automatic coverage, distinct
from voluntary prepaid arrangements and out-of-
pocket spending (OOPS). The new classifications
enable a more explicit assessment of how countries
rely on compulsory/automatic coverage in their
financing arrangements. They may also help shift
the focus from the public or private ownership of a
health financing agency to the compulsory or volun-
tary nature of the arrangements.
Distinguishing current from capital health spendingThe GHED previously reported on total health
spending, not the relative current and capital shares.
Thus, if spending fluctuated from one year to the
next, users would not know whether that fluctuation
was due to a new large capital investment pro-
gram or a sudden change in more “routine” health
spending. Understanding levels and trends in capital
spending is important because investment into
infrastructure such as hospitals or clinics—as well
as diagnostic and therapeutic equipment—under-
pin safe, accessible and quality health services and
require substantial funding. For example, damaged
public health infrastructures was identified as one
of the weaknesses of the health systems of Guin-
ea, Liberia and Sierra Leone during the Ebola virus
epidemics. 11 With the SHA-2 classifications, capital
spending is reported separately, leaving only current
spending for reporting in the FS and HF classifica-
tions to improve comparability.
Realizing the potentialThe potential of the new classification system—to
yield more policy-relevant and useful comparative
data to support policy and research on sustainable
health financing for UHC—is far reaching. But fully
realizing that potential is a major challenge. The
new GHED required producing the FS, HF and capi-
tal data series for each WHO Member State and for
each year from 2000 to 2015. While mapping some
previously reported data to the SHA-2 categories
is straightforward, this is not possible for some im-
portant data elements, and some items are new.
The main challenge has been to separate capital
from within the historical series of previously report-
ed total health expenditures. Secondary challenges
relate to obtaining data for the new FS series and
to ensuring consistency in the interpretation of
financing arrangements within the HF series. As a
result, there remains considerable scope to improve
the quality and consistency of the data in the 2017
GHED. We return to this issue at the end, where we
suggest priorities for improvement in the years to
come involving a collaborative effort of WHO staff,
countries and health financing experts from partner
agencies and the wider community of academia and
civil society.
9
GLOBAL REPORTGLOBAL REPORT
$76
The potential of the new classification system — to yield more policy-
relevant and useful comparative data to support policy and research on
sustainable health financing for UHC — is far reaching.

10
GLOBAL REPORT
2. How much the world spends on health
United States of America
United Kingdom
Sweden
Spain
Republicof Korea
Japan
Italy
Germany France
Canada
Belgium
Mexico
Iran
China
Brazil
India
Tree Income 2
IncomeLow IncomeLower-middle IncomeUpper-middle IncomeHigh Income
In 2015, the world spent USD 7.3 trillion on health,
close to 10% of global GDP. Health’s GDP share is
greatest in high-income countries at nearly 12% on
average. In low-income countries, health expen-
ditures account on average for 7% of GDP, and in
middle-income countries 6%.
The health sector is an important source of real
economic growth globally and particularly in low-in-
come and lower middle-income countries. Investing
in health not only leads to healthier lives, it also
generates employment, fosters social and politi-
cal stability, drives technological innovation and
contributes to higher productivity and economic
output. 12 Indeed, the health sector has consistently
grown faster than the overall economy over the past
15 years. Between 2000 and 2015 the global health
economy has grown in real terms at an average
annual rate of 4.0%, compared with 2.8% for the
global economy. The health economy in low-income
and lower middle-income countries has grown even
faster, at more than 6.0% on average. In 2015 only
the United States and China had a larger GDP than
the global health economy.
Figure 2.1: Country shares of global health expenditure in 2015, by income group

11
GLOBAL REPORT
Figure 2.3: The world’s largest economies
Low-Middle Income
Low Income
Upper-Middle Income
Figure 2.4: Aid is relatively small share of health expenditure in low and middle income countries.
30% aid
< 1% aid
3% aid
2015 the average share of external resources to
health spending in the 31 low-income countries was
around 30%, while in the 50 lower-middle and 57
upper-middle countries it was respectively only 3%
and less than 1%.
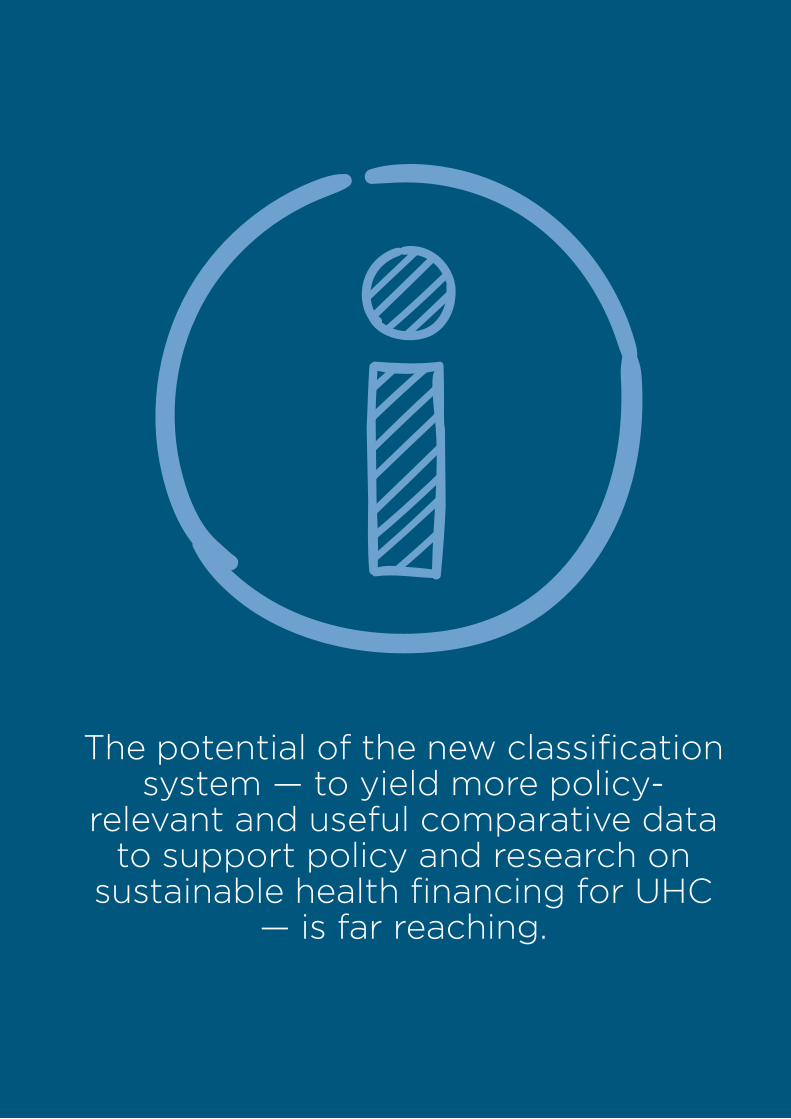
The way health care is financed varies considerably
across countries. Middle-income and high-income
countries tend to have a higher share of health
spending that is funded from compulsory prepaid
sources, such as government budgets (from various
types of taxes) and social health insurance contri-
butions. Public funding has increased slightly over
the past 15 years from an average of 48% to 51% of
current health spending in middle-income countries
and from 66% to 70% in high-income countries. In
low-income countries domestic government sourc-
es have declined from 30% to 22% as aid increased
from 20% to 30%.
2. HOW MUCH THE WORLD SPENDS ON HEALTH
Figure 2.2: Health expenditure is growing faster than GDP in most countries
Annual Average Real Growth 2000-2015
Health Expenditure Gross Domestic Product
0.0%
1.0%
2.0%
3.0%
4.0%
5.0%
6.0%
7.0%
Low Low-Mid Up-Mid High
Health Economy USA China Japan Germany
0
2
4
6
8
10
12
14
16
18
20
2000 2005 2010 2015
in c
on
stan
t 20
10 t
rilli
on
US
D
Domestic finances are the dominant source of
funding for health in all but a small handful of
low-income countries. Development assistance for
health amounted in 2015 to just over USD 19 billion,
or less than 0.3% of global health expenditure. But
it remains important for low-income countries. In
12
GLOBAL REPORT
Figure 2.5: Trends in health expenditure sources, by country income group
Health expenditure by income group, 2000-2015

13
GLOBAL REPORT2. HOW MUCH THE WORLD SPENDS ON HEALTH
Out-of-pocket spending (OOPS), associated with
a higher risk of financial hardship and impoverish-
ment, has declined only modestly. Between 2000
and 2015 OOPS fell from an average of 46% of CHE
to 38% in low-income countries and from 45% to
40% in lower middle-income countries. It fell from
37% of CHE to 31% in upper middle-income coun-
tries and from 23% to 21% in high-income countries.
Today, there are 1 billion fewer people living in coun-
tries where out-of-pocket spending is 50% or more.
Higher economic growth in low- and middle-income
countries has not closed the gap in health spending,
and global inequity in health spending has remained
largely unchanged. Indeed, the global spending
across countries is more unequal than GDP and
higher than any country’s income Gini coefficient.
Today, high-income countries, with only 16% of the
world’s people, account for 80% of global health
spending. Conversely, 76% of the world’s people
live in middle-income countries, but they account
for less than 20% of global health spending. Low-in-
come countries, with more than half a billion people,
accounted for less than 1% of the world’s health
spending in 2015. In 2015, the global average health
spending per capita was USD 1,011, with a median of
only 366. This global average conceals a very large
difference between the highest and lowest spending
countries, ranging from over USD 9,000 to less than
USD 20 per capita. In 2015 close to 50 countries
with a total population of 2.7 billion spent less than
USD 100 per capita.
Figure 2.6: Billions of people living in countries where out-of-pocket spending is at least 50% of current health spending
Figure 2.7: Most global health spending is in high-income countries, 2015
In 2000 In 2015Q5 Q4 Q3 Q2 Q1
0%
20%
40%
60%
80%
100%
Population Health Spending

14
GLOBAL REPORT
3. Public spending on health
Figure 3.1: Public spending and GDP per capita Figure 3.2: Public spending as a share of GDP by country income groups, 2000–2015
Government fiscal capacity, as indicated by the
share of overall government spending in GDP,
increased steadily over 2000–2015, c with partic-
ular growth among lower-middle and low-income
countries (figures 3.1 and 3.2). 13 Higher per capita
income has been associated with a higher demand
for public services (Wagner’s law d). The rise in pub-
lic spending after 2008 is attributed to countercycli-
cal fiscal policies and outlays to support the finan-
cial sector following the global financial crisis. 13 This
was followed by a decline in high- and middle-in-
come countries. For the period overall, however, the
trend in government fiscal capacity for countries is
positive at all income levels.
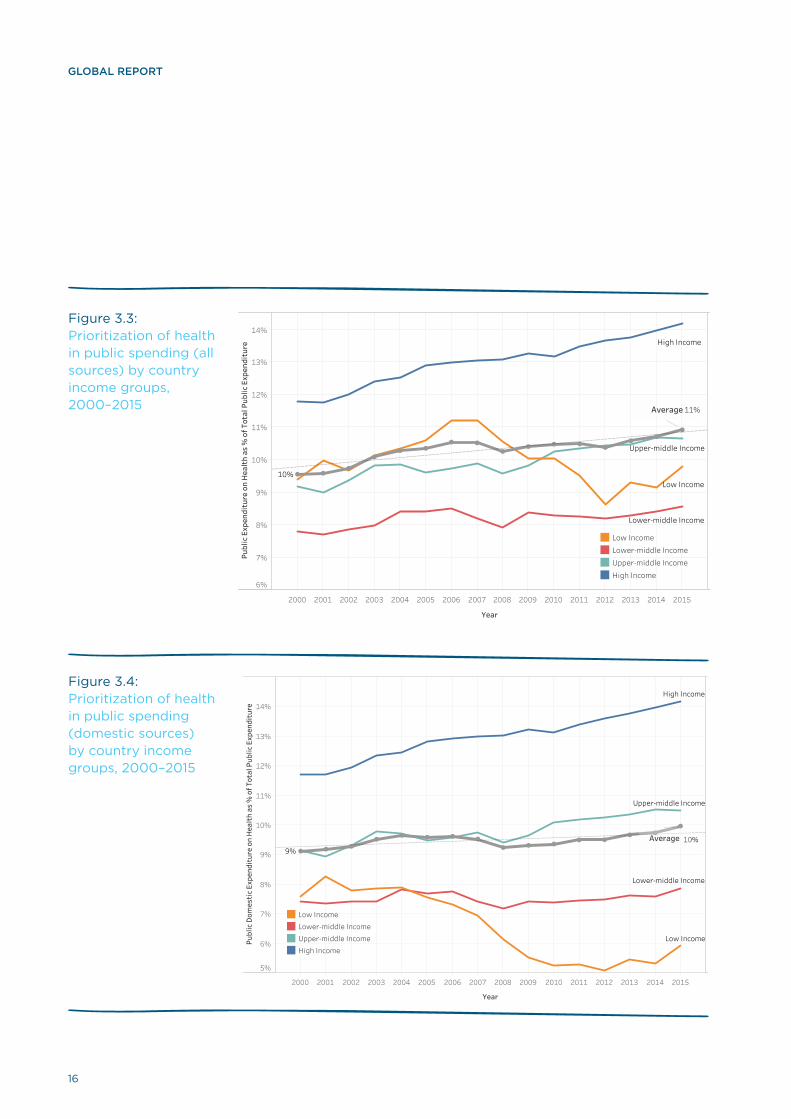
On average, health spending is a higher priority, but
this trend is not uniform, particularly when exam-
ining the share of domestic spending for health.
Perhaps surprisingly, the average share of health
spending in general government spending for lower
middle-income countries tends to be less than for
low-income countries (figure 3.3). It appears that
the observed relatively high allocation to health in
public spending among low-income countries is due
to external support. In the early 2000s the share of
domestic health spending in government expendi-
tures was similar among low- and lower middle-in-
come countries (figure 3.4). But the trends started
to diverge as prioritization of health from domestic
sources started to decline among low-income coun-
tries.
The level of per capita public spending on health
has increased in real terms (figure 3.5), including
in low-income countries (figure 3.6). It appears
that for many countries, particularly for those in
the low-income group, this growth has been driven
largely by fiscal capacity in these countries and not
budget prioritization. This is also in line with other
recent studies.14,15 Among the low-income countries,
it appears that while there has been overall fiscal
expansion since 2000 (figure 3.2), the domestic
health share of this public spending declined be-
tween 2005 and 2012 (figure 3.4).
2000 2001 2002 2003 2004 2005 2006 2007 2008 2009 2010 2011 2012 2013 2014 2015
Year
15%
20%
25%
30%
35%
40%
Tota
l Pub
lic E
xpen
ditu
re a
s %
of G
DP
Low Income
Lower-Middle Income
Upper-Middle Income
High Income
29%
33%Average
High IncomeUpper-Middle IncomeLower-Middle IncomeLow Income
c Methodological note: Countries with less than 600,000 population are excluded from this analysis. Most of them have a very high share of total government expenditure relative to GDP – well above 80% – and can be considered their own category. The official population threshold used by the World Bank (http://www.worldbank.org/en/country/smallstates/overview) and The Commonwealth of Small States (http://thecommonwealth.org/small-states ) is 1.5 million people. But that excludes many more countries, and we deem that threshold to be too high for the purposes of this analysis. The distribution looks much more normal once we exclude these extreme outliers.
d The German economist, Adolf Wagner theorized that the demand for public goods and services increases as countries become richer (“Wagner’s Law”)

15
GLOBAL REPORT
16
GLOBAL REPORT
Figure 3.3: Prioritization of health in public spending (all sources) by country income groups, 2000–2015
Figure 3.4: Prioritization of health in public spending (domestic sources) by country income groups, 2000–2015
2000 2001 2002 2003 2004 2005 2006 2007 2008 2009 2010 2011 2012 2013 2014 2015
Year
6%
7%
8%
9%
10%
11%
12%
13%
14%
Publ
ic E
xpen
ditu
re o
n H
ealt
h as
% o
f Tot
al P
ublic
Exp
endi
ture High Income
Upper-middle Income
Lower-middle Income
Low Income10%
11%Average
Low IncomeLower-middle IncomeUpper-middle IncomeHigh Income
2000 2001 2002 2003 2004 2005 2006 2007 2008 2009 2010 2011 2012 2013 2014 2015
Year
5%
6%
7%
8%
9%
10%
11%
12%
13%
14%
Publ
ic D
omes
tic
Expe
ndit
ure
on H
ealt
h as
% o
f Tot
al P
ublic
Exp
endi
ture
Low Income
High Income
Upper-middle Income
Lower-middle Income
9%10%Average
Low IncomeLower-middle IncomeUpper-middle IncomeHigh Income

17
GLOBAL REPORT3. PUBLIC SPENDING ON HEALTH
Figure 3.5: Prioritization and per capita public spending on health (from all sources), 2000–2015
Figure 3.6: Prioritization and per capita public spending on health (from all sources) among low-income countries, 2000–2015

18
GLOBAL REPORT
Figure 4.1: Expenditure from external sources constitute a small part of health expenditures in the world, 2015
Global health expenditure:
USD 7.3 trillion
Health expenditure from external sources:
USD 19.2 billion
Domestic public expenditure on health:
USD 4.4 trillion
Note: The above figure of USD 19.2 billion in development assistance for health in 2015 is based on current health expenditure, and draws on country produced health accounts as well as OECD DAC data. A complementary analysis of development assistance that is currently under production relies on a broader definition including health-related expenditures such as water and sanitation, as well health-specific global public goods. 16

19
GLOBAL REPORT
4. The role of external funding
Figure 4.2: Share of external and domestic sources of health spending in low-income countries, 2000–2015
External assistance for health constitutes a very
small part of global health expenditures (figure
4.1). This emphasizes again the importance of the
rising agenda on domestic revenue mobilization. If
countries are to make progress towards UHC they
have to rely on domestic revenues. But in many
low-income countries, the contribution of external
assistance to health expenditures is large: in 2015
it is estimated at about 33%, on average. e More-
over, this share increased between 2000 and 2015
(figure 4.2). It appears that there is a growing trend
in providing on-budget support—external funds
channelled through government mechanisms. This
trend is positive, suggesting increased alignment of
donor funding with country priorities and systems.
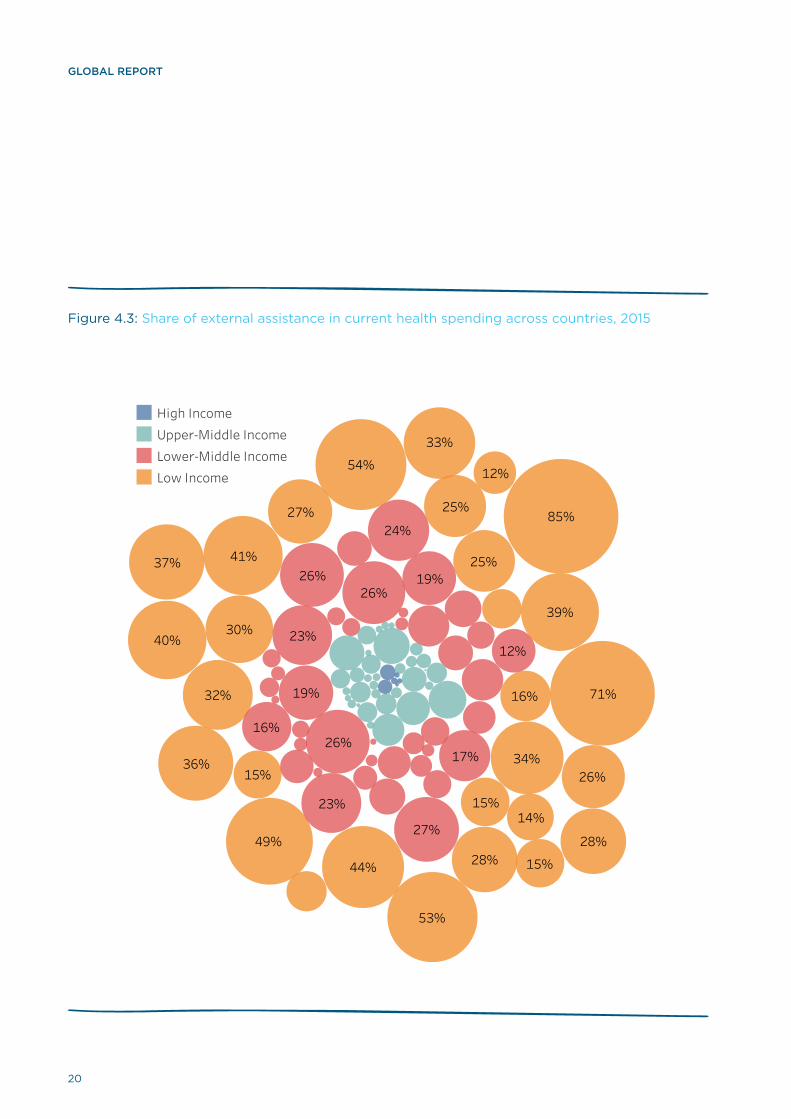
Many countries still rely heavily on external assis-
tance (figure 4.3). According to 2015 data, in 4 of 31
low-income countries, external sources constituted
more than half of current health expenditures, and
in 15, more than 30%. Middle-income countries with
high reliance on external resources are almost all
exclusively small states. Despite their per capita
GDP, they face specific challenges associated with
the size of their economies, among other factors. 17
e The 33% figure is unweighted, meaning that it reflects an average of the percent of externally-sourced health spending across all low-in-come countries. This is distinct from the very small percentage of such expenditures reflected in figure 4.1, which shows the global total amounts of health spending.
0 20% 40% 60%
2015201420132012201120102009200820072006200520042003200220012000
Domestic public spending (%) External on-budget assistance (%)
External off-budget assistance (%)
20
GLOBAL REPORT
28%
37%
40%
15%
14%
53%
12%
33%
26%
85%
36%
54%
27%
71%
49%
32%
25%
28%
15%
25%
39%
15%
44%
41%
30%
34%
16%
24%
27%
16%
23%
12%
26%
17%
19%26%
23%
19%
26%
High IncomeUpper-Middle IncomeLower-Middle IncomeLow Income
Figure 4.3: Share of external assistance in current health spending across countries, 2015

21
GLOBAL REPORT4. THE ROLE OF EXTERNAL FUNDING
Development assistance is highly volatile. The share
of external assistance in health spending varies from
year to year within countries (figure 4.4). This has
strong negative consequences for the country’s abil-
ity to plan and thus use resources efficiently. Some
estimates show that volatility reduces the value of
aid to recipients by 15–20%. 18
There is evidence of fungibility of external funds,
particularly in low-income countries. There has been
a decrease in domestic public spending among the
low-income countries with an accompanying in-
crease in development assistance for health (fig-
ure 4.5). There is evidence of non-additionality of
development assistance for health, where develop-
ment assistance is spent in the health sector, but the
recipient government re-allocates its own resources
to fund other priorities. 18,19
Figure 4.4: Variation in external assistance in low-income countries, 2000–2015
Figure 4.5: Growing share of spending from external sources in current health spending among low-income countries, 2000–2015
MWI
MOZ
HTI
LBR
TZA
RWA
ERI
BFA
BDI
UGA
GMB
GIN
ETH
BEN
CAF
COD
SLE
MDG
GNB
NPL
AFG
MLI
NER
TGO
TCD
SEN
COM
ZWE
SSD
0%
10%
20%
30%
40%
50%
60%
70%
80%
Expe
ndit
ure
from
Ext
erna
l Sou
rces
as
% o
f Cur
rent
Hea
lth
Expe
ndit
ure
2000
2000
2000
2000
20002000
2015
2015
2015
2015
2015
2015
20152015
Note: The vertical lines/boxes represent the variation observed over the period within each of 29 low income countries.

22
GLOBAL REPORT

23
GLOBAL REPORT
2000
2001
2002
2003
2004
2005
2006
2007
2008
2009
2010
2011
2012
2013
2014
2015
0
10
20
30
Out
of P
ocke
t per
cap
ita
(con
stan
t USD
201
0)
Low Income
2000
2001
2002
2003
2004
2005
2006
2007
2008
2009
2010
2011
2012
2013
2014
2015
0
20
40
60
80
100
120
Out
of P
ocke
t per
cap
ita
(con
stan
t USD
201
0)
Lower-middle Income
2000
2001
2002
2003
2004
2005
2006
2007
2008
2009
2010
2011
2012
2013
2014
2015
0
100
200
300
Out
of P
ocke
t per
cap
ita
(con
stan
t USD
201
0)
Upper-middle Income
2000
2001
2002
2003
2004
2005
2006
2007
2008
2009
2010
2011
2012
2013
2014
2015
0
500
1000
Out
of P
ocke
t per
cap
ita
(con
stan
t USD
201
0)
High Income
5. Global spending on health through out-of-pocket payment
Out-of-pocket payment, a key UHC indicator under
the overall SDG monitoring framework, is negatively
associated with financial protection. High out-of-
pocket expenditures result in household financial
hardship and cause millions to forgo needed health
care. 2,20 Many countries have been closely monitor-
ing out-of-pocket payments as a share of current
health spending. WHO, working with countries and
partners, reviewed the entire series of household
out-of-pocket health spending from 2000 to 2015.
This section highlights some central observations
from the data.
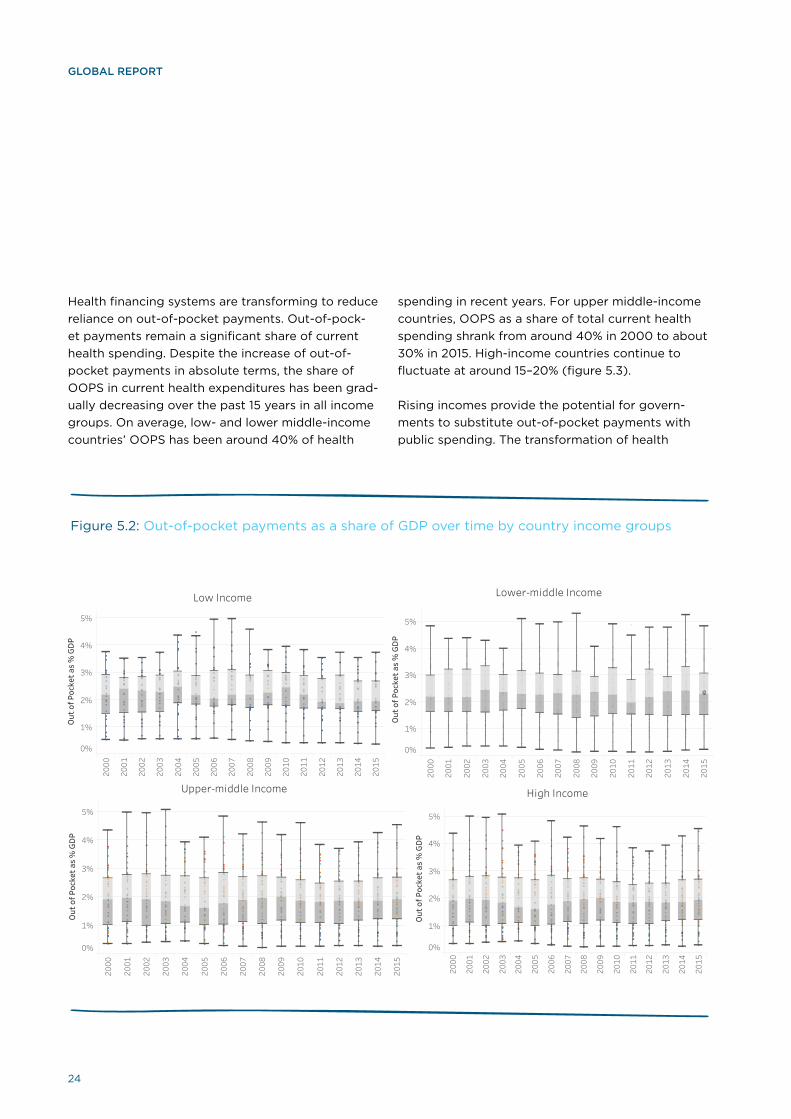
Out-of-pocket health spending is increasing. Peo-
ple spend more on health through out-of-pocket
payment in constant absolute terms for all income
groups (figure 5.1), with high-income countries
increasing fastest and low-income countries slow-
est. The increase in OOPS reflects a combination of
increasing household capacity and willingness to
pay for health services as well as the increased cost
of medical goods or services. But in relative terms,
OOPS as a share of GDP are fairly stable over time,
accounting for about 2% of GDP in recent years in
low-, lower middle- and upper middle-income groups
(figure 5.2).
Figure 5.1: Out-of-pocket payments per capita by country income groups
Note: The horizontal line in the middle of the box represents the median. The box extends from the lower 25th percentile to the upper 25th percentile.
24
GLOBAL REPORT
Figure 5.2: Out-of-pocket payments as a share of GDP over time by country income groups
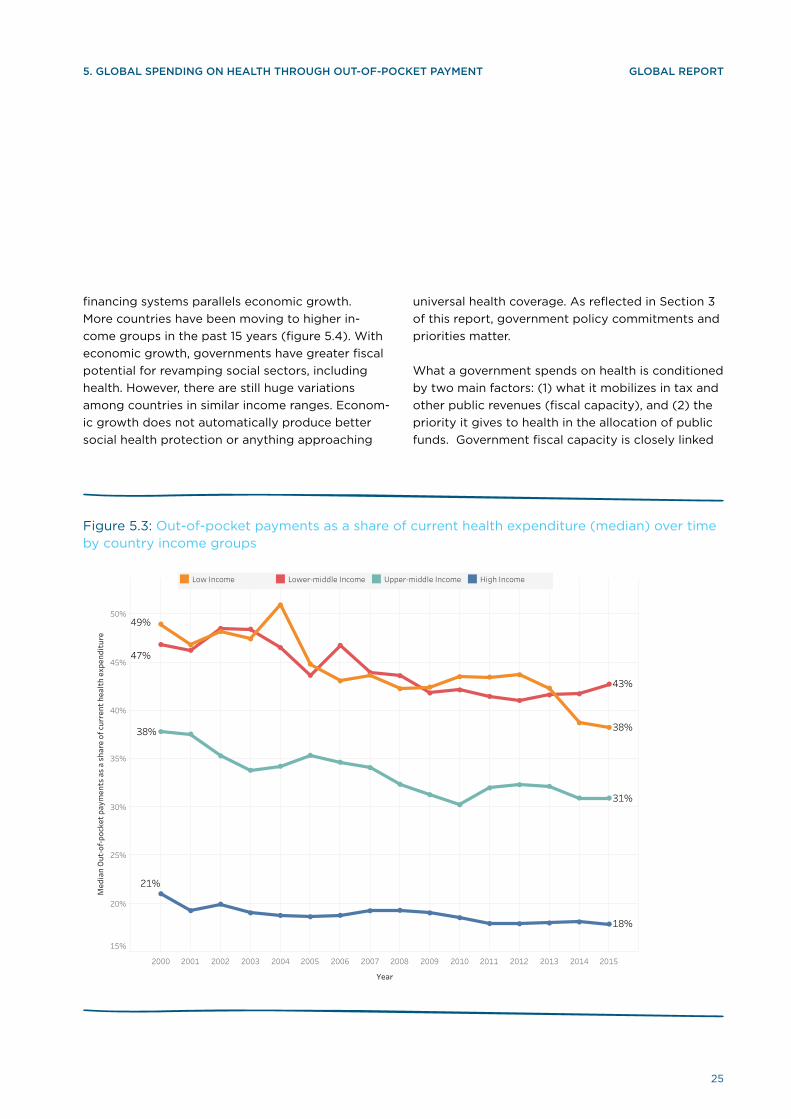
Health financing systems are transforming to reduce
reliance on out-of-pocket payments. Out-of-pock-
et payments remain a significant share of current
health spending. Despite the increase of out-of-
pocket payments in absolute terms, the share of
OOPS in current health expenditures has been grad-
ually decreasing over the past 15 years in all income
groups. On average, low- and lower middle-income
countries’ OOPS has been around 40% of health
spending in recent years. For upper middle-income
countries, OOPS as a share of total current health
spending shrank from around 40% in 2000 to about
30% in 2015. High-income countries continue to
fluctuate at around 15–20% (figure 5.3).
Rising incomes provide the potential for govern-
ments to substitute out-of-pocket payments with
public spending. The transformation of health
2000
2001
2002
2003
2004
2005
2006
2007
2008
2009
2010
2011
2012
2013
2014
2015
0%
1%
2%
3%
4%
5%
Out
of P
ocke
t as
% G
DP
Low Income
2000
2001
2002
2003
2004
2005
2006
2007
2008
2009
2010
2011
2012
2013
2014
2015
0%
1%
2%
3%
4%
5%
Out
of P
ocke
t as
% G
DP
Lower-middle Income
2000
2001
2002
2003
2004
2005
2006
2007
2008
2009
2010
2011
2012
2013
2014
2015
0%
1%
2%
3%
4%
5%
Out
of P
ocke
t as
% G
DP
Upper-middle Income
2000
2001
2002
2003
2004
2005
2006
2007
2008
2009
2010
2011
2012
2013
2014
2015
0%
1%
2%
3%
4%
5%
Out
of P
ocke
t as
% G
DP
High Income
25
GLOBAL REPORT
financing systems parallels economic growth.
More countries have been moving to higher in-
come groups in the past 15 years (figure 5.4). With
economic growth, governments have greater fiscal
potential for revamping social sectors, including
health. However, there are still huge variations
among countries in similar income ranges. Econom-
ic growth does not automatically produce better
social health protection or anything approaching
Figure 5.3: Out-of-pocket payments as a share of current health expenditure (median) over time by country income groups
universal health coverage. As reflected in Section 3
of this report, government policy commitments and
priorities matter.
What a government spends on health is conditioned
by two main factors: (1) what it mobilizes in tax and
other public revenues (fiscal capacity), and (2) the
priority it gives to health in the allocation of public
funds. Government fiscal capacity is closely linked
5. GLOBAL SPENDING ON HEALTH THROUGH OUT-OF-POCKET PAYMENT
2000 2001 2002 2003 2004 2005 2006 2007 2008 2009 2010 2011 2012 2013 2014 2015
Year
15%
20%
25%
30%
35%
40%
45%
50%
Med
ian
Out
-of-
pock
et p
aym
ents
as
a sh
are
of c
urre
nt h
ealt
h ex
pend
itur
e
21%
18%
38%
31%
47%
43%
49%
38%
Low Income Lower-middle Income Upper-middle Income High Income

26
GLOBAL REPORT
to economic development (figures 3.1 and 3.2), al-
though there is variation, and this does not happen
automatically. 14 Priority for health in government re-
source allocation is not inherently linked to country
income level, although figure 3.3 shows that there
is a broad pattern of governments in richer coun-
tries also allocating a greater share of their available
funds to health. Taken together, more fiscal capac-
Figure 5.4: Out-of-pocket as a percentage of current health spending and GDP per capita
ity and a higher priority to health results in greater
public spending on health, f and earlier analyses
7,21 have shown that this results in less dependence
on out-of-pocket spending. And because out-of-
pocket health spending is a critical determinant of
household financial burden attributable to paying
for health services, more public spending on health
is associated with greater financial protection.
Note: Each bubble represents one country, and the size of each bubble represents the relative size of the country’s population.
f Of course, it is not merely the percentage of GDP that matters, but also the absolute amount of public spending, because many of the inputs used in the health sector, such as medicines and devices, reflect international rather than domestic price structures.
100 1,000 10,000 100,000
Log GDP per capita (USD)
0%
10%
20%
30%
40%
50%
60%
70%
80%
90%
Out
of P
ocke
t as
a %
of C
urre
nt H
ealt
h Ex
pend
itur
e
2005
100 1,000 10,000 100,000
Log GDP per capita (USD)
0%
10%
20%
30%
40%
50%
60%
70%
80%
90%
Out
of P
ocke
t as
a %
of C
urre
nt H
ealt
h
2015 RegionAFRAMREMREURSEARWPR
27
GLOBAL REPORT
0% 1% 2% 3% 4% 5% 6% 7% 8% 9% 10%
Public Expenditure on Health as % of GDP
0%
10%
20%
30%
40%
50%
60%
70%
80%
Out
of P
ocke
t as
a %
of C
urre
nt H
ealt
h Ex
pend
itur
e
RegionAFRAMREMREURSEARWPR
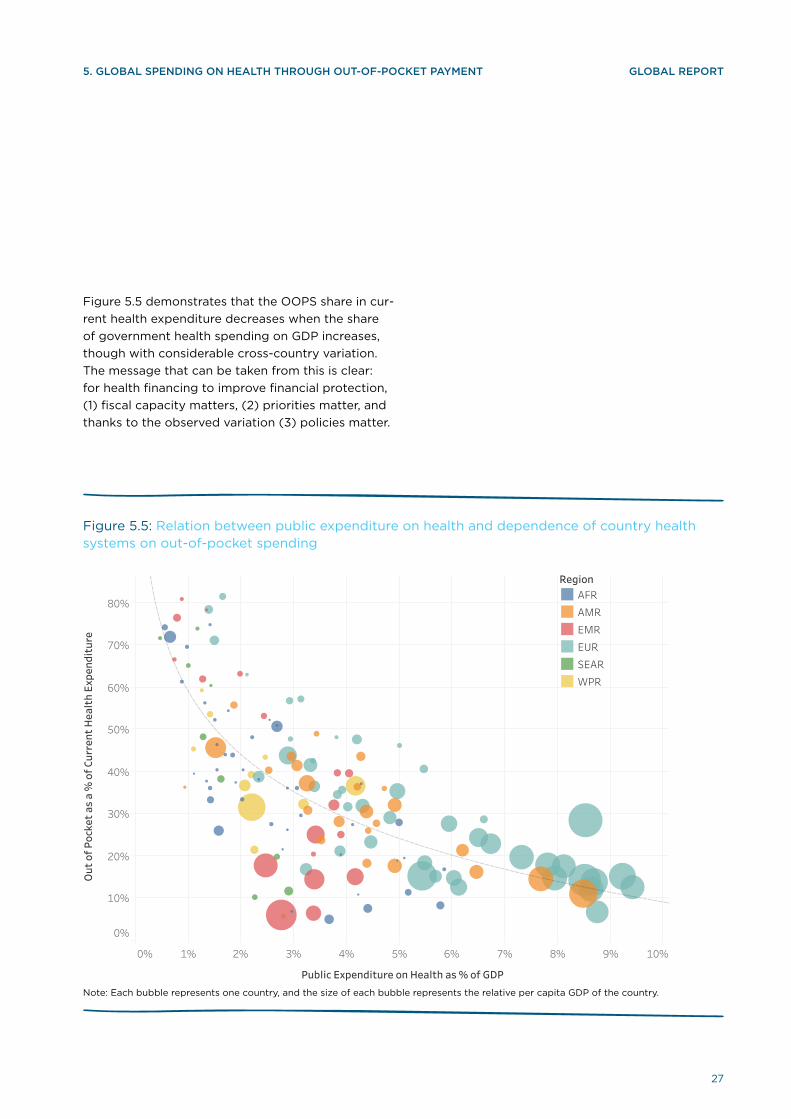
Figure 5.5: Relation between public expenditure on health and dependence of country health systems on out-of-pocket spending
5. GLOBAL SPENDING ON HEALTH THROUGH OUT-OF-POCKET PAYMENT
Note: Each bubble represents one country, and the size of each bubble represents the relative per capita GDP of the country.
Figure 5.5 demonstrates that the OOPS share in cur-
rent health expenditure decreases when the share
of government health spending on GDP increases,
though with considerable cross-country variation.
The message that can be taken from this is clear:
for health financing to improve financial protection,
(1) fiscal capacity matters, (2) priorities matter, and
thanks to the observed variation (3) policies matter.

28
GLOBAL REPORT
29
GLOBAL REPORT
6. Revealing the sources of social health insurance spending
Traditional models of health financing, such as
so-called “tax-funded systems” (also referred to
as the Beveridge model, referring to the type of
arrangements put in place by the UK government
in 1948) or “social health insurance systems” (the
Bismarck model, referring to the first public policy
on health coverage, put in place in Germany in the
1880s) are based on a logic that the source of funds
determines the type of health financing system that
a country has. The functional approach to health
financing 9 posed a challenge to this way of thinking,
arguing (a) that all health financing systems, regard-
less of the label attached, perform the functions of
revenue raising, pooling of funds, and purchasing
of health services; and (b) the source of funds does
not inherently determine choices and options with
regard to the other health financing functions.
Concerns about the traditional approach towards
SHI relying strictly on contributions from the insured
derive from two main considerations. First, for low-
and middle-income countries characterized by a
high degree of labour force informality, the con-
tribution base is quite small, and the approach of
starting explicit coverage with the formal workforce
has been identified as an inequality driver. 22,23,24
For higher income countries, demographic change
means that the share of the working age population
in the economy is shrinking, reducing the relative
size of a wage-linked contribution base, and raising
concerns about unemployment and competitiveness
if action is not taken to diversity revenue sources.
In both contexts, therefore, promoting equitable
progress towards UHC requires diversifying sources
away from contributions and towards general bud-
get revenues.
3A few documented examples 25,26,27 have illustrated
the importance of this issue and potential to pool
tax funding with SHI contributions, but the impor-
tance of this issue to the agenda of health financing
for UHC led WHO to embark on a series of studies
documenting the extent to which countries had
already moved away from the traditional model
of funding SHI. 28,29,30,31 These studies suggest that
many countries that have SHI arrangements are us-
ing general revenues as a revenue source. However,
there was no place to obtain systematic data on the
relative magnitude of different funding sources for
SHI because the SHA-1 classifications only showed
expenditures made by social health insurance agen-
cies but did not include anything on their sources.
By enabling separate reporting on expenditures
made through different financing arrangements
(HF) and the sources (FS) of these expenditures,
the new GHED using SHA-2 classifications allows
new insights into this issue, and is one of the most
important changes that SHA-2 brings to the under-
standing of health financing policies. Because this
is new, however, reporting of data on SHI revenue
sources was not consistent across all countries, and
hence the findings reported here should be seen
as preliminary. WHO will produce a more in-depth
analysis of this issue in 2018.
SHI is widespread, with more than 110 countries
reporting expenditures through these arrangements
in 2015, more than half the countries in the world.g
The importance of SHI in financing health systems
varies, but it tends to play a larger role in high-in-
come countries that use this mechanism (countries
further to the right on the x-axis of figure 6.1). There
are some middle-income countries in which SHI is
an important financing arrangement, but it is not
significant in low-income countries.
g For purposes of the analysis, we are interpreting SHI to include arrangements that involve the compulsory purchase of private health insurance. While very few countries have such a mechanism, the similarities from a policy perspective outweigh the differences, as do concerns with the funding mix for such arrangements in terms of the balance between mandatory contributions by the insured and transfers from general government revenues.

30
GLOBAL REPORT
In high-income countries in which spending through
SHI comprises more than 80% of public spending
on health, most revenues come from SHI contribu-
tions, with budget transfers playing a complemen-
tary role. A likely explanation is that most of the
population of these countries is part of the formal
sector of the economy, and the countries also have
a long history of contributory SHI. In such settings,
the need for budget transfers to ensure universal
affiliation is less than in other contexts. This is also
consistent with the relatively large number of low-
and lower middle-income countries that do not use
budget transfers and, due to the small size of their
formal workforce, SHI constitutes a small share of
government health spending.
Figure 6.1: Relation between importance of SHI to public spending on health and the share of SHI expenditures funded from government budget revenues, 2015
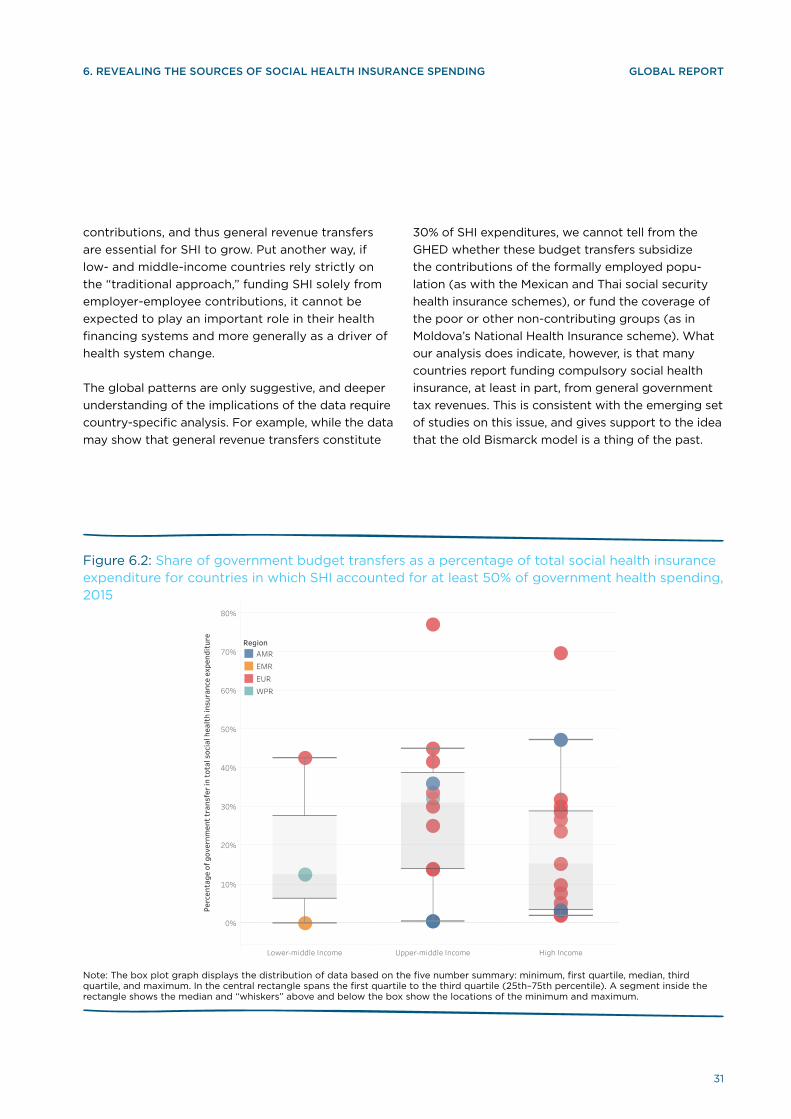
That said, there are a large number of middle- and
upper-income countries in which budget transfers
are the source of between 20–50% of SHI spending.
Figure 6.2 shows the range and median share of SHI
spending coming from budget transfers in coun-
tries in which SHI comprises at least 50% of public
spending on health. While not conclusive, the data
suggest that general budget transfers are essen-
tial if SHI is to play a significant role in the health
financing systems of middle-income countries (and
by extension, low-income countries). Again, this is
consistent with the expectation that higher labour
force informality will yield a lower base for SHI
0% 10% 20% 30% 40% 50% 60% 70% 80% 90% 100%
Social health insurance as a % of GGHE
0%
10%
20%
30%
40%
50%
60%
70%
80%
90%
Perc
enta
ge o
f gov
ernm
ent t
rans
fer i
n to
tal s
ocia
l hea
lth
insu
ranc
e ex
pend
itur
e
High IncomeUpper-middle IncomeLower-middle IncomeLow Income
Social health insurance as a % of public expenditure on health
31
GLOBAL REPORT
contributions, and thus general revenue transfers
are essential for SHI to grow. Put another way, if
low- and middle-income countries rely strictly on
the “traditional approach,” funding SHI solely from
employer-employee contributions, it cannot be
expected to play an important role in their health
financing systems and more generally as a driver of
health system change.
The global patterns are only suggestive, and deeper
understanding of the implications of the data require
country-specific analysis. For example, while the data
may show that general revenue transfers constitute
6. REVEALING THE SOURCES OF SOCIAL HEALTH INSURANCE SPENDING
30% of SHI expenditures, we cannot tell from the
GHED whether these budget transfers subsidize
the contributions of the formally employed popu-
lation (as with the Mexican and Thai social security
health insurance schemes), or fund the coverage of
the poor or other non-contributing groups (as in
Moldova’s National Health Insurance scheme). What
our analysis does indicate, however, is that many
countries report funding compulsory social health
insurance, at least in part, from general government
tax revenues. This is consistent with the emerging set
of studies on this issue, and gives support to the idea
that the old Bismarck model is a thing of the past.
Note: The box plot graph displays the distribution of data based on the five number summary: minimum, first quartile, median, third quartile, and maximum. In the central rectangle spans the first quartile to the third quartile (25th–75th percentile). A segment inside the rectangle shows the median and “whiskers” above and below the box show the locations of the minimum and maximum.
Lower-middle Income Upper-middle Income High Income
0%
10%
20%
30%
40%
50%
60%
70%
80%
Perc
enta
ge o
f gov
ernm
ent t
rans
fer i
n to
tal s
ocia
l hea
lth
insu
ranc
e ex
pend
itur
e
RegionAMREMREURWPR
Figure 6.2: Share of government budget transfers as a percentage of total social health insurance expenditure for countries in which SHI accounted for at least 50% of government health spending, 2015
32
GLOBAL REPORT
At a global level, WHO will continue to compile and publish the health expenditure data. We commit to
work closely with experts and global, regional and local partners to refine the guidelines for implementation,
and to explore and research for better ways of data collection.

33
GLOBAL REPORT
7. Conclusions and future directions
In 2015 the world spent USD 7.3 trillion on health,
representing close to 10% of global GDP. Health
expenditure is growing faster than the overall econ-
omy. The average health expenditure per capita is
USD 1,011, but half of the world’s countries spend
less USD 366 per person.
On average, health financing systems have trans-
formed around the world to greater reliance on
compulsory prepaid and pooled funding, although
beneath this broad depiction of change lies sub-
stantial variation in country experience. But the
general picture suggests that government expendi-
ture on health is increasing in absolute terms and as
a share of total government expenditure, which in-
dicates that health has received higher government
priority over time. Many countries channel budget
revenues to health service purchasing agencies such
as social health insurance funds. In the meantime,
out-of-pocket health expenditure increased in abso-
lute terms, but decreased as a share of total current
health expenditure.
External funding for health represents less than
0.3% of global spending. However, for low-income
countries, external funding counts for 30% of cur-
rent health expenditure on average, and it has been
increasing over time in absolute terms. At the same
time, government fiscal capacity is also increasing.
Yet the increase in fiscal capacity has not translated
into an increase in government health spending;
instead, the increased donor spending appears to
have had a crowding-out effect, leading govern-
ments to reallocate their domestic spending to
other sectors.
The patterns and trends derived from the data
highlight key issues for the attention of countries
and international agencies. As a monitoring tool, the
database supports the tracking of these patterns
over time, and can provide a trigger or entry point for
deeper investigation. This requires going beyond the
global database into country-specific analysis, such
as:
• How much of the health expenditure increase is
caused by the cost increase for producing the
same types and amount of services, how much is
caused by the increased and changed need and
demand of services?
• What is the impact of health expenditure growth
on households, governments, labour markets and
the structure of national economies?
• Is the channelling of government budget reve-
nues to social health insurance agencies for the
purpose of extending coverage to previously un-
derserved populations or does it simply concen-
trate more resources and services for those who
already have good access?
• How to make the aid more effective: target spe-
cific disease programs, overall health systems or
global public goods?
• How much is needed to strengthen health sys-
tem foundations and institutions?
• Which countries are most in need?
• How does external aid crowd out domestic fund-
ing that governments need to invest in health,
and are some ways of channelling aid less sub-
ject to fungibility?
These are, no doubt, just a few of possible questions
that arise from our analysis of the health expendi-
ture data.
Priorities for improving dataAs a global public good, health expenditure track-
ing aims to provide accurate, timely and compa-
rable data to support better decision making at
national, regional and global levels, and to improve
transparency and accountability of local, nation-
al and global governance. Past experiences have
clearly indicated that: a well-developed national
information system is the foundation for accurate
health data, including the health expenditure data;
making use of data for policymaking is the key for
routine health expenditure data collection and for
improve quality of data. Experience suggests that
the following strategies to improve data quality
and use are worth considering:

34
GLOBAL REPORT
• Link health expenditure data collection with the
routine data reporting system in the country.
• Create a virtuous cycle, linking health expendi-
ture data collection with policy development and
analytical work at country level.
• Link health expenditure data collection with oth-
er data collection efforts
• Sequence the implementation of the SHA-2
framework at the country level, focusing initially
on “the basics,” the classification of expendi-
tures into the appropriate HF and FS categories.
Without the basic data on expenditures through
different financing arrangements, and the sourc-
es of these expenditures, the other classifications
cannot be produced reliably on a regular basis
In addition to these process changes, the work
in putting together the new GHED has helped to
identify specific areas for attention that should be
priorities going forward, because of their policy
relevance, the weaknesses observed in the available
data, and the potential to do something about it
through a concerted effort. These are summarized
here.
Separating capital from total expenditure. His-
torically, the GHED health expenditure data did
not separate capital from recurrent spending, and
without new data for all countries and years, there
was no obvious basis on which to make a defensible
estimate of what, for example, capital spending was
in a given country in a given year. While estimation
is more feasible to fill gaps in current spending data,
the scope for error in estimating capital is much
greater. As a result, the 2017 release of the GHED
has many “missings” for capital expenditure.
Going forward, it is clear that this will require use of
specific, tailored questions on capital expenditures
with each country for which data are not currently
reported. Obtaining the data on public and external
sources of capital spending will require close en-
gagement with national finance and health authori-
ties, national and international experts with deeper
knowledge of the financial data reporting systems
of particular countries (as for the Public Investment
Programs where these exist), and closer cooper-
ation with other international agencies. There is
probably also scope for the research community to
at least explore the potential to develop an estima-
tion methodology for missing data-years that might
be plausible.
Capturing external revenue sources of health
expenditure. The shift to SHA-2 did not, in itself,
alter the difficulty of obtaining routine data on all
externally sourced expenditure in a country for a
given year. Efforts were made to collect informa-
tion on expenditures from external sources through
the data collection process, but in many cases
the information was incomplete and required also
using international data sources. Further efforts
35
GLOBAL REPORTCONCLUSIONS AND FUTURE DIRECTIONS
are needed to improve both the completeness of
the information on external inflows, to disentangle
actual expenditures from commitments, and to
depict the channels through which the external aid
flows to both capital and current health spending,
and within the latter through government, NGO and
private financing arrangements. While it will never
be perfect, targeting resources for a data collection
effort in countries that receive large amounts of
development assistance, with the combined efforts
of those countries and the donors that provide the
funding, can greatly improve the situation. Further
work to extract more relevant and reliable data from
the OECD-DAC may also prove fruitful.
Disentangling domestic sources of social health
insurance. h A number of studies have shown that
many countries channel budget revenues to health
insurance agencies, such as social health insurance
funds. The historical GHED data based on the SHA-1
classifications do not, on their own, provide a basis
for estimating the sources of this expenditure, and
thus the information had to be obtained directly
from country health expenditure experts or estimat-
ed using other information. A key resource for this
information proved to be the Annual Reports of SHI
agencies, as these typically report on their revenue
sources. In addition, explicit transfers of general
revenues to social health insurance agencies would
normally appear in the government budget. In many
cases, and using a variety of such sources as well as
expert knowledge on the particular arrangements
of particular countries, we were able to obtain or
otherwise estimate the shares of the sources of
current social health insurance expenditure. Howev-
er, there remains scope to improve the accuracy and
completeness of this information. In particular, by
asking targeted questions to the correct agencies
and obtaining the relevant publicly available data
sources, there is no reason why it will not be pos-
sible to obtain complete and accurate information
on this in the future. The key challenge is knowing
where to look for the data. This can be resolved
through close engagement of those implementing
the data collection process with the health financing
community active in the country.
Characterizing health financing arrangements
correctly. Correct HF classification within the SHA-2
framework requires knowledge of both a country’s
health financing arrangements and of SHA-2. This
knowledge is not quantitative or held in a national
statistical office. Instead, this knowledge typical-
ly rests with people who are involved with health
financing policy in the country and can answer
questions that relate to, for example, the nature of
h Less frequent but still important in some countries are transfers from government budgets to voluntary health insurance. Where this information is obtained, it is reported in the new GHED.

36
GLOBAL REPORT
entitlement or whether an arrangement is compul-
sory or voluntary. In some cases, this knowledge did
not rest with those individuals who were historically
responsible for reporting health expenditure data to
WHO.
Going forward, it will be essential to augment the
skills and background for health expenditure re-
porting by drawing on more health financing policy
expertise, both at national and international levels.
A useful direction to improve data collection will
be to “translate” the classifications into groupings
that will be recognized in a particular country, using
terminology and agency names that exist in that
country. The health financing teams in WHO’s six
regional offices (and sub-regional offices, as in the
case of the African Region) are well positioned to
take on this role, though they would need to be
appropriately resourced for this purpose. In addi-
tion, collaboration with the health financing experts
of partner agencies with staff active in particular
countries, or working closely with networks (such as
P4H), academics, and NGOs, will be very valuable
for this effort going forward.
Given the importance of internationally comparable
health expenditure data and its role as a global pub-
lic good, there is a common interest in ensuring that
it is of high quality and consistently interpreted. In
turn, a well-coordinated collective effort—including
data generation, reporting, and vetting—is needed
to enable improvement in the years to come, and to
provide a sound technical foundation for the analy-
sis and development of health financing policies to
move towards UHC.
At a global level, WHO will continue to compile and
publish the health expenditure data. We commit to
work closely with experts and global, regional and
local partners to refine the guidelines for implemen-
tation, and to explore and research for better ways
of data collection. We will also play the convening
role to coordinate with partners in building country
capacity and technical support for data collec-
tion, analysis and use of health expenditure data
to improve health policy, support monitoring of
implementation, and drive the health financing and
system reform research agenda.

37
GLOBAL REPORTGLOBAL REPORTREFERENCE
References
1 WHO (2017). Together on the road to universal
health coverage: a call to action. Geneva: World
Health Organization.
2 World Health Organization and World Bank
(2017, forthcoming). Tracking universal health
coverage: 2017 global monitoring report. Gene-
va.
3 World Health Organization (2010). The world
health report – Health systems financing: the
path to universal coverage. Geneva.
4 Stenberg, K., O. Hanssen, T. Edejer, M. Bertram,
C. Brindley and A. E. A. Meshreky (2017). “Fi-
nancing transformative health systems towards
achievement of the health Sustainable Devel-
opment Goals: a model for projected resource
needs in 67 low-income and middle-income
countries.” Lancet 5(9): e875–e887.
5 Abel-Smith, B. (1967). An international study of
health expenditure and its relevance for health
planning. Geneva: World Health Organization.
6 OECD, Eurostat and WHO (2017). A System of
Health Accounts 2011: Revised edition. Paris:
OECD Publishing.
7 Kutzin, J., W. Yip and C. Cashin (2016). Alterna-
tive Financing Strategies for Universal Health
Coverage. In R. M. Scheffler, ed., World Scientific
Handbook of Global Health Economics and Pub-
lic Policy. Volume 1 — The Economics of Health
and Health Systems. Singapore: World Scientific
Publishing Co Pte Ltd.
8 OECD (2000). A System of Health Accounts.
Paris: OECD Publishing.
9 Kutzin, J. (2001). “A descriptive framework for
country-level analysis of health care financing
arrangements.” Health Policy 56(3): 171–204.
10 Barroy, H., J. Kutzin, A. Tandon, C. Kurowski, G.
Lie, M. Borowitz, S. Sparkes and E. Dale (2017).
“Commentary: Assessing fiscal space for health
in the SDG era: a different story.” Health Systems
& Reform: DOI: 10.1080/23288604.2017.1395503
11 “http://www.who.int/csr/disease/ebola/one-
year-report/factors/en/” http://www.who.int/
csr/disease/ebola/one-year-report/factors/en/.
12 High-Level Commission on Health Employment
and Economic Growth (2016). Final Report of
the Expert Group. Geneva: World Health Organi-
zation.
13 International Monetary Fund (2014). Public
Expenditure Reform: Making Difficult Choices.
Washington, DC: International Monetary Fund.
14 Barroy, H., K. Vaughan, Y. Tapsoba, E. Dale
and N. Van de Maele (2017). Towards Univer-
sal Health Coverage: Thinking Public. Health
Financing Working Paper No.7. Geneva: World
Health Organization.
15 Barroy, H., S. Sparkes and E. Dale (2016). Assess-
ing fiscal space for health in low and middle in-
come countries: a review of the evidence. Health
Financing Working Paper. Geneva, World Health
Organization.
16 SEEK Development, Duke University, RTI Inter-
national, and the University of California San
Francisco (forthcoming). Development assis-
tance for health to achieve universal health
coverage. Study commissioned by the Interna-
tional Health Partnership for UHC2030. Geneva:
World Health Organization.
17 World Bank (2017). “The World Bank In Small
States.” Retrieved 02.12.2017, 2017, from HY-
PERLINK “http://www.worldbank.org/en/coun-
try/smallstates/overview” http://www.world-
bank.org/en/country/smallstates/overview.
18 Moon, S., and O. Omole (2013). Development
Assistance for Health: Critiques and Proposals
for Change. Chatham House, Centre on Global
Health Security Working Group Papers. London:
The Royal Institute of International Affairs.

38
GLOBAL REPORT
19 Alvarez, M. M., J. Borghi, A. Acharya and A.
Vassall (2016). “Is Development Assistance for
Health fungible? Findings from a mixed methods
case study in Tanzania.” Social Science & Medi-
cine 159: 161–169.
20 Xu, K., D. Evans, G. Carrin, A. Aguilar, P. Mus-
grove, T. Evans (2007). “Protecting Households
From Catastrophic Health Spending.” Health
Affairs, 26(4): 972–983.
21 Kutzin, J. and M. Jakab (2010). “Fiscal context
and health expenditure patterns.” In Kutzin,
J., C. Cashin, and M. Jakab, eds., Implementing
Health Financing Reform: Lessons from Coun-
tries in Transition. Copenhagen, Denmark: World
Health Organization, on behalf of the European
Observatory on Health Systems and Policies.
22 Londoño, J.-L. , and J. Frenk (1997). “Structured
pluralism: towards an innovative model for
health system reform in Latin America.” Health
Policy 41(1): 1–36.
23 Savedoff, W. (2004). “Is there a case for social
insurance?” Health Policy and Planning 19(3):
183–184.
24 Kutzin J (1997). Health insurance for the formal
sector in Africa: ‘yes, but...’ Current Concerns se-
ries, ARA Paper number 14. WHO/ARA/CC/97.4.
Geneva: World Health Organization. Also
available, under the same title, in: Beattie A.,
J. Doherty, L. Gilson, E. Lambo, and R.P. Shaw,
eds. (1998). Sustainable Health Care Financing
in Southern Africa: Papers from an EDI Health-
Policy Seminar Held in Johannesburg, South
Africa, June 1996. Washington, DC: World Bank,
Economic Development Institute.
25 Ikegami, N., B.-K. Yoo, H. Hashimoto, M. Matsu-
moto, H. Ogata, A. Babazono, R. Watanabe, K.
Shibuya, B.-M. Yang, M. R. Reich and Y. Ko-
bayashi (2011). “Japanese universal health cov-
erage: evolution, achievements, and challenges.”
The Lancet 378(9796): 1106–1115.
GLOBAL REPORT REFERENCE
26 Kutzin, J., M. Jakab, S. Shishkin (2009). “From
scheme to system: Social health insurance funds
and the transformation of health financing in
Kyrgyzstan and Moldova.” In D. Chernicho-
vsky and K. Hanson, eds. Innovations in Health
System Finance in Developing and Transitional
Economies. Advances in Health Economics and
Health Services Research, Volume 21. Bingley,
UK: Emerald Group Publishing.
27 Lagomarsino, G., A. Garabrant, A. Adyas, R.
Muga, N. Otoo. (2012). “Moving towards univer-
sal health coverage: Health insurance reforms
in nine developing countries in Africa and Asia.”
Lancet 380: 933–943.
28 Mathauer, I., and T. Behrendt (2017). “Govern-
ment Subsidization of Health Insurance Cover-
age for Vulnerable Population Groups in Latin
America: Experiences and Challenges.” BMC
Health Serv Res 17(145).
29 Mathauer, I., M. Theisling, B. Mathivet and I. Vilcu
(2016). “Government Budget Transfers to Health
Insurance Funds to Cover Vulnerable and Other-
wise Uninsured Population Groups: Institutional
Design and Challenges in Low-and Middle-In-
come Countries of the WHO European Region.”
International Journal for Equity in Health 15(57).
30 Vilcu, I., and I. Mathauer (2016). “State Bud-
get Transfers to Health Insurance Systems for
Universal Health Coverage: Institutional Design
Patterns and Challenges of Covering Those
Outside the Formal Sector in Eastern European
High-Income Countries.” International Journal of
Equity in Health 15(7).
31 Vilcu, I., L. Probst, D. Bayarsaikhan and I.
Mathauer (2016). “Subsidized Health Insurance
Coverage of People in the Informal Sector and
Vulnerable Population Groups: Institutional
design trends in Asia.” International Journal for
Equity in Health 15(165).

39
GLOBAL REPORT
© World Health Organization [2017]
Some rights reserved. This work is available un-
der the Creative Commons Attribution-NonCom-
mercial-ShareAlike 3.0 IGO licence (CC BY-NC-
SA 3.0 IGO; https://creativecommons.org/licenses/
by-nc-sa/3.0/igo).
Under the terms of this licence, you may copy,
redistribute and adapt the work for non-commer-
cial purposes, provided the work is appropriately
cited, as indicated below. In any use of this work,
there should be no suggestion that WHO endorses
any specific organization, products or services. The
use of the WHO logo is not permitted. If you adapt
the work, then you must license your work under
the same or equivalent Creative Commons licence.
If you create a translation of this work, you should
add the following disclaimer along with the sug-
gested citation: “This translation was not created
by the World Health Organization (WHO). WHO is
not responsible for the content or accuracy of this
translation. The original English edition shall be the
binding and authentic edition”.
Any mediation relating to disputes arising under the
licence shall be conducted in accordance with the
mediation rules of the World Intellectual Property
Organization.
Suggested citation. New Perspectives on Global
Health Spending for Universal Health Coverage.
Geneva: World Health Organization; 2017. Licence:
CC BY-NC-SA 3.0 IGO.
Cataloguing-in-Publication (CIP) data. CIP data are
available at http://apps.who.int/iris.
Sales, rights and licensing. To purchase WHO pub-
lications, see http://apps.who.int/bookorders. To
submit requests for commercial use and queries on
rights and licensing, see http://www.who.int/about/
licensing.
Third-party materials. If you wish to reuse material
from this work that is attributed to a third party,
such as tables, figures or images, it is your respon-
sibility to determine whether permission is needed
for that reuse and to obtain permission from the
copyright holder. The risk of claims resulting from
infringement of any third-party-owned component
in the work rests solely with the user.
General disclaimers. The designations employed
and the presentation of the material in this publi-
cation do not imply the expression of any opinion
whatsoever on the part of WHO concerning the le-
gal status of any country, territory, city or area or of
its authorities, or concerning the delimitation of its
frontiers or boundaries. Dotted and dashed lines on
maps represent approximate border lines for which
there may not yet be full agreement.
The mention of specific companies or of certain
manufacturers’ products does not imply that they
are endorsed or recommended by WHO in prefer-
ence to others of a similar nature that are not men-
tioned. Errors and omissions excepted, the names
of proprietary products are distinguished by initial
capital letters.
All reasonable precautions have been taken by WHO
to verify the information contained in this publi-
cation. However, the published material is being
distributed without warranty of any kind, either
expressed or implied. The responsibility for the inter-
pretation and use of the material lies with the reader.
In no event shall WHO be liable for damages arising
from its use.
The named authors Ke Xu, Agnes Soucat, Joe
Kutzin, Callum Brindley, Elina Dale, Nathalie Van de
Maele, Tomas Roubal, Chandika Indikadahena, Hap-
sa Toure, and Veneta Cherilova alone are responsi-
ble for the views expressed in this publication.
WHO/HIS/HGF/HFWorkingPaper/17.10

WWW