Embed Size (px)
Citation preview
University of Nebraska - LincolnDigitalCommons@University of Nebraska - Lincoln
NASA Publications National Aeronautics and Space Administration
1-1-2002
Global products of vegetation leaf area and fractionabsorbed PAR from year one of MODIS dataR. B. MyneniBoston University
S. HoffmanBoston University
Y. KnyazikhinBoston University
J. L. PrivetteNASA Goddard Space Flight Center
J. GlassyUniversity of Montana
See next page for additional authors
Follow this and additional works at: http://digitalcommons.unl.edu/nasapubPart of the Physical Sciences and Mathematics Commons
This Article is brought to you for free and open access by the National Aeronautics and Space Administration at DigitalCommons@University ofNebraska - Lincoln. It has been accepted for inclusion in NASA Publications by an authorized administrator of DigitalCommons@University ofNebraska - Lincoln.
Myneni, R. B.; Hoffman, S.; Knyazikhin, Y.; Privette, J. L.; Glassy, J.; Tian, Y.; Wang, Y.; Song, X.; Zhang, Y.; Smith, G. R.; Lotsch, A.;Friedl, M.; Morisette, J. T.; Votava, P.; Nemani, R. R.; and Running, S. W., "Global products of vegetation leaf area and fractionabsorbed PAR from year one of MODIS data" (2002). NASA Publications. Paper 39.http://digitalcommons.unl.edu/nasapub/39
AuthorsR. B. Myneni, S. Hoffman, Y. Knyazikhin, J. L. Privette, J. Glassy, Y. Tian, Y. Wang, X. Song, Y. Zhang, G. R.Smith, A. Lotsch, M. Friedl, J. T. Morisette, P. Votava, R. R. Nemani, and S. W. Running
This article is available at DigitalCommons@University of Nebraska - Lincoln: http://digitalcommons.unl.edu/nasapub/39
Global products of vegetation leaf area and fraction absorbed PAR
from year one of MODIS data
R.B. Myneni a,*, S. Hoffman a, Y. Knyazikhin a, J.L. Privette b, J. Glassy c, Y. Tian a,Y. Wang a, X. Song a, Y. Zhang a, G.R. Smith a, A. Lotsch a, M. Friedl a, J.T. Morisette b,
P. Votava c, R.R. Nemani c, S.W. Running c
aDepartment of Geography, Boston University, 675 Commonwealth Avenue, Boston, MA, 02215, USAbBiospheric Sciences Branch, NASA Goddard Space Flight Center, Greenbelt, MD, 20771, USA
cSchool of Forestry, University of Montana, Missoula, MT, USA
Received 6 April 2001; received in revised form 16 January 2002; accepted 18 February 2002
Abstract
An algorithm based on the physics of radiative transfer in vegetation canopies for the retrieval of vegetation green leaf area index (LAI)
and fraction of absorbed photosynthetically active radiation (FPAR) from surface reflectances was developed and implemented for
operational processing prior to the launch of the moderate resolution imaging spectroradiometer (MODIS) aboard the TERRA platform in
December of 1999. The performance of the algorithm has been extensively tested in prototyping activities prior to operational production.
Considerable attention was paid to characterizing the quality of the product and this information is available to the users as quality assessment
(QA) accompanying the product. The MODIS LAI/FPAR product has been operationally produced from day one of science data processing
from MODIS and is available free of charge to the users from the Earth Resources Observation System (EROS) Data Center Distributed
Active Archive Center. Current and planned validation activities are aimed at evaluating the product at several field sites representative of the
six structural biomes. Example results illustrating the physics and performance of the algorithm are presented together with initial QA and
validation results. Potential users of the product are advised of the provisional nature of the product in view of changes to calibration,
geolocation, cloud screening, atmospheric correction and ongoing validation activities.
D 2002 Published by Elsevier Science Inc.
1. Introduction
Leaf area index (LAI) and fraction of photosynthetically
active radiation (0.4–0.7 Am) absorbed by vegetation
(FPAR) characterize vegetation canopy functioning and
energy absorption capacity. LAI is defined as one sided
green leaf area per unit ground area in broadleaf canopies
and as the projected needle leaf area in coniferous canopies.
LAI and FPAR are key parameters in most ecosystem
productivity models and global models of climate, hydrol-
ogy, biogeochemistry and ecology (Sellers et al., 1997). For
effective use in large-scale models, these variables must be
collected over a long period of time and should represent
every region of the terrestrial surface. Satellite remote
sensing is the most effective means of collecting such global
fields on a regular basis. Advances in remote sensing
technology (Deschamps et al., 1994; Diner et al., 1999;
Justice et al., 1998) and radiative transfer modeling (Myneni
and Ross, 1991; Ross, Knyazikhin, Marshak, & Nilson,
1992) have improved the possibility of accurate estimation
of these parameters from spectral and angular dimensions of
remotely sensed data. The launch of TERRAwith moderate
resolution imaging spectroradiometer (MODIS) and multi-
angle imaging spectroradiometer (MISR) instruments
onboard began a new era in remote sensing of the Earth
system. In contrast to previous single-angle and few-channel
instruments, MODIS and MISR together allow for rich
spectral and angular sampling of the reflected radiation
field. This sets new demands on retrieval techniques for
geophysical parameters in order to take full advantage of
these instruments. In this context, we have developed a
synergistic algorithm for the extraction of LAI and FPAR
from MODIS- and MISR-measured canopy reflectance data,
0034-4257/02/$ - see front matter D 2002 Published by Elsevier Science Inc.
PII: S0034 -4257 (02 )00074 -3
* Corresponding author. Tel.: +1-617-353-5742; fax: +1-617-353-8399.
E-mail address: [email protected] (R.B. Myneni).
www.elsevier.com/locate/rse
Remote Sensing of Environment 83 (2002) 214–231
with the flexibility of using the same algorithm in MODIS-
only and MISR-only modes as well (Knyazikhin, Marton-
chik, Diner, et al., 1998; Knyazikhin, Martonchik, Myneni,
et al., 1998).
In this paper, we provide an overview of the MODIS
LAI/FPAR research. This includes a description of the
salient features of the algorithm, evaluation of its perform-
ance, details of the product from year one of MODIS data
and initial results of validation with field data. The
MODIS LAI/FPAR product is currently being produced
operationally and is available to the user community free
of charge.
2. The MODIS LAI/FPAR algorithm
The operational MODIS algorithm ingests up to seven
atmosphere-corrected surface spectral bi-directional reflec-
tance factors (BRFs) and their uncertainties and outputs
the most probable values for pixel LAI, FPAR and their
respective dispersions. The theoretical basis of the algo-
rithm is given in Knyazikhin, Martonchik, Myneni, et al.
(1998) and the implementation aspects are discussed in
Knyazikhin et al. (1999). A look-up-table (LUT) method
is used to achieve inversion of the three-dimensional
radiative transfer problem. When this method fails to
localize a solution, a back-up method based on relations
between the normalized difference vegetation index
(NDVI) and LAI/FPAR (Knyazikhin, Martonchik,
Myneni, et al., 1998; Myneni, Hall, Sellers, & Marshak,
1995) are utilized together with a biome classification
map. The principal features of the LUT-based method are
summarized below.
2.1. Global biome map
Global vegetation is stratified into six canopy architec-
tural types, or biomes, in our approach to LAI/FPAR
retrieval. The six biomes are grasses and cereal crops,
shrubs, broadleaf crops, savannas, broadleaf forests and
needle leaf forests. These biomes span structural variations
along the horizontal (homogeneous vs. heterogeneous) and
vertical (single- vs. multi-story) dimensions, canopy height,
leaf type, soil brightness and climate (precipitation and
temperature) space of herbaceous and woody vegetation
globally.
Nomenclature
a(k) Absorptance at kAVHRR Advanced Very High Resolution Radiometer
BRF Bi-directional reflectance factor
DAAC Distributed Active Archive Center
e Uncertainty in spectral reflectance measurement
EOS Earth Observing System
EROS Earth Resources Observation System
ETM+ Enhanced Thematic Mapper +
FPAR Fraction of absorbed Photosynthetically Active Radiation
GLCC Global Land Cover Characterization database
HDF Hierarchical Data Format
LAI Leaf Area Index
LANDSAT Land remote sensing Satellite
LASUR Land Surface Reflectance
LUT Look-up-table
MISR Multi-angle Imaging Spectrometer
MOD15A1 Daily LAI/FPAR product from MODIS
MOD15A2 8-day composite LAI/FPAR product from MODIS
MODIS Moderate resolution imaging spectroradiometer
NIR Near infra-red
NDVI Normalized Differential Vegetation Index
POLDER Polarization and Directionality of Earth’s Reflectances
QA Quality assessment
RI Retrieval Index
SeaWiFS Sea-viewing Wide Field-of-view Sensor
SLCR Seasonal land cover regions
t(E) Transmittance at kTERRA EOS-AM spacecraft (Launched 1999)
R.B. Myneni et al. / Remote Sensing of Environment 83 (2002) 214–231 215
The biome map reduces the number of unknowns of
the inverse problem through the use of simplifying
assumptions (e.g., model leaf normal orientation distribu-
tions) and standard constants (e.g., leaf, wood, litter and
soil optical properties) that are assumed to vary with bio-
me and soil types only. This approach is similar to that
adopted in many global models which assume certain key
parameters to vary only by vegetation type and utilize a
land cover classification to achieve spatialization. The as-
sumption that vegetation within each 1 km MODIS pixel
belongs to one of the six biomes impacts performance of
the algorithm.
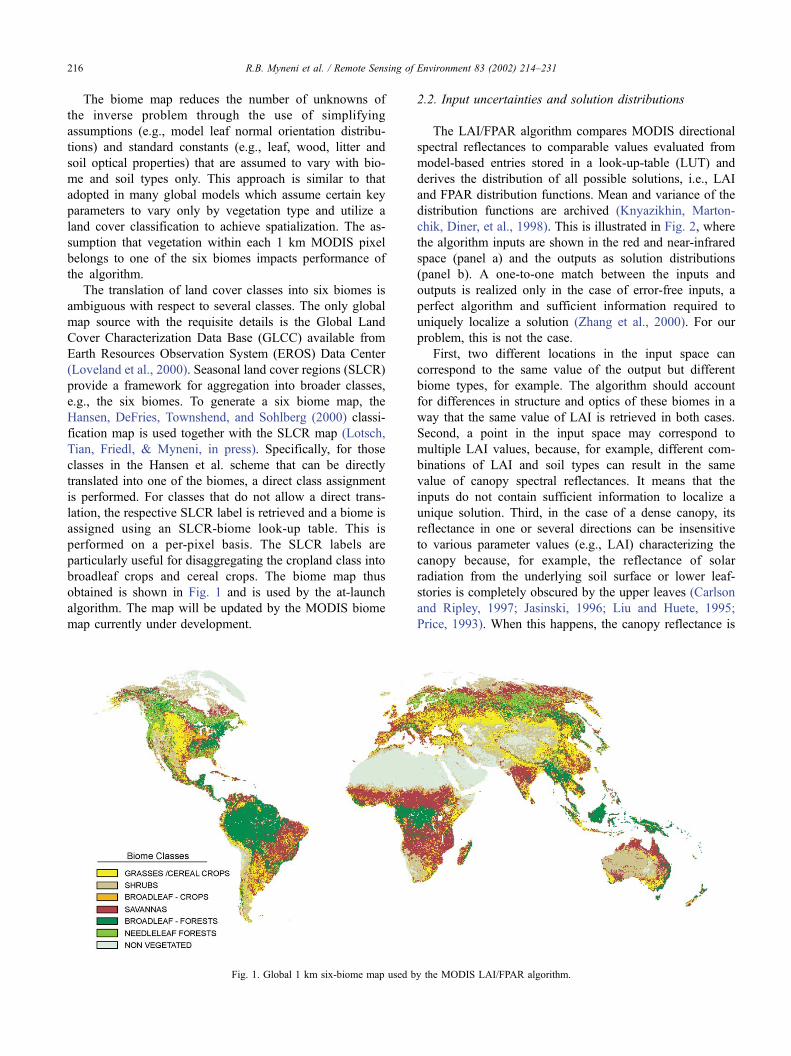
The translation of land cover classes into six biomes is
ambiguous with respect to several classes. The only global
map source with the requisite details is the Global Land
Cover Characterization Data Base (GLCC) available from
Earth Resources Observation System (EROS) Data Center
(Loveland et al., 2000). Seasonal land cover regions (SLCR)
provide a framework for aggregation into broader classes,
e.g., the six biomes. To generate a six biome map, the
Hansen, DeFries, Townshend, and Sohlberg (2000) classi-
fication map is used together with the SLCR map (Lotsch,
Tian, Friedl, & Myneni, in press). Specifically, for those
classes in the Hansen et al. scheme that can be directly
translated into one of the biomes, a direct class assignment
is performed. For classes that do not allow a direct trans-
lation, the respective SLCR label is retrieved and a biome is
assigned using an SLCR-biome look-up table. This is
performed on a per-pixel basis. The SLCR labels are
particularly useful for disaggregating the cropland class into
broadleaf crops and cereal crops. The biome map thus
obtained is shown in Fig. 1 and is used by the at-launch
algorithm. The map will be updated by the MODIS biome
map currently under development.
2.2. Input uncertainties and solution distributions
The LAI/FPAR algorithm compares MODIS directional
spectral reflectances to comparable values evaluated from
model-based entries stored in a look-up-table (LUT) and
derives the distribution of all possible solutions, i.e., LAI
and FPAR distribution functions. Mean and variance of the
distribution functions are archived (Knyazikhin, Marton-
chik, Diner, et al., 1998). This is illustrated in Fig. 2, where
the algorithm inputs are shown in the red and near-infrared
space (panel a) and the outputs as solution distributions
(panel b). A one-to-one match between the inputs and
outputs is realized only in the case of error-free inputs, a
perfect algorithm and sufficient information required to
uniquely localize a solution (Zhang et al., 2000). For our
problem, this is not the case.
First, two different locations in the input space can
correspond to the same value of the output but different
biome types, for example. The algorithm should account
for differences in structure and optics of these biomes in a
way that the same value of LAI is retrieved in both cases.
Second, a point in the input space may correspond to
multiple LAI values, because, for example, different com-
binations of LAI and soil types can result in the same
value of canopy spectral reflectances. It means that the
inputs do not contain sufficient information to localize a
unique solution. Third, in the case of a dense canopy, its
reflectance in one or several directions can be insensitive
to various parameter values (e.g., LAI) characterizing the
canopy because, for example, the reflectance of solar
radiation from the underlying soil surface or lower leaf-
stories is completely obscured by the upper leaves (Carlson
and Ripley, 1997; Jasinski, 1996; Liu and Huete, 1995;
Price, 1993). When this happens, the canopy reflectance is
Fig. 1. Global 1 km six-biome map used by the MODIS LAI/FPAR algorithm.
R.B. Myneni et al. / Remote Sensing of Environment 83 (2002) 214–231216
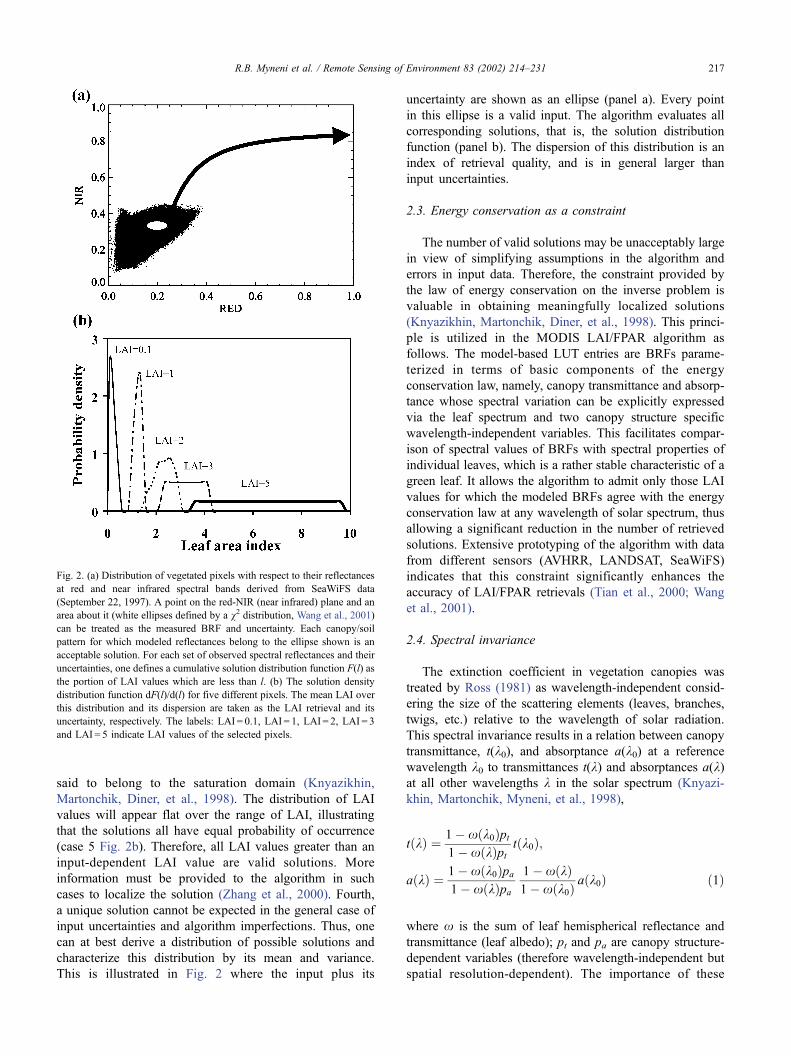
said to belong to the saturation domain (Knyazikhin,
Martonchik, Diner, et al., 1998). The distribution of LAI
values will appear flat over the range of LAI, illustrating
that the solutions all have equal probability of occurrence
(case 5 Fig. 2b). Therefore, all LAI values greater than an
input-dependent LAI value are valid solutions. More
information must be provided to the algorithm in such
cases to localize the solution (Zhang et al., 2000). Fourth,
a unique solution cannot be expected in the general case of
input uncertainties and algorithm imperfections. Thus, one
can at best derive a distribution of possible solutions and
characterize this distribution by its mean and variance.
This is illustrated in Fig. 2 where the input plus its
uncertainty are shown as an ellipse (panel a). Every point
in this ellipse is a valid input. The algorithm evaluates all
corresponding solutions, that is, the solution distribution
function (panel b). The dispersion of this distribution is an
index of retrieval quality, and is in general larger than
input uncertainties.
2.3. Energy conservation as a constraint
The number of valid solutions may be unacceptably large
in view of simplifying assumptions in the algorithm and
errors in input data. Therefore, the constraint provided by
the law of energy conservation on the inverse problem is
valuable in obtaining meaningfully localized solutions
(Knyazikhin, Martonchik, Diner, et al., 1998). This princi-
ple is utilized in the MODIS LAI/FPAR algorithm as
follows. The model-based LUT entries are BRFs parame-
terized in terms of basic components of the energy
conservation law, namely, canopy transmittance and absorp-
tance whose spectral variation can be explicitly expressed
via the leaf spectrum and two canopy structure specific
wavelength-independent variables. This facilitates compar-
ison of spectral values of BRFs with spectral properties of
individual leaves, which is a rather stable characteristic of a
green leaf. It allows the algorithm to admit only those LAI
values for which the modeled BRFs agree with the energy
conservation law at any wavelength of solar spectrum, thus
allowing a significant reduction in the number of retrieved
solutions. Extensive prototyping of the algorithm with data
from different sensors (AVHRR, LANDSAT, SeaWiFS)
indicates that this constraint significantly enhances the
accuracy of LAI/FPAR retrievals (Tian et al., 2000; Wang
et al., 2001).
2.4. Spectral invariance
The extinction coefficient in vegetation canopies was
treated by Ross (1981) as wavelength-independent consid-
ering the size of the scattering elements (leaves, branches,
twigs, etc.) relative to the wavelength of solar radiation.
This spectral invariance results in a relation between canopy
transmittance, t(k0), and absorptance a(k0) at a reference
wavelength k0 to transmittances t(k) and absorptances a(k)at all other wavelengths k in the solar spectrum (Knyazi-
khin, Martonchik, Myneni, et al., 1998),
tðkÞ ¼ 1� xðk0Þpt1� xðkÞpt
tðk0Þ;
aðkÞ ¼ 1� xðk0Þpa1� xðkÞpa
1� xðkÞ1� xðk0Þ
aðk0Þ ð1Þ
where x is the sum of leaf hemispherical reflectance and
transmittance (leaf albedo); pt and pa are canopy structure-
dependent variables (therefore wavelength-independent but
spatial resolution-dependent). The importance of these
Fig. 2. (a) Distribution of vegetated pixels with respect to their reflectances
at red and near infrared spectral bands derived from SeaWiFS data
(September 22, 1997). A point on the red-NIR (near infrared) plane and an
area about it (white ellipses defined by a v2 distribution, Wang et al., 2001)
can be treated as the measured BRF and uncertainty. Each canopy/soil
pattern for which modeled reflectances belong to the ellipse shown is an
acceptable solution. For each set of observed spectral reflectances and their
uncertainties, one defines a cumulative solution distribution function F(l) as
the portion of LAI values which are less than l. (b) The solution density
distribution function dF(l)/d(l) for five different pixels. The mean LAI over
this distribution and its dispersion are taken as the LAI retrieval and its
uncertainty, respectively. The labels: LAI = 0.1, LAI = 1, LAI = 2, LAI = 3
and LAI = 5 indicate LAI values of the selected pixels.
R.B. Myneni et al. / Remote Sensing of Environment 83 (2002) 214–231 217
relations is two-fold. The size of the LUT is independent of
the number of spectrally dependent inputs ingested by the
algorithm since wavelength dependencies can be resolved
from reference wavelength entries and knowledge of pt and
pa. Second, the scale dependence of the LUT, because of ptand pa, facilitates validation of coarse scale retrievals with
fine scale field measurements, as discussed later.
3. Performance of the MODIS LAI/FPAR algorithm
In this section, we present results that illustrate the
performance of the algorithm with respect to input and
model uncertainties, multi-band retrievals, dependence on
spatial resolution, impact of biome misclassifications,
reflectance saturation, etc.
3.1. Input and model uncertainties
The uncertainties in input surface reflectances and mod-
els used to generate the LUT set a limit on the quality of
retrievals. Their specification is critical to production of LAI
and FPAR fields of maximum possible quality (Wang et al.,
2001). The in-orbit radiances measured by space-borne
sensors require corrections for calibration and atmospheric
effects and this introduces uncertainty in the surface reflec-
tance products.
Model uncertainty characterizes the ability of models to
approximate natural variability, which in general can be
quite high. These uncertainties depend on the temporal and
spatial resolution of the data as well. Ignoring model
uncertainties in a retrieval algorithm leads to destabilization
of the convergence process because an increase in input
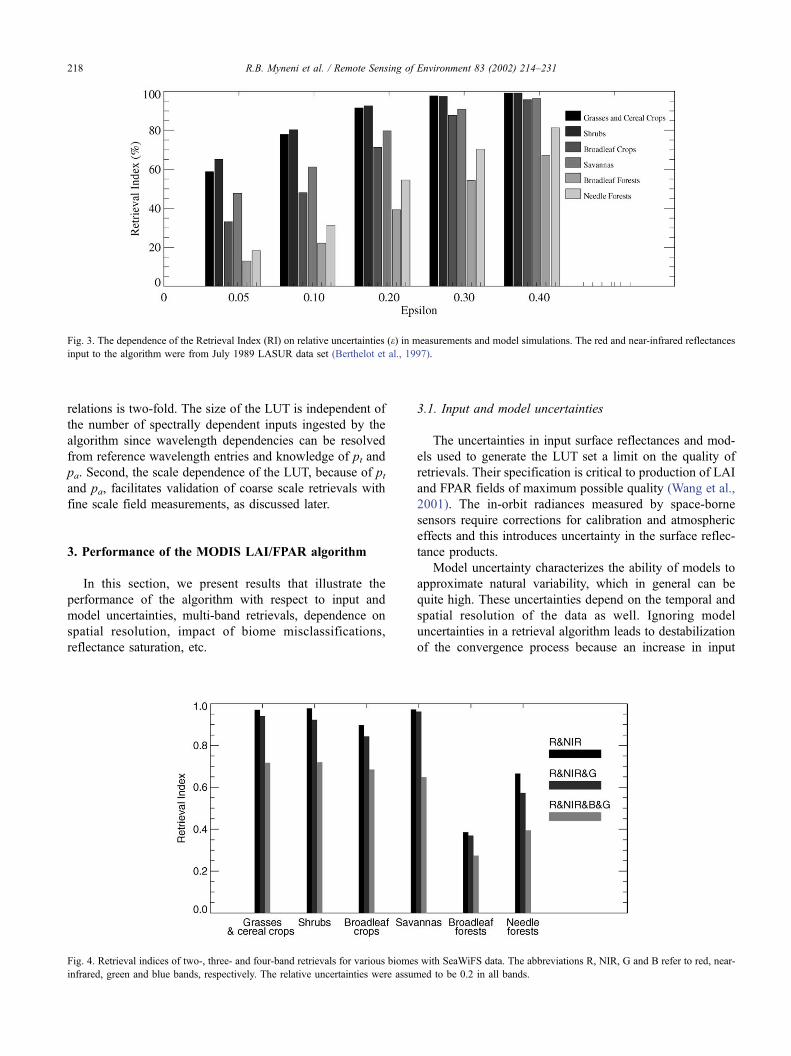
Fig. 3. The dependence of the Retrieval Index (RI) on relative uncertainties (e) in measurements and model simulations. The red and near-infrared reflectances
input to the algorithm were from July 1989 LASUR data set (Berthelot et al., 1997).
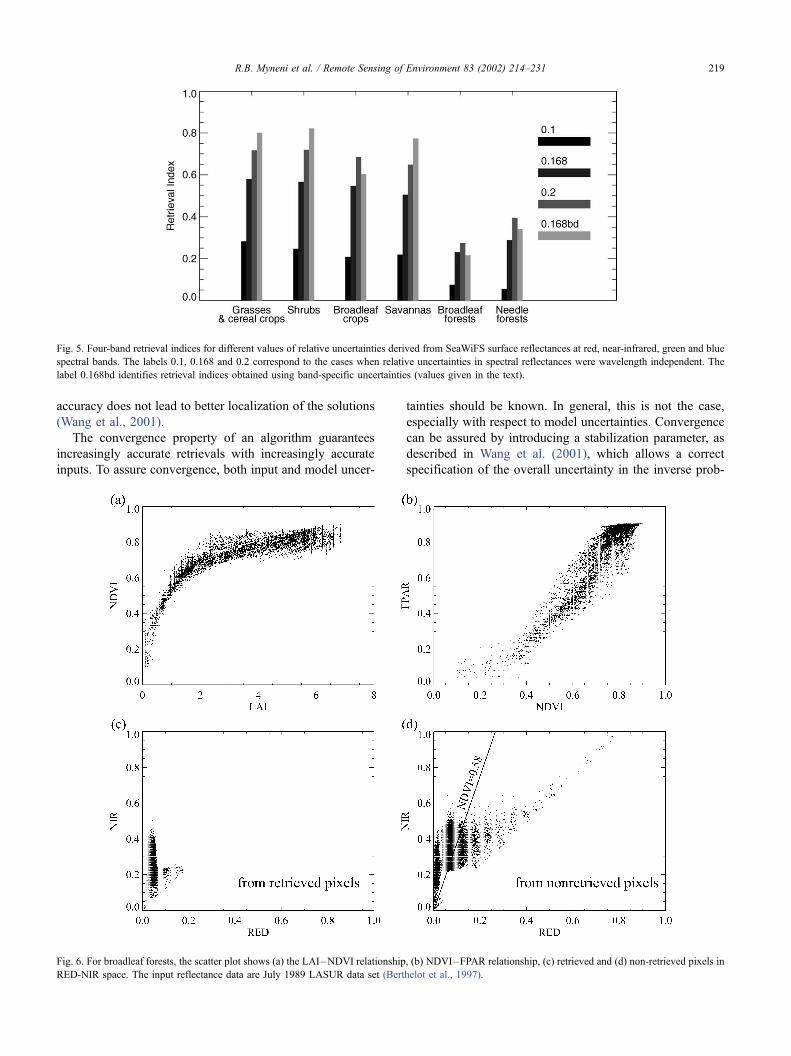
Fig. 4. Retrieval indices of two-, three- and four-band retrievals for various biomes with SeaWiFS data. The abbreviations R, NIR, G and B refer to red, near-
infrared, green and blue bands, respectively. The relative uncertainties were assumed to be 0.2 in all bands.
R.B. Myneni et al. / Remote Sensing of Environment 83 (2002) 214–231218
accuracy does not lead to better localization of the solutions
(Wang et al., 2001).
The convergence property of an algorithm guarantees
increasingly accurate retrievals with increasingly accurate
inputs. To assure convergence, both input and model uncer-
tainties should be known. In general, this is not the case,
especially with respect to model uncertainties. Convergence
can be assured by introducing a stabilization parameter, as
described in Wang et al. (2001), which allows a correct
specification of the overall uncertainty in the inverse prob-
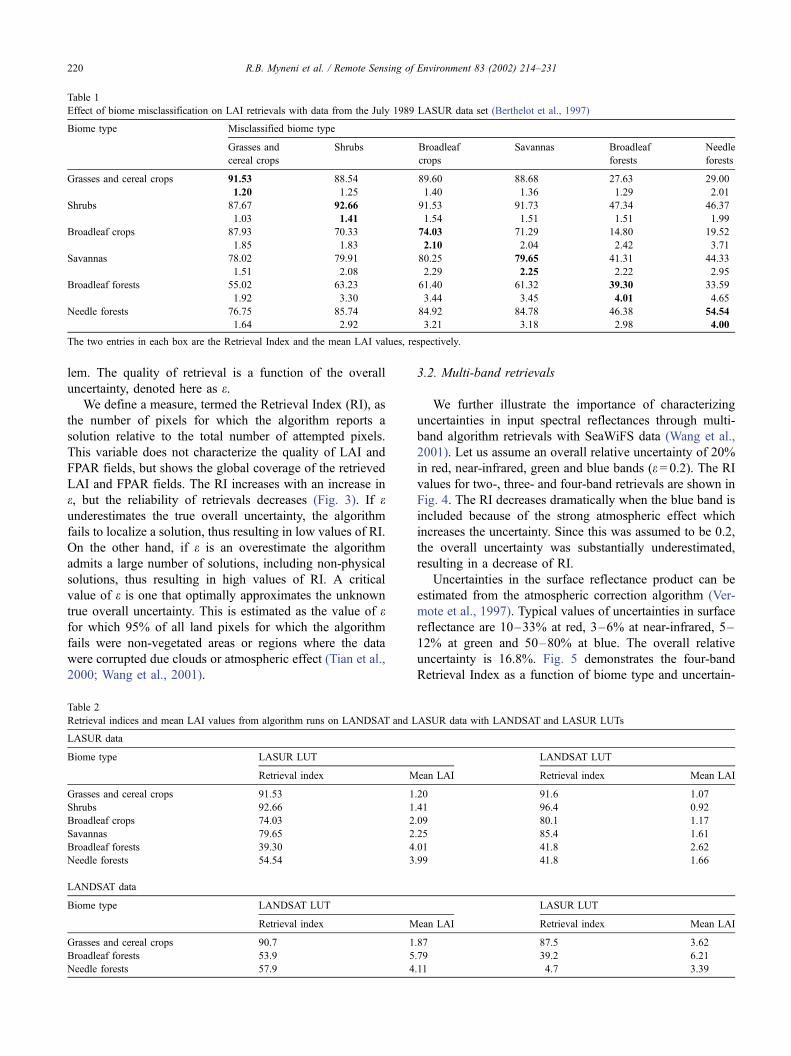
Fig. 5. Four-band retrieval indices for different values of relative uncertainties derived from SeaWiFS surface reflectances at red, near-infrared, green and blue
spectral bands. The labels 0.1, 0.168 and 0.2 correspond to the cases when relative uncertainties in spectral reflectances were wavelength independent. The
label 0.168bd identifies retrieval indices obtained using band-specific uncertainties (values given in the text).
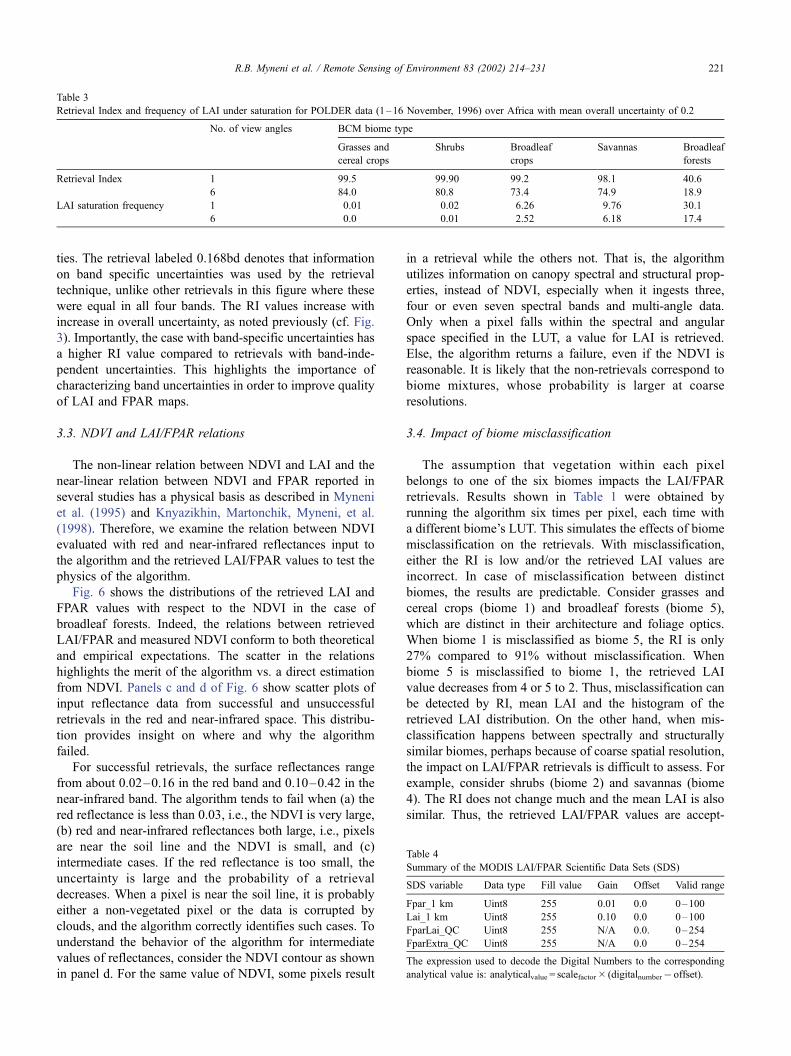
Fig. 6. For broadleaf forests, the scatter plot shows (a) the LAI–NDVI relationship, (b) NDVI–FPAR relationship, (c) retrieved and (d) non-retrieved pixels in
RED-NIR space. The input reflectance data are July 1989 LASUR data set (Berthelot et al., 1997).
R.B. Myneni et al. / Remote Sensing of Environment 83 (2002) 214–231 219
lem. The quality of retrieval is a function of the overall
uncertainty, denoted here as e.We define a measure, termed the Retrieval Index (RI), as
the number of pixels for which the algorithm reports a
solution relative to the total number of attempted pixels.
This variable does not characterize the quality of LAI and
FPAR fields, but shows the global coverage of the retrieved
LAI and FPAR fields. The RI increases with an increase in
e, but the reliability of retrievals decreases (Fig. 3). If eunderestimates the true overall uncertainty, the algorithm
fails to localize a solution, thus resulting in low values of RI.
On the other hand, if e is an overestimate the algorithm
admits a large number of solutions, including non-physical
solutions, thus resulting in high values of RI. A critical
value of e is one that optimally approximates the unknown
true overall uncertainty. This is estimated as the value of efor which 95% of all land pixels for which the algorithm
fails were non-vegetated areas or regions where the data
were corrupted due clouds or atmospheric effect (Tian et al.,
2000; Wang et al., 2001).
3.2. Multi-band retrievals
We further illustrate the importance of characterizing
uncertainties in input spectral reflectances through multi-
band algorithm retrievals with SeaWiFS data (Wang et al.,
2001). Let us assume an overall relative uncertainty of 20%
in red, near-infrared, green and blue bands (e = 0.2). The RIvalues for two-, three- and four-band retrievals are shown in
Fig. 4. The RI decreases dramatically when the blue band is
included because of the strong atmospheric effect which
increases the uncertainty. Since this was assumed to be 0.2,
the overall uncertainty was substantially underestimated,
resulting in a decrease of RI.
Uncertainties in the surface reflectance product can be
estimated from the atmospheric correction algorithm (Ver-
mote et al., 1997). Typical values of uncertainties in surface
reflectance are 10–33% at red, 3–6% at near-infrared, 5–
12% at green and 50–80% at blue. The overall relative
uncertainty is 16.8%. Fig. 5 demonstrates the four-band
Retrieval Index as a function of biome type and uncertain-
Table 1
Effect of biome misclassification on LAI retrievals with data from the July 1989 LASUR data set (Berthelot et al., 1997)
Biome type Misclassified biome type
Grasses and
cereal crops
Shrubs Broadleaf
crops
Savannas Broadleaf
forests
Needle
forests
Grasses and cereal crops 91.53 88.54 89.60 88.68 27.63 29.00
1.20 1.25 1.40 1.36 1.29 2.01
Shrubs 87.67 92.66 91.53 91.73 47.34 46.37
1.03 1.41 1.54 1.51 1.51 1.99
Broadleaf crops 87.93 70.33 74.03 71.29 14.80 19.52
1.85 1.83 2.10 2.04 2.42 3.71
Savannas 78.02 79.91 80.25 79.65 41.31 44.33
1.51 2.08 2.29 2.25 2.22 2.95
Broadleaf forests 55.02 63.23 61.40 61.32 39.30 33.59
1.92 3.30 3.44 3.45 4.01 4.65
Needle forests 76.75 85.74 84.92 84.78 46.38 54.54
1.64 2.92 3.21 3.18 2.98 4.00
The two entries in each box are the Retrieval Index and the mean LAI values, respectively.
Table 2
Retrieval indices and mean LAI values from algorithm runs on LANDSAT and LASUR data with LANDSAT and LASUR LUTs
LASUR data
Biome type LASUR LUT LANDSAT LUT
Retrieval index Mean LAI Retrieval index Mean LAI
Grasses and cereal crops 91.53 1.20 91.6 1.07
Shrubs 92.66 1.41 96.4 0.92
Broadleaf crops 74.03 2.09 80.1 1.17
Savannas 79.65 2.25 85.4 1.61
Broadleaf forests 39.30 4.01 41.8 2.62
Needle forests 54.54 3.99 41.8 1.66
LANDSAT data
Biome type LANDSAT LUT LASUR LUT
Retrieval index Mean LAI Retrieval index Mean LAI
Grasses and cereal crops 90.7 1.87 87.5 3.62
Broadleaf forests 53.9 5.79 39.2 6.21
Needle forests 57.9 4.11 4.7 3.39
R.B. Myneni et al. / Remote Sensing of Environment 83 (2002) 214–231220
ties. The retrieval labeled 0.168bd denotes that information
on band specific uncertainties was used by the retrieval
technique, unlike other retrievals in this figure where these
were equal in all four bands. The RI values increase with
increase in overall uncertainty, as noted previously (cf. Fig.
3). Importantly, the case with band-specific uncertainties has
a higher RI value compared to retrievals with band-inde-
pendent uncertainties. This highlights the importance of
characterizing band uncertainties in order to improve quality
of LAI and FPAR maps.
3.3. NDVI and LAI/FPAR relations
The non-linear relation between NDVI and LAI and the
near-linear relation between NDVI and FPAR reported in
several studies has a physical basis as described in Myneni
et al. (1995) and Knyazikhin, Martonchik, Myneni, et al.
(1998). Therefore, we examine the relation between NDVI
evaluated with red and near-infrared reflectances input to
the algorithm and the retrieved LAI/FPAR values to test the
physics of the algorithm.
Fig. 6 shows the distributions of the retrieved LAI and
FPAR values with respect to the NDVI in the case of
broadleaf forests. Indeed, the relations between retrieved
LAI/FPAR and measured NDVI conform to both theoretical
and empirical expectations. The scatter in the relations
highlights the merit of the algorithm vs. a direct estimation
from NDVI. Panels c and d of Fig. 6 show scatter plots of
input reflectance data from successful and unsuccessful
retrievals in the red and near-infrared space. This distribu-
tion provides insight on where and why the algorithm
failed.
For successful retrievals, the surface reflectances range
from about 0.02–0.16 in the red band and 0.10–0.42 in the
near-infrared band. The algorithm tends to fail when (a) the
red reflectance is less than 0.03, i.e., the NDVI is very large,
(b) red and near-infrared reflectances both large, i.e., pixels
are near the soil line and the NDVI is small, and (c)
intermediate cases. If the red reflectance is too small, the
uncertainty is large and the probability of a retrieval
decreases. When a pixel is near the soil line, it is probably
either a non-vegetated pixel or the data is corrupted by
clouds, and the algorithm correctly identifies such cases. To
understand the behavior of the algorithm for intermediate
values of reflectances, consider the NDVI contour as shown
in panel d. For the same value of NDVI, some pixels result
in a retrieval while the others not. That is, the algorithm
utilizes information on canopy spectral and structural prop-
erties, instead of NDVI, especially when it ingests three,
four or even seven spectral bands and multi-angle data.
Only when a pixel falls within the spectral and angular
space specified in the LUT, a value for LAI is retrieved.
Else, the algorithm returns a failure, even if the NDVI is
reasonable. It is likely that the non-retrievals correspond to
biome mixtures, whose probability is larger at coarse
resolutions.
3.4. Impact of biome misclassification
The assumption that vegetation within each pixel
belongs to one of the six biomes impacts the LAI/FPAR
retrievals. Results shown in Table 1 were obtained by
running the algorithm six times per pixel, each time with
a different biome’s LUT. This simulates the effects of biome
misclassification on the retrievals. With misclassification,
either the RI is low and/or the retrieved LAI values are
incorrect. In case of misclassification between distinct
biomes, the results are predictable. Consider grasses and
cereal crops (biome 1) and broadleaf forests (biome 5),
which are distinct in their architecture and foliage optics.
When biome 1 is misclassified as biome 5, the RI is only
27% compared to 91% without misclassification. When
biome 5 is misclassified to biome 1, the retrieved LAI
value decreases from 4 or 5 to 2. Thus, misclassification can
be detected by RI, mean LAI and the histogram of the
retrieved LAI distribution. On the other hand, when mis-
classification happens between spectrally and structurally
similar biomes, perhaps because of coarse spatial resolution,
the impact on LAI/FPAR retrievals is difficult to assess. For
example, consider shrubs (biome 2) and savannas (biome
4). The RI does not change much and the mean LAI is also
similar. Thus, the retrieved LAI/FPAR values are accept-
Table 3
Retrieval Index and frequency of LAI under saturation for POLDER data (1–16 November, 1996) over Africa with mean overall uncertainty of 0.2
No. of view angles BCM biome type
Grasses and
cereal crops
Shrubs Broadleaf
crops
Savannas Broadleaf
forests
Retrieval Index 1 99.5 99.90 99.2 98.1 40.6
6 84.0 80.8 73.4 74.9 18.9
LAI saturation frequency 1 0.01 0.02 6.26 9.76 30.1
6 0.0 0.01 2.52 6.18 17.4
Table 4
Summary of the MODIS LAI/FPAR Scientific Data Sets (SDS)
SDS variable Data type Fill value Gain Offset Valid range
Fpar_1 km Uint8 255 0.01 0.0 0–100
Lai_1 km Uint8 255 0.10 0.0 0–100
FparLai_QC Uint8 255 N/A 0.0. 0–254
FparExtra_QC Uint8 255 N/A 0.0 0–254
The expression used to decode the Digital Numbers to the corresponding
analytical value is: analyticalvalue = scalefactor� (digitalnumber� offset).
R.B. Myneni et al. / Remote Sensing of Environment 83 (2002) 214–231 221
able, although the pixels have been misclassified. Such a
case also indicates that the biome LUTs share similar entries
for certain combinations of spectral reflectances. This may
be an indication of the limitations of the model used to
build the LUT. Another limitation may be characterizing
global vegetation as six architectural biome types, and not
allowing for mixtures, which is especially an acute problem
with coarse resolution retrievals.
3.5. Scale dependence of the algorithm
Reflectance of the vegetation canopy is scale-dependent.
With a decrease in spatial resolution of satellite data, the
pixels are likely to contain an increasing amount of radiative
contribution from the background (Tian et al., 2000). This
manifests as changes in the location of reflectance data in
the spectral space with changing spatial resolution. Under-
standing the relation between such changes and LAI/FPAR
variations with resolution is key to accomplishing the
scaling that is required in the validation of large area
retrievals with point field measurements. The MODIS
LAI/FPAR algorithm addresses this issue explicitly through
structure-dependent parameters pt and pa, introduced earlier,
which imbue scale dependence to the algorithm via mod-
ifications to the LUTs (Tian et al., 2000).
The scale dependence of the algorithm is illustrated here
with retrievals from algorithm runs on LANDSAT data with
both LANDSAT (30 m) and LASUR (atmospherically
corrected LAnd SUrface Reflectances in the red and near-
infrared channels of the Advanced Very High Resolution
Radiometer (AVHRR) at global scale, 1/7j resolution; 1
week temporal resolution for 1989) LUTs, and on LASUR
data with LANDSAT and LASUR LUTs (Table 2). When
Landsat data and LUT are used, the retrieved LAI values
vary from 0 to 2.5 for grasses, 5–7 for broadleaf forests and
1.5–6 for needle forests. The same runs with LASUR LUT
result in unrealistic retrievals—large LAI values and/or low
retrieval indices because the location of fine resolution data
even in low LAI canopies map to locations of coarse
resolution reflectance data of dense canopies. Likewise,
algorithm runs on LASUR data with LANDSAT LUT result
in low values of LAI for all biomes.
The probability of spatially variable background in a
coarse resolution cell is larger in comparison to fine reso-
lution data. Coarse resolution reflectance data, therefore,
have larger radiative contributions from the background.
While the LAI of the imaged scenes may be identical, the
location of reflectance data in the spectral space changes
with resolution. In the design of the MODIS LAI/FPAR
algorithm, the three-dimensional radiative transfer problem
is split into two sub-problems. The first, the black-soil
problem, describes a vegetation radiation regime for the case
of a completely absorbing background beneath the canopy.
The second, the S-problem, describes the radiation regime
due to interactions between the underlying surface and the
canopy that includes contributions from the background. At
finer resolutions, the contribution of the S-problem is negli-
gible, especially at high LAI values. For example, the
retrieval indices from LANDSAT data and LUT runs can
be as high as 51% (broadleaf forests) using just the black-soil
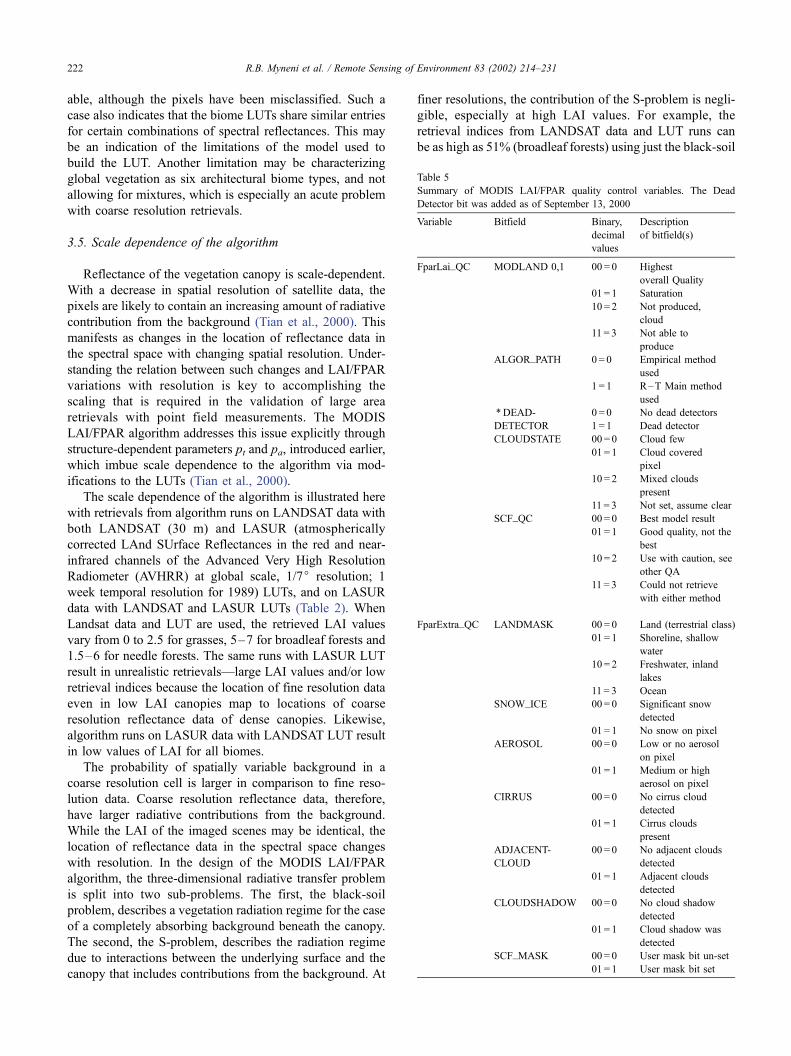
Table 5
Summary of MODIS LAI/FPAR quality control variables. The Dead
Detector bit was added as of September 13, 2000
Variable Bitfield Binary,
decimal
values
Description
of bitfield(s)
FparLai_QC MODLAND 0,1 00 = 0 Highest
overall Quality
01 = 1 Saturation
10 = 2 Not produced,
cloud
11 = 3 Not able to
produce
ALGOR_PATH 0= 0 Empirical method
used
1 = 1 R–T Main method
used
*DEAD- 0 = 0 No dead detectors
DETECTOR 1= 1 Dead detector
CLOUDSTATE 00 = 0 Cloud few
01 = 1 Cloud covered
pixel
10 = 2 Mixed clouds
present
11 = 3 Not set, assume clear
SCF_QC 00 = 0 Best model result
01 = 1 Good quality, not the
best
10 = 2 Use with caution, see
other QA
11 = 3 Could not retrieve
with either method
FparExtra_QC LANDMASK 00 = 0 Land (terrestrial class)
01 = 1 Shoreline, shallow
water
10 = 2 Freshwater, inland
lakes
11 = 3 Ocean
SNOW_ICE 00 = 0 Significant snow
detected
01 = 1 No snow on pixel
AEROSOL 00 = 0 Low or no aerosol
on pixel
01 = 1 Medium or high
aerosol on pixel
CIRRUS 00 = 0 No cirrus cloud
detected
01 = 1 Cirrus clouds
present
ADJACENT-
CLOUD
00= 0 No adjacent clouds
detected
01 = 1 Adjacent clouds
detected
CLOUDSHADOW 00= 0 No cloud shadow
detected
01 = 1 Cloud shadow was
detected
SCF_MASK 00 = 0 User mask bit un-set
01 = 1 User mask bit set
R.B. Myneni et al. / Remote Sensing of Environment 83 (2002) 214–231222
problem compared to 54% when the S-problem is included.
With coarse resolution LASUR data, however, the RI values
for just the black-soil problem are low (31%), which high-
lights the importance of background contributions.
3.6. Reflectance saturation
In the case of dense canopies, the reflectances saturate,
and are therefore insensitive to changes in LAI. The canopy
reflectances are then said to belong to the saturation domain
(Knyazikhin, Martonchik, Diner, et al., 1998). The reliabil-
ity of parameters retrieved under conditions of saturation is
low, that is, the dispersion of the solution distribution is
large (Fig. 2, case 5). The frequency of LAI retrievals under
saturation also increases with increasing uncertainties. The
saturation domain can be avoided if more information can
be provided to the algorithm in the form of multi-angle and
multi-spectral data (Zhang et al., 2000). Below, we illustrate
the saturation domain problem with multi-angle retrievals.
Example algorithm runs with multi-spectral, multi-angle
data over Africa from the POLDER instrument (Leroy et al.,
1997), assuming a mean overall uncertainty of 20%, were
performed. The LAI saturation frequency decreases with an
increase in the number of view angles (Table 3). This is
evidence of the enhanced information content of multi-angle
data, as it helps localize a value of LAI. As expected, the
saturation domain is rarely encountered in sparse biomes,
such as grasses and shrubs.
Saturation domain retrievals are flagged in the quality
assessment (QA) files accompanying the MODIS LAI/
FPAR product. For each such retrieval, the lower bound
of the LAI domain can be evaluated (Knyazikhin, Marton-
chik, Diner, et al., 1998). This value is to be interpreted as
follows: all values of LAI above this threshold, up to the
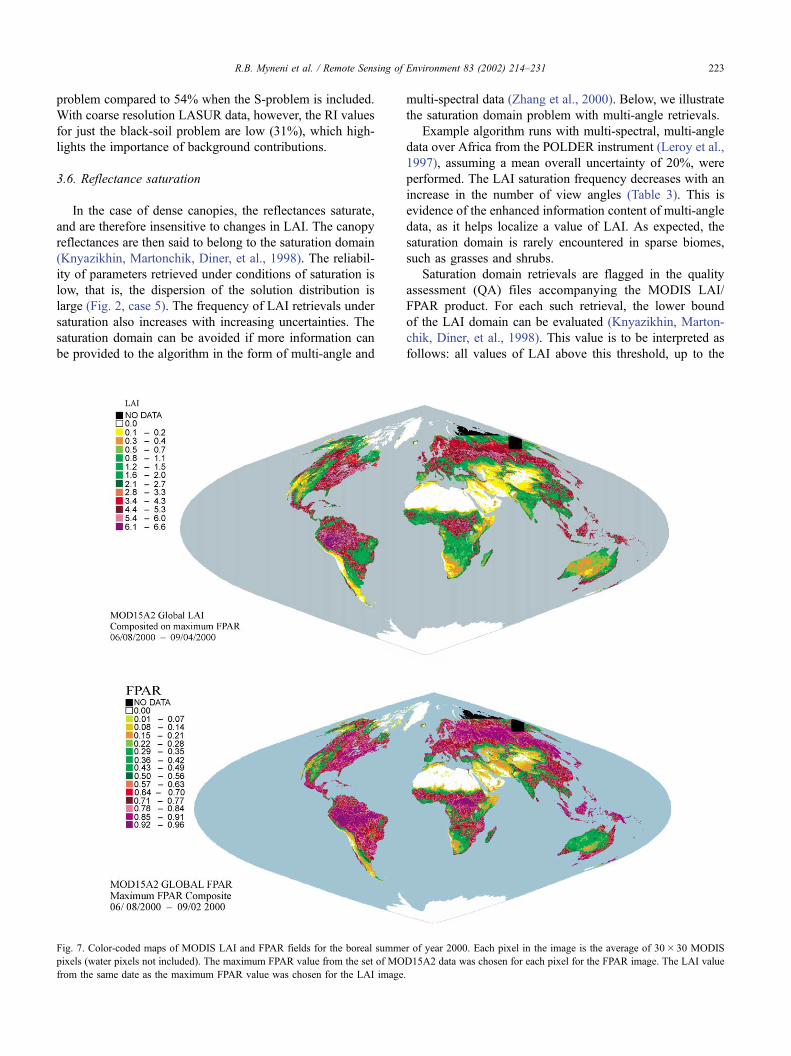
Fig. 7. Color-coded maps of MODIS LAI and FPAR fields for the boreal summer of year 2000. Each pixel in the image is the average of 30� 30 MODIS
pixels (water pixels not included). The maximum FPAR value from the set of MOD15A2 data was chosen for each pixel for the FPAR image. The LAI value
from the same date as the maximum FPAR value was chosen for the LAI image.
R.B. Myneni et al. / Remote Sensing of Environment 83 (2002) 214–231 223
maximum value of 7.0, are valid solutions (see case 5 in Fig.
2a). The algorithm reports a value equal to the arithmetic
mean of these solutions.
4. The MODIS LAI/FPAR product
The MODIS LAI/FPAR product is produced at 1 km
spatial resolution daily (MOD15A1) and composited over
an 8-day period based on the maximum FPAR value. The 8-
day product (MOD15A2) is distributed to the public from
the EROS Data Center Distributed Active Archive Center
(EDC DAAC). The products are projected on the Integer-
ized Sinusoidal (IS) 10j grid, where the globe is tiled for
production and distribution purposes into 36 tiles along the
east–west axis, and 18 tiles along the north–south axis,
each approximately 1200� 1200 km.
The product files contain four scientific data sets, output
as two-dimensional HDF EOS grid fields of 1200 lines by
1200 samples. All fields are produced using the HDF uint8
data type, which is an unsigned 8-bit integer variable whose
values may range from 0 to 255. The values are stored in
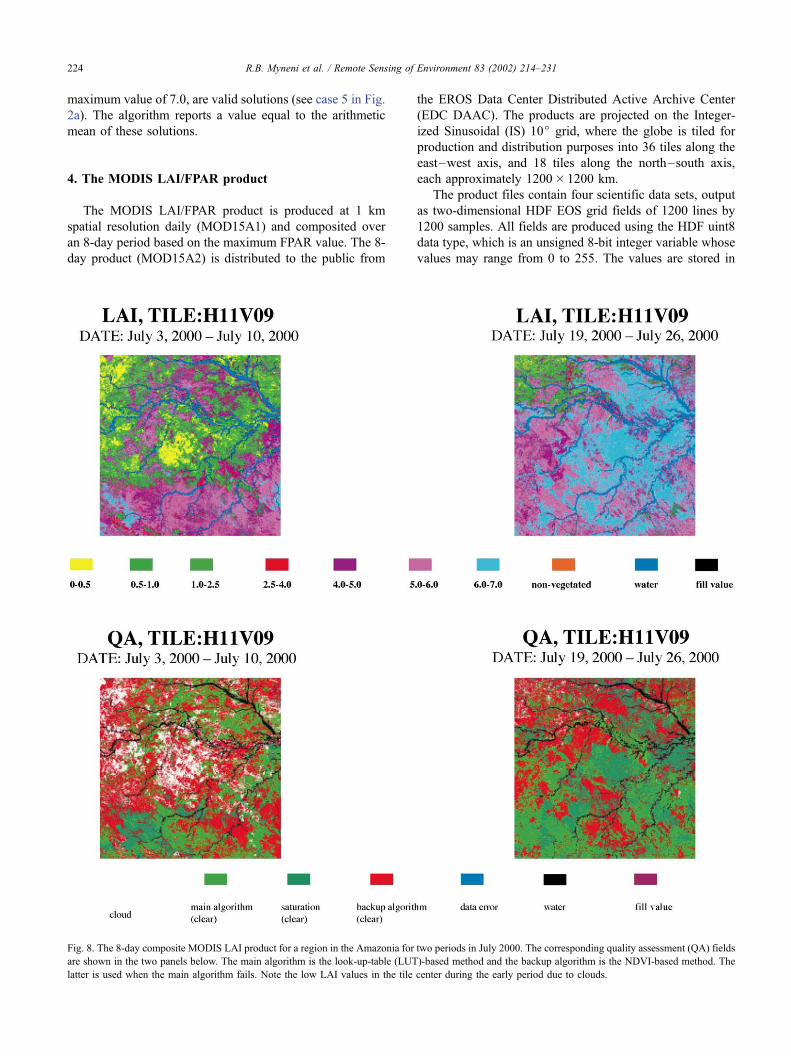
Fig. 8. The 8-day composite MODIS LAI product for a region in the Amazonia for two periods in July 2000. The corresponding quality assessment (QA) fields
are shown in the two panels below. The main algorithm is the look-up-table (LUT)-based method and the backup algorithm is the NDVI-based method. The
latter is used when the main algorithm fails. Note the low LAI values in the tile center during the early period due to clouds.
R.B. Myneni et al. / Remote Sensing of Environment 83 (2002) 214–231224
their digital form with a scale-factor (gain) and offset, which
is applied to transform the stored values to their biophysical
counterparts for analysis. The quality control variables are
integer measures without a gain or offset (Table 4). The
product files also contain a considerable amount of extra
information that describes various properties of the data.
The majority of this information is classic metadata, describ-
ing the geolocation, quality, and source of the tile and pixel
data.
Within the MODIS team, considerable attention has been
paid to implement a set of quality control protocols that help
users match data sets to their applications. Quality control
measures are produced at both the file (10j tile level) and at
the pixel level. At the tile level, these appear as a set of
EOSDIS core system (ECS) metadata fields. At the pixel
level, quality control information is represented by one or
more separate data layers in the HDF EOS file whose pixel
values correspond to specific quality scoring schemes that
vary by product. The quality assessment (QA) organization
users will find MOD15A2 files generated summarized in
Table 5.
The LAI and FPAR products have been produced since
MODIS started acquiring data in late February of 2000. The
products have been released and are available free of charge
to the users since early August 2000. Extensive documen-
tation describing the availability and usage of the products
can be found at the MODIS, EDC DAAC and MODIS
LAND web sites (Justice et al., 2000). Global maps of
MODIS LAI and FPAR for the boreal summer period are
shown in Fig. 7.
The products from year one of MODIS operation should
be used with caution in view of changes to calibration,
geolocation, cloud screening, atmospheric correction and
ongoing validation activities. In particular, the users are
advised to pay attention to the QA files accompanying the
products (see Table 5). For example, the MODIS LAI
product for a region in the Amazonia is shown in Fig. 8
for two composite periods in July of 2000. Large variations
in the LAI of tropical humid forests can be seen within the
same month. The respective QA files, also shown in Fig. 8,
indicate that the low LAI values correspond to retrievals
under cloudy conditions.
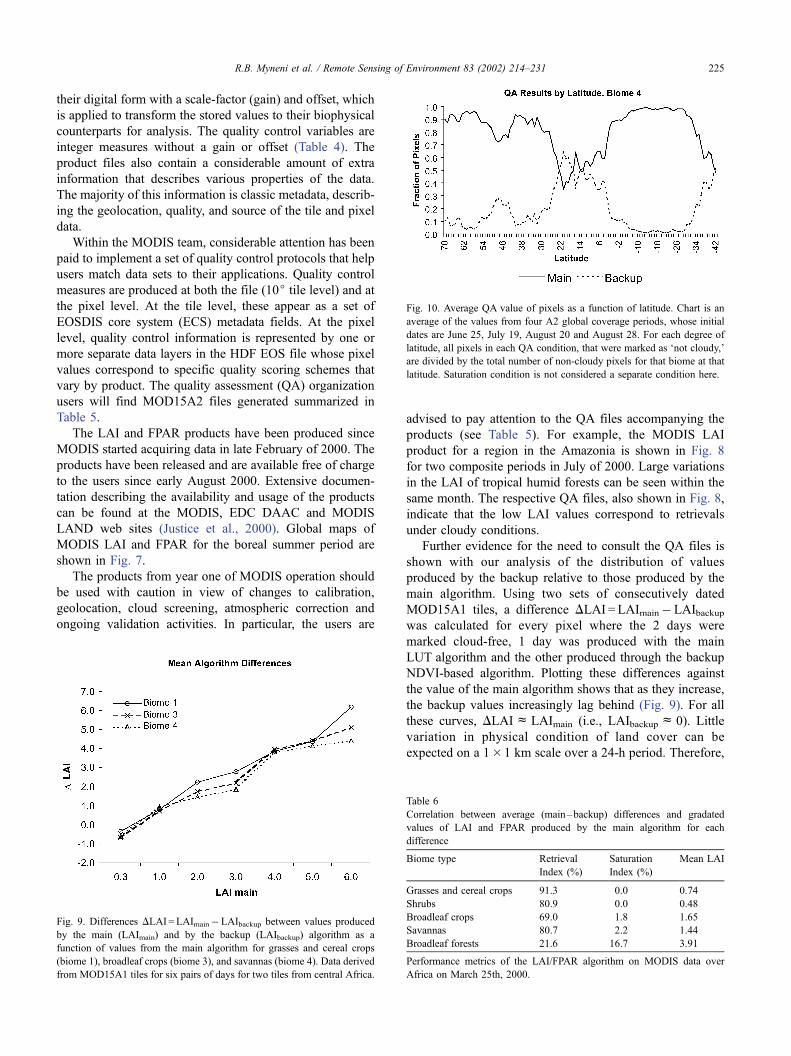
Further evidence for the need to consult the QA files is
shown with our analysis of the distribution of values
produced by the backup relative to those produced by the
main algorithm. Using two sets of consecutively dated
MOD15A1 tiles, a difference DLAI = LAImain�LAIbackupwas calculated for every pixel where the 2 days were
marked cloud-free, 1 day was produced with the main
LUT algorithm and the other produced through the backup
NDVI-based algorithm. Plotting these differences against
the value of the main algorithm shows that as they increase,
the backup values increasingly lag behind (Fig. 9). For all
these curves, DLAIcLAImain (i.e., LAIbackupc 0). Little
variation in physical condition of land cover can be
expected on a 1�1 km scale over a 24-h period. Therefore,
Fig. 9. Differences DLAI = LAImain�LAIbackup between values produced
by the main (LAImain) and by the backup (LAIbackup) algorithm as a
function of values from the main algorithm for grasses and cereal crops
(biome 1), broadleaf crops (biome 3), and savannas (biome 4). Data derived
from MOD15A1 tiles for six pairs of days for two tiles from central Africa.
Fig. 10. Average QA value of pixels as a function of latitude. Chart is an
average of the values from four A2 global coverage periods, whose initial
dates are June 25, July 19, August 20 and August 28. For each degree of
latitude, all pixels in each QA condition, that were marked as ‘not cloudy,’
are divided by the total number of non-cloudy pixels for that biome at that
latitude. Saturation condition is not considered a separate condition here.
Table 6
Correlation between average (main–backup) differences and gradated
values of LAI and FPAR produced by the main algorithm for each
difference
Biome type Retrieval
Index (%)
Saturation
Index (%)
Mean LAI
Grasses and cereal crops 91.3 0.0 0.74
Shrubs 80.9 0.0 0.48
Broadleaf crops 69.0 1.8 1.65
Savannas 80.7 2.2 1.44
Broadleaf forests 21.6 16.7 3.91
Performance metrics of the LAI/FPAR algorithm on MODIS data over
Africa on March 25th, 2000.
R.B. Myneni et al. / Remote Sensing of Environment 83 (2002) 214–231 225
the causes of variations in LAI values will be due to changes
in the atmosphere. As mentioned earlier, the main algorithm
fails when the pixel’s reflectance data are corrupted due to
clouds or atmospheric effects. NDVI, in these cases, is close
to zero, therefore, the backup algorithm outputs low LAI
values. Further evidence of the sensitivity of the main LUT
algorithm to cloud contamination can be seen in the dis-
tribution of QA values by latitude (Fig. 10). The main
algorithm fails more often over tropical latitudes where
there is frequent cloud cover.
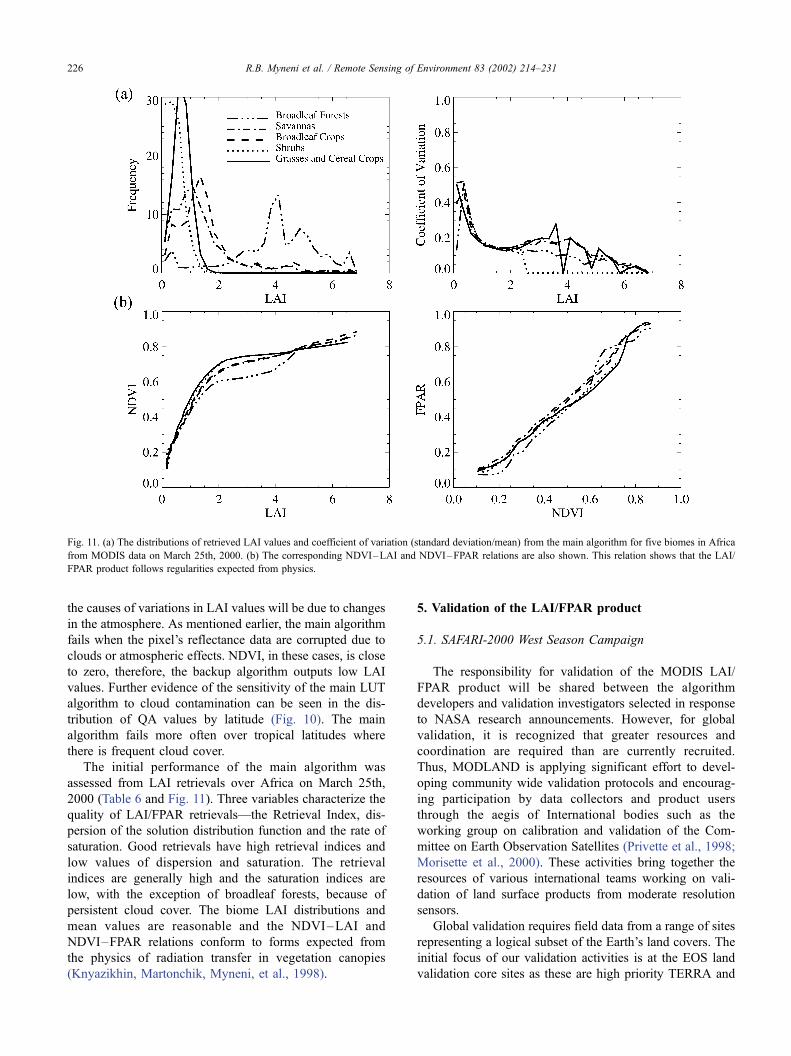
The initial performance of the main algorithm was
assessed from LAI retrievals over Africa on March 25th,
2000 (Table 6 and Fig. 11). Three variables characterize the
quality of LAI/FPAR retrievals—the Retrieval Index, dis-
persion of the solution distribution function and the rate of
saturation. Good retrievals have high retrieval indices and
low values of dispersion and saturation. The retrieval
indices are generally high and the saturation indices are
low, with the exception of broadleaf forests, because of
persistent cloud cover. The biome LAI distributions and
mean values are reasonable and the NDVI–LAI and
NDVI–FPAR relations conform to forms expected from
the physics of radiation transfer in vegetation canopies
(Knyazikhin, Martonchik, Myneni, et al., 1998).
5. Validation of the LAI/FPAR product
5.1. SAFARI-2000 West Season Campaign
The responsibility for validation of the MODIS LAI/
FPAR product will be shared between the algorithm
developers and validation investigators selected in response
to NASA research announcements. However, for global
validation, it is recognized that greater resources and
coordination are required than are currently recruited.
Thus, MODLAND is applying significant effort to devel-
oping community wide validation protocols and encourag-
ing participation by data collectors and product users
through the aegis of International bodies such as the
working group on calibration and validation of the Com-
mittee on Earth Observation Satellites (Privette et al., 1998;
Morisette et al., 2000). These activities bring together the
resources of various international teams working on vali-
dation of land surface products from moderate resolution
sensors.
Global validation requires field data from a range of sites
representing a logical subset of the Earth’s land covers. The
initial focus of our validation activities is at the EOS land
validation core sites as these are high priority TERRA and
Fig. 11. (a) The distributions of retrieved LAI values and coefficient of variation (standard deviation/mean) from the main algorithm for five biomes in Africa
from MODIS data on March 25th, 2000. (b) The corresponding NDVI–LAI and NDVI–FPAR relations are also shown. This relation shows that the LAI/
FPAR product follows regularities expected from physics.
R.B. Myneni et al. / Remote Sensing of Environment 83 (2002) 214–231226
Landsat 7 land validation activities and product generation
targets. The sites typically have a history of in-situ and
remote observations and are expected to facilitate both
validation and early EOS science. Centralized web based
archiving of ASTER, MISR, MODIS, Landsat 7 ETM+, and
IKONOS products in relatively easy-to-use formats are
planned for these sites. These core sites together with
several investigator volunteered sites comprise the LAI-
net, an informally coordinated array of sites for possible
validation of LAI/FPAR products from MODIS and other
moderate resolution sensors (Table 7).
We participated in the SAFARI 2000 wet season field
campaign in Southern Africa from March 3 to 18, 2000.
Ground measurements of LAI, FPAR, leaf and canopy
hemispherical reflectance and transmittance, and directional
canopy reflectance were made using the LAI-2000 plant
canopy analyzer, AccuPAR ceptometer, LI-1800 portable
spectroradiometer and ASD handheld spectroradiometer (no
endorsements intended here and through out). LAI and
FPAR were intensively measured at four different sites,
Pandamatenga, Maun, Okwa and Tshane (from north to
south in Botswana), where the vegetation ranged from
moist closed woodland to arid sparsely shrub-covered
grassland.
At each of the four sites, measurements were collected
every 25 m along three parallel 750-m-long east–west
transects. These transects were 250 m apart along the
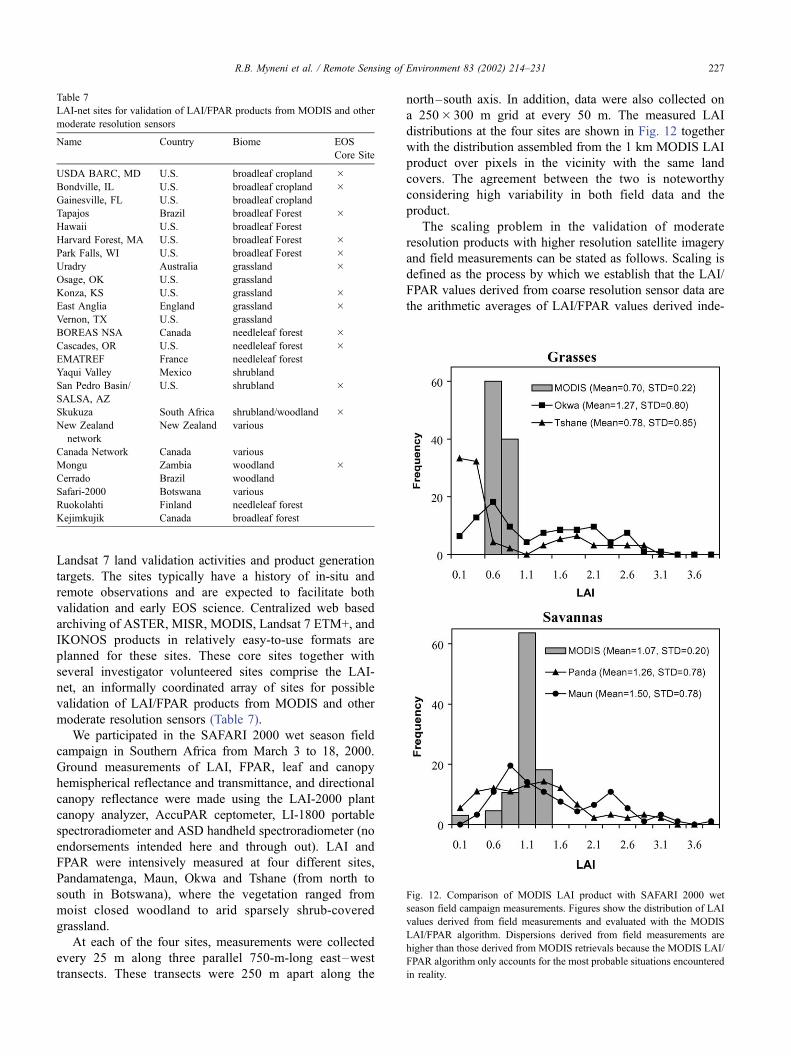
north–south axis. In addition, data were also collected on
a 250� 300 m grid at every 50 m. The measured LAI
distributions at the four sites are shown in Fig. 12 together
with the distribution assembled from the 1 km MODIS LAI
product over pixels in the vicinity with the same land
covers. The agreement between the two is noteworthy
considering high variability in both field data and the
product.
The scaling problem in the validation of moderate
resolution products with higher resolution satellite imagery
and field measurements can be stated as follows. Scaling is
defined as the process by which we establish that the LAI/
FPAR values derived from coarse resolution sensor data are
the arithmetic averages of LAI/FPAR values derived inde-
Table 7
LAI-net sites for validation of LAI/FPAR products from MODIS and other
moderate resolution sensors
Name Country Biome EOS
Core Site
USDA BARC, MD U.S. broadleaf cropland �Bondville, IL U.S. broadleaf cropland �Gainesville, FL U.S. broadleaf cropland
Tapajos Brazil broadleaf Forest �Hawaii U.S. broadleaf Forest
Harvard Forest, MA U.S. broadleaf Forest �Park Falls, WI U.S. broadleaf Forest �Uradry Australia grassland �Osage, OK U.S. grassland
Konza, KS U.S. grassland �East Anglia England grassland �Vernon, TX U.S. grassland
BOREAS NSA Canada needleleaf forest �Cascades, OR U.S. needleleaf forest �EMATREF France needleleaf forest
Yaqui Valley Mexico shrubland
San Pedro Basin/ U.S. shrubland �SALSA, AZ
Skukuza South Africa shrubland/woodland �New Zealand
network
New Zealand various
Canada Network Canada various
Mongu Zambia woodland �Cerrado Brazil woodland
Safari-2000 Botswana various
Ruokolahti Finland needleleaf forest
Kejimkujik Canada broadleaf forest
Fig. 12. Comparison of MODIS LAI product with SAFARI 2000 wet
season field campaign measurements. Figures show the distribution of LAI
values derived from field measurements and evaluated with the MODIS
LAI/FPAR algorithm. Dispersions derived from field measurements are
higher than those derived from MODIS retrievals because the MODIS LAI/
FPAR algorithm only accounts for the most probable situations encountered
in reality.
R.B. Myneni et al. / Remote Sensing of Environment 83 (2002) 214–231 227
pendently from fine resolution sensor data over the same
region (Tian et al., in press). The variables pt and pa, which
imbue scale dependence to the algorithm via modifications
to the LUTs, can be derived from model calculations and
measurements of leaf and canopy spectral properties (Pan-
ferov et al., 2001). Ground-based measurements that allow
specification of pt and pa are included in a prioritized list of
measurements needed for validation of MODIS LAI/FPAR
product. Thus, the transect and grid point measurements
collected in the field can be used to obtain the scaling
parameters pt and pa at spatial resolutions of interest.
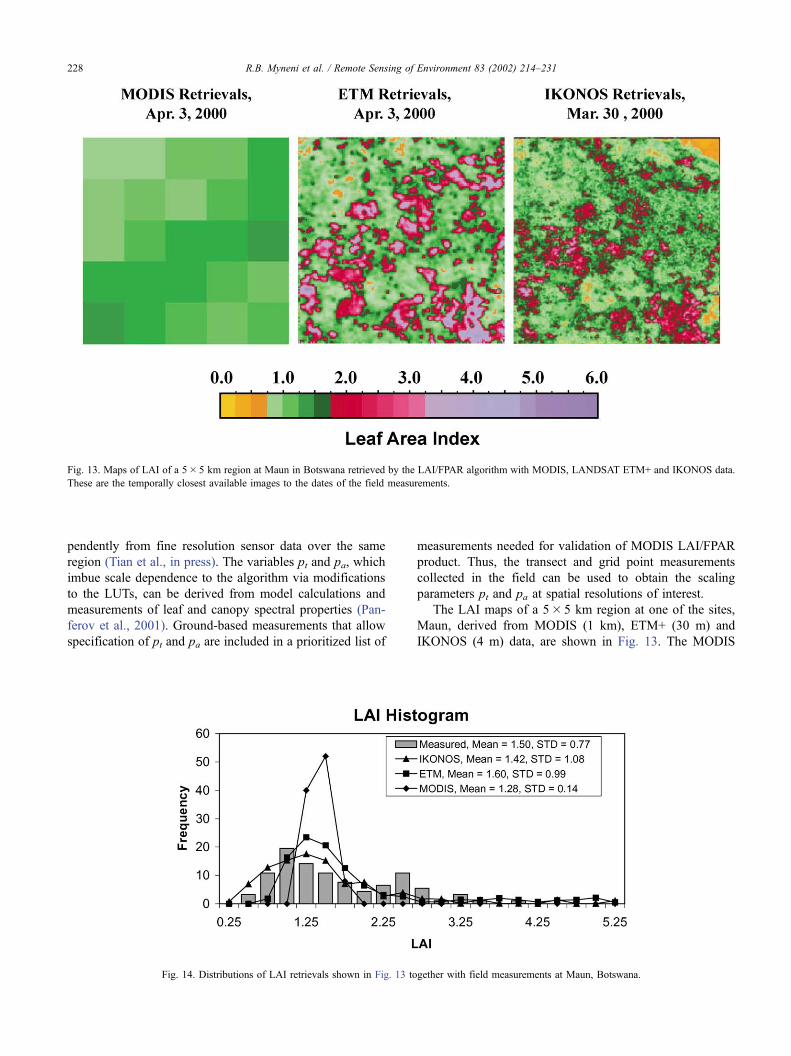
The LAI maps of a 5� 5 km region at one of the sites,
Maun, derived from MODIS (1 km), ETM+ (30 m) and
IKONOS (4 m) data, are shown in Fig. 13. The MODIS
Fig. 13. Maps of LAI of a 5� 5 km region at Maun in Botswana retrieved by the LAI/FPAR algorithm with MODIS, LANDSAT ETM+ and IKONOS data.
These are the temporally closest available images to the dates of the field measurements.
Fig. 14. Distributions of LAI retrievals shown in Fig. 13 together with field measurements at Maun, Botswana.
R.B. Myneni et al. / Remote Sensing of Environment 83 (2002) 214–231228
LAI/FPAR algorithm was used in all cases, but with look-
up-tables adjusted for resolution of ETM+ and MODIS
reflectance data. The retrieved distributions are shown in
Fig. 14 together with field measurements. The agreement
between the various distributions illustrates the validity of
the scaling approach and the MODIS LAI product for this
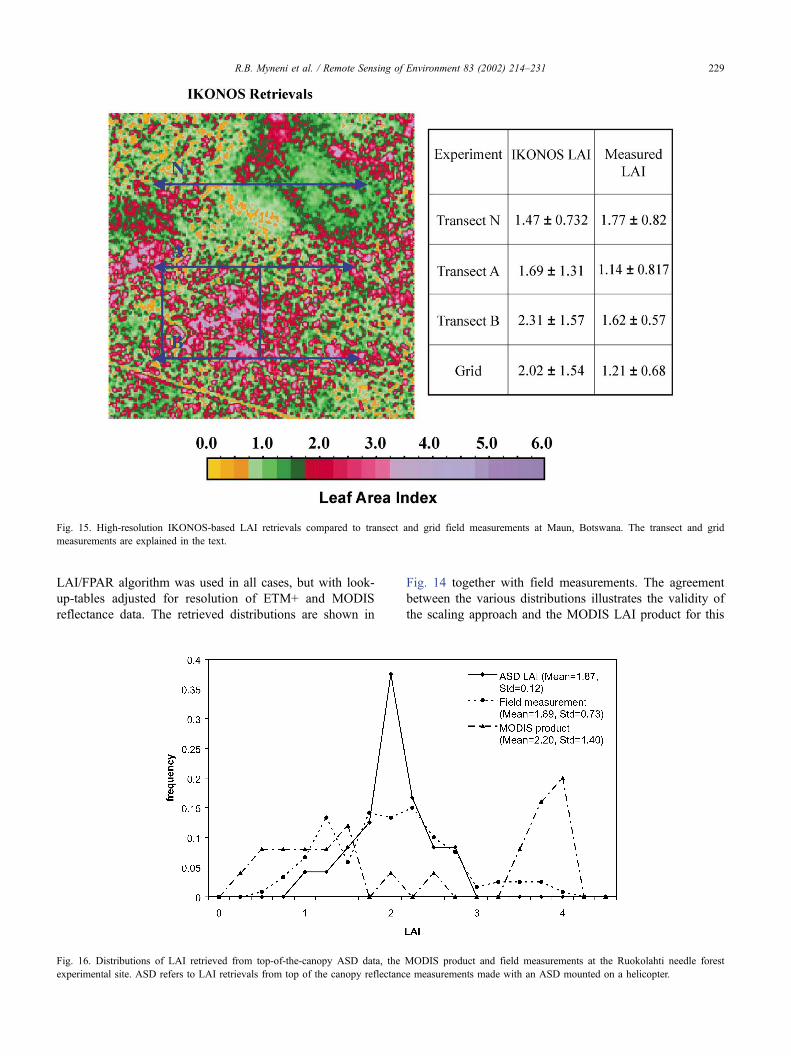
Fig. 15. High-resolution IKONOS-based LAI retrievals compared to transect and grid field measurements at Maun, Botswana. The transect and grid
measurements are explained in the text.
Fig. 16. Distributions of LAI retrieved from top-of-the-canopy ASD data, the MODIS product and field measurements at the Ruokolahti needle forest
experimental site. ASD refers to LAI retrievals from top of the canopy reflectance measurements made with an ASD mounted on a helicopter.
R.B. Myneni et al. / Remote Sensing of Environment 83 (2002) 214–231 229
site. In Fig. 15, the higher resolution IKONOS-based LAI
retrievals are compared with both the transect and the grid
field measurements. Again, the agreement between the
retrievals and measurements is noteworthy.
5.2. Field campaign at Ruokolahti
We participated in a field campaign at a needle forest site
(mostly pines) near Ruokolahti (61.32jN, 28.43jE) Finlandfrom June 14 to 21 of 2000 and collected data for validation
of the MODIS LAI/FPAR product. During this week, LAI,
FPAR, canopy reflectance, canopy transmittance and soil
reflectance were intensively measured with LAI-2000 can-
opy analyzers, ACCUPAR ceptometers, LI-1800 portable
spectroradiometer and ASD handheld spectroradiometer.
The canopy reflectances, directional and hemispherical,
were measured by mounting the ASD on a helicopter. A
1�1 km site was chosen for intensive ground sampling at a
resolution of 50 m. Based on a CCD image of the site, the
canopy was stratified into three classes depending on the
tree density and age. In these three classes, data were also
collected at a higher resolution of 25 m in a plot size of
200� 200 m. The LAI distribution retrieved from the top-
of-the-canopy helicopter ASD data and the MODIS LAI
product agree well with the field data (Fig. 16).
5.3. Other field campaigns
We are presently analyzing data collected in 2000 at two
broadleaf forest sites—Harvard Forest in Massachusetts and
Kejimkujik National Forest Reserve in Nova Scotia, Can-
ada. Field campaigns in 2001 are targeted for validation of
the LAI/FPAR product in cereal and broadleaf crops, shrubs
and tropical humid forests. These activities are aimed at
quantifying uncertainty of the MODIS LAI/FPAR product
in all the six structural biomes. Further evaluation of the
product will be performed by validation investigators and
the large community of users.
6. Concluding remarks
This paper presented an overview of research related to
the MODIS LAI/FPAR algorithm and the product. Example
results highlighting salient features of the algorithm and its
performance were discussed to provide an understanding of
the LAI/FPAR products from MODIS. The presented results
indicate expected and satisfactory functionality of the algo-
rithm in the operational mode. Initial results of validation,
that is, comparison of the MODIS LAI/FPAR fields with
ground measurements, are encouraging. However, in order
to globally validate the product and to assess its use for
scientific analyses, participation by the community-at-large
is required. Therefore, the products have been released to
the community as early as 5 months from the date of first
light.
Acknowledgements
This research was funded by the NASA MODIS
program. Several individuals not listed in the byline have
contributed significantly to the MODIS LAI/FPAR research
and project activities. In particular, we gratefully acknowl-
edge the contributions of Nazmi El-Saleous, Chris Justice,
David Roy and Robert Wolfe.
References
Berthelot, B., Adam, S., Kergoat, L., Cabot, F., Dedieu, G., & Maison-
grande, P. (1997). A global dataset of surface reflectances and vegeta-
tion indices derived from AVHRR/GVI time series for 1989 1990: The
LAnd SUrface Reflectances (LASUR) data. Proc. Commun. 7th Int.
Symp. Physical Measurements and Signatures in Remote Sens. Courch-
evel, France, Apr. 7–11, 1997.
Carlson, T. N., & Ripley, D. A. (1997). On the relation between NDVI,
fractional vegetation cover, and leaf area index. Remote Sens. Environ.,
62, 241–252.
Deschamps, P. Y., Breon, F. M., Leroy, M., Podaire, A., Bricaud, A.,
Buriez, J. C., & Seze, G. (1994). The POLDER mission: Instrument
characteristics and scientific objectives. IEEE Trans. Geosci. Remote
Sens., 32, 598–615.
Diner, D. J., Asner, G. P., Davies, R., Knyazikhin, Y., Muller, J. P., Nolin,
A. W., Pinty, B., Schaaf, C. B., & Stroeve, J. (1999). New directions in
Earth observing: Scientific application of multi-angle remote sensing.
Bull. Am. Meteorol. Soc., 80, 2209–2228.
Hansen, M. C., DeFries, R. S., Townshend, J. R. G., & Sohlberg, R. (2000).
Global land cover classification at 1 km spatial resolution using a clas-
sification tree approach. Int. J. Remote Sens., 21, 1331–1364.
Jasinski, M. F. (1996). Estimation of subpixel vegetation density of natural
regions using satellite multispectral imagery. IEEE Trans. Geosci. Re-
mote Sens., 34, 804–813.
Justice, C. O., Vermote, E., Townshend, J. R. G., Defries, R., Roy, D. P.,
Hall, D. K., Salomonson, V. V., Privette, J. P., Riggs, G., Strahler, A.,
Lucht, W., Myneni, R. B., Knyazikhin, Y., Running, S. W., Nemani, R.
R., Wan, Z., Huete, A., Leeuwen, W., Wolfe, R. E., Giglio, L., Muller, J.
P., Lewis, P., & Barnsley, M. J. (1998). The moderate resolution imag-
ing spectroradiometer (MODIS): Land remote sensing for global re-
search. IEEE Trans. Geosci. Remote Sens., 36, 1228–1249.
Justice, C. O., Wolfe, W., El-Saleous, N., Descloitres, J., Vermote, E., Roy,
D., Owens, J., & Masuoka, E. (2000). The availability and status of
MODIS Land products. Earth Obs., 12, 8–18.
Knyazikhin, Y., Glassy, J., Privette, J. L., Tian, Y., Lotsch, A., Zhang, Y.,
Wang, Y., Morisette, J. T., Votava, P., Myneni, R. B., Nemani, R. R., &
Running, S. W. (1999). MODIS Leaf Area Index (LAI) and Fraction of
Photosynthetically Active Radiation Absorbed by Vegetation (FPAR)
Product (MOD15) Algorithm, Theoretical Basis Document, NASA
Goddard Space Flight Center, Greenbelt, MD 20771, USA.
Knyazikhin, Y., Martonchik, J. V., Diner, D. J.,Myneni, R. B., Verstraete, M.,
Pinty, B., & Gobron, N. (1998). Estimation of vegetation leaf area index
and fraction of absorbed photosynthetically active radiation from atmos-
phere-corrected MISR data. J. Geophys. Res., 103, 32239–32256.
Knyazikhin, Y., Martonchik, J. V., Myneni, R. B., Diner, D. J., & Run-
ning, S. W. (1998). Synergistic algorithm for estimating vegetation
canopy leaf area index and fraction of absorbed photosynthetically
active radiation from MODIS and MISR data. J. Geophys. Res.,
103, 32257–32274.
Leroy, M., Deuze, J. L., Breon, F. M., Hautecoeur, O., Herman, M.,
Buriez, J. C., Tanre, D., Bouffies, S., Chazette, P., & Roujean, J. L.
(1997). Retrieval of atmospheric properties and surface bidirectional
reflectances over land from POLDER/ADEOS. J. Geophys. Res., 102,
17023–17037.
R.B. Myneni et al. / Remote Sensing of Environment 83 (2002) 214–231230

Liu, Q., & Huete, A. (1995). A feedback based modification of the NDVI to
minimize canopy background and atmospheric noise. IEEE Trans. Geo-
sci. Remote Sens., 33, 457–465.
Lotsch, A., Tian, Y., Friedl, M. A., & Myneni, R. B. (2001). Land cover
mapping in support of LAI and FAPAR retrievals from EOS-MODIS
and MISR: Classification methods and sensitivities to errors. Int. J.
Remote Sens., (in press).
Loveland, T. R., Zhu, Z., Ohlen, D. O., Brown, J. F., Redd, B. C., & Yang,
L. (2000). An analysis of the IGBP global land cover characterization
process. Photogrammetric Eng. Remote Sens., 65, 1021–1031.
Morisette, J., Privette, J., Guenther, K., Belward, A., & Justice, C. O.
(2000). The CEOS Land Product Validation (LPV) Subgroup: Summary
of May 23–25th Meeting. Earth Obs., 12(4), 6–9.
Myneni, R. B., Hall, F. G., Sellers, P. J., & Marshak, A. L. (1995). The
meaning of spectral vegetation indices. IEEE Trans. Geosci. Remote
Sens., 33, 481–486.
Myneni, R. B., & Ross, J. (1991). Photon–vegetation interactions: Appli-
cations in optical remote sensing and plant physiology. New York,
USA: Springer-Verlag.
Panferov, O., Knyazikhin, Y., Myneni, R. B., Szarzynski, J., Engwald, S.,
Schnitzler, K. G., & Gravenhorst, G. (2001). The role of canopy struc-
ture in the spectral variation of transmission and absorption of solar
radiation in vegetation canopies. IEEE Trans. Geosci. Remote Sens.,
39(2), 241–253.
Price, J. C. (1993). Estimating leaf area index from satellite data. Remote
Sens. Environ., 31, 727–734.
Privette, J. L., Myneni, R. B., Morisette, J. T., & Justice, C. O. (1998). Global
validation of EOS LAI and FPAR products. Earth Obs., 10, 39–42.
Ross, J. (1981). The radiation regime and architecture of plant stands. The
Hague, The Netherlands: Dr. W. Junk Publ.
Ross, J., Knyazikhin, Y., Marshak, A., & Nilson, T. (1992). Mathemat-
ical modeling of the solar radiation transfer in plant canopies. St.
Petersburg, Russia: Gidrometeoizdat (in Russian, with English ab-
stract) 195 pp.
Sellers, P. J., Randall, D. A., Betts, A. K., Hall, F. G., Berry, J. A., Collatz,
G. J., Denning, A. S., Mooney, H. A., Nobre, C. A., Sato, N., Field, C.
B., & Henderson-sellers, A. (1997). Modeling the exchanges of energy,
water, and carbon between continents and the atmosphere. Science,
275, 502–509.
Tian, Y., Wang, Y., Zhang, Y., Knyazikhin, Y., Bogaert, J., & Myneni, R. B.
(2001). Radiative transfer based scaling of LAI retrievals from reflec-
tance data of different resolutions. Remote Sens. Environ. (in press).
Tian, Y., Zhang, Y., Knyazikhin, Y., Myneni, R. B., Glassy, J., Dedieu, G.,
& Running, S. W. (2000). Prototyping of MODIS LAI and FPAR
algorithm with LASUR and LANDSAT data. IEEE Trans. Geosci.
Remote Sens., 38, 2387–2401.
Vermote, E. F., El Saleous, N. Z., Justice, C. O., Kaufman, Y. J., Privette,
J., Remer, L., Roger, J. C., & Tanre, D. (1997). Atmospheric correc-
tion visible to middle infrared EOS-MODIS data over land surface,
background, operational algorithm and validation. J. Geophys. Res.,
102(14), 17131–17141.
Wang, Y., Tian, Y., Zhang, Y., El-Saleous, N., Knyazikhin, Y., Vermote, E.,
& Myneni, R. B. (2001). Investigation of product accuracy as a function
of input and model uncertainties: Case study with SeaWiFS and
MODIS LAI/FPAR algorithm. Remote Sens. Environ., 78, 296–311.
Zhang, Y., Tian, Y., Knyazikhin, Y., Martonchik, J., Diner, D., Leroy, M., &
Myneni, R. B. (2000). Prototyping of MODIS LAI and FPAR algorithm
with POLDER data over Africa. IEEE Trans. Geosci. Remote Sens., 38,
2402–2418.
R.B. Myneni et al. / Remote Sensing of Environment 83 (2002) 214–231 231