Embed Size (px)
Citation preview
GLOBAL PRODUCTION AND MARKET TRENDGLOBAL PRODUCTION AND MARKET TRENDOF TROPICAL FRUITSOF TROPICAL FRUITS
Dr. Izham AhmadDr. Izham Ahmad
Chief Executive OfficerChief Executive Officer
International Tropical Fruits NetworkInternational Tropical Fruits Network
(TFNet)(TFNet)
Walk-In Seminar Walk-In Seminar Malaysian Agricultural, Horticultural and Agrotourism (MAHA 2008)Malaysian Agricultural, Horticultural and Agrotourism (MAHA 2008)
19 August 200819 August 2008MAEPS, MALAYSIAMAEPS, MALAYSIA

DISCUSSION TOPICS
2222 GLOBAL PRODUCTIONGLOBAL PRODUCTIONGLOBAL PRODUCTIONGLOBAL PRODUCTION
1111 INTRODUCTIONINTRODUCTION INTRODUCTIONINTRODUCTION
33
44 ISSUES AND CHALLENGESISSUES AND CHALLENGES ISSUES AND CHALLENGESISSUES AND CHALLENGES
55 CONCLUSIONCONCLUSION CONCLUSIONCONCLUSION
INTERNATIONAL TRADEINTERNATIONAL TRADE INTERNATIONAL TRADEINTERNATIONAL TRADE
1111 INTRODUCTIONINTRODUCTION INTRODUCTIONINTRODUCTION
Tropical Fruit Industry is an important economic sector in many countries
Potential of the sector in: Generating income Improving livelihoods of small farmers Employment opportunities Foreign exchange Source dietary requirements for healthy
population
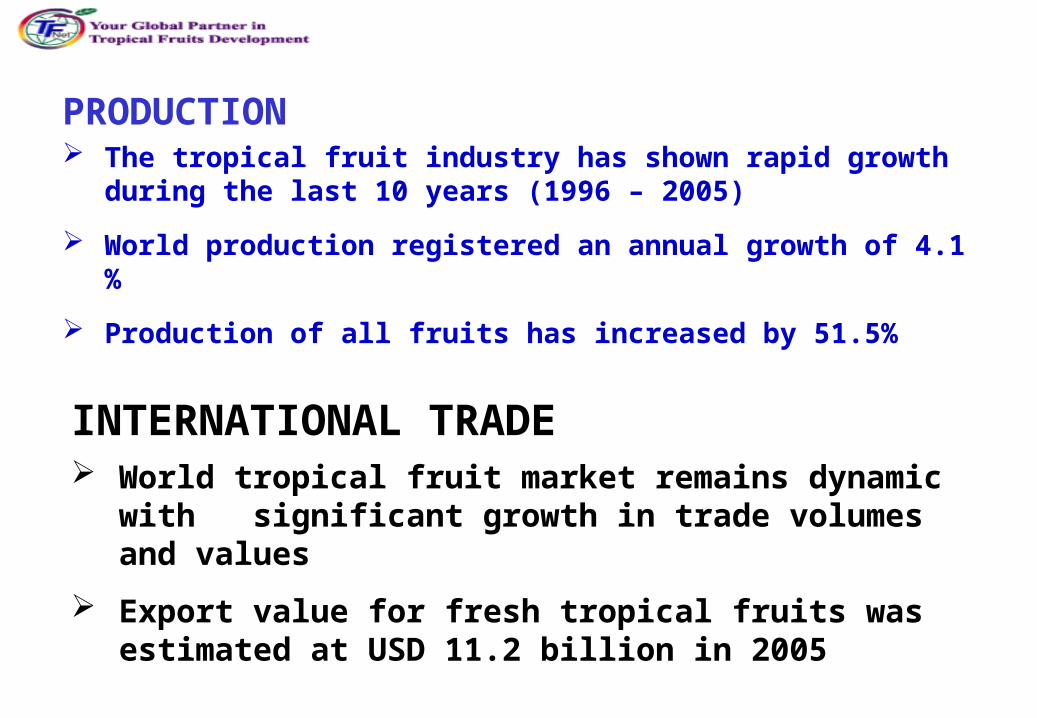
PRODUCTION The tropical fruit industry has shown rapid growth during
the last 10 years (1996 – 2005)
World production registered an annual growth of 4.1 %
Production of all fruits has increased by 51.5%
INTERNATIONAL TRADE World tropical fruit market remains dynamic with
significant growth in trade volumes and values
Export value for fresh tropical fruits was estimated at USD 11.2 billion in 2005
2222 GLOBAL TROPICAL FRUIT PRODUCTIONGLOBAL TROPICAL FRUIT PRODUCTION GLOBAL TROPICAL FRUIT PRODUCTIONGLOBAL TROPICAL FRUIT PRODUCTION
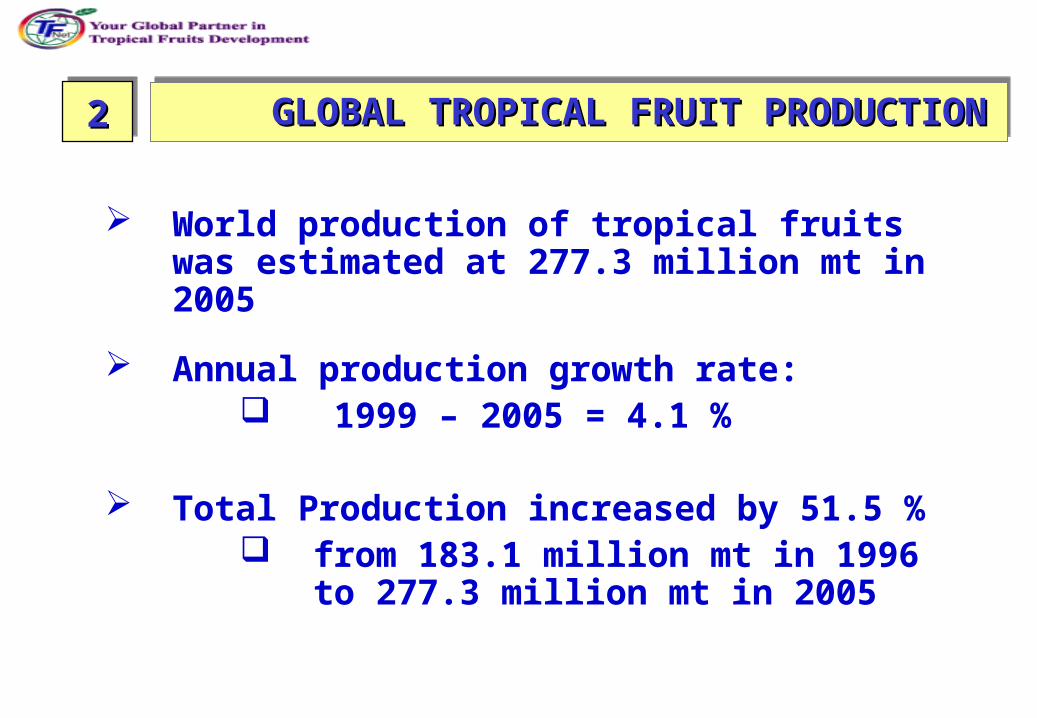
World production of tropical fruits was estimated at 277.3 million mt in 2005
Annual production growth rate: 1999 – 2005 = 4.1 %
Total Production increased by 51.5 % from 183.1 million mt in 1996 to
277.3 million mt in 2005
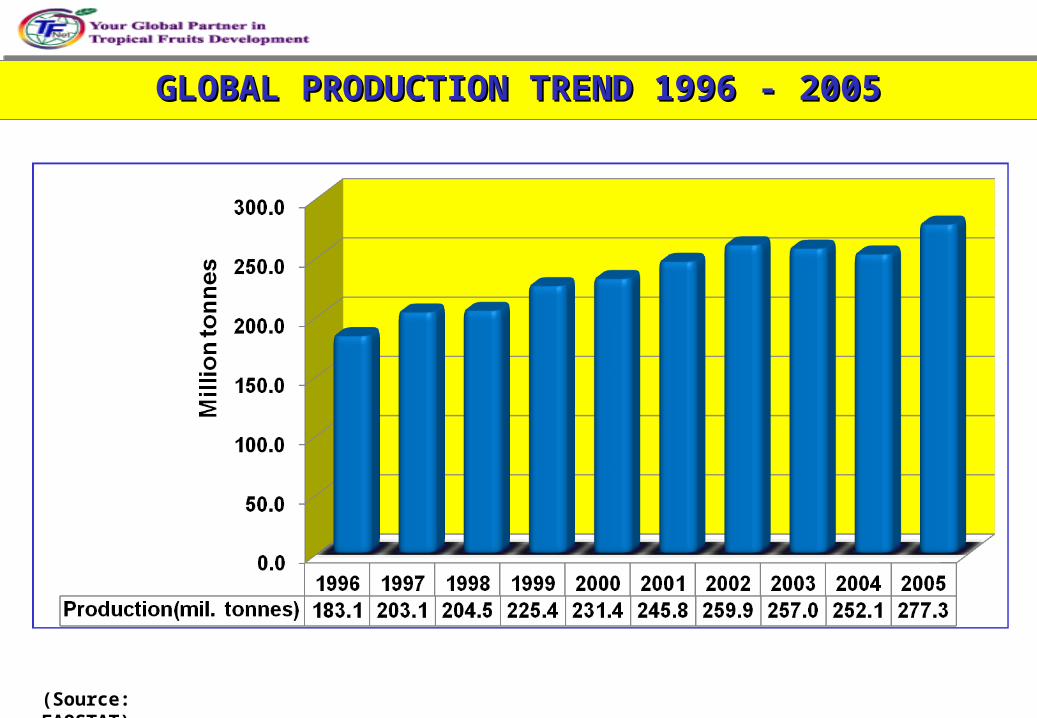
(Source: FAOSTAT)
GLOBAL PRODUCTION TREND 1996 - 2005GLOBAL PRODUCTION TREND 1996 - 2005GLOBAL PRODUCTION TREND 1996 - 2005GLOBAL PRODUCTION TREND 1996 - 2005
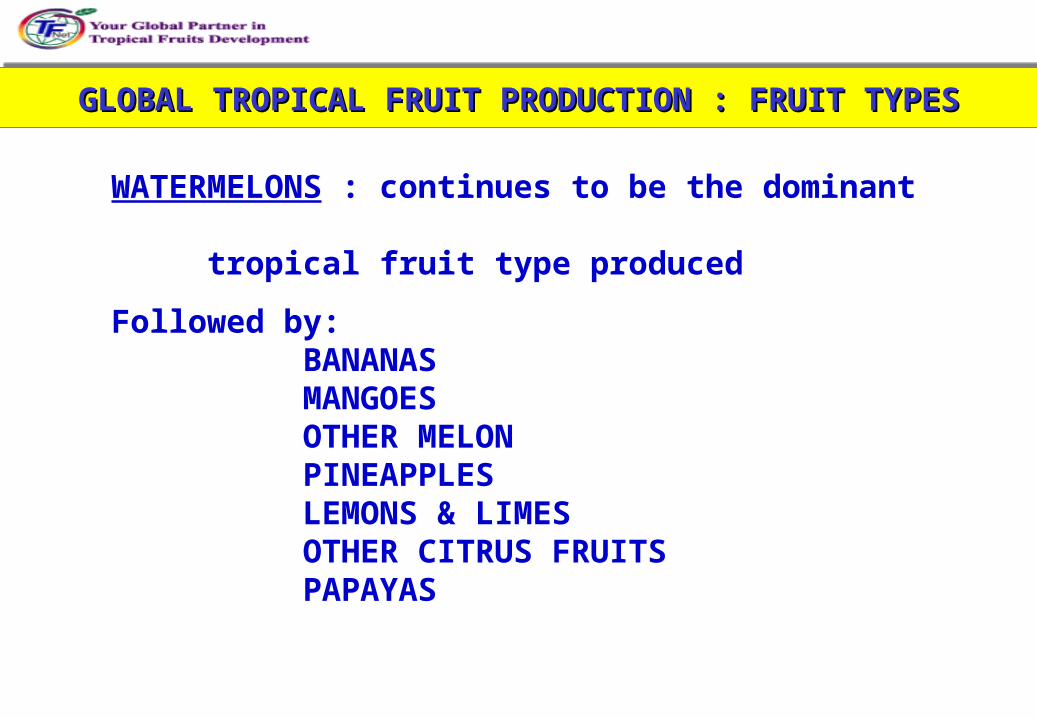
GLOBAL TROPICAL FRUIT PRODUCTION : FRUIT TYPESGLOBAL TROPICAL FRUIT PRODUCTION : FRUIT TYPESGLOBAL TROPICAL FRUIT PRODUCTION : FRUIT TYPESGLOBAL TROPICAL FRUIT PRODUCTION : FRUIT TYPES
WATERMELONS : continues to be the dominant tropical fruit type produced
Followed by:BANANASMANGOESOTHER MELONPINEAPPLESLEMONS & LIMESOTHER CITRUS FRUITSPAPAYAS
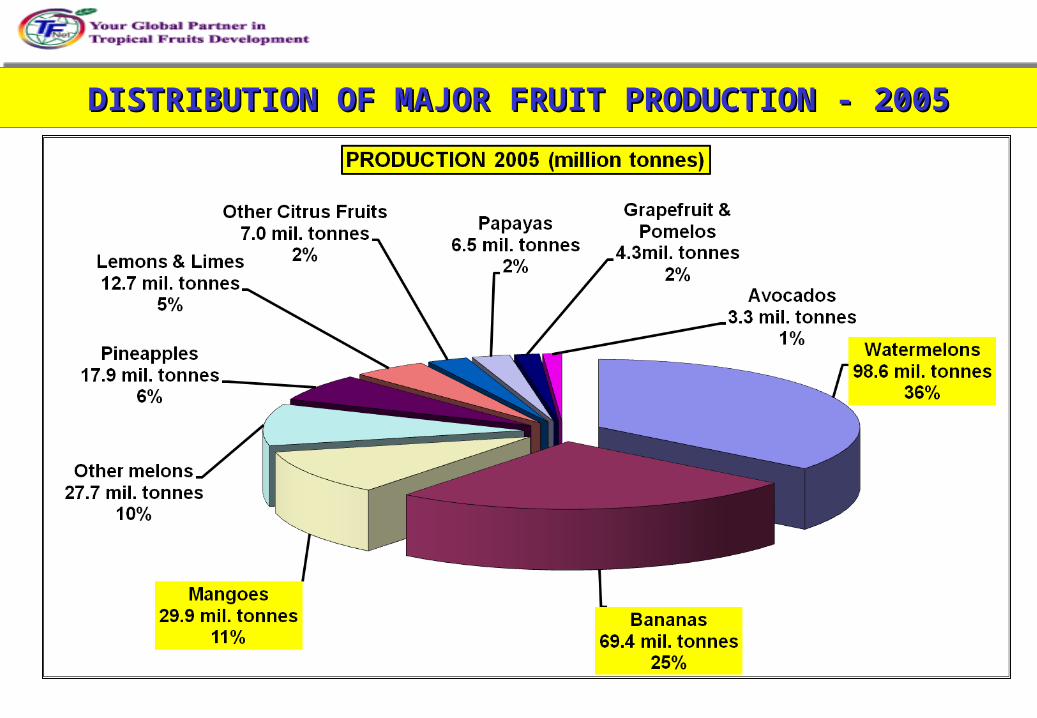
DISTRIBUTION OF MAJOR FRUIT PRODUCTION - 2005DISTRIBUTION OF MAJOR FRUIT PRODUCTION - 2005DISTRIBUTION OF MAJOR FRUIT PRODUCTION - 2005DISTRIBUTION OF MAJOR FRUIT PRODUCTION - 2005
(Source: FAOSTAT)
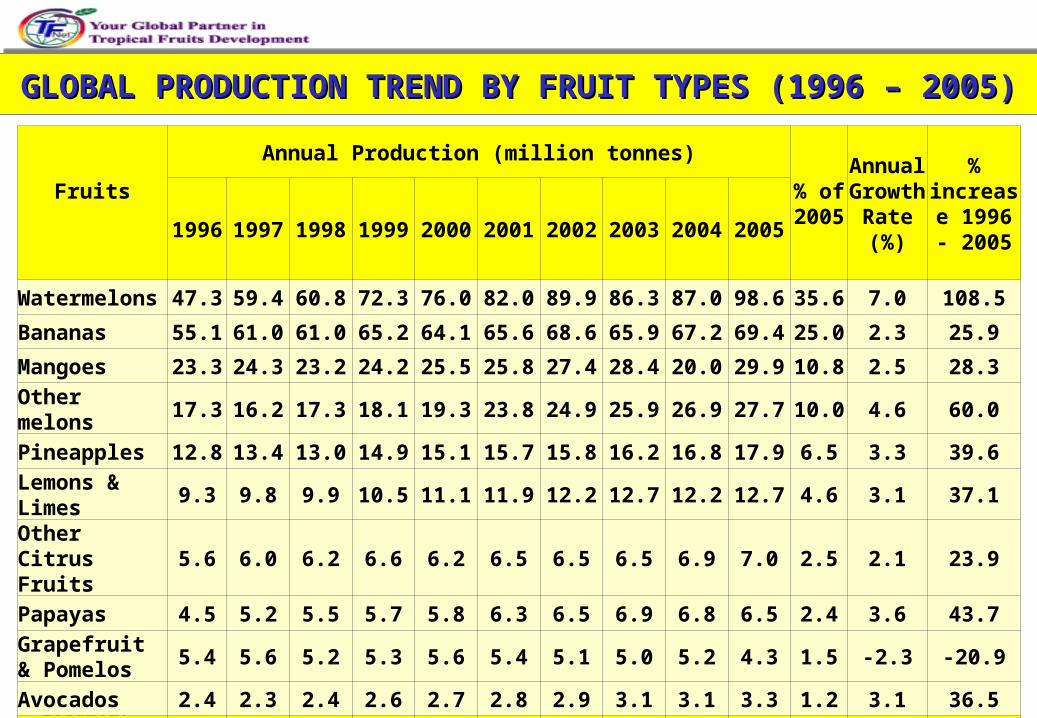
GLOBAL PRODUCTION TREND BY FRUIT TYPES (1996 – 2005)GLOBAL PRODUCTION TREND BY FRUIT TYPES (1996 – 2005)GLOBAL PRODUCTION TREND BY FRUIT TYPES (1996 – 2005)GLOBAL PRODUCTION TREND BY FRUIT TYPES (1996 – 2005)
Fruits
Annual Production (million tonnes)
% of 2005
Annual Growth
Rate (%)
% increase
1996 - 2005
1996 1997 1998 1999 2000 2001 2002 2003 2004 2005
Watermelons 47.3 59.4 60.8 72.3 76.0 82.0 89.9 86.3 87.0 98.6 35.6 7.0 108.5Bananas 55.1 61.0 61.0 65.2 64.1 65.6 68.6 65.9 67.2 69.4 25.0 2.3 25.9Mangoes 23.3 24.3 23.2 24.2 25.5 25.8 27.4 28.4 20.0 29.9 10.8 2.5 28.3Other melons 17.3 16.2 17.3 18.1 19.3 23.8 24.9 25.9 26.9 27.7 10.0 4.6 60.0Pineapples 12.8 13.4 13.0 14.9 15.1 15.7 15.8 16.2 16.8 17.9 6.5 3.3 39.6Lemons & Limes
9.3 9.8 9.9 10.5 11.1 11.9 12.2 12.7 12.2 12.7 4.6 3.1 37.1
Other Citrus Fruits
5.6 6.0 6.2 6.6 6.2 6.5 6.5 6.5 6.9 7.0 2.5 2.1 23.9
Papayas 4.5 5.2 5.5 5.7 5.8 6.3 6.5 6.9 6.8 6.5 2.4 3.6 43.7Grapefruit & Pomelos
5.4 5.6 5.2 5.3 5.6 5.4 5.1 5.0 5.2 4.3 1.5 -2.3 -20.9
Avocados 2.4 2.3 2.4 2.6 2.7 2.8 2.9 3.1 3.1 3.3 1.2 3.1 36.5TOTAL 183.1 203.1 204.5 225.4 231.4 245.8 259.9 257.0 252.1 277.3 100.0 4.1 51.5
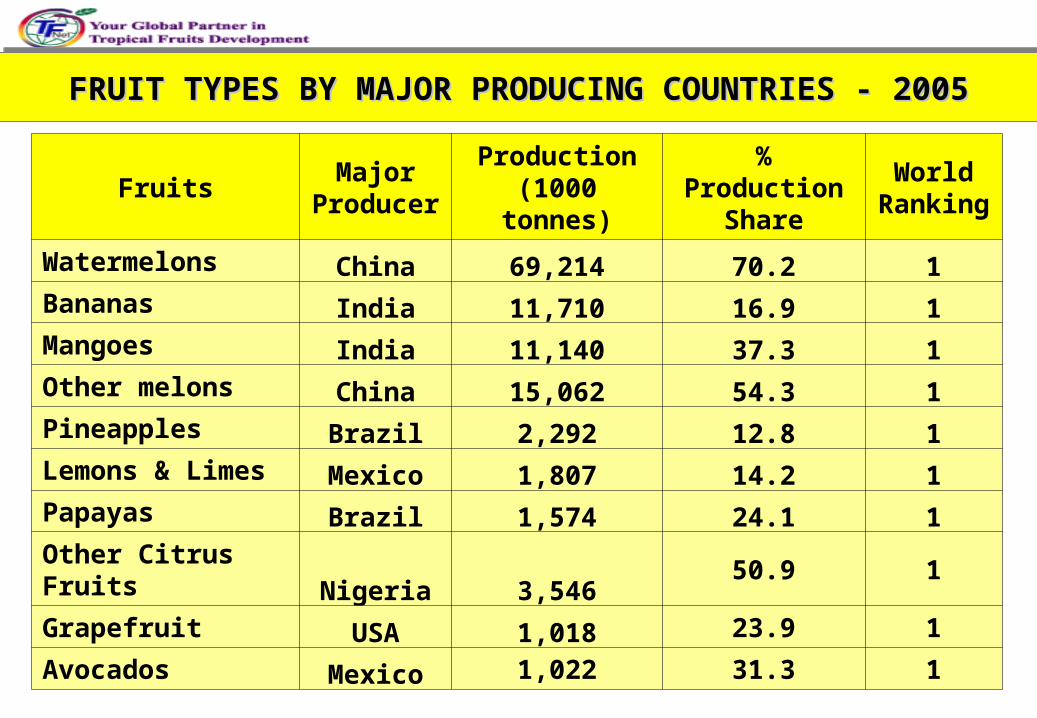
FRUIT TYPES BY MAJOR PRODUCING COUNTRIES - 2005FRUIT TYPES BY MAJOR PRODUCING COUNTRIES - 2005FRUIT TYPES BY MAJOR PRODUCING COUNTRIES - 2005FRUIT TYPES BY MAJOR PRODUCING COUNTRIES - 2005
FruitsMajor
ProducerProduction
(1000 tonnes)% Production
ShareWorld
Ranking
Watermelons China 69,214 70.2 1Bananas India 11,710 16.9 1Mangoes India 11,140 37.3 1Other melons China 15,062 54.3 1Pineapples Brazil 2,292 12.8 1Lemons & Limes Mexico 1,807 14.2 1Papayas Brazil 1,574 24.1 1Other Citrus Fruits Nigeria 3,546 50.9 1
Grapefruit USA 1,018 23.9 1
Avocados Mexico 1,022 31.3 1
(Source: FAOSTAT)
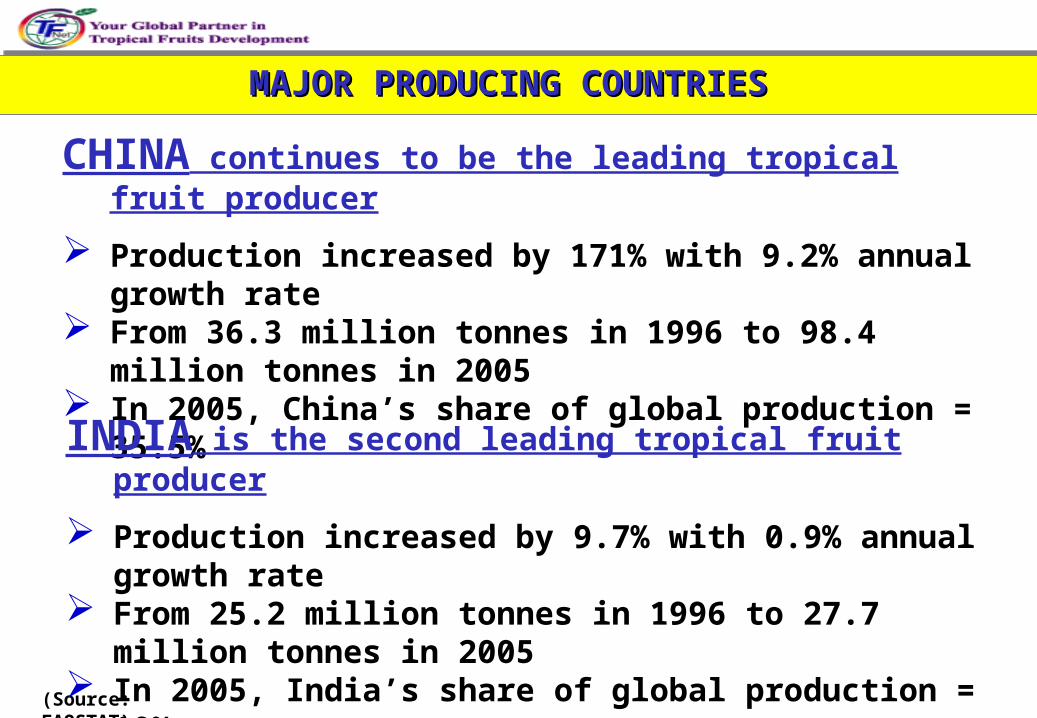
MAJOR PRODUCING COUNTRIES MAJOR PRODUCING COUNTRIES MAJOR PRODUCING COUNTRIES MAJOR PRODUCING COUNTRIES
CHINA continues to be the leading tropical fruit producer
Production increased by 171% with 9.2% annual growth rate
From 36.3 million tonnes in 1996 to 98.4 million tonnes in 2005
In 2005, China’s share of global production = 35.5%
INDIA is the second leading tropical fruit producer
Production increased by 9.7% with 0.9% annual growth rate
From 25.2 million tonnes in 1996 to 27.7 million tonnes in 2005
In 2005, India’s share of global production = 10%
(Source: FAOSTAT)
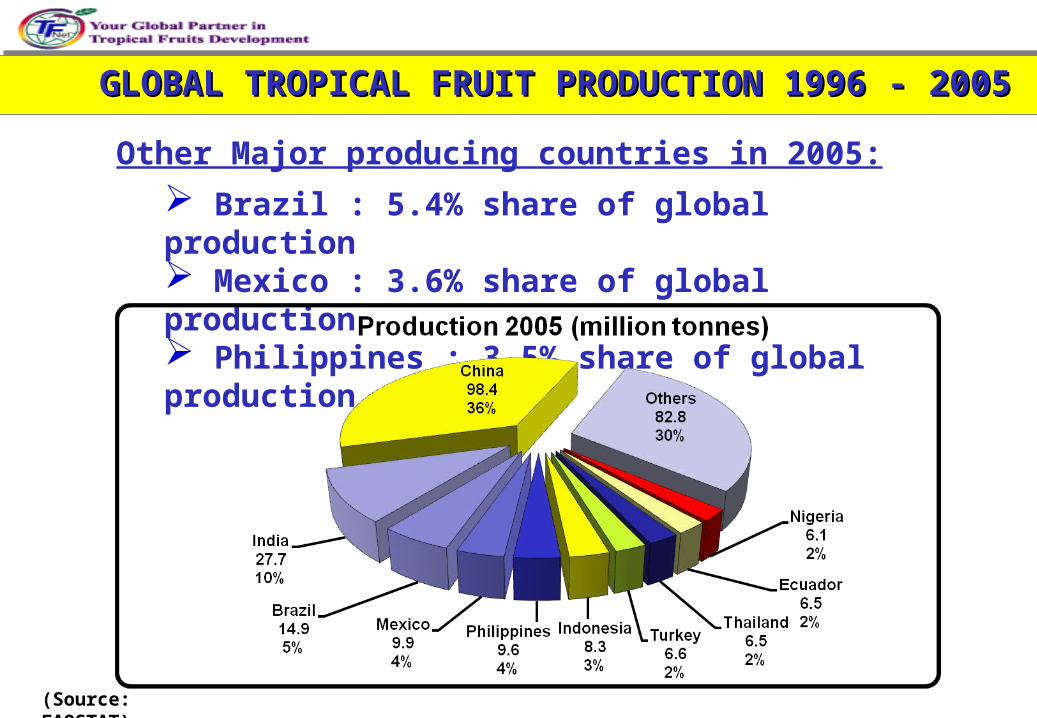
GLOBAL TROPICAL FRUIT PRODUCTION 1996 - 2005GLOBAL TROPICAL FRUIT PRODUCTION 1996 - 2005GLOBAL TROPICAL FRUIT PRODUCTION 1996 - 2005GLOBAL TROPICAL FRUIT PRODUCTION 1996 - 2005
Other Major producing countries in 2005:
Brazil : 5.4% share of global production Mexico : 3.6% share of global production Philippines : 3.5% share of global production
(Source: FAOSTAT)
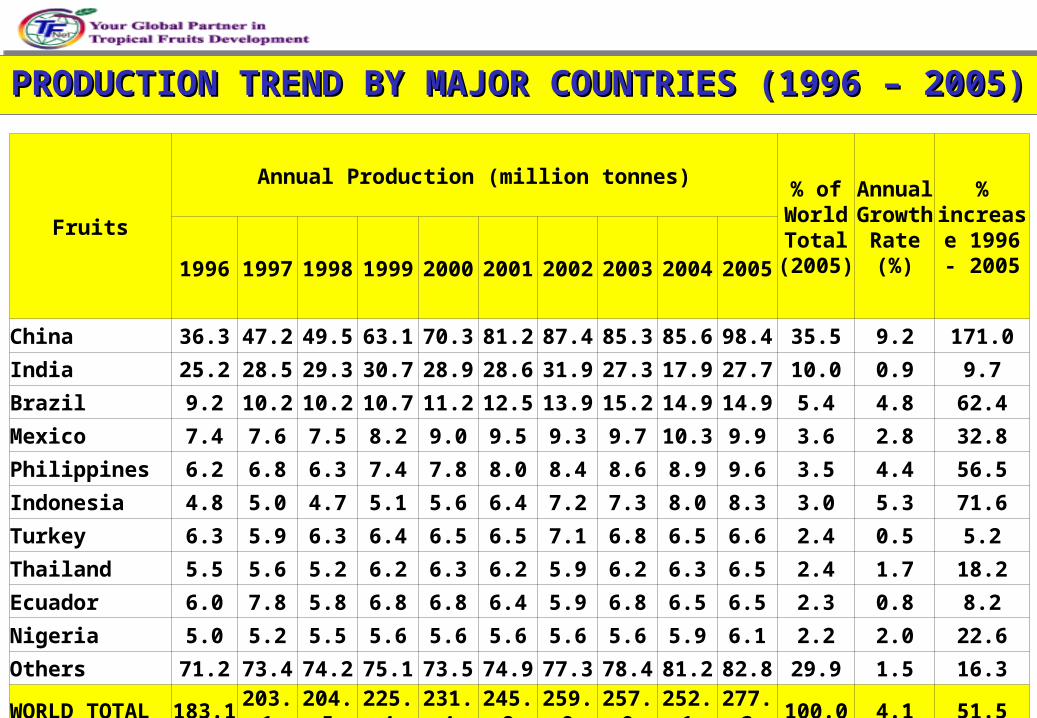
PRODUCTION TREND BY MAJOR COUNTRIES (1996 – 2005)PRODUCTION TREND BY MAJOR COUNTRIES (1996 – 2005)PRODUCTION TREND BY MAJOR COUNTRIES (1996 – 2005)PRODUCTION TREND BY MAJOR COUNTRIES (1996 – 2005)
Fruits
Annual Production (million tonnes)% of
World Total
(2005)
Annual Growth
Rate (%)
% increase
1996 - 20051996 1997 1998 1999 2000 2001 2002 2003 2004 2005
China 36.3 47.2 49.5 63.1 70.3 81.2 87.4 85.3 85.6 98.4 35.5 9.2 171.0
India 25.2 28.5 29.3 30.7 28.9 28.6 31.9 27.3 17.9 27.7 10.0 0.9 9.7
Brazil 9.2 10.2 10.2 10.7 11.2 12.5 13.9 15.2 14.9 14.9 5.4 4.8 62.4
Mexico 7.4 7.6 7.5 8.2 9.0 9.5 9.3 9.7 10.3 9.9 3.6 2.8 32.8
Philippines 6.2 6.8 6.3 7.4 7.8 8.0 8.4 8.6 8.9 9.6 3.5 4.4 56.5
Indonesia 4.8 5.0 4.7 5.1 5.6 6.4 7.2 7.3 8.0 8.3 3.0 5.3 71.6Turkey 6.3 5.9 6.3 6.4 6.5 6.5 7.1 6.8 6.5 6.6 2.4 0.5 5.2
Thailand 5.5 5.6 5.2 6.2 6.3 6.2 5.9 6.2 6.3 6.5 2.4 1.7 18.2
Ecuador 6.0 7.8 5.8 6.8 6.8 6.4 5.9 6.8 6.5 6.5 2.3 0.8 8.2
Nigeria 5.0 5.2 5.5 5.6 5.6 5.6 5.6 5.6 5.9 6.1 2.2 2.0 22.6
Others 71.2 73.4 74.2 75.1 73.5 74.9 77.3 78.4 81.2 82.8 29.9 1.5 16.3WORLD TOTAL 183.1 203.1 204.5 225.4 231.4 245.8 259.9 257.0 252.1 277.3 100.0 4.1 51.5

(Source: FAOSTAT)
MAJOR FRUIT PRODUCTION BY MAJOR COUNTRIES- 2005MAJOR FRUIT PRODUCTION BY MAJOR COUNTRIES- 2005MAJOR FRUIT PRODUCTION BY MAJOR COUNTRIES- 2005MAJOR FRUIT PRODUCTION BY MAJOR COUNTRIES- 2005
Countries Major FruitsProduction
(1000 tonnes)Share of Global Production (%)
World Ranking
China Watermelons 69,214 70.2 1 Other Melons 15,062 54.3 1 Bananas 6,670 9.6 3
India Bananas 11,710 16.9 1 Mangoes 11,140 37.3 1 Lemons & Limes 1,618 12.7 2
Brazil Bananas 6,703 9.7 2 Pineapples 2,292 12.8 1 Papayas 1,574 24.1 1
Mexico Bananas 2,250 3.2 8 Lemon & Limes 1,807 14.2 1 Mangoes 1,679 5.6 4
Philippines Bananas 6,298 9.1 4 Pineapples 1,788 10.0 3 Mangoes 1,003 3.4 8
MINOR FRUIT PRODUCTIONMINOR FRUIT PRODUCTIONMINOR FRUIT PRODUCTIONMINOR FRUIT PRODUCTION
Minor or exotic tropical fruits also contribute significantly towards the income of small farmers in Asia.
The important minor fruits include:
durian, rambutan, longan and mangosteen
Information on production of these fruits, however, are scarcely available
Trade statistics show that there is a growing interest in these fruits in both traditional and new markets
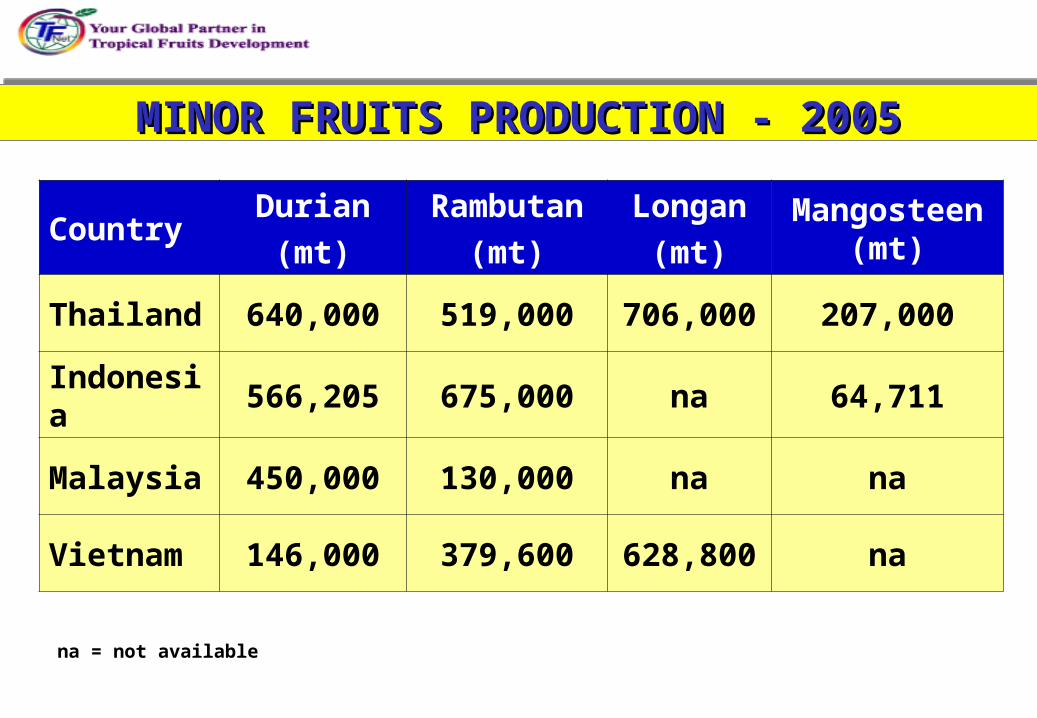
MINOR FRUITS PRODUCTION - 2005MINOR FRUITS PRODUCTION - 2005MINOR FRUITS PRODUCTION - 2005MINOR FRUITS PRODUCTION - 2005
CountryDurian
(mt)
Rambutan
(mt)
Longan
(mt)Mangosteen
(mt)
Thailand 640,000 519,000 706,000 207,000
Indonesia 566,205 675,000 na 64,711
Malaysia 450,000 130,000 na na
Vietnam 146,000 379,600 628,800 na
na = not available
3333 INTERNATIONAL TRADEINTERNATIONAL TRADEINTERNATIONAL TRADEINTERNATIONAL TRADE
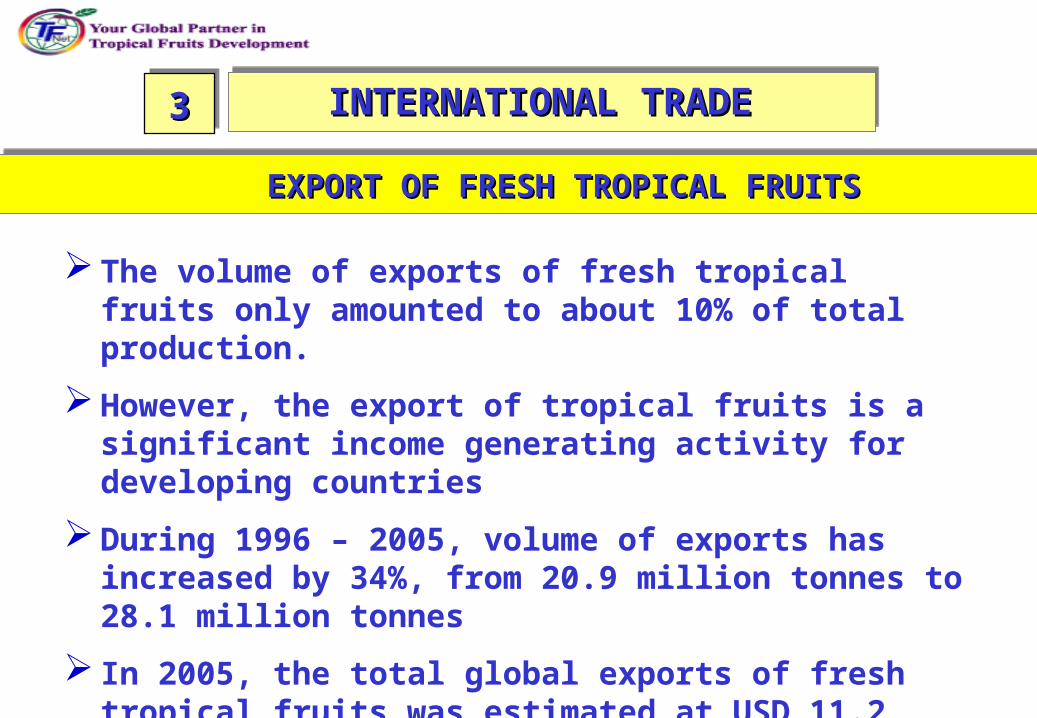
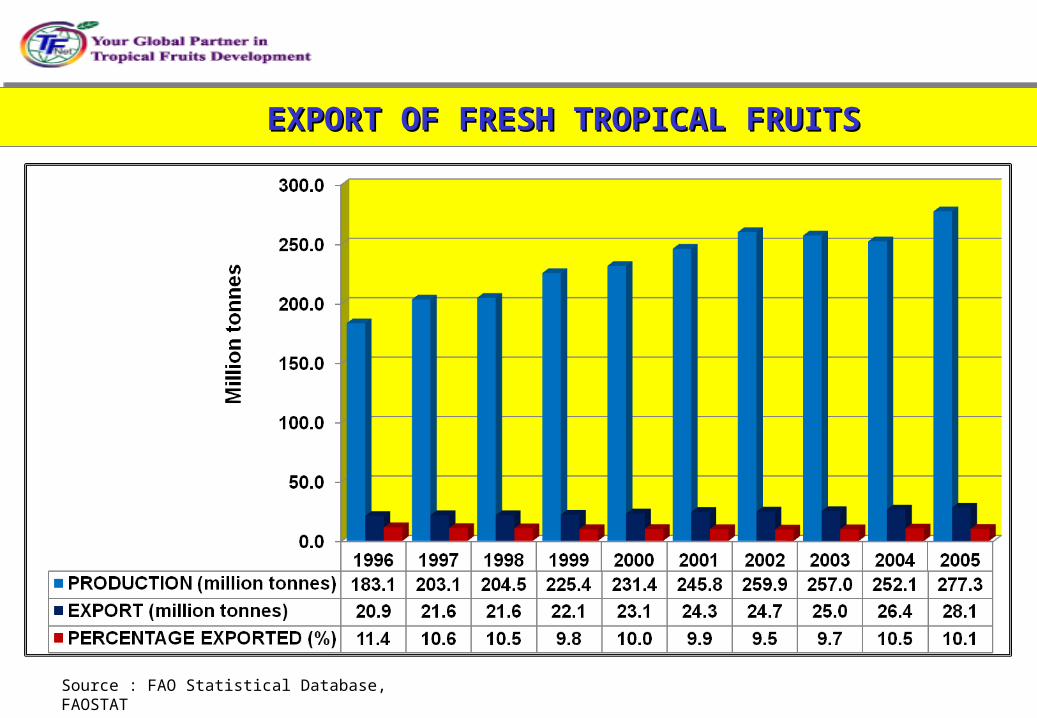
EXPORT OF FRESH TROPICAL FRUITSEXPORT OF FRESH TROPICAL FRUITSEXPORT OF FRESH TROPICAL FRUITSEXPORT OF FRESH TROPICAL FRUITS
The volume of exports of fresh tropical fruits only amounted to about 10% of total production.
However, the export of tropical fruits is a significant income generating activity for developing countries
During 1996 – 2005, volume of exports has increased by 34%, from 20.9 million tonnes to 28.1 million tonnes
In 2005, the total global exports of fresh tropical fruits was estimated at USD 11.2 billion
EXPORT OF FRESH TROPICAL FRUITSEXPORT OF FRESH TROPICAL FRUITSEXPORT OF FRESH TROPICAL FRUITSEXPORT OF FRESH TROPICAL FRUITS
Source : FAO Statistical Database, FAOSTAT
EXPORT OF FRESH TROPICAL FRUITSEXPORT OF FRESH TROPICAL FRUITSEXPORT OF FRESH TROPICAL FRUITSEXPORT OF FRESH TROPICAL FRUITS
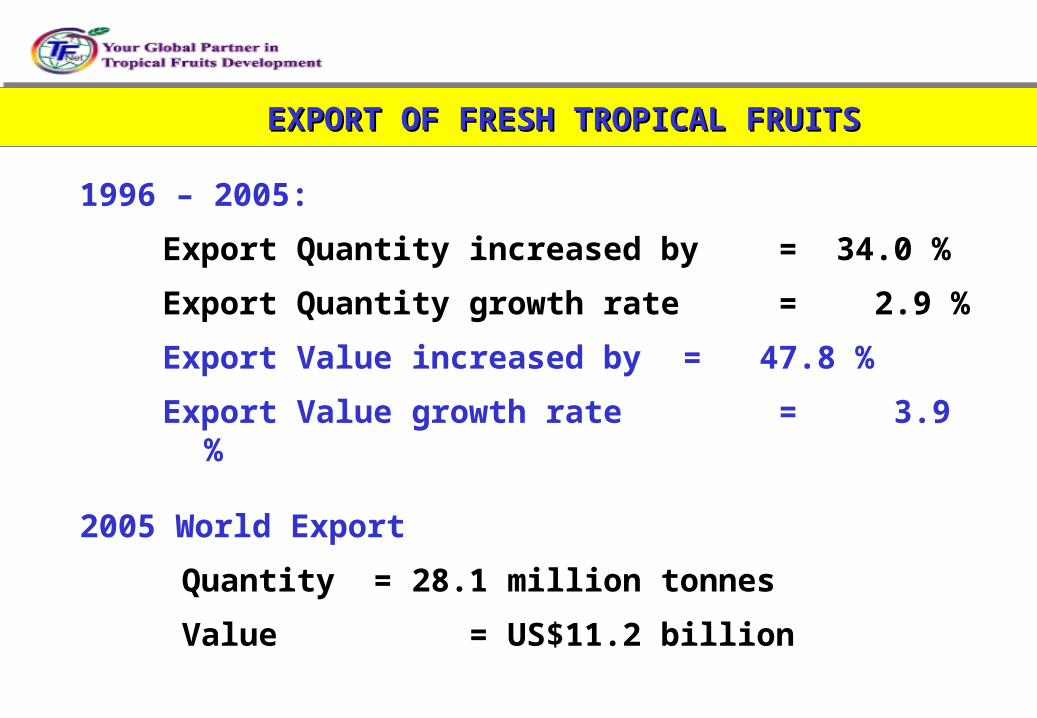
1996 – 2005:
Export Quantity increased by = 34.0 %
Export Quantity growth rate = 2.9 %
Export Value increased by = 47.8 %
Export Value growth rate = 3.9 %
2005 World Export
Quantity = 28.1 million tonnes
Value = US$11.2 billion
Source : FAO Statistical Database, FAOSTAT
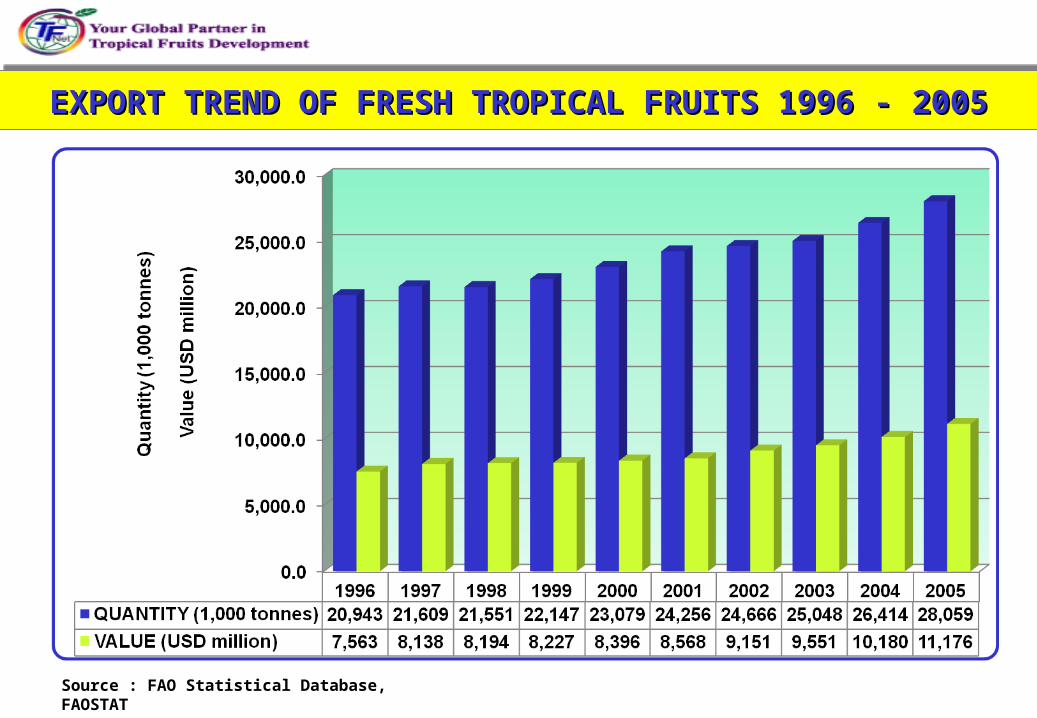
EXPORT TREND OF FRESH TROPICAL FRUITS 1996 - 2005EXPORT TREND OF FRESH TROPICAL FRUITS 1996 - 2005EXPORT TREND OF FRESH TROPICAL FRUITS 1996 - 2005EXPORT TREND OF FRESH TROPICAL FRUITS 1996 - 2005
Source : FAO Statistical Database, FAOSTAT
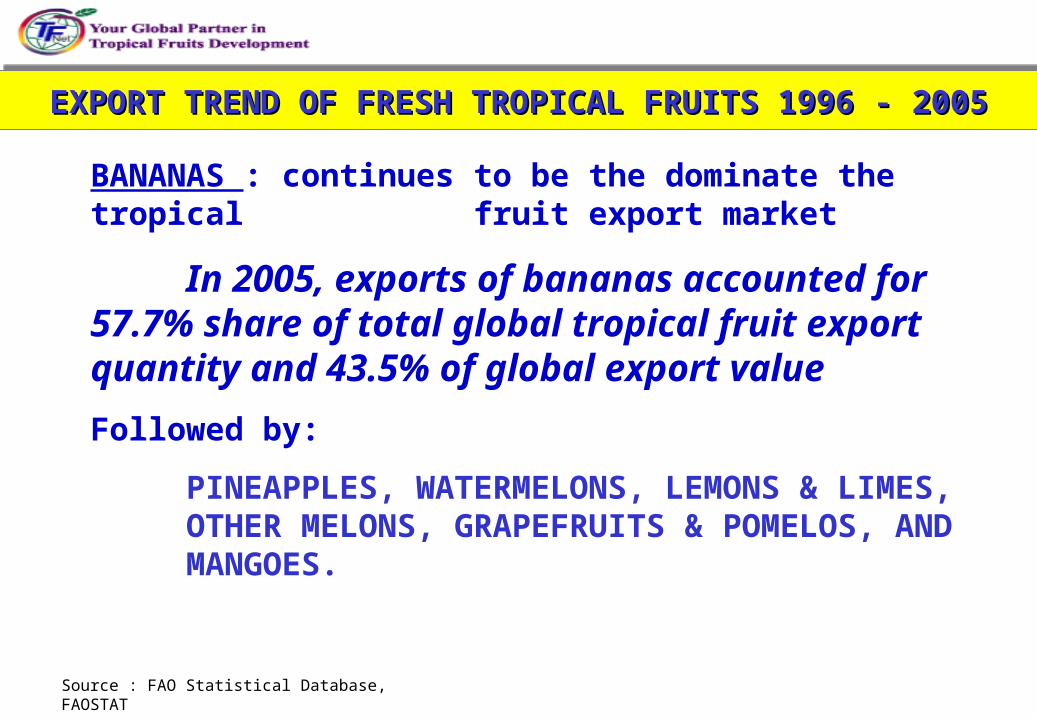
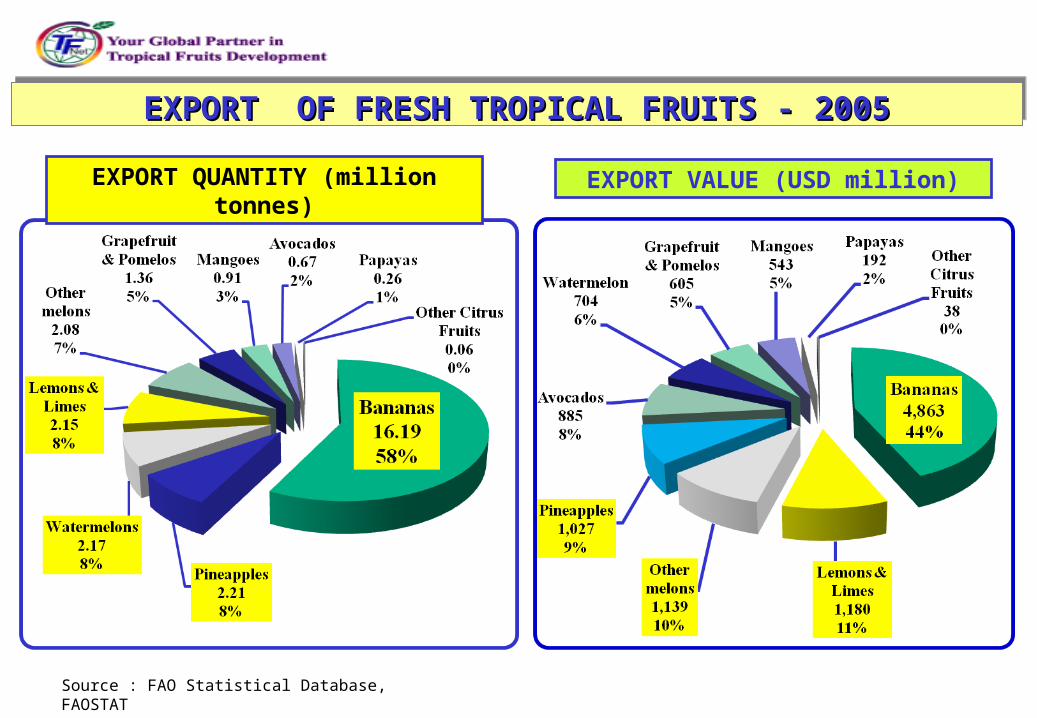
BANANAS : continues to be the dominate the tropical fruit export market
In 2005, exports of bananas accounted for 57.7% share of total global tropical fruit export quantity and 43.5% of global export value
Followed by:
PINEAPPLES, WATERMELONS, LEMONS & LIMES, OTHER MELONS, GRAPEFRUITS & POMELOS, AND MANGOES.
EXPORT TREND OF FRESH TROPICAL FRUITS 1996 - 2005EXPORT TREND OF FRESH TROPICAL FRUITS 1996 - 2005EXPORT TREND OF FRESH TROPICAL FRUITS 1996 - 2005EXPORT TREND OF FRESH TROPICAL FRUITS 1996 - 2005
Source : FAO Statistical Database, FAOSTAT
EXPORT OF FRESH TROPICAL FRUITS - 2005EXPORT OF FRESH TROPICAL FRUITS - 2005EXPORT OF FRESH TROPICAL FRUITS - 2005EXPORT OF FRESH TROPICAL FRUITS - 2005
EXPORT QUANTITY (million tonnes) EXPORT VALUE (USD million)
Source : FAO Statistical Database, FAOSTAT
EXPORT TREND OF FRESH TROPICAL FRUITS 1996 – 2005 EXPORT TREND OF FRESH TROPICAL FRUITS 1996 – 2005
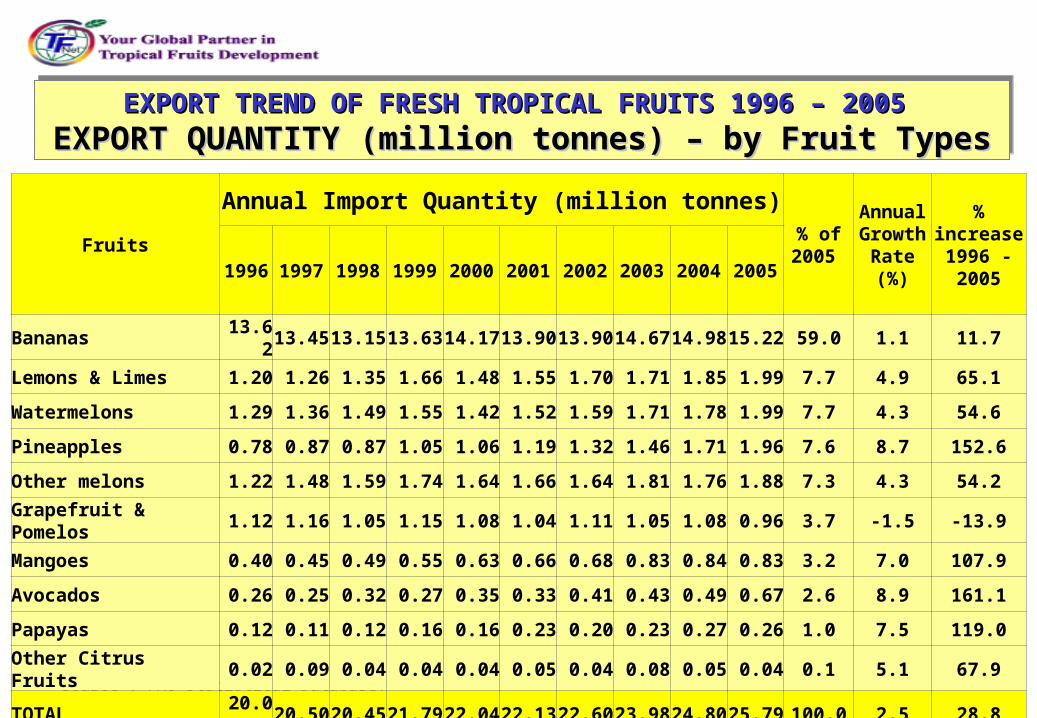
EXPORT QUANTITY (million tonnes) – by Fruit TypesEXPORT QUANTITY (million tonnes) – by Fruit TypesEXPORT TREND OF FRESH TROPICAL FRUITS 1996 – 2005 EXPORT TREND OF FRESH TROPICAL FRUITS 1996 – 2005
EXPORT QUANTITY (million tonnes) – by Fruit TypesEXPORT QUANTITY (million tonnes) – by Fruit Types
Fruits
Annual Import Quantity (million tonnes)% of 2005
Annual Growth Rate (%)
% increase
1996 - 20051996 1997 1998 1999 2000 2001 2002 2003 2004 2005
Bananas 13.62 13.45 13.15 13.63 14.17 13.90 13.90 14.67 14.98 15.22 59.0 1.1 11.7
Lemons & Limes 1.20 1.26 1.35 1.66 1.48 1.55 1.70 1.71 1.85 1.99 7.7 4.9 65.1
Watermelons 1.29 1.36 1.49 1.55 1.42 1.52 1.59 1.71 1.78 1.99 7.7 4.3 54.6
Pineapples 0.78 0.87 0.87 1.05 1.06 1.19 1.32 1.46 1.71 1.96 7.6 8.7 152.6
Other melons 1.22 1.48 1.59 1.74 1.64 1.66 1.64 1.81 1.76 1.88 7.3 4.3 54.2
Grapefruit & Pomelos 1.12 1.16 1.05 1.15 1.08 1.04 1.11 1.05 1.08 0.96 3.7 -1.5 -13.9
Mangoes 0.40 0.45 0.49 0.55 0.63 0.66 0.68 0.83 0.84 0.83 3.2 7.0 107.9
Avocados 0.26 0.25 0.32 0.27 0.35 0.33 0.41 0.43 0.49 0.67 2.6 8.9 161.1
Papayas 0.12 0.11 0.12 0.16 0.16 0.23 0.20 0.23 0.27 0.26 1.0 7.5 119.0
Other Citrus Fruits 0.02 0.09 0.04 0.04 0.04 0.05 0.04 0.08 0.05 0.04 0.1 5.1 67.9
TOTAL 20.02 20.50 20.45 21.79 22.04 22.13 22.60 23.98 24.80 25.79 100.0 2.5 28.8
Source : FAO Statistical Database, FAOSTAT
EXPORT TREND OF FRESH TROPICAL FRUITS 1996 – 2005 EXPORT TREND OF FRESH TROPICAL FRUITS 1996 – 2005
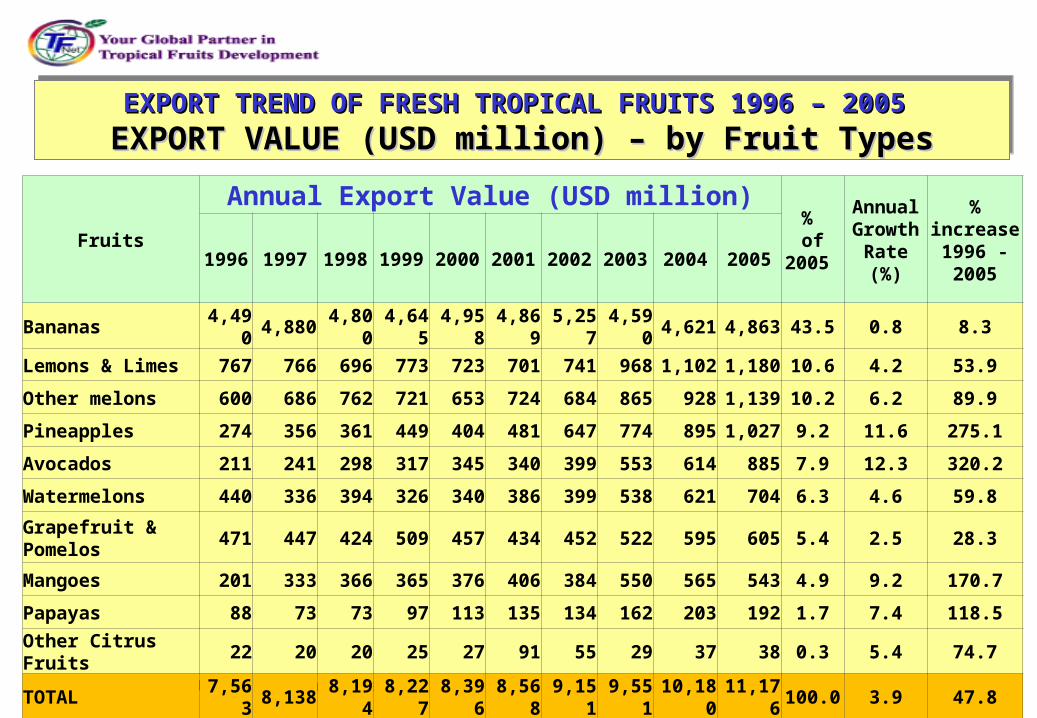
EXPORT VALUE (USD million) – by Fruit TypesEXPORT VALUE (USD million) – by Fruit TypesEXPORT TREND OF FRESH TROPICAL FRUITS 1996 – 2005 EXPORT TREND OF FRESH TROPICAL FRUITS 1996 – 2005
EXPORT VALUE (USD million) – by Fruit TypesEXPORT VALUE (USD million) – by Fruit Types
Fruits
Annual Export Value (USD million)% of
2005
Annual Growth Rate (%)
% increase
1996 - 2005
1996 1997 1998 1999 2000 2001 2002 2003 2004 2005
Bananas 4,490 4,880 4,800 4,645 4,958 4,869 5,257 4,590 4,621 4,863 43.5 0.8 8.3
Lemons & Limes 767 766 696 773 723 701 741 968 1,102 1,180 10.6 4.2 53.9
Other melons 600 686 762 721 653 724 684 865 928 1,139 10.2 6.2 89.9
Pineapples 274 356 361 449 404 481 647 774 895 1,027 9.2 11.6 275.1
Avocados 211 241 298 317 345 340 399 553 614 885 7.9 12.3 320.2
Watermelons 440 336 394 326 340 386 399 538 621 704 6.3 4.6 59.8
Grapefruit & Pomelos
471 447 424 509 457 434 452 522 595 605 5.4 2.5 28.3
Mangoes 201 333 366 365 376 406 384 550 565 543 4.9 9.2 170.7
Papayas 88 73 73 97 113 135 134 162 203 192 1.7 7.4 118.5
Other Citrus Fruits 22 20 20 25 27 91 55 29 37 38 0.3 5.4 74.7
TOTAL 7,563 8,138 8,194 8,227 8,396 8,568 9,151 9,551 10,180 11,176 100.0 3.9 47.8
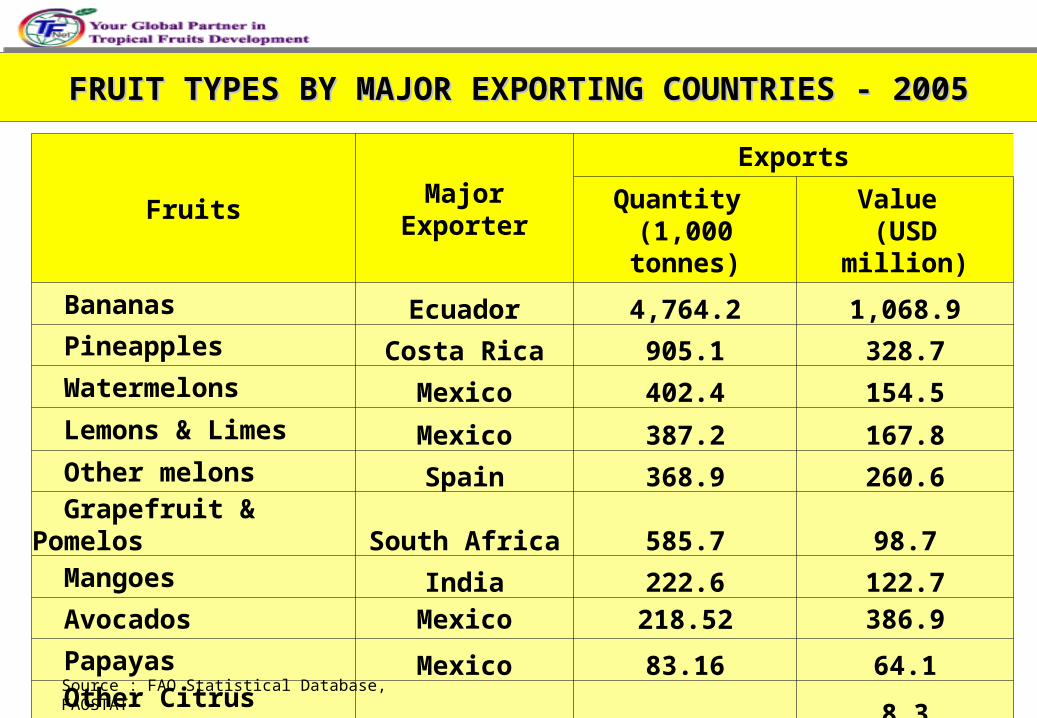
FRUIT TYPES BY MAJOR EXPORTING COUNTRIES - 2005FRUIT TYPES BY MAJOR EXPORTING COUNTRIES - 2005FRUIT TYPES BY MAJOR EXPORTING COUNTRIES - 2005FRUIT TYPES BY MAJOR EXPORTING COUNTRIES - 2005
Fruits Major ExporterExports
Quantity (1,000 tonnes)
Value (USD million)
Bananas Ecuador 4,764.2 1,068.9 Pineapples Costa Rica 905.1 328.7 Watermelons Mexico 402.4 154.5
Lemons & Limes Mexico 387.2 167.8 Other melons Spain 368.9 260.6 Grapefruit & Pomelos South Africa 585.7 98.7 Mangoes India 222.6 122.7 Avocados Mexico 218.52 386.9
Papayas Mexico 83.16 64.1 Other Citrus Fruits China 20.82 8.3
Source : FAO Statistical Database, FAOSTAT
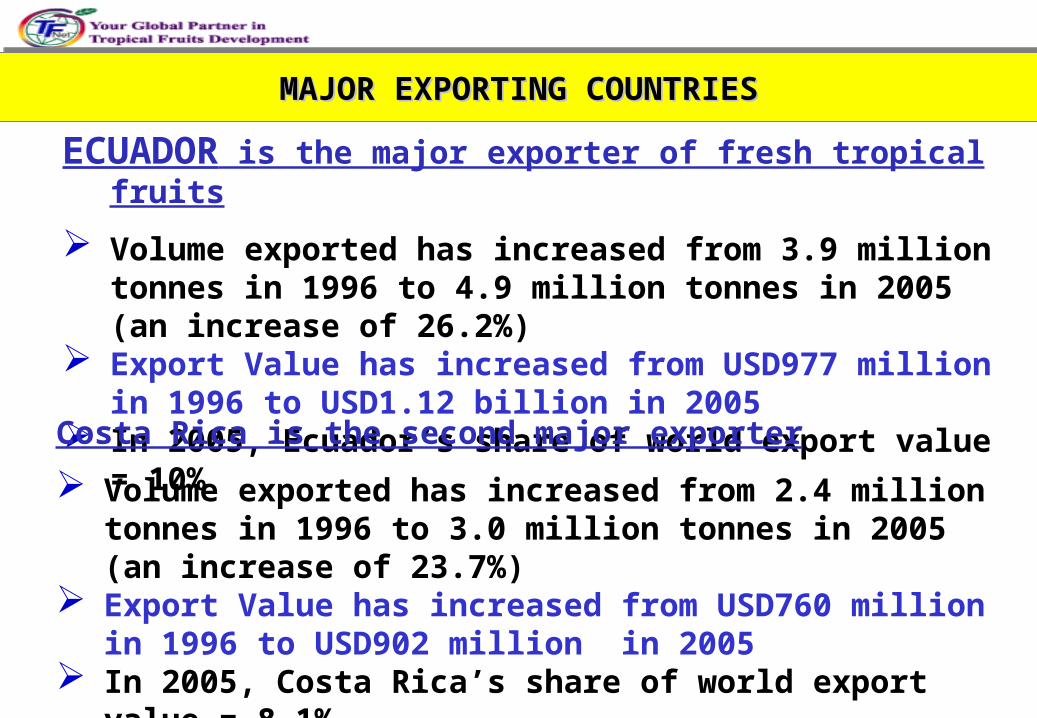
MAJOR EXPORTING COUNTRIESMAJOR EXPORTING COUNTRIESMAJOR EXPORTING COUNTRIESMAJOR EXPORTING COUNTRIES
ECUADOR is the major exporter of fresh tropical fruits
Volume exported has increased from 3.9 million tonnes in 1996 to 4.9 million tonnes in 2005 (an increase of 26.2%)
Export Value has increased from USD977 million in 1996 to USD1.12 billion in 2005
In 2005, Ecuador’s share of world export value = 10%
Costa Rica is the second major exporter
Volume exported has increased from 2.4 million tonnes in 1996 to 3.0 million tonnes in 2005 (an increase of 23.7%)
Export Value has increased from USD760 million in 1996 to USD902 million in 2005
In 2005, Costa Rica’s share of world export value = 8.1%
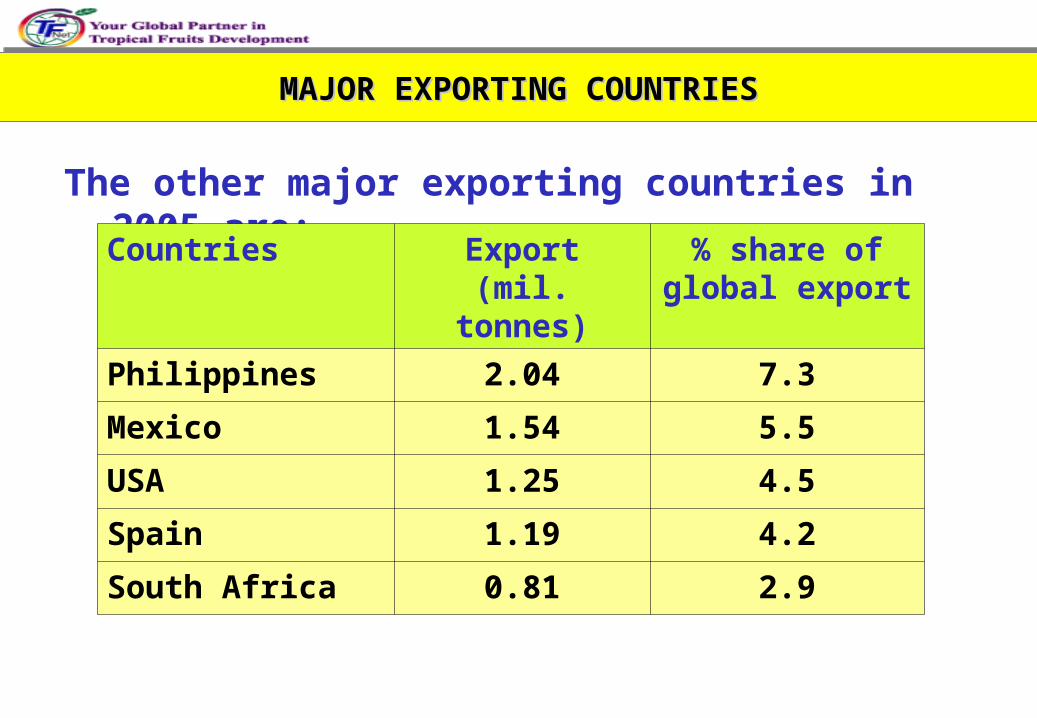
MAJOR EXPORTING COUNTRIESMAJOR EXPORTING COUNTRIESMAJOR EXPORTING COUNTRIESMAJOR EXPORTING COUNTRIES
The other major exporting countries in 2005 are:
Countries Export(mil. tonnes)
% share of global export
Philippines 2.04 7.3
Mexico 1.54 5.5
USA 1.25 4.5
Spain 1.19 4.2
South Africa 0.81 2.9
Source : FAO Statistical Database, FAOSTAT
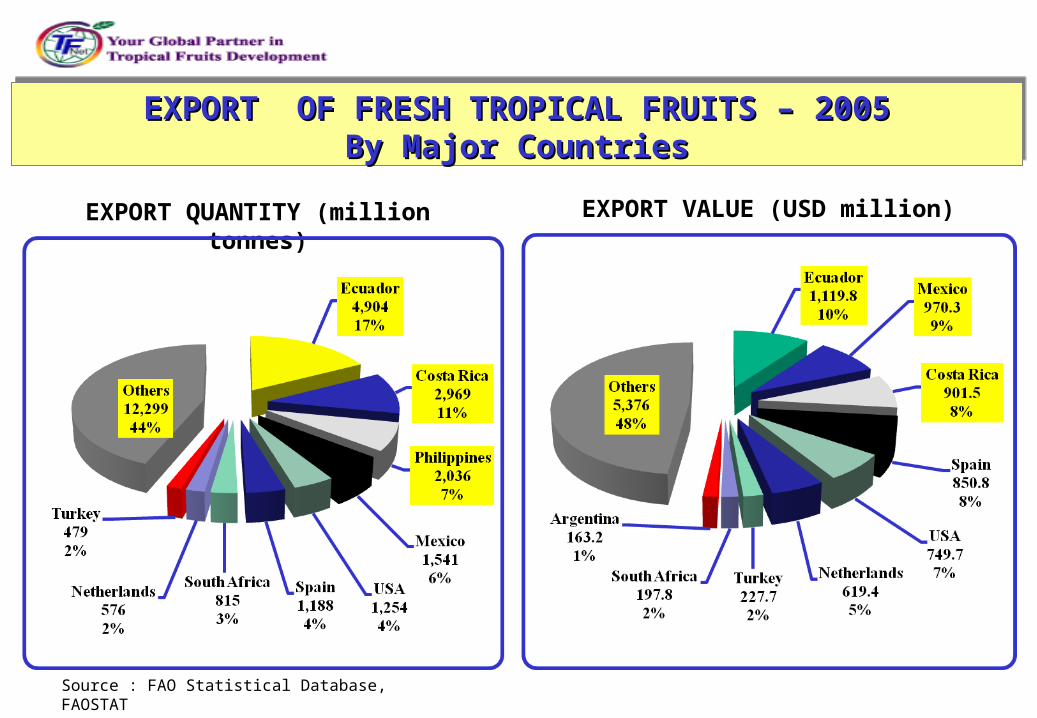
EXPORT OF FRESH TROPICAL FRUITS – 2005EXPORT OF FRESH TROPICAL FRUITS – 2005By Major CountriesBy Major Countries
EXPORT OF FRESH TROPICAL FRUITS – 2005EXPORT OF FRESH TROPICAL FRUITS – 2005By Major CountriesBy Major Countries
EXPORT QUANTITY (million tonnes) EXPORT VALUE (USD million)
EXPORT TREND OF FRESH TROPICAL FRUITS 1996 – 2005 EXPORT TREND OF FRESH TROPICAL FRUITS 1996 – 2005
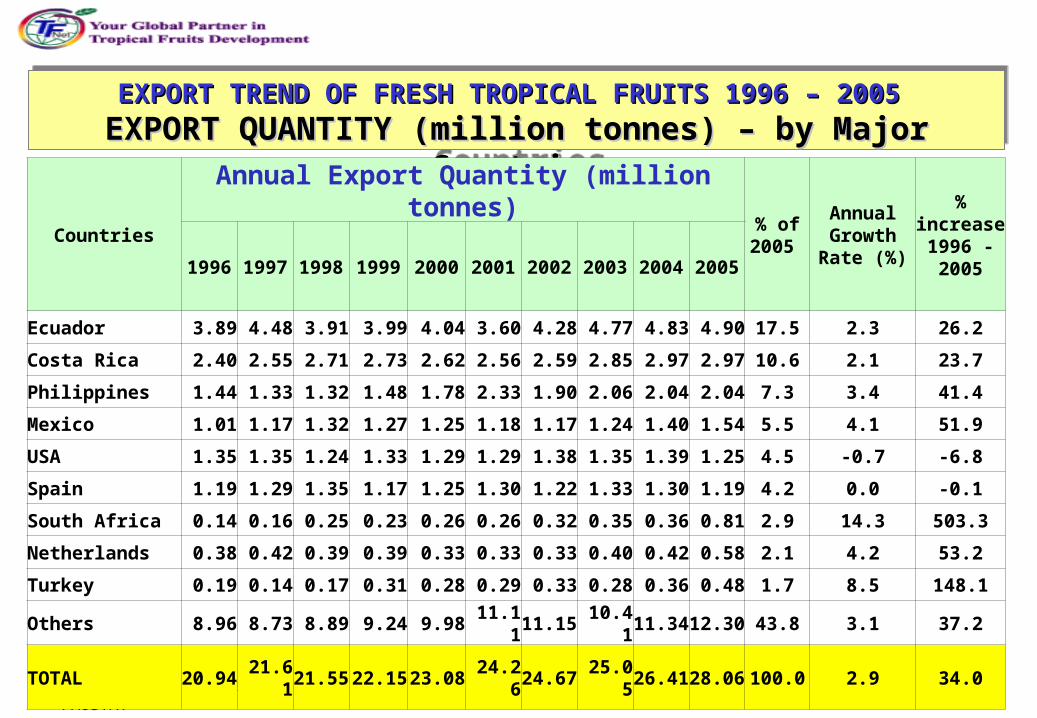
EXPORT QUANTITY (million tonnes) – by Major CountriesEXPORT QUANTITY (million tonnes) – by Major CountriesEXPORT TREND OF FRESH TROPICAL FRUITS 1996 – 2005 EXPORT TREND OF FRESH TROPICAL FRUITS 1996 – 2005
EXPORT QUANTITY (million tonnes) – by Major CountriesEXPORT QUANTITY (million tonnes) – by Major Countries
Source : FAO Statistical Database, FAOSTAT
Countries
Annual Export Quantity (million tonnes)% of 2005
Annual Growth Rate (%)
% increase
1996 - 2005
1996 1997 1998 1999 2000 2001 2002 2003 2004 2005
Ecuador 3.89 4.48 3.91 3.99 4.04 3.60 4.28 4.77 4.83 4.90 17.5 2.3 26.2
Costa Rica 2.40 2.55 2.71 2.73 2.62 2.56 2.59 2.85 2.97 2.97 10.6 2.1 23.7
Philippines 1.44 1.33 1.32 1.48 1.78 2.33 1.90 2.06 2.04 2.04 7.3 3.4 41.4
Mexico 1.01 1.17 1.32 1.27 1.25 1.18 1.17 1.24 1.40 1.54 5.5 4.1 51.9
USA 1.35 1.35 1.24 1.33 1.29 1.29 1.38 1.35 1.39 1.25 4.5 -0.7 -6.8
Spain 1.19 1.29 1.35 1.17 1.25 1.30 1.22 1.33 1.30 1.19 4.2 0.0 -0.1
South Africa 0.14 0.16 0.25 0.23 0.26 0.26 0.32 0.35 0.36 0.81 2.9 14.3 503.3
Netherlands 0.38 0.42 0.39 0.39 0.33 0.33 0.33 0.40 0.42 0.58 2.1 4.2 53.2
Turkey 0.19 0.14 0.17 0.31 0.28 0.29 0.33 0.28 0.36 0.48 1.7 8.5 148.1
Others 8.96 8.73 8.89 9.24 9.98 11.11 11.15 10.41 11.34 12.30 43.8 3.1 37.2
TOTAL 20.94 21.61 21.55 22.15 23.08 24.26 24.67 25.05 26.41 28.06 100.0 2.9 34.0
EXPORT TREND OF FRESH TROPICAL FRUITS 1996 – 2005 EXPORT TREND OF FRESH TROPICAL FRUITS 1996 – 2005
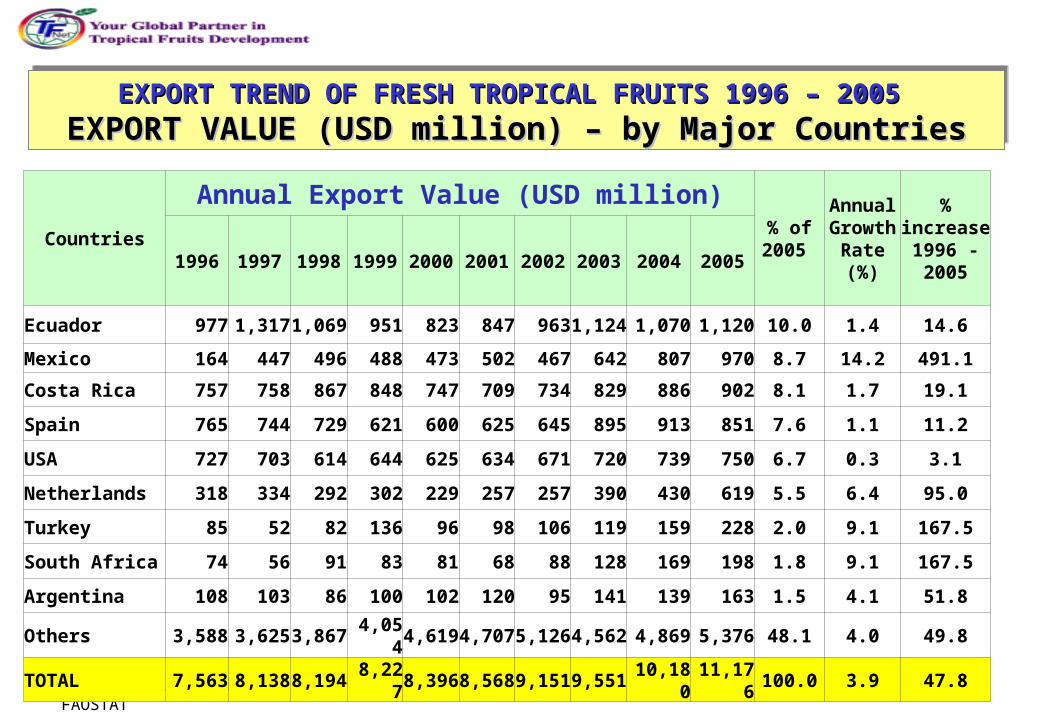
EXPORT VALUE (USD million) – by Major CountriesEXPORT VALUE (USD million) – by Major CountriesEXPORT TREND OF FRESH TROPICAL FRUITS 1996 – 2005 EXPORT TREND OF FRESH TROPICAL FRUITS 1996 – 2005
EXPORT VALUE (USD million) – by Major CountriesEXPORT VALUE (USD million) – by Major Countries
Source : FAO Statistical Database, FAOSTAT
Countries
Annual Export Value (USD million)% of 2005
Annual Growth Rate (%)
% increase
1996 - 2005
1996 1997 1998 1999 2000 2001 2002 2003 2004 2005
Ecuador 977 1,317 1,069 951 823 847 963 1,124 1,070 1,120 10.0 1.4 14.6
Mexico 164 447 496 488 473 502 467 642 807 970 8.7 14.2 491.1
Costa Rica 757 758 867 848 747 709 734 829 886 902 8.1 1.7 19.1
Spain 765 744 729 621 600 625 645 895 913 851 7.6 1.1 11.2
USA 727 703 614 644 625 634 671 720 739 750 6.7 0.3 3.1
Netherlands 318 334 292 302 229 257 257 390 430 619 5.5 6.4 95.0
Turkey 85 52 82 136 96 98 106 119 159 228 2.0 9.1 167.5
South Africa 74 56 91 83 81 68 88 128 169 198 1.8 9.1 167.5
Argentina 108 103 86 100 102 120 95 141 139 163 1.5 4.1 51.8
Others 3,588 3,625 3,867 4,054 4,619 4,707 5,126 4,562 4,869 5,376 48.1 4.0 49.8
TOTAL 7,563 8,138 8,194 8,227 8,396 8,568 9,151 9,551 10,180 11,176 100.0 3.9 47.8
(Source: FAOSTAT)
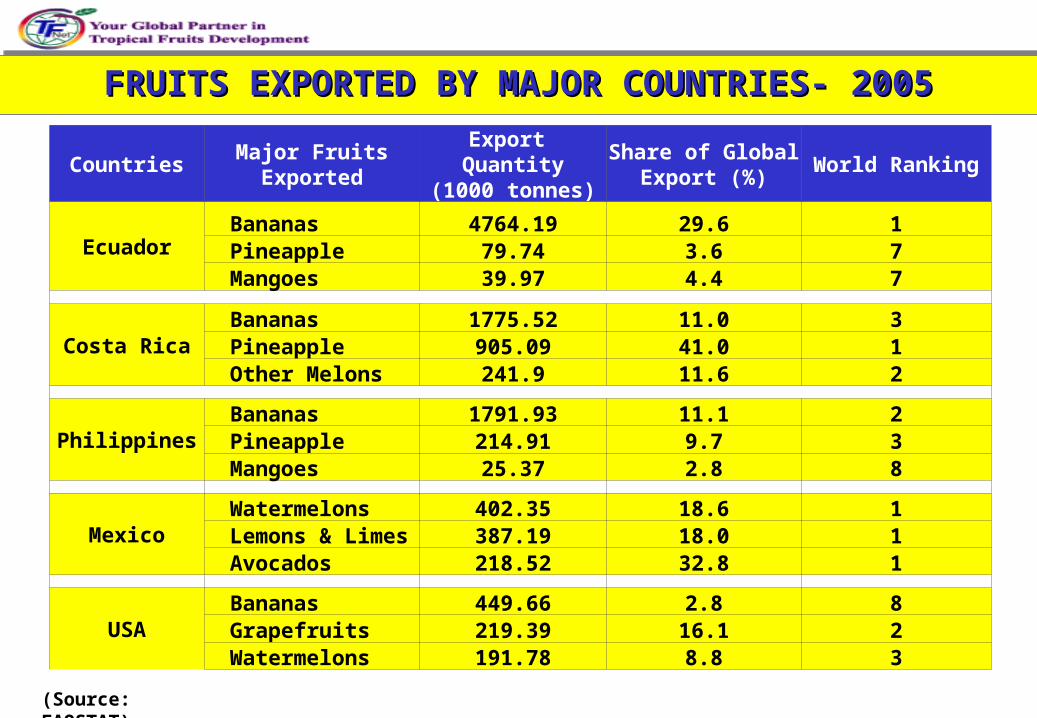
FRUITS EXPORTED BY MAJOR COUNTRIES- 2005FRUITS EXPORTED BY MAJOR COUNTRIES- 2005FRUITS EXPORTED BY MAJOR COUNTRIES- 2005FRUITS EXPORTED BY MAJOR COUNTRIES- 2005
CountriesMajor Fruits
ExportedExport Quantity
(1000 tonnes)Share of Global
Export (%)World Ranking
Ecuador Bananas 4764.19 29.6 1 Pineapple 79.74 3.6 7 Mangoes 39.97 4.4 7
Costa Rica Bananas 1775.52 11.0 3 Pineapple 905.09 41.0 1 Other Melons 241.9 11.6 2
Philippines Bananas 1791.93 11.1 2 Pineapple 214.91 9.7 3 Mangoes 25.37 2.8 8
Mexico Watermelons 402.35 18.6 1 Lemons & Limes 387.19 18.0 1 Avocados 218.52 32.8 1
USA Bananas 449.66 2.8 8 Grapefruits 219.39 16.1 2 Watermelons 191.78 8.8 3
IMPORT OF FRESH TROPICAL FRUITSIMPORT OF FRESH TROPICAL FRUITSIMPORT OF FRESH TROPICAL FRUITSIMPORT OF FRESH TROPICAL FRUITS
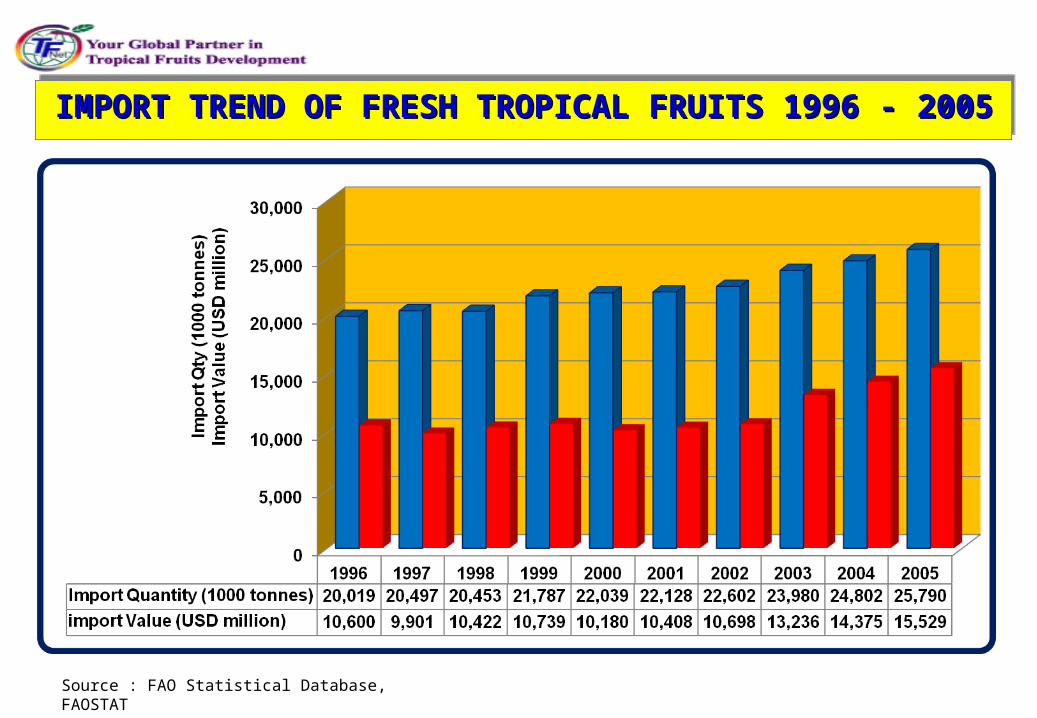
From 1996 to 2005, imports of fresh tropical fruits has expanded by 28.8% from 20.0 million tonnes to 25.8 million tonnes
The value of imports has increased by 46.5%, from USD10.6 billion in 1996 to USD15.5 billion in 2005
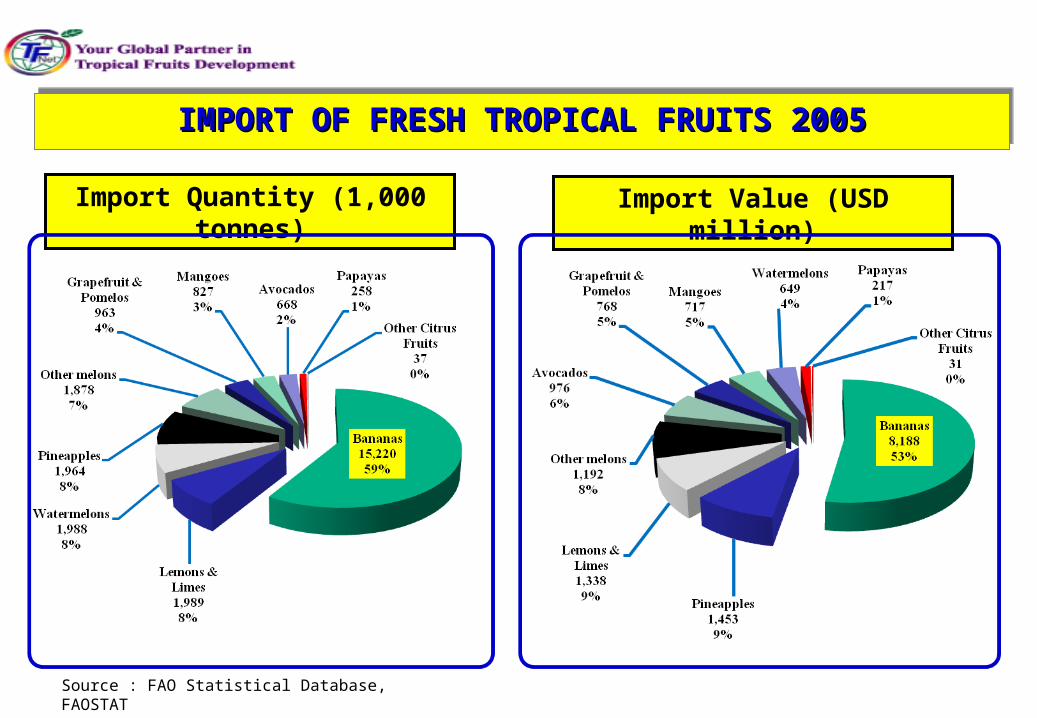
Bananas accounted for 59% of total world imports of fresh tropical fruits in 2005
USA is the world’s largest importer; accounting for 24.5% of global import volume in 2005
Source : FAO Statistical Database, FAOSTAT
IMPORT TREND OF FRESH TROPICAL FRUITS 1996 - 2005IMPORT TREND OF FRESH TROPICAL FRUITS 1996 - 2005IMPORT TREND OF FRESH TROPICAL FRUITS 1996 - 2005IMPORT TREND OF FRESH TROPICAL FRUITS 1996 - 2005
Source : FAO Statistical Database, FAOSTAT
IMPORT TREND OF FRESH TROPICAL FRUITS 1996 - 2005IMPORT TREND OF FRESH TROPICAL FRUITS 1996 - 2005IMPORT TREND OF FRESH TROPICAL FRUITS 1996 - 2005IMPORT TREND OF FRESH TROPICAL FRUITS 1996 - 2005
Fresh tropical fruit import market is dominated by bananas, which accounts for 59% of total world import quantity in 2005
Other major imported tropical fruits include;lemons & limes; watermelons and pineapples
Imports of pineapples has shown very significant increase of 152.6% during 1996 – 2005
Source : FAO Statistical Database, FAOSTAT
IMPORT OF FRESH TROPICAL FRUITS 2005IMPORT OF FRESH TROPICAL FRUITS 2005IMPORT OF FRESH TROPICAL FRUITS 2005IMPORT OF FRESH TROPICAL FRUITS 2005
Import Quantity (1,000 tonnes) Import Value (USD million)

Source : FAO Statistical Database, FAOSTAT
IMPORT QUANTITY OF FRESH TROPICAL FRUITS 1996 - 2005IMPORT QUANTITY OF FRESH TROPICAL FRUITS 1996 - 2005– – by Fruit Types (million tonnes)by Fruit Types (million tonnes)
IMPORT QUANTITY OF FRESH TROPICAL FRUITS 1996 - 2005IMPORT QUANTITY OF FRESH TROPICAL FRUITS 1996 - 2005– – by Fruit Types (million tonnes)by Fruit Types (million tonnes)
Fruits
Annual Import Quantity (million tonnes)% of 2005
Annual Growth Rate (%)
% increase
1996 - 20051996 1997 1998 1999 2000 2001 2002 2003 2004 2005
Bananas 13.62 13.45 13.15 13.63 14.17 13.90 13.90 14.67 14.98 15.22 59.0 1.1 11.7
Lemons & Limes 1.20 1.26 1.35 1.66 1.48 1.55 1.70 1.71 1.85 1.99 7.7 4.9 65.1
Watermelons 1.29 1.36 1.49 1.55 1.42 1.52 1.59 1.71 1.78 1.99 7.7 4.3 54.6
Pineapples 0.78 0.87 0.87 1.05 1.06 1.19 1.32 1.46 1.71 1.96 7.6 8.7 152.6
Other melons 1.22 1.48 1.59 1.74 1.64 1.66 1.64 1.81 1.76 1.88 7.3 4.3 54.2
Grapefruit & Pomelos 1.12 1.16 1.05 1.15 1.08 1.04 1.11 1.05 1.08 0.96 3.7 -1.5 -13.9
Mangoes 0.40 0.45 0.49 0.55 0.63 0.66 0.68 0.83 0.84 0.83 3.2 7.0 107.9
Avocados 0.26 0.25 0.32 0.27 0.35 0.33 0.41 0.43 0.49 0.67 2.6 8.9 161.1
Papayas 0.12 0.11 0.12 0.16 0.16 0.23 0.20 0.23 0.27 0.26 1.0 7.5 119.0
Other Citrus Fruits 0.02 0.09 0.04 0.04 0.04 0.05 0.04 0.08 0.05 0.04 0.1 5.1 67.9
TOTAL 20.02 20.50 20.45 21.79 22.04 22.13 22.60 23.98 24.80 25.79 100.0 2.5 28.8
Source : FAO Statistical Database, FAOSTAT
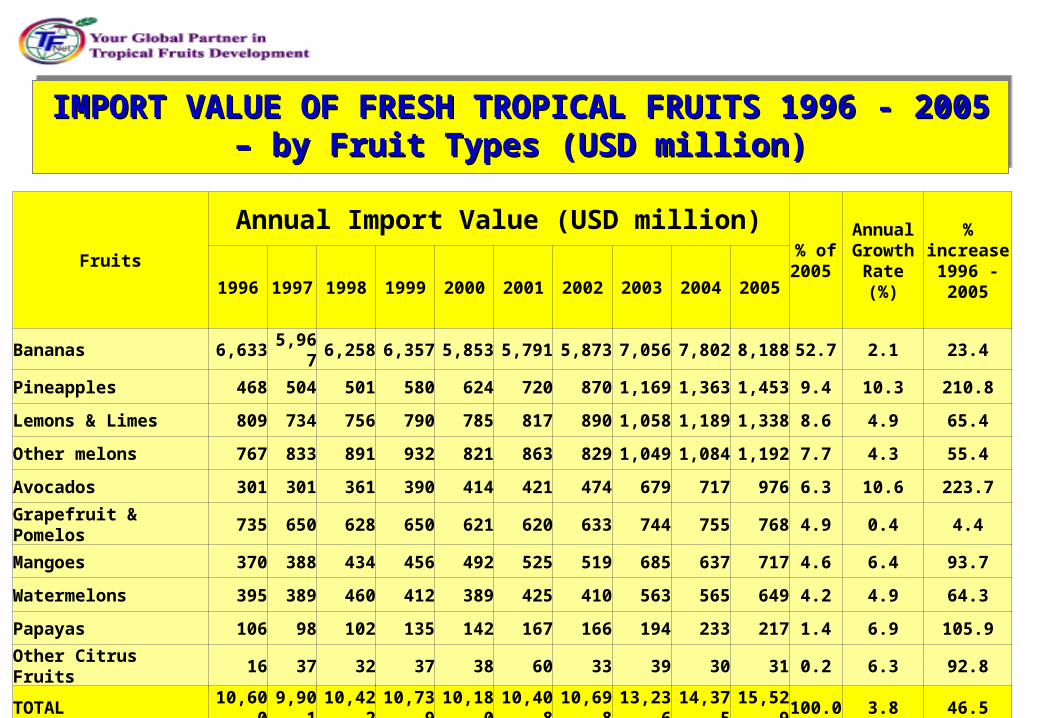
IMPORT VALUE OF FRESH TROPICAL FRUITS 1996 - 2005IMPORT VALUE OF FRESH TROPICAL FRUITS 1996 - 2005– – by Fruit Types (USD million)by Fruit Types (USD million)
IMPORT VALUE OF FRESH TROPICAL FRUITS 1996 - 2005IMPORT VALUE OF FRESH TROPICAL FRUITS 1996 - 2005– – by Fruit Types (USD million)by Fruit Types (USD million)
Fruits
Annual Import Value (USD million)% of 2005
Annual Growth Rate (%)
% increase
1996 - 20051996 1997 1998 1999 2000 2001 2002 2003 2004 2005
Bananas 6,633 5,967 6,258 6,357 5,853 5,791 5,873 7,056 7,802 8,188 52.7 2.1 23.4
Pineapples 468 504 501 580 624 720 870 1,169 1,363 1,453 9.4 10.3 210.8
Lemons & Limes 809 734 756 790 785 817 890 1,058 1,189 1,338 8.6 4.9 65.4
Other melons 767 833 891 932 821 863 829 1,049 1,084 1,192 7.7 4.3 55.4
Avocados 301 301 361 390 414 421 474 679 717 976 6.3 10.6 223.7
Grapefruit & Pomelos 735 650 628 650 621 620 633 744 755 768 4.9 0.4 4.4
Mangoes 370 388 434 456 492 525 519 685 637 717 4.6 6.4 93.7
Watermelons 395 389 460 412 389 425 410 563 565 649 4.2 4.9 64.3
Papayas 106 98 102 135 142 167 166 194 233 217 1.4 6.9 105.9
Other Citrus Fruits 16 37 32 37 38 60 33 39 30 31 0.2 6.3 92.8
TOTAL 10,600 9,901 10,422 10,739 10,180 10,408 10,698 13,236 14,375 15,529 100.0 3.8 46.5
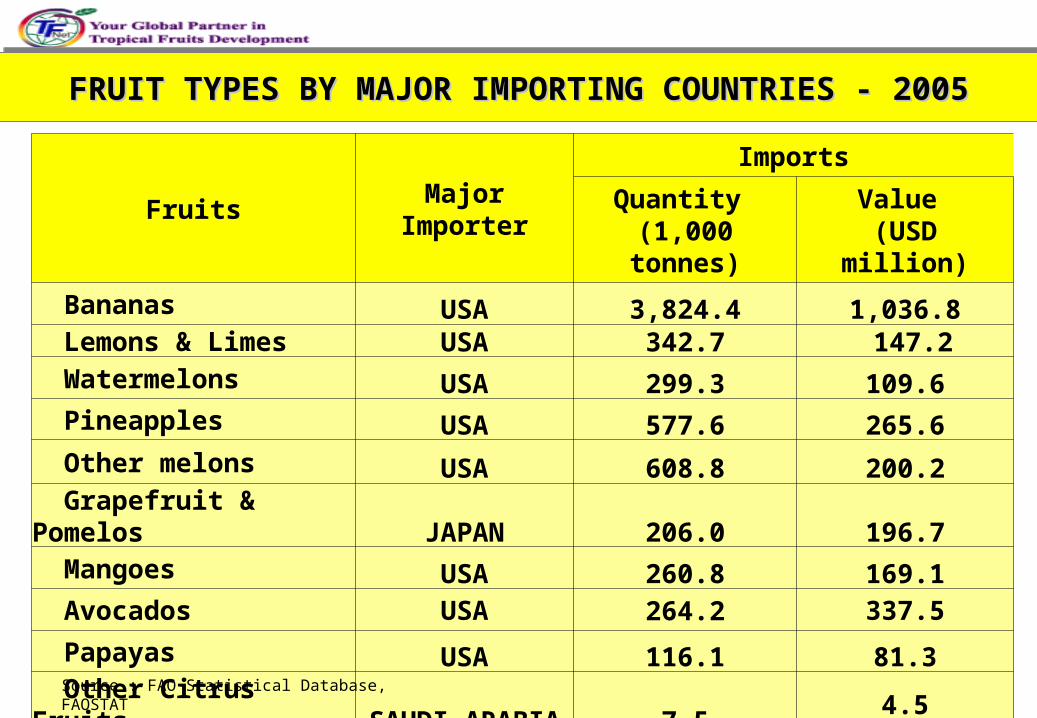
FRUIT TYPES BY MAJOR IMPORTING COUNTRIES - 2005FRUIT TYPES BY MAJOR IMPORTING COUNTRIES - 2005FRUIT TYPES BY MAJOR IMPORTING COUNTRIES - 2005FRUIT TYPES BY MAJOR IMPORTING COUNTRIES - 2005
Fruits Major ImporterImports
Quantity (1,000 tonnes)
Value (USD million)
Bananas USA 3,824.4 1,036.8 Lemons & Limes USA 342.7 147.2 Watermelons USA 299.3 109.6 Pineapples USA 577.6 265.6
Other melons USA 608.8 200.2 Grapefruit & Pomelos JAPAN 206.0 196.7 Mangoes USA 260.8 169.1 Avocados USA 264.2 337.5
Papayas USA 116.1 81.3 Other Citrus Fruits SAUDI ARABIA 7.5 4.5
Source : FAO Statistical Database, FAOSTAT
Source : FAO Statistical Database, FAOSTAT
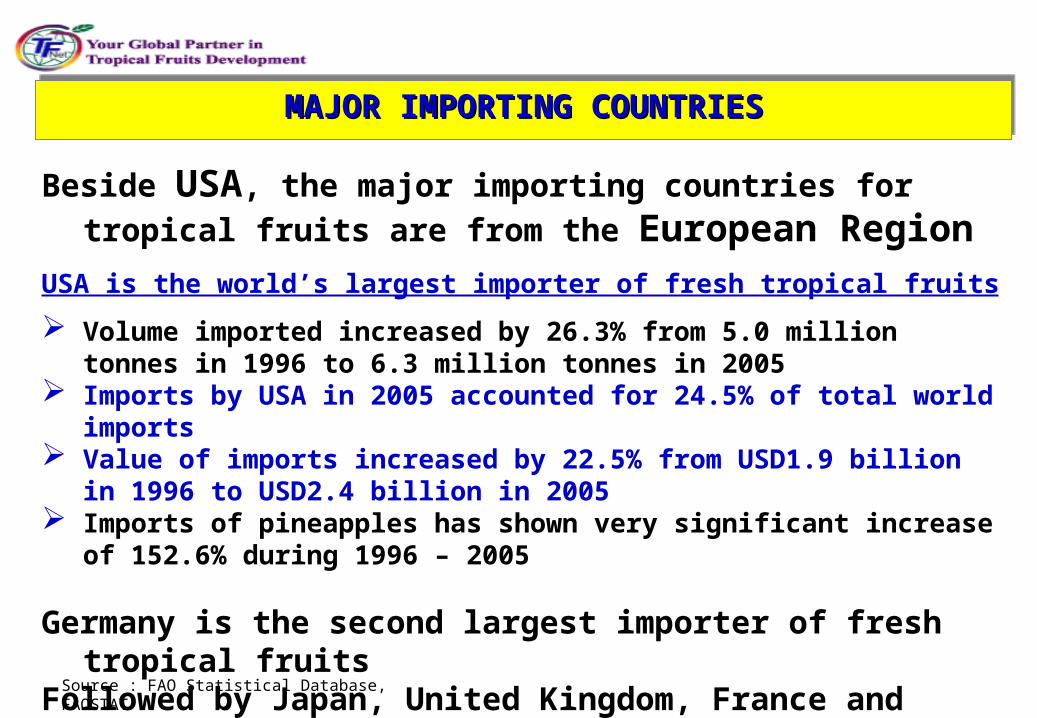
MAJOR IMPORTING COUNTRIESMAJOR IMPORTING COUNTRIESMAJOR IMPORTING COUNTRIESMAJOR IMPORTING COUNTRIES
Beside USA, the major importing countries for tropical fruits
are from the European RegionUSA is the world’s largest importer of fresh tropical fruits
Volume imported increased by 26.3% from 5.0 million tonnes in 1996 to 6.3 million tonnes in 2005
Imports by USA in 2005 accounted for 24.5% of total world imports Value of imports increased by 22.5% from USD1.9 billion in 1996 to
USD2.4 billion in 2005 Imports of pineapples has shown very significant increase of 152.6%
during 1996 – 2005
Germany is the second largest importer of fresh tropical fruitsFollowed by Japan, United Kingdom, France and Canada
Source : FAO Statistical Database, FAOSTAT
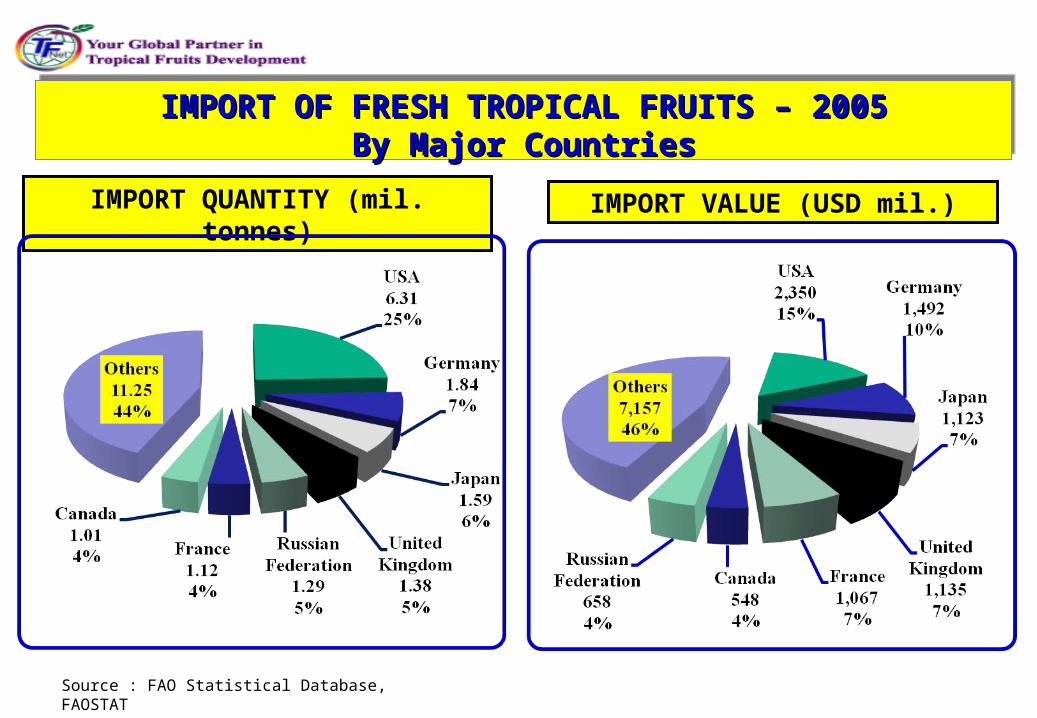
IMPORT OF FRESH TROPICAL FRUITS – 2005IMPORT OF FRESH TROPICAL FRUITS – 2005By Major CountriesBy Major Countries
IMPORT OF FRESH TROPICAL FRUITS – 2005IMPORT OF FRESH TROPICAL FRUITS – 2005By Major CountriesBy Major Countries
IMPORT QUANTITY (mil. tonnes) IMPORT VALUE (USD mil.)
Source : FAO Statistical Database, FAOSTAT
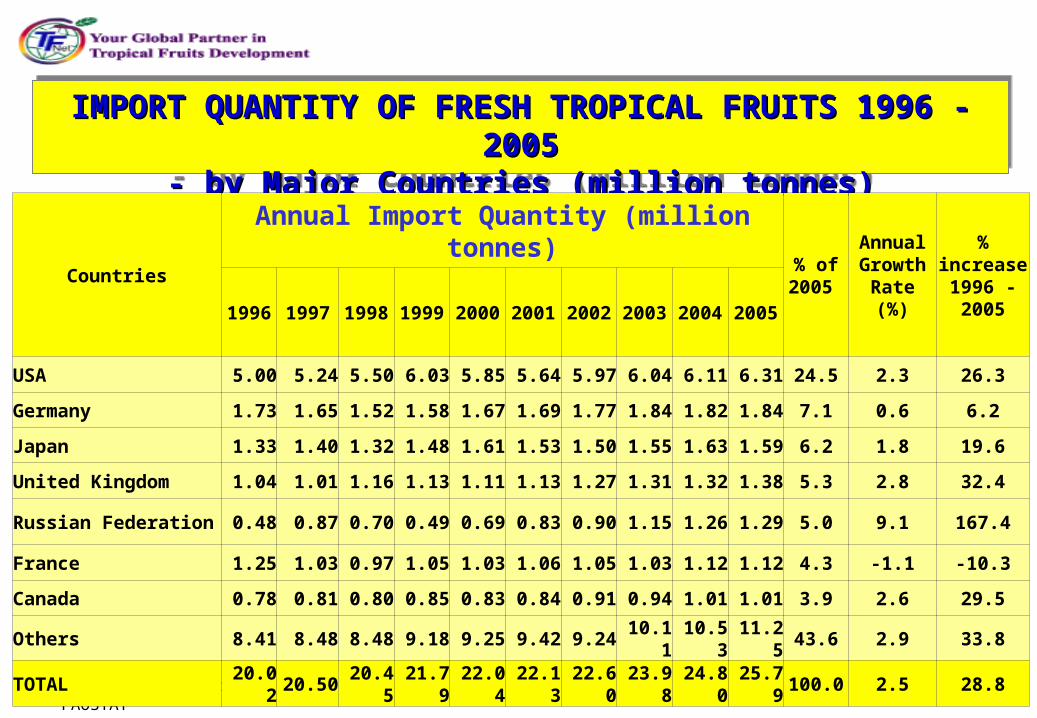
IMPORT QUANTITY OF FRESH TROPICAL FRUITS 1996 - 2005IMPORT QUANTITY OF FRESH TROPICAL FRUITS 1996 - 2005- by Major Countries (million tonnes)- by Major Countries (million tonnes)
IMPORT QUANTITY OF FRESH TROPICAL FRUITS 1996 - 2005IMPORT QUANTITY OF FRESH TROPICAL FRUITS 1996 - 2005- by Major Countries (million tonnes)- by Major Countries (million tonnes)
Countries
Annual Import Quantity (million tonnes)% of 2005
Annual Growth Rate (%)
% increase
1996 - 20051996 1997 1998 1999 2000 2001 2002 2003 2004 2005
USA 5.00 5.24 5.50 6.03 5.85 5.64 5.97 6.04 6.11 6.31 24.5 2.3 26.3
Germany 1.73 1.65 1.52 1.58 1.67 1.69 1.77 1.84 1.82 1.84 7.1 0.6 6.2
Japan 1.33 1.40 1.32 1.48 1.61 1.53 1.50 1.55 1.63 1.59 6.2 1.8 19.6
United Kingdom 1.04 1.01 1.16 1.13 1.11 1.13 1.27 1.31 1.32 1.38 5.3 2.8 32.4
Russian Federation 0.48 0.87 0.70 0.49 0.69 0.83 0.90 1.15 1.26 1.29 5.0 9.1 167.4
France 1.25 1.03 0.97 1.05 1.03 1.06 1.05 1.03 1.12 1.12 4.3 -1.1 -10.3
Canada 0.78 0.81 0.80 0.85 0.83 0.84 0.91 0.94 1.01 1.01 3.9 2.6 29.5
Others 8.41 8.48 8.48 9.18 9.25 9.42 9.24 10.11 10.53 11.25 43.6 2.9 33.8
TOTAL 20.02 20.50 20.45 21.79 22.04 22.13 22.60 23.98 24.80 25.79 100.0 2.5 28.8
Source : FAO Statistical Database, FAOSTAT
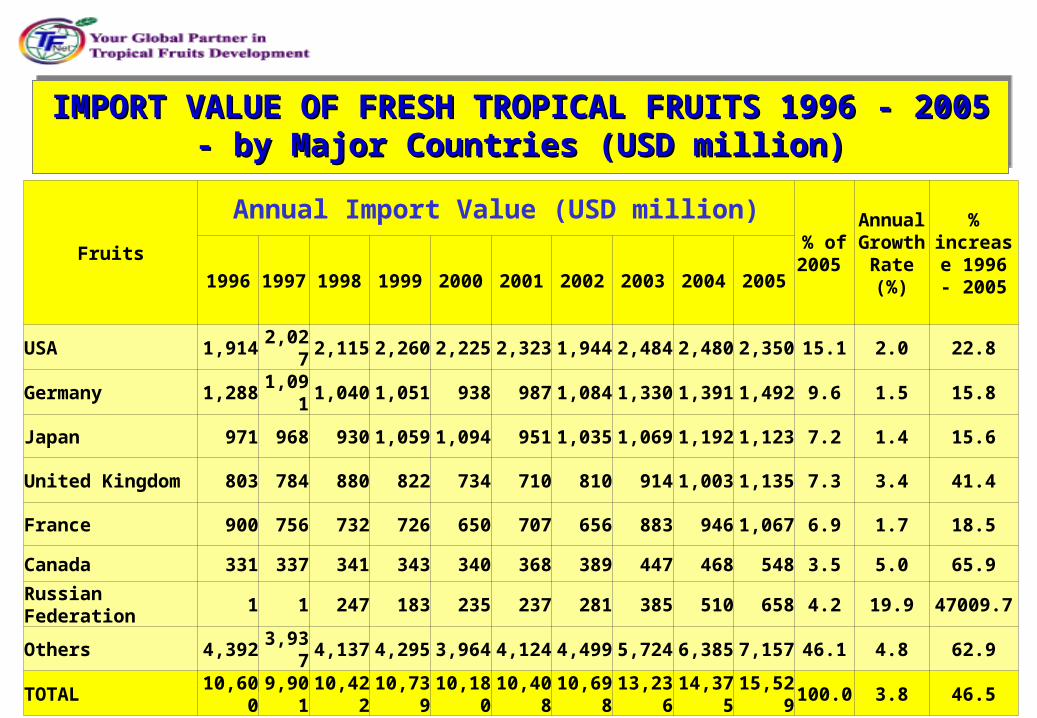
IMPORT VALUE OF FRESH TROPICAL FRUITS 1996 - 2005IMPORT VALUE OF FRESH TROPICAL FRUITS 1996 - 2005- by Major Countries (USD million)- by Major Countries (USD million)
IMPORT VALUE OF FRESH TROPICAL FRUITS 1996 - 2005IMPORT VALUE OF FRESH TROPICAL FRUITS 1996 - 2005- by Major Countries (USD million)- by Major Countries (USD million)
Fruits
Annual Import Value (USD million)% of 2005
Annual Growth
Rate (%)
% increase
1996 - 20051996 1997 1998 1999 2000 2001 2002 2003 2004 2005
USA 1,914 2,027 2,115 2,260 2,225 2,323 1,944 2,484 2,480 2,350 15.1 2.0 22.8
Germany 1,288 1,091 1,040 1,051 938 987 1,084 1,330 1,391 1,492 9.6 1.5 15.8
Japan 971 968 930 1,059 1,094 951 1,035 1,069 1,192 1,123 7.2 1.4 15.6
United Kingdom 803 784 880 822 734 710 810 914 1,003 1,135 7.3 3.4 41.4
France 900 756 732 726 650 707 656 883 946 1,067 6.9 1.7 18.5
Canada 331 337 341 343 340 368 389 447 468 548 3.5 5.0 65.9
Russian Federation 1 1 247 183 235 237 281 385 510 658 4.2 19.9 47009.7
Others 4,392 3,937 4,137 4,295 3,964 4,124 4,499 5,724 6,385 7,157 46.1 4.8 62.9
TOTAL 10,600 9,901 10,422 10,739 10,180 10,408 10,698 13,236 14,375 15,529 100.0 3.8 46.5
(Source: FAOSTAT)
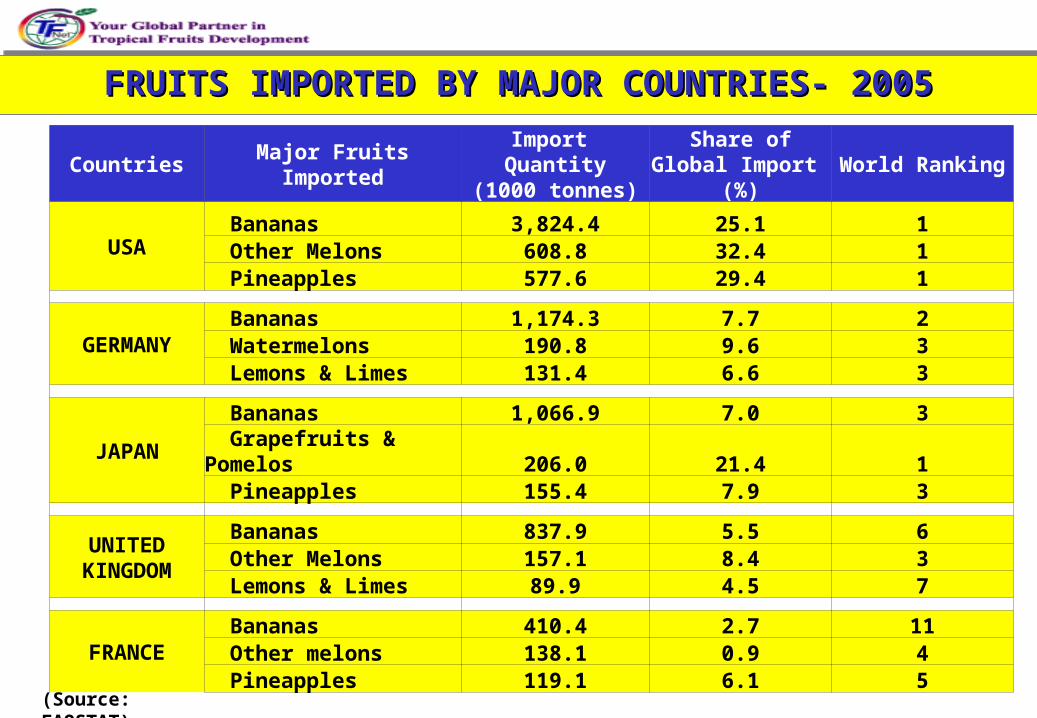
FRUITS IMPORTED BY MAJOR COUNTRIES- 2005FRUITS IMPORTED BY MAJOR COUNTRIES- 2005FRUITS IMPORTED BY MAJOR COUNTRIES- 2005FRUITS IMPORTED BY MAJOR COUNTRIES- 2005
Countries Major Fruits ImportedImport Quantity
(1000 tonnes)Share of Global
Import (%)World Ranking
USA Bananas 3,824.4 25.1 1 Other Melons 608.8 32.4 1 Pineapples 577.6 29.4 1
GERMANY Bananas 1,174.3 7.7 2 Watermelons 190.8 9.6 3 Lemons & Limes 131.4 6.6 3
JAPAN Bananas 1,066.9 7.0 3 Grapefruits & Pomelos 206.0 21.4 1 Pineapples 155.4 7.9 3
UNITED KINGDOM
Bananas 837.9 5.5 6 Other Melons 157.1 8.4 3 Lemons & Limes 89.9 4.5 7
FRANCE Bananas 410.4 2.7 11 Other melons 138.1 0.9 4 Pineapples 119.1 6.1 5
44 ISSUES AND CHALLENGESISSUES AND CHALLENGES ISSUES AND CHALLENGESISSUES AND CHALLENGES
Production and productivity issues
Compliance to international regulations & requirements
Lack of post harvest handling technologies
Lacking in market information
Product development and diversification
PRODUCTION AND PRODUCTIVITYPRODUCTION AND PRODUCTIVITY
The Tropical Fruit smallholding sector:
characterised by small and scattered fruit gardens
poor farm management practices
low yields and quality
production not market-driven
lack of knowledge of domestic and global demands
PRODUCTION AND PRODUCTIVITYPRODUCTION AND PRODUCTIVITY
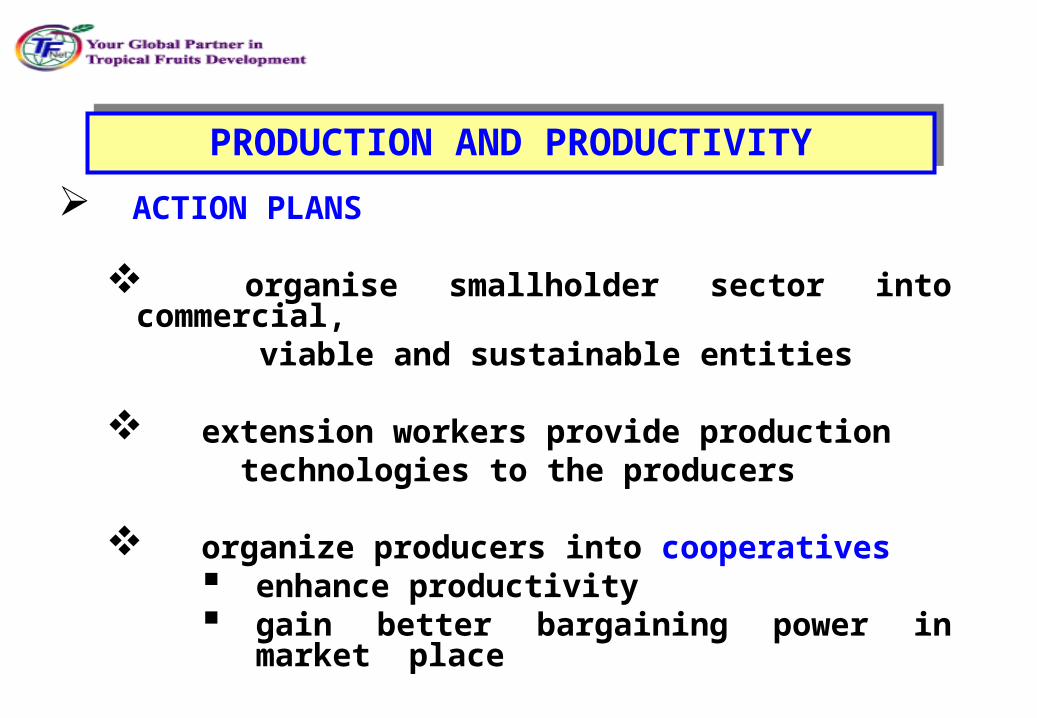
ACTION PLANS
organise smallholder sector into commercial, viable and sustainable entities
extension workers provide production technologies to the producers
organize producers into cooperatives enhance productivity gain better bargaining power in market place
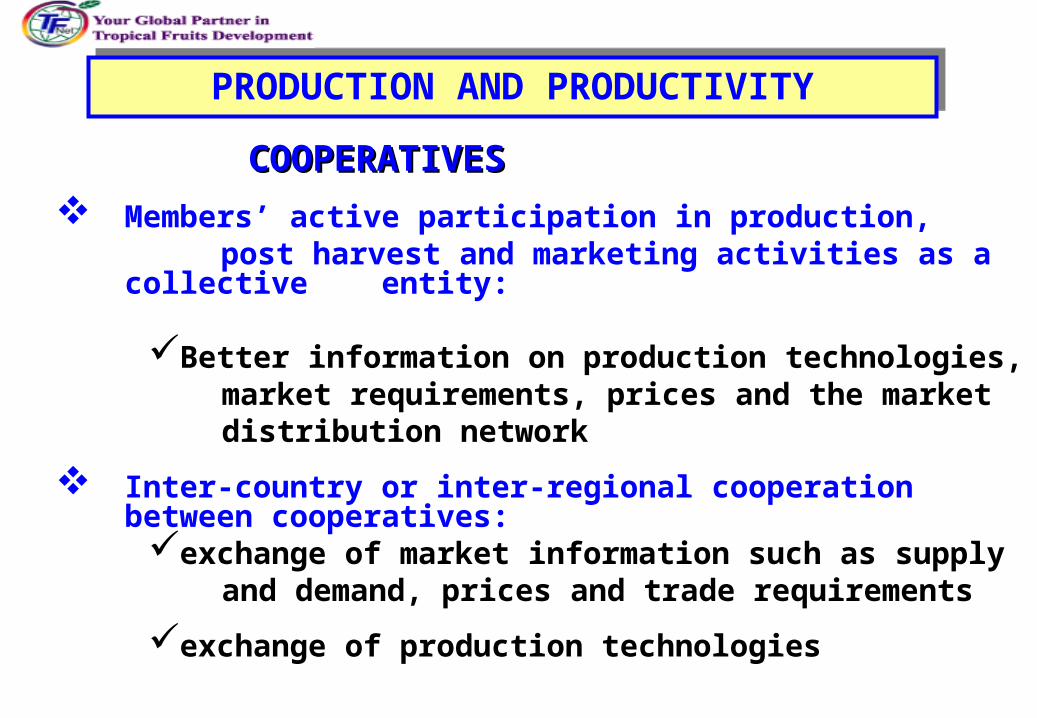
COOPERATIVESCOOPERATIVES
Members’ active participation in production, post harvest and marketing activities as a collective
entity:
Better information on production technologies, market requirements, prices and the market distribution network
Inter-country or inter-regional cooperation between cooperatives:exchange of market information such as supply and demand, prices and trade requirements
exchange of production technologies
PRODUCTION AND PRODUCTIVITYPRODUCTION AND PRODUCTIVITY
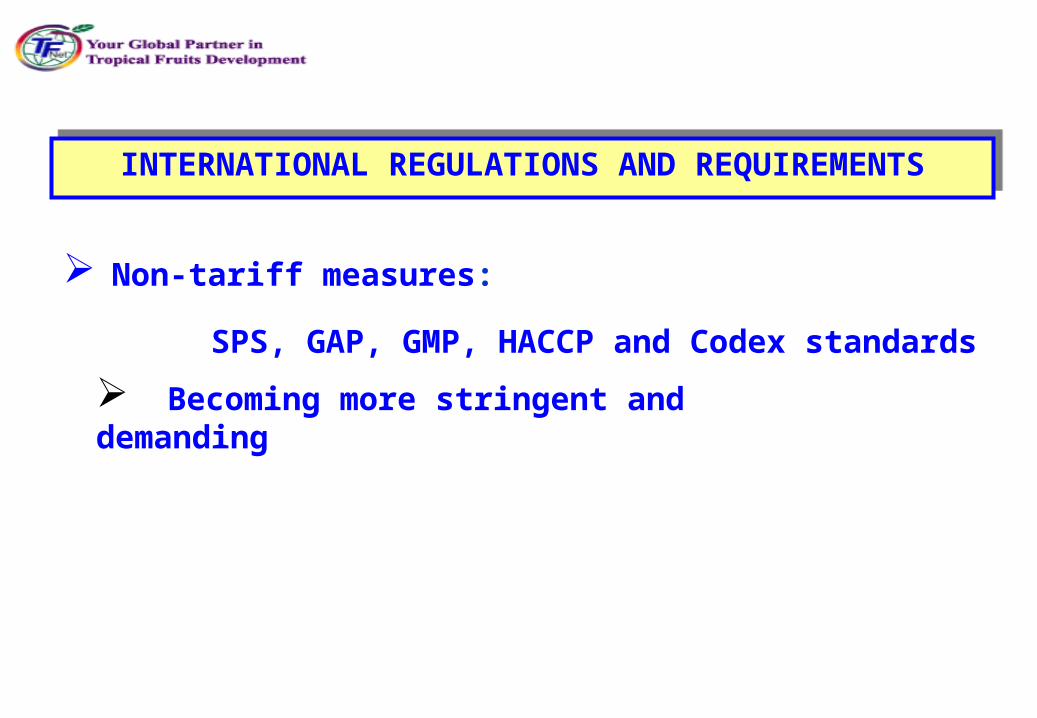
INTERNATIONAL REGULATIONS AND REQUIREMENTSINTERNATIONAL REGULATIONS AND REQUIREMENTS
Non-tariff measures:
SPS, GAP, GMP, HACCP and Codex standards
Becoming more stringent and demanding
INTERNATIONAL REGULATIONS AND REQUIREMENTSINTERNATIONAL REGULATIONS AND REQUIREMENTS
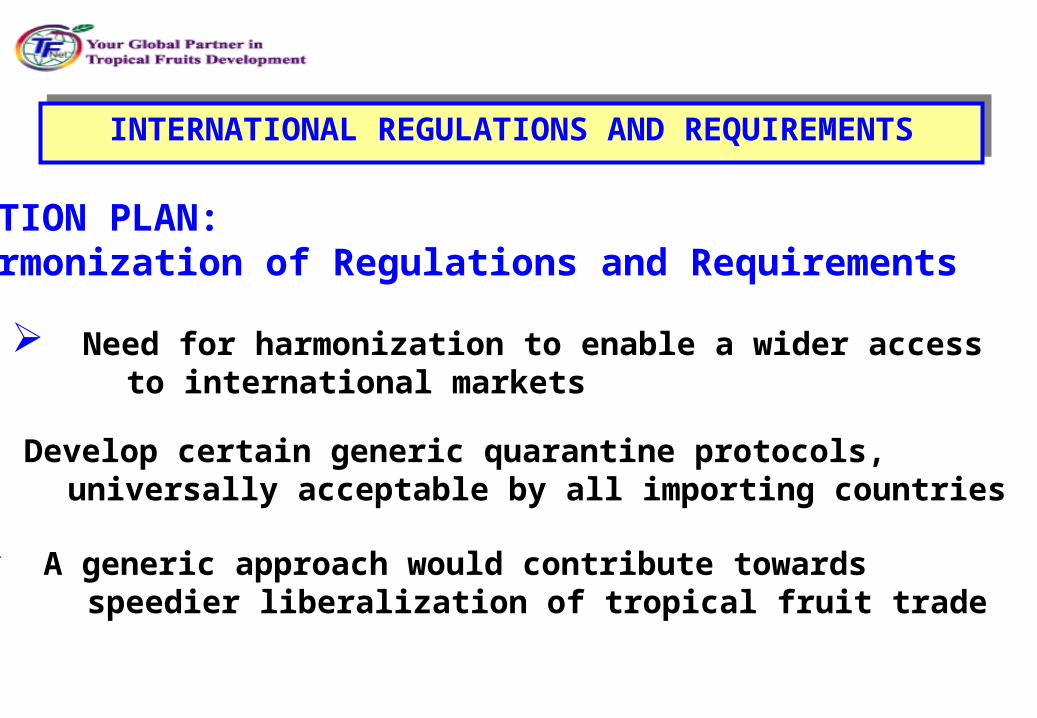
ACTION PLAN:Harmonization of Regulations and Requirements
Need for harmonization to enable a wider access to international markets
Develop certain generic quarantine protocols, universally acceptable by all importing countries
A generic approach would contribute towards speedier liberalization of tropical fruit trade

INTERNATIONAL REGULATIONS AND REQUIREMENTSINTERNATIONAL REGULATIONS AND REQUIREMENTS
ACTION PLAN:Implementation of Farm Certification Programme
Develop Food Safety and Quality Assurance Standards
Adoption of GAP (e.g. Malaysian SALM / Thai GAP etc)
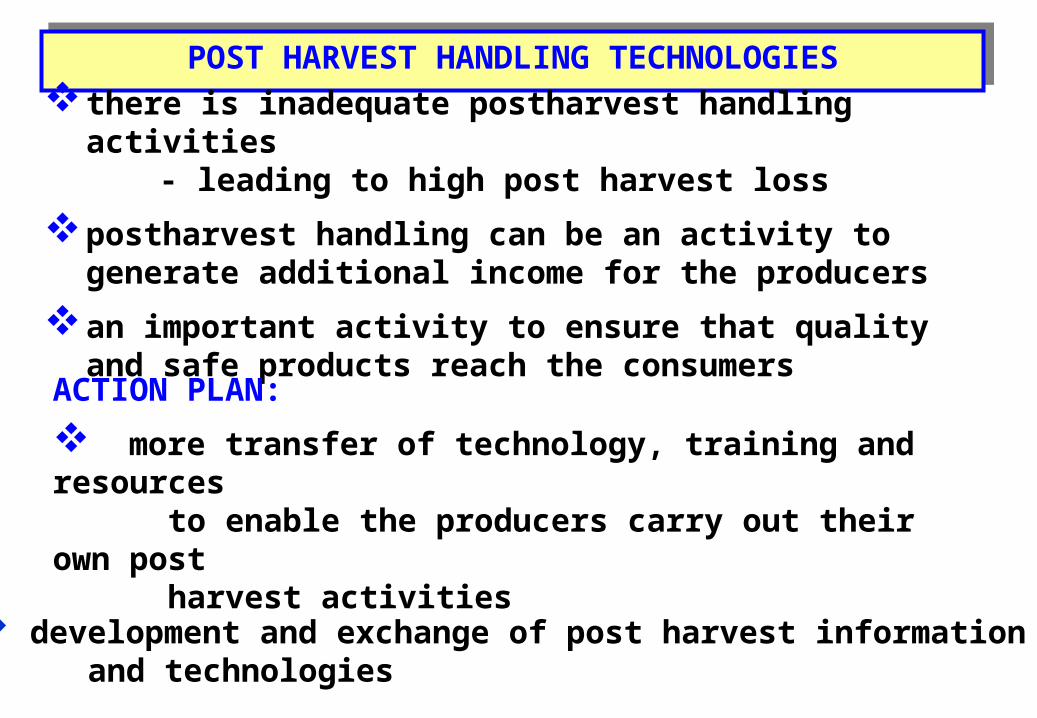
POST HARVEST HANDLING TECHNOLOGIESPOST HARVEST HANDLING TECHNOLOGIES
there is inadequate postharvest handling activities - leading to high post harvest loss
postharvest handling can be an activity to generate additional income for the producers
an important activity to ensure that quality and safe products reach the consumers
ACTION PLAN:
more transfer of technology, training and resources to enable the producers carry out their own post harvest activities
development and exchange of post harvest information and technologies
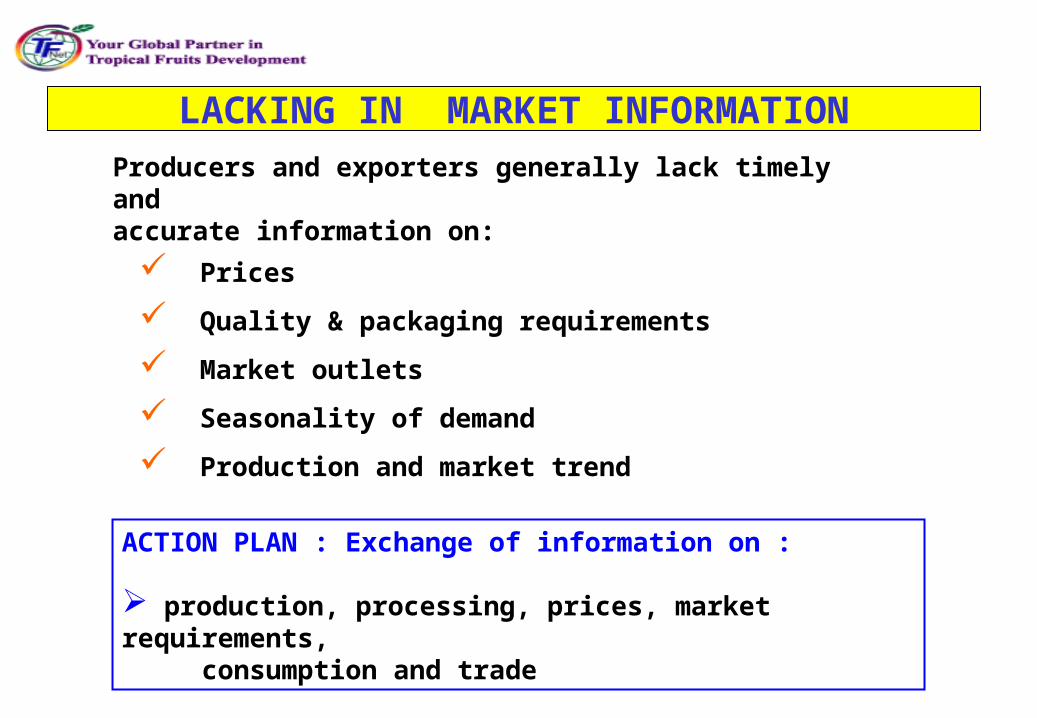
Producers and exporters generally lack timely andaccurate information on:
Prices
Quality & packaging requirements
Market outlets
Seasonality of demand
Production and market trend
ACTION PLAN : Exchange of information on :
production, processing, prices, market requirements, consumption and trade
LACKING IN MARKET INFORMATION
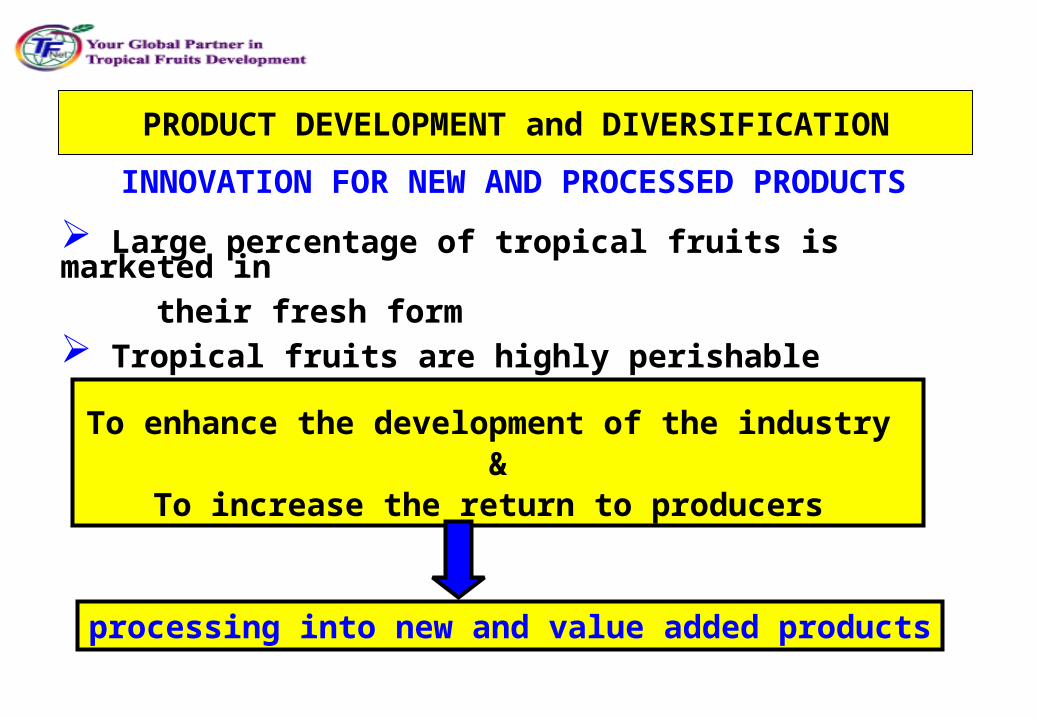
PRODUCT DEVELOPMENT and DIVERSIFICATION
Large percentage of tropical fruits is marketed in
their fresh form Tropical fruits are highly perishable
To enhance the development of the industry &
To increase the return to producers
processing into new and value added products
INNOVATION FOR NEW AND PROCESSED PRODUCTS
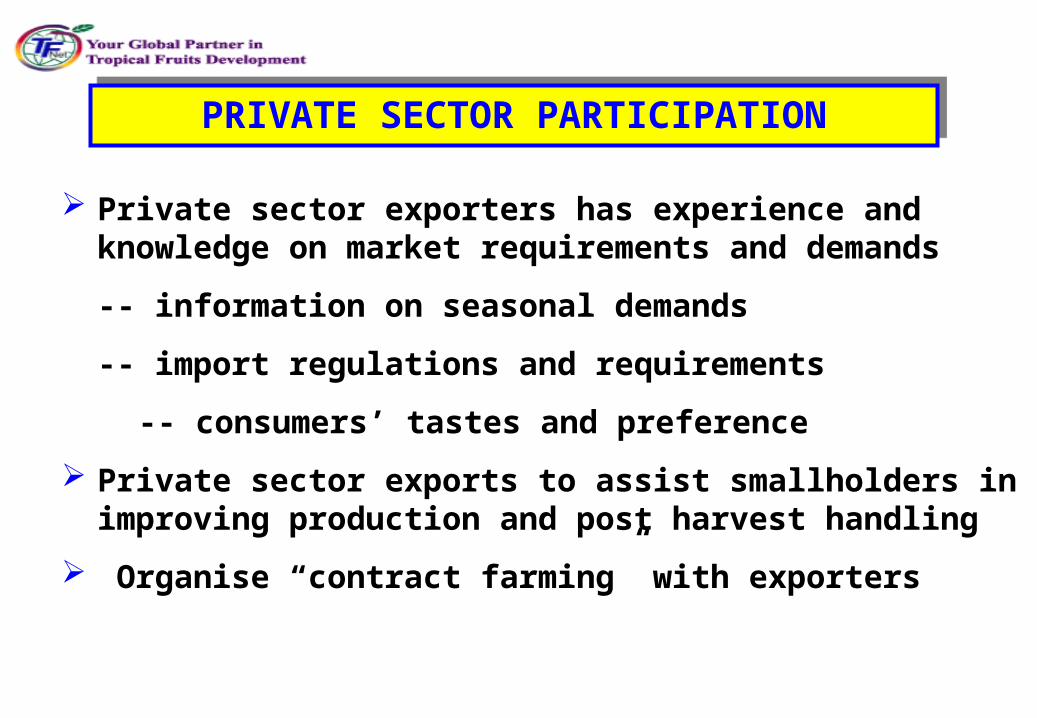
PRIVATE SECTOR PARTICIPATIONPRIVATE SECTOR PARTICIPATION
Private sector exporters has experience and knowledge on market requirements and demands
-- information on seasonal demands
-- import regulations and requirements
-- consumers’ tastes and preference
Private sector exports to assist smallholders in improving production and post harvest handling
Organise “contract farming” with exporters

ROLE OF TFNETROLE OF TFNET
Membership network of 98 members in 24 countries
International Conferences/Seminars/Workshops
gathering of experts for exchange & sharing of information and experiences
Dissemination of Information through Website, Newsletters and publications
ROLE OF TFNETROLE OF TFNET
Specialized training
tissue culture
post harvest handling and processing
PVP
GAP
Joint Projects
germplasm exchange
market studies
55 CONCLUSIONCONCLUSION CONCLUSIONCONCLUSION
The tropical and subtropical fruit sector could be a new source of growth for providing income, employment and foreign exchange.
In addition tropical fruit provides the necessary nutrition to create healthy and productive population.
Many challenges need to be addressed before this sector could play an important role as engine of economic growth including increasing efficiency and productivity of activities from farm to table as well as improving postharvest losses, enhancing extension delivery system, and the application of ICT in agriculture.

T H A N K Y O U for your kind attention
T H A N K Y O U for your kind attention
….5 servings tropical fruits a day, keep the medicine man away!
….5 servings tropical fruits a day, keep the medicine man away!
Your Global Partner in Tropical Fruits DevelopmentYour Global Partner in Tropical Fruits Development
Linking People, Technology & MarketLinking People, Technology & Market