Embed Size (px)
Citation preview

© 2016 IHS Markit. All Rights Reserved. © 2016 IHS Markit. All Rights Reserved.
Global PMI Global economy suffers loss of momentum in March
April 10th 2018
© 2018 IHS Markit. All Rights Reserved.

© 2016 IHS Markit. All Rights Reserved.
Global economy suffers marked loss of growth momentum • Global economic growth slowed sharply to the weakest for over a year in March. The JPMorgan Global PMI™, compiled by IHS
Markit, fell for the first time in six months, down sharply from 54.8 in February to a 16-month low of 53.3. The 1.5 index point
drop was the steepest seen for two years. To put the decline in context, while the February PMI reading was consistent with
global GDP rising at an annual rate of 3.0% (at market exchange rates), the March reading is indicative of 2.5% growth.
• Inflows of new business and backlogs of work also rose to weaker extents than seen in the previous month. Employment growth
remained more resilient, easing only marginally from the decade-high rates seen in prior months to suggest that firms continued
to focus on expanding capacity to meet rising demand. Future expectations also remained elevated, suggesting that at least
some of the slowdown may prove temporary. Bad weather was cited in many countries as curbing business activity in March.
Global PMI indicators*
2
Global PMI* output & economic growth
Sources: IHS Markit, JPMorgan. Source: IHS Markit, JP Morgan. * PMI shown above is a GDP-weighted average of the survey manufacturing and services indices.
© 2018 IHS Markit. All Rights Reserved.

© 2016 IHS Markit. All Rights Reserved.
Global price pressures remain elevated amid supply constraints • Global input costs rose sharply again during March, albeit with the rate of increase easing to a five-month low, in part reflecting
some cooling of global commodity prices. The IHS Materials Price Index (MPI) has fallen in eight of the past nine weeks. The
weaker rate of cost increase took some pressure off selling prices, which showed the smallest rise for three months. However,
the rate of selling price inflation for goods and services remained among the highest seen over the past seven years.
• Price hikes were often linked to demand exceeding supply. Global supplier delivery times lengthened to the greatest extent since
May 2011, with delays close to 20-year survey records in the eurozone and at a four-year high in North America. An upshot of
the supply delays was the ability of suppliers to hike prices, with manufacturers increasingly eager to ensure production needs
were satisfied.
Global PMI price indices*
3
Sources: IHS Markit, JPMorgan. Sources: IHS Markit, JPMorgan. * PMI shown is a weighted average of the manufacturing and services survey indices.
© 2018 IHS Markit. All Rights Reserved.
Global manufacturing PMI price indices

© 2016 IHS Markit. All Rights Reserved.
Machinery & equipment makers see strongest global growth in 2018
Machinery and equipment makers - bellwethers of business
investment spending – have recorded the strongest global
output growth of all sectors covered by the PMI surveys so far
in 2018. The first quarter saw the largest surge in machinery
making since 2011 as companies expanded capacity.
Tech equipment makers have likewise seen strong growth this
year, also reflecting rising capex, although the rate of increase
slowed sharply in March. However, only three of the 24 detailed
sectors (media, healthcare and real estate) recorded faster
output growth in March, further highlighting the broad-based
nature of March’s slowdown.
4
Source: IHS Markit. © 2018 IHS Markit. All Rights Reserved.
Global Sector PMI Output Index: Q1 average
Source: IHS Markit.

© 2016 IHS Markit. All Rights Reserved.
Broad-based slowdown in all major developed markets • Weaker rates of expansion were seen in all four of the largest developed economies. While the eurozone continued to lead the
upturn, the gap has narrowed markedly with the US, albeit with both recording solid rates of expansions commensurate with first
quarter GDP rising by approximately 0.6% and 0.5% respectively. A substantially slower rate of growth was signalled in the UK,
pointing to a first quarter GDP rise of 0.3%. Japan’s upturn also lost momentum, with the Nikkei composite PMI down to a 17-
month low.
• Emerging market growth meanwhile cooled further from January’s peak, though continued to run at one of the highest rates seen
over the past five years. Russia, China and Brazil all reported slower rates of expansion. India bucked the trend, although still
registered the weakest growth of the four largest emerging market economies.
Major developed markets*
5
Sources: IHS Markit, CIPS, Nikkei. Sources: IHS Markit, Caixin, Nikkei. * PMI shown above is a GDP-weighted average of the survey output indices.
© 2018 IHS Markit. All Rights Reserved.
Major emerging markets*

© 2016 IHS Markit. All Rights Reserved.
6
Netherlands stays top of global manufacturing rankings • Global manufacturing growth slowed to a five-month low in
March, though remained robust. The fastest expansions were
again seen in the eurozone and its neighbours. The
Netherlands headed up the global rankings, followed by
Germany and Austria. However, faster US growth helped
North America close the gap with the slowing eurozone.
• Asia remained on a sluggish growth path. Of the 30 countries
surveyed, only three recorded PMI readings below 50,
signalling contraction, all were in Asia.
• An Asian PMI reading of 51.4 compared to 55.3 for North
America and 56.6 for the eurozone, dragged down to a large
extent by growth in China slipping to a four-month low.
Sources: IHS Markit, JPMorgan, CBA, ISO, CIPS, NEVI, Nikkei, BME, Bank Austria, Investec, AERCE, Caixin, HPI, CBA.
© 2018 IHS Markit. All Rights Reserved.
Sources: IHS Markit, JPMorgan, National Statistical Offices via Datasteam.

© 2016 IHS Markit. All Rights Reserved.
US economy sees steady Q1 growth, but rising prices • US business activity growth slowed in March compared to February's 27-month high, but remained encouragingly solid, notably in
manufacturing. Combined, the two IHS Markit PMI surveys indicate that the economy grew at an annualised rate of 2.5% (though
official GDP data are likely to come in at least 0.5% weaker, due to seasonality issues). Strong inflows of new orders means
growth looks set to accelerate again into Q2. The past two months have seen the largest back-to-back increases in demand for
almost three years. The strongest jobs gain for over two years further underscored the bullish outlook, as firms stepped up their
hiring to meet the recent upturn in demand.
• Price pressures meanwhile eased slightly during the month, though remained elevated by standards of the past four years, linked
in many cases to healthy demand boosting firms' pricing power, as well as recent tariff announcements adding to inflationary
pressures in the manufacturing sector.
US price pressures
7
US economic growth and the PMI**
© 2018 IHS Markit. All Rights Reserved.
** PMI shown above is a GDP weighted average of the manufacturing and services indices.
Sources: IHS Markit, U.S. Bureau of Economic Analysis.
* A blended index of input prices and supplier delivery times.
Sources: IHS Markit, BLS.

© 2016 IHS Markit. All Rights Reserved.
Eurozone upturn loses steam as PMI slides to 14-month low
• The eurozone economy came off the boil in March, though continued to run hot. Although the final PMI numbers showed the
weakest rise in business activity since the start of last year, adding to signs that the region’s growth spurt has peaked, the
surveys are still indicative of the economy growing at an impressive 0.6% quarterly rate in March, down from an unsustainably
rapid 0.8-9% rate around the start of the year.
• Some pull-back from the elevated level of the PMI at the start of the year was always highly likely. Some of the loss in growth
momentum also appears to have been the result of temporary factors, such as bad weather and short-term capacity
constraints, notably shortages of supplies and labour. Some reversal of these impediments should therefore hopefully help
boost growth in April. Cost pressures meanwhile remain elevated, driven by improved pricing power among suppliers.
• . Eurozone PMI** and ECB policy
8
Eurozone economic growth and PMI**
* Price pressures index is a composite of input cost and supplier lead times indices. ** PMI shown above is a GDP-weighted average of the survey output indices.
Sources: IHS Markit, ECB. © 2018 IHS Markit. All Rights Reserved.
Sources: IHS Markit, Eurostat.

© 2016 IHS Markit. All Rights Reserved.
Snow-hit UK economy sees worst growth since Brexit vote • Bad weather curbed business activity growth in March, leading to the weakest expansions of output and new orders for 20
months. The ‘all-sector’ IHS Markit/CIPS PMI Output Index fell from 54.2 in February to 52.1, its lowest since July 2016. While
some rebound is expected in April amid better weather, a deterioration in business expectations suggests the underlying trend
remains one of weak growth compared to that seen late last year.
• Price pressures meanwhile remained strong as input cost inflation picked up again. Although remaining below the peaks seen
in late 2017, rates of both input price and selling price inflation remained elevated by historical standards, suggesting
consumer price inflation could stay stubbornly high in coming months and leaving a widely-touted May interest rate hike very
much in play.
UK inflation
9
Sources: IHS Markit, CIPS, ONS.
** PMI shown is a GDP-weighted average of the survey manufacturing, construction and services indices.
© 2018 IHS Markit. All Rights Reserved.
UK PMI** and GDP
Sources: IHS Markit, CIPS, ONS.

© 2016 IHS Markit. All Rights Reserved.
Japanese economic growth close to 1½ year low • Growth of Japanese business activity was the slowest since October 2016 at the end of the first quarter, according to the latest
Nikkei PMI data, with the rate of expansion slowing for a second successive month. Despite the dip in March, the first quarter
average PMI reading remains relatively robust, indicative of quarterly GDP rising by around 0.4-0.5%.
• Robust demand conditions enabled companies to raise prices to protect margins. The rate of selling price and input cost inflation
remains well above its historical average, boding well for the Bank of Japan’s efforts to re-inflate the economy.
• However, while the overall picture remains positive, the survey sub-indices suggest that economic activity will slow further in
coming months: the composite PMI’s gauge of new orders registered the smallest monthly increase for nearly one-and-a-half
years. Confidence about the business outlook in the year ahead meanwhile dipped to a six-month low.
Japan inflation indicators
10
Japan economic growth and the PMI*
© 2018 IHS Markit. All Rights Reserved.
Sources: IHS Markit, Nikkei, Datastream. * PMI shown above is a GDP weighted average of the survey output indices.
Sources: IHS Markit, Nikkei, Japan Cabinet Office

© 2016 IHS Markit. All Rights Reserved.
Chinese economic growth loses momentum at end of first quarter
• March PMI data signalled a noticeable loss of momentum in China’s economic growth, raising questions over whether business
activity growth will slow further in coming months after a stronger than expected start to the year. The Caixin Composite PMI
Output Index fell from 53.3 in February to 51.8 in March. Additional concerns about the outlook are flagged by the
deteriorating labour market. March survey data showed the first drop in overall employment numbers since last October,
contrasting with the broad stabilisation seen in prior months. While mild, the pace of contraction was the fastest since July last
year. Services job gains were insufficient to offset a steeper rate of job shedding in the manufacturing sector.
• There were further signs of easing cost pressures at the end of the first quarter. March saw a marked slowdown in the growth
of input costs, with inflation running at the weakest for eight months.
China employment indicators
11
China PMI* & economic growth
Sources: IHS Markit, Caixin, NBS.
© 2018 IHS Markit. All Rights Reserved.
Sources: IHS Markit, Caixin. * PMI shown above is a GDP-weighted average of the survey output indices.
© 2016 IHS Markit. All Rights Reserved.
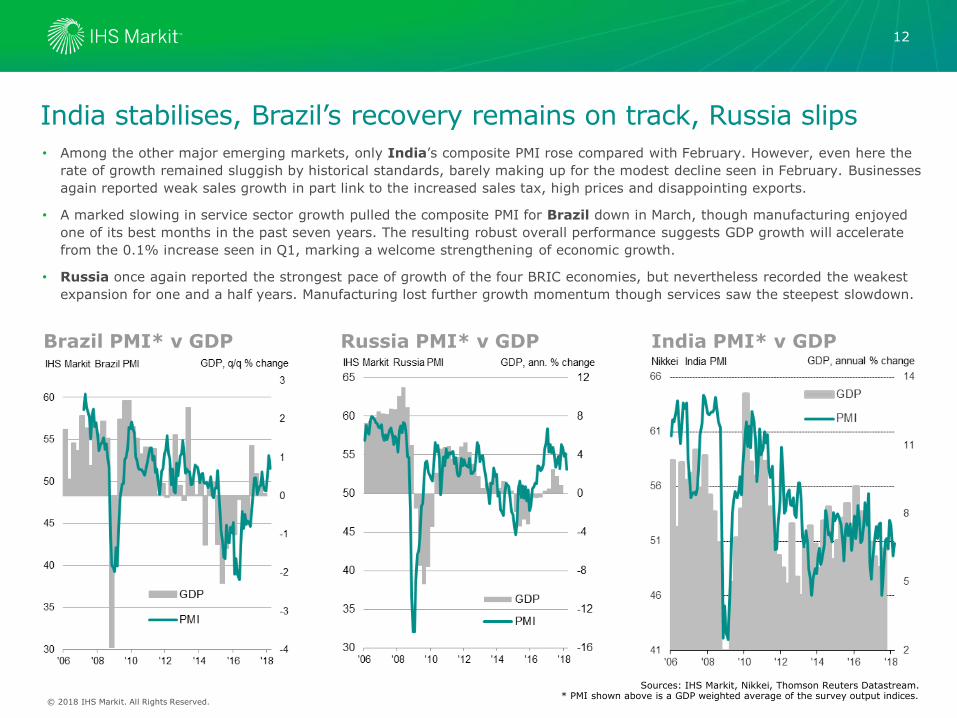
India stabilises, Brazil’s recovery remains on track, Russia slips
• Among the other major emerging markets, only India’s composite PMI rose compared with February. However, even here the
rate of growth remained sluggish by historical standards, barely making up for the modest decline seen in February. Businesses
again reported weak sales growth in part link to the increased sales tax, high prices and disappointing exports.
• A marked slowing in service sector growth pulled the composite PMI for Brazil down in March, though manufacturing enjoyed
one of its best months in the past seven years. The resulting robust overall performance suggests GDP growth will accelerate
from the 0.1% increase seen in Q1, marking a welcome strengthening of economic growth.
• Russia once again reported the strongest pace of growth of the four BRIC economies, but nevertheless recorded the weakest
expansion for one and a half years. Manufacturing lost further growth momentum though services saw the steepest slowdown.
12
Brazil PMI* v GDP Russia PMI* v GDP India PMI* v GDP
Sources: IHS Markit, Nikkei, Thomson Reuters Datastream. * PMI shown above is a GDP weighted average of the survey output indices.
© 2018 IHS Markit. All Rights Reserved.

© 2016 IHS Markit. All Rights Reserved.
Disclaimer The information contained in this presentation is confidential. Any unauthorised use, disclosure, reproduction or dissemination, in full or in part, in any media or by any means, without the prior written permission of IHS Markit or any of its affiliates ("Markit") is strictly prohibited. Opinions, statements, estimates and projections in this presentation (including other media) are solely those of the individual author(s) at the time of writing and do not necessarily reflect the opinions of IHS Markit. Neither IHS Markit nor the author(s) has any obligation to update this presentation in the event that any content, opinion, statement, estimate or projection (collectively, "information") changes or subsequently becomes inaccurate. IHS Markit makes no warranty, expressed or implied, as to the accuracy, completeness or timeliness of any information in this presentation, and shall not in any way be liable to any recipient for any inaccuracies or omissions. Without limiting the foregoing, Markit shall have no liability whatsoever to any recipient, whether in contract, in tort (including negligence), under warranty, under statute or otherwise, in respect of any loss or damage suffered by any recipient as a result of or in connection with any information provided, or any course of action determined, by it or any third party, whether or not based on any information provided. The inclusion of a link to an external website by IHS Markit should not be understood to be an endorsement of that website or the site's owners (or their products/services). IHS Markit is not responsible for either the content or output of external websites. Copyright ©2018, IHS Markit Limited. All rights reserved and all intellectual property rights are retained by IHS Markit.
13
© 2018 IHS Markit. All Rights Reserved.