Embed Size (px)
Citation preview

Disclaimer & Disclosures: This report must be read with the disclosures and the analyst certifications in the Disclosure appendix, and with the Disclaimer, which forms part of it
https://www.research.hsbc.com
Play interview withKim Fustier
Global oil supplyWill mature field declines drive the nextsupply crunch?
Supply constraints seem a distant prospect in the current oil market, but a return to balance in 2017 will leave the World with severely limited spare capacity
Meanwhile, near term productivity gains are temporarily masking a steady increase in mature field decline rates which could cut existing capacity by >40mbd (>42%) by 2040e
We think risks of supply constraints will resurface long before risks of global demand peaking, and a steady tightening in the supply/demand balance post-2017 is behind our unchanged USD75/b long-term Brent price assumption
MULTI-ASSETNATURAL RESOURCES & ENERGYSeptember 2016
By: Kim Fustier, Gordon Gray, Christoffer Gundersen and Thomas Hilboldt
1
MULTI-ASSET NATURAL RESOURCES & ENERGY
September 2016
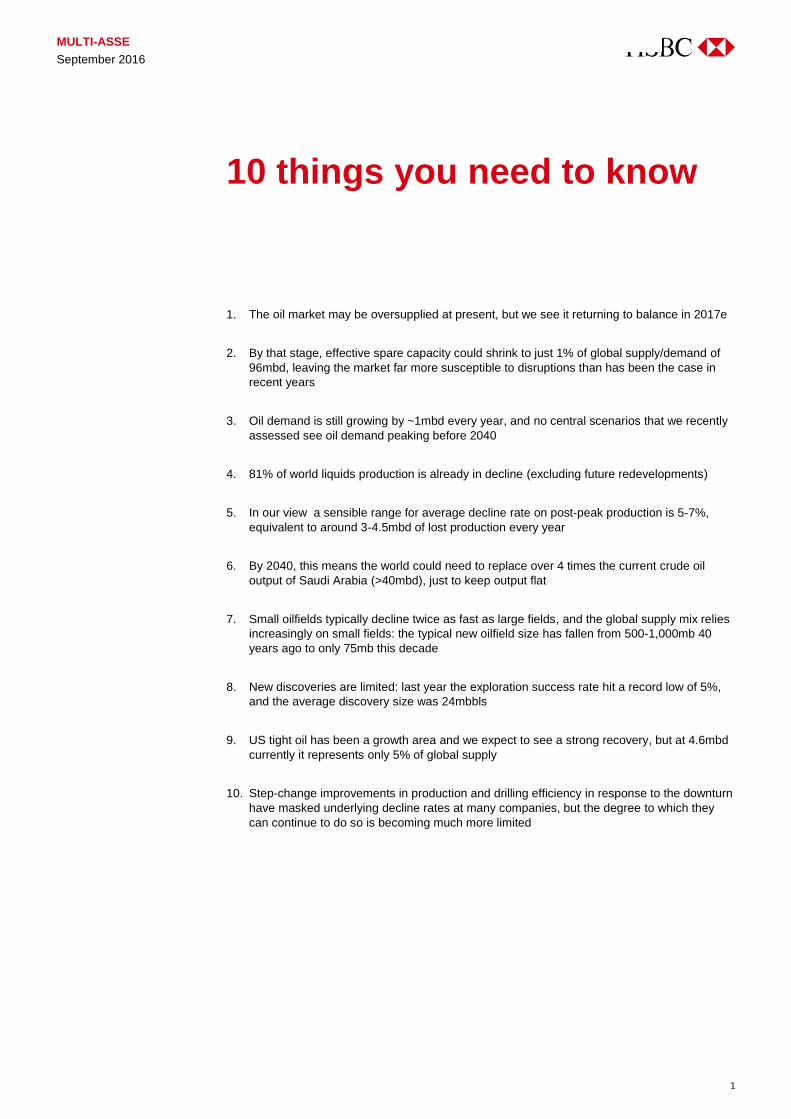
1. The oil market may be oversupplied at present, but we see it returning to balance in 2017e
2. By that stage, effective spare capacity could shrink to just 1% of global supply/demand of
96mbd, leaving the market far more susceptible to disruptions than has been the case in
recent years
3. Oil demand is still growing by ~1mbd every year, and no central scenarios that we recently
assessed see oil demand peaking before 2040
4. 81% of world liquids production is already in decline (excluding future redevelopments)
5. In our view a sensible range for average decline rate on post-peak production is 5-7%,
equivalent to around 3-4.5mbd of lost production every year
6. By 2040, this means the world could need to replace over 4 times the current crude oil
output of Saudi Arabia (>40mbd), just to keep output flat
7. Small oilfields typically decline twice as fast as large fields, and the global supply mix relies
increasingly on small fields: the typical new oilfield size has fallen from 500-1,000mb 40
years ago to only 75mb this decade
8. New discoveries are limited: last year the exploration success rate hit a record low of 5%,
and the average discovery size was 24mbbls
9. US tight oil has been a growth area and we expect to see a strong recovery, but at 4.6mbd
currently it represents only 5% of global supply
10. Step-change improvements in production and drilling efficiency in response to the downturn
have masked underlying decline rates at many companies, but the degree to which they
can continue to do so is becoming much more limited
10 things you need to know

MULTI-ASSET NATURAL RESOURCES & ENERGY
September 2016
2
10 things you need to know 1
Executive summary 3
Declines and the oil market 5
Global oil market: from supply
surplus to supply deficit? 5
HSBC oil supply & demand model
and oil price assumptions 8
Decline rates – synopsis 9
Decline rates likely to rise 9
The North Sea example 11
The impact of improving plant and
drilling efficiency 12
New oil fields are becoming smaller 13
What does this all mean for global
supply? 16
Oil demand is growing, despite
near-term concerns 17
Decline rates and oil supply 19
Decline rate curves: the basics 20
Observations on decline rates
from academic studies 22
The example of the North Sea: do
theories hold up? 30
Case study: China’s Daqing 37
Production efficiency and decline 39
Digging into production efficiency 39
Drilling productivity has stemmed
decline rates 43
Appendix: What oil companies are
saying on decline 47
Disclosure appendix 48
Disclaimer 52
Contents

3
MULTI-ASSET NATURAL RESOURCES & ENERGY
September 2016
Why talk about supply declines now?
Given the backdrop of the past two years’ severe oversupply in the global oil market, it’s not
surprising that few are discussing the possibility of a future supply squeeze. Indeed, most of the
current debate on the long-term outlook for oil seems focused on risks to demand from progress
on both the policy and technology fronts. While global oil demand growth rates are set to
decline as this progress continues, we are still a significant way off the point that demand peaks
in absolute terms – central scenarios from the main energy agencies such as the IEA, OPEC
and the US EIA don’t see this happening before 2040.
Meanwhile, we expect the past two years’ severe crude price weakness to result in a return to
balance in the global oil market in 2017. At that stage, we expect global effective spare capacity
to fall to as little as 1% of demand. Supply disruptions have had only limited impact on price in
2015-16 due to the global oversupply, but the market will be much more susceptible to
interruptions post-2017. In addition, given the almost unprecedented fall in industry investment
since 2014, we expect the focus to return to the availability of adequate supply.
Declines: the self-correcting mechanism for the oil market
What differentiates oil from other commodities is the natural production decline in all oil and gas
fields after a period of plateau, which acts as a natural correcting mechanism in global oil
supply. While global liquids supply has grown by more than 10mbd in the past ten years, this
growth has been focused firmly on 1) OPEC crude (mainly Saudi Arabia and Iraq), 2) US tight
oil (~5mbd), 3) natural gas liquids (NGLs, >3.5mbd) and biofuels (~1.5mbd). In fact,
conventional non-OPEC crude supply of around 42.4mbd has shown no net growth over this
period, as new field start-ups have been offset completely by declines in existing output.
Decline rates set to increase, putting pressure on supply
We think several factors point to risks of accelerating declines in the coming years:
Increase in declines over time due to a combination of a) deteriorating geology and b) the
inevitable maturing of old fields, where declines have thus far been mitigated by technology.
Executive summary
We look in depth at oil production decline rates and their
implications for the long-term oil supply outlook; an issue receiving
little attention in the current oversupplied market
We see the oil market back in balance in 2017, with little spare
capacity. Thereafter, accelerating decline rates are set to be a key
factor in increasing market tightness
Impending supply constraints are a key factor behind our USD75/b
long-term (2018e and beyond) price assumption

MULTI-ASSET NATURAL RESOURCES & ENERGY
September 2016
4
New fields becoming smaller: the world’s production mix is structurally changing and relies
increasingly on small fields rather than ageing giants. Small fields are likely to see faster
declines as their limited size does not allow for long production plateaus.
Discoveries point to this trend continuing: the average size of new oil discoveries has been
falling for decades. Last year it reached a record low of 24mbbls, a small fraction of the 1-
2bnbbl average size of new fields starting up in the 1960’s.
We believe a range of decline rates of 5-7% (on post-peak production) is probably
reasonable. This represents around 3-4.5mbd of potential lost production every year over
the next few years – far more than unplanned production interruptions could take out in any
given year.
Improving efficiency giving a false sense of security?
Improving plant and drilling efficiency have been important contributors to production holding up
better than expected in many regions in 2015-16, and several oil majors have highlighted how
this has mitigated their decline rates. However, we need to be cautious in assuming these lower
decline rates are sustainable. In our view after such “step-changes” in performance there are
limits to how much further production efficiency can improve and mask underlying decline rates.
What it all means for global supply
Based on our supply model, we estimate that 81% of world liquids production is already in
decline, excluding future redevelopments. However, on a more benign definition we estimate
the figure at 64%, or 59mbd vs global supply (excluding biofuels/processing gains) of 91mbd.
The remainder of output is accounted for by 1) new conventional fields or large fields in ramp-up
or plateau, 2) natural gas liquids (~13.5mbd globally, where production is often associated with
long-plateau gas output, typically for LNG), tight oil (~5mbd) and biofuels (~2.3mbd).
If we assume 5-7%pa decline rates on a benign estimate of 59mbd of global post-peak output,
the supply lost between 2016 and 2040 amounts to 41-48mbd. For context, this is broadly 4x
the current crude oil output of OPEC’s largest producer, Saudi Arabia (c.10.5mbd). Assuming all
other pre-peak production is held constant, this is the amount needed just to keep supply flat.
To provide in addition for the expected rise in global demand over the period, the additional
supply needed could be closer to 55-60mbd.
Post-peak production (benign definition) – sensitivity to 5-7% decline rate to 2040
Source: HSBC estimates
In this report we focus on conventional liquids supply (onshore, offshore and deepwater) and do
not discuss the topic of US shale declines in detail. For more on US shale trends, please see
our latest Oil Insights report: Oil Insights: The dog days of summer (10 August 2016).
0
10
20
30
40
50
60
2016 2018 2020 2022 2024 2026 2028 2030 2032 2034 2036 2038 2040
7% decline rate 6% decline rate 5% decline rate
41-48mbd lost

5
MULTI-ASSET NATURAL RESOURCES & ENERGY
September 2016
Global oil market: from supply surplus to supply deficit?
After a period of oversupply in 2014-16, the oil market is finally getting closer to balance. Our
supply/demand model points to a market in balance in 2017 despite our below-consensus
demand growth assumption (+0.9mbd), as non-OPEC output declines for a second successive
year (-0.5mbd). Thereafter, through 2018-20 we see a steadily tightening market under a
combination of demand growth, moderately rising OPEC output (mainly Iraq/Iran) but virtually
flat non-OPEC volumes.
Spare capacity to tighten in 2017e-18e
The current global oversupply has meant that the issue of decline rates have received very little
investor attention in the past couple of years. However, the oil market should be back in balance
sometime in 2017. At that stage, effective (ie deliverable) global spare capacity could be as little
as 1% of global oil demand according to the US EIA.
Measures of OPEC spare capacity OPEC ex Iraq, Nigeria and Libya spare capacity, mbd
Source: BP, IEA, US EIA, Wood Mackenzie, HSBC and US EIA estimates Source: IEA
Against a backdrop of such limited spare capacity, supply shocks have the potential to
significantly affect oil supply and therefore oil prices. Production declines caused by natural
factors (i.e. reservoir depletion) and lack of capital investment could also become more
prominent issues for the market.
0%
5%
10%
15%
2000
2001
2002
2003
2004
2005
2006
2007
2008
2009
2010
2011
2012
2013
2014
2015
2016
e
2017
e
Effective spare capacity as % of demandEffective spare capacity, %Spare capacity at call, %
0.0
0.5
1.0
1.5
2.0
2.5
3.0
3.5
4.0
Jan-
14
Mar
-14
May
-14
Jul-1
4
Sep
-14
Nov
-14
Jan-
15
Mar
-15
May
-15
Jul-1
5
Sep
-15
Nov
-15
Jan-
16
Mar
-16
May
-16
Declines and the oil market
Decline rates key to oil supply picture; and set to become an issue
for investors as spare capacity tightens again in 2017e-18e
Declines on conventional production (ex-shale) means non-OPEC
production won’t grow from 2016e to 2020e
In the longer-term, a supply squeeze is likely to happen well before
oil demand peaks
With low spare capacity,
market may worry again
about supply declines

MULTI-ASSET NATURAL RESOURCES & ENERGY
September 2016
6
Supply issues likely to arise long before demand peaks
With respect to the long-term outlook for oil, investors’ concerns seem mostly focused on the
outlook for oil demand. This is understandable, particularly in the context of the COP21
agreement and rapid advances in alternative energy technologies such as electric vehicles. As
discussed later in this report (page 16) and in detail in Global oil demand: Near-term strength,
longer-term uncertainty (24 July 2016), none of the central scenarios from the main energy
agencies (such as the International Energy Agency, the US Energy Information Administration
and OPEC) and oil majors currently sees global demand peaking by 2040. The average growth
in oil demand over the period is seen at ~15mbd.
Even in a world of slower oil demand growth, we think the oil industry’s biggest long-term
challenge is to offset declines in production from mature fields. The scale of this issue is such
that in our view rather there could well be a global supply squeeze some time before we are
realistically looking at global demand peaking.
Non-OPEC conventional crude production has struggled to grow
For context, global liquid supply is currently ~96mbd, up from the recent low of ~85mbd in 2009
after the global financial crisis. Of this, ~56mbd is non-OPEC, including 7mbd of natural gas
liquids (NGLs), plus 2.3mbd of biofuels – which leaves around 47mbd of non-OPEC crude
production (including processing gains). OPEC crude represents around 33mbd and OPEC
NGLs another 6.7mbd.
Share of global liquids production Share of global liquids production (crude + NGLs)
Source: Bloomberg, Petroleum Intelligence Weekly (PIW) Source: Bloomberg, Petroleum Intelligence Weekly (PIW)
It is useful to understand the contributions to the incremental 11mbd of liquids since 2009 by the
various producer categories:
OPEC contributed around 3.1mbd of growth (mainly from Saudi Arabia and Iraq), and the
cartel’s market share fell slightly from 34.9% to 34.2%. Natural gas liquids (NGLs) from
OPEC also grew strongly, adding about 1mbd over the period.
Non-OPEC contributed a total of 6.7mbd of incremental supply over the period. This may
look like a good performance at first glance, but most of this volume growth came from
supply sources outside conventional crude. Non-OPEC NGLs (which are related to gas and
LNG output), US shale and biofuels added 1mbd, 3.4mbd and 0.8mbd respectively. In fact,
non-OPEC conventional crude production grew by only 1.5mbd over 7 years, equivalent to
a growth rate of just 0.5% – well below trend demand growth. This isn’t a new trend: if we
go back a little further, non-OPEC conventional crude is currently no higher than it was ten
years ago.
0%
10%
20%
30%
40%
50%
60%
2000 2002 2004 2006 2008 2010 2012 2014 2016
OPEC crude Non-OPEC crude
OPEC NGLs Non-OPEC NGLs
30%
35%
40%
45%
50%
55%
60%
65%
2000 2002 2004 2006 2008 2010 2012 2014 2016
OPEC Non-OPEC
7
MULTI-ASSET NATURAL RESOURCES & ENERGY
September 2016
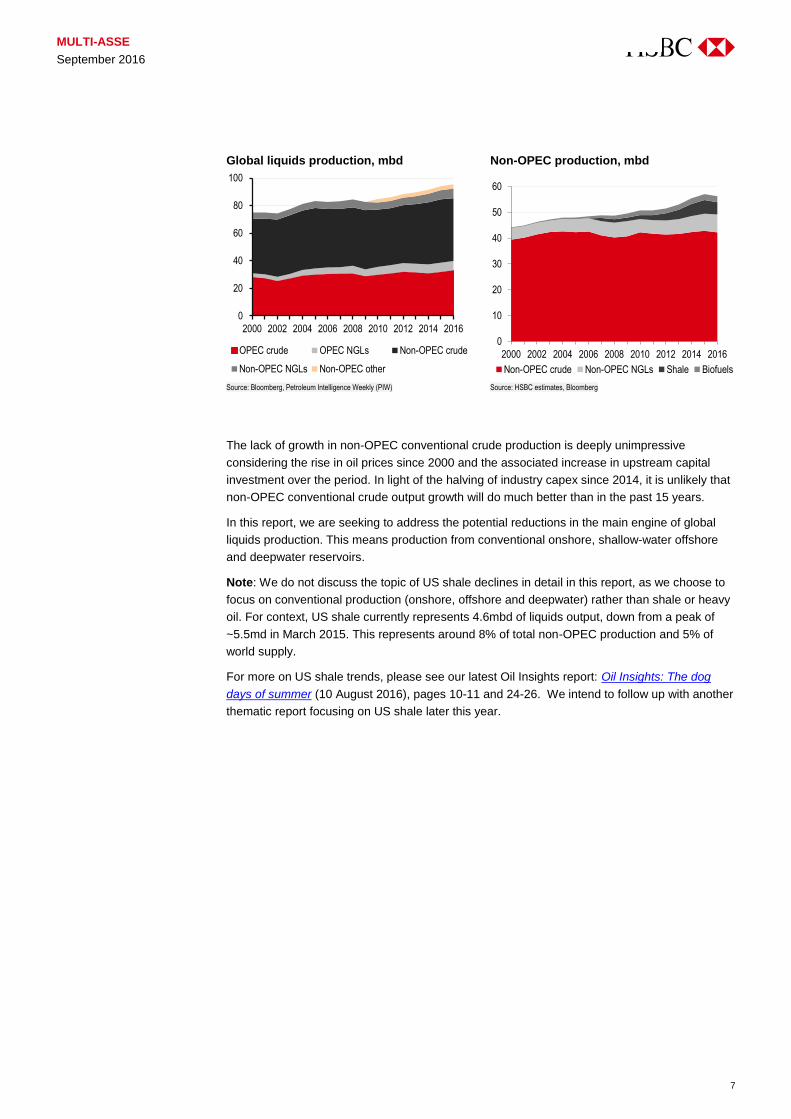
Global liquids production, mbd Non-OPEC production, mbd
Source: Bloomberg, Petroleum Intelligence Weekly (PIW) Source: HSBC estimates, Bloomberg
The lack of growth in non-OPEC conventional crude production is deeply unimpressive
considering the rise in oil prices since 2000 and the associated increase in upstream capital
investment over the period. In light of the halving of industry capex since 2014, it is unlikely that
non-OPEC conventional crude output growth will do much better than in the past 15 years.
In this report, we are seeking to address the potential reductions in the main engine of global
liquids production. This means production from conventional onshore, shallow-water offshore
and deepwater reservoirs.
Note: We do not discuss the topic of US shale declines in detail in this report, as we choose to
focus on conventional production (onshore, offshore and deepwater) rather than shale or heavy
oil. For context, US shale currently represents 4.6mbd of liquids output, down from a peak of
~5.5md in March 2015. This represents around 8% of total non-OPEC production and 5% of
world supply.
For more on US shale trends, please see our latest Oil Insights report: Oil Insights: The dog
days of summer (10 August 2016), pages 10-11 and 24-26. We intend to follow up with another
thematic report focusing on US shale later this year.
0
20
40
60
80
100
2000 2002 2004 2006 2008 2010 2012 2014 2016
OPEC crude OPEC NGLs Non-OPEC crude
Non-OPEC NGLs Non-OPEC other
0
10
20
30
40
50
60
2000 2002 2004 2006 2008 2010 2012 2014 2016
Non-OPEC crude Non-OPEC NGLs Shale Biofuels

MULTI-ASSET NATURAL RESOURCES & ENERGY
September 2016
8
HSBC oil supply & demand model and oil price assumptions
We think the market could be underestimating the scale of the supply tightening and the almost
unprecedented fall in industry investment seen in the past two years is likely to have long-term
implications for the supply outlook. Despite our expectation of a rebound in US tight oil output
from H2 2017 onwards as prices rise further, we see total non-OPEC output no higher in 2020e
than in 2016e. Moreover, the effects of the spending slowdown on non-OPEC supply are likely
to stretch far beyond 2020, in our view.
Global oil supply/demand balance, mbd
2013 2014 2015 2016e 2017e 2018e 2019e 2020e
Demand OECD 46.0 45.8 46.2 46.4 46.3 46.1 45.9 45.7 Non-OECD 45.4 46.7 47.8 48.8 49.8 50.9 51.9 53.0 Global demand 91.3 92.4 94.0 95.2 96.1 97.0 97.8 98.6 Demand growth 1.0% 1.2% 1.7% 1.2% 1.0% 0.9% 0.8% 0.8% Supply Non-OPEC* 53.0 55.5 57.1 56.3 55.8 56.2 56.0 56.0 OPEC NGLs 6.4 6.4 6.5 6.7 6.9 7.0 7.1 7.2 Non-OPEC & OPEC non-crude 59.5 61.8 63.6 62.9 62.7 63.2 63.2 63.2 OPEC crude production 31.7 31.0 32.1 32.7 33.3 33.5 33.9 34.3 Global supply 91.2 92.8 95.7 95.6 96.0 96.7 97.1 97.5 Implied inventory build/(draw) -0.2 0.4 1.7 0.5 -0.1 -0.3 -0.7 -1.1 Call on OPEC crude 31.9 30.6 30.5 32.2 33.4 33.8 34.6 35.4 OPEC crude capacity, mbd 33.2 33.1 33.4 34.1 34.4 Spare capacity at call, mbd 1.4 2.5 2.9 1.8 0.9 Spare capacity at call, % 4.1% 7.5% 8.6% 5.4% 2.8% Effective spare capacity, mbd 1.53 2.11 1.21 1.36 1.03 Effective spare capacity, % 4.6% 6.4% 3.6% 4.0% 3.0% Spare capacity at call, % of demand 1.5% 2.7% 3.1% 1.9% 1.0% Effective spare capacity, % of demand
1.7% 2.3% 1.3% 1.4% 1.1%
Annual changes, mbd Global demand 0.9 1.1 1.6 1.1 0.9 0.9 0.8 0.8 Non-OPEC supply 1.5 2.4 1.6 -0.8 -0.5 0.4 -0.1 -0.1 Non-OPEC (inc. OPEC NGL) supply 1.5 2.4 1.7 -0.6 -0.3 0.5 0.0 0.0 Call on OPEC -0.6 -1.3 -0.1 1.7 1.2 0.4 0.8 0.8 OPEC crude production -0.9 -0.7 1.2 0.6 0.6 0.2 0.4 0.4
*Includes global biofuels, processing gains etc. Source: BP, IEA, US EIA, Wood Mackenzie, HSBC estimates
As a result, we see the stage set for further crude price upside as the market steadily tightens
through the remainder of this decade. Our unchanged Brent price assumptions are USD60/b in
2017e and USD75/b in 2018e.
HSBC oil and natural gas price assumptions
Annual average 2011 2012 2013 2014 2015 2016e 2017e 2018e
Brent USD/b 110.9 111.7 108.7 99.5 53.6 46.8 60.0 75.0 WTI USD/b 95.1 94.1 97.9 93.1 48.7 45.5 59.0 74.0 W Canada Select USD/b 78.4 71.8 73.5 74.4 35.7 29.0 42.0 52.5 Dubai USD/b 106.1 108.9 105.4 96.6 51.2 43.2 57.0 72.0 Nymex gas USD/mBtu 4.0 2.8 3.7 4.3 2.6 2.5 3.0 3.5 UK spot gas GBp/th 56.4 59.7 68.2 50.2 42.7 31.5 40.0 50.0
Source: Bloomberg, HSBC assumptions
Flat non-OPEC supply from
2016e to 2020e
We continue to assume Brent
crude prices of USD60/b in
2017e, USD75/b in 2018e

9
MULTI-ASSET NATURAL RESOURCES & ENERGY
September 2016
What's in this report
Oil is geologically different from other commodities in that production is not naturally static: after
a period of plateau, all oil and gas fields inevitably decline even with additional investment.
There is therefore a natural correcting mechanism in global oil supply. While the impact of
decline on long-term oil supply is well-known, the exact mechanics and behaviour of decline
rates are not necessarily as well understood by the market, in our view.
This report looks in detail at two main subjects:
1. The theory and practice of decline rates, and the scale at which this can affect future oil supply.
2. Improving production efficiency, and how this is mitigating declines, but potentially only
temporarily.
Decline rates likely to rise
In this report, we look at the theory and practise of decline rates. We have reviewed several
academic studies on declines, notably i) the IEA study from the 2008 and 2013 editions of its
annual World Energy Outlook and ii) the University of Uppsala (Sweden) papers published in
2009 and 2013. The IEA and Uppsala studies were based on the analysis of over 1,600 fields
(covering two-thirds of global oil production) and just under 900 fields respectively – large
enough to be statistically significant.
How quickly is production declining?
The studies we have compiled (IEA and Uppsala) coincidentally appear to agree on a ~6.2%
average post-peak decline rate. Decline rates are higher for offshore fields and smaller fields,
reaching 12% or more for deepwater fields and for fields of less than 100mbbls. The chart
below shows the IEA’s average post-peak decline rate calculations for various field categories
and sizes:
Decline rates – synopsis
Decline rates likely to rise over time as oil production relies
increasingly on small fields
Range of 5-7% for global decline rates seems sensible based on
academic studies and our own analysis
Improved production & drilling efficiency can stem declines, but
only for so long – as the North Sea example shows
Studies converge on a >6%
post-peak decline rate

MULTI-ASSET NATURAL RESOURCES & ENERGY
September 2016
10
Annual decline rates for various field types and sizes
Source: IEA World Energy Outlook 2013. Average declines are weighted by cumulative production to 2012. Decline rates are calculated as compound-annual decline rates since peak.
The studies highlight several important conclusions on decline rates:
Offshore fields decline 3-6 ppts faster than (conventional) onshore fields. This is
partly because offshore fields are smaller than onshore fields, on average. This leads to the
next observation:
Smaller fields decline substantially faster than large fields. This will have important
implications for future world supply as the giant fields are maturing and a rising amount of global
oil production is coming from small fields (see more on this in the next section on page 16).
World decline rates have been slowly increasing: for instance, non-OPEC giant fields
that peaked in the 2000’s are declining at ~10% p.a., vs <5% for fields that peaked in the
1970’s. This deterioration reflects several factors including the diminishing size of new giant
fields, deteriorating geology and finally the impact of technology. Secondary and tertiary
recovery (IOR/EOR) techniques play a crucial role in the oil supply equation and help to
support global oil output, particularly for large fields where they are more frequently applied.
However, studies show that technology not only increases reservoir recovery rates, but also
brings production forward in order to keep output relatively flat. This leads to higher decline
rates at the back end of the curve, once all the “tricks in the book” have been exhausted
and fields actually start declining.
Decline rates accelerate in the final stages of a field’s lifecycle. This is particularly the
case for giant fields due to the impact of enhanced recovery techniques, which do little to
stem declines past a certain point. However, the IEA has shown that the conclusion holds
for any size and type of field, with a ~5% average step-up in decline rates in the terminal
phase (ie, when output has fallen to less than 50% of peak) compared to earlier phases.
Basin-wide decline rates inevitably catch up with field decline rates. Basin declines
are typically much lower than individual field decline rates, but rise as basins mature and
the new field start-ups needed to offset basin declines get increasingly small. It can take 30
years or more for basin-wide declines to reach individual field decline rates.
We have calculated underlying decline rates based on our analysis of Wood Mackenzie data
covering over 6,000 fields and 21 countries representing 86% of world crude supply. In order to
smooth out annual volatility, we use 20-year compound average decline rates (1996-2016e)
rather than single-year decline rates.
0%
2%
4%
6%
8%
10%
12%
14%
Onshore Shallow Deepwater Supergiant Giant Large Small Non-OPEC OPEC
Average post peak All fields
5 observations on decline
rates’ behaviour

11
MULTI-ASSET NATURAL RESOURCES & ENERGY
September 2016
We find that decline rates range between -14% at worst (Nigeria) to -2% at best
(Azerbaijan), with a global average around 6%.
Unsurprisingly, OPEC countries tend to fare better on average than non-OPEC countries on
decline rates. There are a few notable exceptions such as i) Nigeria, where militant attacks
have been responsible for significant output losses, and ii) Indonesia and Angola, both of
which are offshore producers as opposed to the onshore Middle East OPEC producers.
By and large, decline rates appear to have accelerated slightly in 2016e compared to their
20-year average. Having said this, we would not focus too much on single-year decline
rates given year-on-year volatility in output.
Compound-average underlying decline rate by country, last 20 years
Source: HSBC estimates, Wood Mackenzie. NB: Excludes NGLs and unconventional shale production in the US and Canada.
The North Sea example
In this report, we analyse data and use examples from the North Sea in order to test and back
up the theories laid out in academic studies. The North Sea is a mature OECD oil producing
offshore region where data is more easily available than most other regions. The region used to
represent 9% of global production in the 1990’s, but this has since fallen to just 3%. While we
have analysed in detail here only two countries (UK and Norway), we believe many of the
conclusions drawn from our North Sea analysis can be extrapolated to other regions,
particularly as they relate to offshore production.
Our North Sea analysis reveals the following:
Since 1997, the managed country-level decline rate has averaged 5% pa and 8% pa in
Norway and the UK, respectively, compared to 9% and 14% for “natural” decline rates.
Managed decline rates have improved noticeably in the last couple of years thanks to rising
production efficiency.
Basin-wide declines are far lower than individual field decline rates, which we estimate at
10% in Norway and 12% in the UK. Models show that basin-wide decline rates should
slowly converge towards (higher) field decline rates over time.
Small fields decline noticeably faster than larger fields. Moreover, large fields (>500mbbls)
have relatively stable decline rates in the first 15 years of their lives, then show accelerating
declines at the end of their lives – consistent with the behaviour predicted by academic studies.
(18%)
(16%)
(14%)
(12%)
(10%)
(8%)
(6%)
(4%)
(2%)
(0%)
Aze
rbai
jan
Ven
ezue
la
UA
E
Qat
ar
Kaz
akhs
tan
Iran
Kuw
ait
Can
ada
Sau
di A
rabi
a
Rus
sia
Iraq
Chi
na
Mal
aysi
a
Ang
ola
Bra
zil
Tha
iland US
Col
ombi
a
Indo
nesi
a
Mex
ico
Nig
eria
OPEC non-OPEC 2016e
Detailed analysis of North
Sea data backs up the theory
MULTI-ASSET NATURAL RESOURCES & ENERGY
September 2016
12
The average size of new field start-ups has trended down over the last 40 years, dropping
from over a hundred million barrels before 2000 down to 42mb in Norway and a measly
15mbbls in the UK in the last five years. Both countries are much more reliant on the
contribution from smaller (and therefore faster-declining) fields than 20 years ago.
Average water cuts have risen to 80% in the UK and to 62% in Norway. Water cuts tend to
rise faster for small fields and typically cause earlier shutdowns than at larger fields. Almost
a third of all UK production has a water cut of over 75%.
Based on Norway’s example, decline rates are faster for crude than NGL production, as the
latter is also linked to often more stable gas output. This may well be the only mitigating factor
in an otherwise bleak picture for decline rates, as NGL production from both OPEC and non-
OPEC should continue to rise and make up a greater production of world liquids supply.
The impact of improving plant and drilling efficiency
In many parts of the world, oil production has surprised to the upside since the start of the oil
price downturn in 2014. Putting aside the specific case of US light tight oil, the main positive
surprises have come from the likes of Russia and the North Sea, both of which managed to
grow output last year against expectations. Both are mature oil producing regions where, unlike
the US shale patch, there are no obvious technological or geological game-changers.
In this report, we examine the topic of production efficiency (“PE”) and drilling productivity
closely, using examples from the North Sea. Production efficiency measures actual production
relative to the maximum production potential of a field. The concept of PE is particularly relevant
for offshore activities, where fixed costs are high and maximising platform availability is
therefore crucial to production economics.
We conclude that production and drilling efficiency have played a major part in the unexpectedly
strong output increase seen in the last two years in the UK and Norway. While improvements
have been impressive – particularly in previously poor-performing regions such as the UK side
of the North Sea – we believe there are limits to how much production efficiency can improve
further and mask underlying decline rates. Notwithstanding anecdotal evidence of individual
fields reaching 97-99% production efficiency rates, we think the natural limit for production
efficiency is probably around 90-92% across an entire upstream portfolio and over a full
maintenance cycle.
In the UK, production efficiency fell steadily for a decade from 81% in 2004 to mediocre
60% in 2012, and has since rebounded to 71% in 2015 – about halfway back to where it
used to be. If we assume a similar rate of improvement in 2016-17e to that seen in the last
3 years, we estimate that there could be up to 110kbd of production upside relative to the
IEA’s 2017e production forecasts (or 11% of the country’s expected production).
Greater production efficiency
explains higher-than-
forecasted supply…
… But there are limits to how
much it can improve further

13
MULTI-ASSET NATURAL RESOURCES & ENERGY
September 2016
UKCS Oil & gas production efficiency
Source: UK Oil & Gas Authority, HSBC estimates
Norway is already well ahead of the UK on production efficiency. Statoil, a reasonably good
proxy for Norwegian production, reported over 90% production efficiency last year across its
Norwegian operations. This means there is less scope to further improve performance
relative to the UK. Indeed Statoil aims to keep production efficiency at a similar level this
year, acknowledging that further meaningful improvements are unlikely.
Drilling productivity has improved dramatically in the last 2-3 years and has helped to
offset the decrease in drilling spending and the number of rigs in operations. In Norway,
development wells are now 50% cheaper than 3 years ago, leading to higher drilling activity
despite lower investment.
New oil fields are becoming smaller
The average size of new oil fields matters in at least two respects.
Firstly, basin-wide decline rates ultimately catch up with individual field decline rates only
under the assumption that new fields get smaller over time.
Secondly, smaller fields decline significantly faster than big fields as discussed above. For
instance, giant fields (>1bnbbls) typically decline at less than 5% p.a. while small fields of
under 100mbbls decline at 20% or more.
On the scale of hydrocarbon basins, oil field discoveries and start-ups generally do get smaller
over time: the larger fields are logically found and developed first, so the frequency and average
size of new discoveries tends to diminish as basins get more mature over the years.
Based to our analysis of Wood Mackenzie data covering 15,500 fields, the average size of new
field start-ups has dropped significantly from over a billion barrels in the 1960’s to ~250mbbls in
the 1980’s to just 75mbbls this decade.
81% 80% 79% 77% 76%72% 70%
63% 60%64% 65%
71%67% 66%
80%85%
0%
20%
40%
60%
80%
100%
0
0.5
1
1.5
2
2.5
3
3.5
4
2004 2005 2006 2007 2008 2009 2010 2011 2012 2013 2014 2015 2016e 2017e
Oil Gas Oil upside Gas upside Production efficiency (RHS) PE target ( RHS)
Fields are becoming smaller
globally
New fields starting up are
getting smaller; <80mbbls
now the norm

MULTI-ASSET NATURAL RESOURCES & ENERGY
September 2016
14
Average size (URR) of global oil field start-ups, mboe
Source: HSBC estimates, Wood Mackenzie
The conclusion is even worse when looking just at the non-OPEC world, where the average
size of new field start-ups has fallen to 64mbbls.
Average size (URR) of global oil field start-ups, OPEC vs non-OPEC, mboe
Source: HSBC estimates, Wood Mackenzie. NB: Conventional resources only
In truth, the average size of new start-ups has been broadly stable since 2000 at less than
100mbbls, so these are not exactly new trends. However, the ever-decreasing size and number
of new oil discoveries does not bode well for future oil field start-ups.
No sign of improvement in oil discoveries
The size of oil discoveries has also been steadily diminishing over the years, fully consistent
with our earlier findings on field start-ups. Oil fields typically start up within 5-15 years of
discovery, so trends related to discoveries should simply anticipate those for producing fields
with a time lag.
According Wood Mackenzie, the average size of oil discoveries has steadily declined over time
and reached an all-time low in 2015 of just 24mmbbls of oil resources per discovery well. For
context, this compares to 340mbbls in the 1960’s and 180mbbls in the 1970’s, and is equivalent
to 18% of the historical annual average since 1960.
0
500
1,000
1,500
2,000
2,500
1960
-64
1965
-69
1970
-74
1975
-79
1980
-84
1985
-89
1990
-94
1995
-99
2000
-04
2005
-09
2010
-15
All fields Conventional only
0
500
1,000
1,500
2,000
2,500
3,000
3,500
4,000
1960
-64
1965
-69
1970
-74
1975
-79
1980
-84
1985
-89
1990
-94
1995
-99
2000
-04
2005
-09
2010
-15
Non-OPEC OPEC
Oil discoveries are also
smaller and fewer

15
MULTI-ASSET NATURAL RESOURCES & ENERGY
September 2016
Oil resources per discovery well (mbbls) and success rate (%)
Source: Wood Mackenzie, HSBC estimates
When looking at exploration activity in aggregate rather than at the individual discovery level, we
also observe that: 1) the number of exploration wells spudded has dropped markedly in the last
couple of years, and 2) the exploration success rate has plummeted to an all-time low of 5%. As a
result, the absolute amount of oil discovered fell to just 2.7bnbbls, 9% of the historical average.
Total oil discovered (mbbls) and number of exploration wells (RHS)
Source: Wood Mackenzie, HSBC estimates
In conclusion, the data shows that oil fields do get individually smaller on average, and that new
discoveries are also smaller than in the past. It also shows that there are fewer discoveries as
the number of exploration wells drops and success rates worsen. It follows that average field
declines rates should increase over time as global production increasingly relies on a high
number of small fields and less so on big fields.
0%
5%
10%
15%
20%
25%
30%
-
100
200
300
400
500
600
1960 1965 1970 1975 1980 1985 1990 1995 2000 2005 2010 2015
Oil resources per well Success rate - commercial (RHS)
-
500
1,000
1,500
2,000
2,500
-
20,000
40,000
60,000
80,000
100,000
120,000
1960 1965 1970 1975 1980 1985 1990 1995 2000 2005 2010 2015
Oil discovered Well Count Exploration

MULTI-ASSET NATURAL RESOURCES & ENERGY
September 2016
16
What does this all mean for global supply?
How much of global production is declining?
Based on our oil supply model, we estimate that ~81% of world oil supply (crude and NGLs)
is post-peak, or ~74mbd out of ~91mbd of production (excluding biofuels and processing
gains). In this analysis, we have used the strictest definition of “post-peak production”, defined
as output from all fields that are currently (as of 2016) below a previous production peak.
However, a less restrictive definition of “post-peak production” can be used, whereby we consider
that fields which have previously peaked but will have a second production peak (or redevelopment)
in the future are not post-peak. This is particularly relevant for large onshore fields, which are more
easily developed in successive phases, with sometimes lengthy intervals between investment
phases. For example, we classify the Tengizchevroil giant project in Kazakhstan as “growth” rather
than “post-peak”, as it is will undergo a big expansion phase from 2019 onwards. In our view, both
definitions of post-peak production are equally valid and have their own use, as many fields which
will be redeveloped in the future are currently suffering from decline.
Using the more benign definition, we find that 64% of the world’s oil production is post-
peak, or ~59mbd. As should be expected, the largest differences between the strict and less
strict definitions are found in the US (due to the expected recovery in tight and shale oil output
from 2018 onwards), Russia, Kazakhstan (due to the Tengizchevroil expansion), OPEC
countries (especially Iran, Iraq and Saudi Arabia) and countries where large production
disruptions have occurred in 2016 (e.g. Libya, Nigeria).
In conclusion, even using the less strict definition, it is clear that many producing regions are
highly mature, particularly Europe, Africa and Latin America. North America appears to be the
least mature region of the world, with 47% of current output which is either long-plateau
production (e.g. Canadian heavy oil) or yet to reach a production peak (e.g. US light tight oil
from the Permian, Eagle Ford etc).
Post-peak world oil production, as % of total
Source: HSBC estimates, BP Statistical Review of World Energy 2016. Includes crude and NGLs.
Global production is sensitive to small changes in decline assumptions
If we assumed an average decline rate of 5%pa on global post-peak supply of 74mbd – which is
by no means aggressive in our view − it would imply a fall in post-peak supply of c.38mbd by
2030, and c.52mbd out to 2040. In other words, the world would need to find over four times the
size of Saudi Arabia just to keep supply flat, before demand growth is taken into account.
0%
10%
20%
30%
40%
50%
60%
70%
80%
90%
100%
World crude+ NGL
OPEC Non-OPEC Europe FSU NorthAmerica
LatinAmerica
Middle East Africa
Strictly post-peak Incl future phases
>80% of world oil supply
already post-peak, on strict
definition
On less strict definition, <2/3
of supply is post-peak
1% change in initial decline
rate assumption = 4-5mbd
difference by 2040

17
MULTI-ASSET NATURAL RESOURCES & ENERGY
September 2016
Given the compounding nature of oil decline rates, a small difference in the initial decline rate
assumptions makes a significant difference to long-term production forecasts 20 years down the
line. For instance, if we assumed a 6% pa global decline rate instead of 5%, we would need to
find 57mbd of new capacity. At a 7% decline rate, we would need 61mbd of new capacity, or
around five “Saudi Arabias”.
For a more benign view, we could use the less strict definition of post-peak production of 59mbd
as a starting point. A decline rate of 5-7% would lead to a fall in post-peak production of 41-
48mbd. These are still very large numbers that represent a huge supply challenge to the oil &
gas industry.
Post-peak production (strict definition) – sensitivity to 5-7% decline rate to 2040
Post-peak production (benign definition) – sensitivity to 5-7% decline rate to 2040
Source: HSBC estimates Source: HSBC estimates
We could indeed use the more benign definition of post-peak production, however we believe
that using a constant decline rate between now and 2040 could be too optimistic. As previously
discussed, decline rates should rise over time as new fields get increasingly small.
While the concept of decline may be eminently simple to grasp, the quantification of
decline rates is of crucial importance in our view. Whether the answer is 5% or 7% really
does matter to oil supply and ultimately to oil prices.
Oil demand is growing, despite near-term concerns
Although there might be some very near-term concerns about demand, the medium-term
outlook to 2020e looks robust. We expect global oil demand growth of 1.1mbd (1.2%) in 2016e,
still above the ten-year average of 0.9mbd. We then expect demand to return broadly to trend
(0.9mbd) in 2017e-18e. Thereafter, rates of demand growth are set to slow further, and we
forecast 0.8mbd p.a. growth in 2019e-20e.
Following the COP21 agreement and in the context of rapid advances in alternative energy
technologies, uncertainties over the long-term outlook for oil demand seem to have increased
significantly. With this in mind, we recently conducted a detailed review of a number of leading
long-term energy demand scenarios and their implications for long-term oil demand. For full
details, please see Global oil demand: Near-term strength, longer-term uncertainty, 24 July 2016.
0
10
20
30
40
50
60
70
80
2016 2019 2022 2025 2028 2031 2034 2037 2040
7% decline rate 6% decline rate 5% decline rate
52-61mbd lost
0
10
20
30
40
50
60
70
2016 2019 2022 2025 2028 2031 2034 2037 2040
7% decline rate 6% decline rate 5% decline rate
41-48mbd lost
4 or 5 new Saudi Arabia’s
needed by 2040 just to keep
supply flat
Oil demand is still growing at
0.8-1.1mbd p.a.

MULTI-ASSET NATURAL RESOURCES & ENERGY
September 2016
18
Much of the debate around long-term prospects for oil demand is dominated by the issue of
penetration of the light duty vehicle (LDV) fleet by electric vehicles (EVs). Of course this is one
of the key uncertainties, but there are a few other important points to highlight:
It’s not all about cars: LDVs are only responsible for around a quarter of world oil demand.
Other forms of transport (trucks, aviation, marine and rail) consume in total more than
LDVs, and although substitution is happening, widespread disruption on the potential scale
facing LDVs look far less achievable, in our view. Demand growth prospects for both
aviation and commercial trucks look extremely strong across all the reference scenarios we
assessed, driven mainly by non-OECD markets.
Petrochemicals demand currently accounts for around 13% of global oil demand and has
been a key source of growth; aggregate chemicals demand growth of ~50% (6mbd) by
2040e looks quite feasible from the studies we examined.
Across the range of the scenarios we studied, none of the “reference cases” point to a peak in
oil demand through the forecasting period (to 2040), and even the most conservative of these
studies points to 2040e global demand more than 8mbd above that of 2015.
Global liquids demand, 2014-40e, mbd
Source: BP, ExxonMobil, Statoil, IEA, EIA, OPEC. Note that STL Renewal and IEA 450 are outcomes-based scenarios consistent with limiting temperature rises to 2°C
70
80
90
100
110
120
130
2014 2015 2020 2025 2030 2035 2040
BP STL Reform STL Renewal XOM
OPEC IEA NP IEA 450 EIA
Oil demand grows through to
2040 in all reference cases

19
MULTI-ASSET NATURAL RESOURCES & ENERGY
September 2016
Defining decline rates
Let’s start with a few definitions. The decline rate is usually defined as the amount of liquids
production lost in a given year divided by last year’s output, yielding a (negative) percentage
change.
𝜆𝑛 = 𝐷𝑒𝑐𝑙𝑖𝑛𝑒 𝑟𝑎𝑡𝑒𝑛 =𝑃𝑟𝑜𝑑𝑢𝑐𝑡𝑖𝑜𝑛𝑛 − 𝑃𝑟𝑜𝑑𝑢𝑐𝑡𝑖𝑜𝑛 𝑛−1
𝑃𝑟𝑜𝑑𝑢𝑐𝑡𝑖𝑜𝑛 𝑛−1
The decline phase in an oil field occurs after production has reached its peak. In the case of
large fields, peak production tends to last longer than for smaller fields – in many cases, several
years – and decline only sets in after a multi-year plateau.
The term “decline” can be applied at various levels of aggregation such as individual wells,
fields, basins and countries. When applied to a region, we should distinguish between the
overall decline rate which includes all producing fields, and the post-peak decline which only
includes fields already in decline and excludes fields that are ramping up or still at plateau.
Production decline can be caused by a number of factors, generally categorised as either
“above-ground” or “below-ground”:
Above-ground (or man-made) factors include production constraints, technical failures,
sabotage, permitting issues and politics. Despite their importance, this report will largely
leave aside such considerations and focus on below-ground factors.
The main below-ground factor is natural depletion. At some point in their lifecycle, all oil
fields begin to decline as the production of liquids (oil, condensates, and NGLs and water)
leads to falling reservoir pressure, which in turn causes well flow rates to drop. Water cuts
(i.e., the ratio of water to total liquids produced) also start to rise as wells produce
increasing amounts of water.
Decline rates and oil supply
All oil fields decline, but small and offshore fields decline much
faster than large and onshore fields
Rising proportion of world supply is coming from small fields
Case studies from North Sea to China show technology (IOR/EOR)
initially limits decline rates, but helps little past a certain stage
Declines are one of several
factors that cause oil
production to decrease

MULTI-ASSET NATURAL RESOURCES & ENERGY
September 2016
20
Stylised oil field production curve, describing the various stages of maturity
Source: Davies, D (2001). Production technology II. Tech. rep., Department of Petroleum Engineering, Heriot-Watt University (Edinburgh, Scotland)
Natural decline can be mitigated through investments into additional drilling, facilities,
debottlenecking, secondary and tertiary recovery. Some analyses differentiate natural decline
(which purely reflects physical factors) from managed decline rates, which include the impact
of reinvestment. The IEA estimates that the difference between natural and managed decline
rates is between 2% and 3%, and has been rising over time.
Natural depletion, not to be confused with natural decline, occurs as soon as a field enters
production. As such, a field that has recently started up is already depleting – by definition – but
may not yet in decline. Depletion measures the rate at which recoverable resources of a field or
region are being produced. It is defined as the ratio of annual production to either ultimate
recoverable reserves (URR), or alternatively to remaining recoverable resources, where the
latter is calculated as ultimate recoverable resources minus cumulative production.
Numerous studies have shown a strong correlation between decline and depletion rates, which
is hardly a surprise given the primary role of depletion in determining decline rates. In a
theoretical exponential decline curve (which we discuss below), the depletion rate in fact equals
the decline rate.
Decline rate curves: the basics
For the last century or so, many studies have proposed modelling decline rates as simple
mathematical curves, either exponential, harmonic or hyperbolic. There is a good connection
between these simplified mathematical models and the physical models for reservoir flows – for
instance, the exponential model solves for the flow equation of a well with constant bottomhole
flowing pressure. It is also virtually independent of the reservoir size and shape, and the actual
drive mechanism.
The best-known decline rate model is perhaps the exponential equation, whereby:
𝑃𝑛 = (1 − 𝜆) × 𝑃𝑛−1 and 𝑃𝑛 = (1 − 𝜆)𝑛 × 𝑃0
where 𝑃𝑛 is the production rate in year 𝑛; 𝑃0 is the initial production rate in year 0 (when decline
starts), and constant 𝜆 is the decline rate. A close variant of the exponential decline formula is:
𝑃𝑛 = 𝑃0𝑒−𝜆𝑛
First Oil
Build
Up
Discov ery
Well
Appraisal
Well
Plateau
Economic Limit
Decline
Abandonment
Time
Rat
e o
f Pro
duc
tion
Natural decline rates can be
mitigated through investment
Depletion occurs from Day 1,
not to be confused with
decline…
…but depletion and decline
rates are strongly correlated
Exponential decline rate
model is the best-known

21
MULTI-ASSET NATURAL RESOURCES & ENERGY
September 2016
The general hyperbolic decline rate equation allows for a falling rate of decline rather than a
constant rate of decline, and is written as follows:
𝑃𝑛 =𝑃0
(1+𝜆𝛽𝑛)1/𝛽 where 𝛽 is the curvature of decline.
If 𝛽 = 0, this is equivalent to exponential decline, as shown above. If 𝛽 = 1, this reduces to
harmonic decline:
𝑃𝑛 =𝑃0
1 + 𝜆𝑛
Both the exponential and harmonic are special cases of the general hyperbolic model.
Due to its simplicity and single parameter 𝜆, the exponential curve is the most convenient and
frequently used decline model. As we will show later, it provides a surprisingly good fit with
actual production data in many cases.
However, the main drawback of the exponential decline is that it sometimes overestimates the
extent of decline (i.e. underestimates production) towards the back end of the production curve,
as decline often flattens out in the latter years of a field’s lifecycle. This feature makes harmonic
or hyperbolic curves more appropriate. Indeed, several studies (including the IEA’s 2008 and
2013 studies) have split their analysis of decline rates into distinct sub-stages – we will come
back to this later.
By way of illustration, we have plotted 3 decline curves in the graph below using a 10% decline
rate 𝜆. The harmonic and hyperbolic curves result in shallower decline rates of the order of ~4-
5% towards the back end, while the exponential case maintains the decline constant at 10%
throughout the field’s lifetime.
Theoretical field decline rate curves (with a decline rate factor λ of 10%)
Source: HSBC estimates, based on UK Energy Research Centre: “Global Oil Depletion: An assessment of evidence for near-term peak in global oil production” (August 2009)
Do these decline curves work in the real world?
There is plenty of evidence that these simple models agree well with empirical data. To test this
hypothesis, we have fitted theoretical decline curves to actual production data for several
Norwegian offshore fields of varying sizes (from giants to small fields) picked at random.
During this exercise, we were surprised by i) how easy it was to find a good fit, despite some
year-on-year variations, ii) the high implied λ (decline rate) parameters, including for large and
giant fields.
0
1
2
3
4
5
6
7
8
9
10
1 2 3 4 5 6 7 8 9 10 11 12 13 14 15 16 17 18 19 20 21 22 23 24
General hyperbolic, β=0.5 Harmonic Exponential "Classic" exponential
Hyperbolic decline model
allows for falling rate of
decline
Simple decline rate models fit
reality surprisingly well

MULTI-ASSET NATURAL RESOURCES & ENERGY
September 2016
22
Giant field: Statfjord (1.7bn b). Exponential fit with λ = 14%
Production (kbd) vs years from peak
Large field: Ula (250mb). Hyperbolic fit
with λ = 40% and β = 0.7
Production (kbd) vs years from peak
Source: HSBC estimates, Norwegian Petroleum Directorate. Source: HSBC estimates, Norwegian Petroleum Directorate
Medium/large field: Statfjord Øst (162mb).
Hyperbolic fit with λ = 20% and β = 0.2.
Production (kbd) vs years from peak
Small field: Mikkel (26mb). Harmonic fit
with λ = 23% and β = 1
Production (kbd) vs years from peak
Source: HSBC estimates, Norwegian Petroleum Directorate Source: HSBC estimates, Norwegian Petroleum Directorate
Observations on decline rates from academic studies
Several academic studies have tried to quantify global decline rates – a herculean task which
requires a considerable amount of accurate production and reserve data for hundreds or
thousands of fields around the world.
The main authoritative studies on the subject have been conducted by the IEA in the 2008 and
2013 editions of the World Energy Outlook (WEO) and by the University of Uppsala (Sweden) in
2009 and 2013. The more recent 2013 IEA study was based on the analysis of 1,634 production
fields, of which 358 are giant fields and 93% are in decline. The database covers around two-
thirds of global oil production. The 2013 Uppsala study was based on 880 oilfields, including
about 350 giant fields, covering well over 50% of global production.
-
100
200
300
400
500
600
700
0 1 2 3 4 5 6 7 8 9 10111213141516171819
STATFJORD
-
20
40
60
80
100
120
140
0 1 2 3 4 5 6 7 8 9 10111213141516171819
ULA
-
10
20
30
40
50
60
70
80
0 1 2 3 4 5 6 7 8 9 10111213141516171819
STATFJORD ØST
-
2
4
6
8
10
12
14
0 1 2 3 4 5 6 7 8 9
MIKKEL
We summarise findings from
two studies on decline rates,
including the IEA’s

23
MULTI-ASSET NATURAL RESOURCES & ENERGY
September 2016
These studies tend to agree on an average decline rate figure of just over 6%, and on the main
conclusions which we summarise below:
Offshore fields decline 3-6 ppts faster than onshore fields
Smaller fields decline substantially faster than large fields
World decline rates have been slowly increasing
Decline rates accelerate in the final stages of a field’s lifecycle, as technology only delays
the onset of decline
Basin-wide decline rates inevitably catch up with field decline rates
1: Offshore fields decline 3-6 ppts faster than onshore fields
Significant differences can be seen between onshore and offshore fields on the one hand, and
OPEC and non-OPEC fields on the other hand. There is significant overlap between the two sets
of data, as the vast majority of OPEC giant fields are onshore. However, even adjusting for this,
the Uppsala study found that non-OPEC onshore declined faster than OPEC onshore (5.1% vs
2.8%), and that non-OPEC offshore declined faster than OPEC offshore (10.3% vs 7.5%).
This difference could be partly explained by field size: indeed, many of the world’s giants and
supergiants are located onshore rather than offshore. As we discuss in the next section, field
size has been shown to be inversely correlated with decline rates.
Average decline rates for post-peak giant fields
Uppsala 2013 IEA 2008 CERA 2008
Average decline All fields 6.5% n.a. 6.3% Onshore 4.9% n.a. 5.3% Offshore 9.4% n.a. 7.5% Non-OPEC 7.5% n.a. 6.4% Non-OPEC onshore 5.7% Non-OPEC offshore 10.0% OPEC 4.8% n.a. 5.4% OPEC onshore 3.8% OPEC offshore 7.7% Production-weighted decline All fields 5.5% 6.5% 5.8% Onshore 3.9% 5.6% n.a. Offshore 9.7% 8.6% n.a. Non-OPEC 7.1% 7.4% n.a. Non-OPEC onshore 5.1% Non-OPEC offshore 10.3% OPEC 3.4% 4.8% n.a. OPEC onshore 2.8% OPEC offshore 7.5%
Source: “Decline and depletion rates of oil production: a comprehensive investigation”, Uppsala University (December 2013), based on Uppsala 2009 study
6% average decline rate, with
key nuances on field size,
type and maturity
Offshore fields decline 3-
6ppts faster than onshore

MULTI-ASSET NATURAL RESOURCES & ENERGY
September 2016
24
Production-weighted decline rates for post-peak giant fields
Source: “Decline and depletion rates of oil production: a comprehensive investigation”, Uppsala University (December 2013), based on Uppsala 2009 study
2: Smaller fields decline twice as fast as large fields
Several studies have shown that decline rates are lower for giant fields than for smaller fields.
Beyond geological factors, this feature is the result of several factors:
Low declines at giant fields often derive from a deliberate development and production
strategy: large fields can be developed through successive phases aimed at maintaining
stable plateau production for several years. This is particularly the case for large onshore
fields (which can easily be developed in phases), but the idea remains applicable to large
offshore fields too.
Moreover, in countries highly dependent on hydrocarbon exports, and/or where upstream
activity is dominated by national oil companies (NOCs) rather than IOCs (i.e. typically in
OPEC countries), large fields are often developed at a slower pace to optimise reservoir
conditions throughout their lifecycles and to preserve resources for future generations.
A 2013 study by Uppsala University has shown that decline rates of smaller fields are
significantly higher than for larger fields. On average, small fields of less than 10mbbls of
recoverable resources decline twice as fast as larger fields of over 10mbbls (whether the
decline rates are weighted arithmetically or by production). Unsurprisingly, giant fields of over
1bnboe have by far the lowest decline rates.
0%
2%
4%
6%
8%
10%
12%
Onshore Offshore Non-OPEC OPEC
Uppsala 2009 IEA 2008 Average Uppsala Average IEA
Small fields decline faster
than big fields

25
MULTI-ASSET NATURAL RESOURCES & ENERGY
September 2016
Observed annual decline rates in % for fields of varying sizes
Source: “Decline and depletion rates of oil production: a comprehensive investigation”, Uppsala University (December 2013)
While the figures are different, the 2008 IEA study reached similar conclusions, with declines at
smaller fields consistently higher than for giants and supergiants regardless of location and field type.
Based on these figures, it seems likely that average decline rates will move closer to the ~10%
observed at non-giant fields than the ~6.5% average for giant fields, as global oil production is
increasingly driven by smaller oilfields, as we have shown earlier in this report.
Production-weighted decline rates for different sizes of post-peak fields (IEA data)
Total Supergiant Giant Other
All fields 5.1% 3.4% 6.5% 10.4% Onshore 4.3% 3.4% 5.6% 8.8% Offshore 7.3% 3.4% 8.6% 11.6% Non-OPEC 7.1% 5.7% 6.9% 10.5% OPEC 3.1% 2.3% 5.4% 9.1%
Source: IEA World Energy Outlook 2008. Field simple size: 798.
Faster depletion of smaller fields explains higher declines
Higher decline rates in smaller fields are strongly correlated with higher depletion rates (defined
as annual production as a % of ultimate recoverable resources) at the onset of decline. High
depletion rates of 15-20% of URR are frequently observed only in small oilfields, but are very
rare in larger fields for reasons previously discussed (optimal reservoir management, resource
husbandry etc.).
0%
5%
10%
15%
20%
25%
30%
Under 0.1mb 0.1 to 1mb 1 to 10mb 10 to 100mb 100mb to 1bnb over 1bnb
Average decline PW decline Average PW average
MULTI-ASSET NATURAL RESOURCES & ENERGY
September 2016
26
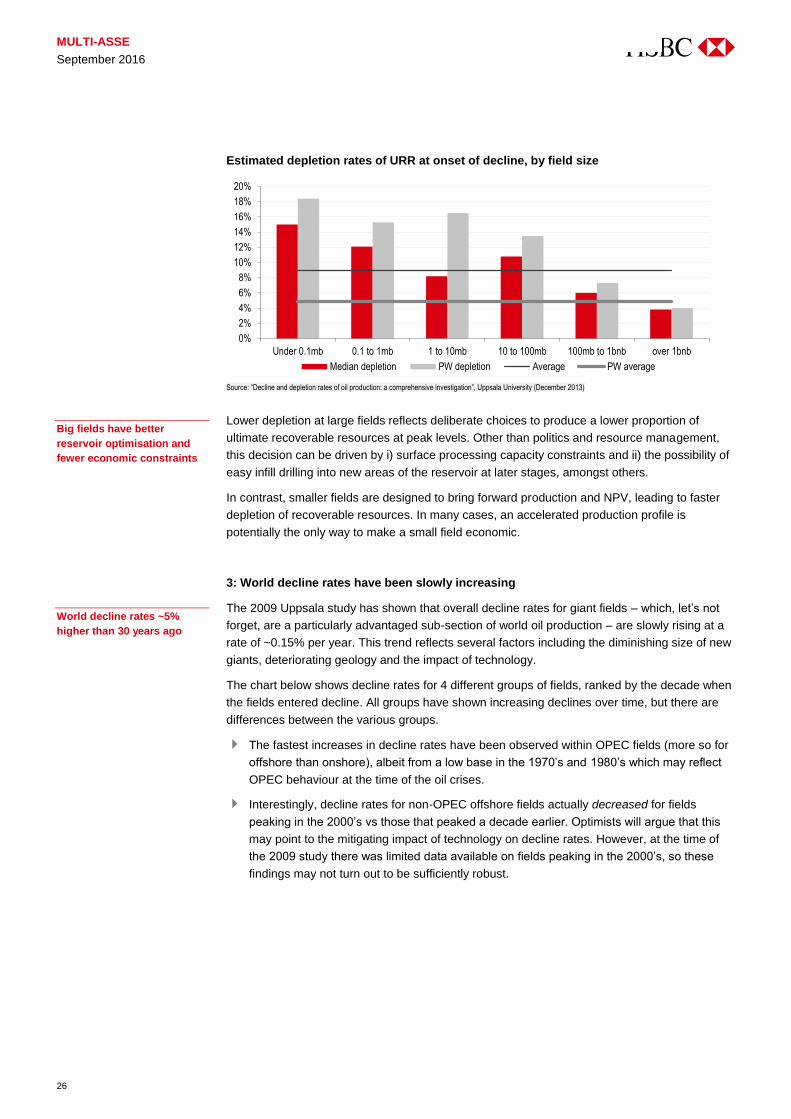
Estimated depletion rates of URR at onset of decline, by field size
Source: “Decline and depletion rates of oil production: a comprehensive investigation”, Uppsala University (December 2013)
Lower depletion at large fields reflects deliberate choices to produce a lower proportion of
ultimate recoverable resources at peak levels. Other than politics and resource management,
this decision can be driven by i) surface processing capacity constraints and ii) the possibility of
easy infill drilling into new areas of the reservoir at later stages, amongst others.
In contrast, smaller fields are designed to bring forward production and NPV, leading to faster
depletion of recoverable resources. In many cases, an accelerated production profile is
potentially the only way to make a small field economic.
3: World decline rates have been slowly increasing
The 2009 Uppsala study has shown that overall decline rates for giant fields – which, let’s not
forget, are a particularly advantaged sub-section of world oil production – are slowly rising at a
rate of ~0.15% per year. This trend reflects several factors including the diminishing size of new
giants, deteriorating geology and the impact of technology.
The chart below shows decline rates for 4 different groups of fields, ranked by the decade when
the fields entered decline. All groups have shown increasing declines over time, but there are
differences between the various groups.
The fastest increases in decline rates have been observed within OPEC fields (more so for
offshore than onshore), albeit from a low base in the 1970’s and 1980’s which may reflect
OPEC behaviour at the time of the oil crises.
Interestingly, decline rates for non-OPEC offshore fields actually decreased for fields
peaking in the 2000’s vs those that peaked a decade earlier. Optimists will argue that this
may point to the mitigating impact of technology on decline rates. However, at the time of
the 2009 study there was limited data available on fields peaking in the 2000’s, so these
findings may not turn out to be sufficiently robust.
0%
2%
4%
6%
8%
10%
12%
14%
16%
18%
20%
Under 0.1mb 0.1 to 1mb 1 to 10mb 10 to 100mb 100mb to 1bnb over 1bnb
Median depletion PW depletion Average PW average
Big fields have better
reservoir optimisation and
fewer economic constraints
World decline rates ~5%
higher than 30 years ago

27
MULTI-ASSET NATURAL RESOURCES & ENERGY
September 2016
Evolution of the decline rate of various field types (grouped by decade of reaching peak production)
Source: “Depletion and Decline Curve Analysis in Crude Oil Production”, Uppsala University (May 2009). Declines are weighted by production.
Crucially, the Uppsala study argues that many giant oilfields have managed to extend their
plateau phases through technology (secondary and tertiary recovery), only to experience faster
declines once they actually start declining. In other words, these technologies help to bring
production forward by raising the rate of depletion, rather than materially increase recovery
rates and the amount of recoverable oil. This would explain why fields that entered decline in
the 1990’s and 2000’s have seen faster declines than older fields that peaked in the 1960-80’s,
when technology was not applied to the same degree.
The sharp output drop at the giant Cantarell field (offshore Mexico) since the onset of decline in
2005 is a good example of what happens once all the “tricks” in the book to extend plateau have
been exhausted. In Cantarell’s case, secondary and tertiary recovery techniques included
nitrogen injection (which was controversial at the time as it is known to cause steeper declines
in the long term), infill drilling, horizontal drilling and gas lift.
According to IHS (2007), all of the world’s oilfields suitable for secondary recovery methods
(water or gas injection) are already applying them. This leaves infill drilling and tertiary recovery
or enhanced oil recovery / EOR (e.g. polymer injection, CO2 injection, etc) as the principal
remaining methods used to stem decline rates going forward.
Lastly, an obvious point worth reiterating is that the Uppsala study analysed decline rates for
giant fields already in decline. Logically, as more giants leave plateau production and enter
decline in the next few decades, their overall decline rate will rise. The authors estimate that as
much as 80% of the world’s giants will be in decline by 2030, compared to ~60% in 2005. If the
study is right about the impact of technology on recovery rates, then the decline-delaying
techniques are only masking what could be significantly higher decline rates in the future.
4: Decline rates accelerate in the final stages of a field’s lifecycle, as technology only
delays the onset of decline
The IEA (2013 WEO) has argued that using a single decline rate is not a robust basis for long-term
supply forecasts, as decline rates evolve through the different stages of a field’s decline. In its
analysis of decline rates, the agency divides post-peak decline into 3 phases:
phase 1, when production remains consistently above 85% of peak level;
phase 2, when production is between 50% and 85% of peak;
phase 3, when production falls below 50% of peak.
0%
2%
4%
6%
8%
10%
12%
Pre-1960 1960s 1970s 1980s 1990s 2000s
Non-OPEC onshore Non-OPEC offshore OPEC onshore OPEC offshore
Recovery techniques help
delay onset of decline, but
not forever
Cantarell: a good example of
the limits of technology

MULTI-ASSET NATURAL RESOURCES & ENERGY
September 2016
28
Indicative illustration of decline phases and concepts (IEA)
Source: IEA World Energy Outlook 2013
The IEA then calculates a compound average decline rate (CADR) from either the beginning of
each phase to the end of the phase or the last year of production.
The results are broken down by the type of conventional field, showing wide variations. As we have
shown previously, onshore, OPEC and supergiant fields have the lowest decline rates at 4-5%, while
small fields and deepwater fields have the highest declines at 12-13%. The analysis further reveals
that for any type of field, decline rates accelerate in the third phase, i.e. when fields are in
terminal decline.
Average compound annual decline rate (CADR) to 2012 by decline phase
Source: IEA World Energy Outlook 2013. Average declines are weighted by cumulative production to 2012. Decline rates are calculated as compound-annual decline rates since peak. Supergiants are fields of >5bnbbls recoverable resources, giants are 500-5,000mbbls, large are 100-500mbbls and small are <100mbbls. Deepwater are fields in >1,500m water depth.
This is consistent with the Uppsala University’s hypothesis that secondary and tertiary recovery
initially limits field decline rates, but does little to stem declines past a certain point.
How do we reconcile this with earlier observations that decline rates often flatten out at the tail
end (exhibiting hyperbolic decline curves rather than exponential)? We suspect the answer is
that fields that benefit from secondary / tertiary recovery are more likely to see higher decline
rates at the end of their lives, after a long period of flatter production aided by technology. On
the other hand, fields that have declined naturally will more closely match classic hyperbolic
decline models.
100%
80%
60%
40%
20%
Sh
are
of p
eak
pro
duct
ion
Peak
Ramp-up
Decline
phase 1
Decline phase 285%
50%Decline phase 3
Post-plateau
Post-peak
0%
2%
4%
6%
8%
10%
12%
14%
16%
Onshore Shallow Deepwater Supergiant Giant Large Small Non-OPEC OPEC All fields
Decline phase 1 Decline phase 2 Decline phase 3 Average post peak
Decline rates accelerate in
terminal phase

29
MULTI-ASSET NATURAL RESOURCES & ENERGY
September 2016
5. Basin-wide decline rates increase with maturity
The overall decline rate of a basin typically increases with maturity. While individual field decline
rates can flatten out towards the back end of their lives; on the scale of an entire basin the
opposite effect is observed, i.e. overall decline rates increase with time.
An oil-producing region is the sum of individual oil fields which reach their individual peak
production levels at different points in time. Declining production from post-peak fields has to be
replaced by increased production from new fields. As the larger fields in a basin are generally
found and developed first, the frequency and average size of new discoveries tends to diminish
as hydrocarbon basins get more mature over time.
In the early years, new field start-ups (although typically smaller than the basin-opening fields)
partly offset natural decline elsewhere. This leads to lower basin-wide overall decline rates
compared to individual field decline rates. When no new fields are launched, a basin’s overall
decline rate catches up with individual field declines. When older fields are shut down at the end
of their lives, basin decline rates can eventually exceed field decline rates.
To illustrate this, we have built a theoretical basin-wide model where we assume that (i) one
field is brought onstream each year for 20 years; (ii) each field is 10% smaller than the previous
field; (iii) fields reach their peak production in year 2, and sustain this level for a further 2 years;
(iv) the peak/plateau production level is set at 10% of ultimate recoverable resources (URR);
and (v) each field’s annual decline or depletion rate is 13%.
This model illustrates how the basin’s growth/decline rates evolve through its different
lifecycle stages.
It starts by exhibiting strong growth in the first 7 years and reaches a plateau around year 9-
10, when new fields are ~60% smaller than the initial discoveries and 35-40% of the basin’s
ultimate recoverable resources have been produced.
At the onset of basin decline in year 11, the overall decline rate gradually increases from a range
of 3-6% (years 11 to 20), to 9-13% (years 21 to 27) as new fields get increasingly smaller.
Ultimately, after around 30 years, the overall decline rate rises to 17-18%+, exceeding
individual field decline rates, as older fields stop production when they are no longer
economically viable.
Simple model of a basin’s production cycle, vs basin-wide overall decline rate (RHS)
Source: HSBC, based on “The future of oil supply” (December 2013), Richard G. Miller and Steven R. Sorrell
0%
2%
4%
6%
8%
10%
12%
14%
16%
18%
20%
0
5
10
15
20
25
30
35
40
45
50
1 2 3 4 5 6 7 8 9 10 11 12 13 14 15 16 17 18 19 20 21 22 23 24 25 26 27 28 29 30 31 32
Basin declines initially lower
than individual field
declines…
… but ultimately catch up
when new fields get too small

MULTI-ASSET NATURAL RESOURCES & ENERGY
September 2016
30
The example of the North Sea: do theories hold up?
We have gathered annual production data from Norway and the UK, two countries that make up
over 90% of total North Sea liquids production. The North Sea is an important example of a
classic mature offshore basin which represented 9% of global production 20 years ago, but has
fallen to just 3% currently.
North Sea liquids production (kbd) North Sea as % of world production (mbd)
Source: BP Statistical Review of World Energy 2016 Source: BP Statistical Review of World Energy 2016
From our analysis of several decades’ worth of annual production data from the Norwegian
Continental Shelf (NCS) and the UK, we make the following observations at the basin level:
We estimate that the managed decline rate for liquids since 1997 has averaged ~5% in
Norway and 8.3% in the UK. In the last two years, however, managed decline rates appear
to have been far smaller or even positive (i.e. increasing base production).
The natural decline rate has been closer to ~9% and ~14% in Norway and the UK,
respectively. The difference between natural and managed decline rates of 4-6% in the last
represents the positive impact of decline-mitigation activities such as infill drilling, IOR/EOR
and production efficiency.
Our analysis indicates that the impact of such decline-mitigation activities has increased in
the last couple of years, likely driven by the increases production efficiency, as we discuss
in the next section
Decline rates in Norway appear marginally (0.7ppts) higher for crude than for NGLs and
condensates, which depend on gas production rates as well as oil. (The UK does not
disclose crude oil, condensate and NGL production separately.)
0
1,000
2,000
3,000
4,000
5,000
6,000
7,000
1997 1999 2001 2003 2005 2007 2009 2011 2013 2015
Norway UK Other Europe
0%
2%
4%
6%
8%
10%
0
20
40
60
80
100
1997 2000 2003 2006 2009 2012 2015
North Sea Other non-OPEC
OPEC % of total
North Sea data backs up
decline rate models

31
MULTI-ASSET NATURAL RESOURCES & ENERGY
September 2016
Managed vs natural decline rates in Norway
Source: HSBC estimates, Norwegian Petroleum Directorate
Managed vs natural decline rates in the UK
Source: HSBC estimates, UK Oil & Gas Authority
As previously discussed, academic studies have shown that decline rates are generally lower
for large fields than smaller fields. Our own analysis of North Sea production data demonstrates
that this is indeed the case in Norway and the UK, certainly at the front end of their lives. The
charts below show average field production decline curves for fields of various sizes – for
simplicity we have shown only three categories, from small (<100mb) to very large (>1bnb), but
the conclusions still hold with finer size classifications.
-14%
-12%
-10%
-8%
-6%
-4%
-2%
0%
2%
4%
1997 1998 1999 2000 2001 2002 2003 2004 2005 2006 2007 2008 2009 2010 2011 2012 2013 2014 2015
Managed decline rate (%) Decline rate ex-infill (%)
-30%
-25%
-20%
-15%
-10%
-5%
0%
5%
10%
1985 1987 1989 1991 1993 1995 1997 1999 2001 2003 2005 2007 2009 2011 2013 2015
Managed decline rate (%) Decline rate ex-infill (%)
Small North Sea fields
decline faster than big fields
at the front end…
Production decline curves, ranked by field size (URR) - Norway
Production decline curves, ranked by field size (URR) - UK
Source: HSBC estimates, Norwegian Petroleum Directorate Source: HSBC estimates, UK Oil & Gas Authority
-
20
40
60
80
100
0 2 4 6 8 10 12 14 16 18 20
<100mb 100-1000mb >1000mb
-
20
40
60
80
100
0 2 4 6 8 10 12 14 16 18 20
<100mb 100-1000mb >1000mb

MULTI-ASSET NATURAL RESOURCES & ENERGY
September 2016
32
We have analysed decline rates for different North Sea field sizes as well as for various decline
stages. It appears that decline rates behave differently through a field’s lifecycle
depending on its size.
Small and medium-sized fields in both Norway and the UK tend to follow a classic
hyperbolic curve for the first 15 years or so, with very steep declines upfront and lower
decline rates at the tail end. This makes sense, as small fields are less likely to have
undergone secondary and tertiary recovery.
Large fields (of over 500mb) in both countries have more stable decline rates through time
for the first 15 years of their lives, consistent with the classic exponential curve. However,
they show a noticeable acceleration in decline at the end of their lives (after year 15).
Technology (secondary and tertiary recovery) appears to have delayed the onset of decline
at large fields for the first 15 years, before terminal decline sets in – basically the behaviour
predicted by Uppsala University and the IEA 2013 study.
Field size therefore explains much of discrepancy in decline rate behaviour through time: large
fields decline slowly thanks to technology, until they enter final depletion-driven decline. On the
other hand, small fields don’t typically benefit much from improved recovery. As a result, they
closely match classic hyperbolic curves, with lower declines at the tail end.
Decline rates ranked by field size and decline phase in Norway
Source: HSBC estimates, Norwegian Petroleum Directorate
Decline rates ranked by field size and decline phase in the UK
Source: HSBC estimates, UK Oil & Gas Authority
-30%
-25%
-20%
-15%
-10%
-5%
0%
<30mb 30-100mb 100-250mb 250-500mb 500-1000mb >1000mb
Year 1-5 Year 5-10 Year 10-15 Year 15-20
-30%
-25%
-20%
-15%
-10%
-5%
0%
<30mb 30-100mb 100-250mb 250-500mb 500-1000mb >1000mb
Year 1-5 Year 5-10 Year 10-15 Year 15-20
… But big fields have steeper
declines at the back end

33
MULTI-ASSET NATURAL RESOURCES & ENERGY
September 2016
As previously mentioned, big fields decline more slowly than small fields mostly due to long-
term reservoir management and the application of secondary and tertiary recovery. The charts
below show a clear inverse relationship between depletion-at-peak (i.e. peak production as a
proportion of ultimate recoverable resources) and field size on a log scale. In other words, the
larger a field is, the lower the plateau rate is compared to total recoverable resources, hence the
longer this peak rate can be sustained with little decline.
Depletion-at-peak rates vs URR (log scale) - Norway
Depletion-at-peak rates vs URR (log scale) - UK
Source: HSBC estimates, Norwegian Petroleum Directorate Source: HSBC estimates, UK Oil & Gas Authority
Basin-wide declines set to rise as new fields get smaller
We have described earlier a stylised basin model which demonstrates that basin-wide decline rates
are initially lower than field declines. Basin decline rates then eventually catch up with individual field
decline rates, assuming that new discoveries are smaller than initial basin-opening discoveries.
Although it is hardly new news, the charts below show that the average size of new field start-
ups in the North Sea has indeed declined over time. This points to basin decline rates getting
inexorably closer to individual field decline rates, unless the trend of discoveries getting
smaller can be reversed.
To put this in perspective, the basin-wide managed decline rate is around 5% in Norway
compared to individual field declines of ~10% as new field start-ups are partly offsetting decline.
In the UK, the basin-wide decline rate is around 8% vs individual field decline rates of ~12%.
The gap between field and basin decline rates is marginally narrower in the UK than Norway, as
new field start-ups in the UK are smaller than in Norway.
0%
5%
10%
15%
20%
25%
30%
35%
40%
45%
50%
0 1 2 3 4
0%
10%
20%
30%
40%
50%
60%
70%
80%
0 1 2 3 4
Big fields’ plateau rates set at
a lower % of recoverable
resources
Basin decline rates much
lower than field declines…
for now
Field size (URR) by start-up period - Norway Field size (URR) by start-up period - UK
Source: HSBC estimates, Norwegian Petroleum Directorate Source: HSBC estimates, UK Oil & Gas Authority
-
100
200
300
400
500
600
700
800
900
1,000
-
1,000
2,000
3,000
4,000
5,000
6,000
7,000
8,000
9,000
70-80
81-85
86-90
91-95
96-00
01-05
06-10
11-15
URR Average field size
-
100
200
300
400
500
600
700
800
900
-
2,000
4,000
6,000
8,000
10,000
12,000
14,000
75-80
81-85
86-90
91-95
96-00
01-05
06-10
11-15
URR Average field size

MULTI-ASSET NATURAL RESOURCES & ENERGY
September 2016
34
North Sea production increasingly coming from small/medium fields
In this context, it is interesting to note the growing proportion of North Sea production
coming from small and medium fields and the declining contribution from large and
particularly giant fields.
In Norway, giant fields of more than 1bnbbls have fallen to less than 35% of total production,
down from nearly three-quarters 20 years ago. Conversely, the contribution of every other
category of field – small, medium fields but also “elephants” of >500mb – has risen.
The UK has equally been reliant on a few very large fields, but the latter tend to be
“elephants” (500mb-1bnb) rather than true giants as in Norway. Following the Norwegian
trend, the proportion of giants has collapsed from just under 20% to only 6% of production.
However, unlike its northern neighbour, in the UK even medium-sized fields have dropped
from 45% to 1/3 of total production – evidence of the UK’s greater maturity. Meanwhile, the
contribution from small fields of <100mb has grown from 13% to one-third, far more than in
Norway where they currently represent one-fifth of total production.
Norwegian Continental Shelf (NCS) crude production, ranked by field size (kbd)
Source: HSBC estimates, Norwegian Petroleum Directorate. Ranked by estimated ultimate recoverable reserves. Excludes condensate and NGL production.
UK liquids production, ranked by field size (kbd)
Source: HSBC estimates, UK Oil & Gas Authority. Ranked by estimated ultimate recoverable reserves.
-
500
1,000
1,500
2,000
2,500
3,000
3,500
1971 1974 1977 1980 1983 1986 1989 1992 1995 1998 2001 2004 2007 2010 2013 2016
over 1000mb 500-1000mb 250-500mb 100-250mb 30-100mb up to 30mb
-
500
1,000
1,500
2,000
2,500
3,000
1975 1977 1979 1981 1983 1985 1987 1989 1991 1993 1995 1997 1999 2001 2003 2005 2007 2009 2011 2013 2015
over 1000mb 500-1000mb 250-500mb 100-250mb 30-100mb up to 30mb
More production comes from
small/mid fields vs giants

35
MULTI-ASSET NATURAL RESOURCES & ENERGY
September 2016
Rising water cuts are an indication of field maturity
The UK’s greater maturity compared to Norway is also evident in its higher water cuts. Water
cuts refer to the amount of water produced relative to the volume of total liquids produced. As
fields mature, oil production falls and water production rises, notably in fields with water-drive
reservoirs (i.e. reservoirs where the oil driven by an active aquifer) or that use water injection as
secondary recovery mechanism. At some stage, old wells produce too much water and the cost
of handling the water makes it uneconomic to continue producing. At the individual well level,
water cuts can rise to 90% or more of liquid volume brought to the surface.
The UK’s average water cut has risen from 68% in 2000 to 80% currently, while the average
water cut in Norway has increased from 37% to 62% currently.
Water cut in Norway (last 20 years) Water cut in the UK (last 40 years)
Source: HSBC estimates, Norwegian Petroleum Directorate Source: HSBC estimates, UK Oil & Gas Authority
Water cuts tend to rise faster in smaller fields: it takes less than 2 years for small fields to get to
a 50% water cut, compared to 6 years for big fields.
Water cut since peak (year 0) for different field sizes in the UK
Source: HSBC estimates, UK Oil & Gas Authority
Big fields can typically sustain high water cuts for longer periods than small fields: logically,
smaller accumulations are more likely to be shut down early when water cuts become
excessively high. In 2015, the average water cut for fields of at least half a billion barrels of
reserves was 86% in the UK and 68% in Norway, 6ppts above their respective basin averages.
Water cuts are commonly as high as 90%+ for big mature fields (e.g. Forties), while for smaller
0
500
1,000
1,500
2,000
2,500
3,000
3,500
4,000
0%
10%
20%
30%
40%
50%
60%
70%
80%
90%
100%
1997 2000 2003 2006 2009 2012 2015 2018
Liquids production Water cut
0
500
1,000
1,500
2,000
2,500
3,000
0%
10%
20%
30%
40%
50%
60%
70%
80%
90%
100%
1977 1982 1987 1992 1997 2002 2007 2012
Oil production Water cut
0%
10%
20%
30%
40%
50%
60%
70%
80%
90%
100%
-1 0 1 2 3 4 5 6 7 8 9 10 11 12 13 14 15
up to 30mb 30-150mb 100-500mb over 500mb
Rising water cuts indicate
field maturity
Water cut 80% in UK, 62% in
Norway
Big fields can sustain higher
water cuts before shut down

MULTI-ASSET NATURAL RESOURCES & ENERGY
September 2016
36
fields they usually peak in the mid-to-high 60%’s before the fields get shut down. On average,
small UK offshore fields can expect to produce just 1.5 years once they get past a 90% water
cut, while large fields can expect to produce another 9 years.
Post-peak life expectancy for UK fields past % water cut levels, ranked by field size
Source: HSBC estimates, UK Oil & Gas Authority
Around 30% of all UK production has a water cut of over 75%, up from 19% in 2000. While it is
yet another proof of the basin’s increasing maturity, it also indicates a rising proportion of fields
are at risk of being shut down within the next few years.
Fields with high water cuts contribute a growing proportion of UK production
Source: HSBC estimates, UK Oil & Gas Authority
0
5
10
15
20
25
>40% >50% >60% >70% >80% >90%
up to 30mb 30-150mb 100-500mb over 500mb
0%
10%
20%
30%
40%
50%
60%
70%
80%
90%
100%
1977 1979 1981 1983 1985 1987 1989 1991 1993 1995 1997 1999 2001 2003 2005 2007 2009 2011 2013 2015
<25% 25% - 50% 50% - 75% 75% - 100%

37
MULTI-ASSET NATURAL RESOURCES & ENERGY
September 2016
Case study: China’s Daqing
Although China is seen mostly as a major oil consumer, the country is also is an important
global oil producer, the sixth largest in the world. The three NOCs (PetroChina, Sinopec and
CNOOC) contributed a collective 5% of global oil supply in 2015. Pressures created by low oil
prices and reservoir maturity have contributed to 140kbd lower y/y production levels year-to-
date in 2016 (January-July), although more recent datapoints show y/y declines of more than
300kbd (-7-8% y/y).
Daqing: onshore giant in decline
As we discussed earlier in this report, the world’s large reservoirs, both within OPEC and
outside OPEC are relatively mature. PetroChina’s Daqing field is a good case in point: this oil
region is PetroChina’s largest oil and gas producing property, located in the Songliao basin. The
producing areas cover approximately one million acres.
Since its start more than 50 years ago, Daqing peaked near 1.1mbd in 1997 and is currently
producing just under 756kbd. This production has held up for decades, to the surprise of many
analysts and oilmen. This extension of peak recovery rates was achieved largely through the
use of Enhanced Oil Recovery (EOR) techniques including basic water injection, and more
recently newer EOR techniques, namely Alkaline-Surfactant-Polymer (ASP) flooding.
CNPC/PetroChina continue to apply EOR recovery to the liquid production. A new flooding
system consisting of alkaline, surfactant, polymer, and natural gas is significantly increasing
recovery rates. ASP-foam flooding recoveries can be c.10% higher than simple ASP flooding
and 30% higher than by water flooding.
From 2001 to 2009, Daqing’s water cut increased from 87.4% to 91.5%. Interestingly, the
operator stopped disclosing the field’s overall water cut in 2010.
China’s other two Majors, Sinopec and CNOOC, also operate in more mature basins and have
significant well declines in core production areas of the order of 4-8% p.a. each (see charts overleaf).
Daqing field production (kbd) Daqing water cut (%)
Source: CNPC, PetroChina Source: CNPC, PetroChina
0
200
400
600
800
1,000
1,200
1996 1999 2002 2005 2008 2011 2014Core prod Polymer flood Daqing
85%
86%
87%
88%
89%
90%
91%
92%
2001 2002 2003 2004 2005 2006 2007 2008 2009
Water cut

MULTI-ASSET NATURAL RESOURCES & ENERGY
September 2016
38
PetroChina productive oil wells (‘000) and per-well output (RHS)
Sinopec production oil wells (‘000) and per-well output (RHS)
Source: Company reports Source: Company reports
Annual change in per-well output for PetroChina and Sinopec (y/y)
Source: Company reports
China underlying annual decline rate (%)
Source: HSBC estimates, Wood Mackenzie
0
10
20
30
0
50
100
150
200
250
2002 2004 2006 2008 2010 2012 2014
Other regions Xinjiang
Changqing Daqing
Per well output (kbd)
0
5
10
15
20
25
30
0
10
20
30
40
50
60
2005 2007 2009 2011 2013 2015Productive oil wells Per well output (kbd)
(8%)
(7%)
(6%)
(5%)
(4%)
(3%)
(2%)
(1%)
0%
Petrochina (Daqing) Petrochina (Changqing) Petrochina (Xinjiang) Sinopec
2014 2015
(6%)
(5%)
(4%)
(3%)
(2%)
(1%)
--
2002 2003 2004 2005 2006 2007 2008 2009 2010 2011 2012 2013 2014 2015 2016
China underlying decline rate

39
MULTI-ASSET NATURAL RESOURCES & ENERGY
September 2016
Why has production surprised to the upside?
In many mature basins such as the North Sea, crude production has surprised to the upside in
the last 18 months, despite sharp reductions in capital spending and drilling activity. For
instance, UK liquids production rose 13% y/y in 2015 (the first increase in 16 years), while
Norway liquids production rose by 3% y/y (the second consecutive increase after 12 years of
decline). Several factors explain the production increases seen last year:
New field start-ups in the UK and Norway played a major part. In the UK there were 8 new
start-ups in 2015, adding to the ramp-ups from two large projects that started in late 2014.
In Norway, there were 4 new field start-ups respectively in 2015 and 2014.
In the UK, a number of fields which were previously shut in for various reasons came back
onstream last year. In volume terms, the contribution from field restarts was roughly equal
to the new field start-ups and ramp-ups. However, field start-ups and restarts together do
not fully explain the North Sea’s production turnaround.
Increased production efficiency meant that existing assets delivered higher production
than expected, and helped to reduce decline rates. UK trade association Oil & Gas UK
estimates that production declines from existing fields slowed from 12% to just 4% last year,
as production efficiency rose to over 70% from a low of 60% in 2012.
Digging into production efficiency
It is hardly new news that – until very recently – North Sea production has been in decline for
years, having peaked in 1999-2000. Despite last year’s rebound, the combined output of the UK
and Norway is still roughly 50% below its peak and has shrunk at a 4.6% average annual rate.
A lack of new big field start-ups is only partly to blame for this: indeed, a large part of the North
Sea’s decline over the last 10 years is explained by worsening production efficiency. Production
efficiency (often abbreviated “PE” in the industry) is defined as actual annual production divided
by the maximum production potential of a given field or group of fields.
Production efficiency and
decline
Improvements in production and drilling efficiency in recent years
have masked underlying decline rates
For example, UK production efficiency rose from 60% in 2012 to
71% last year
Production efficiency can’t keep improving forever – some
countries / assets have already reached their maximum potential
North Sea production has
surprised to the upside due
to production efficiency
“Production efficiency”
measures actual output vs
capacity

MULTI-ASSET NATURAL RESOURCES & ENERGY
September 2016
40
Production efficiency reflects planned losses (e.g. for maintenance purposes) as well as
unplanned production losses. 2014 data from the UK Oil & Gas Authority (OGA, previously
called DECC) has shown that unplanned shutdowns makes up nearly 50% of the overall losses
on the UKCS, with planned annual shutdowns representing around 25%, and the rest due to
well work, reservoir and export losses.
Breakdown of average UKCS production losses
Source: UK Oil & Gas Authority
Data has also shown that there is a large and widening gap between best-in-class and worst-in-class
operators in the UK. While the average UKCS field achieved a production efficiency of only 65% in
2014 (implying 35% downtime), best-in-class fields achieved 92% efficiency or 8% downtime.
UKCS production efficiency – average vs best-in-class field
Source: UK Oil & Gas Authority
The biggest difference between leading and lagging fields is the magnitude of unplanned
plant losses: unplanned plant losses are close to 8 times higher at average fields
compared to best-in-class fields. The quality of operator practises, rather than field/platform
age, is a strong predictor of unplanned losses. In other words, this means that improving
plant uptime is largely in operator’s hands.
The second biggest delta between leading and lagging fields comes from export losses.
This factor is somewhat less under operators’ control, as export availability depends on a
platform’s position on the hub network: indirect hubs that rely on third-party hubs to export
oil & gas are likely to suffer more than direct hubs. However, this inter-dependence also
means that uptime improvements at direct hubs can have a positive knock-on impact on
indirect hubs’ production efficiency.
46.7% 43.4%
19.6% 21.2%
12.1% 13.4%
6.2% 8.0%
9.5% 8.7%5.2% 5.1%
0%
10%
20%
30%
40%
50%
60%
70%
80%
90%
100%
2013 2014
Market losses
Planned plant losses
Reservoir losses
Wellwork losses
Export losses
Annual shutdown losses
Unplanned plant losses
92%
65%
2%
15% 5%
0% 10% 20% 30% 40% 50% 60% 70% 80% 90% 100%
Best inClassField
UKCSAverage
Field
Production Unplanned plant losses Annual shutdown losses Wellwork losses
Reservoir losses Planned plant losses Export losses Market losses
Unplanned shutdowns = 50%
of production losses
Operators have strong
influence over production
efficiency

41
MULTI-ASSET NATURAL RESOURCES & ENERGY
September 2016
Data from OGA has revealed that production efficiency on the UKCS was on a steady
downward trend from 2004 to 2012, falling from 81% and bottoming out at 60% (-2.6% per
annum). In response to this trend, the industry and UK government formed the Production
Efficiency Task Force (PETF) in June 2013 to address falling production efficiency. The PETF
set an ambitious production efficiency target of 80% for 2016, rising to 85% from 2017 onwards.
The focus group is taking a three-pronged approach:
1. Improved business processes: challenging and minimising planned downtime,
continually improving reliability by learning from failures.
2. Standardisation in areas such as subsea, valves, well plugging & abandonment.
3. Cooperation and sharing of best practices. This starts with like-for-like accurate
reporting of production efficiency across operators to enable data analysis. The task force
set up a web portal allowing UK asset operators to share successful stories on efficiency
improvements.
“Wrench time” could rise from 30-40% now to 75-80%
One of the four key issues currently being investigated by the PETF is “wrench time”, the
amount of time offshore spent on productive activities, as opposed to non-value adding
activities. Data has shown that as little as 29-38% of offshore operators’ time out of a 12-hour
shift is actually spent on core maintenance, or under 4 hours a day. Meeting, planning,
administration and waiting on other disciplines makes up 40-45% of working time, and various
breaks the remaining 20-25%.
There are significant variances between operators, which points to significant upside as the
laggards catch up with more efficient operators. Industry body Oil & Gas UK estimates that best
practise is six hours of productive time, and in some cases, as many as nine hours. For
instance, BP recently said that it currently gets around 4.5 hours of effective time in an 8-hour
shift in its Norwegian operations. This compares to 11 hours at Norwegian independent Det
Norske. The potential for productivity improvements was likely one of the main drivers behind
the BP-Det Norske tie-up combining the two companies’ Norwegian operations announced in
June. Some operators have already managed to significantly improve wrench time, for instance
Nexen with a 30% increase in productivity in 2015.
Typical breakdown of working day (12-hour shift)
Source: UK Oil & Gas Authority, based on Hitachi Consulting study
17%
9%
13%
29%
8%
8%
8%
8%
Meetings
Planning
Adminstration
Core maintenance
Unofficial breaks
Official breaks
Waiting on other disciplines
Other
UK production efficiency
bottomed at 60% in 2012
<40% of offshore workers’ is
spent on core maintenance
Some companies better than
others at production
efficiency

MULTI-ASSET NATURAL RESOURCES & ENERGY
September 2016
42
There are many aspects of daily offshore operations where simple, incremental changes can
positively affect “wrench time”. For instance, detailed planning and preparation before a
turnaround can ensure that all the necessary materials, equipment and manpower are in place.
Improved systems & procedures, staff training and knowledge sharing can also help. Staff
capabilities are particularly crucial in an offshore environment where shift patterns means that a
single position could be covered by up to six different employees in a month. In response to low
oil prices, many UK operators have already moved to a “three weeks on, three weeks off”
pattern, instead of the traditional “two on, three off”.
Production efficiency rose sharply last year, but more to go
All these initiatives have started to bear fruit: UKCS production efficiency rose to 64-65% in
2013-14 after 8 consecutive years of deterioration, and jumped to over 70% last year. Although
this scale of the improvement is impressive, 2015 production efficiency still came in below the
task force’s target of 75% and is only back to 2009-10 productivity levels. In short, UK offshore
productivity is around halfway back to where it used to be.
UKCS Oil & gas production efficiency
Source: UK Oil & Gas Authority, HSBC estimates
Up to 200kbd UK production upside from efficiency improvements
The OGA’s conservative UKCS production forecasts are based on the assumption that
production efficiency goes backwards in 2016-17e to 67% and 66%, down from ~71% in 2015.
These assumptions are a long way below PETF’s targets of reaching 80-85% efficiency over the
period, and strike us as overly pessimistic. As operating procedures become embedded in day-
to-day practises, we see no reason why offshore productivity should deteriorate in 2016-17.
Assuming a similar rate of improvement in 2016-17e to that seen over the last 3 years (+3.7
ppts per year), we estimate potential upside in UK oil output of 90kbd in 2016 and 140kbd in
2017 vs the OGA’s conservative forecasts, or 110kbd vs the IEA’s more realistic 2017e
production forecast (~11% of UK production). Achieving the PETF’s stretch targets would offer
170-240kbd upside vs the OGA’s forecasts, or 80-210kbd upside vs the IEA’s.
Norway appears to be ahead of the UK on production efficiency
In its annual reviews of the Norwegian Continental Shelf, the Norwegian Petroleum Directorate
(NPD) cites higher regularity as the most important reason behind the production rise on the
NCS in 2014 and 2015, ahead of new field start-ups & ramp-ups and drilling efficiency.
In the last two years, Statoil has managed to halve unplanned losses compared to 2013 levels
down from 10% to just 5%. Production efficiency has increased by 6.5 ppts since 2013 to above
90%, and stands at 92% or more at 15 fields.
81% 80% 79% 77% 76%72% 70%
63% 60%64% 65%
71%67% 66%
80%85%
0%
20%
40%
60%
80%
100%
0
0.5
1
1.5
2
2.5
3
3.5
4
2004 2005 2006 2007 2008 2009 2010 2011 2012 2013 2014 2015 2016e 2017e
Oil Gas Oil upside Gas upside Production efficiency (RHS) PE target ( RHS)
UK production efficiency has
risen to >70%, more to go
Further improvements could
add up to 200kbd to UK oil
output in 2017
Norway ahead of UK; less
room for improvement

43
MULTI-ASSET NATURAL RESOURCES & ENERGY
September 2016
Statoil – Improvements in regularity and production efficiency
Source: Statoil February 2016 presentation
Statoil represents c.70% of Norway’s liquids production, including the Petoro state share. As
such, trends seen at Statoil are probably fairly representative of the NCS as a whole, and we
can probably infer that Norway’s production efficiency is ahead of the UK. However, Norway’s
head-start on the PE front means that there is logically less scope to further improve
performance than on the UK side of the border. Indeed, Statoil expects to maintain production
efficiency at similar or slightly higher levels in 2016 compared to last year, though this will be
offset by higher planned turnaround activity.
Drilling productivity has stemmed decline rates
Achieving better drilling efficiency is another area that offers significant upside potential for
operators, since drilling represents a large share of upstream capital expenditures at around 40-
50% of project costs. Alongside production efficiency, greater drilling productivity has played a
key role behind the improvement in decline rates in mature regions such as the North Sea.
Oil market observers are well aware that drilling spending worldwide has declined materially
since the 2013-14 peak. For instance, spending on development drilling offshore Norway is
expected to fall by 45% in USD terms between 2013 and 2016e (-21% in NOK), according to
the Norwegian Petroleum Directorate. In the UK, development spending in USD terms is set to
fall by 50% between 2014 and 2016e (-40% in GBP).
But looking at spending alone would be misleading: drilling activity levels in the North Sea have
actually increased over the period. The number of development wells rose in the UK from 120 in
2013 to 129 last year, while Norway saw 189 developments wells drilled last year (up from 166
in 2013), the second-highest number on record.
It is clear that higher development drilling activity has been a major factor behind the North
Sea’s surprisingly resilient production performance.
76%
78%
80%
82%
84%
86%
88%
90%
92%
0%
2%
4%
6%
8%
10%
12%
14%
2011 2012 2013 2014 2015 2016e
Unplanned losses as % of production Production efficiency
Drilling efficiency is key
Drilling spending -50% in
Norway since peak, but
activity is up
Higher drilling activity offsets
natural decline

MULTI-ASSET NATURAL RESOURCES & ENERGY
September 2016
44
Development wells drilled per year, UK vs Norway
Source: Norwegian Petroleum Directorate, Oil & Gas Authority
The ramp-up in drilling activity in the North Sea was achieved despite a reduction in the number of
active drilling rigs. The UK rig count fell to from 16-17 rigs in 2013 to 14 last year and has dropped
further to fewer than 9 rigs so far this year. The Norway rig count followed a similar trend to the UK as
it fell from 20 in 2013 to 17 in 2015, but unlike the UK appears to have stabilised this year.
Taken together, the data shows that each rig drilled 45% more wells in Norway and 11% in the
UK last year vs 2012. This supports Statoil’s assertion that it is drilling wells c.30% faster than in
the past, which is equivalent to drilling c.43% more wells.
Rig count, UK vs Norway Total wells drilled per rig, UK vs Norway
Source: Baker Hughes Source: Norwegian Petroleum Directorate, Oil & Gas Authority, Baker Hughes, HSBC estimates
As a result, unit development well costs have fallen by 50% in dollar terms since their 2012
peak in Norway (-31% in NOK terms). If we assume constant rig productivity – i.e. each rig drills
takes 25 days to drill, development well costs would fall by a further 12-15% this year, partly
thanks to cost deflation.
The UK North Sea’s performance has been a little less impressive, with a 26% fall from peak 2013
unit well costs in dollar terms (-24% in GBP). Well costs in Norway were historically significantly
higher than in the UK for various reasons, mainly to do with expensive labour, high specifications
and strict environmental standards and regulations. But over the last couple of years, improved
drilling efficiency coupled with the Norwegian krone depreciation means that it was 30% cheaper
to drill a well in Norway than in UK last year. This reversal of fortune – among other factors – helps
to explain why Norway has overtaken the UK on drilling activity in the last 3 years.
0
50
100
150
200
250
300
350
1964 1967 1970 1973 1976 1979 1982 1985 1988 1991 1994 1997 2000 2003 2006 2009 2012 2015
UK Norway
0
5
10
15
20
25
30
35
1997 2000 2003 2006 2009 2012 2015
UK Norway
0
2
4
6
8
10
12
14
16
18
1997 1999 2001 2003 2005 2007 2009 2011 2013 2015
UK Norway
Fewer rigs at work, but each
rig can drill up to 45% more
wells p.a.
Development wells 50%
cheaper in Norway vs peak

45
MULTI-ASSET NATURAL RESOURCES & ENERGY
September 2016
Development well costs, UK vs Norway (USDm per well)
Source: Norwegian Petroleum Directorate, Oil & Gas Authority, Baker Hughes, HSBC estimates
This isn’t this just a North Sea example – the rest of the world has also improved
We are conscious that we have studied only two non-OPEC producing countries in the above
discussion – UK and Norway. Nonetheless, we think that trends such as increased production
efficiency, drilling productivity etc, apply to many other offshore basins around the world – not
least because global operators (i.e. the Majors) have strived to spread best practises throughout
their upstream portfolio. There is plenty of anecdotal evidence from oil majors under our
coverage pointing to improved operational performance across the board.
For instance, BP has achieved significant improvements in production efficiency and reliability
across its entire portfolio:
Planned outages have reduced by 50% since 2011 partly thanks to improved execution
on turnarounds (i.e. maintenance shutdowns), while plant reliability has increased from
84% to 95%.
BP’s overall operational efficiency has risen from 69% in 2011 to 82% in 2016. The North
Sea, which represents 7-8% of BP’s total production (ex-Rosneft), has seen an
improvement from 72% to 82% in the past two years. Crucially, the small weight of North
Sea production in BP’s portfolio means that there have been significant efficiency gains
elsewhere – in other words, this is categorically not just a North Sea trend.
BP targets an efficiency rate in the mid to high-80’s over the next few years, and assumes a
mid-80’s efficiency rate in its 3-5% decline rate guidance.
0
10
20
30
40
50
60
70
80
90
1997 1998 1999 2000 2001 2002 2003 2004 2005 2006 2007 2008 2009 2010 2011 2012 2013 2014 2015
UK Norway dev well cost ($)
Lessons from North Sea can
be applied to many offshore
regions
BP operating efficiency and plant reliability (%)
Source: Company data (June 2016 Baku field trip presentation)
84%88%
92% 93% 95%
69% 67%
77% 79% 81%82%
0%
10%
20%
30%
40%
50%
60%
70%
80%
90%
100%
2011 2012 2013 2014 2015 2016
Plant reliability Operating efficiency Efficiency target range
MULTI-ASSET NATURAL RESOURCES & ENERGY
September 2016
46
If we believe BP’s guidance, there may well be a further 3-6 ppts upside in its portfolio
operational efficiency over the next several years. This would substantially mitigate natural
decline, as every 1 ppt improvement in production efficiency is broadly equivalent to a 1 ppt
reduction in its decline rate. However, a 3-6 ppt improvement needs to be put into the context of
a 13 ppts increase over the last 5 years.
Don’t be fooled by high individual field efficiency numbers
Moreover, once the company hits its high-80’s efficiency target there will simply not be much
further upside, if at all, as 90-92% production efficiency appears to be a natural limit. There is
anecdotal evidence of certain (best-in-class) fields reaching 97-99% production efficiency
levels. However these levels are reached outside planned maintenance periods and do not
leave much room for any unplanned outages. Across an entire company’s portfolio and over a
full maintenance cycle, we believe the maximum sustainable production efficiency level is
probably 90-92%.
Natural limit to production
efficiency across a whole
portfolio probably 90-92%

47
MULTI-ASSET NATURAL RESOURCES & ENERGY
September 2016
Appendix: What oil companies are saying on decline
Oil majors have strived to maintain their average portfolio decline rates unchanged in a 2-5%
range despite lower investment, notably thanks to greater production efficiency and growth from
long-life assets and unconventionals. However, much of this growth is in gas/LNG, not oil. In
contrast, oil service companies have been notably more vocal about the supply challenges from
rising decline rates. It would be easy to accuse service companies of “talking their own book”,
but we believe the latter are probably closer to the truth.
Company comments on decline – Spot the difference
What the producers are saying What the oil service companies are saying
BP: “By enhancing oil recovery and increasing the amount of drilling we do, we have reduced planned deferrals, increased plant reliability, and established a four-year track record of base decline of less than 3%. For planning purposes, we expect our future base decline to be in the 3% to 5% range. […] we're going to do everything that we can to keep it to the lower end of the 3% to 5% range” – July 2016, 2Q16 conference call
Weatherford: "As well production decline rates accelerate and reservoir productivity complexities increase, our clients will continue to face challenges associated with decreasing the cost of extraction activities and securing desired rates of production. [...] We have long said that after a lag, decline rates would accelerate, that the effects were underestimated and the industry was producing at near capacity, which is something none of us have ever experienced. We'll also add in that the industry will not be able to manage required oil demand as early as 2017." – May 2016, 1Q16 conference call
Shell: “Each particular strategic theme has a different, if you like, challenge in decline rates, with the highest challenge being in the conventional and gas, then deepwater. […] So the total decline rate has been around 5%. It's moved to a 4%, and it's probably heading lower.” – June 2016 Capital Markets Day
Ensco: "When oil prices went up above $80 or $100 a barrel, although a lot of headline attention went to the big new field developments and the FID, what was happening that people were doing a huge amount of in-field work. They were drilling infield wells, recompleting old wells, drilling step-out wells. That has effectively stopped and, as a consequence of that, we're going to start to see, very rapidly, decline rates on existing fields. " – April 2016, 1Q16 conference call
Total: “The average decline in this oil industry is around 5%. By the way, this decline will not be lower if we continue to invest less in the oil industry; it will accelerate the decline. […] We have a decline of around 3.5%” – 4Q15 conference call.
“We are surprised to see actually on our figures a lower-than-expected decline rate at the moment, because we are more in the range of 3% than 3% to 4% at the moment. But going forward, less works on brownfield but more long plateau project[s]; I think we will be able to maintain the 3% decline rate.” – July 2016, 2Q15 conference call
Schlumberger: "[The] apparent resilience in production outside of OPEC and North America is in many cases driven by producers opening the taps wide open to maximise cash flow, which also means that we will likely see higher decline rates after these short-term actions are exhausted. So while the global oil market is still being weighed down by fears of reduced growth in Chinese demand, the magnitude of additional Iranian exports and the continued various trends in global oil inventories, we still expect a positive movement in oil prices during 2016, with specific timing being a function of the shape of the non-OPEC decline rates." – January 2016, 4Q15 conference call
ENI: “Our strategy is keeping 5% our decline. So we are fighting all these numbers through our continual reservoir modelling and petroleum engineering. Basically since the objective was also to reduce costs […], we directed most of our activity in rigless instead of large and heavy work” – 3Q15 conference call
Schlumberger: "Production in North America continues to fall as decline rates are becoming more pronounced, while the mature non-OPEC production is now falling in a number of regions. [...] [The] the magnitude of the E&P investment cuts are now so severe that it can only accelerate production decline and the consequent upward movement in oil price[s]”. – April 2016, 1Q16 conference call
Statoil: “[Decline in Norway] has been around 5%, fairly much the same rate as the international. […] We have offset decline and achieved a production growth due to strong operational performance.” – February 2016.Capital Markets Day
Technip: "There is now a strong consensus that the current investment levels are insufficient to sustain production and we are starting to observe a significant production decline at field, company or even country levels." – July 2016, 2Q16 conference call
Chevron: “We are going to see somewhat higher decline rates. Right now we've been able to maintain our base fully invested at less than 2% including our shale. As we move forward we'd expect to see that probably increase to more like less than 4% not including the shale. But when we add the shale and tight back in we should be in that 1% to 2% range. As projects like Gorgon and Wheatstone come into the base, right now we treat those as major capital projects but as they start production, they add decades-long stable production to us and actually help us with that equation. Shale and tight growth like in the Permian tends to increase your decline rates because obviously the nature of those types of wells have individually high declines. So the balance is we should stay pretty stable to where we are but we will see the uninvested decline rate increase.” – March 2016 Strategy Update
Core Labs: "With long-term worldwide spare capacity near zero, Core believes worldwide producers will not be able to offset the estimated 3.3% net production decline curve rate in 2016, leading to falling global oil production in the year. These net decline curve rates are supported by recent IEA data indicating a decline of 300,000 barrels of production per day from February to March of 2016, which is the third consecutive month of global decline. Core believes crude oil markets rationalise in the second half of 2016 with price stability followed by price increases returning to the energy complex. The immutable laws of physics and thermodynamics mean that the production decline curve always wins, and it never sleeps." – April 2016, 1Q16 conference call
Exxon: “We have an underlying decline, as we include in our 10-K, of about 3%. On top of that we had major project activity.” – February 2016, 4Q15 conference call
“Our decline rate really hasn't changed over the last year since we had guidance last time. It does imply some optimisation that goes along with our base, that I think we are doing actually a better job of today with a little more focus on it. But we have a mix of long-plateau assets and some of the unconventional. And when you kind of combine that portfolio, I think that's still an apt description of where we are in terms of base decline.” – March 2016 Strategy Update
Diamond Offshore: "And then you look at the decline curves that we're experiencing, and many people or many commentators in our space have differing views, but it's anything from 3.8% per year through to maybe 5% or 6%." – June 2016
Source: Company data

MULTI-ASSET NATURAL RESOURCES & ENERGY
September 2016
48
Notes

49
MULTI-ASSET NATURAL RESOURCES & ENERGY
September 2016
Notes

MULTI-ASSET NATURAL RESOURCES & ENERGY
September 2016
50
Disclosure appendix
Analyst Certification
The following analyst(s), economist(s), and/or strategist(s) who is(are) primarily responsible for this report, certifies(y) that the
opinion(s) on the subject security(ies) or issuer(s) and/or any other views or forecasts expressed herein accurately reflect their
personal view(s) and that no part of their compensation was, is or will be directly or indirectly related to the specific
recommendation(s) or views contained in this research report: Kim Fustier, Gordon Gray, Christoffer Gundersen and Thomas C.
Hilboldt
Important disclosures
Equities: Stock ratings and basis for financial analysis
HSBC believes an investor's decision to buy or sell a stock should depend on individual circumstances such as the investor's
existing holdings, risk tolerance and other considerations and that investors utilise various disciplines and investment horizons
when making investment decisions. Ratings should not be used or relied on in isolation as investment advice. Different
securities firms use a variety of ratings terms as well as different rating systems to describe their recommendations and
therefore investors should carefully read the definitions of the ratings used in each research report. Further, investors should
carefully read the entire research report and not infer its contents from the rating because research reports contain more
complete information concerning the analysts' views and the basis for the rating.
From 23rd March 2015 HSBC has assigned ratings on the following basis:
The target price is based on the analyst’s assessment of the stock’s actual current value, although we expect it to take six to 12
months for the market price to reflect this. When the target price is more than 20% above the current share price, the stock will
be classified as a Buy; when it is between 5% and 20% above the current share price, the stock may be classified as a Buy or a
Hold; when it is between 5% below and 5% above the current share price, the stock will be classified as a Hold; when it is
between 5% and 20% below the current share price, the stock may be classified as a Hold or a Reduce; and when it is more
than 20% below the current share price, the stock will be classified as a Reduce.
Our ratings are re-calibrated against these bands at the time of any 'material change' (initiation or resumption of coverage,
change in target price or estimates).
Upside/Downside is the percentage difference between the target price and the share price.
Prior to this date, HSBC’s rating structure was applied on the following basis:
For each stock we set a required rate of return calculated from the cost of equity for that stock’s domestic or, as appropria te,
regional market established by our strategy team. The target price for a stock represented the value the analyst expected the
stock to reach over our performance horizon. The performance horizon was 12 months. For a stock to be classified as
Overweight, the potential return, which equals the percentage difference between the current share price and the target price,
including the forecast dividend yield when indicated, had to exceed the required return by at least 5 percentage points over the
succeeding 12 months (or 10 percentage points for a stock classified as Volatile*). For a stock to be classified as Underweight,
the stock was expected to underperform its required return by at least 5 percentage points over the succeeding 12 months (or
10 percentage points for a stock classified as Volatile*). Stocks between these bands were classified as Neutral.
*A stock was classified as volatile if its historical volatility had exceeded 40%, if the stock had been listed for less than 12
months (unless it was in an industry or sector where volatility is low) or if the analyst expected significant volatility. However,
stocks which we did not consider volatile may in fact also have behaved in such a way. Historical volatility was defined as the
past month's average of the daily 365-day moving average volatilities. In order to avoid misleadingly frequent changes in rating,
however, volatility had to move 2.5 percentage points past the 40% benchmark in either direction for a stock's status to change.
51
MULTI-ASSET NATURAL RESOURCES & ENERGY
September 2016
Rating distribution for long-term investment opportunities
As of 06 September 2016, the distribution of all independent ratings published by HSBC is as follows:
Buy 43% (24% of these provided with Investment Banking Services)
Hold 42% (26% of these provided with Investment Banking Services)
Sell 15% (18% of these provided with Investment Banking Services)
For the purposes of the distribution above the following mapping structure is used during the transition from the previous to
current rating models: under our previous model, Overweight = Buy, Neutral = Hold and Underweight = Sell; under our current
model Buy = Buy, Hold = Hold and Reduce = Sell. For rating definitions under both models, please see “Stock ratings and basis
for financial analysis” above.
For the distribution of non-independent ratings published by HSBC, please see the disclosure page available at
http://www.hsbcnet.com/gbm/financial-regulation/investment-recommendations-disclosures.
To view a list of all the independent fundamental ratings disseminated by HSBC during the preceding 12-month period, please
see the disclosure page available at www.research.hsbc.com/A/Disclosures.
HSBC and its affiliates will from time to time sell to and buy from customers the securities/instruments, both equity and debt
(including derivatives) of companies covered in HSBC Research on a principal or agency basis.
Analysts, economists, and strategists are paid in part by reference to the profitability of HSBC which includes investment
banking, sales & trading, and principal trading revenues.
Whether, or in what time frame, an update of this analysis will be published is not determined in advance.
Economic sanctions imposed by the EU and OFAC prohibit transacting or dealing in new debt or equity of Russian SSI entities.
This report does not constitute advice in relation to any securities issued by Russian SSI entities on or after July 16 2014 and as
such, this report should not be construed as an inducement to transact in any sanctioned securities.
For disclosures in respect of any company mentioned in this report, please see the most recently published report on that
company available at www.hsbcnet.com/research. In order to find out more about the proprietary models used to produce this
report, please contact the authoring analyst.
Additional disclosures
1 This report is dated as at 07 September 2016.
2 All market data included in this report are dated as at close 02 September 2016, unless a different date and/or a specific
time of day is indicated in the report.
3 HSBC has procedures in place to identify and manage any potential conflicts of interest that arise in connection with its
Research business. HSBC's analysts and its other staff who are involved in the preparation and dissemination of Research
operate and have a management reporting line independent of HSBC's Investment Banking business. Information Barrier
procedures are in place between the Investment Banking, Principal Trading, and Research businesses to ensure that any
confidential and/or price sensitive information is handled in an appropriate manner.
4 You are not permitted to use, for reference, any data in this document for the purpose of (i) determining the interest
payable, or other sums due, under loan agreements or under other financial contracts or instruments, (ii) determining the
price at which a financial instrument may be bought or sold or traded or redeemed, or the value of a financial instrument,
and/or (iii) measuring the performance of a financial instrument.
Production & distribution disclosures
1 This report was produced and signed off by the author on 06 Sep 2016 15:05 GMT.
2 In order to see when this report was first disseminated please see the disclosure page available at
https://www.research.hsbc.com/R/34/vzchQwb

MULTI-ASSET NATURAL RESOURCES & ENERGY
September 2016
52
Disclaimer
Legal entities as at 1 July 2016
‘UAE’ HSBC Bank Middle East Limited, Dubai; ‘HK’ The Hongkong and Shanghai Banking Corporation
Limited, Hong Kong; ‘TW’ HSBC Securities (Taiwan) Corporation Limited; 'CA' HSBC Bank Canada,
Toronto; HSBC Bank, Paris Branch; HSBC France; ‘DE’ HSBC Trinkaus & Burkhardt AG, Düsseldorf; 000
HSBC Bank (RR), Moscow; ‘IN’ HSBC Securities and Capital Markets (India) Private Limited, Mumbai;
‘JP’ HSBC Securities (Japan) Limited, Tokyo; ‘EG’ HSBC Securities Egypt SAE, Cairo; ‘CN’ HSBC
Investment Bank Asia Limited, Beijing Representative Office; The Hongkong and Shanghai Banking
Corporation Limited, Singapore Branch; The Hongkong and Shanghai Banking Corporation Limited,
Seoul Securities Branch; The Hongkong and Shanghai Banking Corporation Limited, Seoul Branch;
HSBC Securities (South Africa) (Pty) Ltd, Johannesburg; HSBC Bank plc, London, Madrid, Milan,
Stockholm, Tel Aviv; ‘US’ HSBC Securities (USA) Inc, New York; HSBC Yatirim Menkul Degerler AS,
Istanbul; HSBC México, SA, Institución de Banca Múltiple, Grupo Financiero HSBC; HSBC Bank
Australia Limited; HSBC Bank Argentina SA; HSBC Saudi Arabia Limited; The Hongkong and Shanghai
Banking Corporation Limited, New Zealand Branch incorporated in Hong Kong SAR; The Hongkong and
Shanghai Banking Corporation Limited, Bangkok Branch
Issuer of report
HSBC Bank plc
8 Canada Square
London, E14 5HQ, United Kingdom
Telephone: +44 20 7991 8888
Fax: +44 20 7992 4880
Website: www.research.hsbc.com
In the UK this document has been issued and approved by HSBC Bank plc (“HSBC”) for the information of its Clients (as defined in the Rules of FCA) and those of
its affiliates only. It is not intended for Retail Clients in the UK. If this research is received by a customer of an affiliate of HSBC, its provision to the recipient is
subject to the terms of business in place between the recipient and such affiliate.
HSBC Securities (USA) Inc. accepts responsibility for the content of this research report prepared by its non-US foreign affiliate. All U.S. persons receiving and/or
accessing this report and wishing to effect transactions in any security discussed herein should do so with HSBC Securities (USA) Inc. in the United States and not
with its non-US foreign affiliate, the issuer of this report.
In Singapore, this publication is distributed by The Hongkong and Shanghai Banking Corporation Limited, Singapore Branch for the general information of
institutional investors or other persons specified in Sections 274 and 304 of the Securities and Futures Act (Chapter 289) (“SFA”) and accredited investors and other
persons in accordance with the conditions specified in Sections 275 and 305 of the SFA. This publication is not a prospectus as defined in the SFA. It may not be
further distributed in whole or in part for any purpose. The Hongkong and Shanghai Banking Corporation Limited Singapore Branch is regulated by the Monetary
Authority of Singapore. Recipients in Singapore should contact a "Hongkong and Shanghai Banking Corporation Limited, Singapore Branch" representative in
respect of any matters arising from, or in connection with this report.
In Australia, this publication has been distributed by The Hongkong and Shanghai Banking Corporation Limited (ABN 65 117 925 970, AFSL 301737) for the general
information of its “wholesale” customers (as defined in the Corporations Act 2001). Where distributed to retail customers, this research is distributed by HSBC Bank
Australia Limited (AFSL No. 232595). These respective entities make no representations that the products or services mentioned in this document are available to
persons in Australia or are necessarily suitable for any particular person or appropriate in accordance with local law. No consideration has been given to the
particular investment objectives, financial situation or particular needs of any recipient.
This publication has been distributed in Japan by HSBC Securities (Japan) Limited. It may not be further distributed, in whole or in part, for any purpose. In Hong
Kong, this document has been distributed by The Hongkong and Shanghai Banking Corporation Limited in the conduct of its Hong Kong regulated business for the
information of its institutional and professional customers; it is not intended for and should not be distributed to retail customers in Hong Kong. The Hongkong and
Shanghai Banking Corporation Limited makes no representations that the products or services mentioned in this document are available to persons in Hong Kong or
are necessarily suitable for any particular person or appropriate in accordance with local law. All inquiries by such recipients must be directed to The Hongkong and
Shanghai Banking Corporation Limited. In Korea, this publication is distributed by The Hongkong and Shanghai Banking Corporation Limited, Seoul Securities
Branch ("HBAP SLS") for the general information of professional investors specified in Article 9 of the Financial Investment Services and Capital Markets Act
(“FSCMA”). This publication is not a prospectus as defined in the FSCMA. It may not be further distributed in whole or in part for any purpose. HBAP SLS is
regulated by the Financial Services Commission and the Financial Supervisory Service of Korea. This publication is distributed in New Zealand by The Hongkong
and Shanghai Banking Corporation Limited, New Zealand Branch incorporated in Hong Kong SAR.
This document is not and should not be construed as an offer to sell or the solicitation of an offer to purchase or subscribe for any investment. HSBC has based this
document on information obtained from sources it believes to be reliable but which it has not independently verified; HSBC makes no guarantee, representation or
warranty and accepts no responsibility or liability as to its accuracy or completeness. The opinions contained within the report are based upon publicly available
information at the time of publication and are subject to change without notice. From time to time research analysts conduct site visits of covered issuers. HSBC
policies prohibit research analysts from accepting payment or reimbursement for travel expenses from the issuer for such visits.
Nothing herein excludes or restricts any duty or liability to a customer which HSBC has under the Financial Services and Markets Act 2000 or under the Rules of
FCA and PRA. A recipient who chooses to deal with any person who is not a representative of HSBC in the UK will not enjoy the protections afforded by the UK
regulatory regime. Past performance is not necessarily a guide to future performance. The value of any investment or income may go down as well as up and you
may not get back the full amount invested. Where an investment is denominated in a currency other than the local currency of the recipient of the research report,
changes in the exchange rates may have an adverse effect on the value, price or income of that investment. In case of investments for which there is no recognised
market it may be difficult for investors to sell their investments or to obtain reliable information about its value or the extent of the risk to which it is exposed.
In Canada, this document has been distributed by HSBC Bank Canada and/or its affiliates. Where this document contains market updates/overviews, or similar
materials (collectively deemed “Commentary” in Canada although other affiliate jurisdictions may term “Commentary” as either “macro-research” or “research”), the
Commentary is not an offer to sell, or a solicitation of an offer to sell or subscribe for, any financial product or instrument (including, without limitation, any currencies,
securities, commodities or other financial instruments).
HSBC Bank plc is registered in England No 14259, is authorised by the Prudential Regulation Authority and regulated by the Financial Conduct Authority and the
Prudential Regulation Authority and is a member of the London Stock Exchange. (070905)
© Copyright 2016, HSBC Bank plc, ALL RIGHTS RESERVED. No part of this publication may be reproduced, stored in a retrieval system, or transmitted, on any
form or by any means, electronic, mechanical, photocopying, recording, or otherwise, without the prior written permission of HSBC Bank plc. MCI (P) 094/06/2016,
MCI (P) 085/06/2016 and MICA (P) 021/01/2016
[526500]

Kim Fustier* Analyst HSBC Bank plc +44 20 3359 2136 | [email protected]
Kim Fustier joined HSBC’s Oil & Gas equity research team in London in September 2015. She has covered the European integrated oils sector since 2007, working previously at several international investment banks as an Extel-ranked analyst. Kim has an MSc in Management and Finance from HEC Paris and a BSc in Applied Mathematics from the University of Paris-XI.
Gordon Gray* Global Head of Oil and Gas Equity Research HSBC Bank plc +44 20 7991 6787 | [email protected]
Gordon Gray is Head of the Global Oil and Gas Equity Research team. He has covered the integrated oils sector for over 20 years, working at various investment banks. Gordon ranked second in the Wall Street Journal’s 2012 “Best on the Street” survey of oil and gas analysts. He has an MBA from the Cranfield School of Management and a bachelor of science in mining engineering from the Royal School of Mines in London, and spent seven years in the management of underground mining operations.
Christoffer Gundersen*, CFA Analyst HSBC Bank plc +44 20 7992 1728 | [email protected]
Christoffer Gundersen is an Oil & Gas analyst based in London. Prior to joining the Global Research graduate programme in 2013, he spent 14 months with HSBC’s FX Strategy team covering G10 currencies. He then worked in the Quantitative Research team for a year before taking up his current role. Christoffer holds a first-class honours degree from the University of Bath. He is a CFA charterholder.
Thomas C Hilboldt*, CFAHead of Resources & Energy Research, Asia-Pacific The Hongkong and Shanghai Banking Corporation Limited +852 2822 2922 | [email protected]
Thomas Hilboldt is the Asia-Pacific Head of Resources and Energy Research. He joined HSBC as Asia-Pacific Head of Oil, Gas and Petrochemicals Research in April 2012 before expanding his role in 2016. Tom was ranked the best regional energy analyst in the 2014 AsiaMoney Brokers Poll, while the HSBC Asian Energy research team was top ranked in the 2015 poll. Tom has covered Asian equity markets since 1996, leading country and sector research teams at major global investment banks in Hong Kong and Thailand. He also led a sector research team in a Korean brokerage and ran both equity research and foreign sales in a major Thai bank. Tom has a BSc in finance from the University of Vermont and an MBA from New York University. He is a CFA charterholder.
*Employed by a non-US affiliate of HSBC Securities (USA) Inc, and is not registered/qualified pursuant to FINRA regulations.
Main contributors
Issuer of report:HSBC Bank plc
8 Canada SquareLondon, E14 5HQ, United Kingdom
Telephone: +44 20 7991 8888Fax: +44 20 7992 4880
Website: www.research.hsbc.com