Embed Size (px)
Citation preview

CERA
Oil Sands, Greenhouse Gases, and US Oil SupplyGetting the Numbers Right
Special RepoRt™

We welcome your feedback regarding this iHS ceRa report. please feel free to e-mail us at [email protected] and reference the title of this report in your message.
For clients with access to IHSCERA.com, the following features related to this report may be available online: downloadable data (excel file format); downloadable, full-color graphics; author biographies;
and the adobe pDF version of the complete report.
TERmS Of USE. the accompanying materials were prepared by iHS ceRa inc. content distributed or reprinted must display iHS ceRa’s legal notices and attributions of authorship. iHS ceRa provides the materials “as is” and does not guarantee or warrant the correctness, completeness or currentness, merchantability, or fitness for a particular purpose. all warranties of which are hereby expressly disclaimed and negated. to the extent permissible under the governing law, in no event will iHS ceRa be liable for any direct, indirect, special, incidental, lost profit, lost royalties, lost data, punitive, and/or consequential damages, even if advised of the possibility of same. © 2010, all rights reserved, iHS ceRa inc., 55 cambridge parkway, cambridge, Massachusetts 02142.

About This Report
Purpose. Regulation of GHG emissions is evolving, and policies that consider the full life-cycle emissions of a product are gaining traction. lcFS are charting a new path for regulation in the transportation sector, with direct implications for crude suppliers, particularly for relatively energy-intensive supply sources such as the canadian oil sands. as regulation of crude oil life-cycle GHG emissions moves to the forefront, accurate, verifiable, and consistent reporting of GHG emissions becomes more important. Uniform reporting requirements would create a “level playing field” for sources of oil supply. the outcome of the debate about life-cycle–based regulation will be an important factor in shaping the economic and political playing field for the oil sands industry.
Context. this is the second in a series of reports from the iHS ceRa Canadian Oil Sands Energy Dialogue. the dialogue convenes stakeholders in the oil sands to participate in an objective analysis of the benefits, costs, and impacts of various choices associated with canadian oil sands development. Stakeholders include representatives from governments, regulators, oil companies, shipping companies, and nongovernmental organizations. the 2010 Dialogue program and associated reports cover four oil sands topics:
the role of canadian oil sands in US oil supply•
oil sands, greenhouse gases, and US oil supply: getting the numbers right•
oil sands technology: past, present, and future•
impact of greenhouse gas policies•
these reports and iHS ceRa’s 2009 Multiclient Study Growth in the Canadian Oil Sands? Finding the New Balance can be downloaded at www2.cera.com\oilsandsdialogue.
methodology. this report includes multistakeholder input from a focus group meeting held in calgary on May 14, 2010, and participant feedback on a draft version of the report. iHS ceRa also conducted its own extensive research and analysis both independently and in consultation with stakeholders. iHS ceRa has full editorial control over this report and is solely responsible for the report’s contents (see end of report for a list of participants and the iHS ceRa team).
Structure. this report has six major sections:
Summary of Key insights of iHS ceRa’s analysis•
Part I: Life-Cycle Analysis Is a New Basis for Policy. • What are lcFS? How can lcFS be regulated?
Part II: GHG Emissions from Oil Sands.• How do the GHG emissions from oil sands compare with other sources of crude?
Part III: Challenges of Life-cycle Analysis.• life-cycle analysis is an evolving discipline. What are some of the difficulties of estimating life-cycle emissions of fuels and using these estimates as the basis for policy?
Part IV: Implications of Life-cycle Policy on Oil Sands.• What are implications of lcFS on high carbon crudes like oil sands? How can oil sands “fit” into jurisdictions with lcFS?
appendix: Details of iHS ceRa’s GHG emissions analysis•

© 2010, all rights reserved, iHS ceRa inc. 55 cambridge parkway, cambridge, Massachusetts 02142.
No portion of this report may be reproduced, reused, or otherwise distributed in any form without prior written consent.
OIL SANdS, GREENHOUSE GASES, ANd US OIL SUPPLy: GETTING THE NUmBERS RIGHT
SUmmARy Of KEy INSIGHTS Of IHS CERA’S ANALySIS
Transportation fuels produced solely from oil sands result in well-to-wheels life-cycle greenhouse gas (GHG) emissions 5 to 15 percent higher than the average crude refined in the United States. Well-to-wheels emissions include those produced during crude oil extraction, processing, distribution, and combustion in an engine. Many analyses of oil sands GHG emissions focus on emissions in the extraction through refining phases, also known as the well-to-retail pump portion of the life cycle. However, 70 to 80 percent of GHG emissions for all sources of crude oil, including oil sands, occur at the combustion phase. combustion emissions do not vary for a given fuel among sources of crude oil. oil suppliers influence only the well-to-retail pump emissions, which account for 20 to 30 percent of total life-cycle GHG emissions.
The average oil sands import to the United States has well-to-wheels life-cycle GHG emissions about 6 percent higher than the average crude refined in the United States. in 2009 oil sands products imported to the United States were 45 percent synthetic crude oil (Sco) and 55 percent bitumen blends. Bitumen is diluted to make the mixed product “lighter,” lowering the viscosity enough for the blend to be shipped in a pipeline. Most often, bitumen blends have lower life-cycle emissions than bitumen because only 70 percent of the barrel is derived from oil sands. over the past five years the GHG intensity of US oil sands imports has been steady, and over the next two decades the average is projected to remain steady or decrease slightly.
Life-cycle analysis of GHG emissions is becoming a new basis for policy in the transportation sector. Many regulations designed to reduce GHG emissions from transportation focus on the fuel economy of vehicles—the distance they can travel on a given volume of fuel. life-cycle policies instead call for reductions in the well-to-wheels emissions associated with the fuel itself, meaning that improving vehicle fuel economy is not an option to achieve compliance. low-carbon fuel standards (lcFS) are an example of this type of regulation. lcFS are in place in california, British columbia, and the european Union, and are under consideration in other jurisdictions. North american jurisdictions implementing or considering lcFS policies represent 34 percent of the US gasoline market and close to 50 percent of the canadian gasoline market.
Compliance with LCfS policies will require substantial volumes of alternative fuels. lcFS in place today call for reductions in life-cycle GHG emissions of up to 10 percent from the current average within a decade. as oil suppliers control only 20 to 30 percent of the well-to-wheels emissions of petroleum fuel, a 10 percent reduction would require suppliers to cut the emissions from crude oil extraction, processing, and distribution by one-third to one-half. Reducing emissions by this large of a margin is not practical for any fuel derived from crude oil. in effect lcFS are alternative fuel standards that require lower-carbon biofuels, natural gas, and electricity to displace oil for transportation use. oil sands crudes will require about twice the volume of low-carbon fuels to offset emissions as compared with the average crude. over the next decade limited availability of low-carbon alternative fuels, the vehicles to consume them, and the infrastructure for fuel distribution will make achieving lcFS mandates difficult, no matter what sources of crude oil are used to produce transportation fuels.

Life-cycle analysis is an evolving discipline that must deal with a number of uncertainties, making it a challenging basis for policy. estimates of well-to-retail pump GHG emissions from a single fuel can vary by more than 10 percent on a well-to-wheels basis. this variance is larger than the GHG emissions reductions that some lcFS require. additionally, regulating life-cycle emissions requires a trade-off between the complexity of regulation and the level of incentive that it provides for emissions reductions. establishing broad categories of transportation fuels makes a regulation easier to manage, but more granular regulation of individual fuels provides more incentive for fuel producers to reduce their emissions. Finally, regulations based on the GHG-intensity of fuels do not guarantee an overall reduction in GHG emissions from the transportation sector. Regulations that focus on all three factors influencing transportation GHG emissions—vehicle efficiency, fuel properties, and demand for transportation—are likely to achieve the greatest emissions reductions.
To implement GHG life-cycle policy for petroleum, the data quality and availability must improve; accurate measurement, verification, and reporting across all sources of oil supply must emerge. Without such a system, canadian oil sands could be unduly penalized for being more transparent about their GHG emissions compared with crude oil from other jurisdictions. if policies that target life-cycle emissions are not based on accurate life-cycle GHG data, they could result in unintended consequences, such as shifting emissions to supply sources with mischaracterized levels of GHG emissions.
—September 2010

1
IHS CERA Special Report
© 2010, iHS ceRa inc. No portion of this report may be reproduced, reused, or otherwise distributed in any form without prior written consent.
OIL SANdS, GREENHOUSE GASES, ANd US OIL SUPPLy: GETTING THE NUmBERS RIGHT
The oil sands industry has met the challenge of turning a once uneconomic, unconventional resource into an important pillar of North American and world oil supply. Oil sands are poised to become the largest source of US crude oil imports by the end of 2010. The oil sands story is very much one of overcoming both economic and technical challenges, but additional challenges remain. Evolving policy to reduce GHG emissions from the transportation sector in the United States, Canada, and elsewhere poses a new test for all sources of hydrocarbon supply, but particularly for the oil sands because of their higher carbon intensity.
The objective of this report is to provide an independent perspective on the life-cycle GHG emissions of oil sands compared with other crudes; on the evolving discipline of estimating life-cycle GHG emissions, particularly for oil sands; and on the growing trend of using life-cycle GHG analysis in policy. These policies have the potential to affect the market for Canadian oil sands and other sources of carbon-intensive crude oil.
The first part of this report focuses on understanding how life-cycle GHG analyses are being used to shape transportation fuel policy. The second part clarifies how the GHG emissions from oil sands–derived fuels differ from other sources of fuel (incorporating new data since the analysis published in our May 2009 study, Growth in the Canadian Oil Sands? Finding the New Balance). The third part describes several challenges in estimating the life-cycle GHG emissions of fuels, including data quality and availability and consistent system boundaries. The final part describes the potential implications of life-cycle–based regulation on crude oil, including the oil sands. Finally the appendix provides more details about IHS CERA’s GHG analysis methodology.

2 © 2010, iHS ceRa inc.
No portion of this report may be reproduced, reused, or otherwise distributed in any form without prior written consent.
IHS CERA Special Report
Oil Sands 101
the immensity of the oil sands is their signature feature. current estimates place the amount of oil that can be economically recovered from alberta’s oil sands at 170 billion barrels, second only to Saudi arabia. canada’s oil sands are concentrated in three major deposits. the largest is the athabasca, a large region around Fort McMurray in northeastern alberta. the other two areas are peace River in northwest alberta and cold lake, east of edmonton.
the oil sands are grains of sand covered with water, bitumen, and clay. the “oil” in the oil sands comes from bitumen, an extra-heavy oil with high viscosity. Given their black and sticky appearance, the oil sands are also referred to as “tar sands.” tar, however, is a man-made substance derived from petroleum or coal. oil sands are unique in that they are produced via both surface mining and in-situ thermal processes.
mining.• about 20 percent of currently recoverable oil sands reserves lie close enough to the surface to be mined. in a strip-mining process similar to coal mining, the overburden (primarily soils and vegetation) is removed, and the layer of oil sands is excavated using massive shovels that scoop the sand, which is then transported by truck, shovel, or pipeline to a processing facility. Slightly more than half of today’s production is from mining, and we expect this proportion to be roughly steady through 2030.
In-situ thermal processes.• about 80 percent of the recoverable oil sands deposits are too deep to be mined and are recovered by drilling methods. thermal methods inject steam into the wellbore to lower the viscosity of the bitumen and allow it to flow to the surface. Such methods are used in oil fields around the world to recover very heavy oil. two thermal processes are in wide use in the oil sands today: steam-assisted gravity drainage (SaGD) and cyclic steam stimulation. SaGD made up about 15 percent of 2009 production and is expected to grow to more than 40 percent of oil sands production by 2030. innovations in thermal recovery methods have reduced the amount of energy needed to recover bitumen, and such innovations are likely to continue in the future.
Raw bitumen is solid at ambient temperature and cannot be transported in pipelines or processed in conventional refineries. it must first be diluted with light oil liquid or converted into a synthetic light crude oil. Several crude oil–like products are produced from bitumen, and their properties differ in some respects from conventional light crude oil.
Upgraded bitumen—SCO• is produced from bitumen via refinery conversion units that turn very heavy hydrocarbons into lighter, more valuable fractions. although Sco can be sour, typically Sco is a light, sweet crude oil with no heavy fractions, with api gravity typically greater than 33 degrees.
diluted bitumen (dilbit)• is bitumen mixed with a diluent, typically a natural gas liquid such as condensate. this is done to make the mixed product “lighter,” lowering the viscosity enough for the dilbit to be shipped in a pipeline. Some refineries will need modifications to process large amounts of dilbit feedstock, because it requires more heavy oil conversion capacity than most crude oils. Dilbit is also lower quality than most crude oils, containing higher levels of sulfur and aromatics.
Synbit• is typically a combination of bitumen and Sco. the properties of each kind of synbit blend vary significantly, but blending the lighter Sco with the heavier bitumen results in a product that more closely resembles conventional crude oil than Sco or dilbit alone.
dilsynbit• is a combination of bitumen and heavy conventional crudes blended with condensate and Sco, resulting in a product that more closely resembles conventional crude oil than Sco or dilbit.

3
IHS CERA Special Report
© 2010, iHS ceRa inc. No portion of this report may be reproduced, reused, or otherwise distributed in any form without prior written consent.
PART I: LIfE-CyCLE ANALySIS IS A NEw BASIS fOR POLICy
The world’s increasing focus on climate change and reducing GHG emissions has brought new attention to the transportation sector. Transportation makes up 28 percent of US GHG emissions and 14 percent of global GHG emissions. Since petroleum makes up 93 percent of global transportation fuel, the quest to reduce GHG emissions from the transportation sector focuses on replacing petroleum or using it in ways that create fewer GHG emissions. Policy surrounding GHG emissions in transportation is crucial to oil producers, since road transportation accounts for more than 40 percent of world oil demand.
The factors that influence GHG emissions from the transportation sector can be depicted as a three-legged stool, consisting of vehicle fuel economy, fuel properties, and total demand for transport (see Figure 1). Policies that aim to reduce transportation sector GHG emissions can focus on one or more legs of the stool. For example, fuel economy standards focus on the vehicle—on the efficiency of engines, the size of vehicles, and how much fuel it takes to travel a given distance. The federal renewable fuel standard (RFS2) in place today in the United States focuses on the fuel by mandating that specified volumes of biofuels be blended into transportation fuels. Policies that focus on the demand for transport include fuel taxes; congestion charges for drivers that enter inner cities; pay-as-you-drive insurance; urban planning to reduce the need for travel; and subsidizing or encouraging mass transit use, carpooling, or alternatives to transportation such as telecommuting.
��������
��������������������������������������������������������
������������������������
�������������������������
����������������� ����
����������
��������������������������������

4 © 2010, iHS ceRa inc.
No portion of this report may be reproduced, reused, or otherwise distributed in any form without prior written consent.
IHS CERA Special Report
wHAT IS LIfE-CyCLE ANALySIS ANd HOw dOES IT RELATE TO TRANSPORTATION?
New methods are being developed to better understand and keep track of GHG emissions. One method is life-cycle analysis, which aims to account for all of the GHG emissions associated with a product, from its production through its use. For petroleum transportation fuels, life-cycle analysis encompasses GHG emissions from producing crude oil, refining it into useful products, transporting crude oil and refined products, and combusting the fuel in an engine—often referred to as a “well-to-wheels” analysis.
This method of tracking all GHG emissions associated with a fuel is beginning to enter the realm of transportation policy. Policy based on life-cycle analysis focuses on the fuel leg of the stool, aiming to reduce all emissions attributable to the fuel, not just those released at the tailpipe.
Regulation of life-cycle GHG emissions began in the realm of biofuels. The US Congress passed the Energy Independence and Security Act in 2007, requiring that biofuels achieve specified reductions in life-cycle GHG intensity in comparison with the petroleum fuels they replace (see the box “How Is Policy Based on Life-cycle GHG Emissions Regulated? The RFS2 Example”).
LCFS are another form of regulation that relies on life-cycle analysis. LCFS require a reduction in the life-cycle GHG intensity of all types of transportation fuel, not just biofuels. A reduction in life-cycle GHG intensity means reducing the total GHG emissions associated with producing and using transportation fuel, from the oil production well or farmer’s field through refining, raw material and finished product transport, and combustion of the fuel in a vehicle’s engine. LCFS aim to promote transportation fuels with lower life-cycle GHG emissions without choosing a specific “winning” technology.
LCFS are likely to be most effective in reducing transportation GHG emissions when applied in concert with fuel economy standards and policies that aim to reduce distance traveled, since LCFS alone will not guarantee an absolute decrease in transportation GHG emissions. LCFS require reduced GHG intensity of each unit of fuel by a specified margin; but if the amount of fuel consumed increases, GHG emissions from the transportation sector can still grow. A suite of policies that covers all three factors influencing transportation emissions is required to ensure a reduction in transportation sector emissions.
LCfS Compared to Cap-and-Trade
LCFS have some important differences from other common ways of regulating GHG emissions. Cap-and-trade policies target GHG reductions across multiple sectors of the economy and are not limited to the transportation sector. They constrain GHG emissions in regulated sectors to a maximum limit or cap and establish a market-based price allowing trading of the right to emit GHG. In contrast LCFS are intensity-based regulations that do not limit total emissions from the transportation sector. The “trade” portion of cap-and-trade policies encourages regulated industries to exploit the least-expensive GHG reductions first. Transportation emissions are typically not the cheapest GHG reductions, meaning that with cap-and-trade policy alone, significant reductions in GHG emissions from the transportation

5
IHS CERA Special Report
© 2010, iHS ceRa inc. No portion of this report may be reproduced, reused, or otherwise distributed in any form without prior written consent.
How Is Policy Based on Life-cycle GHG Emissions Regulated? The RfS2 Example
RFS2, the US Federal Renewable Fuels Standard, requires the United States transportation sector to consume 2.35 million barrels per day (mbd) of biofuels by 2022. the 2007 revision introduced new categories of renewable fuels and set separate volume requirements and life-cycle GHG emissions reduction thresholds for each. these categories are
Renewable fuel.• Requires a 20 percent reduction in life-cycle GHG emissions from the 2005 baseline for gasoline or diesel, whichever it replaces.
Biomass-based diesel.• Requires a 50 percent reduction in life-cycle GHG emissions from the 2005 diesel baseline.
Advanced biofuel.• Biofuel made from feedstock other than corn starch that achieves a 50 percent reduction in life-cycle GHG emissions from the 2005 gasoline or diesel baseline.
Cellulosic biofuel.• Biofuel made from cellulosic materials that achieves a 60 percent reduction in life-cycle GHG emissions from the 2005 gasoline or diesel baseline.
congress charged the US environmental protection agency (epa) with implementing RFS2, including determining which fuels comply with the life-cycle GHG performance thresholds and developing a system for administering the standard and ensuring compliance. the RFS2 regulation, developed in collaboration with refiners, renewable fuel producers, and many other stakeholders, went into effect on July 1, 2010.
Classifying biofuels for compliance.• although congress established in legislation the biofuels categories and their required GHG reductions, it was up to the epa to determine how to classify various biofuel sources. to make these determinations, epa modeled the full life cycle of various transportation fuels, including emissions from international land use changes resulting from increased biofuel demand. epa incorporated numerous modifications to its proposed approach based on comments from the public and a formal peer review. Using this process, the epa established which combinations of feedstock and production methods fall into which compliance category. For example, epa modeling results show that sugarcane ethanol produced in Brazil qualifies as advanced biofuel.
Tracking biofuels to ensure compliance.• once a feedstock is processed into a biofuel, it is difficult to determine how the biofuel was made. For example, ethanol produced from corn is chemically the same as ethanol from sugarcane. therefore, epa established a system to generate and trade program credits for compliance. these credits are called renewable identification numbers (RiNs). RiNs are associated with volumes of biofuels produced that meet the four renewable fuel categories, and parties demonstrate compliance by producing the required number of RiNs or acquiring them through a trading program.
Accounting for changes in life-cycle knowledge.• the assessment of life-cycle GHG emissions is an evolving discipline. as the state of scientific knowledge changes, life-cycle emissions estimates for some sources of fuel may change. if new knowledge changes the compliance status of a fuel source, the new status would be applied only to future production from plants built after the new status was established in regulation. essentially, once a fuel meets a compliance category, existing production is “grandfathered” into that category. this provision provides regulatory certainty to biofuel producers.
in establishing this regulation, the epa has demonstrated how it intends to regulate transportation fuel based on life-cycle GHG emissions. Grouping sources of fuel into broad categories based on their production method and emissions reduces the complexity of the regulation. However, these categories remove the incentive for individual renewable fuel suppliers to reduce their life-cycle GHG emissions once they have achieved the required threshold.

6 © 2010, iHS ceRa inc.
No portion of this report may be reproduced, reused, or otherwise distributed in any form without prior written consent.
IHS CERA Special Report
sector are not likely. LCFS policies are intended to drive GHG reductions in the transportation sector beyond those that would result from a cap-and-trade policy. In a sense LCFS place a higher value on GHG emissions from the transportation sector than on those from other segments of the economy, since LCFS require emissions reductions from transportation that are likely to be more expensive than other reductions available in the economy—for instance concentrated stationary GHG emissions from industrial facilities. The combination of LCFS with other policies to regulate GHG emissions means that some sources of emissions are likely to be regulated in multiple ways. This situation is not unique, however, and is likely to occur in other sectors also as GHG policies expand.
Jurisdictions Adopting LCfS on the Rise
As regulation of GHG emissions moves to the forefront, several jurisdictions have established LCFS. In the United States LCFS went into effect in California on January 12, 2010.1 This standard requires a 10 percent reduction in the GHG intensity of transportation fuel sold in the state by 2020. In Canada, British Columbia has passed a similar standard, also requiring a 10 percent decrease. In the European Union the new fuel directives agreed upon in late 2008 include an LCFS provision that calls for a 6 percent decrease in the carbon intensity of transportation fuels by 2020. Implementing regulations for the directive are in progress.
Other jurisdictions are considering LCFS as well. The governors of 11 states in the US Northeast and Mid-Atlantic signed a letter of intent at the end of 2009 to create LCFS, and LCFS are also under consideration in the states of Oregon and Washington.2 An LCFS is also under consideration in Ontario. States and provinces implementing or considering LCFS make up 34 percent of the US gasoline market and nearly 50 percent of the Canadian gasoline market.
Today Canadian oil sands are primarily sold and marketed in Canada and the United States, with very limited infrastructure available to export to other markets. Therefore, if these types of policies become more common in both the United States and Canada, the implications for the oil sands industry will become critically important, as will the implications for US energy security.
1. Ongoing lawsuits are challenging California’s LCFS on the basis of conflict with the Federal Energy Independence and Security Act of 2007 and interference with interstate commerce.2. The states that signed the letter of intent are Connecticut, Delaware, Maine, Maryland, Massachusetts, New Hampshire, New Jersey, New York, Pennsylvania, Rhode Island, and Vermont. Each state would need to implement its own regulation, as there is no regional body with such authority.

7
IHS CERA Special Report
© 2010, iHS ceRa inc. No portion of this report may be reproduced, reused, or otherwise distributed in any form without prior written consent.
PART II: GHG EmISSIONS fROm OIL SANdS
Concerns about climate change have intensified the worldwide debate about oil resource development, pushing the debate on development of the Canadian oil sands to center stage. But how do the life-cycle GHG emissions of Canadian oil sands compare with other sources of crude oil? Is current data on GHG emissions transparent and complete enough to support the adoption of sound public policy? Canadian oil sands face a greater risk from regulations based on life-cycle emissions because their GHG emissions are greater than many, but not all, sources of oil consumed in the United States.
HOw dO OIL SANdS LIfE-CyCLE EmISSIONS COmPARE TO OTHER SOURCES Of CRUdE OIL?
To evaluate the life-cycle GHG emissions of conventional and unconventional crude oils, IHS CERA conducted a meta-analysis of 13 publicly available life-cycle studies.1
A meta-analysis combines and analyses the results of multiple studies with the goal of providing more accurate data than any single study (see the Appendix for more information on IHS CERA’s meta-study methodology).
Awareness of where and how GHG emissions occur in the petroleum fuel life cycle is crucial to understanding the differences in emissions among crudes. When GHG emissions are viewed on a well-to-wheels basis, the emissions released during the combustion of refined products (such as gasoline and diesel) make up 70 to 80 percent of total emissions (see Figure 2). The combustion emissions do not vary with the origin of the crude. For example, tailpipe GHG emissions from an automobile are the same whether the gasoline is made from Saudi light crude, West Texas Intermediate crude, heavy Venezuelan crude, or Canadian oil sands.2
Consequently the variability in life-cycle emissions among petroleum fuels occurs in the well-to-retail pump portion of the life cycle—the portion upstream of the vehicle tank.3 Much of the public debate about oil sands GHG emissions focuses on the well-to-retail pump segment, which constitutes 20 to 30 percent of total emissions. The emissions for
1. IHS CERA has updated the GHG meta-analysis originally published in May 2009 with data from recent studies that Energy and Environment Solutions, Alberta Innovates (formerly Alberta Energy Research Institute) commissioned: Life Cycle Assessment Comparison of North American and Imported Crudes, Jacobs Consultancy, July 2009 and Comparison of North American and Imported Crude Oil Lifecycle GHG Emissions, TIAX LCC, July 2009. Other data sources include: Development of Baseline Data and Analysis of Life Cycle Greenhouse Gas Emissions of Petroleum-Based Fuels, US Department of Energy/National Energy Technology Laboratory (DOE/NETL), November 2008; “Typical Heavy Crude and Bitumen Derivative Greenhouse Gas Life Cycles,” McCann and Associates, November 2001; Unconventional Fossil-Based Fuels: Economic and Environmental Trade-Offs, RAND Corporation, 2008; Canadian Oil Sands: Opportunities and Challenges, National Energy Board (NEB), Canada, 2006; Environmental Challenges and Progress in Canada’s Oil Sands, Canadian Association of Petroleum Producers (CAPP), 2008; Greenhouse Gases, Regulated Emissions, and Energy Use in Transportation model, Version 1.8b, September 2008; GHGenius, 2007 Crude Oil Production Update, Version 3.8; 2009/10 Sustainability Report, Syncrude Canada Ltd.; The Shell Sustainability Report, 2006, Shell; IHS CERA data.2. Combustion emissions do very slightly among vehicles running on the same type of fuel.3. Well-to-retail pump covers GHG emissions from oil production, processing, and distribution of refined products to the retail pump. It excludes combustion of refined products.

8 © 2010, iHS ceRa inc.
No portion of this report may be reproduced, reused, or otherwise distributed in any form without prior written consent.
IHS CERA Special Report
the well-to-retail pump portion of the value chain differ among crudes because of varying energy requirements for crude oil production, upgrading, transport, and refining.
IHS CERA found that when GHG emissions are viewed on a life-cycle basis (well-to-wheels), the emissions from refined products wholly derived from oil sands are 5 to 15 percent higher than the average crude consumed in the United States. These bookend values represent a 5 percent average for mining and a 15 percent average for in-situ production. They do not encompass all possible oil sands emissions, but instead represent average values to use for comparison with other crude oil sources. Although oil sands–derived crudes are more carbon-intensive than the average crude oil consumed in the United States, they are one among several. Other carbon-intensive crude oils are produced, imported, or refined in the United States (see Figure 3).
In 2009 oil sands products processed in the United States were 45 percent SCO and 55 percent bitumen blends. The majority of US SCO imports come from mining operations with well-to-wheels GHG emissions that are 6 percent higher than the average crude. The most common bitumen blend is dilbit, a combination of bitumen and diluents, such as natural gas condensates. Dilbit has lower life-cycle emissions than bitumen because only 70 percent of the dilbit barrel is derived from oil sands. On average, oil sands products processed in the United States result in well-to-wheels GHG emissions about 6 percent higher than the average crude consumed in the United States.1 Over the past five years the GHG intensity of US oil
1. This is a best estimate and not a precise number. Many types of blends and qualities of SCO are exported, and the available data does not track exports at this level of granularity.
������������������������������������������������������������������������������
��������
������������������������
������������
�����������������
������������������
������������
��������� ��������������
���������
������������
������� �������
������������������������
��������������������������������������������������������������
���������������������������
������������ ������������������������

9
IHS CERA Special Report
© 2010, iHS ceRa inc. No portion of this report may be reproduced, reused, or otherwise distributed in any form without prior written consent.
sands imports has been steady, and it is expected to remain steady or decrease somewhat over the next 20 years as the energy efficiency of oil sands operations improves.1
1. Over the next 20 years the mix of US oil sands imports is projected to shift. Some imports will become more carbon intensive. For instance, as of 2010 Midwest refiners have the option to refine some “bitumen only” oil sands. A condensate recycle pipeline started in 2010 allows refiners to recycle diluent rather than refining it. Meanwhile, other imports will become less carbon intensive—new mining projects without upgraders will increase the imports of lower-carbon oil blends. We project the average carbon intensity of oil sands blends in 2030 to remain about the same as today.
��������
���������������������������������������������������������������������
����������������������������������������������������������������������������������������������������������������������������������������������������������������������������������������������������������������������������������������������������������������������������������������������������������������������������������������������������������������������������������������������������������������������������������������������������������������������������������������������������������������������������������������������������������������������������������������������������������������������������������������������������������������������������������������������������������������������������������������������������������������������
���� ��� ��� ��� ���
������������������� ���������������
���
��������������������������������������
����������������
�����������������������
����������������������������
��������������������
���������������������������
��������������������������������
�������������������
������������������������������
���������������������������������������������������
�������������������������������
����������������������������������
��������������������
���������������������������������
���������������������������������
�����������
��������������������������������
������������������
��������������������������
�����������������������

10 © 2010, iHS ceRa inc.
No portion of this report may be reproduced, reused, or otherwise distributed in any form without prior written consent.
IHS CERA Special Report
IHS CERA’s comparison of publicly available life-cycle analysis studies found that fuel produced from oil sands mining has well-to-retail pump emissions 1.3 times the average fuel consumed in the United States. Similarly fuel produced from oil sands by in-situ methods has well-to-retail pump GHG emissions 1.6 times larger than the average fuel consumed in the United States (see Figure 4).1 These values correspond to a 5 to 15 percent difference in well-to-wheels emissions, because a majority of emissions occur in the combustion phase, where emissions do not vary among sources of crude oil. In-situ production generally has higher life-cycle GHG emissions than mining because of the steam that must be produced for in-situ extraction. However, in-situ operators have been reducing the amount of steam required to produce each barrel of oil sands over time. The average amount of steam used today per unit of output is about 15 percent lower than the original operations which started less than a decade ago. Technology is expected to continue to improve, enabling greater energy efficiency and thus lower GHG emissions.
Understanding differences in GHG Intensity
A wide range of reported values compare the GHG intensity of oil sands with other crudes. Some other studies state that the “gap” between oil sands crudes and others is much higher than the IHS CERA analysis. What are some of the main drivers for the differences between these reports and our analysis?
One difference is that some studies only compare GHG emissions from part of the life cycle. Some studies state GHG emissions from oil sands are three times greater than conventional crudes. Although not always stated, these studies compare only the emissions from producing
1. These comparisons represent today’s mining and in-situ technology compared to the 2005 baseline provided by the US NETL in Development of Baseline Data and Analysis of Life Cycle Greenhouse Gas Emissions of Petroleum-Based Fuels, November 2008.
How do Emissions for dilbit Stack Up?
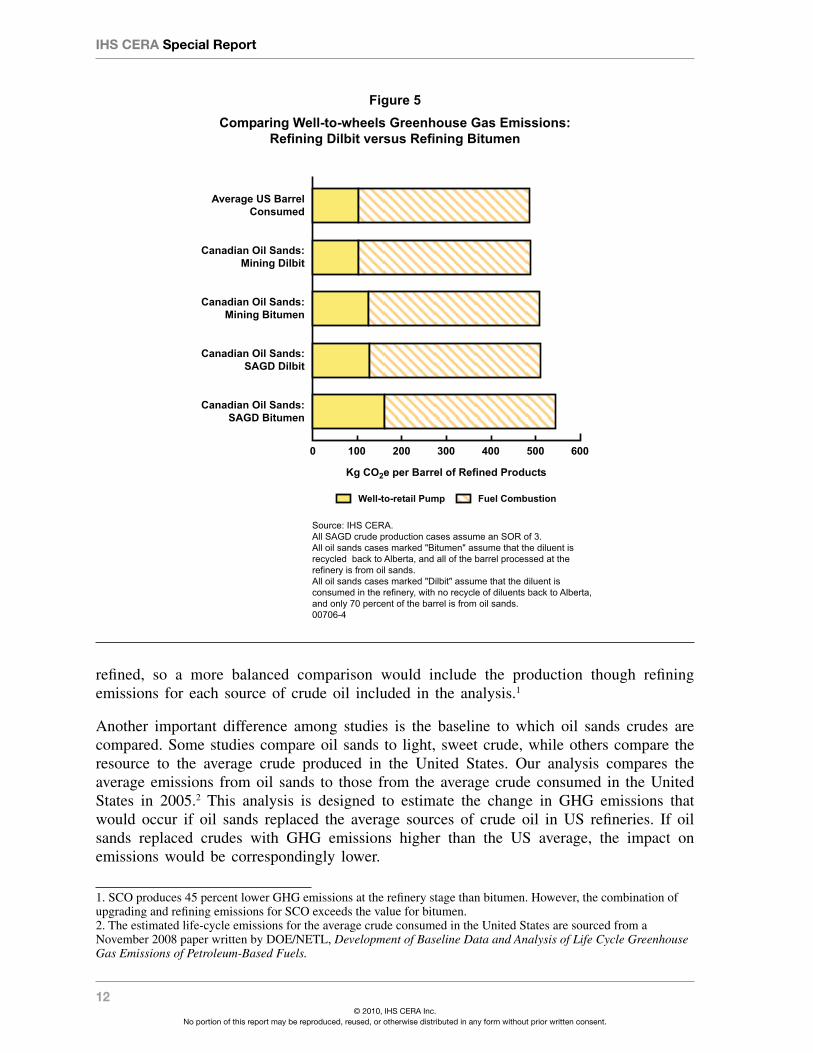
Bitumen is too viscous to transport through pipelines at ambient temperatures—it must be diluted to lower its viscosity for transportation. Diluted bitumen is called dilbit. Natural gas liquids, such as condensates, are used to dilute the bitumen. the life-cycle carbon emissions described above are for crude oil derived entirely from oil sands. How do these emissions compare to the life-cycle emissions of dilbit?
producing a barrel of condensate emits one fifth of the GHG emissions associated with producing the same volume of bitumen; and refining a barrel of condensate emits one third of the GHG emissions associated with refining bitumen. therefore, when the raw bitumen is diluted with the less carbon-intensive condensate, the resulting barrel of dilbit has lower life-cycle emissions than a barrel of bitumen.
Figure 5 compares the GHG emissions for a barrel of products produced from dilbit with those for a barrel of products produced from bitumen. the GHG emissions of a barrel of refined products produced from mining dilbit are 0.1 percent greater on a well-to-wheels basis than the average crude consumed in the United States, compared with 5 percent for bitumen. For dilbit produced from SaGD, the well-to-wheel emissions are 5 percent greater than the average crude consumed in the United States, compared with 12 percent for bitumen.

11
IHS CERA Special Report
© 2010, iHS ceRa inc. No portion of this report may be reproduced, reused, or otherwise distributed in any form without prior written consent.
the oil. Other studies state that GHG emissions from oil sands are five times greater than conventional crudes. Often, these studies compare the emissions from producing bitumen and upgrading it to SCO to the emissions from producing conventional oil. SCO is partially
��������
��������������������������������������������������������������������������
�����������������������������������������������������������������������������������������������������������������������������������������������������������������������������������������������������������������������������������������������������������������������������������������������������������������������������������������������������������������������������������������������������������������������������������������������������������������������������������������������������������������������������������������������������������������������������������������������������������������������������������������������������������������������������������������������������������������������������������������������������������
���� �� ��� ���
��������������������������������������
���������������� ���������������
��������������� ��������������
��������������������������������
����������������
�����������������������
����������������������������
��������������������
���������������������������
��������������������������������
�������������������
������������������������������
���������������������������������������������������
�������������������������������
����������������������������������
��������������������
���������������������������������
���������������������������������
�����������
��������������������������������
������������������
��������������������������
�����������������������
12 © 2010, iHS ceRa inc.
No portion of this report may be reproduced, reused, or otherwise distributed in any form without prior written consent.
IHS CERA Special Report
refined, so a more balanced comparison would include the production though refining emissions for each source of crude oil included in the analysis.1
Another important difference among studies is the baseline to which oil sands crudes are compared. Some studies compare oil sands to light, sweet crude, while others compare the resource to the average crude produced in the United States. Our analysis compares the average emissions from oil sands to those from the average crude consumed in the United States in 2005.2 This analysis is designed to estimate the change in GHG emissions that would occur if oil sands replaced the average sources of crude oil in US refineries. If oil sands replaced crudes with GHG emissions higher than the US average, the impact on emissions would be correspondingly lower.
1. SCO produces 45 percent lower GHG emissions at the refinery stage than bitumen. However, the combination of upgrading and refining emissions for SCO exceeds the value for bitumen.2. The estimated life-cycle emissions for the average crude consumed in the United States are sourced from a November 2008 paper written by DOE/NETL, Development of Baseline Data and Analysis of Life Cycle Greenhouse Gas Emissions of Petroleum-Based Fuels.
��������
�����������������������������������������������������������������������������������������
������������������������������������������������������������������������������������������������������������������������������������������������������������������������������������������������������������������������������������������������������������������������������������������������������������������������������������������������������������������������������������������������������������������������������
� ��� ��� ��� ��� ���
������������������� ���������������
���
��������������������������������������
�������������������������������
������������������������������
���������������������������������
��������������������������������
�������������������������

13
IHS CERA Special Report
© 2010, iHS ceRa inc. No portion of this report may be reproduced, reused, or otherwise distributed in any form without prior written consent.
Scale of Oil Sands Emissions in a Canadian and Global Context
iHS ceRa estimates that in 2009 carbon dioxide (co2) emissions from oil sands extraction and upgrading constituted about 14 percent of alberta’s emissions, 6 percent of canada’s emissions, and 0.1 percent of global emissions. emissions from oil sands production are not the largest source of emissions in alberta or canada as a whole. canadian emissions from transportation (27 percent), total emissions from the energy extraction sector (28 percent—the oil sands account for 6 percent), and electrical generation (17 percent) each constitute a larger portion of total emissions than oil sands.*
as oil sands productive capacity increases, GHG emissions will grow as well. looking forward, iHS ceRa’s oil sands scenarios envision that emissions from oil sands will grow from 6 percent of canada’s emissions today to between 14 (3.1 mbd moderate growth case) to 21 percent (5.7 mbd stretch growth case) by 2030.** the GHG intensity of each barrel of oil sands production is projected to decline more than 10 percent over the next 20 years, but growth in the number of barrels produced results in emissions growth.***
By 2030 in the stretch growth scenario emissions from oil sands would be in the range of those from canada’s electrical generation sector, but still lower than emissions from the transportation sector. in absolute terms emissions resulting from oil sands production and upgrading are projected to grow from about 34 million metric tons of carbon dioxide equivalent (mtco2e) in 2009 to between 70 (moderate growth case) to 160 (stretch growth case) mtco2e by 2030. to help put the emissions in perspective, the US currently produces domestically 4.5 mbd of crude oil creating about 45 mtco2e annually. Natural gas–fired electricity generated in the United States results in more than 360 mtco2e per year. to be sure, oil extraction and refining from any oil supply source requires energy. if oil sands were to be substituted with another source of oil supply, one that produces the average life-cycle emissions of the oil consumed in the United States, the resulting well-to-wheels emissions would be about 5 to 15 percent lower.
*total energy extraction sector includes all oil extraction (including oil sands), refining, mining, and related fugitive emissions. the sector emissions data is sourced from the 2007 canadian National inventory Report, environment canada, april 2009. **the high growth scenario is a “stretch case” for oil sands growth and assumes a middle-of-the road co2 policy. the scenario assumes growth in coke gasification as an alternative to natural gas and oil sands production of 5.7 mbd by 2030. the moderate growth case assumes aggressive co2 policy, aggressive carbon capture and storage, introduction of alternative nonsteam technologies for production, and oil sands production of 3.1 mbd by 2030. today’s emissions are estimated based on 2009 data and production growth. ***See the iHS ceRa Special Report Growth in the Canadian Oil Sands: Finding the New Balance.

14 © 2010, iHS ceRa inc.
No portion of this report may be reproduced, reused, or otherwise distributed in any form without prior written consent.
IHS CERA Special Report
PART III: CHALLENGES Of LIfE-CyCLE ANALySIS
Evaluating and comparing the life-cycle GHG emissions of fuels is a complex process given differences in the data used and in the types of inputs considered. Estimates attained from rules of thumb or broad assessments can be helpful for general discussion, but they are not specific enough to support sound public policy.
The challenge of accurately measuring or estimating life-cycle emissions is reflected in the wide range of results across the studies analyzed. Across the 13 sources compared, estimates of the well-to-retail pump emissions for specific crude oils varied by as much as 45 percent. The significant difference in results reflects the level of uncertainty in measuring life-cycle GHG emissions and highlights a challenge in regulating LCFS policies. Inconsistencies in the results arise from a variety of sources:
Data quality, availability, and modeling assumptions.• Often the data used in life-cycle analysis are average values or numbers estimated from limited sources. The assumptions about key data and calculations are often not transparent, differing substantially among the various models and studies. Emissions also vary from a specific fuel source over time.
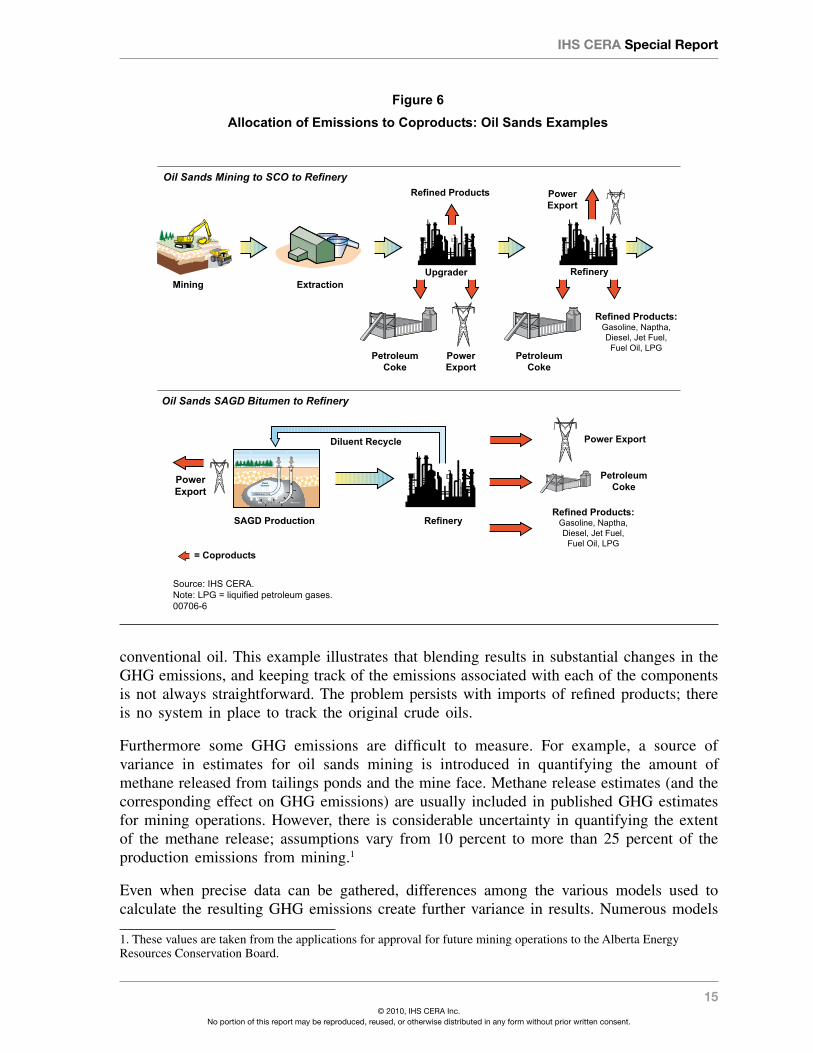
Allocation of emissions to coproducts.• Life-cycle analysis often requires attributing emissions from a process to multiple outputs of that process. Depending on how emissions are allocated to each product, the emissions for a specific product can vary substantially (see Figure 6).
System boundary for life-cycle estimates.• Estimates of life-cycle emissions require a system boundary—a determination of what emissions are counted and not counted. Emissions directly attributable to production of the product are included, but studies vary on whether they include secondary or indirect emissions.
dATA QUALITy, AVAILABILITy, ANd mOdELING ASSUmPTIONS
The data used in crude oil life-cycle analysis pose a number of challenges. Data are often derived from rules of thumb or estimated from limited sources. Even for a single source of crude oil, such as West Texas Intermediate, a range of life-cycle GHG emissions values have been calculated. Often sufficiently granular and current data to estimate life-cycle GHG emissions are not publically available. Moreover the GHG emissions profile of producing a crude oil can change significantly over time. As a crude oil reservoir matures, more energy-intensive production methods are often required, resulting in greater life-cycle GHG emissions.
Blends of crude oil and imports of refined products are particularly problematic for emissions estimates. Crudes with similar properties are often combined in pipelines, making it difficult to track the actual source of the crude oil. With oil sands, bitumen blends can be dilbit or syndilbit (a combination of diluents, SCO, and bitumen), and some blends even contain
15
IHS CERA Special Report
© 2010, iHS ceRa inc. No portion of this report may be reproduced, reused, or otherwise distributed in any form without prior written consent.
conventional oil. This example illustrates that blending results in substantial changes in the GHG emissions, and keeping track of the emissions associated with each of the components is not always straightforward. The problem persists with imports of refined products; there is no system in place to track the original crude oils.
Furthermore some GHG emissions are difficult to measure. For example, a source of variance in estimates for oil sands mining is introduced in quantifying the amount of methane released from tailings ponds and the mine face. Methane release estimates (and the corresponding effect on GHG emissions) are usually included in published GHG estimates for mining operations. However, there is considerable uncertainty in quantifying the extent of the methane release; assumptions vary from 10 percent to more than 25 percent of the production emissions from mining.1
Even when precise data can be gathered, differences among the various models used to calculate the resulting GHG emissions create further variance in results. Numerous models
1. These values are taken from the applications for approval for future mining operations to the Alberta Energy Resources Conservation Board.
��������
���������������������������������������������������������
��������������������������������������������������������������
�����������������������������������
����������������������������������������������������������������
�������������
�����������
���������������� �����������
�������������
���������������
������������
���������������
�������������� ���������
����������������������������������
�����������
����������������������������������������������������������������
������������
�������������
������������
������ ����������
��������������� ��������
�������� ��������

16 © 2010, iHS ceRa inc.
No portion of this report may be reproduced, reused, or otherwise distributed in any form without prior written consent.
IHS CERA Special Report
are used to calculate life-cycle emissions, each with their own correlations, factors, and assumptions, resulting in a range of GHG emission estimates from the same input data.
The quality or lack of international data used in life-cycle analysis poses an additional challenge. Without accurate and verifiable data, some sources of crude oil, such as Canadian oil sands, could be unduly penalized for being more transparent about their GHG emissions than other sources. If policies that target life-cycle emissions use inaccurate assumptions, instead of reducing emissions they could shift emissions to countries or sectors with mischaracterized levels of GHG emissions. Today the United States imports crude oil from over 40 countries, and most of these countries provide multiple types of crude oil. Measuring, verifying, and tracking the emissions from each crude source would be a formidable effort.
Since the band of uncertainty in measuring life-cycle emissions is larger than the emissions reductions that regulations are aiming to achieve, determining whether a regulation is meeting its environmental goals will be difficult. Regulation can be established based on a specified model and its assumptions to provide regulatory certainty to fuel producers, but the actual environmental result of the regulation will always be difficult to determine.
ALLOCATION Of EmISSIONS TO COPROdUCTS: THE ExAmPLE Of ELECTRICITy COGENERATION
Emissions allocation challenges can arise in a number of ways in petroleum life-cycle analysis. Allocation of upstream emissions and refinery emissions among the various refined products is one challenge. Cogeneration of electricity (production of electricity along with steam) poses an even greater challenge. Allocating the emissions between steam and electricity is one part of the quandary; the magnitude of GHG credit to grant the produced electricity is another.
Gas-fired cogeneration of electricity is a common practice in the oil sands industry because it decreases costs and provides a reliable power supply. All mining production and about half of in-situ production currently use cogeneration, and this proportion will increase as SAGD production grows. Because cogeneration plants simultaneously produce steam and electricity, they are more efficient than producing steam and electricity separately. Consequently, sites with electrical cogeneration plants have lower life-cycle GHG emissions then comparable sites that buy their electricity from the grid.
Cogeneration facilities for oil sands developments are sized to produce enough steam to meet oil production needs. Sizing the plant this way results in a surplus of electricity that can be sent to the grid for use off-site (see Figure 7). This power sold to the grid is very reliable, since the cogeneration plant must run at all times for oil production to continue.
In Alberta the electricity produced by natural gas cogeneration is typically less carbon-intensive than the grid electricity that it replaces.1 In this case the GHG emissions for producing a barrel of bitumen with cogeneration are 8 to 14 percent lower than the emissions from a comparable operation without cogeneration. The size of the reduction varies with
1. Today, about 60 percent of Alberta’s power is generated from coal. Power from coal is more carbon-intensive than power generated from natural gas. Source for electrical generation mix: Alberta Electric System Operator.

17
IHS CERA Special Report
© 2010, iHS ceRa inc. No portion of this report may be reproduced, reused, or otherwise distributed in any form without prior written consent.
the assumption on the source of electricity displaced. A 14 percent reduction results from assuming the electricity displaces coal-fired power generation.1 An 8 percent reduction results from using the renewable offset credit established by the Alberta government.2 An estimate using the average GHG intensity for Alberta’s grid produces a result in between these two extremes.3 Using this range of potential offset values, on a well-to-wheels basis, cogeneration reduces the life-cycle GHG emissions for producing refined products with a barrel of bitumen using SAGD by 1 to 2 percent.4
Although oil sands operators could produce more steam (and hence electricity) than their sites require for oil production, they usually do not; they are not in the electrical generation business. However, there are a handful of examples of oversized cogeneration plants in the oil sands.5 In some cases the oversized cogeneration plants have been built to fit future production growth. Therefore they are “oversized” now but may not be in the future. For these oversized
1. Coal GHG intensity for power generation is assumed to average 1,000 kilograms (kg) CO2 per megawatt-hour
(MWh) which is the average between a “best in class” new coal plant and a marginal coal plant.2. Alberta’s GHG intensity offset credit for renewable power generation is 650 kg CO
2 per MWh. Offset Credit
Project Guidance Document, Alberta Government, February 2008.3. Alberta’s average grid GHG intensity was 820 kg CO
2 per MWh in 2007. 2007 Canadian National Inventory
Report, Environment Canada, April.4. All calculations are for a SAGD site with a steam-oil ratio of 3 which is the current average for all SAGD operations, and electricity export equivalent to 10 kilowatt-hour per barrel of bitumen produced. The percent reduction associated with cogen varies with the steam-oil ratio.5. Cogeneration plants that produce as much as ten times more power than needed to meet oil production requirements.
��������
�����������������������������������
������������������������
�����������
�������������������
�����
�����������
�������

18 © 2010, iHS ceRa inc.
No portion of this report may be reproduced, reused, or otherwise distributed in any form without prior written consent.
IHS CERA Special Report
facilities additional GHG emission reductions are possible—for instance if they replace electricity generated from coal. However, as the oversized portion of the cogeneration plant is effectively a power plant (the excess steam is not required for oil production), not all of these extra emissions reductions can be attributed to the bitumen barrel produced. The way that government policies calculate and credit GHG reductions resulting from cogeneration strongly influences facility investments in cogeneration. In California there are examples of developments using steam for heavy oil recovery with cogeneration plants that produce much more steam than is needed for oil recovery. These facilities were designed to take advantage of a past US federal government policy that allowed cogeneration plants to sell electric generation in excess of their needs to the grid at prices typically higher than their cost of production. One example produces more than 20 times more electricity per barrel than the typical in-situ cogeneration plant in Alberta, where cogeneration plants are not so heavily subsidized.
SySTEm BOUNdARy: ExAmPLE Of dIRECT ANd INdIRECT LANd USE CHANGES
Life-cycle analysis attempts to estimate all of the GHG emissions associated with producing and using a given product. However, including all of the emissions is clearly an impossible task. Life-cycle analyses establish a system boundary—a determination of what types of emissions are included and not included in the analysis. As the system boundary widens, the level of debate and uncertainty in the resulting GHG emission estimate tends to grow. However, a narrow system boundary may result in excluding significant sources of GHG emissions.
In estimating the GHG emissions for petroleum, the system boundary is often drawn tightly around the production facilities and the refinery. Direct emissions that are beyond the facility gate are generally not included, nor are indirect emissions. As an example, life-cycle analyses of oil sands include the GHG emitted when water is heated to remove bitumen from the sands. However, emissions resulting from the production of natural gas used in the steam boiler are not included (direct off-site emissions), nor are emissions resulting from boiler production (indirect emissions).
The issue of GHG emissions resulting from land use change is a particularly strong area of debate. Such emissions are very difficult to measure and to attribute to products.
For oil and gas developments, direct emissions from land use change arise when the development is constructed and the land is converted from its previous use (such as agriculture or forest). Some GHG emissions occur when carbon stored in the disturbed land is released; others result from loss of vegetation on the land, which absorbs carbon as it grows.
In the case of biofuel production, the GHG emission changes from land use can be direct or indirect. Direct emissions can occur when soil is disturbed to plant biofuel crops and if the biofuel crop absorbs less CO2
than the previous use of the land. Indirect emissions can occur when the increased production of biofuel feedstocks results in the conversion of additional land to agriculture to meet the ongoing demand for food. All land use emissions are difficult to estimate, but indirect emissions are particularly difficult to estimate and attribute

19
IHS CERA Special Report
© 2010, iHS ceRa inc. No portion of this report may be reproduced, reused, or otherwise distributed in any form without prior written consent.
to products. Estimating just how land use changes due to increasing biofuel production is difficult, and the uncertain nature of emissions resulting from land use changes adds another layer of ambiguity.
Whether and how to include land-use change emissions in life-cycle analysis is the topic of controversy in biofuels regulation. California’s LCFS and the US RFS2 include indirect emissions due to land use change in their life-cycle emissions for biofuels. British Columbia made the opposite decision and does not consider emissions due to indirect land use change. Land use change emissions for petroleum fuels are not included in either regulation. The inclusion of emissions due to land use change makes a substantial difference in total life-cycle emissions for biofuels. For example, land use change makes up as much as two thirds of the total life-cycle emission for some biofuels in California’s LCFS analysis.
Unlike for biofuels, the effect of excluding land use change emissions in the life-cycle analysis for conventional petroleum is relatively minor. The amount of land disturbed per unit of energy produced is much smaller than for biofuels. However, emissions from land use change can be larger from oil sands developments than from other sources of crude oil. For mining operations, all of the vegetation and overburden is removed, disturbing a much larger area per unit of energy produced than a conventional oil field. Additionally, the oil sands region has numerous peat bogs that absorb large amounts of carbon compared with forest or prairie land. Disturbing this land results in larger GHG emissions per acre than most oil developments. Emissions from land use change for in-situ projects are much smaller than for mining because less land is disturbed.
Methods to accurately measure the amount of carbon stored and released by land disturbed during oil and gas development are still evolving. For instance when an oil sands mine is stripped, not all of the carbon is released to the atmosphere, and estimating what portion of the carbon is released is not easy. After the land is reclaimed, the land will start sequestering carbon again. If the land can be reclaimed as peat bog, it could sequester a similar amount of carbon as before disturbance. Currently most studies do not include a credit for future sequestration because restoration of peaty wetlands has not been successfully demonstrated to date. Recently a handful of studies have attempted to quantify the direct land-use–related GHG emissions of oil sands.1 Using average values across the wide range of study results (estimates of stored carbon varied by more than 200 percent) showed that including the direct land impacts for in-situ projects does not result in a material change in GHG life-cycle emissions. However, for oil sands mining the direct land impacts could potentially increase the well-to-wheels emissions from an average of 6 percent higher than the average crude consumed in the United States to about 12 percent higher. These numbers aid in understanding the possible effect of including direct land use in GHG emission calculations; but like all estimates of emissions associated with land use change, they are highly uncertain.
Widening the system boundary increases the uncertainty in GHG life-cycle analysis, but it also can provide more complete accounting of the emissions created by use of a transportation
1. “Bitumen and Biocarbon Land Use Conversations and Loss of Biological Caron Due to Bitumen Operations in the boreal Forests of Alberta Canada,” Global Forest Watch, 2009; “Biological Carbon Emissions Intensity of Oil Sands mining,” Canadian Boreal Initiative/Ducks Unlimited Canada; “Land Use Greenhouse Gas Emissions from Conventional and Unconventional Oil Production”, University of California, Davis, April 2010 (authors in this study are also from Stanford University, University of Guelph, University of Calgary, and Drexel University).

20 © 2010, iHS ceRa inc.
No portion of this report may be reproduced, reused, or otherwise distributed in any form without prior written consent.
IHS CERA Special Report
fuel. Furthermore, when comparing life-cycle assessments for different sources of fuel, a consistent system boundary is crucial, although difficult to establish.

21
IHS CERA Special Report
© 2010, iHS ceRa inc. No portion of this report may be reproduced, reused, or otherwise distributed in any form without prior written consent.
PART IV: ImPLICATIONS Of LIfE-CyCLE POLICy ON OIL SANdS
The life cycle of petroleum fuels and the way that GHGs are emitted make reducing their GHG intensity difficult. GHGs are emitted during oil production, crude oil transportation, fuel refining, and fuel transportation to the final user, but 70 to 80 percent of life-cycle GHG emissions for petroleum fuels occur in the combustion phase. This fact has crucial implications for complying with life-cycle–based regulations, including LCFS.
GHG emissions from combustion are an unavoidable result of using petroleum fuels. More efficient vehicles reduce the combustion emissions per mile driven. However, no mitigation strategy for petroleum-fueled vehicles can reduce emissions per unit of energy, which is the basis of LCFS. For this reason the 70 to 80 percent of the total life-cycle emissions that occur in the combustion part of the value chain for petroleum fuels are “off the table” with respect to LCFS compliance. Thus the 10 percent reduction in life-cycle GHG intensity that the California and British Columbia LCFS require would all have to occur in the noncombustion, or well-to-retail pump, part of the life cycle. This would mean a reduction of approximately one-third to one-half of the GHG emissions from the oil well to the retail pump. This level of reduction is extremely difficult to achieve in an industry already under competitive pressure to reduce energy use and costs. Using crude oil sources with lower-than-average upstream GHG emissions and increasing refinery efficiency can reduce the life-cycle GHG emissions of gasoline or diesel, but not by 10 percent.
This challenge is present not just for high-emissions crudes, such as oil sands, but for all sources of crude oil. Ultimately the goal of LCFS is to displace petroleum in the transportation sector with alternative fuels that have lower emissions.
HOw dO LCfS dEAL wITH HIGH-CARBON CRUdES?
The way an LCFS is written determines whether oil sands and other high-emissions crudes are disproportionately displaced under LCFS. There are two ways to deal with different sources of crude oil—differentiating among sources of crude oil or using a standard value for all petroleum fuels. California and British Columbia provide examples of the two methods.
The California LCFS differentiates among sources of crude oil, to a point. It establishes a baseline emissions intensity for gasoline and diesel fuel produced from crudes already used in California refineries.1 Refiners using new sources of crude oil with upstream emissions greater than 15 grams of CO
2 equivalent (gCO
2e) per megajoule (MJ) cannot use the baseline
emissions value and must establish an emissions-intensity value for these higher emissions crudes. For comparison, the average crude oil refined in California today has upstream emissions of about 8 gCO
2e per MJ, while oil sands crudes vary from approximately 13 to
19 gCO2e per MJ. Crudes with upstream emissions below the threshold or those already
refined in the state can use the baseline value. Refiners can also petition to use an emissions intensity smaller than the baseline value if they use low-emissions crudes or improve the
1. California’s baseline basket of crudes consists of all sources of crude oil that made up 2 percent or more of California refineries’ feedstock in 2007.

22 © 2010, iHS ceRa inc.
No portion of this report may be reproduced, reused, or otherwise distributed in any form without prior written consent.
IHS CERA Special Report
efficiency of their processes. However, such petitions must result in at least a 5 gCO2e per
MJ improvement in GHG intensity, a significant increase in the well-to-retail pump portion of the value chain.
California’s method of differentiating among crudes is controversial, since high-emissions crudes already used in the state are “grandfathered in,” and refiners do not have to account for the higher emissions of these crudes under the LCFS, even if their share of crude supply increases. Canadian officials have expressed concern that this method discriminates against oil sands crudes as compared to California’s own high-emissions crude oil, potentially violating provisions of the North American Free Trade Agreement and the World Trade Organization.
British Columbia’s LCFS takes a different and simpler approach. It assumes that life-cycle GHG emissions from all sources of gasoline and diesel are the same. Refineries do not have to vary the emissions values they use based on their sources of crude oil. However, the British Columbia LCFS does not incentivize refiners to switch to lower-emissions crudes or to pursue energy efficiency improvements to reduce the life-cycle emissions of their products. The only compliance mechanism is replacing petroleum with a lower-carbon fuel source.
The choice to differentiate among different types of crude oil comes down to balancing the complexity of the regulation with the level of certainty that its environmental goals will be met. Keeping track of the types and quantities of crude oil that refineries use and establishing life-cycle GHG emissions estimates for high-emissions crude oils are substantial efforts—and could prove quite challenging particularly in terms of accuracy and keeping pace with changing life-cycle emissions. Emissions from different sources of crude oil vary, both across fields and in a particular field over time. Field-level data on life-cycle GHG emissions are very spotty and require a great deal of estimation, resulting in considerable uncertainty in the life-cycle emissions of all crude oil sources. Additionally, crude oils of similar quality are mixed in the pipeline distribution system, although their life-cycle GHG emissions could be quite different depending on how and where the crudes were produced.
The British Columbia policy of assigning one value each to gasoline and diesel sidesteps the issue of keeping track of various crudes and their emissions value. However, the trade-off is that such a regulation is less certain to meet its GHG emissions reduction goals. If the crude oil refined to produce fuel for sale in British Columbia were to become more carbon-intensive on average, this increase in emissions would not be captured under the LCFS. In this case emissions would decline less than called for in British Columbia’s LCFS.
HOw dO HIGH-CARBON CRUdES fIT INTO AN LCfS wORLd?
Since a 10 percent reduction in life-cycle GHG emissions from petroleum fuels is difficult to achieve, in practice LCFS are alternative fuel standards. British Columbia’s LCFS takes on this point directly by using one life-cycle emissions value for all sources of petroleum fuels. The primary method of compliance with LCFS is to replace petroleum with other types of fuel, resulting in fewer GHG emissions. Compliance with LCFS is likely to rely on increasing consumption of second generation biofuels and electricity in transportation (see

23
IHS CERA Special Report
© 2010, iHS ceRa inc. No portion of this report may be reproduced, reused, or otherwise distributed in any form without prior written consent.
Figure 8).1 More efficient vehicles that run on petroleum do not help with LCFS compliance, since these regulations focus on the emissions from the fuel itself per unit of energy.
California’s LCFS allows providers of transportation fuels that exceed LCFS compliance standards to trade compliance credits with providers who need them. Petroleum and biofuel providers are required to comply with LCFS. Electric utilities, natural gas companies, and hydrogen producers, which sell fuels that already have lower GHG intensity than gasoline or diesel, can opt in to the program to provide transportation fuel and to sell credits to producers of fuels with higher GHG intensities. Other LCFS are less specific in their trading mechanisms but are likely to adopt similar systems to simplify compliance.
1. The amount of GHG reduction from using electricity in transportation depends on the source of the electricity. Coal-fired electricity can even result in an increase in life-cycle GHG emissions over gasoline.
��������
���������������������������������������������������������
������������������������������������������������������������������������������������������������������������������������������������
���� �� �� �� �� ���������������
����������������
���������������������������������
�����������������������
������������������������
����������������������������
�������������������������
�������������������������
����������������������������
��������������������������
�����������������
������������������

24 © 2010, iHS ceRa inc.
No portion of this report may be reproduced, reused, or otherwise distributed in any form without prior written consent.
IHS CERA Special Report
To illustrate the options and challenges of LCFS, consider the compliance options for a provider of 100,000 barrels per day (bd) each of gasoline and diesel in California. What LCFS-compliant fuel portfolios could the supplier assemble, either through producing or acquiring fuels or purchasing credits?
By 2020 our hypothetical fuel provider would be required to sell fuels into the gasoline and diesel pools that emit 10 percent less GHG on a well-to-wheels basis than today’s baselines.1 Various portfolios of fuels could allow our supplier to comply with the LCFS. The gasoline and diesel pools are considered separately, so substituting diesel for gasoline is not a compliance option.
For the gasoline pool, compliance options include substituting volumes of gasoline with sugarcane ethanol, cellulosic ethanol, electricity, or some combination of these fuels. Ethanol derived from corn, the most common biofuel in the United States today, is not included in the analysis. On a life-cycle basis corn ethanol GHG emissions vary from slightly greater to around 10 percent less than those from gasoline. Therefore even a total replacement of gasoline-pool fuel with corn ethanol might not achieve compliance, depending on the source of the ethanol. Figure 9 shows the results of this analysis considering the average fuel processed in California as well as crude oil derived entirely from Canadian oil sands.
This analysis shows that achieving LCFS compliance for the gasoline fleet requires new technology and changes in fuel distribution and the vehicle fleet regardless of the source of crude oil. Sugarcane ethanol can help a fuel portfolio comply, but owing to its relatively high life-cycle emissions, it would need to replace a large portion of petroleum in the gasoline pool. In this case flex-fuel vehicles capable of consuming fuel containing a high percentage of ethanol would be essential. Additional infrastructure would also be necessary, as few refueling stations carry the fuel (new tanks and pumps would be required). Cellulosic ethanol would displace much less petroleum because of its smaller life-cycle emissions, but this fuel is not yet available in commercial quantities. Electricity is another route to compliance, but electricity is likely to be only a small part of a compliance portfolio in the next ten-plus years because of high electric vehicle costs and still-challenging technology issues.
An analysis for diesel compliance reveals an even greater challenge, as fewer low-carbon fuel options are available (see Figure 10). Similar to ethanol derived from corn, biodiesel derived from soybeans does not have low enough life-cycle emissions to be helpful for LCFS compliance. Biodiesel derived from waste oil is a good blending fuel for LCFS compliance, since its low emissions allow a relatively low blending ratio and since it can be run in today’s vehicles and transported via today’s infrastructure. However, feedstock availability is likely to limit the amount of waste-oil–derived biodiesel. Compressed natural gas (CNG) and liquefied natural gas are additional options for fueling the heavy-duty vehicle fleet that accounts for the lion’s share of US diesel demand. A large portion of the heavy-duty diesel fleet would need to be converted to natural gas, however, an outcome that IHS CERA deems unlikely.2
1. The 10 percent reductions correspond to emissions limits of 86.3 gCO2e per MJ for gasoline and 85.2 gCO
2 per MJ
for diesel.2. See the IHS CERA Multiclient study Fueling North America’s Energy Future. Barriers to large-scale adoption of natural gas for heavy-duty transportation compared with diesel include higher vehicle capital costs, lower fuel density resulting in more refueling stops, and lack of refueling infrastructure.

25
IHS CERA Special Report
© 2010, iHS ceRa inc. No portion of this report may be reproduced, reused, or otherwise distributed in any form without prior written consent.
In practice LCFS are aggressive alternative fuel standards. Significant quantities of low-carbon fuels will be needed to meet the 2020 mandates. A good rule of thumb is that blending LCFS-compliant transportation fuels made from oil sands crudes will require twice the quantity of low-carbon fuels as the average. The life-cycle GHG emissions from oil sands products are about 10 percent higher than the average crude and thus require twice the offset to reach a 10 percent reduction from the average.1 Highlights of potential compliance hurdles include the following:
LCFS gasoline pool compliance could be challenged by limited availability of •low-carbon ethanol. To comply with the California LCFS gasoline target using only sugarcane ethanol and California average crude oil, more than 50 percent of the gasoline consumed (on a volume basis) would need to be derived from sugarcane ethanol. Today California consumes about 1 mbd of gasoline, and Brazil produces less than 0.5 mbd of sugarcane ethanol. Meeting a 10 percent reduction target today would require more sugarcane ethanol than Brazil currently produces. Compliance with cellulosic ethanol
1. This analysis considers the effect of LCFS policy on 100 percent oil sands products. It does not consider bitumen blends such as dilbit. Because dilbit has lower life-cycle GHG emissions, the amount of alternative fuels required to comply would be lower.
��������
����������������������������������������������������������������������������
�����������������������������������
�������������������������������������������������������������������������������������������������������������������������������������������������������������������������������������������������������������������������������������������������������������������������������������
�
������
������
������
������
�������
�������
�������
����������
������������
�������������
�����
�����������
������������
��������������
�����
������������
������������
���������������
�����
�����������
������������������
�����������������
��������
�������������
�����������������
�����������������

26 © 2010, iHS ceRa inc.
No portion of this report may be reproduced, reused, or otherwise distributed in any form without prior written consent.
IHS CERA Special Report
requires smaller volumes because of its lower emissions, but cellulosic ethanol is not yet produced commercially.
LCFS is more aggressive than RFS2.• RFS2 requires more than 20 percent of projected US gasoline demand (on a volume basis) be met by biofuels by 2022, and more than half of this volume must be cellulosic and advanced biofuel. LCFS requirements for biofuel are even greater when considered as a percentage of fuel demand. IHS CERA projects that in a future scenario with low growth in US petroleum demand and strong adoption of alternative fuels and vehicles, the volume of biofuel consumed would still fall short of the less ambitious RFS2 mandate. EPA recently reduced the volume of cellulosic ethanol required in 2011 because sufficient fuel is not expected to be available.
Slow turnover in the vehicle fleet will complicate LCFS compliance.• The fleet of existing vehicles turns over slowly—a typical car is on the road for 12 to 15 years before it is replaced. Therefore, both the electricity and flex-fuel vehicle options for LCFS gasoline pool compliance pose a challenge in the ten-year time frame. Electric vehicle options, such as plug-in hybrid electric vehicles (PHEVs) and all-electric
���������
�����������������������������������������������������������������������������
�����������������������������������
�����������������������������������������������������������������������������������������������������������������������������������������������������������������
�
������
������
������
������
�������
�������
�����������������
�������������
�����������������
����
�����
�����������������
��������
�����
����������������������������
�������������
��������������������
��������������������

27
IHS CERA Special Report
© 2010, iHS ceRa inc. No portion of this report may be reproduced, reused, or otherwise distributed in any form without prior written consent.
vehicles, are only now becoming available to consumers.1 Even with a sharp increase in the sales of alternative vehicles, the number of cars and trucks able to consume alternative fuels are likely to constrain the volumes of low-carbon fuel that can be consumed. In IHS CERA’s aggressive alternative vehicles scenario, electric vehicles displace less than 100,000 bd of US gasoline demand by 2020.
LCFS diesel pool compliance is limited due to a lack of viable low-carbon fuel •alternatives. Low carbon alternatives to diesel are not expected to arrive over the next decade or two. Although viable biodiesel from waste oil does comply, volumes are limited, and natural gas alternatives for heavy hauling are unlikely.
Clearly oil sands crudes are even more challenged than the California average crude in complying with LCFS. They require about twice the quantity of low-carbon alternative fuels to achieve a 10 percent reduction in life-cycle emissions. However, only time will tell what the ultimate impact of LCFS policies on the market for oil sands and other carbon-intensive crudes will be. Since nearly all sources of crude oil will fall short of the LCFS target, research on alternative vehicles and fuels will continue. Future innovations could help these low-carbon fuel alternatives to become both competitive and scalable.
The cost and availability of next-generation biofuels and electric vehicles will be important factors in how fuel providers comply with LCFS. High-carbon sources of transportation fuel, including oil sands and other sources of crude oil, can fit into an LCFS system as part of a fuel portfolio if sufficient volumes of low carbon alternatives are both economic and available. To achieve compliance, other low-carbon fuels in the portfolio must offset the higher emissions from petroleum fuels.
CONCLUSION: THE PATH TO COmPLIANCE
Life-cycle analysis is an evolving discipline that must deal with a number of uncertainties, making it a challenging basis for policy. Estimates of well-to-retail pump GHG emissions from a single fuel can vary by more than 10 percent on a well-to-wheels basis. This variance is larger than the GHG emissions reductions that some LCFS require. Regulatory uncertainty for fuel producers can be limited by establishing life-cycle emissions values in regulation, but uncertainty about the environmental efficacy of such regulations remains. However, life-cycle analysis will never be perfect, and regulations can change over time to reflect the latest findings.
An additional challenge in regulating transportation fuels according to their life-cycle GHG emissions is the trade-off between the complexity of a regulation and the level of incentive that it provides for emissions reductions. Establishing broad categories of fuels makes a regulation much easier to manage, but also reduces the incentive for fuel producers to make additional changes in their processes or feedstocks to reduce their GHG emissions. More granular regulations do provide such incentives, but at the expense of a much more complex regulatory system and the challenge of keeping track of various fuels that are nearly identical chemically but that may have quite different life-cycle GHG emissions.
1. PHEVs have an all-electric range large enough to handle most day-to-day driving, with a backup conventional fuel tank to ensure a range as great or greater than that of a gasoline vehicle.

28 © 2010, iHS ceRa inc.
No portion of this report may be reproduced, reused, or otherwise distributed in any form without prior written consent.
IHS CERA Special Report
Over the next decade LCFS compliance will be difficult for all crude oil sources. Fitting oil sands crudes into an LCFS-compliant fuel portfolio is more challenging because of their greater life-cycle emissions. Over time, assuming that the economics and availably of low-carbon alternatives such as next generation biofuels and electric vehicles improve, it is possible there will be sufficient volumes of alternative fuels to offset the higher carbon intensity of oil sands. The ultimate effect of LCFS on the market for oil sands crudes will depend on the advancement of these fuels and the vehicles that use them.

29
IHS CERA Special Report
© 2010, iHS ceRa inc. No portion of this report may be reproduced, reused, or otherwise distributed in any form without prior written consent.
REPORT PARTICIPANTS ANd REVIEwERS
IHS CERA hosted a focus group meeting in Calgary (May 14, 2010) providing an opportunity for oil sands stakeholders to come together and discuss perspectives on the key issues related to oil sands, life-cycle analysis, and life-cycle analysis policy. Additionally a number of participants reviewed a draft version of this report. Participation in the focus group or review of the draft report does not reflect endorsement of the content of this report. IHS CERA is exclusively responsible for the content of this report.
IHS CERA would like to thank and recognize the following organizations that made a contribution to this report.
Alberta Department of Energy•
American Petroleum Institute—API•
Argonne National Laboratory•
BP Canada•
Canadian Oil Sands Trust•
Canadian Association of Petroleum Producers—CAPP•
Cenovus Energy Inc.•
ConocoPhillips Company•
Devon Energy Corporation•
Energy and Environment Solutions, Alberta Innovates•
Energy Resources Conservation Board (Alberta)—ERCB•
General Electric Company—GE•
Imperial Oil Ltd•
In Situ Oil Sands Alliance—IOSA•
Marathon Oil Corporation•
Natural Resources Canada•
Nexen Inc.•
Pembina Institute•
Shell Canada•
Statoil Canada Ltd.•

30 © 2010, iHS ceRa inc.
No portion of this report may be reproduced, reused, or otherwise distributed in any form without prior written consent.
IHS CERA Special Report
Suncor Energy Inc.•
Total E&P Canada Ltd.•
TransCanada Corporation•
US Department of Energy•
US Environmental Protection Agency •
UTS Energy Corporation•
IHS CERA TEAm
David Hobbs, IHS CERA Chief Energy Strategist, is an expert in energy industry structure and strategies. He previously managed IHS CERA’s energy research activities. Mr. Hobbs is a principal author of the major IHS CERA studies Fueling North America’s Energy Future: The Unconventional Natural Gas Revolution and the Carbon Agenda, a comprehensive examination of the impact of the changed natural gas supply outlook on energy markets, power generation technology choices, and the challenges of procuring a low carbon future; In Search of Reasonable Certainty: Oil and Gas Reserves Disclosures and Modernizing Oil and Gas Disclosures, comprehensive analyses of the problem of assessing oil and gas reserves and resulting proposed solutions; “Recession Shock”: The Impact of the Economic and Financial Crisis on the Oil Market, a major IHS CERA assessment of the world economic crisis; and of the IHS CERA Multiclient Study Harnessing the Storm—Investment Challenges and the Future of the Oil Value Chain. He was a project advisor to the IHS CERA Multiclient Study Crossing the Divide: The Future of Clean Energy.
Mr. Hobbs is IHS CERA’s representative on the management board of the Global Energy Executive MBA program run jointly between the Haskayne School of Business and IHS CERA. He is also a member of the Scientific Advisory Board of the Fondazione Eni Enrico Mattei. Prior to joining IHS CERA Mr. Hobbs had two decades of experience in the international exploration and production business. He has directed projects in Asia, South America, North America, and the North Sea. He has led major international investment and asset commercialization operations. Based in Cambridge, Massachusetts, Mr. Hobbs holds a degree from Imperial College.
James Burkhard, Managing Director of IHS CERA’s Global Oil Group, leads the team of IHS CERA experts who analyze and assess upstream and downstream market conditions and business strategies. His team also develops and maintains detailed short- and long-term outlooks for global crude oil and refined products markets. Mr. Burkhard’s expertise covers geopolitics, world energy and economic conditions, and global oil demand and supply trends. He works closely with IHS CERA clients in assessing how market, economic, and political risks could change the competitive environment. He also works with companies to assess business opportunities in both the upstream and downstream sectors. Mr. Burkhard was the project director of Dawn of a New Age: Global Energy Scenarios for Strategic Decision Making—The Energy Future to 2030, a comprehensive IHS CERA study encompassing the
31
IHS CERA Special Report
© 2010, iHS ceRa inc. No portion of this report may be reproduced, reused, or otherwise distributed in any form without prior written consent.
oil, gas, and electricity sectors. He is currently leading a new initiative, the IHS Global Scenarios to 2030, which covers global economics, security, and geopolitics, and is focused on the energy and automotive industries. He was also the director and coauthor of the recent IHS CERA Multiclient Studies Growth in the Canadian Oil Sands? Finding the New Balance and Potential versus Reality: West African Oil and Gas to 2020. He was project advisor to the IHS CERA Multiclient Study Crossing the Divide: The Future of Clean Energy. Mr. Burkhard is also the coauthor of CERA’s respected World Oil Watch, which analyzes short- to medium-term developments in the oil market. In addition to leading IHS CERA’s oil research, Mr. Burkhard served on the US National Petroleum Council (NPC) committee that provided recommendations on US oil and gas policy to the US Secretary of Energy. He led the team that developed demand-oriented recommendations that were published in the 2007 NPC report Facing the Hard Truths about Energy. Before joining IHS CERA Mr. Burkhard directed infrastructure projects in West Africa for the United States Peace Corps and was a field operator for Rod Electric. Mr. Burkhard holds a BA from Hamline University and an MS from the School of Foreign Service at Georgetown University.
Samantha Gross, IHS CERA Director, focuses on the interaction of investment decision-making with the complex landscape of governments, nongovernmental organizations, shareholders, and other stakeholders. She is the manager of IHS CERA’s Global Energy service. She led the environmental and social aspects of CERA’s recent study Growth in the Canadian Oil Sands: Finding the New Balance, including consideration of water use and quality, local community impacts, and aboriginal issues. Ms. Gross was also the IHS CERA project manager for Towards a More Energy Efficient World and Thirsty Energy: Water and Energy in the 21st Century, both produced in conjunction with the World Economic Forum. Additional contributions to IHS CERA research include reports on the water impacts of unconventional gas production, international climate change negotiations, US vehicle fuel efficiency regulations, and the California low-carbon fuel standard. Before joining IHS CERA she was a Senior Analyst with the Government Accountability Office. Her professional experience also includes providing engineering solutions to the environmental challenges faced by petroleum refineries and other clients. Ms. Gross holds a BS from the University of Illinois, an MS from Stanford University, and an MBA from the University of California at Berkeley.
Jackie Forrest, IHS CERA Director, Global Oil, was the Study Manager for IHS CERA’s recent Multiclient Study Growth in the Canadian Oil Sands: Finding the New Balance. Ms. Forrest has more than a decade’s experience in the definition and economic evaluation of refining and oil sands projects. Her expertise encompasses all aspects of petroleum evaluations, including refining, processing, upgrading, and products. As the research lead for IHS CERA’s Oil Sands Energy Dialogue and Capital Costs Analysis Forum—Downstream, she is responsible for analyzing and monitoring emerging strategic trends related to oil sands projects. Ms. Forrest is a professional engineer and holds a degree from the University of Calgary and an MBA from Queens University.
Tiffany A. Groode, IHS CERA Associate Director, leads the research on critical issues for IHS CERA’s Driving the Future: Energy for Transportation in the 21st Century Forum. Her expertise includes modeling and analyzing the environmental impacts of ethanol production by performing life-cycle uncertainty analysis as well as assessing the potential scale of

32 © 2010, iHS ceRa inc.
No portion of this report may be reproduced, reused, or otherwise distributed in any form without prior written consent.
IHS CERA Special Report
bioethanol production from various biomass sources. While working at the Sloan Automotive Laboratory at the Massachusetts Institute of Technology (MIT), Dr. Groode presented her bioethanol results and conclusions to a variety of national government agencies to provide insight for policy decisions. Dr. Groode holds a BS from the University of California, Los Angeles, and an MS and PhD from MIT.

33
IHS CERA Special Report
© 2010, iHS ceRa inc. No portion of this report may be reproduced, reused, or otherwise distributed in any form without prior written consent.
APPENdIx: IHS CERA’S mETA-ANALySIS Of LIfE-CyCLE ANALySIS STUdIES
IHS CERA’s meta-analysis of 13 separate sources aims to present our best estimate of the life-cycle emissions of oil sands products compared to other sources of crude oil.1
We consider the results of each study on an “apples-to-apples” basis by converting them to common units and common system boundaries. Some studies calculate only part of the well-to-wheels emissions. In order to compare the sources on a well-to-wheels basis, emissions for each step in crude oil processing are required, including crude production, crude transportation, refining, and product distribution. Other studies report emissions on different basis, per barrel of refined product or per barrel of crude. We used the normalized results of the studies to establish IHS CERA’s best estimate of emissions.
Unit of measure: GHG Emission Comparison
We express GHG emissions in units of kilograms of carbon dioxide equivalent per barrel of refined product produced, (kgCO
2e per barrel of refined products). The definition of
refined products is explained in the “Fuel Combustion GHG Emissions” section, below. Some life-cycle analysis studies report GHG emissions on the basis of one barrel of crude oil, gasoline, or diesel. For the studies that reported emissions on a single refined product basis, we used the original studies’ assumptions on refined product yields to convert the emissions to a total barrel of refined products basis.
SETTING CONSISTENT BOUNdARIES fOR COmPARISON
In estimating the GHG emissions for petroleum, our life-cycle analysis boundary is drawn tightly around the gate of the oil production facilities, the refinery, and the shipping pipelines. Direct emissions that are beyond the facility gate are not included, nor are indirect emissions. Many studies did not provide much detail on the boundaries for their analysis, and a tight boundary was assumed for these cases.
One exception to this among the 13 studies we considered was the Jacobs-AERI study. This study included emissions beyond the facility gate, including the upstream emissions from producing natural gas combusted at the oil sands facility and the emissions from producing other fuels that are imported into the refinery, such as isobutene. The Jacobs-AERI study included emissions from these offsite sources for all sources of crude oil. In the case of oil sands production, including these emissions added 12 to 13 percent to well-to-tank emissions,
1. IHS CERA has updated the GHG meta-analysis originally published in May 2009 with data from recent studies that Energy and Environment Solutions, Alberta Innovates (formerly Alberta Energy Research Institute) commissioned: Life Cycle Assessment Comparison of North American and Imported Crudes, Jacobs Consultancy, July 2009 and Comparison of North American and Imported Crude Oil Lifecycle GHG Emissions, TIAX LCC, July 2009. Other data sources include: Development of Baseline Data and Analysis of Life Cycle Greenhouse Gas Emissions of Petroleum-Based Fuels, DOE/NETL, November 2008; Typical Heavy Crude and Bitumen Derivative Greenhouse Gas Life Cycles, McCann and Associates, November 2001; Unconventional Fossil-Based Fuels: Economic and Environmental Trade-Offs, RAND Corporation, 2008; Canadian Oil Sands: Opportunities and Challenges, NEB, 2006. Environmental Challenges and Progress in Canada’s Oil Sands, CAPP, 2008; GREET model, Version 1.8b, September 2008; GHGenius: 2007 Crude Oil Production Update, Version 3.8; 2009/10 Sustainability Report, Syncrude Canada Ltd.; The Shell Sustainability Report, 2006, Shell”; IHS CERA data.

34 © 2010, iHS ceRa inc.
No portion of this report may be reproduced, reused, or otherwise distributed in any form without prior written consent.
IHS CERA Special Report
or around 3 percent to well-to-wheels emissions. To make the Jacobs-AERI results consistent with the other studies, we excluded these off-site emissions from our meta-analysis.
APPLyING NORmALIzEd VALUES: IHS CERA’S BEST ESTImATE Of wELL-TO-RETAIL TANK GHG EmISSIONS
To ensure uniformity in crude oil comparisons, we normalized the data.
Crude production.• When multiple studies analyzed the same crude, the average value for production-related GHG emissions across the studies was used for the IHS CERA best estimate. If a crude source was considered in only one study, the value from the original study was used directly. Table A-1 summarizes the range of study estimates and our best estimate value.
Crude transportation.• The 13 sources used a range of values for the GHG emissions resulting from crude transport. IHS CERA normalized the range of transportation emissions values into two groups—overseas and North American crudes—and used consistent GHG emissions for the transportation step for all comparisons (see Table A-2). Although this is a simplification, because transportation emissions make up less than 1 percent of total well-to-wheels emissions, it does not result in a notable change in the results. Furthermore the range of transportation estimates—even from one location—varied widely. For instance estimates of the emissions for transportation of crude from Mexico ranged from 1 kgCO
2e per barrel to 14 kgCO
2e per barrel.
Without normalizing, results for some sources of crude oil could be skewed because the original study author had a conservative or aggressive assumption about transportation emissions compared to others.
Refining.• IHS CERA categorized crude oil sources considered in the 13 studies into six categories: light conventional, medium conventional, heavy conventional, extra-heavy conventional, SCO, and bitumen. We calculated the average refining emissions values for each crude type using the study estimates and used these average values for the IHS CERA best estimate (see Table A-3). This is an oversimplification of the complexity associated with refining. In reality the emissions are dependent on the type of refinery that processes the crude, the volume of various refined products produced, the quality of the refinery products, and the crude feedstock. Although these average values are simplified, they do not introduce a significant amount of error on a well-to-wheels basis as the difference between processing heavy crude in a complex refinery versus refining light crude in a simple refinery is less than 2 to 3 percent of the total well-to-wheels emissions. Refining emissions generally make up about 10 percent of well-to-wheels emissions. Additionally, without normalizing the values to be consistent across the crudes compared, the results could be skewed because the original study author assumed a more or less complex refinery compared to other sources.
Refined product distribution.• The range of estimates for the GHG emissions associated with refined product distribution varied little among the studies. We used a consistent value across all crude oil sources in our best estimate (see Table A-4).
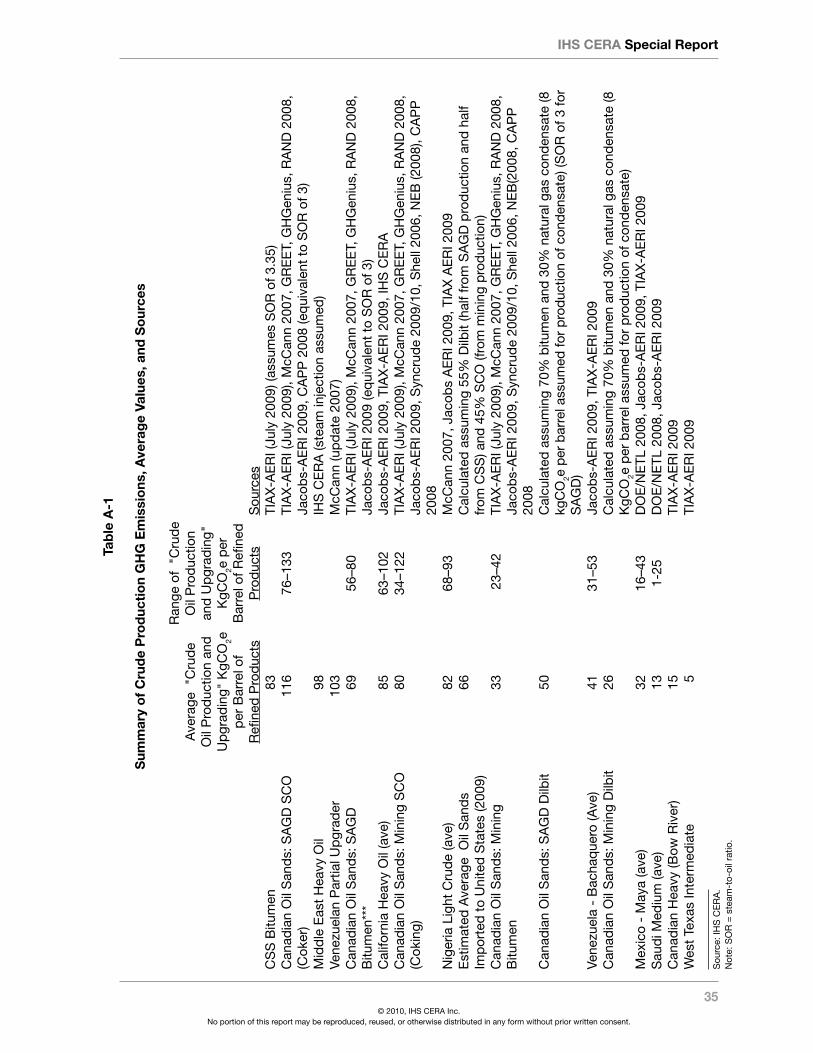
35
IHS CERA Special Report
© 2010, iHS ceRa inc. No portion of this report may be reproduced, reused, or otherwise distributed in any form without prior written consent.
Tab
le A
-1
Sum
mar
y o
f C
rud
e P
rod
ucti
on
GH
G E
mis
sio
ns, A
vera
ge
Valu
es, a
nd S
our
ces
ave
rage
"c
rud
e o
il p
rod
uctio
n an
d
Up
grad
ing"
Kgc
o2e
p
er B
arre
l of
Refi
ned
pro
duc
ts
Ran
ge o
f "c
rud
e o
il p
rod
uctio
n an
d U
pgr
adin
g"
Kgc
o2e
per
B
arre
l of R
efine
d
pro
duc
tsS
ourc
esc
SS
Bitu
men
83ti
aX
-ae
Ri (
July
200
9) (a
ssum
es S
oR
of 3
.35)
can
adia
n o
il S
and
s: S
aG
D S
co
(c
oker
)11
676
–133
tia
X-a
eR
i (Ju
ly 2
009)
, Mcc
ann
2007
, GR
ee
t, G
HG
eniu
s, R
aN
D 2
008,
Ja
cob
s-a
eR
i 200
9, c
ap
p 2
008
(eq
uiva
lent
to
So
R o
f 3)
Mid
dle
eas
t H
eavy
oil
98iH
S c
eR
a (s
team
inje
ctio
n as
sum
ed)
Vene
zuel
an p
artia
l Up
grad
er10
3M
ccan
n (u
pd
ate
2007
)c
anad
ian
oil
San
ds:
Sa
GD
B
itum
en**
*69
56–8
0ti
aX
-ae
Ri (
July
200
9), M
ccan
n 20
07, G
Re
et,
GH
Gen
ius,
Ra
ND
200
8,
Jaco
bs-
ae
Ri 2
009
(eq
uiva
lent
to
So
R o
f 3)
cal
iforn
ia H
eavy
oil
(ave
)85
63–1
02Ja
cob
s-a
eR
i 200
9, t
iaX
-ae
Ri 2
009,
iHS
ce
Ra
can
adia
n o
il S
and
s: M
inin
g S
co
(c
okin
g)80
34–1
22ti
aX
-ae
Ri (
July
200
9), M
ccan
n 20
07, G
Re
et,
GH
Gen
ius,
Ra
ND
200
8,
Jaco
bs-
ae
Ri 2
009,
Syn
crud
e 20
09/1
0, S
hell
2006
, Ne
B (2
008)
, ca
pp
20
08N
iger
ia l
ight
cru
de
(ave
)82
68–9
3M
ccan
n 20
07, J
acob
s a
eR
i 200
9, t
iaX
ae
Ri 2
009
est
imat
ed a
vera
ge o
il S
and
s im
por
ted
to
Uni
ted
Sta
tes
(200
9)66
cal
cula
ted
ass
umin
g 55
% D
ilbit
(hal
f fro
m S
aG
D p
rod
uctio
n an
d h
alf
from
cS
S) a
nd 4
5% S
co
(fro
m m
inin
g p
rod
uctio
n)c
anad
ian
oil
San
ds:
Min
ing
Bitu
men
33 2
3–42
tia
X-a
eR
i (Ju
ly 2
009)
, Mcc
ann
2007
, GR
ee
t, G
HG
eniu
s, R
aN
D 2
008,
Ja
cob
s-a
eR
i 200
9, S
yncr
ude
2009
/10,
She
ll 20
06, N
eB
(200
8, c
ap
p
2008
can
adia
n o
il S
and
s: S
aG
D D
ilbit
50c
alcu
late
d a
ssum
ing
70%
bitu
men
and
30%
nat
ural
gas
con
den
sate
(8
kgc
o2e
per
bar
rel a
ssum
ed fo
r p
rod
uctio
n of
con
den
sate
) (S
oR
of 3
for
Sa
GD
)Ve
nezu
ela
- B
acha
que
ro (a
ve)
4131
–53
Jaco
bs-
ae
Ri 2
009,
tia
X-a
eR
i 200
9
can
adia
n o
il S
and
s: M
inin
g D
ilbit
26c
alcu
late
d a
ssum
ing
70%
bitu
men
and
30%
nat
ural
gas
con
den
sate
(8
Kgc
o2e
per
bar
rel a
ssum
ed fo
r p
rod
uctio
n of
con
den
sate
)M
exic
o -
May
a (a
ve)
3216
–43
Do
e/N
etl
200
8, J
acob
s-a
eR
i 200
9, t
iaX
-ae
Ri 2
009
Sau
di M
ediu
m (a
ve)
131-
25D
oe
/Ne
tl 2
008,
Jac
obs-
ae
Ri 2
009
can
adia
n H
eavy
(Bow
Riv
er)
15ti
aX
-ae
Ri 2
009
Wes
t te
xas
inte
rmed
iate
5ti
aX
-ae
Ri 2
009
Sou
rce:
iHS
ce
Ra
. N
ote:
So
R =
ste
am-t
o-oi
l rat
io.

36 © 2010, iHS ceRa inc.
No portion of this report may be reproduced, reused, or otherwise distributed in any form without prior written consent.
IHS CERA Special Report
fUEL COmBUSTION GHG EmISSIONS
The majority (about 70 to 80 percent) of life-cycle GHG emissions result from fuel combustion. In a complex refinery configured to not make fuel oil, as much as 95 percent of the liquid products yielded from the refinery are diesel, distillate, or gasoline; the remaining products are light liquids such as propane and butane. A complex refinery is defined as a refinery with a coking unit that converts the entire heavy portion of the barrel into light transportation fuels and petroleum coke.
In addition to liquid products, the refinery also yields petroleum coke. The petroleum coke is a by-product of creating the refined products. It can be used for a variety of applications, but the most typical use is in power generation. Because the petroleum coke is a by-product of the refined products and is a substitute for using coal in power generation, the emissions from burning coke are not included in the combustion emissions within this analysis. There are some incremental emissions from substituting petroleum coke instead of coal for power generation, but for the purposes of this comparison, the difference is not considered material enough to have an impact on the comparative results.
To estimate the combustion emissions for one barrel of refined products produced from different crudes in a complex refinery, we apportioned the GHG emissions to the yield of gasoline, diesel, distillate, and gas liquids from each crude (see Table A-5). On average, across a range of heavy, medium, light, SCO, dilbit, and bitumen crudes, the combustion emissions for one barrel of refined products averaged 384 kgCO
2 per barrel of refined
products (plus or minus 2 percent). Due to the relatively small variance associated with the combustion emissions from the different crude types, an average value was applied to all cases within our comparison. Note, if the petroleum coke was included, the combustion emissions for the average crude would be 432 kgCO
2 per barrel of crude.
Table A-2
Summary of Crude Transportation GHG Emissions, Average Values, and Sources
average "crude oil transportation" Kgco2e
per Barrel of Refined products
Range of "crude oil transportation" Kgco2e
per Barrel of Refined products Sources
energy consumed to transport any bitumen or crude within North america and latin america
5.5 1-14 tiaX-aeRi 2009, Jacobs-aeRi 2009, Mccann 2007, Doe/Netl 2008
crude transported from rest of the world
9.1 4-14 tiaX-aeRi 2009, Jacobs-aeRi 2009, Mccann 2007, Doe/Netl 2008
Source: iHS ceRa.

37
IHS CERA Special Report
© 2010, iHS ceRa inc. No portion of this report may be reproduced, reused, or otherwise distributed in any form without prior written consent.
Table A-3
Summary of Crude Refining GHG Emissions, Average Values, and Sources
average "crude Refining" Kgco2e
per Barrel of Refined products
Range of "crude Refining" Kgco2e
per Barrel of Refined products Sources
light conventional crude (greater than 32 degrees api)
42 30–60 tiaX-aeRi 2009, Jacobs-aeRi 2009, Mccann 2007
Medium conventional crude (greater than 26 to 32 degrees api)
56 44–67 tiaX-aeRi 2009, Jacobs-aeRi 2009, Mccann 2007, Doe/Netl 2008
Heavy conventional crude (greater than 20 to 26 degrees api)
60 47–65 tiaX-aeRi 2009, Jacobs-aeRi 2009, Doe/Netl 2008
extra Heavy (less than 20 degrees api)
73 67–79 tiaX-aeRi 2009, Jacobs-aeRi 2009
Sco 47 32–64 GReet, GHGenius, RaND 2008, capp 2008, tiaX-aeRi 2009, Jacobs aeRi 2009, NeB 2008
Bitumen 85 Jacobs aeRi 2009Dilbit 70 calculated assuming 70%
bitumen and 30% natural gas condensate (30 kgco2e per barrel assumed for refining of condensate)
Source: iHS ceRa.
Table A-4
Summary of Refined Product distribution GHG Emissions, Average Values, and Sources
average "crude oil Refining" Kgco2e
per Barrel of Refined products
Range of "crude oil Refining" Kgco2e
per Barrel of Refined products Sources
Distribution from refinery to point of sale
2.1 2–2.6 tiaX-aeRi 2009, Jacobs-aeRi 2009, Doe/Netl 2008
Source: iHS ceRa.

38 © 2010, iHS ceRa inc.
No portion of this report may be reproduced, reused, or otherwise distributed in any form without prior written consent.
IHS CERA Special Report
ESTImATING GHG EmISSION fOR THE AVERAGE CRUdE CONSUmEd IN THE UNITEd STATES
The estimated life-cycle emissions for the average crude consumed in the United States are sourced from a November 2008 paper written by DOE/NETL, Development of Baseline Data and Analysis of Life Cycle Greenhouse Gas Emissions of Petroleum-Based Fuels. The paper estimates the average crude extraction emissions by country for top suppliers of crude to the United States in 2005. We calculated the average GHG emissions for extracting the average barrel consumed in the United States by weighting the country-level emissions by the portion of total crude supply from each country.
We calculated the average extraction emissions for a barrel of oil consumed the United States at 39 kgCO
2e per barrel (see Table A-6). The margin of error associated with this estimate is
larger than that for any individual crude source, owing to the numerous crude types within each country and the difficulties of modeling and finding data for each crude type.
The following example with oil sands illustrates this point, but this type of complexity is inherent for each country listed. Multiple crudes are produced and blended within each jurisdiction, and it is very difficult to precisely measure each country’s average. The oil sands values used in the DOE/NETL study assume extraction emissions of 122 kgCO
2e
per barrel for all SCO and 81 kgCO2e per barrel for all dilbit blends. The average oil
sands GHG extraction emissions are calculated using the percent of SCO and dilbit blend imported into the United States in 2005. The oil sands emission estimates are on the high side for these two products—our best estimate values are 80 kgCO
2e per barrel for SCO
and between 50 and 60 kgCO2e per barrel for dilbit. Further, this is a best estimate and not
a precise number. Many types of bitumen blends and qualities of SCO are imported, and the available data does not track imports at this level of granularity.
Over time the average crude consumed in the United States is changing. This value is a threshold to compare emissions over time, and it should be viewed as a baseline rather than an absolute or precise measure of the emissions from the average crude consumed within the United States.
The refining and transportation emissions for the average crude consumed within the United States were calculated using assumptions consistent with the normalized data used to compare all other crude sources. For instance, the refinery emissions were calculated by weighting the refining emissions by the portion of US crude supply of each crude type. The transportation
Table A-5
Combustion Emissions for Refined Products
Refined product kgco2 per BarrelGasoline 375Diesel/Distillate 422Gas liquids 231
Source: Doe/Netl 2008.
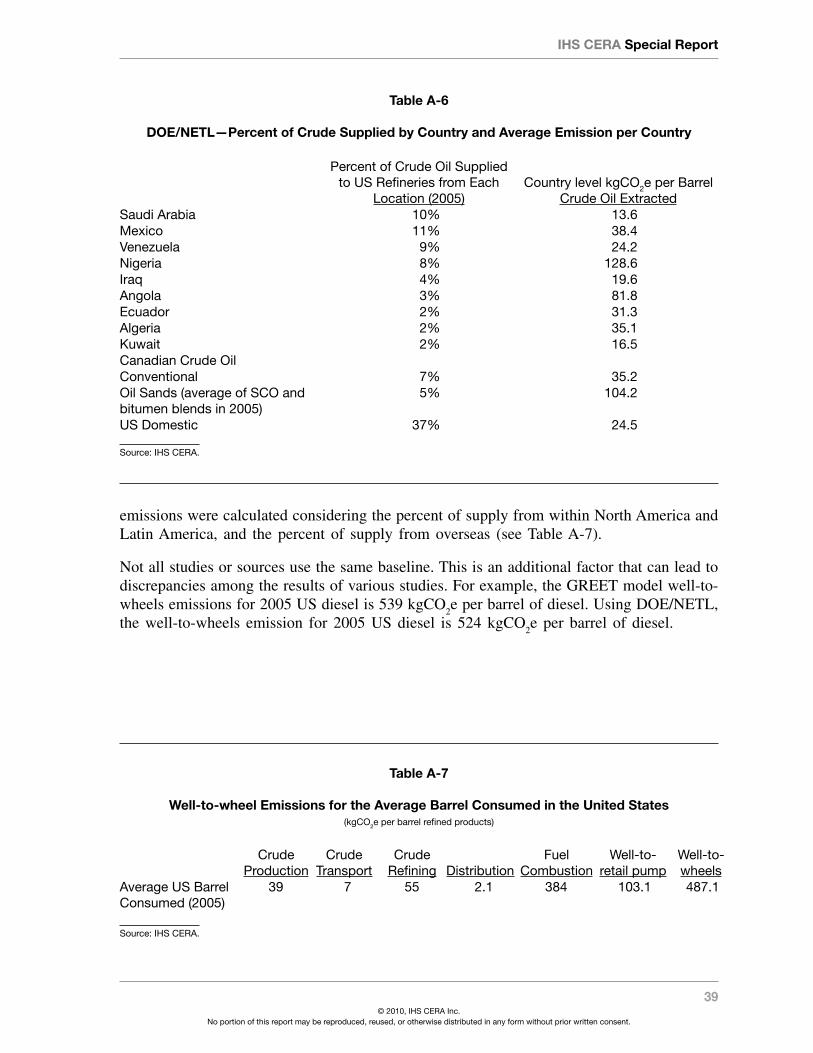
39
IHS CERA Special Report
© 2010, iHS ceRa inc. No portion of this report may be reproduced, reused, or otherwise distributed in any form without prior written consent.
emissions were calculated considering the percent of supply from within North America and Latin America, and the percent of supply from overseas (see Table A-7).
Not all studies or sources use the same baseline. This is an additional factor that can lead to discrepancies among the results of various studies. For example, the GREET model well-to-wheels emissions for 2005 US diesel is 539 kgCO
2e per barrel of diesel. Using DOE/NETL,
the well-to-wheels emission for 2005 US diesel is 524 kgCO2e per barrel of diesel.
Table A-6
dOE/NETL—Percent of Crude Supplied by Country and Average Emission per Country
percent of crude oil Supplied to US Refineries from each
location (2005)country level kgco2e per Barrel
crude oil extractedSaudi arabia 10% 13.6Mexico 11% 38.4Venezuela 9% 24.2Nigeria 8% 128.6iraq 4% 19.6angola 3% 81.8ecuador 2% 31.3algeria 2% 35.1Kuwait 2% 16.5canadian crude oilconventional 7% 35.2oil Sands (average of Sco and bitumen blends in 2005)
5% 104.2
US Domestic 37% 24.5
Source: iHS ceRa.
Table A-7
well-to-wheel Emissions for the Average Barrel Consumed in the United States(kgco2e per barrel refined products)
crude production
crude transport
crude Refining Distribution
Fuel combustion
Well-to-retail pump
Well-to-wheels
average US Barrel consumed (2005)
39 7 55 2.1 384 103.1 487.1
Source: iHS ceRa.

40 © 2010, iHS ceRa inc.
No portion of this report may be reproduced, reused, or otherwise distributed in any form without prior written consent.
IHS CERA Special Report
SUmmARy Of wELL-TO-wHEELS GHG EmISSIONS fOR OIL SANdS ANd CONVENTIONAL CRUdES
Table A-8 shows the values presented in Figures 3 and 4 of this study.

41
IHS CERA Special Report
© 2010, iHS ceRa inc. No portion of this report may be reproduced, reused, or otherwise distributed in any form without prior written consent.
Tab
le A
-8
wel
l-to
-whe
els
Gre
enho
use
Gas
Em
issi
ons
fo
r O
il S
and
s an
d C
onv
enti
ona
l Cru
de
Oils
(dat
a fr
om
fig
ures
3 a
nd 4
)(k
gco
2e p
er b
arre
l refi
ned
pro
duc
ts)
cru
de
pro
duc
tion
cru
de
Up
grad
ing
cru
de
tran
spor
tc
rud
e R
efini
ng
Dis
trib
utio
n of
Refi
ned
p
rod
ucts
Fuel
c
omb
ustio
nW
ell-
to-
reta
il p
ump
Wel
l-to
-w
heel
s
per
cent
D
iffer
ence
fr
om
"ave
rage
U
S c
rud
e c
onsu
med
"c
SS
Bitu
men
***
830
5.5
852.
138
417
5.6
559.
615
%M
idd
le e
ast
Hea
vy o
il**
980
9.1
602.
138
416
9.2
553.
214
%c
anad
ian
oil
San
ds:
Sa
GD
Sc
o
6947
5.5
472.
138
417
0.6
554.
614
%c
alifo
rnia
Hea
vy o
il 85
05.
573
2.1
384
165.
654
9.6
13%
Vene
zuel
an p
artia
l Up
grad
er10
30
5.5
472.
138
415
7.6
541.
611
%c
anad
ian
oil
San
ds:
Sa
GD
Bitu
men
690
5.5
852.
138
416
1.6
545.
612
%N
iger
ia l
ight
cru
de
820
9.1
422.
138
413
5.2
519.
27%
can
adia
n o
il S
and
s: M
inin
g S
co
33
475.
547
2.1
384
134.
651
8.6
6%a
vera
ge o
il S
and
s im
por
ted
to
Uni
ted
S
tate
s (2
009)
*45
215.
560
2.1
384
133.
551
7.5
6%
can
adia
n o
il S
and
s: S
aG
D D
ilbit
500
5.5
702.
138
412
7.6
511.
65%
can
adia
n o
il S
and
s: M
inin
g B
itum
en33
05.
585
2.1
384
125.
650
9.6
5%Ve
nezu
ela
- B
acha
que
ro41
05.
573
2.1
384
121.
650
5.6
4%c
anad
ian
oil
San
ds:
Min
ing
Dilb
it26
05.
570
2.1
384
103.
648
7.6
0%a
vera
ge U
S B
arre
l con
sum
ed (2
005)
390
755
2.1
384
103.
148
7.1
0%M
exic
o -
May
a 32
05.
560
2.1
384
99.6
483.
6-1
%a
vera
ge U
S D
omes
tic c
rud
e (2
005)
24.5
05.
552
2.1
384
84.1
468.
1-4
%S
aud
i Med
ium
(ave
)13
09.
156
2.1
384
80.2
464.
2-5
%c
anad
ian
Hea
vy (B
ow R
iver
) 15
05.
560
2.1
384
82.6
466.
6-4
%W
est
texa
s in
term
edia
te5
05.
542
2.1
384
54.6
438.
6-1
0%
Sou
rce:
iHS
ce
Ra
. N
otes
: *a
ssum
es 5
5 p
erce
nt o
f exp
orts
to
the
Uni
ted
Sta
tes
are
dilb
it b
lend
s an
d 4
5 p
erce
nt a
re S
co
(sou
rce:
Ne
B 2
009
oil s
and
s ex
por
ts).
this
is a
bes
t es
timat
e an
d n
ot a
pre
cise
num
ber
as
ther
e ar
e m
any
typ
es o
f ble
nds
and
qua
litie
s of
Sc
o t
hat
are
exp
orte
d.
**S
team
inje
ctio
n is
use
d fo
r p
rod
uctio
n.
***a
ssum
es S
oR
of 3
.35.
12
per
cent
loss
of v
olum
e up
grad
ing
bitu
men
to
Sc
o.
all
Sa
GD
cru
de
pro
duc
tion
case
s as
sum
e an
So
R o
f 3.
all
oil s
and
s ca
ses
mar
ked
“d
ilbit”
, ass
ume
that
the
dilu
ent
is c
onsu
med
in t
he r
efine
ry, w
ith n
o re
cycl
e of
dilu
ents
bac
k to
alb
erta
, and
onl
y 70
per
cent
of t
he b
arre
l is
from
oil
sand
s.a
ll oi
l san
ds
case
s m
arke
d “
Bitu
men
” as
sum
e th
at t
he d
iluen
t is
rec
ycle
d b
ack
to a
lber
ta, a
nd a
ll of
the
bar
rel p
roce
ssed
at
the
refin
ery
is fr
om o
il sa
nds.