Embed Size (px)
Citation preview

11/11/21 12:46 BofA - Global Metals Weekly
https://rsch.baml.com/r?q=LFAHAGAE7oX1lMzDLC7jIw&e=mmatos%40agenciacomma.com&h=IitxVQ#Exhibit_Label_01609 1/9
Global Metals Weekly
Metals are heroes in Net Zero08 November 2021 | Commodities | Global
Key takeawaysA few deliverables from COP26 are key to tackling climate change. Road to Net Zero provides challenges, alsoin investment
Metals demand from EVs, power storage and renewables to increase rapidly to achieve Net Zero. CAGR could beas high as 25%.
Miners need to increase CAPEX to prevent bottlenecks, but spending is running well below what is needed.
COP26 and road to Net ZeroOver the last three decades, climate change has become a focus, leading to a series of agreements. Yet, since the Montreal Protocol in 1987, seen as oneof the most successful multilateral treaties in history, it appears that the journey towards a sustainable low carbon future is still far from approaching thefinish line. Indeed, there is a divergence between the first Nationally Determined Contributions (NDCs) submitted by the parties convening in Paris and whatscientists and experts deem necessary to limit global warming to 'well below' 2 degrees, never mind 1.5 degrees. For the COP26 summit, a few keydeliverables would be desirable, including new and more ambitious NDCs, climate financing and a finalisation of the Paris Rulebook.
Metals demand from EVs, power storage and renewablesDecarbonisation effectively means an electrification of the global economy through renewables, power storage and EVs. To show some of the operationalchallenges, the IEA assumes that installed power generation capacity in metals-intensive renewables and electric vehicle car sales need to rise by factors of4 and 18 respectively by 2030 to achieving Net Zero. Working some of the IEA's Net Zero assumptions into our metals demand models, we calculate CAGRin consumption of 3.6%, 24.6%, 7.6%, 18%, 2.5% and 3.3% for copper, lithium, nickel, cobalt, silver and platinum respectively. Highlighting the potentialgrowth in market size, lithium supply in 2020 was 387Kt, but demand could rise to 3Mt and 5Mt by 2030 and 2050 under Net Zero respectively.
Miners need to increase CAPEXWhat does mean for the mining industry? To facilitate that demand growth, producers need to boost production capacity. True, recycling can help, butultimately, some primary capacity is also needed. Linked to that, we estimate that the industry needs to spend $72B annually out to 2030 just to preventbottlenecks towards achieving Net Zero; this CAPEX requirement does not include any demand growth from traditional consumer segments. To put thisnumber into context, global mining CAPEX averaged around $99.5B in the past decade; this number includes outlays on iron ore, as well as coal and is moreof a steady state spend. Hence, it does not necessarily factor in all the additional investment required to support decarbonisation. As such, operators areunderspending massively, suggesting that CAPEX may need to almost double going forward for the world to hit Net Zero by 2050.
Metals are heroes in Net Zero
The roadmap to COP26Over the last three decades, climate change has become a focus, leading to a series agreements. Yet, since the Montreal Protocol in 1987 (Exhibit 1), seen
as the most successful multilateral treaties in history, it appears that the journey towards a sustainable low carbon future is still far from approaching the
finish line. Aster Montreal, an important milestone was achieved through the UN Framework Convention on Climate Change (UNFCCC) in 1992, the first
ever global treaty to explicitly address climate change and to formally set up a forum for debate and negotiations as the 'Conference of the Parties' (COP).
Aster the Kyoto Protocol came into force in 2005, many argued that more ambitious goals are needed, especially considering the numerous climate-related
natural catastrophes that occurred in recent years. Indeed, even the "well below 2°C" (or "preferably" 1.5 °C) target of the Paris Agreement in 2015 is being
questioned as out of reach on the basis of the current national pledges.
Exhibit 1: Outcomes from previous summits
Tackling climate change has been a focus since 1987
Agreement Main goal Outcome
Montreal Protocol on Substances thatDeplete the Ozone Layer, 1987
Reduce the harmful impact that certain substances (e.g.chlorofluorocarbons and hydrofluorocarbons) have on thestratospheric ozone layer
Parties successfully phased out 98% ofozone-depleting substances compared to1990 levels.98% of ozone-depletingsubstances compared to 1990 levels
UN Framework Convention on ClimateChange (UNFCCC), 1992
Stabilize greenhouse gas concentration in the atmospherewith the ultimate aim of preventing the "dangerousanthropogenic interference with the climate system"
Conference of The Parties (COP), theKyoto Protocol and the Paris Agreement
Kyoto Protocol, 2005 First commitment period (2008-2012): average 5%reduction of CO2 emissions compared to 1990 levels(equivalent to a 1 GtCO per year)
Second commitment period (2013-2020): at least 18%reduction of CO2 emissions compared to 1990
The average annual aggregated GHGemissions of Annex B-2012 countrieswere 24% below the base-year emissionsduring the first commitment period
Paris Agreement, 2015 Limit global warming to well below 2 degrees Celsius,preferably to 1.5, compared to pre-industrial levels
Parties are currently falling short of theiroriginal pledges
Source: IEA< IPCC, UNEP, BofA Global Research
BofA GLOBAL RESEARCH
Is the Paris Agreement enough?There seems to be a divergence between the first Nationally Determined Contributions (NDCs) submitted by the parties convening in Paris and what
scientists and experts deem necessary to limit global warming to 'well below' 2 degrees, never mind 1.5 degrees. To that point, according to the
International Energy Agency report even if successfully fulfilled, the pledges to date would still leave around 22 billion tonnes of CO emissions worldwide
in 2050. The continuation of that trend would be consistent with a temperature rise in 2100 of around 2.1 °C. On a more positive note, the
Intergovernmental Panel on Climate Change (IPCC) believes that the Paris Agreement target is achievable, but only if unparalleled action is taken
immediately . In this regard, the Glasgow COP is seen as the ultimate deadline for countries to come forward with new and more ambitious NDCs. A similar
narrative emerges from the UN Environment Programme's (UNEP) latest Emissions Gap Report 2021: The Heat Is On , which shows that the new NDCs,
combined with other mitigation pledges, put the world on course for a global temperature rise of 2.7% by the end of the century.
This assessment raises the stakes for the Glasgow summit even further, especially considering that such an outcome refers to the best-case scenario
where the new unconditional commitments are assumed to be met. For global warming to be capped to 1.5 °C, an additional 28 GtCO2 of CO e need to be
taken off annual emissions in the next eight years, the equivalent of almost half of current GHG emissions (for the upper end target of 2 °C the figure drops
to 13 GtCO2e).
2
2
32
4
5
2

11/11/21 12:46 BofA - Global Metals Weekly
https://rsch.baml.com/r?q=LFAHAGAE7oX1lMzDLC7jIw&e=mmatos%40agenciacomma.com&h=IitxVQ#Exhibit_Label_01609 2/9
What is net zero?
What is Net Zero? The balance of reducing and removing emissionsWe recently published our Net Zero Primer (see Thematic Investing: "Transwarming" World: Net Zero Primer 21 October 2021 (https://rsch.baml.com/r?
q=cXumYlUzQ6sNn!FV74h5oA)), outlining potential pathways to keeping global warming within 1.5°C. All require rapid reduction in greenhouse gas
emissions, notably reaching "net zero" by 2050. Net Zero is a measure of carbon neutrality through a balance of eliminating and removing carbon emissions
from the atmosphere. Exhibit 2, first published in Global Energy Weekly: When oil and gas collide 29 October 2021 (https://rsch.baml.com/r?
q=betqbtVDZPQNn!FV74h5oA) shows emission profiles out to 2050, including Net Zero; see also (Global Energy Weekly: Takes a lot of zero$ to zero in on
carbon 28 May 2021 (https://rsch.baml.com/r?q=YhvYgZNl6XINn!FV74h5oA)).
Exhibit 2: Different emission profiles out to 2050, including Net Zero
The Net Zero Emission is an onerous strategy
0
5
10
15
20
25
30
35
40
1980 1985 1990 1995 2000 2005 2010 2015 2019 2020 2025 2030 2035 2040 2045 2050
Status quo Accelerated Aggressive Net zero
Gt CO2e
Source: IEA, BofA Global Research
BofA GLOBAL RESEARCH
The word "net" is the key. This means that whilst eliminating emissions to zero would be ideal, not every activity has to be zero emission to be compliant in
a net zero economy. However, those that continue to emit greenhouse gases would need to be captured and removed from the atmosphere (Exhibit 3).
Exhibit 3: Net Zero: a measure of carbon neutrality by reducing and removing emissions
To achieve net zero requires a combination of reducing direct emissions and/or removing them fromindustrial activity or atmospheric emissions with nature or technology based solutions
Source: Green Match, BofA Global Research
BofA GLOBAL RESEARCH
Exhibit 4 and Exhibit 5 taken an initial stab at the challenges of achieving Net Zero, highlighting some of the IEA's assumptions over capacity additions in
metals-intensive renewables, along electric vehicle car sales, required over the coming years.
Exhibit 4: Capacity additions, GW
Renewables capacity installations need to grow by a factor of 4
0
200
400
600
800
1000
1200
2020 2030
SolarPV Wind
x 4
Source: IEA, BofA Global Research
BofA GLOBAL RESEARCH
Exhibit 5: Electric car sales, millions
EV sales should rise 18 times by 2030
0
10
20
30
40
50
60
2020 2030
x 18
Source: IEA, BofA Global Research
BofA GLOBAL RESEARCH
Good COP / Bad COP? What is COP26, and what is expected?The United Nations hold a Climate Change Conference every year attended by the ~200 country members of the UN's Framework Convention on Climate
Change. Countries negotiate and commit to levels of emissions reductions, and how they'll be financed and implemented. The country emissions reduction
pledges ("Nationally Determined Contributions", or NDCs) were launched in 2015 at COP21 in Paris, where countries agreed to review and update them
every five years, with COP26 being the first such update due. In the run-up to this year's Conference of the Parties, the urge to operationalize the Paris
Agreement has been steadily increasing. Devastating weather events and the recent energy crisis, which unveiled the still severe fossil fuel dependency of
Asia and Europe, highlighted how challenging a successful conclusion of the COP climate talks are.
Thus, the success of COP26 will be determined by the levels of country commitments to reach net zero, the specific policies and finance that will be
mobilised to achieve it. What's expected from COP26 (per the official COP26 website):
The What: Net Zero: Countries are due to submit 2030 emissions reductions targets to remain on track to achieve net zero by 2050. Severalnations have already pre-announced their targets such as China (committing to peak emissions by 2030 and net zero by 2060, announcedSeptember 2020), and the most recent pledge from the UAE to reach net zero by 2050 (October 2021).
The How: Climate Action: To deliver the mid-long dated targets, specific policies and actions are expected, many of which are due to beannounced and publicised at or ahead of COP26, specifically accelerating the phase out of coal, curtailing deforestation, speeding up thetransition to electric vehicles, and encouraging investment in renewable energy.
Climate Finance: In addition to funding their own targets, developed nations committed in 2009 to mobilise $100bn per year to emergingmarkets on climate action by 2020; per the OECD's latest figures (2019), $80bn was spent, with COP26 expected for nations to increase thefigure to bridge the gap, as well as begin negotiations for the next financing milestone and how it can be delivered (e.g. via aid, grants and trade).The UN's Environment Programme estimate adaptation costs alone in developing countries will reach $140-300bn by 2030, and $280-500bn by2050. Africa alone could require $3tn climate action investment by 2030 (source: Climate Policy Initiative).
COP26: What does success look like?Although apparently straightforward, evaluating the outcome of any type of negotiation or agreement thereof - in the case of COP26, all Parties
committing to or, even better, improving the original targets set up in Paris - always leaves room for debate, depending on which perspective one chooses
to take on. Furthermore, projections of future GHG emissions based on announced new NDCs, forecasts on the future developments in the renewable
space and the speed of transition to clean vehicles, are just a few of the potential discussion points. However, given the general consensus around the
current status quo with respect to the Paris Agreement targets - it is widely agreed that these are most likely to be missed - the following list could be a
good starting benchmark for evaluation:
New and more ambitious NDCs: as many governments as possible need to submit new and more ambitious NDCs by the end of the two-weekclimate talks. China and India are now among the world's top emitters, along with the United States. Developed countries have argued that thosecountries should take on a greater responsibility in addressing climate change. Also, simply updating the previous targets is not enough. It isbelieved that the Parties should commit to unprecedented goals as well as actions with the aim of gearing towards the lower target in terms of

11/11/21 12:46 BofA - Global Metals Weekly
https://rsch.baml.com/r?q=LFAHAGAE7oX1lMzDLC7jIw&e=mmatos%40agenciacomma.com&h=IitxVQ#Exhibit_Label_01609 3/9
global warming, embedded by the Paris Agreement. The difference between 1.5 °C and 2 °C is substantial and could make the difference in thecombat to prevent further catastrophic events. Indeed, the UK's all-encompassing aim for the Glasgow summit is to "keep 1.5 degrees alive".
Climate financing. Developed nations to honour the pledge they put forth in 2009 of mobilizing $100 billion per year by 2020 to supportdeveloping countries in their clean energy transition. The official figures for 2020 will not be finalized until 2022, but it is rather evident that the
goal was missed last year. Indeed, as a prelude to COP26 the OECD published a report showing that rich countries fell short of their promisesand that developing countries will have to wait until 2023 to see the pledged funds delivered. So far, the climate finances effectively put on thetable by developed countries totalled USD 79.6B in 2019. Missing these targets not only hinders the path to climate abatement ambitions, butalso the credibility of any type of pledge or commitment brought forward by developed nations.
Finalize the Paris Rulebook. If the COP21 in Paris was all about the 'What', COP26 has to be the final step for finalizing the 'How', i.e. determiningthe implementation plan, the so-called "Paris Rulebook". This includes:
1. Defining a solution on carbon markets by designing an appropriate and robust system of carbon credits consistent with the "Net-Zero" policy. A greatfocus is placed on international carbon markets which currently require more clarity around its system of rules. Further scrutiny is also needed toguarantee fairness and to prevent countries from unlawfully benefit from trading carbon credits without actually contributing to mitigate climatechange;
2. Resolving the issues of transparency and reporting, by establishing an effective system that encourages the Parties to stay on track with theircommitments.
Net zero means electrificationDecarbonisation effectively means an electrification of the global economy. Exhibit 6 picks up on this, highlighting how a new infrastructure could look like;
granted, the chart is a simplification because it references for instance electrolysis/ hydrogen to tackle intermittency issues and that function that could
also be performed by other technologies, including batteries.
Exhibit 6: Integration of Variable Renewable Energy into end uses by means of hydrogen
Renewables, power storage and electricity usage to create a new energy infrastructure
Source: IRENA (2018) Hydrogen from renewable power technology outlook for the energy transition
BofA GLOBAL RESEARCH
Table 1 revisits the implications of de-carbonisation on demand for the MIFTs (metals important for future technologies).
Table 1: Applications helping to decarbonise the economy, along the commodities required
Many mined commodities are critical in technologies required to reducing emissions
Power applications Automotive Others
WindSolar
photovoltaicEnergystorage
Electricvehicles
Electricmotors
Carboncapture and
storage
Light emittingdiodes
Aluminium X X X X X X
Chromium X X X
Cobalt X X X
Copper X X X X X X
Indium X X X
Lithium X
Molybdenum X X X X
Neodymium (proxy for rareearths)
X X
Nickel X X X X X X
Silver X X X
Steel X
Zinc X X
Source: World Bank, The Growing Role of Minerals and Metals for a Low Carbon Future, BofA Global Research
BofA GLOBAL RESEARCH
Meanwhile, Exhibit 5 makes the transitions into the metals space, summarising the impact different Net Zero scenarios have on demand for some of the
key metals. The last two columns are perhaps the most notable, suggesting compound annual growth rates of up to 25% YoY out to 2030.
Exhibit 7: Metals demand from selected technologies required to achieving Net ZeroCompound annual growth rates of up to 25% YoY are required out to 2030
Supply Demand
Batteries Transportation Energy Hydrogen Total CAGR
2020 2030 2050 2030 2050 2030 2050 2030 2050 2030 2050 2030 2050
Copper 23,389,096 5,870,114 7,921,539 4,117,691 4,470,435 9,987,806 12,391,974 3.5% 1.4%
Lithium 386,947 3,141,497 5,410,475 3,141,497 5,410,475 24.7% 9.4%
Nickel 2,615,340 2,838,432 4,737,969 2,838,432 4,737,969 7.6% 3.5%
Cobalt 142,883 607,720 1,024,626 607,720 1,024,626 18.0% 7.3%
Silver 30,687 8,554 10,477 8,554 10,477 2.5% 1.0%
Platinum 6,415,424 1,755,551 4,820,573 747,964 1,120,786 2,503,515 5,941,359 3.3% 2.2%
Source: IEA, BofA Global Research
BofA GLOBAL RESEARCH
Miners need to increase CAPEXWhat does mean for the mining industry? To facilitate that demand growth, miners need to boost CAPEX. Exhibit 8 picks up on this, suggesting that the
industry needs to spend $72B annually out to 2030 just to prevent bottleneck towards achieving Net Zero; this CAPEX requirement does not include any
demand growth from traditional consumers.
Exhibit 8: CAPEX requirements across the MIFTs
Miners need to spend $72B just to facilitate demand growth for the MIFTs; this figure does notinclude consumption increase from traditional sectors not directly related to de-carbonisation
Demand Capexintensity
Growth capex and depreciation,total
2030 2050 US$/t 2030 2050
Copper 9987.8 12392.0 20000 390 501
Lithium 3141.5 5410.5 3000 19 33
Nickel 2838.4 4738.0 50000 287 479
Cobalt 607.7 1024.6 4000 5 8
Silver 8.6 10.5 30 9 3
6

11/11/21 12:46 BofA - Global Metals Weekly
https://rsch.baml.com/r?q=LFAHAGAE7oX1lMzDLC7jIw&e=mmatos%40agenciacomma.com&h=IitxVQ#Exhibit_Label_01609 4/9
Platinum 2503.5 5941.4 1800 9 22
Total capex, US$BN 719 1,045
Annual average,US$ BN 72 35
Source: BofA Global Research
BofA GLOBAL RESEARCH
To put this number into context, global mining CAPEX averaged around $99.5B in the past decade (Exhibit 9); this number includes outlays on iron ore, as
well as coal and is more of a steady state spend. Hence, it does not necessarily factor in all the additional investment required to support decarbonisation.
As such, operators are underspending massively, suggesting that CAPEX may need to almost double going forward for the world to hit Net Zero by 2050.
Exhibit 9: Global Metals and Mining Capex
Global Capex has averaged around $99.5B in the past decade
0
40
80
120
160
2010 2011 2012 2013 2014 2015 2016 2017 2018 2019 2020
US$BN
Source: S&P, BofA Global Research
BofA GLOBAL RESEARCH
Exhibit 10: Capex among selected minersMiners remain cautious in their Capex outlays
01020304050607080
2008 2010 2012 2014 2016 2018 2020E 2022E
BHP RIO AAL GLEN VALEANTO FCX TECK FMG S32
US$BN
Source: company reports, BofA Global Research
BofA GLOBAL RESEARCH
Net Zero and demand from renewables, storage and EVs,
Electricity generation, storage and transportation key for metals demandRevisiting the breakdown of global emissions, Exhibit 11 shows the contribution individual sectors are making, with that power and transportation among
heavyweight GHG generators. Hence, it is perhaps not surprising that those sectors are remain the focus in tackling climate change.
Exhibit 11: Global CO2 emissions by sector
Power and transport are among the key emitters
Power coal28%
Power gas9%Power oil
2%Transport23%
Industry23%
Buildings10%
Others5%
Source: IEA
BofA GLOBAL RESEARCH
Renewables: installations of solar and wind keep acceleratingExhibit 12 picks up on power generation, outlining that installed capacity of renewables needs to increase gradually in the coming years to achieve Net
Zero. Indeed, according to the IEAs calculations, the share of solar PV and wind in total generation should reach 40% and 68% in 2030 and 2050
respectively.
Exhibit 12: Key development milestones for renewables
Solar PV and wind are set to account for 40% and 68% of in 2030 and 2050
Power generation capacity 2020 2030 2050
Total installed capacity (GW) 10,000 16,885 30,227
Renewables
Installed capacity (GW) 2,900 10,300 26,600
Share in total generation 29% 61% 88%
Total solar PV 1,450 6,867 17,733
Total wind 1,450 3,433 8,867
Other 7,100 6,585 3,627
Source: IEA< BofA Global Research
BofA GLOBAL RESEARCH
This has implications for a range of MIFTs, especially copper and silver. Exhibit 13 picks up on this, outlining that copper demand could increase by 4Mt
annually from investment into renewables generation, not factoring in power generation capacity.
Exhibit 13: Copper demand, tonnes
Renewables could support copper demand at +4Mt
2020 2030 2050
From solar 7,975,000 37,766,667 97,533,333
From Wind 8,700,000 20,600,000 53,200,000
From others 7,100,000 6,585,246 3,627,273
Total, cumulative 23,775,000 64,951,913 154,360,606
Copper demand annually, tonnes 4,117,691 4,470,435
Source: IEA, BofA Global Research
BofA GLOBAL RESEARCH
Similarly, demand for silver, which is used in solar panels, could also be materially higher in the coming years; to put the annual demand figures into
context, demand from solar panels was around 3,000 tonnes in 2019/20.
Exhibit 14: Silver demand in ounces and tonnesSilver demand could rise rapidly, if more solar panels are installed
2020 2030 2050
Solar capacity installed, GW 1,450 6,867 17,733
Watt/ cells 3.51 4.15 4.15
# of cells 413,477,789,816 1,655,042,735,043 4,274,188,034,188
Oz/W 0.003644 0.002572 0.002572
Ounces 1,506,608,043 4,256,862,597 10,993,450,978
Silver demand cumulative,tonnes 46,861 132,403 341,935
Silver demand annually, tonnes 8,554 10,477
Source: IEA, BofA Global Research
BofA GLOBAL RESEARCH
11/11/21 12:46 BofA - Global Metals Weekly
https://rsch.baml.com/r?q=LFAHAGAE7oX1lMzDLC7jIw&e=mmatos%40agenciacomma.com&h=IitxVQ#Exhibit_Label_01609 5/9
Rising silver usage is remarkable also when keeping in mind that PV producers are reducing the silver content per cell (Exhibit 15), while boosting the watts
each cell can generate (Exhibit 16).
Exhibit 15: Silver loadings per cell in solar panel
PV manufacturers are reducing silver loadings in solar panels…
0.00000.00050.00100.00150.00200.00250.00300.00350.00400.0045
2016 2018 2020 2022 2024 2026 2028
troz/cell
Source: Silver Institute, BofA Global Research
BofA GLOBAL RESEARCH
Exhibit 16: Watts per cell in solar panels
… while at the same time boosting wattage per cell
0.00.51.01.52.02.53.03.54.04.5
2016 2018 2020 2022 2024 2026 2028
W/cell
Source: Silver Institute, BofA Global Research
BofA GLOBAL RESEARCH
Energy storage: batteries and hydrogenBattery storage to boost lithium demandWhile renewables have a lower carbon footprint, intermittency, ie the imbalance between periods of electricity generation and when power is needed, is an
issue. To mitigate these risk, electricity storage is needed and two hydrogen, as well as batteries are among the technological solutions discussed to
accomplish that.
Batteries are relatively straightforward as power storage. Exhibit 17 picks up on this, outlining that battery storage is set to increase under the IEA's Net
Zero scenarios; in our calculations, we assume that lithium-ion batteries are the technology of choice.
Exhibit 17: Lithium demand in tonnes
Battery storage could add to lithium demand
2020 2030 2050
Battery storage (GW) 18 590 3100
Lithium demand 1,336 43,778 230,020
Source: IEA, BofA Global Research
BofA GLOBAL RESEARCH
The hydrogen economy is bullish platinumMeanwhile, the hydrogen economy could potentially have profound implications for the global economy. Indeed, electrolysis can be used to store power
generated from renewables as hydrogen, before the gas is being re-converted into electricity as the needs arise. At the same time, green hydrogen, ie
hydrogen generated from renewables, can also be used in eg steel mills and to power vehicles. Exhibit 18 picks up on this, outlining the IEA's expectations
over low-carbon hydrogen production.
Exhibit 18: Platinum demand from electrolysis
Electrolysis could be a major boost to platinum offtake
2020 2030 2050
Total production hydrogen-based fuels (Mt) 87 212 528
Low-carbon hydrogen production 9 150 520
share of fossil-based with CCUS 95% 46% 38%
share of electrolysis-based 5% 54% 62%
Low carbon hydrogen, electrolysis-based 0.45 81 322.4
Platinum installed at 3oz 19,286 3,471,429 13,817,143
Average annual demand 345,214 517,286
Platinum installed at 10oz 64,286 11,571,429 46,057,143
Average annual demand 1,150,714 1,724,286
Source: IEA, BofA Global Research
BofA GLOBAL RESEARCH
Batteries and FCEVs to reduce emissions in transportationShisting to transportation, Exhibit 19 outlines that electrified vehicles should account for 64% of car sales by 2030. This is well above our assumption of a
31% penetration rate that we currently factor into our supply and demand models. Beyond passenger vehicles, the IEA's scenarios also incorporate targets
on commercial vehicles. This matters especially for platinum as we believe that heavier vehicles will predominantly run on fuel cells, rather than batteries.
Exhibit 19: Key development milestones in transforming the global transport sector
By 2050, virtually no ICE vehicles will be sold under IEA Net Zero
Road transport 2020 2030 2050
Share of PHEV, BEV and FCEV insales:
cars 5% 64% 100%
two/three-wheelers 40% 85% 100%
bus 3% 60% 100%
vans 0% 72% 100%
heavy trucks 0% 30% 99%
Biofuel blending in oil products 5% 13% 41%
Infrastructure
EV public charging (million units) 1.3 40 200
Hydrogen refuelling units 0 90 0
Share of electrified rail lines 34% 47% 65%
Source: IEA, BofA Global Research
BofA GLOBAL RESEARCH
Error! Reference source not found. makes the transition towards metals demand, suggesting that demand is set to increase significantly across the battery
raw materials lithium, cobalt and nickel.
Exhibit 20: Lithium, cobalt and nickel demand from EVsDemand is set to increase form both BEVs and PHEVs
2020 2030 2050
LITHIUM
BEV 109,258 2,978,627 5,105,920
PHEV 15,558 119,092 74,534
Total 124,816 3,097,719 5,180,455
COBALT
BEV 43,896 584,356 1,009,884
PHEV 6,251 23,364 14,742
Total 50,147 607,720 1,024,626
NICKEL
BEV 83,144 2,729,308 4,669,801
PHEV 11,839 109,124 68,168
Total 94,983 2,838,432 4,737,969

11/11/21 12:46 BofA - Global Metals Weekly
https://rsch.baml.com/r?q=LFAHAGAE7oX1lMzDLC7jIw&e=mmatos%40agenciacomma.com&h=IitxVQ#Exhibit_Label_01609 6/9
Source: IEA, BofA Global Research
BofA GLOBAL RESEARCH
Meanwhile, platinum offtake should rise as more fuel cell electric vehicles are being put into the road.
Exhibit 21: Platinum demand in ounces
FCEVs could add to platinum demand
2020 2030 2050
Two/three-wheelers 40% 85% 100%
Bus 3% 60% 100%
Vans 0% 72% 100%
Heavy trucks 0% 30% 99%
Demand, oz
Bus 6,147 125,469 209,114
Vans 401,762 558,003
Trucks 1,228,320 4,053,456
Total 6,147 1,755,551 4,820,573
Source: IEA, BofA Global Research
BofA GLOBAL RESEARCH
All along, electrified vehicles tend to have more copper-intensive wiring, with Exhibit 22 showing that copper demand will likely increase in the coming
years.
Exhibit 22: Copper demand in tonnes
Copper demand from automotive is set to increase going forward
2020 2030 2050
ICE 2,480,158 1,280,950 0
EV 204,709 4,572,268 7,836,614
PHEV 507 7,051 64,574
Sub-total vehicles 2,685,373 5,860,270 7,901,189
Sub-total charging stations 0 10 20
Total 2,685,373 5,860,280 7,901,209
Source: IEA, BofA Global Research
BofA GLOBAL RESEARCH
Appendix
Table 2: Price forecasts, fundamental drivers and risksWe are bullish a range of cyclical commodities
Metal 2021E 2022E Fundamental drivers
Aluminium $2,465/t112c/lb
$3,250/t147c/lb
Capacity growth in China is slowing and ex-China is reluctant to invest in new capacity
China has exported 4.5-5mt annualised of aluminium units. While these shipments are not
strictly unwrought aluminium, they have nonetheless subdued fundamentals in World ex-
China. Falling exports are bullish.
We expect a deficit from 2021.
D: N
D: C
U: S
U: S
Copper $9,345/t424c/lb
$9, 875/t448c/lb
Demand in China rebounded impressively in 2020, but has been slowing; property and auto are
the key concerns
Inventories are low, which is supportive
Supply additions are set to be limited at the same time
We expect a small deficit for 2021.
D: C
D: g
U: S
U: C
Lead $2,133t97c/lb
$2,251/t102c/lb
There are no immediate scrap and concentrates shortages, suggesting the market could flip
back into surplus
China's demand has slowed structurally, as the ebike market has matured.
D: D
U: S
Nickel $18, 366/t833c/lb
$22,125/t1004c/lb
Nickel demand from electric vehicle producers should rise in the coming years, yet, more NPI
being converted to nickel sulphate
Indonesia is still flooding the global nickel market with nickel units, which should keep prices in
check
We expect a surplus for 2021, but deficits towards 2023
D: N
Phi
D: F
D: S
Zinc $2,914/t132c/lb
$2,750/t125c/lb
The market has rebalanced on significant production curtailments over Covid-19.
Supply is set to come back in 2021, but demand should also rebound, limiting any supply
overhang
Zinc may remain an underperformer, but immediate downside more limited
D: U
D: T
furt
Gold $1,803/oz $1,875/oz Gold has been a trade on US rates and the volume of negative yielding assets.
Stronger inflation would be bearish gold through rising nominal rates, unless CBs cap rates;
more aggressive Fed would help
A weaker USD could also push gold higher.
D: D
D: R
D: H
Silver $25.83/oz $30/oz The silver market has rebalanced on production discipline and demand from new applications
including solar panels
Industrial demand to rebound post COVID-19.
If more spending on solar panels come through, silver should rally above $31/oz.
PlatinumPalladium
$1,093/oz$2,402/oz
$1,313/oz$2,063/oz
Chip shortages cap the upside to prices, but a normalisation of dislocations should ultimately boost
demand
Palladium remains in deficit, so prices should overall remain well supported
While platinum is set to remain in surplus in 2021, the hydrogen economy and substitution should
increasingly stabilise prices.
Iron Ore $157/t CIF $91/t CIF Vale's issues have been defining the iron ore market for a whole and the company is set to increase
production further in 2021.
These units are hitting the market as steel mills in China are cutting production and output
increases slow ex-China
Fundamentals are weakening, so prices should decline further
HCCThermal coal
$207/t$129t
$240/t$130/t
Thermal coal prices should rebound as economies open; energy/ gas markets remain extremely
tight
Supply issues are keeping the met coal market tight.
Brent and WTIcrude oil
$68/bbl$65/bbl
$75/bbl$71/bbl
We project Brent and WTI to average $68/bbl and $65/bbl, respectively, in 2021 and $75 and $71 in 2022.
Our supply and demand forecasts suggest a 1.4mn b/d deficit in 2021 followed by a 400k b/d deficit in 2022.
We forecast global demand will rebound nearly 6mn b/d YoY in 2021 after falling 8.7mn b/d in 2020.
During 2021-23, we forecast demand will grow by more than 9mn b/d, the fastest pace since the 1970s.
Non-OPEC supply should grow roughly 700k b/d YoY in 2021 and an additional 2mn b/d+ in 2022.
We project total US supply will remain flattish in 2021 and rise more than 1.5mn b/d in 2022.
OPEC supplies are set to rise 600k b/d in 2021 and 2.1mn b/d in 2022 as OPEC+ adds back supply and as Iran re
Colours indicate our stance on each commodity: Green = bullish, Yellow = neutral, Red = cautious. Source: BofA Global Research estimates

11/11/21 12:46 BofA - Global Metals Weekly
https://rsch.baml.com/r?q=LFAHAGAE7oX1lMzDLC7jIw&e=mmatos%40agenciacomma.com&h=IitxVQ#Exhibit_Label_01609 7/9
Supply and demand balancesTable 3: Aluminium supply and demand balanceThe aluminium market is expected to tighten 2018-2022E
'000 tonnes 2018 2019 2020 2021E 2022E
Global production 64041 64069 65674 68903 72444
YoY change 1.4% 0.0% 2.5% 4.9% 5.1%
Global consumption 64956 65357 63979 70501 74469
YoY change 3.0% 0.6% -2.1% 10.2% 5.6%
Balance -916 -1288 1695 -1598 -2025
Market inventories 11163 10037 12390 0 0
Weeks of worlddemand 8.9 8.0 10.1 0.0 0.0
LME Cash ($/t) 2110 1813 1704 2465 3250
LME Cash (c/lb) 96 82 77 112 147
Source: SNL, Woodmac, CRU, Bloomberg, company reports, IAI, BofA Global Research
BofA GLOBAL RESEARCH
Table 4: Copper supply and demand balanceCopper will likely be in deficit this year 2018-2022E
'000 tonnes 2018 2019 2020 2021E 2022E
Global production 23507 23444 23389 24624 25647
YoY change 2.0% -0.3% -0.2% 5.3% 4.2%
Global consumption 23654 23681 23528 24866 26084
YoY change 2.5% 0.1% -0.6% 5.7% 4.9%
Balance -147 -237 -139 -241 -437
Market inventories 1583 1351 1212 971 534
Weeks of worlddemand 3.5 3.0 2.7 2.0 1.1
LME Cash ($/t) 6532 5995 6175 9345 9875
LME Cash (c/lb) 296 272 280 424 448
Source: SNL, Woodmac, CRU, Bloomberg, company reports, ICSG, BofA Global Research
BofA GLOBAL RESEARCH
Table 5: Lead supply and demand balanceThere should be no lead shortages 2018-2022E
'000 tonnes 2018 2019 2020 2021E 2022E
Global production 12807 13191 12677 13160 14054
YoY change 0.7% 3.0% -3.9% 3.8% 6.8%
Globalconsumption 12771 12847 12388 13340 13880
YoY change 1.5% 0.6% -3.6% 7.7% 4.0%
Balance 35 344 290 -180 174
Market inventories 489 833 1123 943 1117
Weeks of worlddemand 2.0 3.4 4.7 3.7 4.2
LME Cash ($/t) 2241 1954 1824 2133 2251
LME Cash (c/lb) 102 89 83 97 102
Source: SNL, Woodmac, CRU, Bloomberg, company reports, ILZSG, BofA Global Research
BofA GLOBAL RESEARCH
Table 6: Nickel supply and demand balanceThe nickel market is bifurcated
'000 tonnes 2018 2019 2020 2021E 2022E
Global production 2235 2409 2615 2789 3197
YoY change 5.6% 7.8% 8.6% 6.6% 14.6%
Global consumption 2289 2379 2423 2814 2915
YoY change 7.4% 4.0% 1.8% 16.1% 3.6%
Balance, incl. NPIoversupply -54 30 192 -25 282
Balance, excl. NPIoversupply -54 30 52 -131 54
Market inventories 328 307 377 392 446
Weeks of worlddemand 7.5 6.7 8.1 7.2 8.0
LME price ($/t) 13130 13165 13783 18366 22125
LME price (c/lb) 596 597 625 833 1021
Source: SNL, Woodmac, CRU, Bloomberg, company reports, INSG, BofA Global Research
BofA GLOBAL RESEARCH
Table 7: Zinc supply and demand balanceZinc surpluses will likely remain small 2018-2022E
'000 tonnes 2018 2019 2020 2021E 2022E
Global production 13252 13372 13754 14400 14600
YoY change -2.1% 0.9% 2.9% 4.7% 1.4%
Globalconsumption 14144 13861 13271 14291 14773
YoY change -0.7% -2.0% -4.3% 7.7% 3.4%
Balance -892 -489 484 109 -173
Market inventories 644 589 758 867 693
Weeks of worlddemand 2.4 2.2 3.0 3.2 2.4
LME Cash ($/t) 2923 2404 2265 2914 2750
LME Cash (c/lb) 133 109 103 132 125
Source: SNL, Woodmac, CRU, Bloomberg, company reports, ILZSG, BofA Global Research
BofA GLOBAL RESEARCH
Table 8: Platinum supply and demand balancePlatinum set to be balanced 2018-2022E
'000 ounces 2018 2019 2020 2021E 2022E
Global production 7929 7826 6415 8113 8599
YoY change -1.2% -1.3% -18.0% 26.5% 6.0%
Global consumption 8059 8540 7409 7975 8627
YoY change 0.3% 6.0% -13.3% 7.7% 8.2%
Balance -130 -715 -993 137 -27
Spot ($/oz) 880 865 886 1093 1313
Source: Matthey, company reports, BofA Global Research
BofA GLOBAL RESEARCH
Table 9: Palladium supply and demand balancePalladium should remain undersupplied 2018-2022E
'000 ounces 2018 2019 2020 2021E 2022E
Global production 9,753 10,233 9,011 10,386 11,072
YoY change 4.0% 4.9% -11.9% 15.3% 6.6%
Globalconsumption 10,324 11,418 10,007 9,132 9,540
YoY change 2.6% 10.6% -12.4% -8.7% 4.5%
Balance -571 -1,185 -996 1,254 1,532
Spot ($/oz) 1,030 1,540 2,201 2,402 2,063
Source: Matthey, company reports, BofA Global Research
BofA GLOBAL RESEARCH
Table 10: Iron ore supply and demand balanceIron ore is flipping back into surplus
Wet Mt 2018 2019 2020 2021E 2022E
Global production 2,216 2,211 2,244 2,297 2,365
YoY change 0.5% -0.2% 1.5% 2.4% 2.9%
Global consumption 2,210 2,264 2,291 2,313 2,324
YoY change 2.4% 2.4% 1.2% 0.9% 0.5%
Balance 6 -53 -48 -15 40
Iron ore price(US$/t)
70 93 109 157 91
Source: company reports, CRU, BofA Global Research
BofA GLOBAL RESEARCH
Table 11: Cobalt supply and demand balanceCobalt set to move back into surplus
tonnes 2018 2019 2020 2021E 2022E
Global production 162,284 132,466 142,883 189,672 227,938
YoY change 400.0% 500.0% 600.0% 700.0% 800.0%
Globalconsumption 143,813 150,170 153,063 193,410 213,774
YoY change 21.5% 4.4% 1.9% 26.4% 10.5%
Balance 18,471 -17,704 -10,179 -3,738 14,164
Spot ($/lb) 37.1 16.4 15.2 20.0 20.5
Source: company reports, CRU, BofA Global Research
BofA GLOBAL RESEARCH
Table 12: Lithium supply and demand balanceSupply discipline essential
tonnes, LCE 2018 2019 2020 2021E 2022E
Total Supply 330,024 367,959 386,947 431,314 594,416
YoY change 20.2% 11.5% 5.2% 11.5% 37.8%
Total Demand 272,319 296,680 327,702 457,229 574,019
YoY change 26.9% 8.9% 10.5% 39.5% 25.5%
Balance 57,705 71,279 59,244 -25,915 20,397
Source: company reports, CRU, BofA Global Research
BofA GLOBAL RESEARCH
Table 13: Commodity price forecastsBofA's quarterly and annual forecasts for base metals, precious metals, bulk materials, minor metals, steel and energy
Current 4Q21E 1Q22E 2Q22E 3Q22E 4Q22E 1Q23E 2020 2021 2022 2023 2024 2025LT
price
Base metals
Aluminium US$/t 2,555 2,750 3,000 3,250 3,250 3,500 3,500 1,704 2,465 3,250 3,375 2,989 2,093 2,199
USc/lb 116 125 136 147 147 159 159 77 112 147 153 136 95 100
11/11/21 12:46 BofA - Global Metals Weekly
https://rsch.baml.com/r?q=LFAHAGAE7oX1lMzDLC7jIw&e=mmatos%40agenciacomma.com&h=IitxVQ#Exhibit_Label_01609 8/9
Copper US$/t 9,439 9,750 10,500 10,500 9,500 9,000 9,500 6,175 9,345 9,875 9,500 8,906 8,313 7,719
USc/lb 428 442 476 476 431 408 431 280 424 448 431 404 377 350
Lead US$/t 2,348 2,000 2,251 2,251 2,251 2,251 2,297 1,824 2,133 2,251 2,297 2,348 2,398 2,448
USc/lb 107 91 102 102 102 102 104 83 97 102 104 106 109 111
Nickel US$/t 19,141 18,500 19,000 22,000 22,500 25,000 20,000 13,783 18,366 22,125 20,000 18,367 16,734 15,101
USc/lb 868 839 862 998 1,021 1,134 907 625 833 1,004 907 833 759 685
NPI, 8-12% CNY/t 1,495 1,400 1,300 1,250 1,200 1,100 1,000 1,010 1,260 1,213 1,000 1,032 1,064 1,096
Zinc US$/t 3,241 3,000 3,000 2,750 2,750 2,500 2,500 2,265 2,914 2,750 2,500 2,546 2,591 2,637
USc/lb 147 136 136 125 125 113 113 103 132 125 113 115 118 120
Precious metals
Gold,nominal US$/oz 1,794 1,800 1,900 1,800 1,900 1,900 1,900 1,771 1,803 1,875 1,950 1,961 1,971 1,980
Gold, real US$/oz 1,800 1,854 1,756 1,854 1,854 1,808 1,771 1,803 1,829 1,856 1,821 1,785 1,750
Silver,nominal US$/oz 23.79 25.00 27.50 31.00 31.00 31.00 32.50 20.52 25.83 30.13 32.50 31.18 29.78 28.29
Silver, real US$/oz 25.00 26.83 30.24 30.24 30.24 30.93 20.52 25.83 29.39 30.93 28.96 26.98 25.00
Platinum US$/oz 1,033 1,000 1,000 1,250 1,500 1,500 1,500 886 1,093 1,313 1,500 1,465 1,430 1,395
Palladium US$/oz 2,022 2,000 2,000 2,250 2,000 2,000 1,750 2,201 2,402 2,063 1,750 1,632 1,513 1,395
Current 4Q21E 1Q22E 2Q22E 3Q22E 4Q22E 1Q23E 2020 2021 2022 2023 2024 2025LT
price
Bulk Commodities
Hard cokingcoal US$/t fob 403.0 325.0 240.0 240.0 240.0 240.0 217.7 135.5 206.7 240.0 217.7 195.4 173.1 150.8
Semi-soft US$/t fob 269.3 218.8 147.1 147.1 147.1 147.1 135.7 75.3 158.5 147.1 135.7 124.3 112.9 101.5
Thermal Coal US$/t fob 153.0 175.0 150.0 130.0 125.0 115.0 117.8 60.3 129.0 130.0 117.8 105.6 93.4 81.2
Iron ore fines US$/t CIF 99.7 100.0 75.0 90.0 100.0 100.0 76.9 108.6 157.0 91.3 76.9 78.8 80.8 84.9
Other materials
Lithiumspodumene US$/t 1,300 1,000 1,200 1,200 1,200 1,200 1,100 300 863 1,200 1,050 813 700
Lithiumcarbonate US$/t 30,025 16,400 15,823 15,823 15,823 15,823 17,365 8,067 13,929 15,823 17,365 17,365 17,365
Lithiumhydroxide US$/t 29,675 18,400 17,540 17,540 17,540 17,540 19,249 6,358 15,440 17,540 19,249 19,249 19,249
Alumina $/t 435 350 350 323 323 323 331 271 312 330 331 340 348 357
Uranium $/lb 50.00 60.00 55.00 50.00 49.00 48.50 29.58 36.29 53.50 48.50 48.00 47.50 47.00
Molybdenum $/lb 19.10 19.14 19.14 19.14 19.14 19.14 19.14 8.68 16.01 19.14 19.14 16.44 13.74 11.04
Cobalt $/lb 27.30 24.00 25.00 25.00 27.50 27.50 30.00 15.18 21.61 26.25 30.00 26.13 22.26 18.39
Manganeseore $/dmtu 5.80 5.23 5.23 5.23 5.23 5.23 5.23 4.64 5.13 5.23 5.23 5.42 5.61 5.80
Steel, HRC
HRC, Europe US$/t 1,039 1,179 1,064 947 771 701 674 471 1,158 871
HRC, US US$/t 2,072 1,764 1,537 1,367 1,110 1,008 960 632 1,677 1,256
HRC, China US$/t 825 699 638 635 631 628 556 704 633
Energy Current 4Q21E 1Q22E 2Q22E 3Q22E 4Q22E 1Q23E 2020E 2021E 2022E 2023E 2024E 2025ELT
price
Brent US$/bbl 81.0 83.0 85.0 95.0 85.0 75.0 60.0 43.8 71.3 85.0 60.0 60.0 60.0 60.0
WTI US$/bbl 79.6 81.0 82.0 92.0 81.0 71.0 57.0 39.8 68.5 81.5 57.0 57.0 57.0 57.0
Henry Hub US$/MMBtu 5.59 4.25 3.75 3.25 3.30 3.50 2.60 2.13 3.47 3.45 2.60 2.60 2.60 2.60
Note: quarterly energy forecasts are period-end, rest are period averages; Source: BofA Global Research
BofA GLOBAL RESEARCH
Key Market DataTable 14: Commodity prices, exchange rates, equity indices, yields and inventoriesMetals have rebounded
Base metals Cash, $/t 3-month, $/t Cash, WoW change3-month, WoW
change
Aluminium 2,532 2,555 -7.4% -7.0%
Copper 9,699 9,439 -1.6% -2.4%
Lead 2,374 2,348 -3.5% -3.1%
Nickel 19,224 19,141 -2.3% -2.2%
Tin 37,457 36,452 0.3% 1.7%
Zinc 3,286 3,241 -4.2% -3.9%
LMEX 4,297 -3.0%
Cash, c/lb 3-month, c/lb
Aluminium 115 116
Copper 440 428
Lead 108 107
Nickel 872 868
Tin 1,699 1,654
Zinc 149 147
Other commodities, freight, exchange rates, equitiesand yields Spot WoW change
Gold, $/oz 1,792 -0.4%
Silver, $/oz 23.80 -1.2%
Platinum, $/oz 1,029 0.7%
Palladium, $/oz 2,006 0.7%
Iron ore, China fines cfr $/dmt 96.2 -20.9%
Brent, $/bbl 80.54 -3.7%
Baltic Dry Index 2,769 -23.7%
EUR/USD 1.1554 -1.1%
Dow Jones Industrial Average 36,124 1.1%
10-year US Treasury yield 1.529 -3.3%
ICE BofA Commodity index, ER 349.410 -2.4%
ICE BofA Commodity index Industrial Metals, ER 200.760 -4.2%
ICE BofA Commodity index Precious Metals, ER 211.840 -0.5%
ICE BofA Commodity index Energy, ER 367.650 -2.9%
11/11/21 12:46 BofA - Global Metals Weekly
https://rsch.baml.com/r?q=LFAHAGAE7oX1lMzDLC7jIw&e=mmatos%40agenciacomma.com&h=IitxVQ#Exhibit_Label_01609 9/9
prd - emea - node2 - dxp
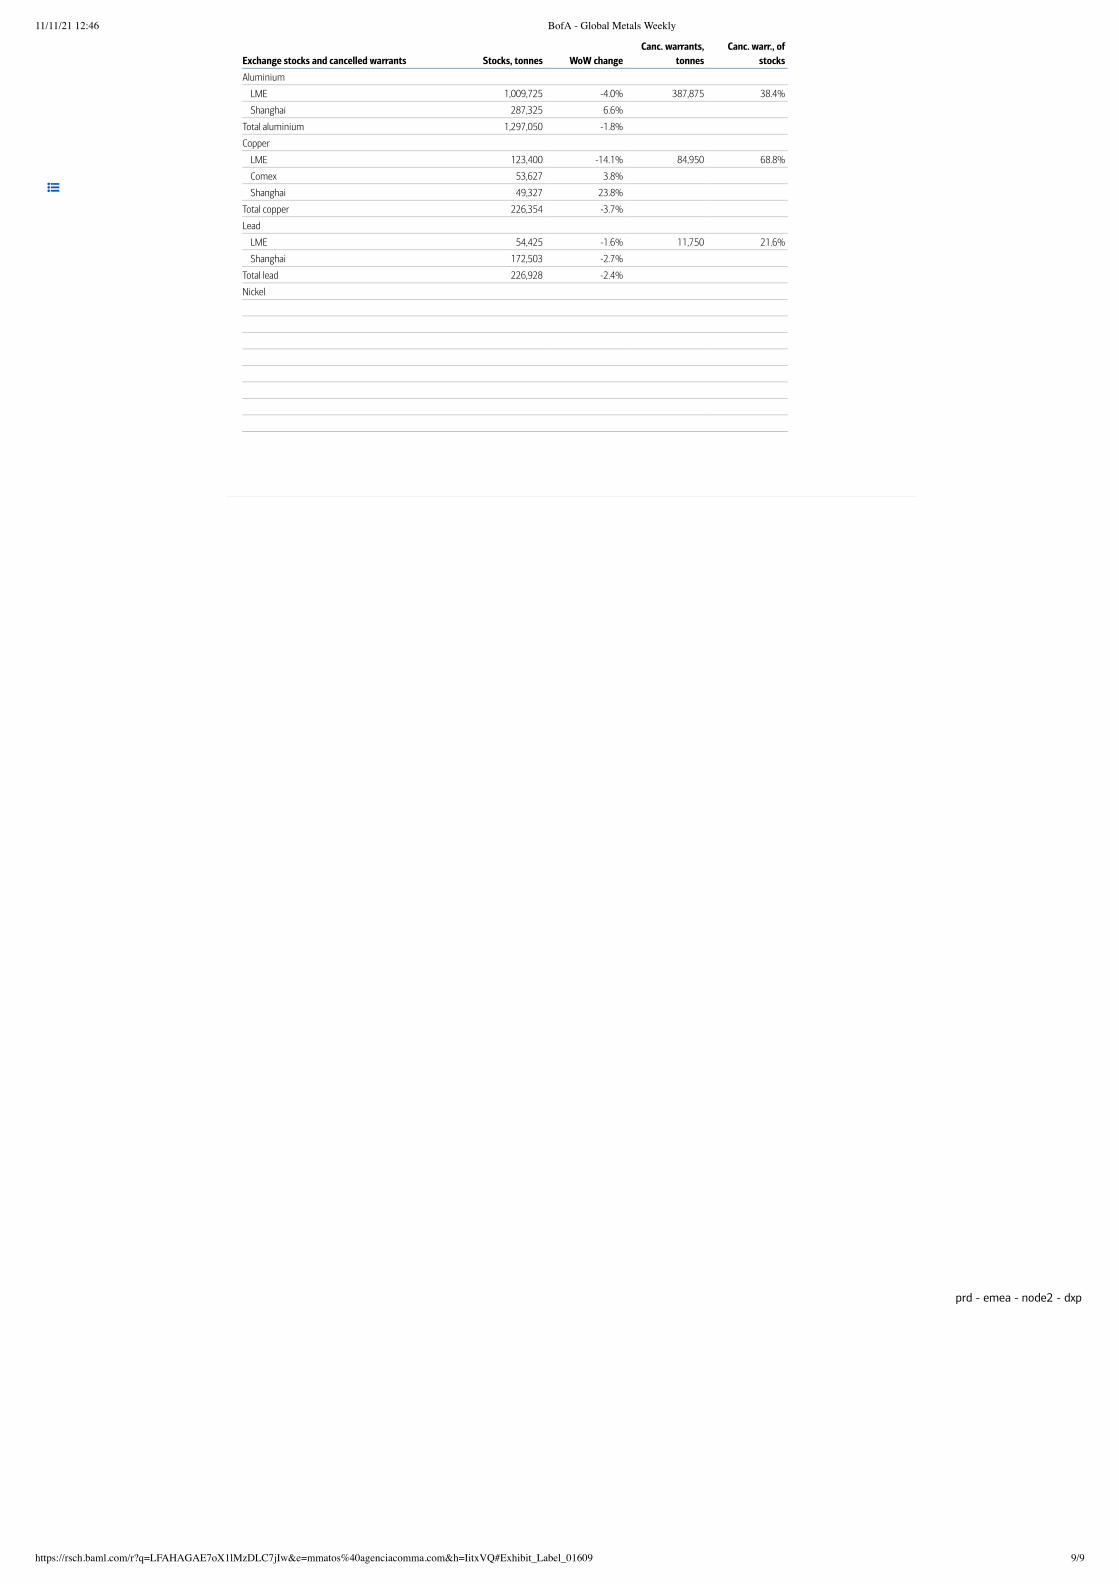
Exchange stocks and cancelled warrants Stocks, tonnes WoW changeCanc. warrants,
tonnesCanc. warr., of
stocks
Aluminium
LME 1,009,725 -4.0% 387,875 38.4%
Shanghai 287,325 6.6%
Total aluminium 1,297,050 -1.8%
Copper
LME 123,400 -14.1% 84,950 68.8%
Comex 53,627 3.8%
Shanghai 49,327 23.8%
Total copper 226,354 -3.7%
Lead
LME 54,425 -1.6% 11,750 21.6%
Shanghai 172,503 -2.7%
Total lead 226,928 -2.4%
Nickel
LME 138,096 -3.7% 65,178 47.2%
Shanghai 7,934 10.0%
Total nickel 146,030 -3.0%
Tin 670 -30.6% 225 33.6%
Zinc
LME 193,550 -2.1% 45,875 23.7%
Shanghai 74,842 -1.4%
Total zinc 268,392 -1.9%
Source: BofA Global Research
BofA GLOBAL RESEARCH
Nationally determined contributions (NDCs) embody efforts by each country to reduce national emissions and adapt to the impacts of climate change
International Energy Agency, 2021. Net Zero by 2050. A Roadmap for the Global Energy Sector
Intergovernmental Panel on Climate Change IPCC, 2021. Climate Change 2021: The Physical Science Basis
UNEP, 2021. Emissions Gap Report
OECD, 2021. Forward-looking Scenarios of Climate Finance
>> Employed by a non-US affiliate of BofAS and is not registered/qualified as a research analyst under the FINRA rules.Refer to "Other Important Disclosures" for information on certain BofA Securities entities that take responsibility for the informationherein in particular jurisdictions.BofA Securities does and seeks to do business with issuers covered in its research reports. As a result, investors should be aware thatthe firm may have a conflict of interest that could affect the objectivity of this report. Investors should consider this report as only asingle factor in making their investment decision.
Click for important disclosures.
Trending
VideoPDF
The RIC Report(http://rsch.baml.com/r?q=wdEQV4BsBdMTI1z8yB99Pw&e=mmatos%40agenciacomma.com&h=BUMMgg)Build your portfolio back betterResearch Investment Committee 2021-Nov-8
Research Summary
Global Research Highlights(http://rsch.baml.com/r?q=SlDSQexBHOkTI1z8yB99Pw&e=mmatos%40agenciacommaBalancing Year End VariablesDerek Harris 2021-Nov-5
Disclosures
Timestamp: 08 November 2021 08:41AM EST
Terms of Use (https://rsch.baml.com/WebReports/TermsofUse.pdf) | Privacy & Security: GBAM (https://www.bofaml.com/en-us/content/global-privacy-notices.html) GWIM (https://www.bankofamerica.com/privacy/privacy-
overview.go) | Cookie Policy (https://www.bofaml.com/content/dam/boamlimages/documents/articles/ID19_0760/Cookie_Policy.pdf) | GDPR Privacy Notice (https://www.bofaml.com/gdpr) | Cookie Center
2
3
4
5
6


![Russia Metals and Mining Weekly[1]](https://img.pdfslide.us/doc/110x75/546a7c4bb4af9f38018b46c7/russia-metals-and-mining-weekly1.jpg)