Embed Size (px)
Citation preview

GLOBAL NON-FERROUS SCRAP FLOWS 2000-2015
with a focus on Aluminium and Copper
BIR GLOBAL FACTS & FIGURES NON-FERROUS METALS
Non-Ferrous Metals Division

2 Review of global non-ferrous scrap flows
This report was prepared for the Bureau of International Recycling by Sue Eales of World Bureau of Metal Statistics in 2016.
Copyright Bureau of International Recycling 2016. All rights reserved.

Review of global non-ferrous scrap flows 1
CONTENTS
Chapter 1 – Introduction 5
Economic benefits of recycling 6
Uses of copper and aluminium 6
Macroeconomic background 7
Stages of economic growth and scrap usage 8
Chapter 2 – Historical growth of copper production and consumption 9
Copper demand 10
Flow of copper through the value chain 13
Copper scrap usage at smelters and semi manufacturers 15
Chapter 3 – Historical growth of aluminium production and consumption 21
Aluminium demand 22
Flow of aluminium through the value chain 25
Aluminium scrap usage at smelters 26
Chapter 4 – International trade 29
Trade definitions 30
Chapter 5 – Trade in copper and alloy scrap 31
Regional copper and alloy scrap trade flows 32
Copper and alloy scrap exports 32
Copper and alloy scrap imports 34
Extra-regional trade in copper and alloy scrap 35

2 Review of global non-ferrous scrap flows
Chapter 6 – Global aluminium trade flows 41
Regional aluminium and alloy scrap trade flows 42
Aluminium and alloy scrap exports 42
Aluminium and alloy scrap imports 43
Extra-regional trade in aluminium and alloy scrap 45
Chapter 7 – Maps 51
Chapter 8 – Conclusion 55
LIST OF TABLESTable 1: Regional demand for copper (% of total) 11
Table 2: Global production of copper 2000 to 2015 in thousand tonnes 12
Table 3: Secondary refining of copper 2000 to 2015 in thousand tonnes 17
Table 4: Direct use of copper scrap 2000 to 2015 in thousand tonnes 18
Table 5: Direct use of copper scrap 2000 to 2015 (% of total copper usage) 19
Table 6: Regional demand for aluminium (% of total) 23
Table 7: Production of primary and secondary aluminium in thousand tonnes 24
Table 8: Secondary aluminium production 2000 to 2015 in thousand tonnes 26
Table 9: Japanese secondary aluminium production in thousand tonnes 27
Table 10: Usage of aluminium scrap in the USA in thousand tonnes 28
Table 11: Summary of copper imports and exports by region in million tonnes 35
Table 12: Exports of copper and alloy scrap 2000 in thousand tonnes 37
Table 13: Exports of copper and alloy scrap 2005 in thousand tonnes 38
Table 14: Exports of copper and alloy scrap 2010 in thousand tonnes 39

Review of global non-ferrous scrap flows 3
Table 15: Exports of copper and alloy scrap 2015 in thousand tonnes 40
Table 16: Summary of aluminium imports and exports by region in million tonnes 46
Table 17: Exports of aluminium and alloy scrap 2000 in thousand tonnes 47
Table 18: Exports of aluminium and alloy scrap 2005 in thousand tonnes 48
Table 19: Exports of aluminium and alloy scrap 2010 in thousand tonnes 49
Table 20: Exports of aluminium and alloy scrap 2015 in thousand tonnes 50
Table 21: Total use of scrap 56
LIST OF FIGURESFigure 1: The stages of copper production 14
Figure 2: The uses and scrap arising of copper 16
Figure 3: Global aluminium flow 2014 in million tonnes 25
Figure 4: Regional exports of copper and alloy scrap 2000 to 2015 in thousand tonnes 33
Figure 5: Regional imports of copper and alloy scrap 2000 to 2015 in thousand tonnes 33
Figure 6: Chinese copper scrap imports 2000 to 2015 by region of origin in thousand tonnes 34
Figure 7: Regional exports of aluminium and alloy scrap 2000 to 2015 in thousand tonnes 43
Figure 8: Regional imports of aluminium and alloy scrap 2000 to 2015 in thousand tonnes 44
Figure 9: Chinese aluminium scrap imports 2000 to 2015 by region of origin in thousand tonnes 44
Figure 10: Exports of copper and alloy scrap 2015: Europe and Africa 52
Figure 11: Exports of copper and alloy scrap 2015: Asia & Oceania 52
Figure 12: Exports of copper and alloy scrap 2015: NAFTA & Other America 53
Figure 13: Exports of aluminium and alloy scrap 2015: Europe & Africa 53
Figure 14: Exports of aluminium and alloy scrap 2015: Asia & Oceania 54
Figure 15: Exports of aluminium an alloy scrap 2015: NAFTA & Other America 54

4 Review of global non-ferrous scrap flows
EXECUTIVE SUMMARY
The purpose of this report is to demonstrate the importance of recycling in the metals industries. Aluminium and copper have been selected because they are the two largest of the non-ferrous metals and because scrap for both metals is widely traded internationally; furthermore, both metals have a broadly similar pattern of scrap recovery. Recycling of other base metals, including lead, zinc, nickel and tin, are not considered in this study but may be the subject of future reports.
Most of the data shown cover developments since 2000. This period has seen enormous growth in Chinese demand for both raw materials and finished metal but virtual stagnation in many developed economies. In order to feed the growing domestic demand, China has needed to import increasing quantities of all forms of raw materials, including scrap. Chinese consumption of all metals was historically low and it will be some time before the end-of-life products produce significant quantities of scrap. An analysis of the international trade in copper- and aluminium-based scrap shows huge imports into China, mainly from the large, mature economies of NAFTA and the European Union. There are, however, some issues about precisely what products are included in the Chinese import data. It seems likely that the Chinese import data cover a mix of other metal scrap and, as a result, the copper and aluminium contained in these imports is overstated. Comparing exports to China by trading partners indicates that the Chinese imports of copper and aluminium scrap are overstated by around 65% and 25%, respectively.
Global scrap usage for copper, both for secondary refined copper production and direct use of scrap, increased by 41% from 5.9 million tonnes in 2000 to 8.3 million tonnes in 2015. In addition, over the same period the LME price of copper rose from US$ 1814 to US$ 5502 per tonne, resulting in a more than fourfold increase in the value of copper recycling from US$ 10.7 billion to US$ 46 billion.
Production of aluminium metal from scrap increased by 86% from 8.4 million tonnes in 2000 to 15.6 million tonnes in 2015. Direct use of aluminium scrap is not recorded. The increase in the average price of aluminium was more modest, from US$ 1595 to US$ 1663 per tonne, while the value of recycled aluminium more than doubled from US$ 12.8 billion to US$ 26 billion.

CHAPTER 1
INTRODUCTION

6 Review of global non-ferrous scrap flows
1.1 Economic benefits of recycling
Metals are an essential part of modern life and are largely made from ores which have to be mined from the earth’s crust. With the world’s population constantly expanding, it is essential that we conserve the scarce resources for future generations. Fortunately, metals are almost infinitely recyclable and the industry is increasingly using scrap to provide the metal that society needs.
There are strong economic arguments for recycling, with the low cost of producing secondary metal compared with the cost of refining new metal being the most compelling. For aluminium, one of the largest costs is the electricity used in the final smelting process. For secondary metal, the cost of electricity is about 90% less than for primary metal from the raw material, bauxite, according to the US Aluminum Association. For copper, the energy saving is more than half.
Over time, it has become increasingly difficult to find new mines with high grades and long life in accessible locations with good transport links and a political framework to exploit the resources. These factors and increasing demand have encouraged producers to look at “urban mining” for metal in the form of scrap.
In addition to the economic pressure to recycle metal products, governments are introducing legislation to encourage industry and individuals to recycle more of all our resources. Not only do these policies preserve resources but they also reduce the need for landfilling of obsolete products. Many consumer products must now be designed so that, at the end of their life, it is possible to recycle the majority of the components.
1.2 Uses of copper and aluminium
Both copper and aluminium are vital resources for most of the key industrial sectors, in particular:
• Building and construction
• Electrical
• Transportation
• Packaging (for aluminium)
In some applications, there has been substitution by other materials such as plastics. In many of these sectors, copper and aluminium are usually the best materials available.

Review of global non-ferrous scrap flows 7
1.3 Macroeconomic background
In the last 70 years, there has been generally favourable growth in GDP and industrial production compared with the decades that preceded the Second World War. After that war, there was a golden period of reconstruction and high growth for a quarter of a century until the first energy crisis when the oil price quadrupled in November 1973. Western Europe, the USA and Japan accounted for most of the economic growth but the other Asian tigers, South Korea and Taiwan, also grew strongly. The deep recession in the mid-1970s was followed by another energy price hike and subsequent deep recession at the end of the 1970s and in the early 1980s. This was followed by a period of slower growth in the 1980s which, as far as the metals industry was concerned, resulted in low demand growth, low metal prices, and consequently low profitability and lack of investment in new capacity.
By the 1990s, world economic growth was recovering and China emerged as a major global player both in terms of rapid industrialisation and economic growth. The scale of the switch from an agricultural economy to a major consumer of investment and consumer goods represented a huge market for Western producers in the period 2000 to 2010. China invested in massive infrastructure projects from ports, airports, power stations to buildings, road construction and industrial plants to produce steel, chemicals and eventually consumer goods. Initially, China represented a massive market for suppliers of raw materials as the country has been well blessed with a few raw materials (e.g. rare earths) but remains a large importer of metal ores, concentrates and other raw materials. In building new infrastructure, China invested in large, often fully-integrated metals plants, some based at deep-water ports where internal freight costs could be minimised. Thus, China may be a net importer of raw materials but became an efficient producer and exporter of metal-containing finished products.

8 Review of global non-ferrous scrap flows
1.4 Stages of economic growth and scrap usage
Since 2010, there have been signs that the economic growth in China is moving to the next stage where the major investments in infrastructure have been largely made for the time being and some of the growth will be replacement demand; also, service industries in the economy are expected to play a greater role. China is no longer the low-cost producer of 10 years ago and some economic activity has moved to lower-cost producers in Asia such as Vietnam which, with a population of 100 million, is a thriving economy. India has also emerged as an engine of economic growth in Asia but, as yet, not on the scale of China.
In general, there is a positive correlation between the level of economic activity and the use of recycled materials, so major economies like the USA and China will be leading users of recycled materials.
There is also a relationship between the stage of economic growth and the generation or supply of recycled materials. In mature economies including the USA, Japan and much of Western Europe, over half a century of high economic activity means that replacement demand and service industries are a large part of growth, so end-of-life recycling of consumer and capital goods is well established because much of the demand is to replace the car, washing machine or TV with a newer model. Among the mature economies, there is also a pattern of net exporters of consumer goods (Japan) and net importers (the USA). This can lead to patterns of some recycling of finished goods in the country to which they were exported rather than in which they were produced. So in some metals, even among mature economies, there were periods of net exporters of recycled materials (the USA) and net importers (Japan). The charts of the trade flows show the current situation.
Finally, in the less mature economies particularly in Asia, including China, there is the aspirational growth in demand. The aspiring consumer who has moved from an agricultural job to a higher-paid industrial or administrative job starts with public transport or a bicycle before moving on to a motorbike and, a few years later, to a small car. He is not trading in old for new; he is a first-time buyer and so the pool of recycled obsolete goods does not yet exist. These economies are places of strong demand for recycled materials and this too can be seen from the trade flows.

CHAPTER 2
HISTORICAL GROWTH OF COPPER PRODUCTION AND CONSUMPTION

10 Review of global non-ferrous scrap flows
2.1 Copper demand
Demand for refined copper has grown dramatically over the last 50 years with the construction of infrastructure, the development of electronics and the need for better transport links. Copper is an essential part of modern life and the increased demand has led the industry to search for new sources of supply which include opening new mines, expanding existing mines and developing methods of reusing old metal in the form of scrap.
In 1970, total world demand for refined copper was just over 7 million tonnes. By 2015, this total had more than trebled to almost 23 million tonnes. Traditionally, copper demand is measured at the point where a copper ingot or cathode is converted into a sheet, a rod, a tube or a piece of wire. The regional patterns of demand have changed dramatically over the last half century. Early in the industrialisation process, countries need to develop large infrastructure projects such as airports and housing which require enormous quantities of copper. Later in the cycle, demand for consumer goods including white goods, cars and computers become the norm but these sectors have a reduced need for copper. As the economy matures, the service industries become more important and demand is largely for replacement goods which reduces the rate of growth for copper. This regional pattern can be seen clearly in the table on the following page with the decline in importance of Europe and the USA and the dramatic increases in China and the rest of Asia.

Review of global non-ferrous scrap flows 11
TABLE 1: REGIONAL DEMAND FOR COPPER (% OF TOTAL)
Europe Africa China Other Asia
USA Other America
Australasia Global demand million tonnes
1970 52 1 2 13 25 5 2 7.31980 50 1 4 16 20 8 1 9.41990 43 1 5 25 20 5 1 10.82000 30 1 13 27 20 8 1 15.22010 20 1 38 25 9 6 1 19.32015 16 1 50 20 8 5 0 22.8
Source: WBMS
Whilst the increase in demand for refined copper encourages higher production, it is also a factor in the availability of old scrap for secondary refining. Old scrap from obsolete products can take between 10 and 50 years to become available for secondary refining. Hence it may be some time before China can generate the amount of scrap it needs for its refineries and will continue to need to import it from around the world.
Production of refined copper has grown by an average of 2.4% per annum since the turn of the century whilst mine production has risen by 2.2% per annum. As a result, the requirement for scrap at refineries and smelters, which is the difference between the two series, has grown on average by 3.6%.

12 Review of global non-ferrous scrap flows
TABLE 2: GLOBAL PRODUCTION OF COPPER 2000 TO 2015 IN THOUSAND TONNES
Mine Production Refined Production Difference2000 13 244 14 798 1 5542001 13 762 15 657 1 8952002 13 549 15 318 1 7692003 13 636 15 215 1 5792004 14 676 15 812 1 1362005 15 099 16 652 1 5532006 15 173 17 344 2 1712007 15 538 17 997 2 4592008 15 653 18 422 2 7692009 15 864 18 550 2 6862010 16 114 19 215 3 1012011 16 263 19 818 3 5552012 16 963 20 355 3 3922013 18 264 21 083 2 8192014 18 476 22 926 4 4502015 19 320 23 054 3 734
Source: WBMS
Most of the refined copper production increase between 2000 and 2015 was in China. Chinese production was just 1.4 million tonnes in 2000 but rose to almost 8 million tonnes in 2015, which was almost a third of the world output. Mine output in China has risen by 180% over the same period and now accounts for about a quarter of the world figure. In absolute terms, the gap between mine production plus imported new raw materials and refined production in China grew from 0.2 million tonnes in 2000 to almost 2.7 million tonnes in 2015 and this can only be filled by the recovery of metal from scrap. For the rest of the world, mine production grew by 33% to 17.7 million tonnes and refined production by 12% to 15 million tonnes.

Review of global non-ferrous scrap flows 13
2.2 Flow of copper through the value chain
The International Copper Study Group (ICSG) has prepared a comprehensive flow diagram of the inputs in the form of raw materials and scrap throughout the supply chain. This is reproduced on the following page and illustrates where scrap can be used in the refining and use of copper metal.
Primary copper production starts with the extraction of copper-bearing ores. There are three basic ways of copper mining: surface, underground mining and leaching. Open-pit mining is the predominant mining method in the world. After the ore has been mined, it is crushed and ground, and then followed by a concentration by flotation. The obtained copper concentrates typically contain around 30% copper, but grades can range from 20 to 40%. In the following smelting process, sometimes preceded by a roasting step, copper is transformed into a “matte” containing 50-70% copper. The molten matte is processed in a converter, resulting in a so-called blister copper of 98.5-99.5% copper content. In the next step, the blister copper is fire-refined in the traditional process route or, increasingly, remelted and cast into anodes for electro-refining. The output of electro-refining is refined copper cathodes, assaying over 99.99% copper. Alternatively, using the hydrometallurgical route, copper is extracted from mainly low-grade oxide ores, and also some sulphide ores, through leaching (solvent extraction) and electrowinning (SX-EW process). The output is the same as through the electro-refining route – refined copper cathodes. The ICSG estimated that, in 2013, refined copper production from SX-EW represented 18% of total refined copper production.
Refined copper production derived from mine production (either from metallurgical treatment of concentrates or SX-EW) is referred to as “primary copper production”, as obtainable from a primary raw material source.
However, there is another important source of raw material which is scrap. Copper scrap derives either from metals discarded in semis fabrication and finished product manufacturing processes (“new scrap”), or from obsolete end-of life products (“old scrap”). Refined copper production attributable to a recycled scrap feed is classified as “secondary copper production”. Secondary producers use processes similar to those employed for primary production. The ICSG estimated that, at the refinery level in 2013, secondary copper refined production reached 18% of total refined copper production.

14 Review of global non-ferrous scrap flows
FIGURE 1: THE STAGES OF COPPER PRODUCTION
The flow of copper
Trade
Scrap Recycling
Mining Production Fabrication
Concentrates/Matte
Mine Smelter
SX/EW
Wire rod plant /Wire mill
Brassmill
Foundry
Other Plants
Refinery
Blister/Anode
RefinedCopper
Scrap forRefining
Scrap forSmelting
AlloyIngot
Hydromet.Plant
AlloyMetals
DirectMelt
SemisNet Trade
IngotMaker
Tailings
Wire rod
Chemicals
incl. low grade scrap
refined
alloys
Refined Usage
Semis Supply
New Scrap
Low Grade ResiduesBy-products/
slag/ashes
Source: International Copper Study Group
Review of global non-ferrous scrap flows 15
2.3 Copper scrap usage at smelters and semi manufacturers
The flow sheet on the following page demonstrates where scrap enters the process for copper.
Scrap is generated at all stages of the metal production and usage process. It is not waste but remains a valuable and re-usable resource. Processing of scrap is always less expensive than the production of new metal from raw materials extracted from the earth. For this reason, where quality standards permit, scrap will always be used before new mined materials.
Scrap is generally divided into three types – old scrap, new scrap and runaround scrap. Old scrap is collected from obsolete goods like washing machines and cars. It generally requires re-processing into new metal through a smelter or a refinery. This is called secondary metal and is usually close in quality to primary metal which is refined from ores.
New scrap is usually generated by producers of industrial or consumer goods. It may also arise from a rolling or drawing process. The quality of the metal remains high and the material may be directly used, refined or remelted. Re-use of this material is termed direct use of scrap.
Scrap arises at a manufacturing plant and can simply be collected and put back into the process. This is called runaround scrap. Since this is simply an internal transfer, data on this material are rarely available.
Secondary scrap production can be calculated by deducting the copper content of mine production (including solvent extraction/electrowon) from the total amount of refined copper production. This method does not allow for bottlenecks in the system or unreported inventory changes but since there are very few reported data, it is the best methodology available. The table on page 17 shows the available data for the years 2000 to 2015.

16 Review of global non-ferrous scrap flows
FIGURE 2: THE USES AND SCRAP ARISING OF COPPER
The flow of copper (continued...)
SemisImport
FinishedProducts
EOLProducts
ProductSupply
Finished Products
EOL Products
Recycling
Recyclinglosses new
scrap
(EOL Managementadjusted for
export/reuse aftercollection)
Low gradefrom Fabr.
Manufacture
Recycling
Product Use(Lifetime)
End-of-Life Management
Net Trade
Copper Reservoir
in Use
Abandoned/ Stored/ Reused
End-of-Life Products
Construction C&D
E&E Equipment INEW
Ind. equipment IEW
Transport ELV
Consumer/ Gen. WEEE
Other Uses
New Scrap Old ScrapScrap & Low grade
Net Trade
DissipativeUses
Other MetalLoops
Disposal/Other Uses
MSW & Other
Source: International Copper Study Group
Review of global non-ferrous scrap flows 17
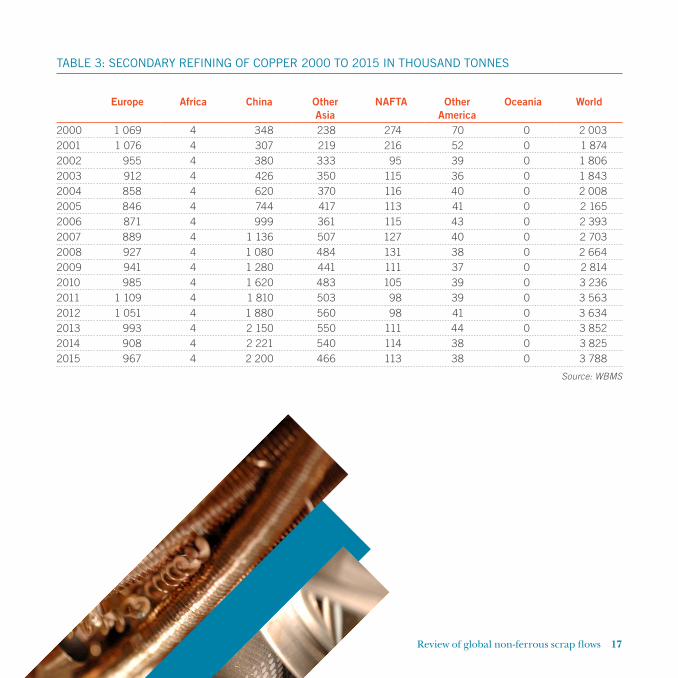
TABLE 3: SECONDARY REFINING OF COPPER 2000 TO 2015 IN THOUSAND TONNES
Europe Africa China Other Asia
NAFTA Other America
Oceania World
2000 1 069 4 348 238 274 70 0 2 0032001 1 076 4 307 219 216 52 0 1 8742002 955 4 380 333 95 39 0 1 8062003 912 4 426 350 115 36 0 1 8432004 858 4 620 370 116 40 0 2 0082005 846 4 744 417 113 41 0 2 1652006 871 4 999 361 115 43 0 2 3932007 889 4 1 136 507 127 40 0 2 7032008 927 4 1 080 484 131 38 0 2 6642009 941 4 1 280 441 111 37 0 2 8142010 985 4 1 620 483 105 39 0 3 2362011 1 109 4 1 810 503 98 39 0 3 5632012 1 051 4 1 880 560 98 41 0 3 6342013 993 4 2 150 550 111 44 0 3 8522014 908 4 2 221 540 114 38 0 3 8252015 967 4 2 200 466 113 38 0 3 788
Source: WBMS

18 Review of global non-ferrous scrap flows
Production of refined copper from scrap almost doubled between 2000 and 2015, which compares with an increase of just over 55% in the output of metal from all sources. Regionally, the trend has been reduced secondary production from the traditional producers in Europe and the Americas and a sevenfold increase in China. Other Asian production of refined copper from scrap doubled over the period from 2000 to 2015.
Usage of direct scrap is calculated as the difference between consumption of refined copper and the copper content of copper products like tubes and wire, which are known as semi-manufactures. In recent years, data on the output of these products have proved much more difficult to obtain owing to company confidentiality. The table below gives estimates of the usage of scrap by copper semi manufacturers for the years between 2000 and 2015.
TABLE 4: DIRECT USE OF COPPER SCRAP 2000 TO 2015 IN THOUSAND TONNES
Europe Africa China Other Asia
NAFTA Other America
Oceania World Total
2000 1 116 33 228 1 307 1 091 132 41 3 9482001 1 106 33 273 1 238 1 039 135 41 3 8652002 1 105 33 500 1 310 958 102 47 4 0552003 1 108 33 500 1 349 898 123 46 4 0572004 1 165 24 540 1 513 922 135 42 4 3412005 1 145 24 680 1 542 914 137 39 4 4812006 1 250 24 680 1 617 932 141 36 4 6802007 1 200 24 860 1 714 887 136 37 4 8582008 1 150 24 820 1 680 807 149 38 4 6682009 900 24 720 1 568 737 130 33 4 1122010 1 000 24 780 1 710 735 164 35 4 4482011 1 000 24 790 1 645 741 150 30 4 3802012 1 108 24 870 1 631 887 156 28 4 7042013 1 108 24 600 1 627 894 148 21 4 4222014 1 108 24 740 1 627 908 148 12 4 5672015 1 107 24 700 1 630 909 148 12 4 530
Source: WBMS

Review of global non-ferrous scrap flows 19
Very few data exist for the most recent years and only two organisations make any real attempt to survey the whole industry: the Copper Development Association (CDA) in the USA and the Japan Mining Association. The direct scrap share of total copper consumption is summarised in the table below.
TABLE 5: DIRECT USE OF COPPER SCRAP 2000 TO 2015 (% OF TOTAL COPPER USAGE)
Japan USA2000 38.3 26.72001 39.9 27.22002 34.3 28.82003 34.4 28.22004 33.3 27.72005 32.9 28.82006 32.3 30.82007 31.7 29.52008 32.4 28.72009 32.5 31.02010 32.7 29.92011 34.3 30.52012 33.4 33.52013 34.5 32.92014 33.7 34.02015 34.6 33.6
Sources: CDA and Japan Mining Association
20 Review of global non-ferrous scrap flows
Direct scrap’s share of total copper usage in these two countries is around one third. For Europe, the share is believed to be slightly lower at 25% to 30% and for China it is currently only about 10%. Domestic scrap is a scarce resource in China and hence the semi manufacturers tend to use more refined copper than any of the more mature economies.
Review of global non-ferrous scrap flows 21
CHAPTER 3
HISTORICAL GROWTH OF ALUMINIUM PRODUCTION AND CONSUMPTION
22 Review of global non-ferrous scrap flows
3.1 Aluminium demand
Most aluminium scrap is used in secondary aluminium smelting to produce secondary metal. This material is treated at a smelter but requires considerably less energy than new aluminium produced from bauxite. At this smelter stage, a small amount of primary aluminium is added to the mix to improve the quality. The data in the table below relate to metal produced at secondary smelters and are not believed to include any scrap processed at primary plants.
The aluminium industry is relatively new compared with copper and the historical growth rates have been much more dramatic than for copper. In 1970, global demand for aluminium from both primary and secondary sources was 12.7 million tonnes. By 2015, this had grown to about 73 million tonnes. Bauxite, the raw material for aluminium production, is the most common metallic ore found in the earth’s crust and the aluminium industry has expanded mine capacity by more than 350% over the last 50 years.
Production of secondary refined metal is under-reported since the available data refer to secondary smelters only. There are no reports on the volume of secondary metal used at primary smelters. The reported data suggest that secondary production at smelters remains at around one fifth of the total output of aluminium and that total output has grown by more than 470% over the last 50 years. Chinese production of primary and secondary aluminium grew from just 200 000 tonnes in 1970 to over 37 million tonnes in 2015. In China, reported secondary output is less than 17% of total output. For the rest of the world, secondary output is around 26% of the total output. Chinese imports of aluminium and alloy scrap were 2.1 million tonnes in 2015, thus limiting their ability to produce secondary aluminium. China’s total production is currently just over 50% of the world’s output.

Review of global non-ferrous scrap flows 23
TABLE 6: REGIONAL DEMAND FOR ALUMINIUM (% OF TOTAL)
Europe Africa China Other Asia
USA Other America
Australasia Global demand million tonnes
1970 44.969 0.617 1.799 11.978 35.393 3.984 1.260 12.51980 43.750 1.005 2.795 15.028 30.553 5.443 1.426 19.71990 39.831 1.062 3.373 22.070 26.323 5.303 2.038 25.52000 29.401 1.126 11.022 21.158 28.433 7.307 1.553 33.52010 22.605 1.454 34.157 20.515 11.965 8.409 0.895 49.92014 18.235 1.454 48.739 12.714 11.675 6.425 0.758 59.6
Source: WBMS
The above table refers to demand for unwrought aluminium from primary and secondary aluminium smelters.
Over the last 45 years, Chinese demand for primary aluminium has grown dramatically and now accounts for more than half the world’s usage of the metal. Over the same period, European demand has fallen from almost 45% to 15% of the world total and the USA’s demand share has dropped from 35% to 9%.

24 Review of global non-ferrous scrap flows
TABLE 7: PRODUCTION OF PRIMARY AND SECONDARY ALUMINIUM IN THOUSAND TONNES
Europe Africa China Other Asia
USA Other America
Oceania World Total %
1970 Primary 4 081 165 180 933 3 607 1 130 206 10 302 81Secondary 828 10 3 375 1 062 81 24 2 383 19Total 4 909 175 183 1 308 4 669 1 211 230 12 685
1980 Primary 6 669 437 358 1 567 4 654 1 891 460 16 036 82Secondary 1 281 27 3 744 1 249 147 40 3 491 18Total 7 950 464 361 2 311 5 903 2 038 500 19 527
1990 Primary 7 836 598 854 1 166 4 048 3 353 1 492 19 347 79Secondary 1 740 34 7 1 168 1 834 214 38 5 035 21Total 9 576 632 861 2 334 5 882 3 567 1 530 24 382
2000 Primary 7 790 1 176 2 794 2 363 3 668 4 537 2 090 24 418 74Secondary 2 627 43 195 1 303 3 450 712 110 8 440 26Total 10 417 1 219 2 989 3 666 7 118 5 249 2 200 32 858
2010 Primary 8 643 1 742 16 244 5 606 1 727 5 270 2 272 41 504 78Secondary 2 390 32 4 000 1 789 2 682 965 77 11 935 22Total 11 033 1 774 20 244 7 395 4 409 6 235 2 349 53 439
2015 Primary 7 897 1 687 31 410 8 583 1 587 4 204 1 980 57 348 79Secondary 2 906 32 6 200 2 075 3 456 945 0 15 614 21Total 10 803 1 719 37 610 10 658 5 043 5 149 1 980 72 962
Source: WBMS
Regionally, Europe produced around 40% of the world’s aluminium in 1970 but only 15% by 2015. For the USA, the fall was from 37% in 2000 to 7% in 2015.
Worldwide, secondary aluminium production was around 15.6 million tonnes in 2015 which is about 22% of the total metal produced from bauxite and scrap (see table 7). In China, secondary accounts for 16% of the total metal produced; this proportion is likely to grow as more domestic scrap becomes available to Chinese secondary smelters.
Review of global non-ferrous scrap flows 25
3.2 Flow of aluminium through the value chain
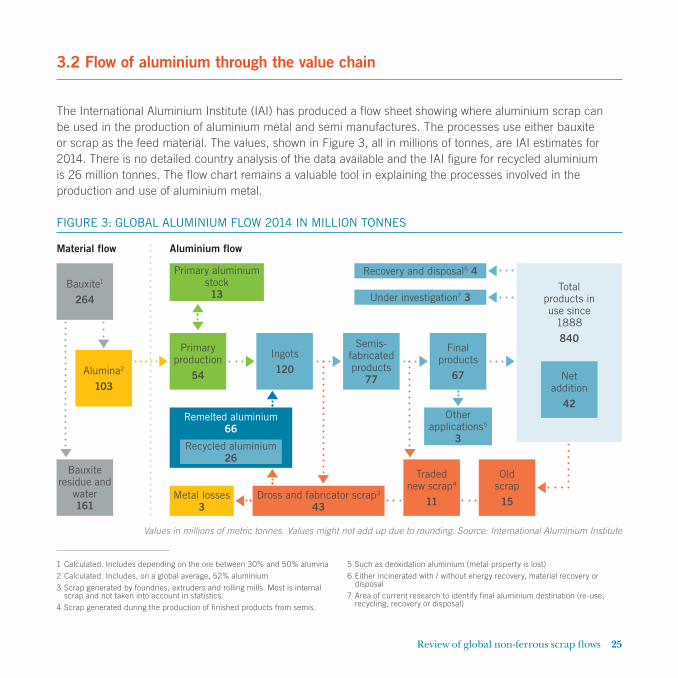
The International Aluminium Institute (IAI) has produced a flow sheet showing where aluminium scrap can be used in the production of aluminium metal and semi manufactures. The processes use either bauxite or scrap as the feed material. The values, shown in Figure 3, all in millions of tonnes, are IAI estimates for 2014. There is no detailed country analysis of the data available and the IAI figure for recycled aluminium is 26 million tonnes. The flow chart remains a valuable tool in explaining the processes involved in the production and use of aluminium metal.
FIGURE 3: GLOBAL ALUMINIUM FLOW 2014 IN MILLION TONNES
Values in millions of metric tonnes. Values might not add up due to rounding. Source: International Aluminium Institute
Material flow Aluminium flow
Bauxite1
264
Primary production
54
Primary aluminium stock13
Alumina2
103
Metal losses3
Bauxite residue and
water161
Ingots120
Dross and fabricator scrap3
43
Semis-fabricated products
77
Traded new scrap4
11
Final products
67
Recovery and disposal6 4
Under investigation7 3
Other applications5
3
Old scrap15
Net addition
42
Total products in use since
1888840
Remelted aluminium66
Recycled aluminium26
1 Calculated. Includes depending on the ore between 30% and 50% alumina
2 Calculated. Includes, on a global average, 52% aluminium
3 Scrap generated by foundries, extruders and rolling mills. Most is internal scrap and not taken into account in statistics.
4 Scrap generated during the production of finished products from semis.
5 Such as deoxidation aluminium (metal property is lost)
6 Either incinerated with / without energy recovery, material recovery or disposal
7 Area of current research to identify final aluminium destination (re-use, recycling, recovery or disposal)

26 Review of global non-ferrous scrap flows
Bauxite is processed in a refinery to produce alumina which is an oxide or hydroxide of aluminium. It takes approximately two tonnes of bauxite to make one tonne of alumina. The alumina is further processed in a smelter to produce primary aluminium. It takes two tonnes of alumina to make one tonne of aluminium metal. Aluminium metal is frequently alloyed with other metals like magnesium, and for these products it is possible to use scrap as a feed for the aluminium part of the alloy.
3.3 Aluminium scrap usage at smelters
The following table shows the production of secondary aluminium for the years 2000 to 2015. Regular reports are received from Japan, the USA and some European countries. Other countries’ figures are estimated on the basis of national production and trade in scrap.
TABLE 8: SECONDARY ALUMINIUM PRODUCTION 2000 TO 2015 IN THOUSAND TONNES
Europe Africa China Other Asia
USA Other America
Oceania World Total
2000 2 588 43 145 999 3 413 748 110 8 0462001 2 575 32 287 1 238 2 965 697 127 7 9212002 2 590 32 1 300 1 329 2 958 689 127 9 0252003 2 532 32 1 450 1 316 3 210 737 76 9 3532004 2 669 32 1 660 1 100 3 329 719 88 9 5972005 2 775 32 1 940 1 128 3 334 763 73 10 0452006 2 863 32 2 350 1 129 3 368 835 78 10 6552007 2 933 32 2 750 1 194 3 888 813 102 11 7122008 2 650 32 2 600 1 162 3 264 885 115 10 7082009 2 063 32 3 100 738 3 090 870 84 9 9772010 2 390 32 4 000 915 2 682 965 77 11 0612011 2 837 32 4 400 827 3 044 966 80 12 1862012 2 772 32 4 800 2 010 3 431 951 79 14 0752013 2 783 32 5 200 2 089 3 482 945 127 14 6582014 2 873 32 5 650 2 141 3 637 975 20 15 3282015 2 906 32 6 200 2 075 3 456 945 0 15 614
Source: WBMS

Review of global non-ferrous scrap flows 27
Secondary aluminium production increased from 8 million tonnes in 2000 to 15.6 million in 2015. Europe and the USA showed little change. China’s total increased by 6 million tonnes and the rest of Asia by 1.1 million tonnes.
Both the US Aluminum Association and the Japan Aluminium Alloy Refiners Association publish data on the output of secondary aluminium. The table below shows Japanese production of secondary aluminium by type of scrap.
TABLE 9: JAPANESE SECONDARY ALUMINIUM PRODUCTION IN THOUSAND TONNES
2000 2005 2010 2015Production of primary 7 0 0 0Production of secondary 910 1 039 817 773Total 917 1 039 817 773
Of which from:Aluminium scrap 91 86 85 76Alloy scrap 621 731 548 575Remelt 153 207 190 149Aluminium dross 80 81 63 64Other/alloying metal 69 80 61 75Total 1 014 1 185 947 939
Source: Japan Aluminium Alloy Refiners Association
There is currently no primary aluminium production in Japan and output is exclusively from scrap. The majority of the scrap used is alloyed material and recovery rates are around 85% to 90%. In recent years, secondary aluminium production in Japan has accounted for about one quarter of the country’s demand for aluminium metal.
Data published by the US Aluminum Association show the consumption of scrap and the metal recovered from it. Metal recovery rates from scrap are around 80% to 85% and secondary metal accounts for between 35% and 40% of the national demand for aluminium metal.

28 Review of global non-ferrous scrap flows
TABLE 10: USAGE OF ALUMINIUM SCRAP IN THE USA IN THOUSAND TONNES
Scrap Consumption Metallic Recovery New Old2002 3 620 2 920 1 750 1 1702003 3 519 2 851 1 720 1 1312004 3 656 3 030 1 830 1 2002005 3 544 2 990 1 926 1 0642006 4 322 3 536 2 284 1 2522007 4 580 3 747 2 219 1 5282008 4 144 3 319 1 975 1 3442009 3 721 3 100 1 849 1 2512010 3 374 2 804 1 553 1 2512011 3 736 3 029 1 631 1 3982012 4 076 3 430 1 810 1 6202013 4 114 3 482 1 850 1 6332014 4 400 3 637 1 932 1 7052015 4 520 3 456 1 870 1 586
Source: US Aluminium Association

CHAPTER 4
INTERNATIONAL TRADE

30 Review of global non-ferrous scrap flows
4.1 Trade definitions
Sections 5 and 6 examine global copper scrap and aluminium scrap flows as measured by individual national customs authorities. The analysis concentrates largely on extra-regional flows of scrap which excludes any exports shipped within the same continent or economic bloc.
For the purposes of this report, trade recorded under the tariff headings 740400 (copper and alloy scrap) and 760200 (aluminium and alloy scrap) have been used. These categories include scrap shipped in gross weight terms. This means that alloying metals and coatings will be included in the total weight of material shipped. On average, the material shipped under these codes will contain roughly 60% copper and 70% aluminium. Other tariff headings covering mixed scrap have been excluded from the analyses as there is no way of evaluating how much copper may be included under these headings.
It is important to understand the way the data are collected and the significance of national differences in the definition of trade and the products they cover.
All countries need to measure the imports and exports of goods and services in order to calculate the balance of payments data. In 1988, a worldwide coding system known as the Harmonised System was introduced and has now been adopted in virtually all countries. The first six digits of the code are common to all countries but additional digits may be used by individual countries to further sub-divide the products.
There are key differences in the definitions used by countries that affect the way the data are collected. In some cases, a shipment may be delivered to a country for onward transportation to another state. In this case, the final receiving country can either register the trade by the country of origin or the country of consignment. As a result of this, the same cargo of scrap metal can be recorded more than once along its journey. Another issue is the treatment of shipments directly into a bonded warehouse. Some countries record these trades as an import as soon as the product crosses the border and others at the point where the material is delivered to the end user. Finally, there are leads and lags between the timing of export shipment and the point at which it is registered as an import. For these reasons, it is rare that the export data from one shipping country will exactly match the corresponding import statistics for the receiving country.
In this report, both import and export data will be reviewed. Scrap trade is only one part of the flow of secondary material since it excludes domestic scrap arisings that are used within the country of collection. However, it does provide an insight into how the external scrap market works.

Review of global non-ferrous scrap flows 31
CHAPTER 5
TRADE IN COPPER AND ALLOY SCRAP

32 Review of global non-ferrous scrap flows
5.1 Regional copper and alloy scrap trade flows
Copper and alloy scrap is traded internationally by many countries. For the purpose of this study, we have included data for trade statistics from 176 countries.
Regional flows of copper and alloy scrap as reported by the import and export statistics are measured in gross weight terms, which means that the total weight exported includes other metals as part of an alloy. It is difficult to assess what percentage of copper is contained in these exports but it is generally assumed that copper scrap is 100% copper and alloy scrap is around 65% copper. On average, it is assumed that the mixed copper and alloy scrap contains around 80% copper.
For each of the last 15 years, the USA has been the single largest exporter of copper and alloy scrap, accounting for between 14% and 22% of global exports. The next six largest exporters, all mature economies, regularly contributed a further 30% to 36% of global exports. The top seven (the USA, Germany, Japan, France, the Netherlands, the UK and Italy) jointly accounted for more than half of the world’s exports of copper scrap. Exports of scrap from Asian countries including South Korea, Thailand and Saudi Arabia have increased by 54% since 2000 but are still small compared with the top seven countries.
5.2 Copper and alloy scrap exports
Total exports grew at an annual rate of 4% over the 15 years under review. Overall, the 28 countries of the European Union have consistently exported the most copper and alloy scrap, although the bulk of this material is shipped to other EU member states. America continues to be a strong exporter, accounting for between 20% and 36% of global trade. Asian countries, outside China and the Middle East, had started to become a major force in the export of scrap up to 2006 but have become less significant in the last few years as the domestic market became stronger.
Global shipments fell by 14% in 2015 from the high of 5.8 million tonnes in 2011. In absolute terms, the greatest falls were recorded in the European Union and Asian countries outside China and the Middle East.

Review of global non-ferrous scrap flows 33
FIGURE 4: REGIONAL EXPORTS OF COPPER AND ALLOY SCRAP 2000 TO 2015 IN THOUSAND TONNES
FIGURE 5: REGIONAL IMPORTS OF COPPER AND ALLOY SCRAP 2000 TO 2015 IN THOUSAND TONNES
0
50
100
150
200
250
300
2015201420132012201120102009200820072006200520042003200220012000
America (27 %) Asia (17 %) Others (10 %)European Union (45 %)
0
1000
2000
3000
4000
5000
6000
2015201420132012201120102009200820072006200520042003200220012000
EU (28 %) Other Asia (14 %) Others (3 %)China (55 %)
Figures in brackets are regional percentages for 2015. Source: National Customs Statistics via Global Trade Tracker
Figures in brackets are regional percentages for 2015. Source: National Customs Statistics via Global Trade Tracker
34 Review of global non-ferrous scrap flows
5.3 Copper and alloy scrap imports
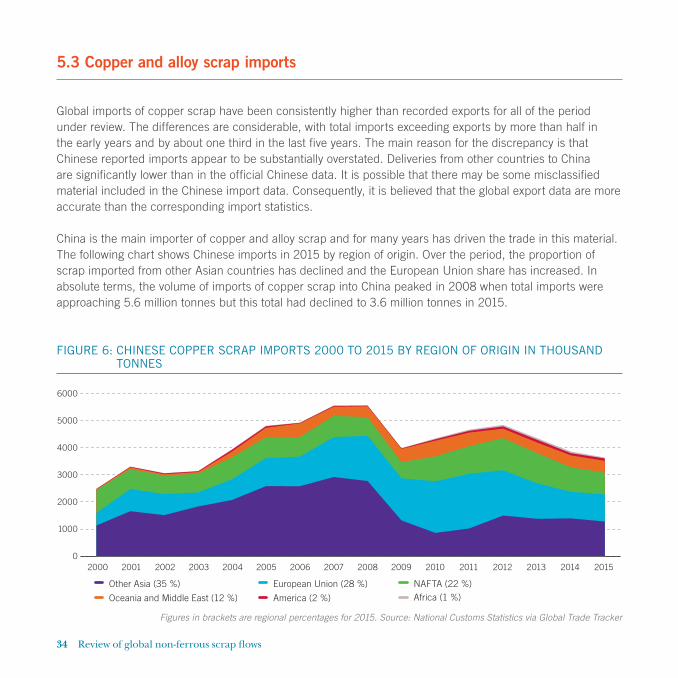
Global imports of copper scrap have been consistently higher than recorded exports for all of the period under review. The differences are considerable, with total imports exceeding exports by more than half in the early years and by about one third in the last five years. The main reason for the discrepancy is that Chinese reported imports appear to be substantially overstated. Deliveries from other countries to China are significantly lower than in the official Chinese data. It is possible that there may be some misclassified material included in the Chinese import data. Consequently, it is believed that the global export data are more accurate than the corresponding import statistics.
China is the main importer of copper and alloy scrap and for many years has driven the trade in this material. The following chart shows Chinese imports in 2015 by region of origin. Over the period, the proportion of scrap imported from other Asian countries has declined and the European Union share has increased. In absolute terms, the volume of imports of copper scrap into China peaked in 2008 when total imports were approaching 5.6 million tonnes but this total had declined to 3.6 million tonnes in 2015.
FIGURE 6: CHINESE COPPER SCRAP IMPORTS 2000 TO 2015 BY REGION OF ORIGIN IN THOUSAND TONNES
0
1000
2000
3000
4000
5000
6000
2015201420132012201120102009200820072006200520042003200220012000
America (2 %)
Other Asia (35 %) European Union (28 %) NAFTA (22 %)Africa (1 %)Oceania and Middle East (12 %)
Figures in brackets are regional percentages for 2015. Source: National Customs Statistics via Global Trade Tracker

Review of global non-ferrous scrap flows 35
5.4 Extra-regional trade in copper and alloy scrap
Intra-regional trade is defined as exports of a product by one member of a regional group to another member of the same group (eg European Union or NAFTA). Exports to countries outside the group are called extra-regional trade and this section looks at this part of the exports only.
The table below shows extra-regional exports only for the years 2000, 2005, 2010 and 2015. The second section is a summary of these exports analysed by trading partner (ie the importer).
TABLE 11: SUMMARY OF COPPER IMPORTS AND EXPORTS BY REGION IN MILLION TONNES
2000 2005 2010 2015ExportsNAFTA 0.4 0.8 1.2 1.1Other America 0.1 0.1 0.2 0.0Other Asia 0.3 0.8 0.6 1.2European Union 0.5 0.9 1.2 1.0Other Europe 0.1 0.1 0.2 0.1Others 0.3 0.4 0.4 0.5Total 1.7 3.1 3.8 3.9
Delivered to:China 0.9 2.2 2.8 2.4Other Asia 0.4 0.6 0.6 0.5European Union 0.2 0.2 0.3 0.5Others 0.2 0.1 0.1 0.5Total 1.7 3.1 3.8 3.9
Source: National Customs Statistics via Global Trade Tracker

36 Review of global non-ferrous scrap flows
Between one third and a half of all reported scrap exports are to nearby countries within that region. In 2015, for example, 2.1 million tonnes were traded between the groups and regions out of total reported exports of 6 million tonnes (see table 15). Exports recorded by NAFTA are currently the most significant, accounting for about one third of the total. The EU has been equally as important as NAFTA for the early years but has declined in 2015 (see table 11). Exports by countries in Africa and Oceania contribute only small quantities of exports and are shown on the table as others. China has been the dominant recipient of exported scrap taking 53% of the material in 2000 and rising to 62% in 2015. Deliveries to other Asian countries and to the EU have remained flat throughout the period.
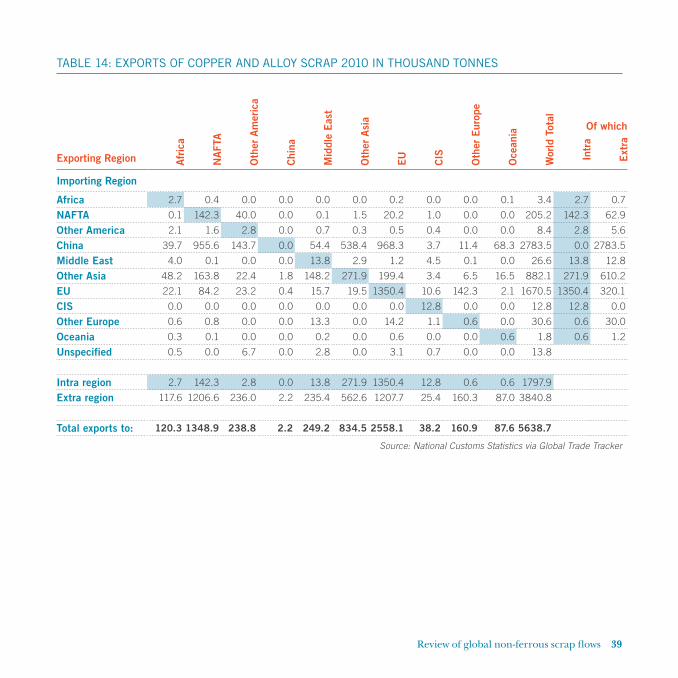
The following four tables show the global exports by region of destination. All of the data are taken from national reported export data and the intra-regional trade has been highlighted in blue.

Review of global non-ferrous scrap flows 37
TABLE 12: EXPORTS OF COPPER AND ALLOY SCRAP 2000 IN THOUSAND TONNES
Exporting Region Afr
ica
NA
FTA
Oth
er A
mer
ica
Chi
na
Mid
dle
Eas
t
Oth
er A
sia
EU CIS
Oth
er E
urop
e
Oce
ania
Wor
ld T
otal
Of which
Intr
a
Ext
ra
Importing Region
Africa 9.1 0.2 0.0 0.0 0.0 0.1 0.9 0.1 0.0 0.0 10.4 9.1 1.3
NAFTA 1.6 220.5 11.6 0.0 0.3 2.7 14.4 0.3 0.4 0.1 251.9 220.5 31.3
Other America 0.1 3.3 2.5 3.4 0.0 0.0 1.8 0.1 0.0 0.0 11.2 2.5 8.8
China 20.4 231.2 21.4 0.0 1.9 277.2 270.5 67.6 9.0 15.6 914.8 0.0 914.9
Middle East 1.9 0.4 0.0 0.0 2.8 0.2 2.3 7.4 0.0 0.0 15.0 2.8 12.2
Other Asia 30.8 161.7 9.4 6.7 29.3 227.9 157.9 15.7 5.3 17.3 662.0 227.9 434.2
EU 44.0 20.0 9.2 0.0 3.8 4.3 994.0 82.9 69.7 0.4 1228.3 994.0 234.3
CIS 0.0 0.1 0.0 0.0 0.0 0.0 0.0 10.4 0.0 0.0 10.5 10.4 0.1
Other Europe 2.4 1.3 0.5 0.0 0.9 0.2 23.0 1.2 0.1 0.0 29.6 0.1 29.5
Oceania 0.1 0.2 0.0 0.0 0.0 0.4 1.2 0.0 0.2 3.1 5.2 3.1 2.0
Unspecified 2.1 0.2 4.1 0.0 23.0 1.9 0.1 0.3 0.1 0.0 31.8
Intra region 9.1 220.5 2.5 0.0 2.8 227.9 994.0 10.4 0.1 3.1 1470.4
Extra region 103.4 418.6 56.2 10.1 59.2 287.0 472.1 175.6 84.7 33.4 1700.3
Total exports to: 112.5 639.1 58.7 10.1 62.0 514.8 1466.1 186.0 84.8 36.5 3170.7
Source: National Customs Statistics via Global Trade Tracker

38 Review of global non-ferrous scrap flows
TABLE 13: EXPORTS OF COPPER AND ALLOY SCRAP 2005 IN THOUSAND TONNES
Exporting Region Afr
ica
NA
FTA
Oth
er A
mer
ica
Chi
na
Mid
dle
Eas
t
Oth
er A
sia
EU CIS
Oth
er E
urop
e
Oce
ania
Wor
ld T
otal
Of which
Intr
a
Ext
ra
Importing Region
Africa 2.7 0.0 0.0 0.0 0.3 0.0 0.6 0.0 0.0 0.0 3.6 2.7 0.9
NAFTA 0.8 158.9 14.2 0.0 0.1 0.7 7.4 0.0 0.1 0.0 182.2 158.9 23.3
Other America 0.1 0.4 2.0 0.0 0.0 0.0 0.2 0.0 0.0 0.0 2.7 2.0 0.7
China 23.3 584.4 51.7 0.0 36.0 768.0 641.1 7.2 22.4 80.4 2214.5 0.0 2214.5
Middle East 2.1 0.2 0.0 0.0 5.3 1.6 1.9 2.7 0.0 0.0 13.8 5.3 8.5
Other Asia 39.1 151.7 12.1 6.3 142.6 473.7 226.3 4.0 4.5 12.3 1072.6 473.7 598.9
EU 39.2 47.9 3.5 0.1 7.3 3.4 1071.7 5.4 85.1 1.5 1265.1 1071.7 193.4
CIS 0.0 0.0 0.0 0.0 0.0 0.0 0.0 1.4 0.0 0.0 1.4 1.4 0.0
Other Europe 0.8 0.3 0.0 0.0 0.0 0.1 49.8 0.0 1.2 0.1 52.3 1.2 51.1
Oceania 0.0 0.0 0.0 0.0 0.0 0.0 0.9 0.0 0.0 1.0 1.9 1.0 0.9
Unspecified 9.4 0.0 22.7 0.0 3.8 6.2 0.3 0.1 0.2 0.0 42.7
Intra region 2.7 158.9 2.0 0.0 5.3 473.7 1071.7 1.4 1.2 1.0 1717.9
Extra region 114.8 784.9 104.2 6.4 190.1 780.0 928.5 19.4 112.3 94.3 3134.9
Total exports to: 117.5 943.8 106.2 6.4 195.4 1253.7 2000.2 20.8 113.5 95.3 4852.7
Source: National Customs Statistics via Global Trade Tracker
Review of global non-ferrous scrap flows 39
TABLE 14: EXPORTS OF COPPER AND ALLOY SCRAP 2010 IN THOUSAND TONNES
Exporting Region Afr
ica
NA
FTA
Oth
er A
mer
ica
Chi
na
Mid
dle
Eas
t
Oth
er A
sia
EU CIS
Oth
er E
urop
e
Oce
ania
Wor
ld T
otal
Of which
Intr
a
Ext
ra
Importing Region
Africa 2.7 0.4 0.0 0.0 0.0 0.0 0.2 0.0 0.0 0.1 3.4 2.7 0.7
NAFTA 0.1 142.3 40.0 0.0 0.1 1.5 20.2 1.0 0.0 0.0 205.2 142.3 62.9
Other America 2.1 1.6 2.8 0.0 0.7 0.3 0.5 0.4 0.0 0.0 8.4 2.8 5.6
China 39.7 955.6 143.7 0.0 54.4 538.4 968.3 3.7 11.4 68.3 2783.5 0.0 2783.5
Middle East 4.0 0.1 0.0 0.0 13.8 2.9 1.2 4.5 0.1 0.0 26.6 13.8 12.8
Other Asia 48.2 163.8 22.4 1.8 148.2 271.9 199.4 3.4 6.5 16.5 882.1 271.9 610.2
EU 22.1 84.2 23.2 0.4 15.7 19.5 1350.4 10.6 142.3 2.1 1670.5 1350.4 320.1
CIS 0.0 0.0 0.0 0.0 0.0 0.0 0.0 12.8 0.0 0.0 12.8 12.8 0.0
Other Europe 0.6 0.8 0.0 0.0 13.3 0.0 14.2 1.1 0.6 0.0 30.6 0.6 30.0
Oceania 0.3 0.1 0.0 0.0 0.2 0.0 0.6 0.0 0.0 0.6 1.8 0.6 1.2
Unspecified 0.5 0.0 6.7 0.0 2.8 0.0 3.1 0.7 0.0 0.0 13.8
Intra region 2.7 142.3 2.8 0.0 13.8 271.9 1350.4 12.8 0.6 0.6 1797.9
Extra region 117.6 1206.6 236.0 2.2 235.4 562.6 1207.7 25.4 160.3 87.0 3840.8
Total exports to: 120.3 1348.9 238.8 2.2 249.2 834.5 2558.1 38.2 160.9 87.6 5638.7
Source: National Customs Statistics via Global Trade Tracker

40 Review of global non-ferrous scrap flows
TABLE 15: EXPORTS OF COPPER AND ALLOY SCRAP 2015 IN THOUSAND TONNES
Exporting Region Afr
ica
NA
FTA
Oth
er A
mer
ica
Chi
na
Mid
dle
Eas
t
Oth
er A
sia
EU CIS
Oth
er E
urop
e
Oce
ania
Wor
ld T
otal
Of which
Intr
a
Ext
ra
Importing Region
Africa 3.4 0.2 0.0 0.0 0.7 0.0 0.6 0.0 0.0 0.0 4.9 3.4 1.5
NAFTA 0.0 173.5 8.6 0.0 0.3 0.1 14.0 0.3 0.1 0.2 197.1 173.5 23.6
Other America 0.1 3.3 4.1 0.0 0.1 0.1 2.0 1.9 0.0 0.0 11.6 4.1 7.5
China 18.4 807.0 90.5 0.0 12.1 591.3 784.3 3.4 13.1 64.8 2384.9 0.0 2384.9
Middle East 4.5 2.3 0.6 0.0 21.6 1.0 1.4 0.1 0.4 0.0 31.9 21.6 10.3
Other Asia 23.3 127.3 28.4 0.1 98.9 606.7 188.2 0.6 4.6 26.5 1104.6 606.7 497.9
EU 17.6 123.9 17.7 0.0 15.2 639.3 1286.2 4.8 145.2 2.0 2251.9 1286.2 965.7
CIS 0.0 0.0 0.0 0.0 0.0 0.0 1.1 1.3 0.0 0.0 2.4 1.3 1.1
Other Europe 0.0 0.7 0.0 0.0 0.0 0.0 22.6 24.2 1.8 0.0 49.3 1.8 47.5
Oceania 0.7 0.0 0.0 0.0 0.0 0.0 0.2 0.0 0.0 1.6 2.5 1.6 0.9
Unspecified 0.6 0.0 0.0 0.0 0.1 0.0 0.2 0.0 0.0 0.0 0.9
Intra region 3.4 173.5 4.1 0.0 21.6 606.7 1286.2 1.3 1.8 1.6 2100.5
Extra region 65.2 1064.7 145.8 0.1 127.4 1231.8 1014.6 35.3 163.4 93.5 3941.8
Total exports to: 68.6 1238.2 149.9 0.1 149.0 1838.5 2300.8 36.6 165.2 95.1 6042.0
Source: National Customs Statistics via Global Trade Tracker
Review of global non-ferrous scrap flows 41
CHAPTER 6
GLOBAL ALUMINIUM TRADE FLOWS

42 Review of global non-ferrous scrap flows
6.1 Regional aluminium and alloy scrap trade flows
There are very few countries in the world which do not trade in aluminium scrap. For the purposes of this study, we have obtained reports on imports and exports from around 115 countries.
Regional flows of aluminium and alloy scrap as reported by the import and export statistics are measured in gross weight terms, which means that the total weight exported includes other metals as part of an alloy. It is difficult to assess what percentage of aluminium is contained in these exports but aluminium products contain a low proportion of alloying metals. On average, it is assumed that the mixed aluminium and alloy scrap contains around 90% aluminium.
6.2 Aluminium and alloy scrap exports
Over the period 2000 to 2015, total exports of aluminium scrap grew at a compound rate of 6% per annum. In 2000, total exports were 3.6 million tonnes and by 2015 this had grown to 7.6 million tonnes. Throughout the period, the top six exporters (the USA, Germany, Canada, France, the UK and the Netherlands) consistently accounted for more than half of the global total (see tables 17 to 20).
Review of global non-ferrous scrap flows 43
6.3 Aluminium and alloy scrap imports
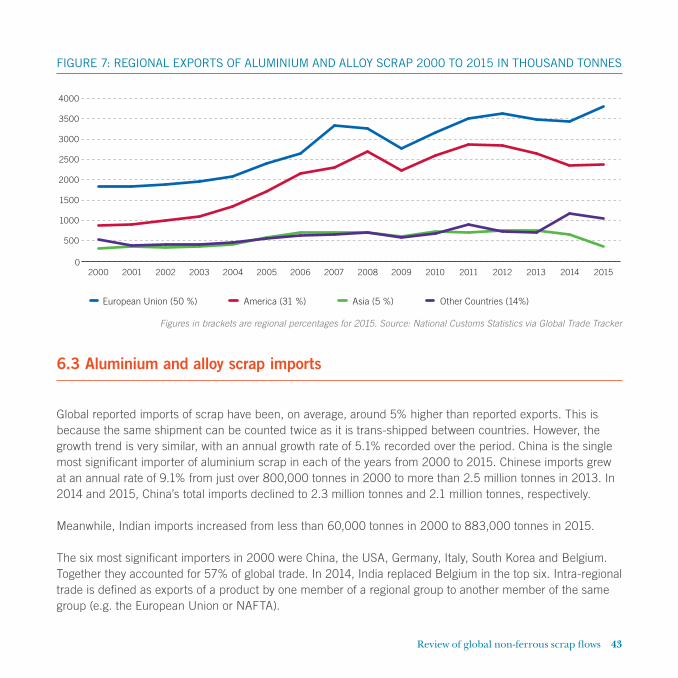
Global reported imports of scrap have been, on average, around 5% higher than reported exports. This is because the same shipment can be counted twice as it is trans-shipped between countries. However, the growth trend is very similar, with an annual growth rate of 5.1% recorded over the period. China is the single most significant importer of aluminium scrap in each of the years from 2000 to 2015. Chinese imports grew at an annual rate of 9.1% from just over 800,000 tonnes in 2000 to more than 2.5 million tonnes in 2013. In 2014 and 2015, China’s total imports declined to 2.3 million tonnes and 2.1 million tonnes, respectively.
Meanwhile, Indian imports increased from less than 60,000 tonnes in 2000 to 883,000 tonnes in 2015.
The six most significant importers in 2000 were China, the USA, Germany, Italy, South Korea and Belgium. Together they accounted for 57% of global trade. In 2014, India replaced Belgium in the top six. Intra-regional trade is defined as exports of a product by one member of a regional group to another member of the same group (e.g. the European Union or NAFTA).
FIGURE 7: REGIONAL EXPORTS OF ALUMINIUM AND ALLOY SCRAP 2000 TO 2015 IN THOUSAND TONNES
0
500
1000
1500
2000
2500
3000
3500
4000
2015201420132012201120102009200820072006200520042003200220012000
America (31 %) Asia (5 %) Other Countries (14%)European Union (50 %)
Figures in brackets are regional percentages for 2015. Source: National Customs Statistics via Global Trade Tracker

44 Review of global non-ferrous scrap flows
FIGURE 8: REGIONAL IMPORTS OF ALUMINIUM AND ALLOY SCRAP 2000 TO 2015 IN THOUSAND TONNES
FIGURE 9: CHINESE ALUMINIUM SCRAP IMPORTS 2000 TO 2015 BY REGION OF ORIGIN IN THOUSAND TONNES
0
1000
2000
3000
4000
5000
2015201420132012201120102009200820072006200520042003200220012000
EU (39 %) America (10 %) Others (1 %)Asia (50 %)
0
500
1000
1500
2000
2500
3000
2015201420132012201120102009200820072006200520042003200220012000
Others (1%)
NAFTA (33 %) Other Asia (31 %) European Union (19 %)
Oceania and Middle East (16 %)
Figures in brackets are regional percentages for 2015. Source: National Customs Statistics via Global Trade Tracker
Figures in brackets are regional percentages for 2015. Source: National Customs Statistics via Global Trade Tracker

Review of global non-ferrous scrap flows 45
Chinese imports remain the main driver of international trade in aluminium scrap. The graph on the previous page shows the imports of aluminium and alloy scrap into China by region for the years 2000 to 2015.
Chinese imports of aluminium and alloy scrap peaked in 2010 at 20.9 million tonnes but the total has declined steadily since then. At the peak, the European Union supplied much of the scrap required by Chinese secondary smelters but, in recent years, the three NAFTA countries have been increasing their exports to China. Shipments from other Asian countries peaked in 2012 at 1.1 million tonnes but fell back in more recent years.
6.4 Extra-regional trade in aluminium and alloy scrap
The table on the following page shows extra-regional exports for the years 2000, 2005, 2010 and 2015. The second section is a summary of the extra-regional exports analysed by trading partner (i.e. the importer).
NAFTA is the largest regional exporter, accounting for 1.5 million tonnes in 2015, followed by the EU with 0.9 million tonnes. China is the largest importing region with 1.5 million tonnes in 2015 followed by the rest of Asia with 1.4 million tonnes.

46 Review of global non-ferrous scrap flows
TABLE 16: SUMMARY OF ALUMINIUM IMPORTS AND EXPORTS BY REGION IN MILLION TONNES
2000 2005 2010 2015ExportsNAFTA 0.3 1.0 1.8 1.5Middle East 0.1 0.3 0.4 0.2Other Asia 0.1 0.2 0.3 0.0European Union 0.4 0.7 0.9 0.9Former CIS 0.2 0.0 0.0 0.0Other Europe 0.2 0.2 0.2 0.4Others 0.2 0.3 0.4 0.6Total 1.5 2.7 4.0 3.6
Delivered to:China 0.5 1.3 2.1 1.5Other Asia 0.5 1.0 1.4 1.4European Union 0.0 0.4 0.3 0.4Others 0.5 0.0 0.2 0.3Total 1.5 2.7 4.0 3.6
Source: National Customs Statistics via Global Trade Tracker
The following four tables show the global exports by region of destination. All of the data are taken from national reported export data and the intra-regional trade has been highlighted in blue.
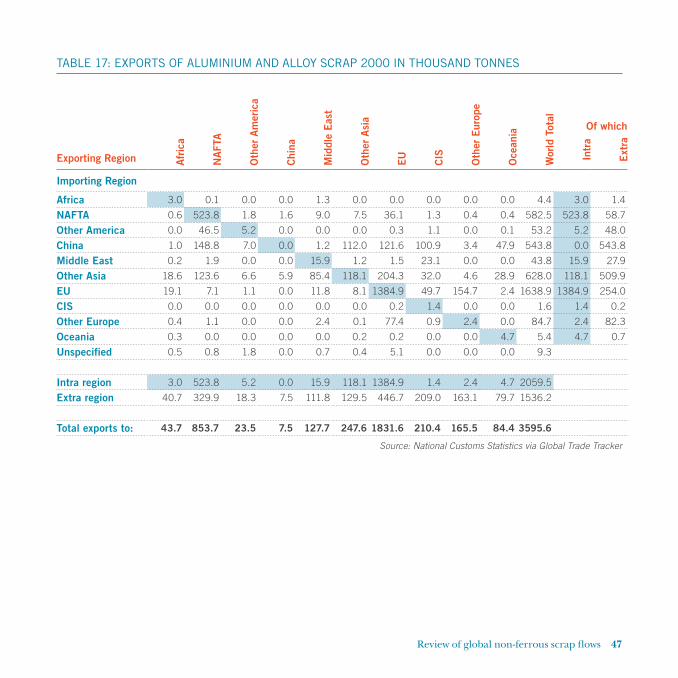
Review of global non-ferrous scrap flows 47
TABLE 17: EXPORTS OF ALUMINIUM AND ALLOY SCRAP 2000 IN THOUSAND TONNES
Exporting Region Afr
ica
NA
FTA
Oth
er A
mer
ica
Chi
na
Mid
dle
Eas
t
Oth
er A
sia
EU CIS
Oth
er E
urop
e
Oce
ania
Wor
ld T
otal
Of which
Intr
a
Ext
ra
Importing Region
Africa 3.0 0.1 0.0 0.0 1.3 0.0 0.0 0.0 0.0 0.0 4.4 3.0 1.4
NAFTA 0.6 523.8 1.8 1.6 9.0 7.5 36.1 1.3 0.4 0.4 582.5 523.8 58.7
Other America 0.0 46.5 5.2 0.0 0.0 0.0 0.3 1.1 0.0 0.1 53.2 5.2 48.0
China 1.0 148.8 7.0 0.0 1.2 112.0 121.6 100.9 3.4 47.9 543.8 0.0 543.8
Middle East 0.2 1.9 0.0 0.0 15.9 1.2 1.5 23.1 0.0 0.0 43.8 15.9 27.9
Other Asia 18.6 123.6 6.6 5.9 85.4 118.1 204.3 32.0 4.6 28.9 628.0 118.1 509.9
EU 19.1 7.1 1.1 0.0 11.8 8.1 1384.9 49.7 154.7 2.4 1638.9 1384.9 254.0
CIS 0.0 0.0 0.0 0.0 0.0 0.0 0.2 1.4 0.0 0.0 1.6 1.4 0.2
Other Europe 0.4 1.1 0.0 0.0 2.4 0.1 77.4 0.9 2.4 0.0 84.7 2.4 82.3
Oceania 0.3 0.0 0.0 0.0 0.0 0.2 0.2 0.0 0.0 4.7 5.4 4.7 0.7
Unspecified 0.5 0.8 1.8 0.0 0.7 0.4 5.1 0.0 0.0 0.0 9.3
Intra region 3.0 523.8 5.2 0.0 15.9 118.1 1384.9 1.4 2.4 4.7 2059.5
Extra region 40.7 329.9 18.3 7.5 111.8 129.5 446.7 209.0 163.1 79.7 1536.2
Total exports to: 43.7 853.7 23.5 7.5 127.7 247.6 1831.6 210.4 165.5 84.4 3595.6
Source: National Customs Statistics via Global Trade Tracker
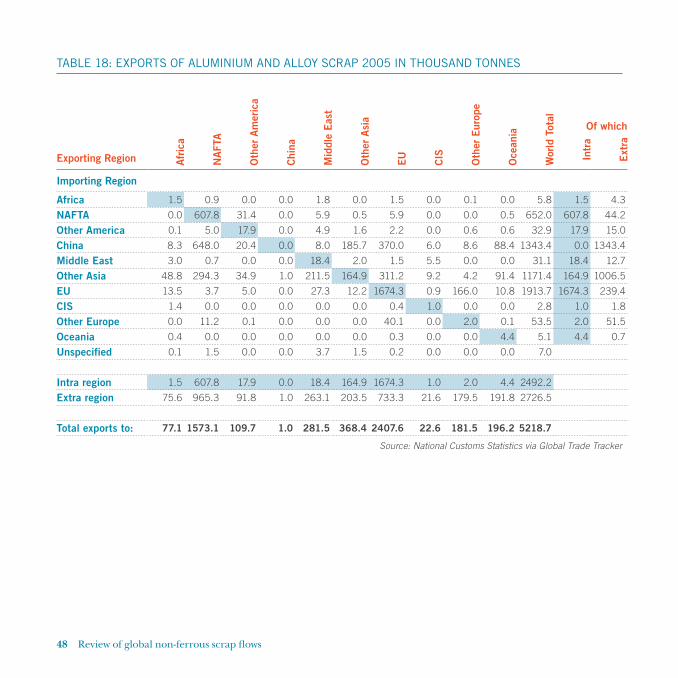
48 Review of global non-ferrous scrap flows
TABLE 18: EXPORTS OF ALUMINIUM AND ALLOY SCRAP 2005 IN THOUSAND TONNES
Exporting Region Afr
ica
NA
FTA
Oth
er A
mer
ica
Chi
na
Mid
dle
Eas
t
Oth
er A
sia
EU CIS
Oth
er E
urop
e
Oce
ania
Wor
ld T
otal
Of which
Intr
a
Ext
ra
Importing Region
Africa 1.5 0.9 0.0 0.0 1.8 0.0 1.5 0.0 0.1 0.0 5.8 1.5 4.3
NAFTA 0.0 607.8 31.4 0.0 5.9 0.5 5.9 0.0 0.0 0.5 652.0 607.8 44.2
Other America 0.1 5.0 17.9 0.0 4.9 1.6 2.2 0.0 0.6 0.6 32.9 17.9 15.0
China 8.3 648.0 20.4 0.0 8.0 185.7 370.0 6.0 8.6 88.4 1343.4 0.0 1343.4
Middle East 3.0 0.7 0.0 0.0 18.4 2.0 1.5 5.5 0.0 0.0 31.1 18.4 12.7
Other Asia 48.8 294.3 34.9 1.0 211.5 164.9 311.2 9.2 4.2 91.4 1171.4 164.9 1006.5
EU 13.5 3.7 5.0 0.0 27.3 12.2 1674.3 0.9 166.0 10.8 1913.7 1674.3 239.4
CIS 1.4 0.0 0.0 0.0 0.0 0.0 0.4 1.0 0.0 0.0 2.8 1.0 1.8
Other Europe 0.0 11.2 0.1 0.0 0.0 0.0 40.1 0.0 2.0 0.1 53.5 2.0 51.5
Oceania 0.4 0.0 0.0 0.0 0.0 0.0 0.3 0.0 0.0 4.4 5.1 4.4 0.7
Unspecified 0.1 1.5 0.0 0.0 3.7 1.5 0.2 0.0 0.0 0.0 7.0
Intra region 1.5 607.8 17.9 0.0 18.4 164.9 1674.3 1.0 2.0 4.4 2492.2
Extra region 75.6 965.3 91.8 1.0 263.1 203.5 733.3 21.6 179.5 191.8 2726.5
Total exports to: 77.1 1573.1 109.7 1.0 281.5 368.4 2407.6 22.6 181.5 196.2 5218.7
Source: National Customs Statistics via Global Trade Tracker

Review of global non-ferrous scrap flows 49
TABLE 19: EXPORTS OF ALUMINIUM AND ALLOY SCRAP 2010 IN THOUSAND TONNES
Exporting Region Afr
ica
NA
FTA
Oth
er A
mer
ica
Chi
na
Mid
dle
Eas
t
Oth
er A
sia
EU CIS
Oth
er E
urop
e
Oce
ania
Wor
ld T
otal
Of which
Intr
a
Ext
ra
Importing Region
Africa 7.2 0.4 0.0 0.0 0.7 0.9 1.5 0.0 0.0 0.0 10.7 7.2 3.5
NAFTA 0.2 650.6 31.2 0.0 0.7 0.7 7.4 0.3 0.0 0.0 691.1 650.6 40.5
Other America 1.1 6.6 31.6 0.0 9.1 0.2 6.9 0.1 1.1 0.0 56.7 31.6 25.1
China 4.2 1335.7 24.3 0.0 10.7 205.8 369.3 2.0 13.4 94.3 2059.7 0.0 2059.7
Middle East 7.9 0.3 0.1 0.0 14.7 2.9 6.2 6.2 0.0 1.5 39.8 14.7 25.1
Other Asia 58.0 449.3 34.2 1.1 325.5 204.4 428.2 8.7 10.0 134.2 1653.6 204.4 1449.2
EU 11.0 8.5 2.9 0.0 18.5 62.4 2290.8 2.4 184.2 4.6 2585.3 2290.8 294.5
CIS 3.0 0.0 0.0 0.0 0.0 0.0 0.1 0.0 0.0 0.0 3.1 0.0 3.1
Other Europe 0.0 0.7 0.0 0.0 15.9 0.0 72.5 0.0 5.0 0.0 94.1 5.0 89.1
Oceania 0.2 0.2 0.0 0.0 0.0 0.8 3.7 0.0 0.0 5.3 10.2 5.3 4.9
Unspecified 1.7 0.0 0.0 0.0 22.6 0.8 0.0 0.0 0.0 0.1 25.1
Intra region 7.2 650.6 31.6 0.0 14.7 204.4 2290.8 0.0 5.0 5.3 3209.5
Extra region 87.3 1801.7 92.7 1.1 403.7 274.5 895.8 19.7 208.7 234.7 4019.9
Total exports to: 94.5 2452.3 124.3 1.1 418.4 478.9 3186.6 19.7 213.7 240.0 7229.5
Source: National Customs Statistics via Global Trade Tracker

50 Review of global non-ferrous scrap flows
TABLE 20: EXPORTS OF ALUMINIUM AND ALLOY SCRAP 2015 IN THOUSAND TONNES
Exporting Region Afr
ica
NA
FTA
Oth
er A
mer
ica
Chi
na
Mid
dle
Eas
t
Oth
er A
sia
EU CIS
Oth
er E
urop
e
Oce
ania
Wor
ld T
otal
Of which
Intr
a
Ext
ra
Importing Region
Africa 3.3 0.1 0.0 0.0 1.5 0.1 0.5 0.0 0.0 0.1 5.6 3.3 2.3
NAFTA 0.2 702.8 49.7 0.0 2.2 2.8 10.2 0.0 1.6 0.1 769.6 702.8 66.8
Other America 3.8 29.8 52.1 0.0 3.0 0.0 1.2 0.1 0.9 0.1 91.0 52.1 38.9
China 7.4 975.6 24.7 0.0 1.2 63.8 330.7 0.2 17.9 95.5 1517.0 0.0 1517.0
Middle East 4.5 1.8 0.6 0.0 34.9 2.0 2.4 0.3 0.2 4.5 51.2 34.9 16.3
Other Asia 69.5 429.4 76.5 1.0 165.5 298.2 450.7 6.4 25.0 178.1 1700.3 298.2 1402.1
EU 20.6 14.8 7.7 0.0 10.6 5.3 2906.7 3.2 357.4 12.6 3338.9 2906.7 432.2
CIS 0.1 0.3 0.0 0.0 0.0 0.6 1.4 0.9 0.0 0.0 3.3 0.9 2.4
Other Europe 0.0 2.4 0.0 0.0 0.0 0.0 93.4 0.4 5.0 0.0 101.2 5.0 96.2
Oceania 2.1 0.0 0.0 0.0 0.0 0.0 0.1 0.0 0.0 5.0 7.2 5.0 2.2
Unspecified 0.5 0.0 0.0 0.0 0.2 0.0 8.6 0.0 2.6 0.0 11.9
Intra region 3.3 702.8 52.1 0.0 34.9 298.2 2906.7 0.9 5.0 5.0 4009.0
Extra region 108.7 1454.2 159.2 1.0 184.2 74.6 899.2 10.6 405.6 291.0 3588.3
Total exports to: 112.0 2157.0 211.3 1.0 219.1 372.8 3805.9 11.5 410.6 296.0 7597.2
Source: National Customs Statistics via Global Trade Tracker
CHAPTER 7
MAPS
The maps on the following pages show the geographical shipments of copper and alloy scrap in 2015, followed by aluminium and alloy scrap in the same year.
52 Review of global non-ferrous scrap flows
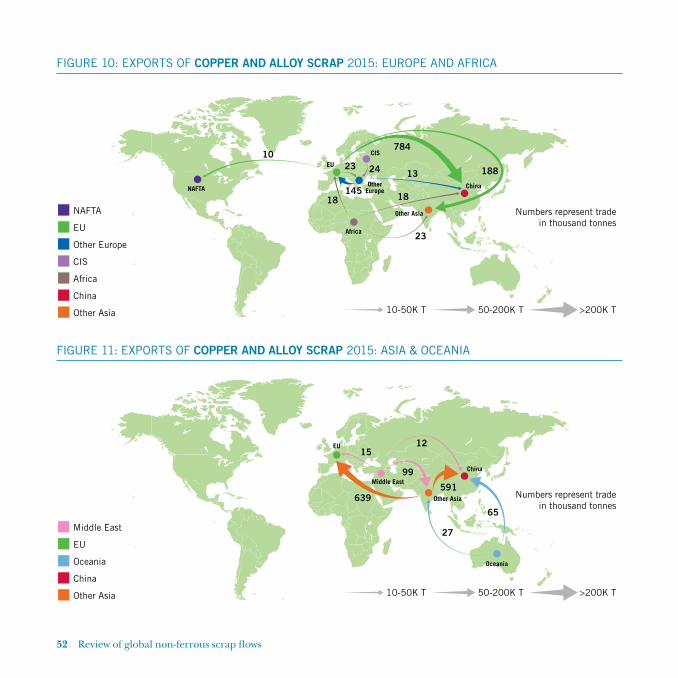
FIGURE 10: EXPORTS OF COPPER AND ALLOY SCRAP 2015: EUROPE AND AFRICA
FIGURE 11: EXPORTS OF COPPER AND ALLOY SCRAP 2015: ASIA & OCEANIA
10
18 18
132423
145
188
784
23
10-50K T
NAFTA
NAFTA
EU
EU
Other Europe
OtherEurope
CIS
Africa
China
Other Asia
CIS
Africa
China
Other Asia
50-200K T >200K T
Numbers represent trade in thousand tonnes
1512
99
639591
65
27
10-50K T
Middle East
EU
Oceania
China
Other Asia
Middle East
EU
Oceania
China
Other Asia
50-200K T >200K T
Numbers represent trade in thousand tonnes

Review of global non-ferrous scrap flows 53
FIGURE 12: EXPORTS OF COPPER AND ALLOY SCRAP 2015: NAFTA & OTHER AMERICA
FIGURE 13: EXPORTS OF ALUMINIUM AND ALLOY SCRAP 2015: EUROPE & AFRICA
807
124
127
91
28
18
10-50K T
NAFTA
EU
Other America
China
Other Asia
NAFTA
EU
Other America
ChinaOther Asia
50-200K T >200K T
Numbers represent trade in thousand tonnes
10
70
182521
93
451
330357
10-50K T
NAFTA
EU
Other Europe
Africa
China
Other Asia
NAFTA
EU Other Europe
Africa
China
Other Asia
50-200K T >200K T
Numbers represent trade in thousand tonnes

54 Review of global non-ferrous scrap flows
FIGURE 14: EXPORTS OF ALUMINIUM AND ALLOY SCRAP 2015: ASIA & OCEANIA
FIGURE 15: EXPORTS OF ALUMINIUM AN ALLOY SCRAP 2015: NAFTA & OTHER AMERICA
11
16664
96
178
12.6
10-50K T
Middle East
EU
Oceania
China
Other Asia
Middle East
EU
Oceania
China
Other Asia
50-200K T >200K T
Numbers represent trade in thousand tonnes
976
15
30
50
429
2577
10-50K T
NAFTA
EU
Other America
China
Other Asia
NAFTA EU
Other America
China
Other Asia
50-200K T >200K T
Numbers represent trade in thousand tonnes

CHAPTER 8
CONCLUSION
56 Review of global non-ferrous scrap flows
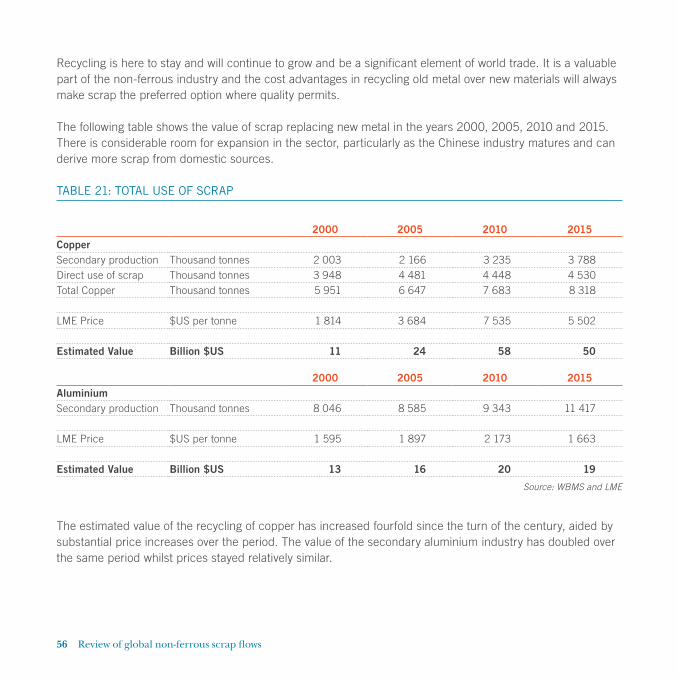
Recycling is here to stay and will continue to grow and be a significant element of world trade. It is a valuable part of the non-ferrous industry and the cost advantages in recycling old metal over new materials will always make scrap the preferred option where quality permits.
The following table shows the value of scrap replacing new metal in the years 2000, 2005, 2010 and 2015. There is considerable room for expansion in the sector, particularly as the Chinese industry matures and can derive more scrap from domestic sources.
TABLE 21: TOTAL USE OF SCRAP
2000 2005 2010 2015CopperSecondary production Thousand tonnes 2 003 2 166 3 235 3 788Direct use of scrap Thousand tonnes 3 948 4 481 4 448 4 530Total Copper Thousand tonnes 5 951 6 647 7 683 8 318
LME Price $US per tonne 1 814 3 684 7 535 5 502
Estimated Value Billion $US 11 24 58 50
2000 2005 2010 2015AluminiumSecondary production Thousand tonnes 8 046 8 585 9 343 11 417
LME Price $US per tonne 1 595 1 897 2 173 1 663
Estimated Value Billion $US 13 16 20 19
Source: WBMS and LME
The estimated value of the recycling of copper has increased fourfold since the turn of the century, aided by substantial price increases over the period. The value of the secondary aluminium industry has doubled over the same period whilst prices stayed relatively similar.

Review of global non-ferrous scrap flows 3
Bureau of International Recycling aisblAvenue Franklin Roosevelt 241050 BrusselsBelgium
T. +32 2 627 57 70F. +32 2 627 57 73
Des
ign
by
Non-Ferrous Metals Division
FSC logo here