Embed Size (px)
Citation preview
MARKET SNAPSHOT
January 2018
GLOBAL
Sheepmeat January 2018
MLA INDUSTRY INSIGHTS i
MARKET SNAPSHOT
ContentsAustralia 1
United States 5
Japan 9
Korea 13
China 17
South East Asia 21
European Union 25
MENA 30
© Meat & Livestock Australia, 2018. ABN 39 081 678 364. MLA makes no representations as to the accuracy of any information or advice contained in MLA’s Market snapshot and excludes all liability, whether in contract, tort (including negligence or breach of statutory duty) or otherwise as a result of reliance by any person on such information or advice. All use of MLA publications, reports and information is subject to MLA’s Market Report and Information Terms of Use. Please read our terms of use carefully and ensure you are familiar with its content.
MLA INDUSTRY INSIGHTS January 2018 ii
Sheepmeat
FOR FURTHER INFORMATION VISIT US ONLINE AT:www.mla.com.au or email us at: [email protected]
GLOBAL
FOR FURTHER INFORMATION VISIT US ONLINE AT:www.mla.com.au or email us at: [email protected]
© Meat & Livestock Australia, 2018. ABN 39 081 678 364. MLA makes no representations as to the accuracy of any information or advice contained in MLA’s Market snapshot and excludes all liability, whether in contract, tort (including negligence or breach of statutory duty) or otherwise as a result of reliance by any person on such information or advice. All use of MLA publications, reports and information is subject to MLA’s Market Report and Information Terms of Use. Please read our terms of use carefully and ensure you are familiar with its content.
MLA INDUSTRY INSIGHTS Australia January 2018 1
MARKET SNAPSHOT SHEEPMEAT
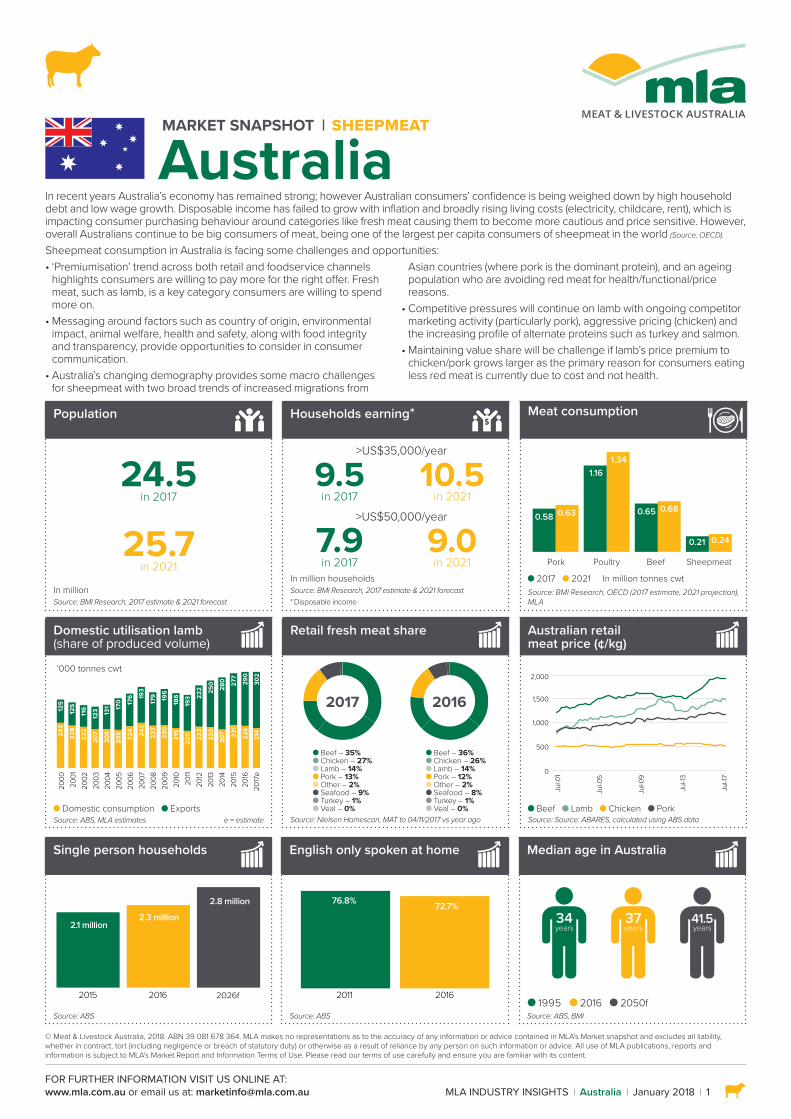
AustraliaIn recent years Australia’s economy has remained strong; however Australian consumers’ confidence is being weighed down by high household debt and low wage growth. Disposable income has failed to grow with inflation and broadly rising living costs (electricity, childcare, rent), which is impacting consumer purchasing behaviour around categories like fresh meat causing them to become more cautious and price sensitive. However, overall Australians continue to be big consumers of meat, being one of the largest per capita consumers of sheepmeat in the world (Source: OECD).
Sheepmeat consumption in Australia is facing some challenges and opportunities:• ‘Premiumisation’ trend across both retail and foodservice channels
highlights consumers are willing to pay more for the right offer. Fresh meat, such as lamb, is a key category consumers are willing to spend more on.
• Messaging around factors such as country of origin, environmental impact, animal welfare, health and safety, along with food integrity and transparency, provide opportunities to consider in consumer communication.
• Australia’s changing demography provides some macro challenges for sheepmeat with two broad trends of increased migrations from
Asian countries (where pork is the dominant protein), and an ageing population who are avoiding red meat for health/functional/price reasons.
• Competitive pressures will continue on lamb with ongoing competitor marketing activity (particularly pork), aggressive pricing (chicken) and the increasing profile of alternate proteins such as turkey and salmon.
• Maintaining value share will be challenge if lamb’s price premium to chicken/pork grows larger as the primary reason for consumers eating less red meat is currently due to cost and not health.
92.7kg per capita*2 total meat protein*3
Population
Households earning*
Meat consumption
24.5 in 2017
25.7 in 2021
>US$35,000/year
Pork Poultry Beef Sheepmeat
0.58
1.161.34
0.63 0.65 0.68
0.21 0.24
9.5 in 2017
10.5 in 2021
>US$50,000/year
7.9 in 2017
9.0 in 2021
In million Source: BMI Research, 2017 estimate & 2021 forecast
In million households Source: BMI Research, 2017 estimate & 2021 forecast* Disposable income
2017 2021 In million tonnes cwtSource: BMI Research, OECD (2017 estimate, 2021 projection), MLA
Domestic utilisation lamb (share of produced volume)
Retail fresh meat share
Australian retail meat price (¢/kg)
0.58 0.63
2000
2001
2002
2003
2004
2005
2006
2007
2008
2009
2010
2011
2012
2013
2014
2015
2016
2017
e
243
228
222
207
215
220
224 243
230
200 222
207 231
214
226
209
205 227
125
125
116
123
186
250
176 19
3
195
193 22
2 280 277
302
290
131 170 179
Domestic consumption Exports
2017 2016
0
500
1,000
1,500
2,000
Jul-0
1
Jul-0
5
Jul-0
9
Jul-1
3
Jul-1
7
Beef Lamb Chicken Pork
Beef – 35% Chicken – 27% Lamb – 14% Pork – 13% Other – 2% Seafood – 9% Turkey – 1% Veal – 0%
Beef – 36% Chicken – 26% Lamb – 14% Pork – 12% Other – 2% Seafood – 8% Turkey – 1% Veal – 0%
Source: ABS, MLA estimates e = estimate Source: Nielsen Homescan, MAT to 04/11/2017 vs year ago Source: Source: ABARES, calculated using ABS data
Single person households
English only spoken at home
Median age in Australia
2.1 million2.3 million
2.8 million
2015 2016 2026f
76.8% 72.7%
2011 2016
Source: ABS Source: ABS Source: ABS, BMI 1995 2016 2050f
‘000 tonnes cwt
34years
37years
41.5years
2 MLA INDUSTRY INSIGHTS Australia January 2018
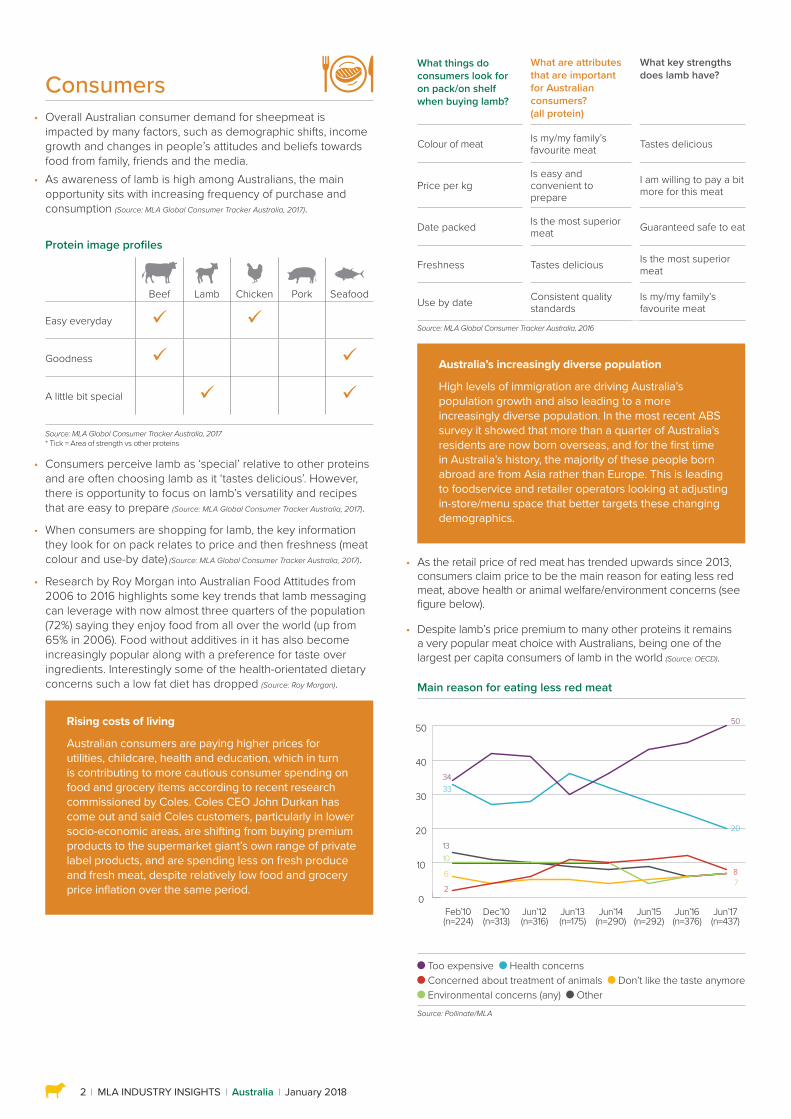
Consumers • Overall Australian consumer demand for sheepmeat is
impacted by many factors, such as demographic shifts, income growth and changes in people’s attitudes and beliefs towards food from family, friends and the media.
• As awareness of lamb is high among Australians, the main opportunity sits with increasing frequency of purchase and consumption (Source: MLA Global Consumer Tracker Australia, 2017).
Protein image profiles
Beef Lamb Chicken Pork Seafood
Easy everyday
Goodness
A little bit special
Source: MLA Global Consumer Tracker Australia, 2017* Tick = Area of strength vs other proteins
• Consumers perceive lamb as ‘special’ relative to other proteins and are often choosing lamb as it ‘tastes delicious’. However, there is opportunity to focus on lamb’s versatility and recipes that are easy to prepare (Source: MLA Global Consumer Tracker Australia, 2017).
• When consumers are shopping for lamb, the key information they look for on pack relates to price and then freshness (meat colour and use-by date) (Source: MLA Global Consumer Tracker Australia, 2017).
• Research by Roy Morgan into Australian Food Attitudes from 2006 to 2016 highlights some key trends that lamb messaging can leverage with now almost three quarters of the population (72%) saying they enjoy food from all over the world (up from 65% in 2006). Food without additives in it has also become increasingly popular along with a preference for taste over ingredients. Interestingly some of the health-orientated dietary concerns such a low fat diet has dropped (Source: Roy Morgan).
Rising costs of living
Australian consumers are paying higher prices for utilities, childcare, health and education, which in turn is contributing to more cautious consumer spending on food and grocery items according to recent research commissioned by Coles. Coles CEO John Durkan has come out and said Coles customers, particularly in lower socio-economic areas, are shifting from buying premium products to the supermarket giant’s own range of private label products, and are spending less on fresh produce and fresh meat, despite relatively low food and grocery price inflation over the same period.
What things do consumers look for on pack/on shelf when buying lamb?
What are attributes that are important for Australian consumers? (all protein)
What key strengths does lamb have?
Colour of meat Is my/my family’s favourite meat Tastes delicious
Price per kgIs easy and convenient to prepare
I am willing to pay a bit more for this meat
Date packed Is the most superior meat Guaranteed safe to eat
Freshness Tastes delicious Is the most superior meat
Use by date Consistent quality standards
Is my/my family’s favourite meat
Source: MLA Global Consumer Tracker Australia, 2016
Australia’s increasingly diverse population
High levels of immigration are driving Australia’s population growth and also leading to a more increasingly diverse population. In the most recent ABS survey it showed that more than a quarter of Australia’s residents are now born overseas, and for the first time in Australia’s history, the majority of these people born abroad are from Asia rather than Europe. This is leading to foodservice and retailer operators looking at adjusting in-store/menu space that better targets these changing demographics.
• As the retail price of red meat has trended upwards since 2013, consumers claim price to be the main reason for eating less red meat, above health or animal welfare/environment concerns (see figure below).
• Despite lamb’s price premium to many other proteins it remains a very popular meat choice with Australians, being one of the largest per capita consumers of lamb in the world (Source: OECD).
Main reason for eating less red meat
Too expensive Health concerns Concerned about treatment of animals Don’t like the taste anymore Environmental concerns (any) Other
Source: Pollinate/MLA
Feb’10(n=224)
Dec’10(n=313)
Jun’12(n=316)
Jun’13(n=175)
Jun’14(n=290)
Jun’15(n=292)
Jun’16(n=376)
Jun’17(n=437)
0
10
20
30
40
50
34
1310
6
2
50
20
7 8
33
MLA INDUSTRY INSIGHTS Australia January 2018 3
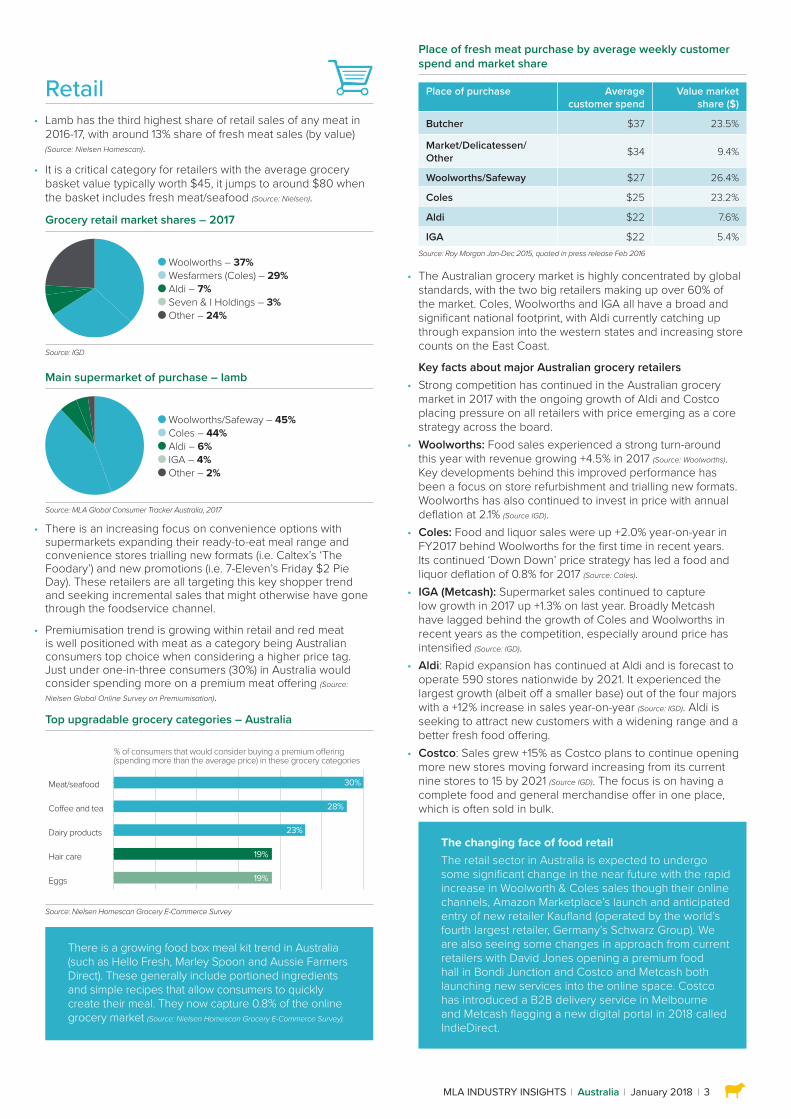
Retail • Lamb has the third highest share of retail sales of any meat in
2016-17, with around 13% share of fresh meat sales (by value) (Source: Nielsen Homescan).
• It is a critical category for retailers with the average grocery basket value typically worth $45, it jumps to around $80 when the basket includes fresh meat/seafood (Source: Nielsen).
Grocery retail market shares – 2017
Woolworths – 37% Wesfarmers (Coles) – 29% Aldi – 7% Seven & I Holdings – 3% Other – 24%
Source: IGD
Main supermarket of purchase – lamb
Woolworths/Safeway – 45% Coles – 44% Aldi – 6% IGA – 4% Other – 2%
Source: MLA Global Consumer Tracker Australia, 2017
• There is an increasing focus on convenience options with supermarkets expanding their ready-to-eat meal range and convenience stores trialling new formats (i.e. Caltex’s ‘The Foodary’) and new promotions (i.e. 7-Eleven’s Friday $2 Pie Day). These retailers are all targeting this key shopper trend and seeking incremental sales that might otherwise have gone through the foodservice channel.
• Premiumisation trend is growing within retail and red meat is well positioned with meat as a category being Australian consumers top choice when considering a higher price tag. Just under one-in-three consumers (30%) in Australia would consider spending more on a premium meat offering (Source:
Nielsen Global Online Survey on Premiumisation).
Top upgradable grocery categories – Australia
Source: Nielsen Homescan Grocery E-Commerce Survey
There is a growing food box meal kit trend in Australia (such as Hello Fresh, Marley Spoon and Aussie Farmers Direct). These generally include portioned ingredients and simple recipes that allow consumers to quickly create their meal. They now capture 0.8% of the online grocery market (Source: Nielsen Homescan Grocery E-Commerce Survey).
Meat/seafood
Co�ee and tea
Dairy products
Hair care
Eggs
54%30%
28%39%
23%
28%
19%
19%
30%
28%
23%
19%
19%
% of consumers that would consider buying a premium o�ering(spending more than the average price) in these grocery categories
Place of fresh meat purchase by average weekly customer spend and market share
Place of purchase Average customer spend
Value market share ($)
Butcher $37 23.5%
Market/Delicatessen/Other $34 9.4%
Woolworths/Safeway $27 26.4%
Coles $25 23.2%
Aldi $22 7.6%
IGA $22 5.4%Source: Roy Morgan Jan-Dec 2015, quoted in press release Feb 2016
• The Australian grocery market is highly concentrated by global standards, with the two big retailers making up over 60% of the market. Coles, Woolworths and IGA all have a broad and significant national footprint, with Aldi currently catching up through expansion into the western states and increasing store counts on the East Coast.
Key facts about major Australian grocery retailers• Strong competition has continued in the Australian grocery
market in 2017 with the ongoing growth of Aldi and Costco placing pressure on all retailers with price emerging as a core strategy across the board.
• Woolworths: Food sales experienced a strong turn-around this year with revenue growing +4.5% in 2017 (Source: Woolworths). Key developments behind this improved performance has been a focus on store refurbishment and trialling new formats. Woolworths has also continued to invest in price with annual deflation at 2.1% (Source IGD).
• Coles: Food and liquor sales were up +2.0% year-on-year in FY2017 behind Woolworths for the first time in recent years. Its continued ‘Down Down’ price strategy has led a food and liquor deflation of 0.8% for 2017 (Source: Coles).
• IGA (Metcash): Supermarket sales continued to capture low growth in 2017 up +1.3% on last year. Broadly Metcash have lagged behind the growth of Coles and Woolworths in recent years as the competition, especially around price has intensified (Source: IGD).
• Aldi: Rapid expansion has continued at Aldi and is forecast to operate 590 stores nationwide by 2021. It experienced the largest growth (albeit off a smaller base) out of the four majors with a +12% increase in sales year-on-year (Source: IGD). Aldi is seeking to attract new customers with a widening range and a better fresh food offering.
• Costco: Sales grew +15% as Costco plans to continue opening more new stores moving forward increasing from its current nine stores to 15 by 2021 (Source IGD). The focus is on having a complete food and general merchandise offer in one place, which is often sold in bulk.
The changing face of food retailThe retail sector in Australia is expected to undergo some significant change in the near future with the rapid increase in Woolworth & Coles sales though their online channels, Amazon Marketplace’s launch and anticipated entry of new retailer Kaufland (operated by the world’s fourth largest retailer, Germany’s Schwarz Group). We are also seeing some changes in approach from current retailers with David Jones opening a premium food hall in Bondi Junction and Costco and Metcash both launching new services into the online space. Costco has introduced a B2B delivery service in Melbourne and Metcash flagging a new digital portal in 2018 called IndieDirect.
© Meat & Livestock Australia, 2018. ABN 39 081 678 364. MLA makes no representations as to the accuracy of any information or advice contained in MLA’s Market snapshot and excludes all liability, whether in contract, tort (including negligence or breach of statutory duty) or otherwise as a result of reliance by any person on such information or advice. All use of MLA publications, reports and information is subject to MLA’s Market Report and Information Terms of Use. Please read our terms of use carefully and ensure you are familiar with its content.4
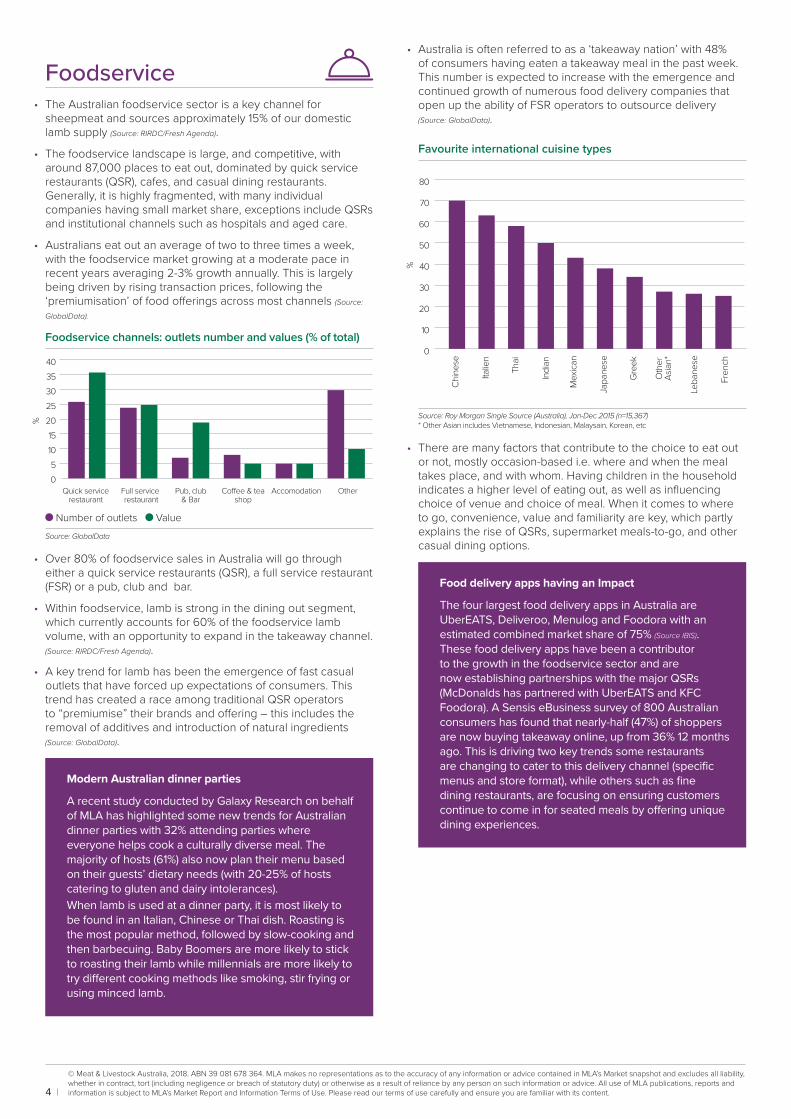
Foodservice • The Australian foodservice sector is a key channel for
sheepmeat and sources approximately 15% of our domestic lamb supply (Source: RIRDC/Fresh Agenda).
• The foodservice landscape is large, and competitive, with around 87,000 places to eat out, dominated by quick service restaurants (QSR), cafes, and casual dining restaurants. Generally, it is highly fragmented, with many individual companies having small market share, exceptions include QSRs and institutional channels such as hospitals and aged care.
• Australians eat out an average of two to three times a week, with the foodservice market growing at a moderate pace in recent years averaging 2-3% growth annually. This is largely being driven by rising transaction prices, following the ‘premiumisation’ of food offerings across most channels (Source:
GlobalData).
Foodservice channels: outlets number and values (% of total)
Number of outlets ValueSource: GlobalData
• Over 80% of foodservice sales in Australia will go through either a quick service restaurants (QSR), a full service restaurant (FSR) or a pub, club and bar.
• Within foodservice, lamb is strong in the dining out segment, which currently accounts for 60% of the foodservice lamb volume, with an opportunity to expand in the takeaway channel. (Source: RIRDC/Fresh Agenda).
• A key trend for lamb has been the emergence of fast casual outlets that have forced up expectations of consumers. This trend has created a race among traditional QSR operators to “premiumise” their brands and offering – this includes the removal of additives and introduction of natural ingredients (Source: GlobalData).
Modern Australian dinner parties
A recent study conducted by Galaxy Research on behalf of MLA has highlighted some new trends for Australian dinner parties with 32% attending parties where everyone helps cook a culturally diverse meal. The majority of hosts (61%) also now plan their menu based on their guests’ dietary needs (with 20-25% of hosts catering to gluten and dairy intolerances). When lamb is used at a dinner party, it is most likely to be found in an Italian, Chinese or Thai dish. Roasting is the most popular method, followed by slow-cooking and then barbecuing. Baby Boomers are more likely to stick to roasting their lamb while millennials are more likely to try different cooking methods like smoking, stir frying or using minced lamb.
%
05
1015
2025303540
Full service restaurant
AccomodationCo�ee & teashop
Quick service restaurant
Pub, club& Bar
Other
• Australia is often referred to as a ‘takeaway nation’ with 48% of consumers having eaten a takeaway meal in the past week. This number is expected to increase with the emergence and continued growth of numerous food delivery companies that open up the ability of FSR operators to outsource delivery (Source: GlobalData).
Favourite international cuisine types
Source: Roy Morgan Single Source (Australia), Jan-Dec 2015 (n=15,367)* Other Asian includes Vietnamese, Indonesian, Malaysain, Korean, etc
• There are many factors that contribute to the choice to eat out or not, mostly occasion-based i.e. where and when the meal takes place, and with whom. Having children in the household indicates a higher level of eating out, as well as influencing choice of venue and choice of meal. When it comes to where to go, convenience, value and familiarity are key, which partly explains the rise of QSRs, supermarket meals-to-go, and other casual dining options.
Food delivery apps having an Impact
The four largest food delivery apps in Australia are UberEATS, Deliveroo, Menulog and Foodora with an estimated combined market share of 75% (Source IBIS). These food delivery apps have been a contributor to the growth in the foodservice sector and are now establishing partnerships with the major QSRs (McDonalds has partnered with UberEATS and KFC Foodora). A Sensis eBusiness survey of 800 Australian consumers has found that nearly-half (47%) of shoppers are now buying takeaway online, up from 36% 12 months ago. This is driving two key trends some restaurants are changing to cater to this delivery channel (specific menus and store format), while others such as fine dining restaurants, are focusing on ensuring customers continue to come in for seated meals by offering unique dining experiences.
Chin
ese
Italie
n
Thai
Indi
an
Mex
ican
Japa
nese
Gre
ek
Leba
nese
Fren
ch
Oth
erAs
ian*
0
10
20
30
40
50
60
70
80
%
FOR FURTHER INFORMATION VISIT US ONLINE AT:www.mla.com.au or email us at: [email protected]
© Meat & Livestock Australia, 2018. ABN 39 081 678 364. MLA makes no representations as to the accuracy of any information or advice contained in MLA’s Market snapshot and excludes all liability, whether in contract, tort (including negligence or breach of statutory duty) or otherwise as a result of reliance by any person on such information or advice. All use of MLA publications, reports and information is subject to MLA’s Market Report and Information Terms of Use. Please read our terms of use carefully and ensure you are familiar with its content.
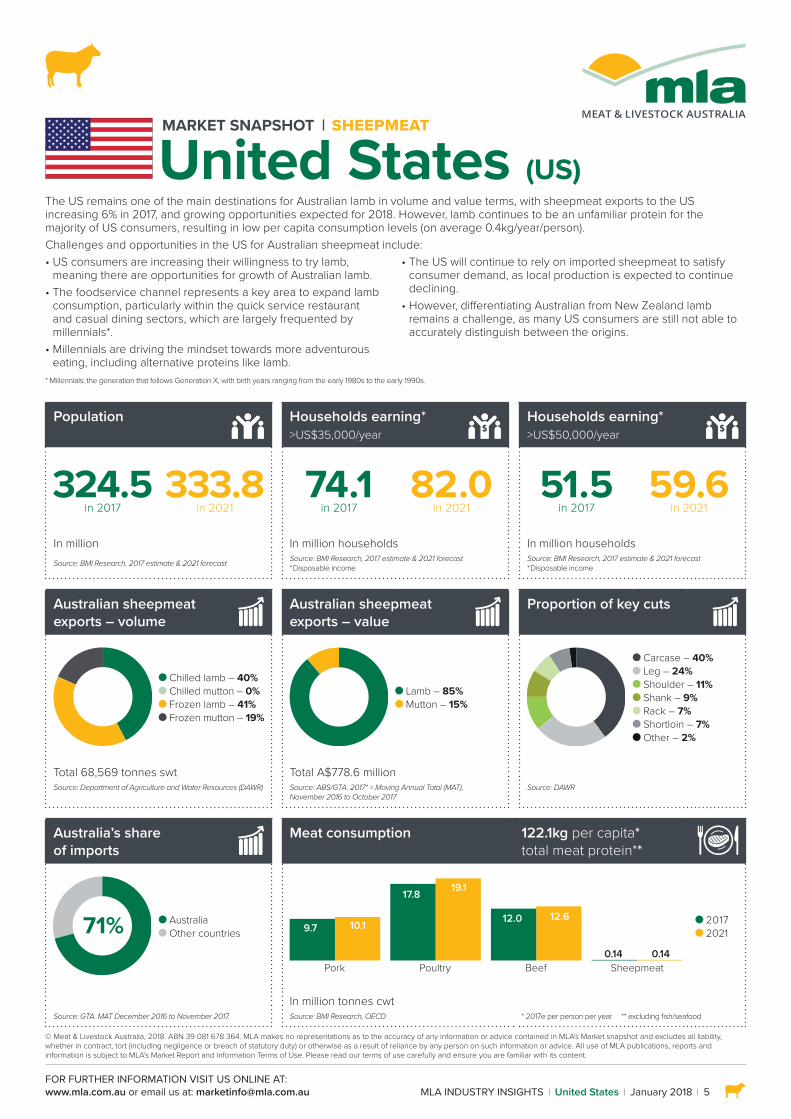
MLA INDUSTRY INSIGHTS United States January 2018 5
MARKET SNAPSHOT SHEEPMEAT
United States (US)
Population
Households earning* >US$35,000/year
Households earning* >US$50,000/year
324.5 in 2017
333.8 in 2021
74.1 in 2017
82.0 in 2021
51.5 in 2017
59.6 in 2021
In million In million households In million householdsSource: BMI Research, 2017 estimate & 2021 forecast Source: BMI Research, 2017 estimate & 2021 forecast
* Disposable incomeSource: BMI Research, 2017 estimate & 2021 forecast* Disposable income
Australian sheepmeat exports – volume
Australian sheepmeat exports – value
Proportion of key cuts
Chilled lamb – 40% Chilled mutton – 0% Frozen lamb – 41% Frozen mutton – 19%
Lamb – 85% Mutton – 15%
Carcase – 40% Leg – 24% Shoulder – 11% Shank – 9% Rack – 7% Shortloin – 7% Other – 2%
Total 68,569 tonnes swt Total A$778.6 millionSource: Department of Agriculture and Water Resources (DAWR) Source: ABS/GTA. 2017* = Moving Annual Total (MAT),
November 2016 to October 2017Source: DAWR
Australia’s share of imports
Meat consumption 122.1kg per capita* total meat protein**
71% Australia Other countries
Pork
9.7 10.1
17.8 19.1
12.0 12.6
0.14 0.14Poultry Beef Sheepmeat
2017 2021
Source: GTA. MAT December 2016 to November 2017.
In million tonnes cwtSource: BMI Research, OECD * 2017e per person per year ** excluding fish/seafood
The US remains one of the main destinations for Australian lamb in volume and value terms, with sheepmeat exports to the US increasing 6% in 2017, and growing opportunities expected for 2018. However, lamb continues to be an unfamiliar protein for the majority of US consumers, resulting in low per capita consumption levels (on average 0.4kg/year/person).Challenges and opportunities in the US for Australian sheepmeat include:• US consumers are increasing their willingness to try lamb,
meaning there are opportunities for growth of Australian lamb.• The foodservice channel represents a key area to expand lamb
consumption, particularly within the quick service restaurant and casual dining sectors, which are largely frequented by millennials*.
• Millennials are driving the mindset towards more adventurous eating, including alternative proteins like lamb.
• The US will continue to rely on imported sheepmeat to satisfy consumer demand, as local production is expected to continue declining.
• However, differentiating Australian from New Zealand lamb remains a challenge, as many US consumers are still not able to accurately distinguish between the origins.
* Millennials: the generation that follows Generation X, with birth years ranging from the early 1980s to the early 1990s.
6 MLA INDUSTRY INSIGHTS United States January 2018
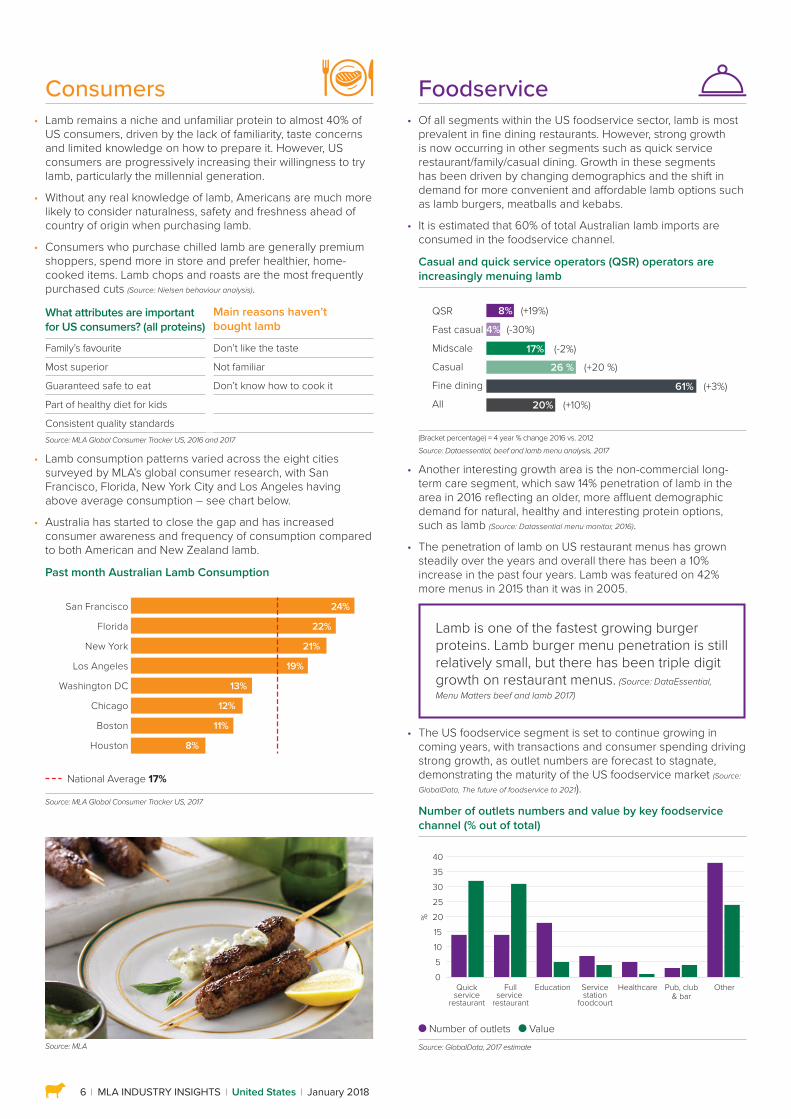
Consumers • Lamb remains a niche and unfamiliar protein to almost 40% of
US consumers, driven by the lack of familiarity, taste concerns and limited knowledge on how to prepare it. However, US consumers are progressively increasing their willingness to try lamb, particularly the millennial generation.
• Without any real knowledge of lamb, Americans are much more likely to consider naturalness, safety and freshness ahead of country of origin when purchasing lamb.
• Consumers who purchase chilled lamb are generally premium shoppers, spend more in store and prefer healthier, home-cooked items. Lamb chops and roasts are the most frequently purchased cuts (Source: Nielsen behaviour analysis).
What attributes are important for US consumers? (all proteins)
Main reasons haven’t bought lamb
Family’s favourite Don’t like the taste
Most superior Not familiar
Guaranteed safe to eat Don’t know how to cook it
Part of healthy diet for kids
Consistent quality standardsSource: MLA Global Consumer Tracker US, 2016 and 2017
• Lamb consumption patterns varied across the eight cities surveyed by MLA’s global consumer research, with San Francisco, Florida, New York City and Los Angeles having above average consumption – see chart below.
• Australia has started to close the gap and has increased consumer awareness and frequency of consumption compared to both American and New Zealand lamb.
Past month Australian Lamb Consumption
San Francisco
Florida
New York
Los Angeles
Washington DC
Chicago
Boston
Houston
24%
22%
21%
19%
13%
12%
11%
8%
National Average 17%
Source: MLA Global Consumer Tracker US, 2017
Source: MLA
Foodservice • Of all segments within the US foodservice sector, lamb is most
prevalent in fine dining restaurants. However, strong growth is now occurring in other segments such as quick service restaurant/family/casual dining. Growth in these segments has been driven by changing demographics and the shift in demand for more convenient and affordable lamb options such as lamb burgers, meatballs and kebabs.
• It is estimated that 60% of total Australian lamb imports are consumed in the foodservice channel.
Casual and quick service operators (QSR) operators are increasingly menuing lamb
QSR
Fast casual
Midscale
Casual
Fine dining
All
17%
4%
26 %
61%
8%
20%
(+19%)
(-2%)
(-30%)
(+20 %)
(+3%)
(+10%)
(Bracket percentage) = 4 year % change 2016 vs. 2012Source: Dataessential, beef and lamb menu analysis, 2017
• Another interesting growth area is the non-commercial long-term care segment, which saw 14% penetration of lamb in the area in 2016 reflecting an older, more affluent demographic demand for natural, healthy and interesting protein options, such as lamb (Source: Datassential menu monitor, 2016).
• The penetration of lamb on US restaurant menus has grown steadily over the years and overall there has been a 10% increase in the past four years. Lamb was featured on 42% more menus in 2015 than it was in 2005.
Lamb is one of the fastest growing burger proteins. Lamb burger menu penetration is still relatively small, but there has been triple digit growth on restaurant menus. (Source: DataEssential, Menu Matters beef and lamb 2017)
• The US foodservice segment is set to continue growing in coming years, with transactions and consumer spending driving strong growth, as outlet numbers are forecast to stagnate, demonstrating the maturity of the US foodservice market (Source:
GlobalData, The future of foodservice to 2021).
Number of outlets numbers and value by key foodservice channel (% out of total)
%
Quickservice
restaurant
Fullservice
restaurant
Education Servicestation
foodcourt
Healthcare Pub, club& bar
0510152025303540
Other
Number of outlets Value Source: GlobalData, 2017 estimate
MLA INDUSTRY INSIGHTS United States January 2018 7
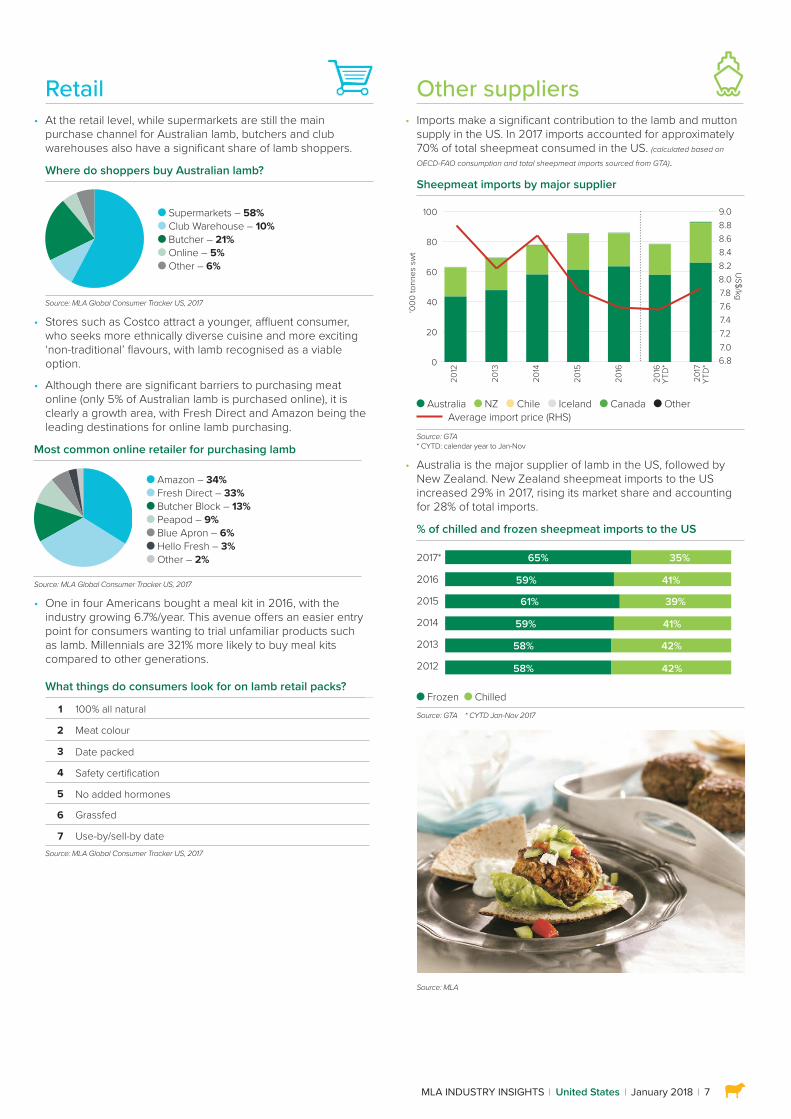
Other suppliers • Imports make a significant contribution to the lamb and mutton
supply in the US. In 2017 imports accounted for approximately 70% of total sheepmeat consumed in the US. (calculated based on
OECD-FAO consumption and total sheepmeat imports sourced from GTA).
Sheepmeat imports by major supplier
2012
2013
2014
2015
2016
2016
YTD
*
2017
YTD
*
‘000
tonn
es s
wt
0
20
40
60
80
100other
Canada
Iceland
Chile
NZ
Australia
6.87.07.27.47.67.88.08.28.48.68.89.0
US$/kg
Australia NZ Chile Iceland Canada Other Average import price (RHS)
Source: GTA * CYTD: calendar year to Jan-Nov
• Australia is the major supplier of lamb in the US, followed by New Zealand. New Zealand sheepmeat imports to the US increased 29% in 2017, rising its market share and accounting for 28% of total imports.
% of chilled and frozen sheepmeat imports to the US
2017*
2016
2015
2014
2013
2012
59%
61% 39%
59% 41%
58% 42%
41%
65% 35%
58% 42%
Frozen Chilled Source: GTA * CYTD Jan-Nov 2017
Source: MLA
Retail • At the retail level, while supermarkets are still the main
purchase channel for Australian lamb, butchers and club warehouses also have a significant share of lamb shoppers.
Where do shoppers buy Australian lamb?
Supermarkets – 58% Club Warehouse – 10% Butcher – 21% Online – 5% Other – 6%
Source: MLA Global Consumer Tracker US, 2017
• Stores such as Costco attract a younger, affluent consumer, who seeks more ethnically diverse cuisine and more exciting ‘non-traditional’ flavours, with lamb recognised as a viable option.
• Although there are significant barriers to purchasing meat online (only 5% of Australian lamb is purchased online), it is clearly a growth area, with Fresh Direct and Amazon being the leading destinations for online lamb purchasing.
Most common online retailer for purchasing lamb
Amazon – 34% Fresh Direct – 33% Butcher Block – 13% Peapod – 9% Blue Apron – 6% Hello Fresh – 3% Other – 2%
Source: MLA Global Consumer Tracker US, 2017
• One in four Americans bought a meal kit in 2016, with the industry growing 6.7%/year. This avenue offers an easier entry point for consumers wanting to trial unfamiliar products such as lamb. Millennials are 321% more likely to buy meal kits compared to other generations.
What things do consumers look for on lamb retail packs?
1 100% all natural
2 Meat colour
3 Date packed
4 Safety certification
5 No added hormones
6 Grassfed
7 Use-by/sell-by dateSource: MLA Global Consumer Tracker US, 2017
© Meat & Livestock Australia, 2018. ABN 39 081 678 364. MLA makes no representations as to the accuracy of any information or advice contained in MLA’s Market snapshot and excludes all liability, whether in contract, tort (including negligence or breach of statutory duty) or otherwise as a result of reliance by any person on such information or advice. All use of MLA publications, reports and information is subject to MLA’s Market Report and Information Terms of Use. Please read our terms of use carefully and ensure you are familiar with its content.8
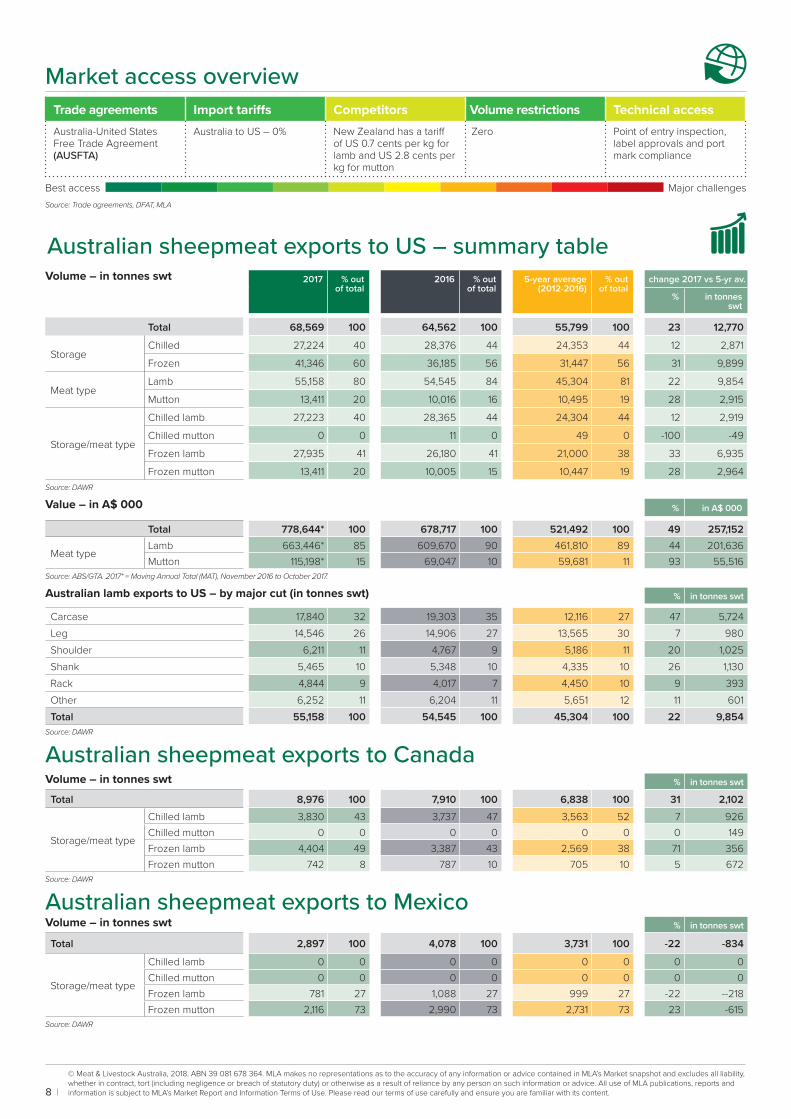
Market access overview Trade agreements Import tariffs Competitors Volume restrictions Technical accessAustralia-United States Free Trade Agreement (AUSFTA)
Australia to US – 0% New Zealand has a tariff of US 0.7 cents per kg for lamb and US 2.8 cents per kg for mutton
Zero Point of entry inspection, label approvals and port mark compliance
Best access Major challengesSource: Trade agreements, DFAT, MLA
Australian sheepmeat exports to US – summary table Volume – in tonnes swt
2017 % out of total
2016 % out of total
5-year average (2012-2016)
% out of total
change 2017 vs 5-yr av.
% in tonnes swt
Total 68,569 100 64,562 100 55,799 100 23 12,770
StorageChilled 27,224 40 28,376 44 24,353 44 12 2,871
Frozen 41,346 60 36,185 56 31,447 56 31 9,899
Meat typeLamb 55,158 80 54,545 84 45,304 81 22 9,854
Mutton 13,411 20 10,016 16 10,495 19 28 2,915
Storage/meat type
Chilled lamb 27,223 40 28,365 44 24,304 44 12 2,919
Chilled mutton 0 0 11 0 49 0 -100 -49
Frozen lamb 27,935 41 26,180 41 21,000 38 33 6,935
Frozen mutton 13,411 20 10,005 15 10,447 19 28 2,964Source: DAWR
Value – in A$ 000 % in A$ 000
Total 778,644* 100 678,717 100 521,492 100 49 257,152
Meat typeLamb 663,446* 85 609,670 90 461,810 89 44 201,636Mutton 115,198* 15 69,047 10 59,681 11 93 55,516
Source: ABS/GTA. 2017* = Moving Annual Total (MAT), November 2016 to October 2017.
Australian lamb exports to US – by major cut (in tonnes swt) % in tonnes swt
Carcase 17,840 32 19,303 35 12,116 27 47 5,724Leg 14,546 26 14,906 27 13,565 30 7 980Shoulder 6,211 11 4,767 9 5,186 11 20 1,025Shank 5,465 10 5,348 10 4,335 10 26 1,130Rack 4,844 9 4,017 7 4,450 10 9 393Other 6,252 11 6,204 11 5,651 12 11 601Total 55,158 100 54,545 100 45,304 100 22 9,854
Source: DAWR
Australian sheepmeat exports to CanadaVolume – in tonnes swt % in tonnes swt
Total 8,976 100 7,910 100 6,838 100 31 2,102
Storage/meat type
Chilled lamb 3,830 43 3,737 47 3,563 52 7 926Chilled mutton 0 0 0 0 0 0 0 149Frozen lamb 4,404 49 3,387 43 2,569 38 71 356Frozen mutton 742 8 787 10 705 10 5 672
Source: DAWR
Australian sheepmeat exports to MexicoVolume – in tonnes swt % in tonnes swt
Total 2,897 100 4,078 100 3,731 100 -22 -834
Storage/meat type
Chilled lamb 0 0 0 0 0 0 0 0Chilled mutton 0 0 0 0 0 0 0 0Frozen lamb 781 27 1,088 27 999 27 -22 --218Frozen mutton 2,116 73 2,990 73 2,731 73 23 -615
Source: DAWR
FOR FURTHER INFORMATION VISIT US ONLINE AT:www.mla.com.au or email us at: [email protected]
© Meat & Livestock Australia, 2018. ABN 39 081 678 364. MLA makes no representations as to the accuracy of any information or advice contained in MLA’s Market snapshot and excludes all liability, whether in contract, tort (including negligence or breach of statutory duty) or otherwise as a result of reliance by any person on such information or advice. All use of MLA publications, reports and information is subject to MLA’s Market Report and Information Terms of Use. Please read our terms of use carefully and ensure you are familiar with its content.
MLA INDUSTRY INSIGHTS Japan January 2018 9
MARKET SNAPSHOT SHEEPMEAT
Japan
Population
Households earning* >US$35,000/year
Households earning* >US$50,000/year
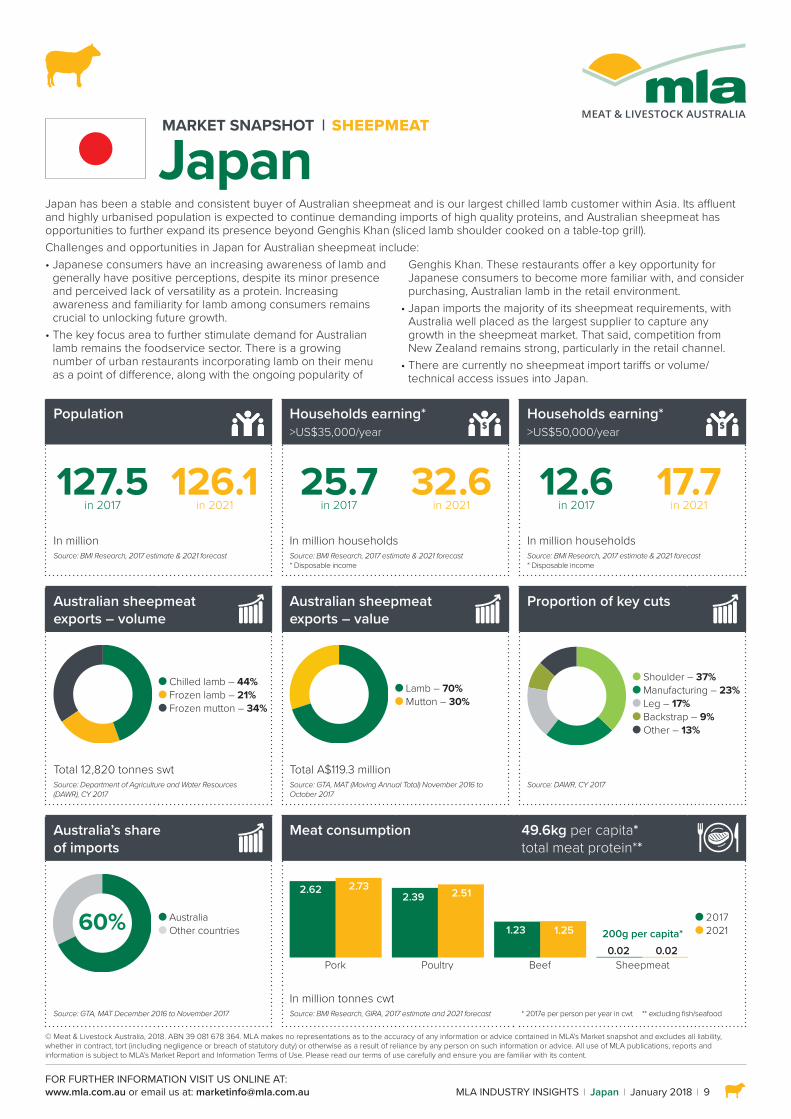
127.5 in 2017
126.1 in 2021
25.7 in 2017
32.6 in 2021
12.6 in 2017
17.7 in 2021
In million In million households In million householdsSource: BMI Research, 2017 estimate & 2021 forecast Source: BMI Research, 2017 estimate & 2021 forecast
* Disposable incomeSource: BMI Research, 2017 estimate & 2021 forecast * Disposable income
Australian sheepmeat exports – volume
Australian sheepmeat exports – value
Proportion of key cuts
Chilled lamb – 44% Frozen lamb – 21% Frozen mutton – 34%
Lamb – 70% Mutton – 30%
Shoulder – 37% Manufacturing – 23% Leg – 17% Backstrap – 9% Other – 13%
Total 12,820 tonnes swt Total A$119.3 millionSource: Department of Agriculture and Water Resources (DAWR), CY 2017
Source: GTA, MAT (Moving Annual Total) November 2016 to October 2017
Source: DAWR, CY 2017
Australia’s share of imports
Meat consumption
49.6kg per capita*total meat protein**
60% Australia Other countries
Pork
2.62 2.732.39 2.51
1.23 1.25
0.02 0.02Poultry Beef Sheepmeat
200g per capita* 2017 2021
In million tonnes cwtSource: GTA, MAT December 2016 to November 2017 Source: BMI Research, GIRA, 2017 estimate and 2021 forecast * 2017e per person per year in cwt ** excluding fish/seafood
Japan has been a stable and consistent buyer of Australian sheepmeat and is our largest chilled lamb customer within Asia. Its affluent and highly urbanised population is expected to continue demanding imports of high quality proteins, and Australian sheepmeat has opportunities to further expand its presence beyond Genghis Khan (sliced lamb shoulder cooked on a table-top grill).Challenges and opportunities in Japan for Australian sheepmeat include:• Japanese consumers have an increasing awareness of lamb and
generally have positive perceptions, despite its minor presence and perceived lack of versatility as a protein. Increasing awareness and familiarity for lamb among consumers remains crucial to unlocking future growth.
• The key focus area to further stimulate demand for Australian lamb remains the foodservice sector. There is a growing number of urban restaurants incorporating lamb on their menu as a point of difference, along with the ongoing popularity of
Genghis Khan. These restaurants offer a key opportunity for Japanese consumers to become more familiar with, and consider purchasing, Australian lamb in the retail environment.
• Japan imports the majority of its sheepmeat requirements, with Australia well placed as the largest supplier to capture any growth in the sheepmeat market. That said, competition from New Zealand remains strong, particularly in the retail channel.
• There are currently no sheepmeat import tariffs or volume/technical access issues into Japan.
10 MLA INDUSTRY INSIGHTS Japan January 2018
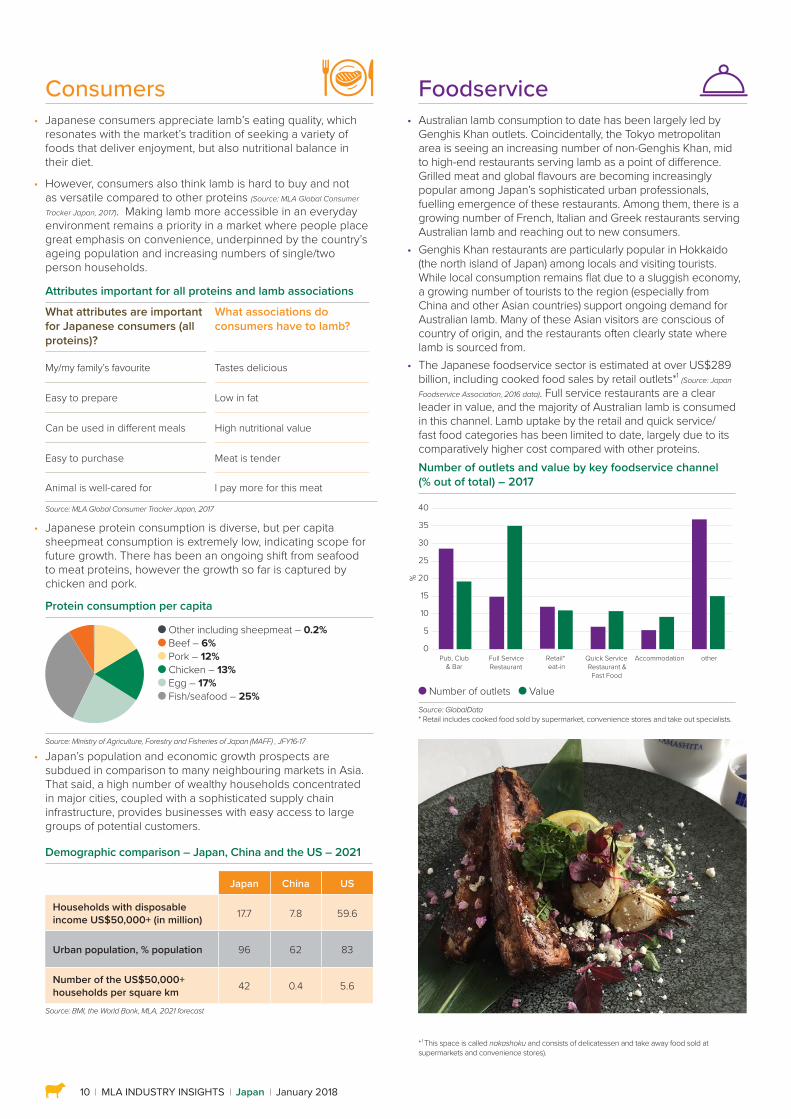
Consumers • Japanese consumers appreciate lamb’s eating quality, which
resonates with the market’s tradition of seeking a variety of foods that deliver enjoyment, but also nutritional balance in their diet.
• However, consumers also think lamb is hard to buy and not as versatile compared to other proteins (Source: MLA Global Consumer
Tracker Japan, 2017). Making lamb more accessible in an everyday environment remains a priority in a market where people place great emphasis on convenience, underpinned by the country’s ageing population and increasing numbers of single/two person households.
Attributes important for all proteins and lamb associations
What attributes are important for Japanese consumers (all proteins)?
What associations do consumers have to lamb?
My/my family’s favourite Tastes delicious
Easy to prepare Low in fat
Can be used in different meals High nutritional value
Easy to purchase Meat is tender
Animal is well-cared for I pay more for this meat
Source: MLA Global Consumer Tracker Japan, 2017
• Japanese protein consumption is diverse, but per capita sheepmeat consumption is extremely low, indicating scope for future growth. There has been an ongoing shift from seafood to meat proteins, however the growth so far is captured by chicken and pork.
Protein consumption per capita
Other including sheepmeat – 0.2% Beef – 6% Pork – 12% Chicken – 13% Egg – 17% Fish/seafood – 25%
Source: Ministry of Agriculture, Forestry and Fisheries of Japan (MAFF) , JFY16-17
• Japan’s population and economic growth prospects are subdued in comparison to many neighbouring markets in Asia. That said, a high number of wealthy households concentrated in major cities, coupled with a sophisticated supply chain infrastructure, provides businesses with easy access to large groups of potential customers.
Demographic comparison – Japan, China and the US – 2021
Category Japan China US
Households with disposable income US$50,000+ (in million) 17.7 7.8 59.6
Urban population, % population 96 62 83
Number of the US$50,000+ households per square km 42 0.4 5.6
Source: BMI, the World Bank, MLA, 2021 forecast
Foodservice • Australian lamb consumption to date has been largely led by
Genghis Khan outlets. Coincidentally, the Tokyo metropolitan area is seeing an increasing number of non-Genghis Khan, mid to high-end restaurants serving lamb as a point of difference. Grilled meat and global flavours are becoming increasingly popular among Japan’s sophisticated urban professionals, fuelling emergence of these restaurants. Among them, there is a growing number of French, Italian and Greek restaurants serving Australian lamb and reaching out to new consumers.
• Genghis Khan restaurants are particularly popular in Hokkaido (the north island of Japan) among locals and visiting tourists. While local consumption remains flat due to a sluggish economy, a growing number of tourists to the region (especially from China and other Asian countries) support ongoing demand for Australian lamb. Many of these Asian visitors are conscious of country of origin, and the restaurants often clearly state where lamb is sourced from.
• The Japanese foodservice sector is estimated at over US$289 billion, including cooked food sales by retail outlets*1 (Source: Japan
Foodservice Association, 2016 data). Full service restaurants are a clear leader in value, and the majority of Australian lamb is consumed in this channel. Lamb uptake by the retail and quick service/fast food categories has been limited to date, largely due to its comparatively higher cost compared with other proteins.Number of outlets and value by key foodservice channel (% out of total) – 2017
5
15
25
35
0
10
20
30
40
Full ServiceRestaurant
Pub, Club& Bar
Quick ServiceRestaurant &
Fast Food
AccommodationRetail*eat-in
other
%
Number of outlets ValueSource: GlobalData * Retail includes cooked food sold by supermarket, convenience stores and take out specialists.
* 1 This space is called nakashoku and consists of delicatessen and take away food sold at supermarkets and convenience stores).
MLA INDUSTRY INSIGHTS Japan January 2018 11
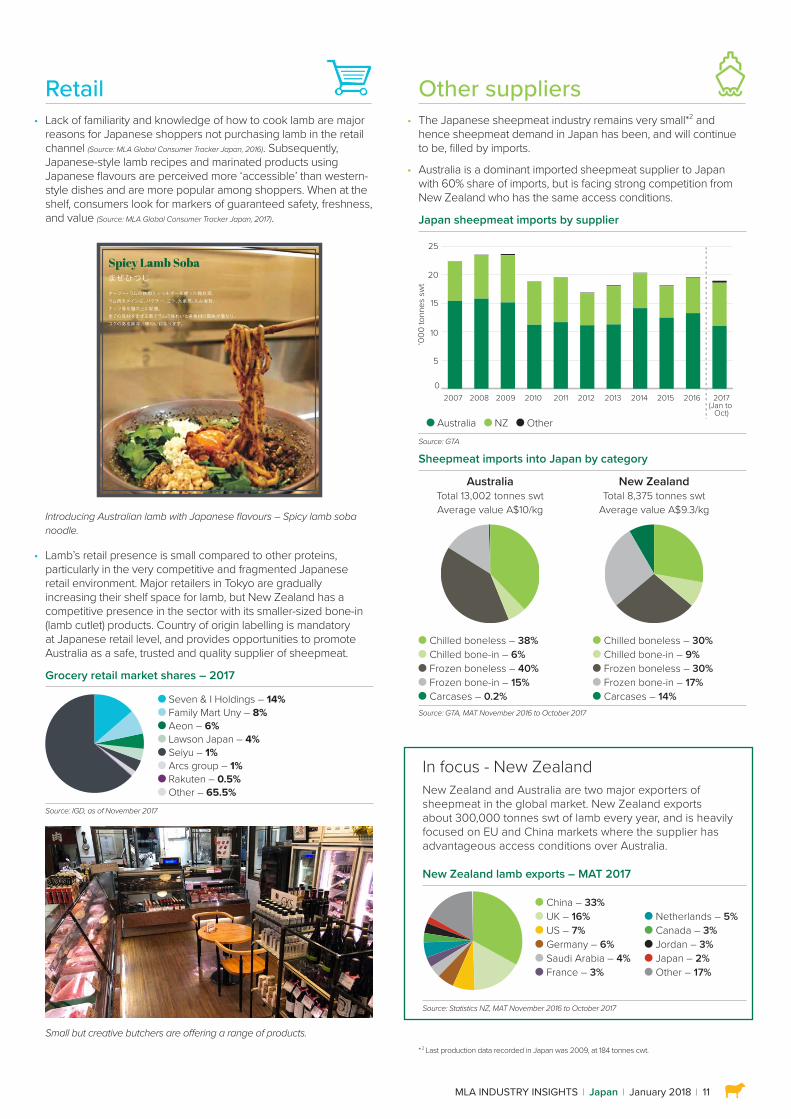
Retail • Lack of familiarity and knowledge of how to cook lamb are major
reasons for Japanese shoppers not purchasing lamb in the retail channel (Source: MLA Global Consumer Tracker Japan, 2016). Subsequently, Japanese-style lamb recipes and marinated products using Japanese flavours are perceived more ‘accessible’ than western-style dishes and are more popular among shoppers. When at the shelf, consumers look for markers of guaranteed safety, freshness, and value (Source: MLA Global Consumer Tracker Japan, 2017).
Introducing Australian lamb with Japanese flavours – Spicy lamb soba noodle.
• Lamb’s retail presence is small compared to other proteins, particularly in the very competitive and fragmented Japanese retail environment. Major retailers in Tokyo are gradually increasing their shelf space for lamb, but New Zealand has a competitive presence in the sector with its smaller-sized bone-in (lamb cutlet) products. Country of origin labelling is mandatory at Japanese retail level, and provides opportunities to promote Australia as a safe, trusted and quality supplier of sheepmeat.
Grocery retail market shares – 2017
Seven & I Holdings – 14% Family Mart Uny – 8% Aeon – 6% Lawson Japan – 4% Seiyu – 1% Arcs group – 1% Rakuten – 0.5% Other – 65.5%
Source: IGD, as of November 2017
Small but creative butchers are offering a range of products.
Other suppliers • The Japanese sheepmeat industry remains very small*2 and
hence sheepmeat demand in Japan has been, and will continue to be, filled by imports.
• Australia is a dominant imported sheepmeat supplier to Japan with 60% share of imports, but is facing strong competition from New Zealand who has the same access conditions.
Japan sheepmeat imports by supplier
0
5
10
15
20
25other
New Zealand
Australia
2017(Jan to
Oct)
2016 2015 2014 2013 2012 2011 2010 2009 2008 2007
‘000
tonn
es s
wt
Australia NZ OtherSource: GTA
Sheepmeat imports into Japan by category
Australia Total 13,002 tonnes swt Average value A$10/kg
New Zealand Total 8,375 tonnes swt
Average value A$9.3/kg
Chilled boneless – 38% Chilled bone-in – 6% Frozen boneless – 40% Frozen bone-in – 15% Carcases – 0.2%
Chilled boneless – 30% Chilled bone-in – 9% Frozen boneless – 30% Frozen bone-in – 17% Carcases – 14%
Source: GTA, MAT November 2016 to October 2017
* 2 Last production data recorded in Japan was 2009, at 184 tonnes cwt.
In focus - New ZealandNew Zealand and Australia are two major exporters of sheepmeat in the global market. New Zealand exports about 300,000 tonnes swt of lamb every year, and is heavily focused on EU and China markets where the supplier has advantageous access conditions over Australia.
New Zealand lamb exports – MAT 2017other
Japan
Jordan
Canada
Netherlands
France
Saudi Arabia
Germany
US
UK
China
China – 33% UK – 16% US – 7% Germany – 6% Saudi Arabia – 4% France – 3%
Netherlands – 5% Canada – 3% Jordan – 3% Japan – 2% Other – 17%
Source: Statistics NZ, MAT November 2016 to October 2017
© Meat & Livestock Australia, 2018. ABN 39 081 678 364. MLA makes no representations as to the accuracy of any information or advice contained in MLA’s Market snapshot and excludes all liability, whether in contract, tort (including negligence or breach of statutory duty) or otherwise as a result of reliance by any person on such information or advice. All use of MLA publications, reports and information is subject to MLA’s Market Report and Information Terms of Use. Please read our terms of use carefully and ensure you are familiar with its content.12
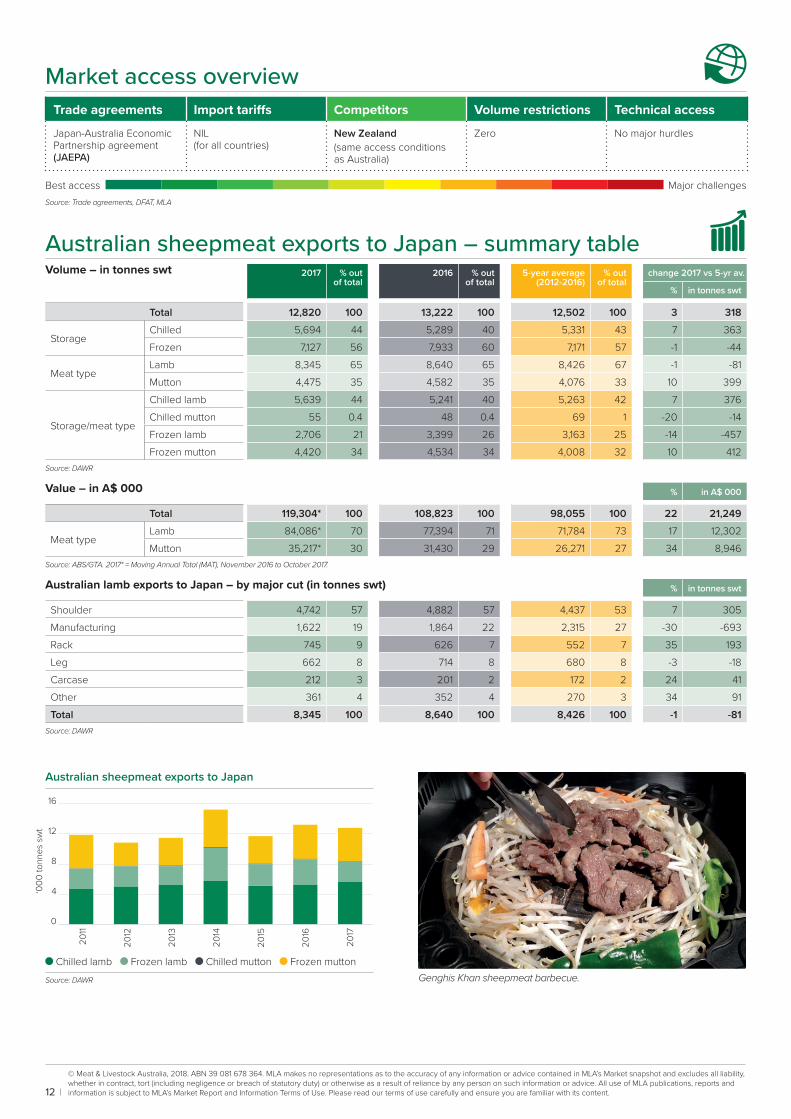
Market access overview Trade agreements Import tariffs Competitors Volume restrictions Technical access
Japan-Australia Economic Partnership agreement (JAEPA)
NIL(for all countries)
New Zealand(same access conditions as Australia)
Zero No major hurdles
Best access Major challengesSource: Trade agreements, DFAT, MLA
Australian sheepmeat exports to Japan – summary table Volume – in tonnes swt 2017 % out
of total2016 % out
of total5-year average
(2012-2016)% out
of totalchange 2017 vs 5-yr av.
% in tonnes swt
Total 12,820 100 13,222 100 12,502 100 3 318
StorageChilled 5,694 44 5,289 40 5,331 43 7 363 Frozen 7,127 56 7,933 60 7,171 57 -1 -44
Meat typeLamb 8,345 65 8,640 65 8,426 67 -1 -81 Mutton 4,475 35 4,582 35 4,076 33 10 399
Storage/meat type
Chilled lamb 5,639 44 5,241 40 5,263 42 7 376 Chilled mutton 55 0.4 48 0.4 69 1 -20 -14 Frozen lamb 2,706 21 3,399 26 3,163 25 -14 -457 Frozen mutton 4,420 34 4,534 34 4,008 32 10 412
Source: DAWR
Value – in A$ 000 % in A$ 000
Total 119,304* 100 108,823 100 98,055 100 22 21,249
Meat typeLamb 84,086* 70 77,394 71 71,784 73 17 12,302 Mutton 35,217* 30 31,430 29 26,271 27 34 8,946
Source: ABS/GTA. 2017* = Moving Annual Total (MAT), November 2016 to October 2017.
Australian lamb exports to Japan – by major cut (in tonnes swt) % in tonnes swt
Shoulder 4,742 57 4,882 57 4,437 53 7 305 Manufacturing 1,622 19 1,864 22 2,315 27 -30 -693 Rack 745 9 626 7 552 7 35 193 Leg 662 8 714 8 680 8 -3 -18 Carcase 212 3 201 2 172 2 24 41 Other 361 4 352 4 270 3 34 91 Total 8,345 100 8,640 100 8,426 100 -1 -81
Source: DAWR
Australian sheepmeat exports to Japan
2011
2012
2013
2014
2015
2016
2017
‘000
tonn
es s
wt
0
4
8
12
16frozen mutton
chilled mutton
frozen lamb
chilled lamb
Chilled lamb Frozen lamb Chilled mutton Frozen muttonSource: DAWR Genghis Khan sheepmeat barbecue.
FOR FURTHER INFORMATION VISIT US ONLINE AT:www.mla.com.au or email us at: [email protected]
© Meat & Livestock Australia, 2018. ABN 39 081 678 364. MLA makes no representations as to the accuracy of any information or advice contained in MLA’s Market snapshot and excludes all liability, whether in contract, tort (including negligence or breach of statutory duty) or otherwise as a result of reliance by any person on such information or advice. All use of MLA publications, reports and information is subject to MLA’s Market Report and Information Terms of Use. Please read our terms of use carefully and ensure you are familiar with its content.
MLA INDUSTRY INSIGHTS Korea January 2018 13
MARKET SNAPSHOT SHEEPMEAT
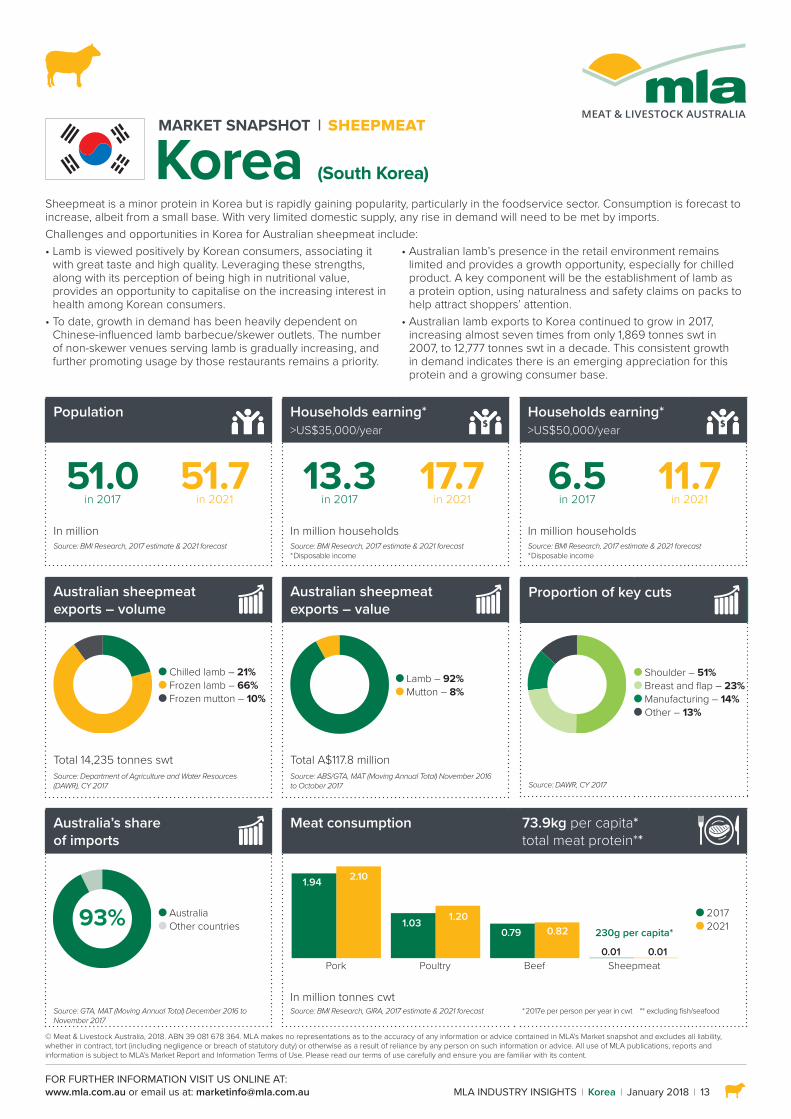
Korea (South Korea)Sheepmeat is a minor protein in Korea but is rapidly gaining popularity, particularly in the foodservice sector. Consumption is forecast to increase, albeit from a small base. With very limited domestic supply, any rise in demand will need to be met by imports.Challenges and opportunities in Korea for Australian sheepmeat include:• Lamb is viewed positively by Korean consumers, associating it
with great taste and high quality. Leveraging these strengths, along with its perception of being high in nutritional value, provides an opportunity to capitalise on the increasing interest in health among Korean consumers.
• To date, growth in demand has been heavily dependent on Chinese-influenced lamb barbecue/skewer outlets. The number of non-skewer venues serving lamb is gradually increasing, and further promoting usage by those restaurants remains a priority.
• Australian lamb’s presence in the retail environment remains limited and provides a growth opportunity, especially for chilled product. A key component will be the establishment of lamb as a protein option, using naturalness and safety claims on packs to help attract shoppers’ attention.
• Australian lamb exports to Korea continued to grow in 2017, increasing almost seven times from only 1,869 tonnes swt in 2007, to 12,777 tonnes swt in a decade. This consistent growth in demand indicates there is an emerging appreciation for this protein and a growing consumer base.
Population
Households earning* >US$35,000/year
Households earning* >US$50,000/year
51.0 in 2017
51.7 in 2021
13.3 in 2017
17.7 in 2021
6.5 in 2017
11.7 in 2021
In million In million households In million householdsSource: BMI Research, 2017 estimate & 2021 forecast Source: BMI Research, 2017 estimate & 2021 forecast
* Disposable incomeSource: BMI Research, 2017 estimate & 2021 forecast * Disposable income
Australian sheepmeat exports – volume
Australian sheepmeat exports – value
Proportion of key cuts
Shoulder – 51% Breast and flap – 23% Manufacturing – 14% Other – 13%
Source: DAWR, CY 2017
Chilled lamb – 21% Frozen lamb – 66% Frozen mutton – 10%
Lamb – 92% Mutton – 8%
Total 14,235 tonnes swt Total A$117.8 millionSource: Department of Agriculture and Water Resources (DAWR), CY 2017
Source: ABS/GTA, MAT (Moving Annual Total) November 2016 to October 2017
Australia’s share of imports
Meat consumption 73.9kg per capita* total meat protein**
93% Australia Other countries
Pork
1.94 2.10
1.03 1.200.79 0.82
0.01 0.01Poultry Beef Sheepmeat
230g per capita*
2017 2021
In million tonnes cwtSource: GTA, MAT (Moving Annual Total) December 2016 to November 2017
Source: BMI Research, GIRA, 2017 estimate & 2021 forecast * 2017e per person per year in cwt ** excluding fish/seafood
14 MLA INDUSTRY INSIGHTS Korea January 2018
Consumers • Lamb is not a frequently consumed protein in Korea, and lacks the
‘easy everyday’ attributes that more common proteins (such as pork) are known for. Rather, consumers associate lamb with taste, nutritional benefits and quality.
Attributes important for all proteins and lamb associations
What attributes are important for Korean consumers (all proteins)?
What associations do consumers have to lamb?
Easy to prepare High nutritional value
Consistent quality Tastes delicious
Guaranteed safety I pay more for this meat
Environmentally sustainable Low in fat
Healthy diet for childern Animal is well-cared for
Source: MLA Global Consumer Tracker Korea, 2017
• Since taste is not a barrier to purchasing lamb in Korea, marketing and promotion can focus on lamb’s goodness. Considering Koreans are the largest per capita consumers of meat in Asia*5, inspiring consumers’ curiosity to try lamb and improving availability will create growth opportunities.
Top three reasons – “I don’t buy lamb because…”
Global average Korea
Not familiar with lamb
Don’t like the taste
Don’t know how to cook it
Not available where I shop Source: Global Consumer Tracker Korea, 2017
• Korea is the third largest economy in Asia, with the number of households earning more than US$50,000/year forecast to reach 54% of total households by 2021 (Source: BMI Research). This, along with an ageing population and declining birth rate, will likely further elevate consumer interest in products and services that promote a healthy lifestyle, and offer a key opportunity for Australian sheepmeat.
Who will be typical Korean consumers in 2021?
Average size of household is 2.4 persons
Spend 29% more on hotels and restaurants*
Spend 20% more onmeat and poultry products*
39% of population is aged between
40-64 year-old
83% live inurban cities
Median age = 44-year-old
Source: BMI, based on various 2021 forecast data. * comparison between 2016 and 2021 forecast data
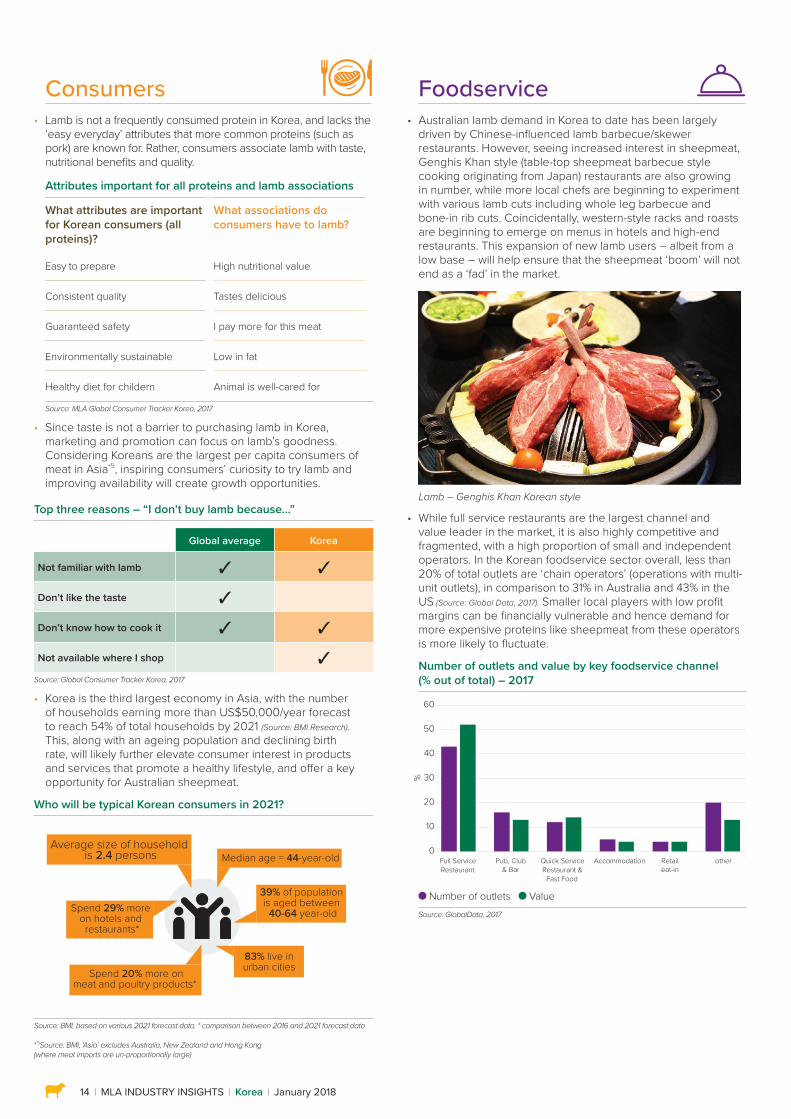
Foodservice • Australian lamb demand in Korea to date has been largely
driven by Chinese-influenced lamb barbecue/skewer restaurants. However, seeing increased interest in sheepmeat, Genghis Khan style (table-top sheepmeat barbecue style cooking originating from Japan) restaurants are also growing in number, while more local chefs are beginning to experiment with various lamb cuts including whole leg barbecue and bone-in rib cuts. Coincidentally, western-style racks and roasts are beginning to emerge on menus in hotels and high-end restaurants. This expansion of new lamb users – albeit from a low base – will help ensure that the sheepmeat ‘boom’ will not end as a ‘fad’ in the market.
Lamb – Genghis Khan Korean style
• While full service restaurants are the largest channel and value leader in the market, it is also highly competitive and fragmented, with a high proportion of small and independent operators. In the Korean foodservice sector overall, less than 20% of total outlets are ‘chain operators’ (operations with multi-unit outlets), in comparison to 31% in Australia and 43% in the US (Source: Global Data, 2017). Smaller local players with low profit margins can be financially vulnerable and hence demand for more expensive proteins like sheepmeat from these operators is more likely to fluctuate.
Number of outlets and value by key foodservice channel (% out of total) – 2017
0
10
20
30
40
50
60
Full ServiceRestaurant
Pub, Club& Bar
Quick ServiceRestaurant &
Fast Food
Accommodation Retaileat-in
other
%
Number of outlets ValueSource: GlobalData, 2017
* 5 Source: BMI, ‘Asia’ excludes Australia, New Zealand and Hong Kong (where meat imports are un-proportionally large)
MLA INDUSTRY INSIGHTS Korea January 2018 15
Retail • Lamb is not commonly available across major supermarkets in
Korea, with consumers not yet readily thinking of lamb as an everyday protein option. When it is purchased, it is often either an impulse buy or for a specific meal (Source: MLA Global Consumer Tracker Korea, 2017).
• That said, lamb is regarded as delicious and for having strengths in animal welfare and sustainability. In comparison to the global average, more Korean shoppers look for ‘markers of naturalness’ on a lamb pack – such as claims of sustainability or ‘free-from’ (antibiotics or GMO) – and safety credentials. These claims need to stand out on packs or shelves to help drive more purchases in retail (Source: MLA Global Consumer Tracker Korea, 2017).
• Consumer interest in lamb is reportedly increasing, particularly after having enjoyed the protein at a restaurant. On the other hand, many outlets are focused on fast selling, low priced protein products, on the back of the fragmented and highly competitive retail environment, which works against the comparatively expensive lamb.
Grocery retail market shares – 2017
Shinsegae Group – 11% Homeplus – 7% Lotte South Korea – 7% GS Retail – 6% BGF Retail Co Ltd – 4% 7-Eleven South Korea – 3% Ministop Korea Co Ltd – 1% Other – 61%
Source: IGD
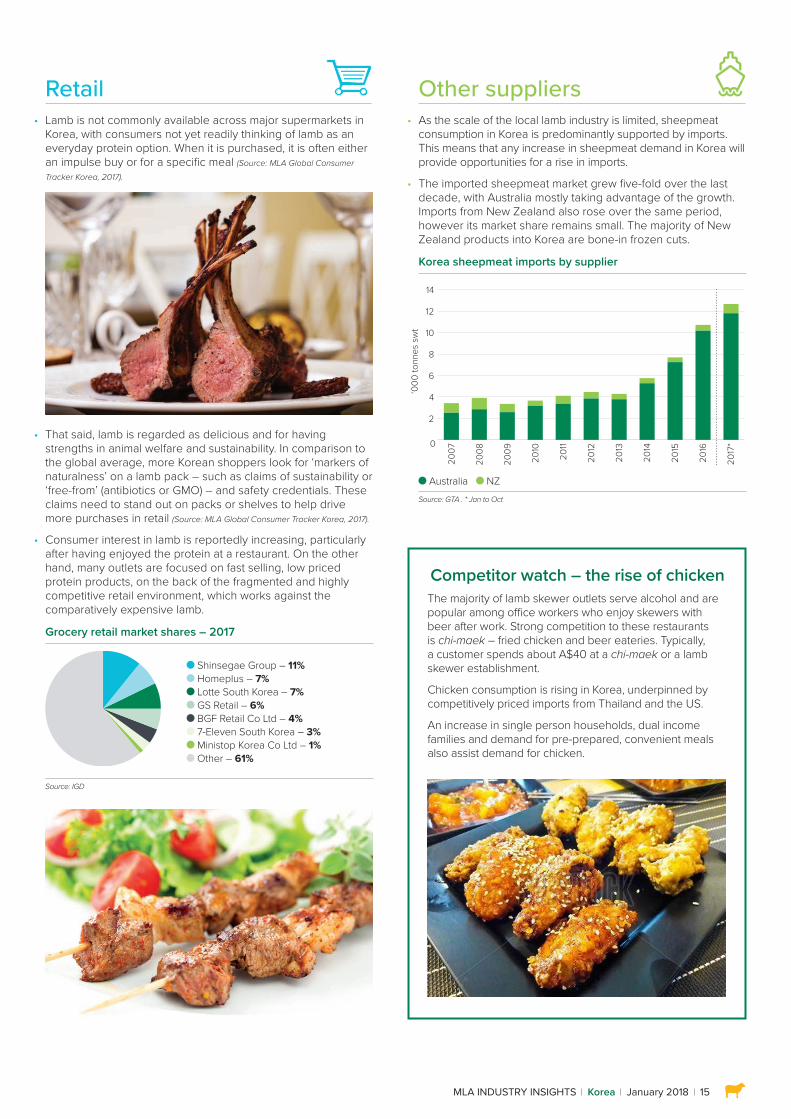
Other suppliers • As the scale of the local lamb industry is limited, sheepmeat
consumption in Korea is predominantly supported by imports. This means that any increase in sheepmeat demand in Korea will provide opportunities for a rise in imports.
• The imported sheepmeat market grew five-fold over the last decade, with Australia mostly taking advantage of the growth. Imports from New Zealand also rose over the same period, however its market share remains small. The majority of New Zealand products into Korea are bone-in frozen cuts.
Korea sheepmeat imports by supplier
200
7
2008
2009
2010
2011
2012
2013
2014
2015
2016
2017
*
‘000
tonn
es s
wt
0
2
4
6
8
10
12
14
Australia NZSource: GTA . * Jan to Oct
Competitor watch – the rise of chickenThe majority of lamb skewer outlets serve alcohol and are popular among office workers who enjoy skewers with beer after work. Strong competition to these restaurants is chi-maek – fried chicken and beer eateries. Typically, a customer spends about A$40 at a chi-maek or a lamb skewer establishment.
Chicken consumption is rising in Korea, underpinned by competitively priced imports from Thailand and the US.
An increase in single person households, dual income families and demand for pre-prepared, convenient meals also assist demand for chicken.
© Meat & Livestock Australia, 2018. ABN 39 081 678 364. MLA makes no representations as to the accuracy of any information or advice contained in MLA’s Market snapshot and excludes all liability, whether in contract, tort (including negligence or breach of statutory duty) or otherwise as a result of reliance by any person on such information or advice. All use of MLA publications, reports and information is subject to MLA’s Market Report and Information Terms of Use. Please read our terms of use carefully and ensure you are familiar with its content.16
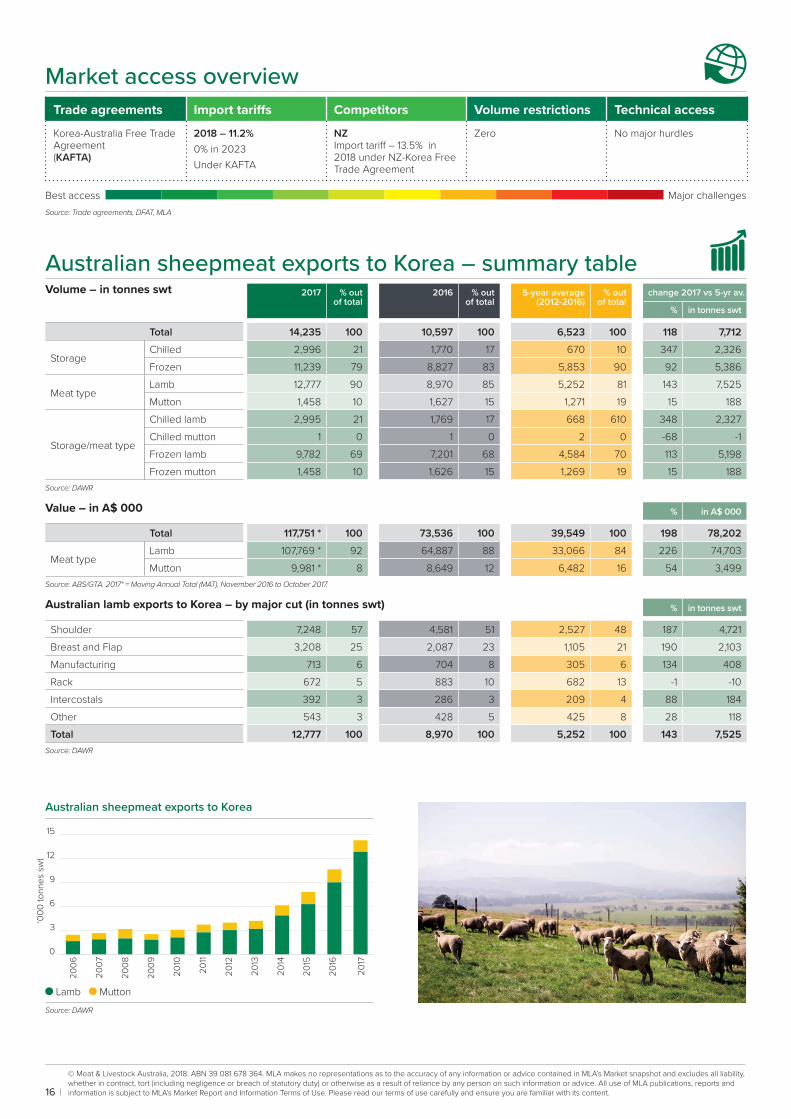
Market access overview Trade agreements Import tariffs Competitors Volume restrictions Technical access
Korea-Australia Free Trade Agreement (KAFTA)
2018 – 11.2%0% in 2023Under KAFTA
NZImport tariff – 13.5% in 2018 under NZ-Korea Free Trade Agreement
Zero No major hurdles
Best access Major challengesSource: Trade agreements, DFAT, MLA
Australian sheepmeat exports to Korea – summary table Volume – in tonnes swt 2017 % out
of total2016 % out
of total5-year average
(2012-2016)% out
of totalchange 2017 vs 5-yr av.
% in tonnes swt
Total 14,235 100 10,597 100 6,523 100 118 7,712
StorageChilled 2,996 21 1,770 17 670 10 347 2,326 Frozen 11,239 79 8,827 83 5,853 90 92 5,386
Meat typeLamb 12,777 90 8,970 85 5,252 81 143 7,525 Mutton 1,458 10 1,627 15 1,271 19 15 188
Storage/meat type
Chilled lamb 2,995 21 1,769 17 668 610 348 2,327 Chilled mutton 1 0 1 0 2 0 -68 -1 Frozen lamb 9,782 69 7,201 68 4,584 70 113 5,198 Frozen mutton 1,458 10 1,626 15 1,269 19 15 188
Source: DAWR
Value – in A$ 000 % in A$ 000
Total 117,751 * 100 73,536 100 39,549 100 198 78,202
Meat typeLamb 107,769 * 92 64,887 88 33,066 84 226 74,703 Mutton 9,981 * 8 8,649 12 6,482 16 54 3,499
Source: ABS/GTA. 2017* = Moving Annual Total (MAT), November 2016 to October 2017.
Australian lamb exports to Korea – by major cut (in tonnes swt) % in tonnes swt
Shoulder 7,248 57 4,581 51 2,527 48 187 4,721 Breast and Flap 3,208 25 2,087 23 1,105 21 190 2,103 Manufacturing 713 6 704 8 305 6 134 408 Rack 672 5 883 10 682 13 -1 -10 Intercostals 392 3 286 3 209 4 88 184 Other 543 3 428 5 425 8 28 118 Total 12,777 100 8,970 100 5,252 100 143 7,525
Source: DAWR
Australian sheepmeat exports to Korea
2006
2007
2008
2009
2010
2011
2012
2013
2014
2015
2016
2017
‘000
tonn
es s
wt
0
3
6
9
12
15
Lamb MuttonSource: DAWR
MARKET SNAPSHOT SHEEPMEAT
China
FOR FURTHER INFORMATION VISIT US ONLINE AT:www.mla.com.au or email us at: [email protected]
© Meat & Livestock Australia, 2018. ABN 39 081 678 364. MLA makes no representations as to the accuracy of any information or advice contained in MLA’s Market snapshot and excludes all liability, whether in contract, tort (including negligence or breach of statutory duty) or otherwise as a result of reliance by any person on such information or advice. All use of MLA publications, reports and information is subject to MLA’s Market Report and Information Terms of Use. Please read our terms of use carefully and ensure you are familiar with its content.
MLA INDUSTRY INSIGHTS China January 2018 17
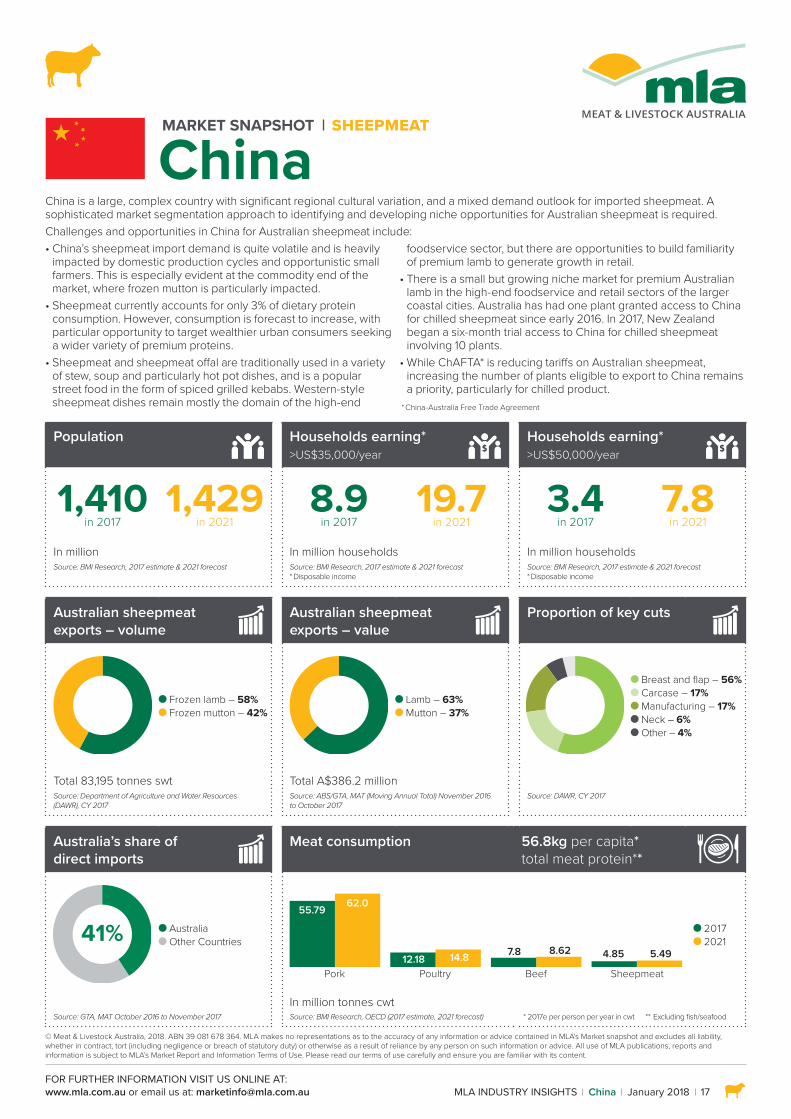
Population
Households earning* >US$35,000/year
Households earning* >US$50,000/year
1,410 in 2017
1,429 in 2021
8.9 in 2017
19.7 in 2021
3.4 in 2017
7.8 in 2021
In million In million households In million householdsSource: BMI Research, 2017 estimate & 2021 forecast Source: BMI Research, 2017 estimate & 2021 forecast
* Disposable incomeSource: BMI Research, 2017 estimate & 2021 forecast* Disposable income
Australian sheepmeat exports – volume
Australian sheepmeat exports – value
Proportion of key cuts
Frozen lamb – 58% Frozen mutton – 42%
Lamb – 63% Mutton – 37%
Breast and flap – 56% Carcase – 17% Manufacturing – 17% Neck – 6% Other – 4%
Total 83,195 tonnes swt Total A$386.2 millionSource: Department of Agriculture and Water Resources (DAWR), CY 2017
Source: ABS/GTA, MAT (Moving Annual Total) November 2016 to October 2017
Source: DAWR, CY 2017
Australia’s share of direct imports
Meat consumption 56.8kg per capita* total meat protein**
41% Australia Other Countries
Pork
55.79 62.0
12.18 14.8 7.8 8.62 4.85 5.49
Poultry Beef Sheepmeat
2017 2021
Source: GTA, MAT October 2016 to November 2017
In million tonnes cwt Source: BMI Research, OECD (2017 estimate, 2021 forecast) * 2017e per person per year in cwt ** Excluding fish/seafood
China is a large, complex country with significant regional cultural variation, and a mixed demand outlook for imported sheepmeat. A sophisticated market segmentation approach to identifying and developing niche opportunities for Australian sheepmeat is required.Challenges and opportunities in China for Australian sheepmeat include:• China’s sheepmeat import demand is quite volatile and is heavily
impacted by domestic production cycles and opportunistic small farmers. This is especially evident at the commodity end of the market, where frozen mutton is particularly impacted.
• Sheepmeat currently accounts for only 3% of dietary protein consumption. However, consumption is forecast to increase, with particular opportunity to target wealthier urban consumers seeking a wider variety of premium proteins.
• Sheepmeat and sheepmeat offal are traditionally used in a variety of stew, soup and particularly hot pot dishes, and is a popular street food in the form of spiced grilled kebabs. Western-style sheepmeat dishes remain mostly the domain of the high-end
foodservice sector, but there are opportunities to build familiarity of premium lamb to generate growth in retail.
• There is a small but growing niche market for premium Australian lamb in the high-end foodservice and retail sectors of the larger coastal cities. Australia has had one plant granted access to China for chilled sheepmeat since early 2016. In 2017, New Zealand began a six-month trial access to China for chilled sheepmeat involving 10 plants.
• While ChAFTA* is reducing tariffs on Australian sheepmeat, increasing the number of plants eligible to export to China remains a priority, particularly for chilled product.
* China-Australia Free Trade Agreement
18 MLA INDUSTRY INSIGHTS China January 2018
Consumers • Due to its large population, growing incomes and shifting
diets, China is an attractive market for premium Australian sheepmeat. However, care needs to be taken to minimise the risks of market volatility, which tends to impact the commodity end of the market due to domestic production cycles.
• China is a country of great regional cultural diversity and variation in consumption habits and preferences. Considering cuisine alone, there are at least eight distinct Chinese cuisines, with the use and flavouring of sheepmeat varying.
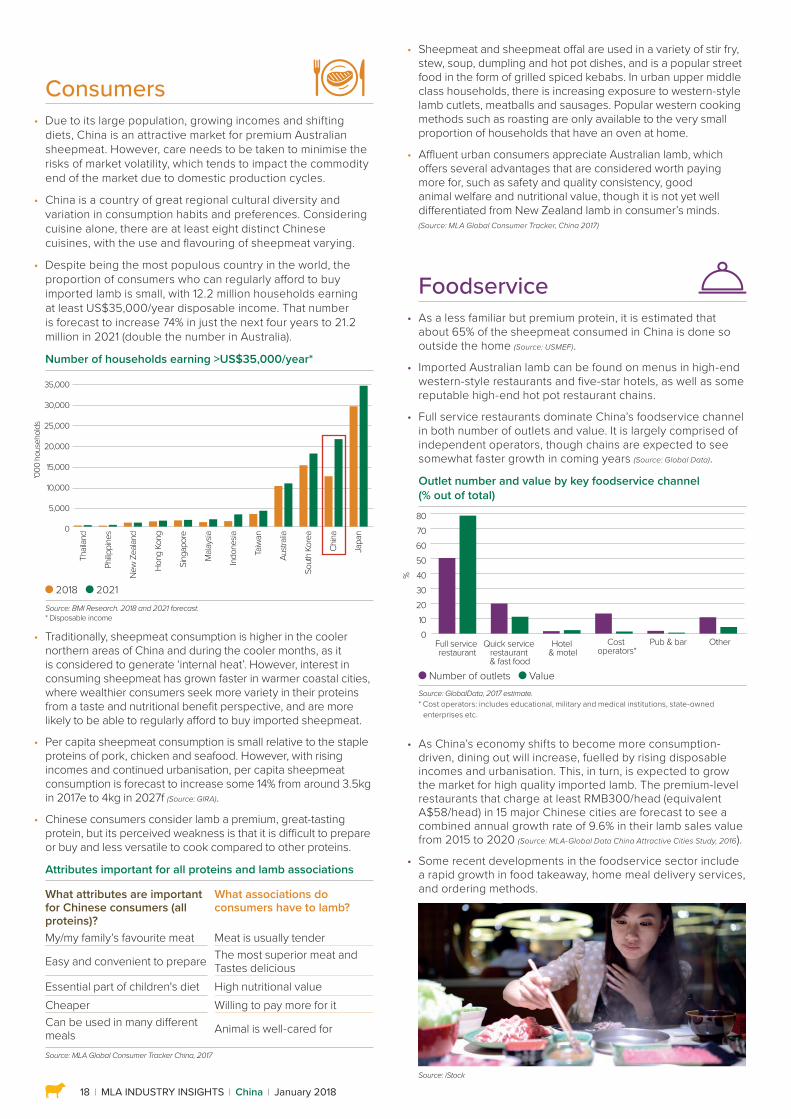
• Despite being the most populous country in the world, the proportion of consumers who can regularly afford to buy imported lamb is small, with 12.2 million households earning at least US$35,000/year disposable income. That number is forecast to increase 74% in just the next four years to 21.2 million in 2021 (double the number in Australia).
Number of households earning >US$35,000/year*
Thail
and
Philip
pine
s
New
Zea
land
Hong
Kon
g
Sing
apor
e
Mala
ysia
Indon
esia
Taiw
an
Austr
alia
Sout
h Ko
rea
China
Japa
n0
5,000
10,000
15,000
20,000
25,000
30,000
35,000
'000
hou
seho
lds
2018 2021Source: BMI Research. 2018 and 2021 forecast.* Disposable income
• Traditionally, sheepmeat consumption is higher in the cooler northern areas of China and during the cooler months, as it is considered to generate ‘internal heat’. However, interest in consuming sheepmeat has grown faster in warmer coastal cities, where wealthier consumers seek more variety in their proteins from a taste and nutritional benefit perspective, and are more likely to be able to regularly afford to buy imported sheepmeat.
• Per capita sheepmeat consumption is small relative to the staple proteins of pork, chicken and seafood. However, with rising incomes and continued urbanisation, per capita sheepmeat consumption is forecast to increase some 14% from around 3.5kg in 2017e to 4kg in 2027f (Source: GIRA).
• Chinese consumers consider lamb a premium, great-tasting protein, but its perceived weakness is that it is difficult to prepare or buy and less versatile to cook compared to other proteins.
Attributes important for all proteins and lamb associations
What attributes are important for Chinese consumers (all proteins)?
What associations do consumers have to lamb?
My/my family’s favourite meat Meat is usually tender
Easy and convenient to prepare The most superior meat and Tastes delicious
Essential part of children's diet High nutritional valueCheaper Willing to pay more for itCan be used in many different meals Animal is well-cared for
Source: MLA Global Consumer Tracker China, 2017
Foodservice • As a less familiar but premium protein, it is estimated that
about 65% of the sheepmeat consumed in China is done so outside the home (Source: USMEF).
• Imported Australian lamb can be found on menus in high-end western-style restaurants and five-star hotels, as well as some reputable high-end hot pot restaurant chains.
• Full service restaurants dominate China’s foodservice channel in both number of outlets and value. It is largely comprised of independent operators, though chains are expected to see somewhat faster growth in coming years (Source: Global Data).
Outlet number and value by key foodservice channel (% out of total)
Number of outlets ValueSource: GlobalData, 2017 estimate. * Cost operators: includes educational, military and medical institutions, state-owned enterprises etc.
• As China’s economy shifts to become more consumption-driven, dining out will increase, fuelled by rising disposable incomes and urbanisation. This, in turn, is expected to grow the market for high quality imported lamb. The premium-level restaurants that charge at least RMB300/head (equivalent A$58/head) in 15 major Chinese cities are forecast to see a combined annual growth rate of 9.6% in their lamb sales value from 2015 to 2020 (Source: MLA-Global Data China Attractive Cities Study, 2016).
• Some recent developments in the foodservice sector include a rapid growth in food takeaway, home meal delivery services, and ordering methods.
Source: iStock
%
010
20304050607080
Full service restaurant
Hotel & motel
Cost operators*
Quick service restaurant & fast food
Pub & bar Other
• Sheepmeat and sheepmeat offal are used in a variety of stir fry, stew, soup, dumpling and hot pot dishes, and is a popular street food in the form of grilled spiced kebabs. In urban upper middle class households, there is increasing exposure to western-style lamb cutlets, meatballs and sausages. Popular western cooking methods such as roasting are only available to the very small proportion of households that have an oven at home.
• Affluent urban consumers appreciate Australian lamb, which offers several advantages that are considered worth paying more for, such as safety and quality consistency, good animal welfare and nutritional value, though it is not yet well differentiated from New Zealand lamb in consumer’s minds. (Source: MLA Global Consumer Tracker, China 2017)
MLA INDUSTRY INSIGHTS China January 2018 19
Retail • China is home to the world’s largest grocery market by total
sales (valued at US$1,275 billion in 2018f), but it is also one of the world’s most regionalised and fragmented (Source: IGD).
Top five grocery retailers by market share rank in China region
East region West region South region North region
Sun Art Group Wal-Mart Group Wal-mart Group Sun Art Group
Vanguard Group (+Tesco) Yonghui Group WSL Group Wu-Mart Group
Bailian Group Vanguard Group (+Tesco)
Vanguard Group (+Tesco) Carrefour
Carrefour New Century Sun Art Group Vanguard Group (+Tesco)
Wal-mart Group Carrefour Bubugao Spar Group
Source: Kantar Worldpanel, September 2017
• In China, country of origin labelling is mandatory so consumers know where their lamb comes from, particularly when purchased from modern retail channels. In addition, urban affluent consumers are driving growth in branded lamb products, as a marker of not only the important ‘basics’ of quality and safety, but as a source of meaning that contributes to their consumption experience via dimensions such as provenance.
• Retail has been a small channel for Australian sheepmeat in China to date, but branded lamb product is becoming available in stores in some of the larger cities and online.
• Frequent imported meat buyers buy their lamb mostly from modern retail channels, but still use wet markets for some lamb purchases.
Where frequent imported meat consumers bought lamb from in the past month
Hypermarket
Supermarket
Specialist/independent butcher shop
Local market stall/wet market
Farmer's market
Online retailer
Direct from farmer/farmer co'op
Department store
Community supported ag group
Cash & Carry Store
60%
42%
42%
35%
32%
31%
17%
12%
11%
6%
Source: MLA-GlobalData China Attractive Cities Study, 2016. Top 15 attractive cities combined.
• China’s grocery retail sector is undergoing significant change, with new business models being trialled across the country including new mobile payment systems, unmanned convenience stores, small format grocery stores and same-day fresh grocery delivery, presenting potential new opportunities for Australian lamb.
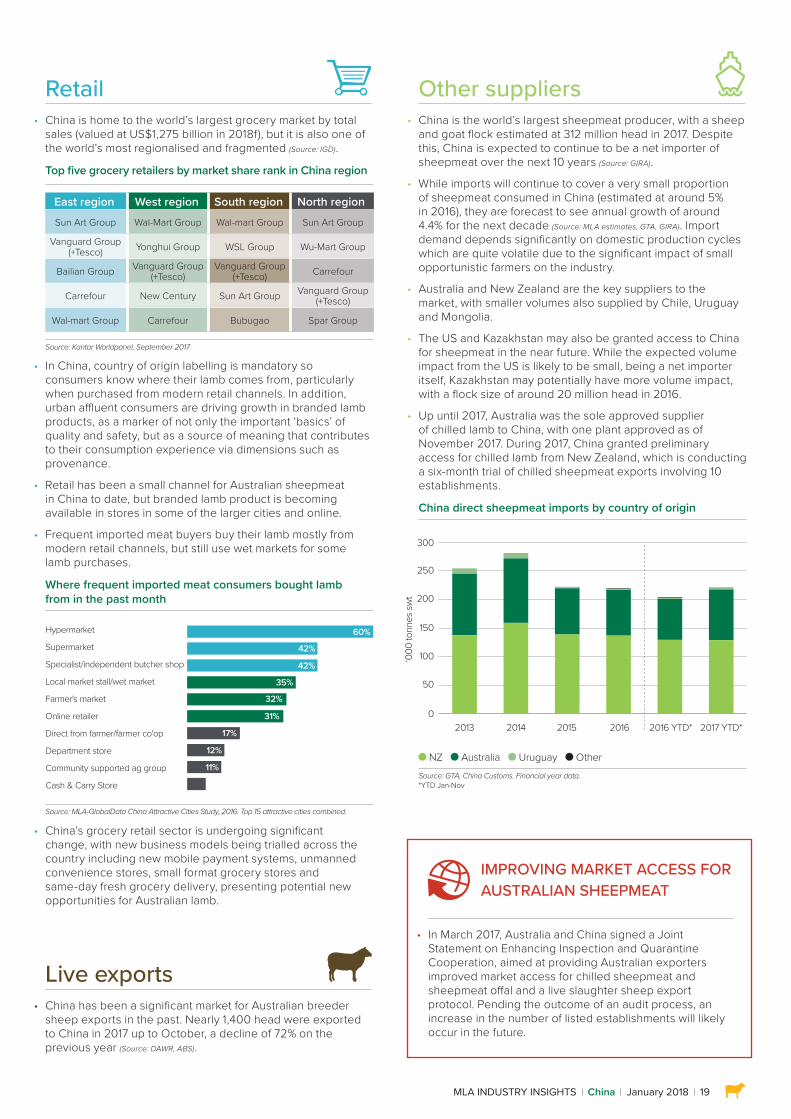
Other suppliers • China is the world’s largest sheepmeat producer, with a sheep
and goat flock estimated at 312 million head in 2017. Despite this, China is expected to continue to be a net importer of sheepmeat over the next 10 years (Source: GIRA).
• While imports will continue to cover a very small proportion of sheepmeat consumed in China (estimated at around 5% in 2016), they are forecast to see annual growth of around 4.4% for the next decade (Source: MLA estimates, GTA, GIRA). Import demand depends significantly on domestic production cycles which are quite volatile due to the significant impact of small opportunistic farmers on the industry.
• Australia and New Zealand are the key suppliers to the market, with smaller volumes also supplied by Chile, Uruguay and Mongolia.
• The US and Kazakhstan may also be granted access to China for sheepmeat in the near future. While the expected volume impact from the US is likely to be small, being a net importer itself, Kazakhstan may potentially have more volume impact, with a flock size of around 20 million head in 2016.
• Up until 2017, Australia was the sole approved supplier of chilled lamb to China, with one plant approved as of November 2017. During 2017, China granted preliminary access for chilled lamb from New Zealand, which is conducting a six-month trial of chilled sheepmeat exports involving 10 establishments.
China direct sheepmeat imports by country of origin
NZ Australia Uruguay OtherSource: GTA, China Customs. Financial year data.*YTD Jan-Nov
0
50
100
150
200
250
300
2013 2014 2015 2016 2017 YTD*2016 YTD*
‘000
tonn
es s
wt
Live exports • China has been a significant market for Australian breeder
sheep exports in the past. Nearly 1,400 head were exported to China in 2017 up to October, a decline of 72% on the previous year (Source: DAWR, ABS).
IMPROVING MARKET ACCESS FOR AUSTRALIAN SHEEPMEAT
• In March 2017, Australia and China signed a Joint Statement on Enhancing Inspection and Quarantine Cooperation, aimed at providing Australian exporters improved market access for chilled sheepmeat and sheepmeat offal and a live slaughter sheep export protocol. Pending the outcome of an audit process, an increase in the number of listed establishments will likely occur in the future.
© Meat & Livestock Australia, 2018. ABN 39 081 678 364. MLA makes no representations as to the accuracy of any information or advice contained in MLA’s Market snapshot and excludes all liability, whether in contract, tort (including negligence or breach of statutory duty) or otherwise as a result of reliance by any person on such information or advice. All use of MLA publications, reports and information is subject to MLA’s Market Report and Information Terms of Use. Please read our terms of use carefully and ensure you are familiar with its content.20
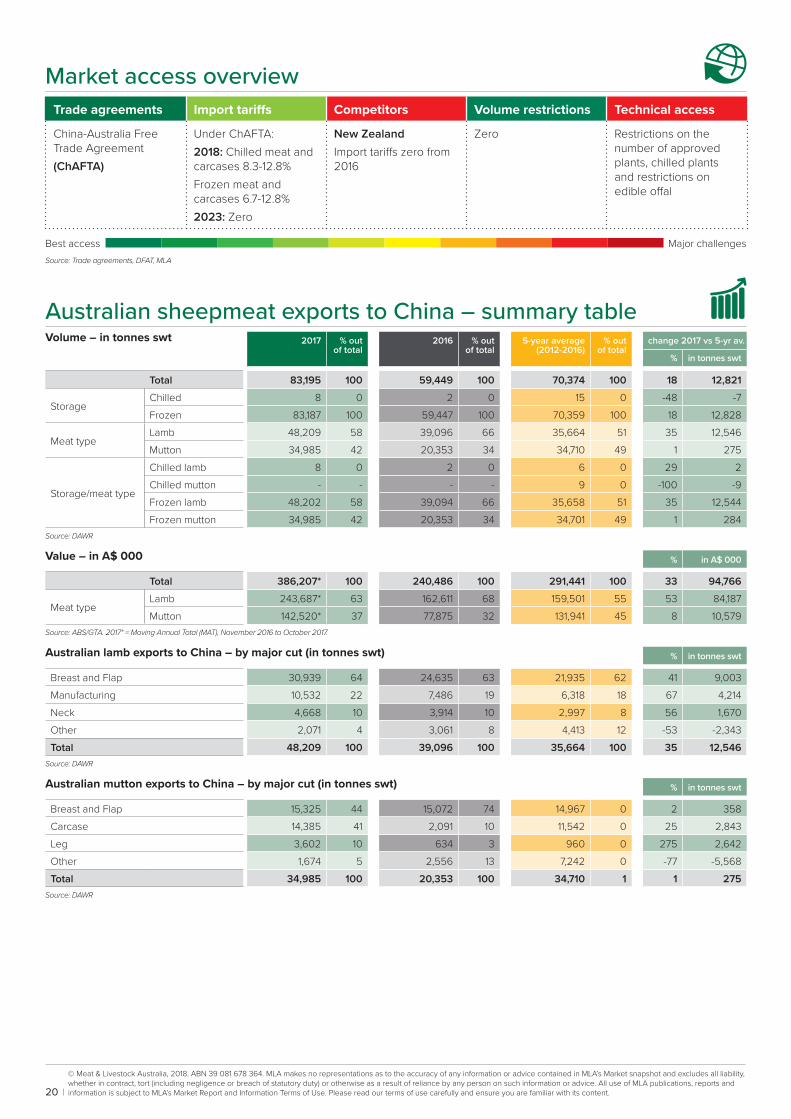
Market access overview Trade agreements Import tariffs Competitors Volume restrictions Technical access
China-Australia Free Trade Agreement(ChAFTA)
Under ChAFTA:2018: Chilled meat and carcases 8.3-12.8%Frozen meat and carcases 6.7-12.8%2023: Zero
New ZealandImport tariffs zero from 2016
Zero Restrictions on the number of approved plants, chilled plants and restrictions on edible offal
Best access Major challengesSource: Trade agreements, DFAT, MLA
Australian sheepmeat exports to China – summary table Volume – in tonnes swt 2017 % out
of total2016 % out
of total5-year average
(2012-2016)% out
of totalchange 2017 vs 5-yr av.
% in tonnes swt
Total 83,195 100 59,449 100 70,374 100 18 12,821
StorageChilled 8 0 2 0 15 0 -48 -7 Frozen 83,187 100 59,447 100 70,359 100 18 12,828
Meat typeLamb 48,209 58 39,096 66 35,664 51 35 12,546 Mutton 34,985 42 20,353 34 34,710 49 1 275
Storage/meat type
Chilled lamb 8 0 2 0 6 0 29 2 Chilled mutton - - - - 9 0 -100 -9 Frozen lamb 48,202 58 39,094 66 35,658 51 35 12,544 Frozen mutton 34,985 42 20,353 34 34,701 49 1 284
Source: DAWR
Value – in A$ 000 % in A$ 000
Total 386,207* 100 240,486 100 291,441 100 33 94,766
Meat typeLamb 243,687* 63 162,611 68 159,501 55 53 84,187 Mutton 142,520* 37 77,875 32 131,941 45 8 10,579
Source: ABS/GTA. 2017* = Moving Annual Total (MAT), November 2016 to October 2017.
Australian lamb exports to China – by major cut (in tonnes swt) % in tonnes swt
Breast and Flap 30,939 64 24,635 63 21,935 62 41 9,003 Manufacturing 10,532 22 7,486 19 6,318 18 67 4,214 Neck 4,668 10 3,914 10 2,997 8 56 1,670 Other 2,071 4 3,061 8 4,413 12 -53 -2,343 Total 48,209 100 39,096 100 35,664 100 35 12,546
Source: DAWR
Australian mutton exports to China – by major cut (in tonnes swt) % in tonnes swt
Breast and Flap 15,325 44 15,072 74 14,967 0 2 358 Carcase 14,385 41 2,091 10 11,542 0 25 2,843 Leg 3,602 10 634 3 960 0 275 2,642 Other 1,674 5 2,556 13 7,242 0 -77 -5,568 Total 34,985 100 20,353 100 34,710 1 1 275
Source: DAWR
FOR FURTHER INFORMATION VISIT US ONLINE AT:www.mla.com.au or email us at: [email protected]
© Meat & Livestock Australia, 2018. ABN 39 081 678 364. MLA makes no representations as to the accuracy of any information or advice contained in MLA’s Market snapshot and excludes all liability, whether in contract, tort (including negligence or breach of statutory duty) or otherwise as a result of reliance by any person on such information or advice. All use of MLA publications, reports and information is subject to MLA’s Market Report and Information Terms of Use. Please read our terms of use carefully and ensure you are familiar with its content.
MLA INDUSTRY INSIGHTS South East Asia January 2018 21
MARKET SNAPSHOT SHEEPMEAT
South East Asia (including Indonesia)South East Asia (SEA*) is one of the fastest-growing consumer markets in the world, underpinned by strong economic growth, a young population, rapid urbanisation and rising incomes. Increasing demand for high quality food, coupled with a growing trend in dining out, represent growth opportunities for Australian lamb and mutton exports. However, the SEA region is diverse, with consumer spending power, consumption habits, and stage of market maturity greatly varying across countries.Challenges and opportunities in SEA for Australian sheepmeat include:• Sheepmeat is a niche meat protein and consumed far less than
chicken, pork, and beef in the region. With many consumers not growing up eating sheepmeat, it remains rather unfamiliar. Consumers’ lack of awareness and familiarity with sheepmeat, coupled with the high prices, have led to a limitation in sheepmeat consumption at home across the region.
• Overall, sheepmeat consumption across SEA is forecast to grow, supported by its large Muslim consumer base who typically
consume sheepmeat to celebrate important religious festivals. Sheepmeat consumption is also supported by the expanding young and urban populations who are keen to experience new tastes and are open to international food culture.
• Robust growth in the tourism sector, increased expansion of barbecue and hot pot restaurants in large cities and the growing amount of consumers dining out across the region are underpinning a gradual uptake of lamb products.
Population
Households earning* >US$35,000/year
Households earning* >US$50,000/year
647.5 in 2017
674.1 in 2021
3.9 in 2017
7.0 in 2021
2.3 in 2017
3.8 in 2021
In million In million households In million householdsSource: BMI Research, 2017 estimate & 2021 forecast, total of 10 countries
Source: BMI Research, 2017 estimate & 2021 forecast, total of 7 countries – Indonesia, Malaysia, Philippines, Singapore, Thailand, Vietnam and Cambodia * Disposable income
Source: BMI Research, 2017 estimate & 2021 forecast, total of 7 countries – Indonesia, Malaysia, Philippines, Singapore, Thailand, Vietnam and Cambodia * Disposable income
Australian sheepmeat exports – volume
Australian sheepmeat exports – value
Do not buy and cook lamb at home (but do eat it when dining out)
Chilled lamb – 3% Chilled mutton – 1% Frozen lamb – 33% Frozen mutton – 63%
Lamb – 44% Mutton – 56%
Indonesia Malaysia Singapore
30%33%
21%Globalaverage
18%
Total 39,316 tonnes swt Total A$271.8 millionSource: Department of Agriculture and Water Resources (DAWR), CY 2017
Source: ABS/GTA, MAT (Moving Annual Total) November 2016 to October 2017
Source: MLA Global Consumer Tracker SEA, 2017
Australia’s share of imports
Meat consumption
Malaysia
62%
88%98%
Singapore Indonesia Pork
6.397.24 6.62
7.92
2.21 2.560.24 0.26
Poultry Beef Sheepmeat
2017 2021
In million tonnes cwtSource: GTA, based on MAT volume of Malaysia, Singapore and Indonesia
Source: BMI Research, 2017 estimate and 2021 forecast, total of 5 countries – Indonesia, Malaysia, Philippines, Thailand and Vietnam
* In this report, South East Asia (SEA) includes the following countries – Indonesia, Singapore, Malaysia, Thailand, the Philippines, and Vietnam, as well as Brunei, Cambodia, Laos and Myanmar..
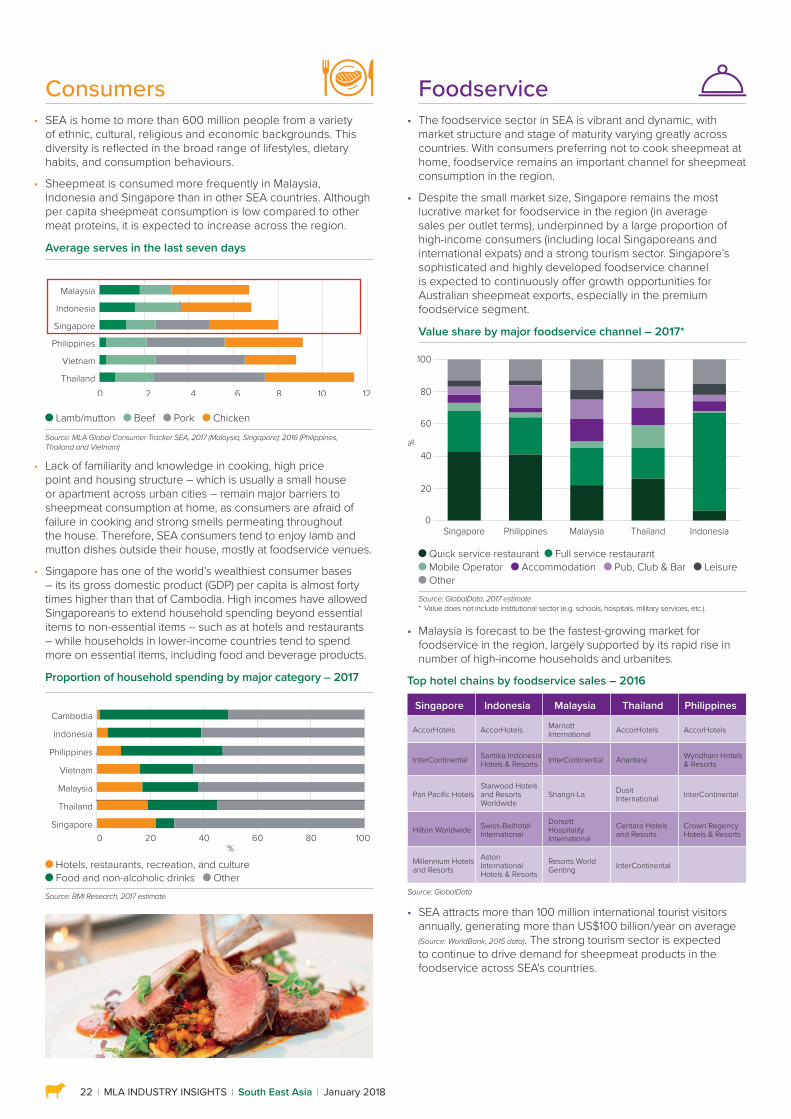
22 MLA INDUSTRY INSIGHTS South East Asia January 2018
Consumers • SEA is home to more than 600 million people from a variety
of ethnic, cultural, religious and economic backgrounds. This diversity is reflected in the broad range of lifestyles, dietary habits, and consumption behaviours.
• Sheepmeat is consumed more frequently in Malaysia, Indonesia and Singapore than in other SEA countries. Although per capita sheepmeat consumption is low compared to other meat proteins, it is expected to increase across the region.
Average serves in the last seven days
0 2 4 6 8 10 12Thailand
Vietnam
Philippines
Singapore
Indonesia
Malaysia
Lamb/mutton Beef Pork Chicken
Source: MLA Global Consumer Tracker SEA, 2017 (Malaysia, Singapore); 2016 (Philippines, Thailand and Vietnam)
• Lack of familiarity and knowledge in cooking, high price point and housing structure – which is usually a small house or apartment across urban cities – remain major barriers to sheepmeat consumption at home, as consumers are afraid of failure in cooking and strong smells permeating throughout the house. Therefore, SEA consumers tend to enjoy lamb and mutton dishes outside their house, mostly at foodservice venues.
• Singapore has one of the world’s wealthiest consumer bases – its its gross domestic product (GDP) per capita is almost forty times higher than that of Cambodia. High incomes have allowed Singaporeans to extend household spending beyond essential items to non-essential items – such as at hotels and restaurants – while households in lower-income countries tend to spend more on essential items, including food and beverage products.
Proportion of household spending by major category – 2017
0 20 40 60 80 100
Other
Food & non-alcoholic drinks
Hotels, restaurants, recreation, and culture
Singapore
Thailand
Malaysia
Vietnam
Philippines
Indonesia
Cambodia
%
Hotels, restaurants, recreation, and culture Food and non-alcoholic drinks Other
Source: BMI Research, 2017 estimate
Foodservice • The foodservice sector in SEA is vibrant and dynamic, with
market structure and stage of maturity varying greatly across countries. With consumers preferring not to cook sheepmeat at home, foodservice remains an important channel for sheepmeat consumption in the region.
• Despite the small market size, Singapore remains the most lucrative market for foodservice in the region (in average sales per outlet terms), underpinned by a large proportion of high-income consumers (including local Singaporeans and international expats) and a strong tourism sector. Singapore’s sophisticated and highly developed foodservice channel is expected to continuously offer growth opportunities for Australian sheepmeat exports, especially in the premium foodservice segment.
Value share by major foodservice channel – 2017*
%
0
20
40
60
80
100Other
Leisure
Pub, Club & Bar
Accommodation
Mobile Operator
Full service restaurant
Quick service restaurantIndonesiaThailandMalaysiaPhilippinesSingapore
Quick service restaurant Full service restaurant Mobile Operator Accommodation Pub, Club & Bar Leisure Other
Source: GlobalData, 2017 estimate * Value does not include institutional sector (e.g. schools, hospitals, military services, etc.).
• Malaysia is forecast to be the fastest-growing market for foodservice in the region, largely supported by its rapid rise in number of high-income households and urbanites.
Top hotel chains by foodservice sales – 2016
Singapore Indonesia Malaysia Thailand Philippines
AccorHotels AccorHotels Marriott International AccorHotels AccorHotels
InterContinental Santika Indonesia Hotels & Resorts InterContinental Anantara Wyndham Hotels
& Resorts
Pan Pacific HotelsStarwood Hotels and Resorts Worldwide
Shangri-La Dusit International InterContinental
Hilton Worldwide Swiss-Belhotel International
Dorsett Hospitality International
Centara Hotels and Resorts
Crown Regency Hotels & Resorts
Millennium Hotels and Resorts
Aston International Hotels & Resorts
Resorts World Genting InterContinental
Source: GlobalData
• SEA attracts more than 100 million international tourist visitors annually, generating more than US$100 billion/year on average (Source: WorldBank, 2015 data). The strong tourism sector is expected to continue to drive demand for sheepmeat products in the foodservice across SEA’s countries.
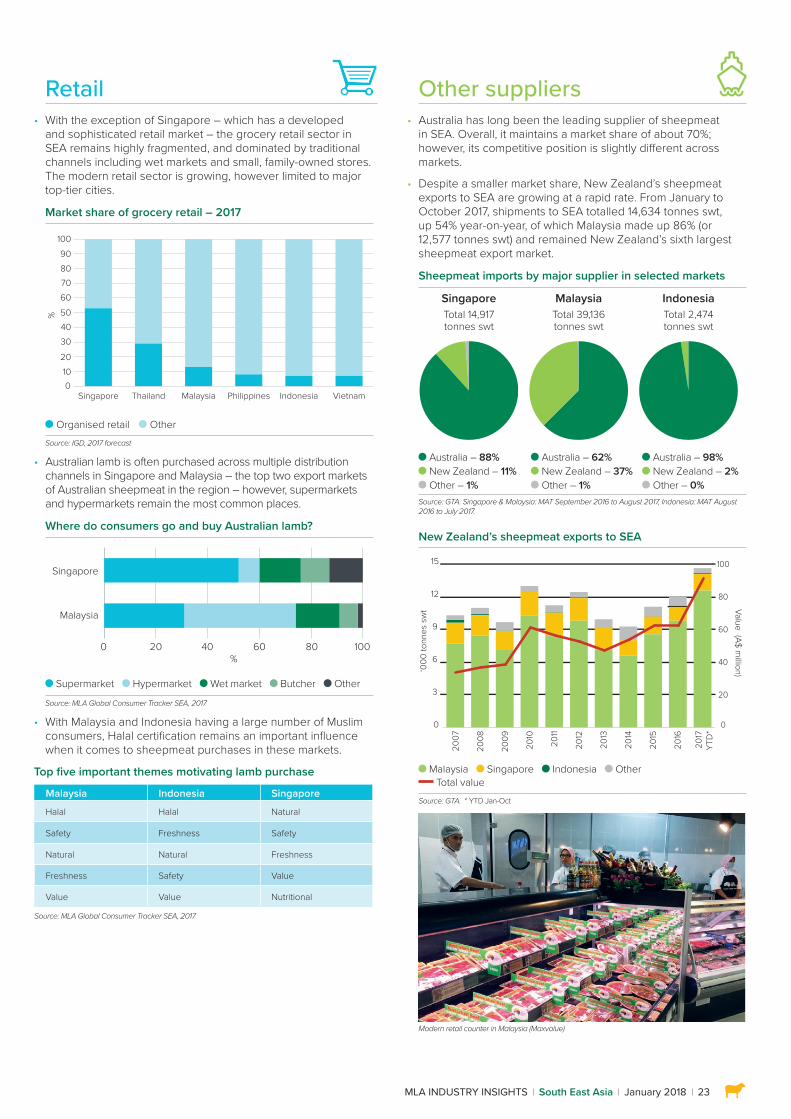
MLA INDUSTRY INSIGHTS South East Asia January 2018 23
Retail • With the exception of Singapore – which has a developed
and sophisticated retail market – the grocery retail sector in SEA remains highly fragmented, and dominated by traditional channels including wet markets and small, family-owned stores. The modern retail sector is growing, however limited to major top-tier cities.
Market share of grocery retail – 2017
%
010
20
30405060708090
100Other
Organised retail
VietnamIndonesiaPhilippinesMalaysiaThailandSingapore
Organised retail OtherSource: IGD, 2017 forecast
• Australian lamb is often purchased across multiple distribution channels in Singapore and Malaysia – the top two export markets of Australian sheepmeat in the region – however, supermarkets and hypermarkets remain the most common places.
Where do consumers go and buy Australian lamb?
Singapore
Malaysia
0 20 40 60 80 100%
Supermarket Hypermarket Wet market Butcher Other
Source: MLA Global Consumer Tracker SEA, 2017
• With Malaysia and Indonesia having a large number of Muslim consumers, Halal certification remains an important influence when it comes to sheepmeat purchases in these markets.
Top five important themes motivating lamb purchase
Malaysia Indonesia Singapore
Halal Halal Natural
Safety Freshness Safety
Natural Natural Freshness
Freshness Safety Value
Value Value Nutritional
Source: MLA Global Consumer Tracker SEA, 2017
Other suppliers • Australia has long been the leading supplier of sheepmeat
in SEA. Overall, it maintains a market share of about 70%; however, its competitive position is slightly different across markets.
• Despite a smaller market share, New Zealand’s sheepmeat exports to SEA are growing at a rapid rate. From January to October 2017, shipments to SEA totalled 14,634 tonnes swt, up 54% year-on-year, of which Malaysia made up 86% (or 12,577 tonnes swt) and remained New Zealand’s sixth largest sheepmeat export market.
Sheepmeat imports by major supplier in selected markets
SingaporeTotal 14,917 tonnes swt
MalaysiaTotal 39,136 tonnes swt
IndonesiaTotal 2,474 tonnes swt
Australia – 88% New Zealand – 11% Other – 1%
Australia – 62% New Zealand – 37% Other – 1%
Australia – 98% New Zealand – 2% Other – 0%
Source: GTA. Singapore & Malaysia: MAT September 2016 to August 2017, Indonesia: MAT August 2016 to July 2017.
New Zealand’s sheepmeat exports to SEA
‘000
tonn
es s
wt
0
3
6
9
12
15OtherIndonesiaSingaporeMalaysia
2007
2008
2009
2010
2011
2012
2013
2014
2015
2016
2017
YT
D*
0
20
40
60
80
100
Value (A$ million)
Malaysia Singapore Indonesia Other Total value
Source: GTA. * YTD Jan-Oct
Modern retail counter in Malaysia (Maxvalue)
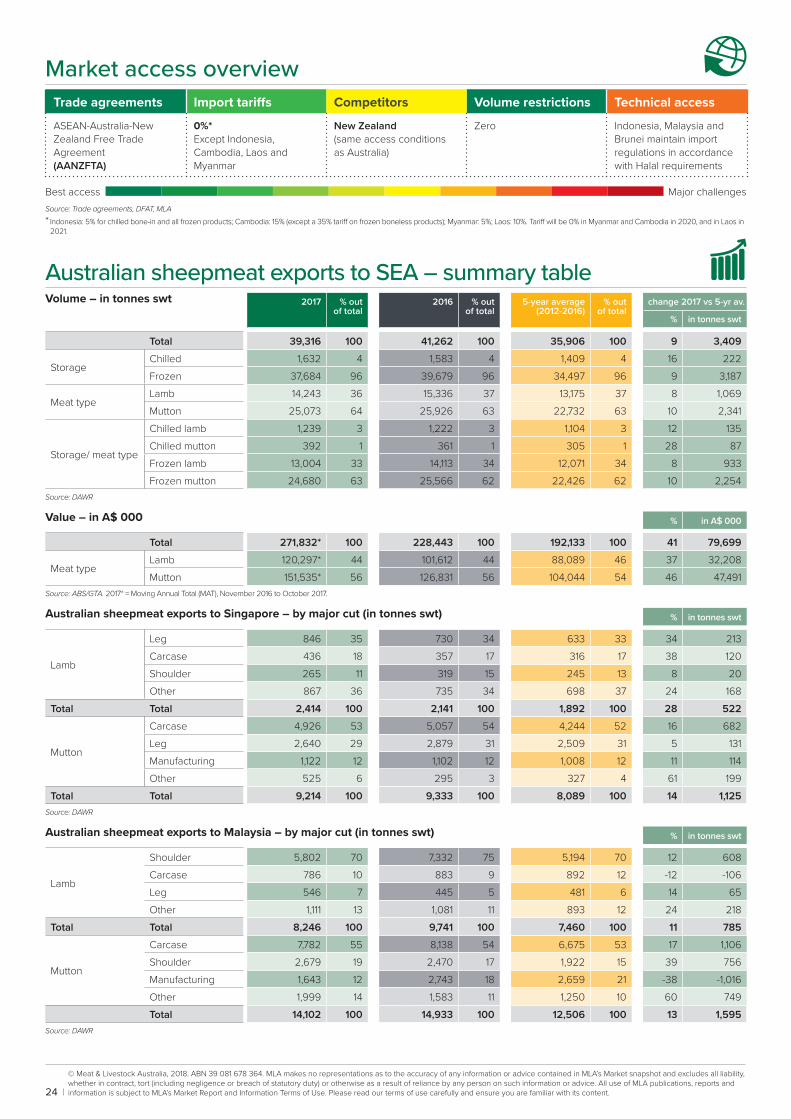
© Meat & Livestock Australia, 2018. ABN 39 081 678 364. MLA makes no representations as to the accuracy of any information or advice contained in MLA’s Market snapshot and excludes all liability, whether in contract, tort (including negligence or breach of statutory duty) or otherwise as a result of reliance by any person on such information or advice. All use of MLA publications, reports and information is subject to MLA’s Market Report and Information Terms of Use. Please read our terms of use carefully and ensure you are familiar with its content.24
Market access overview Trade agreements Import tariffs Competitors Volume restrictions Technical access
ASEAN-Australia-New Zealand Free Trade Agreement(AANZFTA)
0%*Except Indonesia, Cambodia, Laos and Myanmar
New Zealand(same access conditions as Australia)
Zero Indonesia, Malaysia and Brunei maintain import regulations in accordance with Halal requirements
Best access Major challengesSource: Trade agreements, DFAT, MLA* Indonesia: 5% for chilled bone-in and all frozen products; Cambodia: 15% (except a 35% tariff on frozen boneless products); Myanmar: 5%; Laos: 10%. Tariff will be 0% in Myanmar and Cambodia in 2020, and in Laos in 2021.
Australian sheepmeat exports to SEA – summary table Volume – in tonnes swt 2017 % out
of total2016 % out
of total5-year average
(2012-2016)% out
of totalchange 2017 vs 5-yr av.
% in tonnes swt
Total 39,316 100 41,262 100 35,906 100 9 3,409
StorageChilled 1,632 4 1,583 4 1,409 4 16 222 Frozen 37,684 96 39,679 96 34,497 96 9 3,187
Meat typeLamb 14,243 36 15,336 37 13,175 37 8 1,069 Mutton 25,073 64 25,926 63 22,732 63 10 2,341
Storage/ meat type
Chilled lamb 1,239 3 1,222 3 1,104 3 12 135 Chilled mutton 392 1 361 1 305 1 28 87 Frozen lamb 13,004 33 14,113 34 12,071 34 8 933 Frozen mutton 24,680 63 25,566 62 22,426 62 10 2,254
Source: DAWR
Value – in A$ 000 % in A$ 000
Total 271,832* 100 228,443 100 192,133 100 41 79,699
Meat typeLamb 120,297* 44 101,612 44 88,089 46 37 32,208 Mutton 151,535* 56 126,831 56 104,044 54 46 47,491
Source: ABS/GTA. 2017* = Moving Annual Total (MAT), November 2016 to October 2017.
Australian sheepmeat exports to Singapore – by major cut (in tonnes swt) % in tonnes swt
Lamb
Leg 846 35 730 34 633 33 34 213 Carcase 436 18 357 17 316 17 38 120 Shoulder 265 11 319 15 245 13 8 20 Other 867 36 735 34 698 37 24 168
Total Total 2,414 100 2,141 100 1,892 100 28 522
Mutton
Carcase 4,926 53 5,057 54 4,244 52 16 682 Leg 2,640 29 2,879 31 2,509 31 5 131 Manufacturing 1,122 12 1,102 12 1,008 12 11 114 Other 525 6 295 3 327 4 61 199
Total Total 9,214 100 9,333 100 8,089 100 14 1,125 Source: DAWR
Australian sheepmeat exports to Malaysia – by major cut (in tonnes swt) % in tonnes swt
Lamb
Shoulder 5,802 70 7,332 75 5,194 70 12 608 Carcase 786 10 883 9 892 12 -12 -106 Leg 546 7 445 5 481 6 14 65 Other 1,111 13 1,081 11 893 12 24 218
Total Total 8,246 100 9,741 100 7,460 100 11 785
Mutton
Carcase 7,782 55 8,138 54 6,675 53 17 1,106 Shoulder 2,679 19 2,470 17 1,922 15 39 756 Manufacturing 1,643 12 2,743 18 2,659 21 -38 -1,016 Other 1,999 14 1,583 11 1,250 10 60 749 Total 14,102 100 14,933 100 12,506 100 13 1,595
Source: DAWR
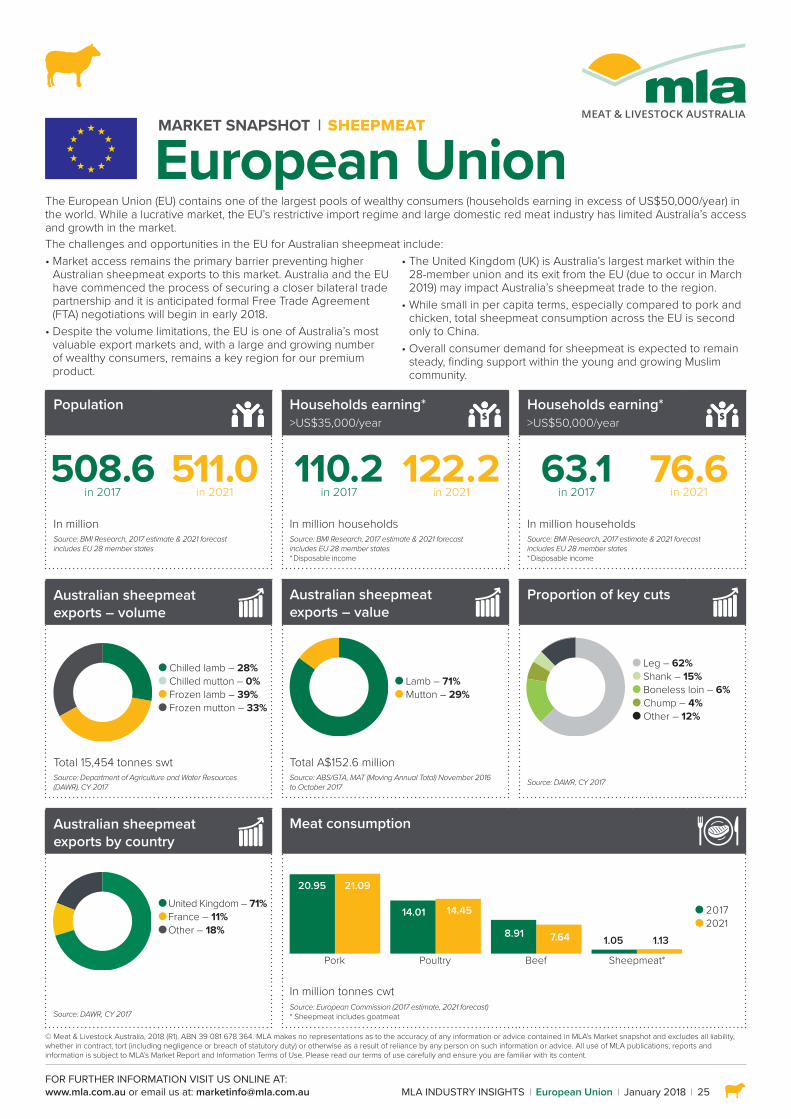
FOR FURTHER INFORMATION VISIT US ONLINE AT:www.mla.com.au or email us at: [email protected]
© Meat & Livestock Australia, 2018 (R1). ABN 39 081 678 364. MLA makes no representations as to the accuracy of any information or advice contained in MLA’s Market snapshot and excludes all liability, whether in contract, tort (including negligence or breach of statutory duty) or otherwise as a result of reliance by any person on such information or advice. All use of MLA publications, reports and information is subject to MLA’s Market Report and Information Terms of Use. Please read our terms of use carefully and ensure you are familiar with its content.
MLA INDUSTRY INSIGHTS European Union January 2018 25
MARKET SNAPSHOT SHEEPMEAT
European Union
Population
Households earning* >US$35,000/year
Households earning* >US$50,000/year
508.6 in 2017
511.0 in 2021
110.2 in 2017
122.2 in 2021
63.1 in 2017
76.6 in 2021
In million In million households In million householdsSource: BMI Research, 2017 estimate & 2021 forecast includes EU 28 member states
Source: BMI Research, 2017 estimate & 2021 forecast includes EU 28 member states* Disposable income
Source: BMI Research, 2017 estimate & 2021 forecast includes EU 28 member states* Disposable income
Australian sheepmeat exports – volume
Australian sheepmeat exports – value
Proportion of key cuts
Chilled lamb – 28% Chilled mutton – 0% Frozen lamb – 39% Frozen mutton – 33%
Lamb – 71% Mutton – 29%
Leg – 62% Shank – 15% Boneless loin – 6% Chump – 4% Other – 12%
Total 15,454 tonnes swt Total A$152.6 millionSource: Department of Agriculture and Water Resources (DAWR), CY 2017
Source: ABS/GTA, MAT (Moving Annual Total) November 2016 to October 2017 Source: DAWR, CY 2017
Australian sheepmeat exports by country
Meat consumption
United Kingdom – 71% France – 11% Other – 18%
Pork
20.95 21.09
14.01 14.45
8.91 7.64 1.05 1.13
Poultry Beef Sheepmeat*
2017 2021
Source: DAWR, CY 2017
In million tonnes cwtSource: European Commission (2017 estimate, 2021 forecast) * Sheepmeat includes goatmeat
The European Union (EU) contains one of the largest pools of wealthy consumers (households earning in excess of US$50,000/year) in the world. While a lucrative market, the EU’s restrictive import regime and large domestic red meat industry has limited Australia’s access and growth in the market. The challenges and opportunities in the EU for Australian sheepmeat include:• Market access remains the primary barrier preventing higher
Australian sheepmeat exports to this market. Australia and the EU have commenced the process of securing a closer bilateral trade partnership and it is anticipated formal Free Trade Agreement (FTA) negotiations will begin in early 2018.
• Despite the volume limitations, the EU is one of Australia’s most valuable export markets and, with a large and growing number of wealthy consumers, remains a key region for our premium product.
• The United Kingdom (UK) is Australia’s largest market within the 28-member union and its exit from the EU (due to occur in March 2019) may impact Australia’s sheepmeat trade to the region.
• While small in per capita terms, especially compared to pork and chicken, total sheepmeat consumption across the EU is second only to China.
• Overall consumer demand for sheepmeat is expected to remain steady, finding support within the young and growing Muslim community.
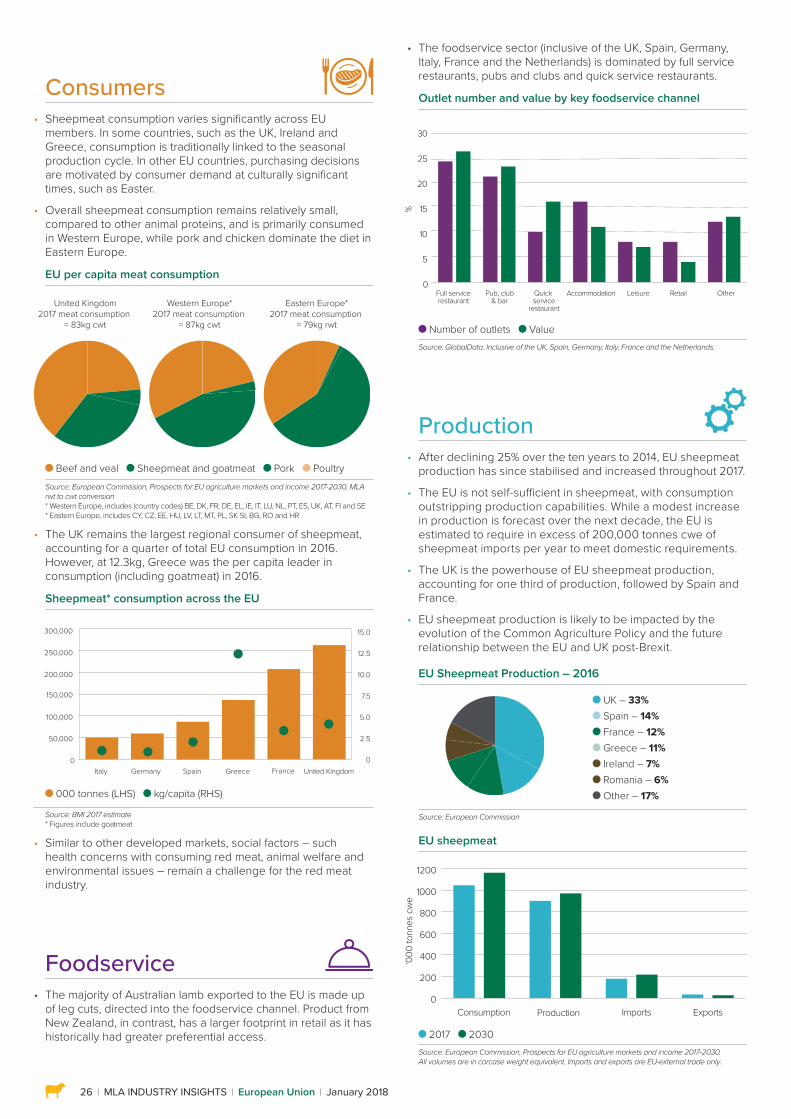
26 MLA INDUSTRY INSIGHTS European Union January 2018
Consumers • Sheepmeat consumption varies significantly across EU
members. In some countries, such as the UK, Ireland and Greece, consumption is traditionally linked to the seasonal production cycle. In other EU countries, purchasing decisions are motivated by consumer demand at culturally significant times, such as Easter.
• Overall sheepmeat consumption remains relatively small, compared to other animal proteins, and is primarily consumed in Western Europe, while pork and chicken dominate the diet in Eastern Europe.
EU per capita meat consumption
United Kingdom2017 meat consumption
= 83kg cwt
Western Europe*2017 meat consumption
= 87kg cwt
Eastern Europe*2017 meat consumption
= 79kg rwt
Beef and veal Sheepmeat and goatmeat Pork Poultry Source: European Commission, Prospects for EU agriculture markets and income 2017-2030, MLA rwt to cwt conversion* Western Europe, includes (country codes) BE, DK, FR, DE, EL, IE, IT, LU, NL, PT, ES, UK, AT, FI and SE* Eastern Europe, includes CY, CZ, EE, HU, LV, LT, MT, PL, SK SI, BG, RO and HR
• The UK remains the largest regional consumer of sheepmeat, accounting for a quarter of total EU consumption in 2016. However, at 12.3kg, Greece was the per capita leader in consumption (including goatmeat) in 2016.
Sheepmeat* consumption across the EU
0
2.5
5.0
7.5
10.0
12.5
15.0
0
50,000
100,000
150,000
200,000
250,000
300,000
FranceGermanyItaly GreeceSpain United Kingdom
000 tonnes (LHS) kg/capita (RHS)
Source: BMI 2017 estimate * Figures include goatmeat
• Similar to other developed markets, social factors – such health concerns with consuming red meat, animal welfare and environmental issues – remain a challenge for the red meat industry.
Production • After declining 25% over the ten years to 2014, EU sheepmeat
production has since stabilised and increased throughout 2017.
• The EU is not self-sufficient in sheepmeat, with consumption outstripping production capabilities. While a modest increase in production is forecast over the next decade, the EU is estimated to require in excess of 200,000 tonnes cwe of sheepmeat imports per year to meet domestic requirements.
• The UK is the powerhouse of EU sheepmeat production, accounting for one third of production, followed by Spain and France.
• EU sheepmeat production is likely to be impacted by the evolution of the Common Agriculture Policy and the future relationship between the EU and UK post-Brexit.
EU Sheepmeat Production – 2016
UK – 33% Spain – 14% France – 12% Greece – 11% Ireland – 7% Romania – 6% Other – 17%
Source: European Commission
EU sheepmeat
2017 2030Source: European Commission, Prospects for EU agriculture markets and income 2017-2030. All volumes are in carcase weight equivalent. Imports and exports are EU-external trade only.
Consumption Production Imports Exports
‘000
tonn
es c
we
0
200
400
600
800
1000
1200
Foodservice • The majority of Australian lamb exported to the EU is made up
of leg cuts, directed into the foodservice channel. Product from New Zealand, in contrast, has a larger footprint in retail as it has historically had greater preferential access.
• The foodservice sector (inclusive of the UK, Spain, Germany, Italy, France and the Netherlands) is dominated by full service restaurants, pubs and clubs and quick service restaurants.
Outlet number and value by key foodservice channel
Number of outlets ValueSource: GlobalData. Inclusive of the UK, Spain, Germany, Italy, France and the Netherlands.
0
5
10
15
20
25
30
%
Full servicerestaurant
Pub, club& bar
Quick service
restaurant
Accommodation RetailLeisure Other
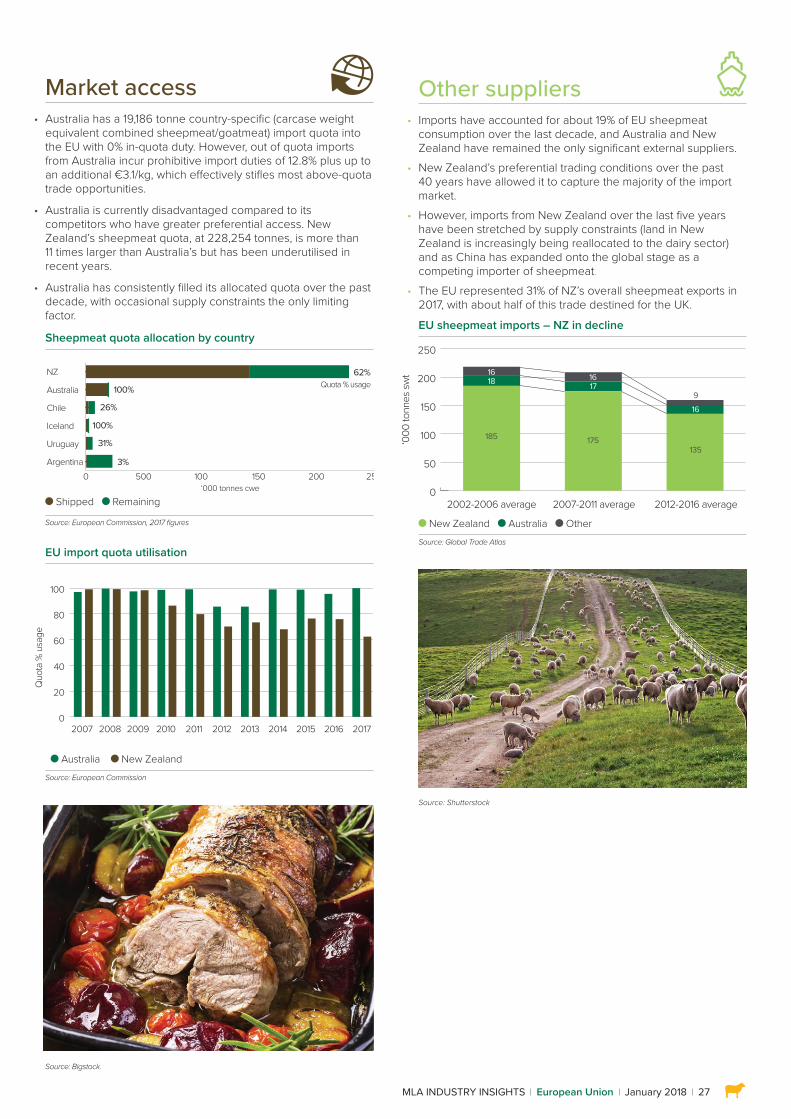
MLA INDUSTRY INSIGHTS European Union January 2018 27
Market access • Australia has a 19,186 tonne country-specific (carcase weight
equivalent combined sheepmeat/goatmeat) import quota into the EU with 0% in-quota duty. However, out of quota imports from Australia incur prohibitive import duties of 12.8% plus up to an additional €3.1/kg, which effectively stifles most above-quota trade opportunities.
• Australia is currently disadvantaged compared to its competitors who have greater preferential access. New Zealand’s sheepmeat quota, at 228,254 tonnes, is more than 11 times larger than Australia’s but has been underutilised in recent years.
• Australia has consistently filled its allocated quota over the past decade, with occasional supply constraints the only limiting factor.
Sheepmeat quota allocation by country
Shipped Remaining
Source: European Commission, 2017 figures
EU import quota utilisation
Australia New ZealandSource: European Commission
Source: Bigstock.
0 500 100 150 200 250
NZ
Australia
Chile
Iceland
Uruguay
Argentina
Quota % usage
‘000 tonnes cwe
62%
100%
3%
26%
100%
31%
2007 2008 2009 2010 2011 2012 2013 2014 2015 2016 2017
Quo
ta %
usa
ge
0
20
40
60
80
100
Other suppliers • Imports have accounted for about 19% of EU sheepmeat
consumption over the last decade, and Australia and New Zealand have remained the only significant external suppliers.
• New Zealand’s preferential trading conditions over the past 40 years have allowed it to capture the majority of the import market.
• However, imports from New Zealand over the last five years have been stretched by supply constraints (land in New Zealand is increasingly being reallocated to the dairy sector) and as China has expanded onto the global stage as a competing importer of sheepmeat.
• The EU represented 31% of NZ’s overall sheepmeat exports in 2017, with about half of this trade destined for the UK.
EU sheepmeat imports – NZ in decline
New Zealand Australia OtherSource: Global Trade Atlas
Source: Shutterstock
2002-2006 average 2007-2011 average 2012-2016 average
‘000
tonn
es s
wt
0
50
100
150
200
250
1618
185
1617
175
916
135
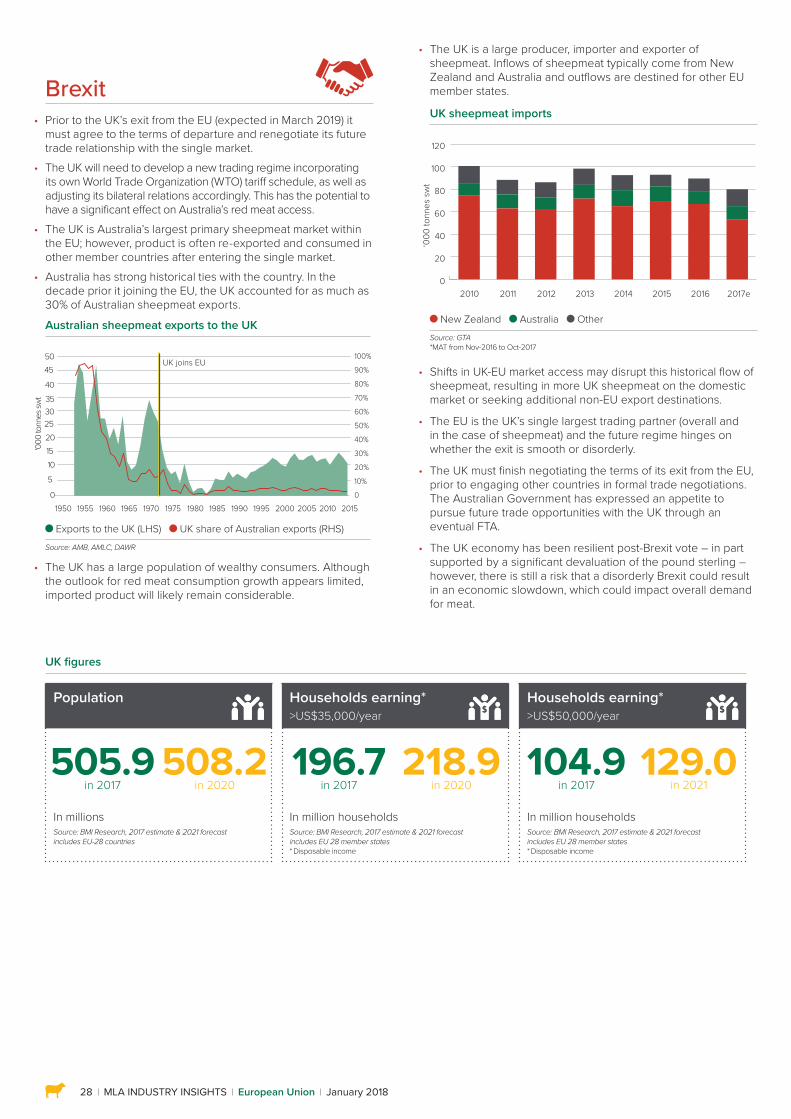
28 MLA INDUSTRY INSIGHTS European Union January 2018
• The UK is a large producer, importer and exporter of sheepmeat. Inflows of sheepmeat typically come from New Zealand and Australia and outflows are destined for other EU member states.
UK sheepmeat imports
New Zealand Australia OtherSource: GTA*MAT from Nov-2016 to Oct-2017
• Shifts in UK-EU market access may disrupt this historical flow of sheepmeat, resulting in more UK sheepmeat on the domestic market or seeking additional non-EU export destinations.
• The EU is the UK’s single largest trading partner (overall and in the case of sheepmeat) and the future regime hinges on whether the exit is smooth or disorderly.
• The UK must finish negotiating the terms of its exit from the EU, prior to engaging other countries in formal trade negotiations. The Australian Government has expressed an appetite to pursue future trade opportunities with the UK through an eventual FTA.
• The UK economy has been resilient post-Brexit vote – in part supported by a significant devaluation of the pound sterling – however, there is still a risk that a disorderly Brexit could result in an economic slowdown, which could impact overall demand for meat.
‘000
tonn
es s
wt
2010 2011 2012 20142013 2015 2016 2017e0
20
40
60
80
100
120
UK figures
Population
Households earning* >US$35,000/year
Households earning* >US$50,000/year
505.9 in 2017
508.2 in 2020
196.7 in 2017
218.9 in 2020
104.9 in 2017
129.0 in 2021
In millions In million households In million householdsSource: BMI Research, 2017 estimate & 2021 forecast includes EU-28 countries
Source: BMI Research, 2017 estimate & 2021 forecast includes EU 28 member states* Disposable income
Source: BMI Research, 2017 estimate & 2021 forecast includes EU 28 member states* Disposable income
Brexit • Prior to the UK’s exit from the EU (expected in March 2019) it
must agree to the terms of departure and renegotiate its future trade relationship with the single market.
• The UK will need to develop a new trading regime incorporating its own World Trade Organization (WTO) tariff schedule, as well as adjusting its bilateral relations accordingly. This has the potential to have a significant effect on Australia’s red meat access.
• The UK is Australia’s largest primary sheepmeat market within the EU; however, product is often re-exported and consumed in other member countries after entering the single market.
• Australia has strong historical ties with the country. In the decade prior it joining the EU, the UK accounted for as much as 30% of Australian sheepmeat exports.
Australian sheepmeat exports to the UK
Exports to the UK (LHS) UK share of Australian exports (RHS)Source: AMB, AMLC, DAWR
• The UK has a large population of wealthy consumers. Although the outlook for red meat consumption growth appears limited, imported product will likely remain considerable.
0
5
10152025303540
4550
'000
tonn
es sw
t
1950 1955 1960 1965 1970 1975 1980 1985 1990 1995 2000 2005 2010 20150
10%
20%
30%
40%
50%
60%
70%
80%
90%
100%UK joins EU
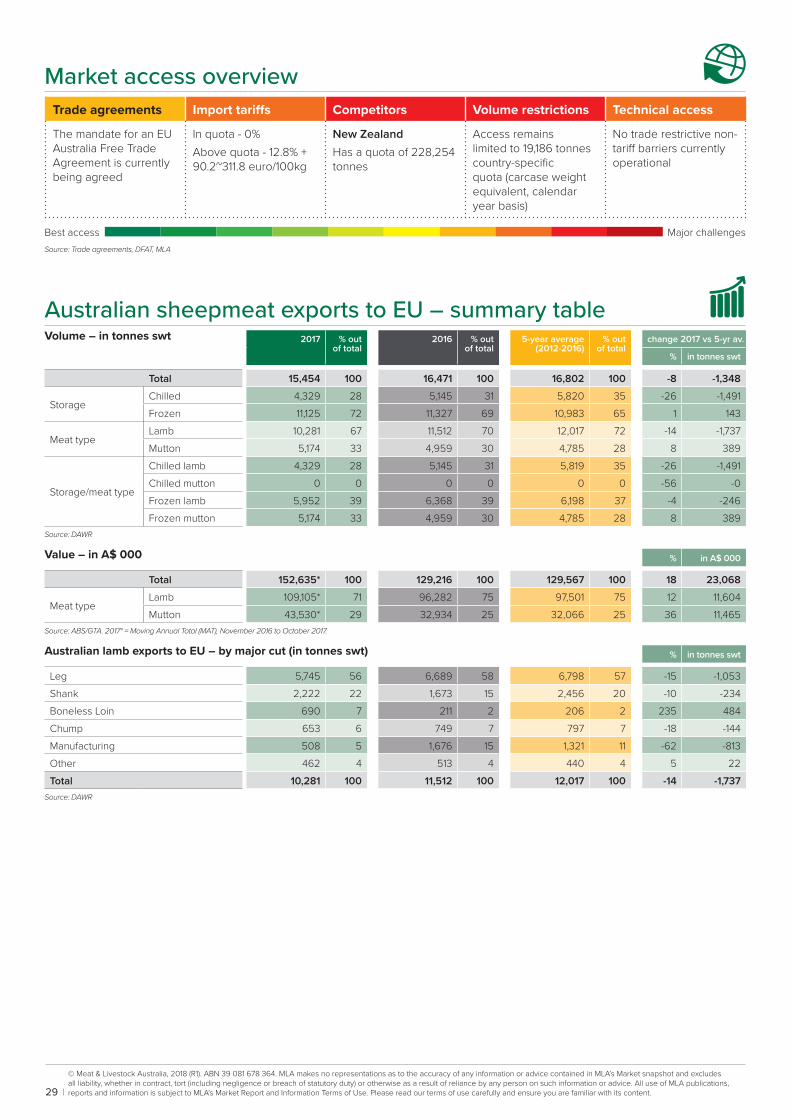
© Meat & Livestock Australia, 2018 (R1). ABN 39 081 678 364. MLA makes no representations as to the accuracy of any information or advice contained in MLA’s Market snapshot and excludes all liability, whether in contract, tort (including negligence or breach of statutory duty) or otherwise as a result of reliance by any person on such information or advice. All use of MLA publications, reports and information is subject to MLA’s Market Report and Information Terms of Use. Please read our terms of use carefully and ensure you are familiar with its content.29
Market access overview Trade agreements Import tariffs Competitors Volume restrictions Technical access
The mandate for an EU Australia Free Trade Agreement is currently being agreed
In quota - 0%Above quota - 12.8% + 90.2~311.8 euro/100kg
New ZealandHas a quota of 228,254 tonnes
Access remains limited to 19,186 tonnes country-specific quota (carcase weight equivalent, calendar year basis)
No trade restrictive non-tariff barriers currently operational
Best access Major challengesSource: Trade agreements, DFAT, MLA
Australian sheepmeat exports to EU – summary table Volume – in tonnes swt 2017 % out
of total2016 % out
of total5-year average
(2012-2016)% out
of totalchange 2017 vs 5-yr av.
% in tonnes swt
Total 15,454 100 16,471 100 16,802 100 -8 -1,348
StorageChilled 4,329 28 5,145 31 5,820 35 -26 -1,491 Frozen 11,125 72 11,327 69 10,983 65 1 143
Meat typeLamb 10,281 67 11,512 70 12,017 72 -14 -1,737 Mutton 5,174 33 4,959 30 4,785 28 8 389
Storage/meat type
Chilled lamb 4,329 28 5,145 31 5,819 35 -26 -1,491 Chilled mutton 0 0 0 0 0 0 -56 -0 Frozen lamb 5,952 39 6,368 39 6,198 37 -4 -246 Frozen mutton 5,174 33 4,959 30 4,785 28 8 389
Source: DAWR
Value – in A$ 000 % in A$ 000
Total 152,635* 100 129,216 100 129,567 100 18 23,068
Meat typeLamb 109,105* 71 96,282 75 97,501 75 12 11,604 Mutton 43,530* 29 32,934 25 32,066 25 36 11,465
Source: ABS/GTA. 2017* = Moving Annual Total (MAT), November 2016 to October 2017.
Australian lamb exports to EU – by major cut (in tonnes swt) % in tonnes swt
Leg 5,745 56 6,689 58 6,798 57 -15 -1,053 Shank 2,222 22 1,673 15 2,456 20 -10 -234 Boneless Loin 690 7 211 2 206 2 235 484 Chump 653 6 749 7 797 7 -18 -144 Manufacturing 508 5 1,676 15 1,321 11 -62 -813 Other 462 4 513 4 440 4 5 22 Total 10,281 100 11,512 100 12,017 100 -14 -1,737
Source: DAWR
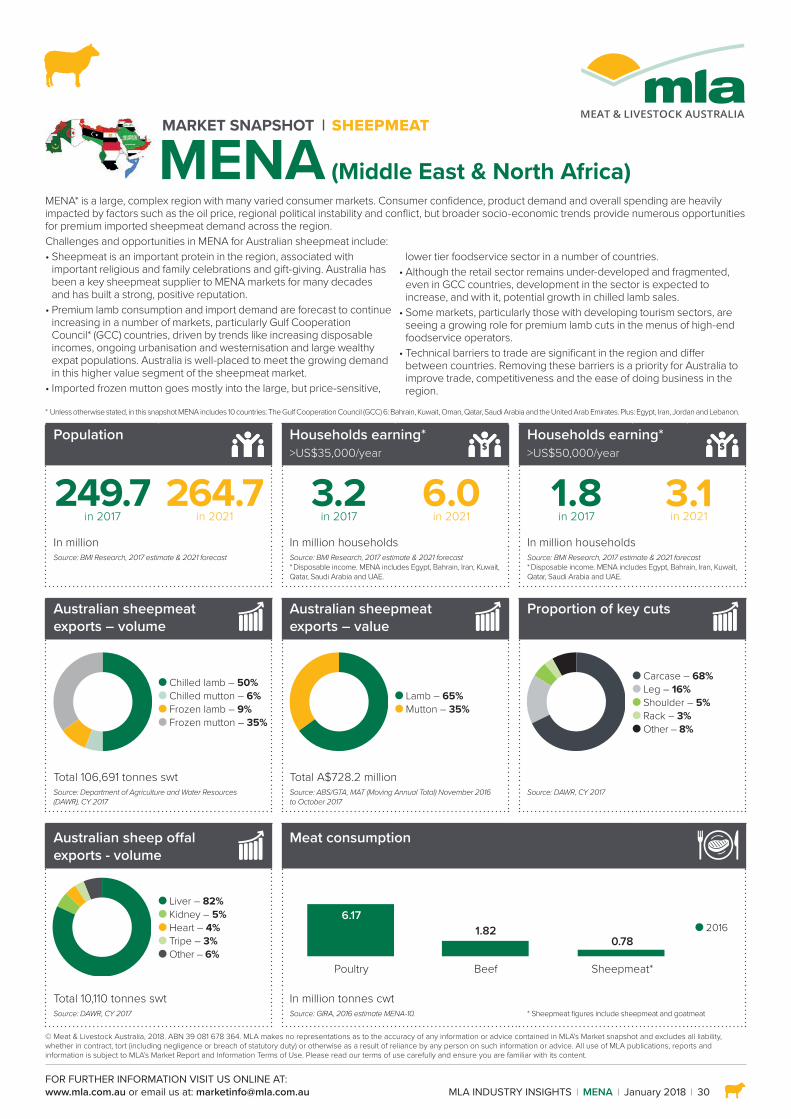
FOR FURTHER INFORMATION VISIT US ONLINE AT:www.mla.com.au or email us at: [email protected]
© Meat & Livestock Australia, 2018. ABN 39 081 678 364. MLA makes no representations as to the accuracy of any information or advice contained in MLA’s Market snapshot and excludes all liability, whether in contract, tort (including negligence or breach of statutory duty) or otherwise as a result of reliance by any person on such information or advice. All use of MLA publications, reports and information is subject to MLA’s Market Report and Information Terms of Use. Please read our terms of use carefully and ensure you are familiar with its content.
MLA INDUSTRY INSIGHTS MENA January 2018 30
MARKET SNAPSHOT SHEEPMEAT
MENA (Middle East & North Africa)MENA* is a large, complex region with many varied consumer markets. Consumer confidence, product demand and overall spending are heavily impacted by factors such as the oil price, regional political instability and conflict, but broader socio-economic trends provide numerous opportunities for premium imported sheepmeat demand across the region. Challenges and opportunities in MENA for Australian sheepmeat include:• Sheepmeat is an important protein in the region, associated with
important religious and family celebrations and gift-giving. Australia has been a key sheepmeat supplier to MENA markets for many decades and has built a strong, positive reputation.
• Premium lamb consumption and import demand are forecast to continue increasing in a number of markets, particularly Gulf Cooperation Council* (GCC) countries, driven by trends like increasing disposable incomes, ongoing urbanisation and westernisation and large wealthy expat populations. Australia is well-placed to meet the growing demand in this higher value segment of the sheepmeat market.
• Imported frozen mutton goes mostly into the large, but price-sensitive,
lower tier foodservice sector in a number of countries. • Although the retail sector remains under-developed and fragmented,
even in GCC countries, development in the sector is expected to increase, and with it, potential growth in chilled lamb sales.
• Some markets, particularly those with developing tourism sectors, are seeing a growing role for premium lamb cuts in the menus of high-end foodservice operators.
• Technical barriers to trade are significant in the region and differ between countries. Removing these barriers is a priority for Australia to improve trade, competitiveness and the ease of doing business in the region.
* Unless otherwise stated, in this snapshot MENA includes 10 countries: The Gulf Cooperation Council (GCC) 6: Bahrain, Kuwait, Oman, Qatar, Saudi Arabia and the United Arab Emirates. Plus: Egypt, Iran, Jordan and Lebanon.
Population
Households earning* >US$35,000/year
Households earning* >US$50,000/year
249.7 in 2017
264.7 in 2021
3.2 in 2017
6.0 in 2021
1.8 in 2017
3.1 in 2021
In million In million households In million householdsSource: BMI Research, 2017 estimate & 2021 forecast Source: BMI Research, 2017 estimate & 2021 forecast
* Disposable income. MENA includes Egypt, Bahrain, Iran, Kuwait, Qatar, Saudi Arabia and UAE.
Source: BMI Research, 2017 estimate & 2021 forecast* Disposable income. MENA includes Egypt, Bahrain, Iran, Kuwait, Qatar, Saudi Arabia and UAE.
Australian sheepmeat exports – volume
Australian sheepmeat exports – value
Proportion of key cuts
Chilled lamb – 50% Chilled mutton – 6% Frozen lamb – 9% Frozen mutton – 35%
Lamb – 65% Mutton – 35%
Carcase – 68% Leg – 16% Shoulder – 5% Rack – 3% Other – 8%
Total 106,691 tonnes swt Total A$728.2 millionSource: Department of Agriculture and Water Resources (DAWR), CY 2017
Source: ABS/GTA, MAT (Moving Annual Total) November 2016 to October 2017
Source: DAWR, CY 2017
Australian sheep offal exports - volume
Meat consumption
Liver – 82% Kidney – 5% Heart – 4% Tripe – 3% Other – 6%
Poultry Beef Sheepmeat*
6.171.82
0.78 2016
Total 10,110 tonnes swt In million tonnes cwtSource: DAWR, CY 2017 Source: GIRA, 2016 estimate MENA-10. * Sheepmeat figures include sheepmeat and goatmeat
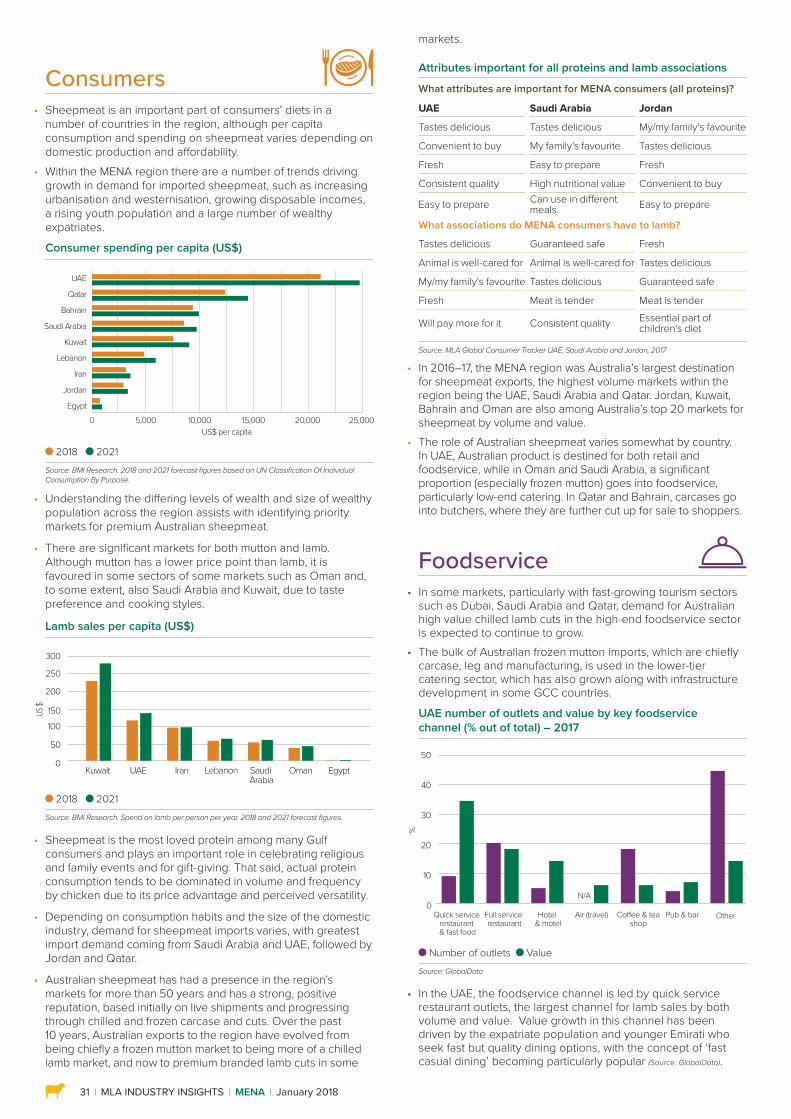
31 MLA INDUSTRY INSIGHTS MENA January 2018
Foodservice • In some markets, particularly with fast-growing tourism sectors
such as Dubai, Saudi Arabia and Qatar, demand for Australian high value chilled lamb cuts in the high-end foodservice sector is expected to continue to grow.
• The bulk of Australian frozen mutton imports, which are chiefly carcase, leg and manufacturing, is used in the lower-tier catering sector, which has also grown along with infrastructure development in some GCC countries.
UAE number of outlets and value by key foodservice channel (% out of total) – 2017
0
10
20
30
40
50
%
Full service restaurant
Hotel & motel
Air (travel)
N/A
Quick service restaurant & fast food
Pub & barCo�ee & teashop
Other
Number of outlets ValueSource: GlobalData
• In the UAE, the foodservice channel is led by quick service restaurant outlets, the largest channel for lamb sales by both volume and value. Value growth in this channel has been driven by the expatriate population and younger Emirati who seek fast but quality dining options, with the concept of ‘fast casual dining’ becoming particularly popular (Source: GlobalData).
Consumers • Sheepmeat is an important part of consumers’ diets in a
number of countries in the region, although per capita consumption and spending on sheepmeat varies depending on domestic production and affordability.
• Within the MENA region there are a number of trends driving growth in demand for imported sheepmeat, such as increasing urbanisation and westernisation, growing disposable incomes, a rising youth population and a large number of wealthy expatriates.
Consumer spending per capita (US$)
UAE
Qatar
Bahrain
Saudi Arabia
Kuwait
Lebanon
Iran
Jordan
Egypt0 5,000 10,000 15,000 20,000 25,000
US$ per capita
2018 2021 Source: BMI Research. 2018 and 2021 forecast figures based on UN Classification Of Individual Consumption By Purpose.
• Understanding the differing levels of wealth and size of wealthy population across the region assists with identifying priority markets for premium Australian sheepmeat.
• There are significant markets for both mutton and lamb. Although mutton has a lower price point than lamb, it is favoured in some sectors of some markets such as Oman and, to some extent, also Saudi Arabia and Kuwait, due to taste preference and cooking styles.
Lamb sales per capita (US$)
2018 2021Source: BMI Research. Spend on lamb per person per year. 2018 and 2021 forecast figures.
• Sheepmeat is the most loved protein among many Gulf consumers and plays an important role in celebrating religious and family events and for gift-giving. That said, actual protein consumption tends to be dominated in volume and frequency by chicken due to its price advantage and perceived versatility.
• Depending on consumption habits and the size of the domestic industry, demand for sheepmeat imports varies, with greatest import demand coming from Saudi Arabia and UAE, followed by Jordan and Qatar.
• Australian sheepmeat has had a presence in the region’s markets for more than 50 years and has a strong, positive reputation, based initially on live shipments and progressing through chilled and frozen carcase and cuts. Over the past 10 years, Australian exports to the region have evolved from being chiefly a frozen mutton market to being more of a chilled lamb market, and now to premium branded lamb cuts in some
US $
Lebanon UAEKuwait Saudi Arabia
Oman EgyptIran0
50
100
150
200
250
300
markets.
Attributes important for all proteins and lamb associations
What attributes are important for MENA consumers (all proteins)?
UAE Saudi Arabia Jordan
Tastes delicious Tastes delicious My/my family's favourite
Convenient to buy My family's favourite Tastes delicious
Fresh Easy to prepare Fresh
Consistent quality High nutritional value Convenient to buy
Easy to prepare Can use in different meals Easy to prepare
What associations do MENA consumers have to lamb?
Tastes delicious Guaranteed safe Fresh
Animal is well-cared for Animal is well-cared for Tastes delicious
My/my family's favourite Tastes delicious Guaranteed safe
Fresh Meat is tender Meat is tender
Will pay more for it Consistent quality Essential part of children's diet
Source: MLA Global Consumer Tracker UAE, Saudi Arabia and Jordan, 2017
• In 2016–17, the MENA region was Australia’s largest destination for sheepmeat exports, the highest volume markets within the region being the UAE, Saudi Arabia and Qatar. Jordan, Kuwait, Bahrain and Oman are also among Australia’s top 20 markets for sheepmeat by volume and value.
• The role of Australian sheepmeat varies somewhat by country. In UAE, Australian product is destined for both retail and foodservice, while in Oman and Saudi Arabia, a significant proportion (especially frozen mutton) goes into foodservice, particularly low-end catering. In Qatar and Bahrain, carcases go into butchers, where they are further cut up for sale to shoppers.
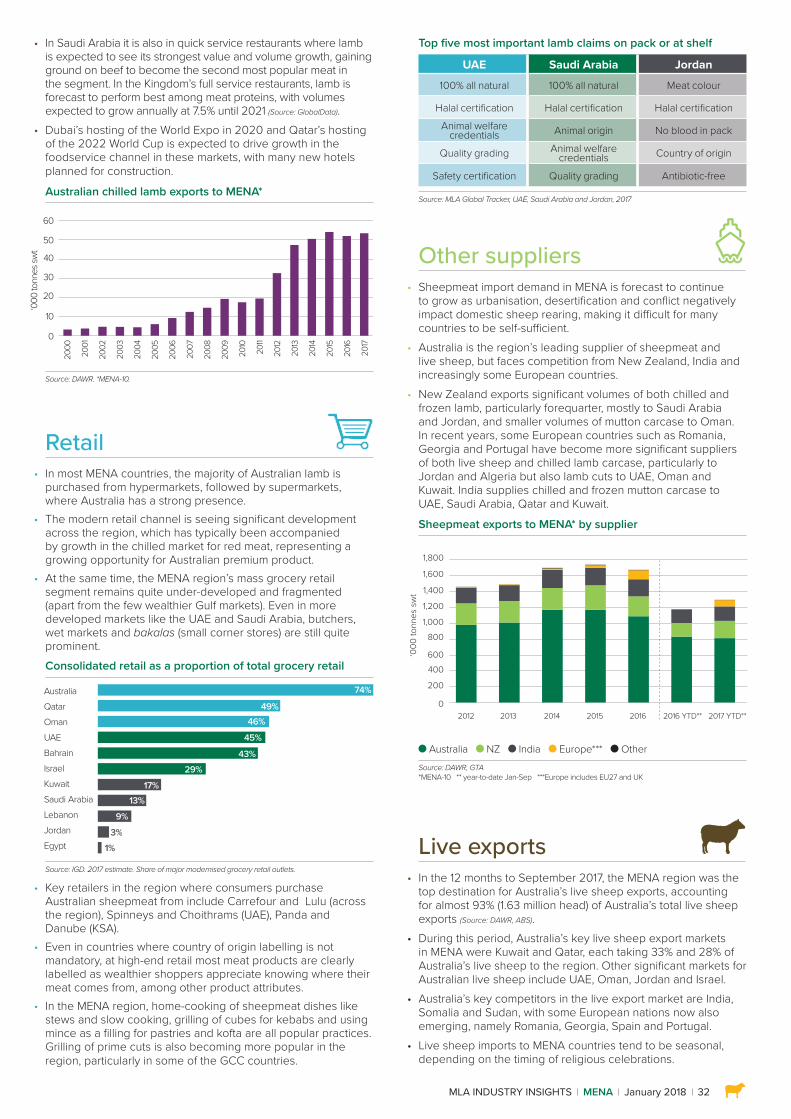
MLA INDUSTRY INSIGHTS MENA January 2018 32
Retail • In most MENA countries, the majority of Australian lamb is
purchased from hypermarkets, followed by supermarkets, where Australia has a strong presence.
• The modern retail channel is seeing significant development across the region, which has typically been accompanied by growth in the chilled market for red meat, representing a growing opportunity for Australian premium product.
• At the same time, the MENA region’s mass grocery retail segment remains quite under-developed and fragmented (apart from the few wealthier Gulf markets). Even in more developed markets like the UAE and Saudi Arabia, butchers, wet markets and bakalas (small corner stores) are still quite prominent.Consolidated retail as a proportion of total grocery retail
Source: IGD. 2017 estimate. Share of major modernised grocery retail outlets.
• Key retailers in the region where consumers purchase Australian sheepmeat from include Carrefour and Lulu (across the region), Spinneys and Choithrams (UAE), Panda and Danube (KSA).
• Even in countries where country of origin labelling is not mandatory, at high-end retail most meat products are clearly labelled as wealthier shoppers appreciate knowing where their meat comes from, among other product attributes.
• In the MENA region, home-cooking of sheepmeat dishes like stews and slow cooking, grilling of cubes for kebabs and using mince as a filling for pastries and kofta are all popular practices. Grilling of prime cuts is also becoming more popular in the region, particularly in some of the GCC countries.
AustraliaQatarOmanUAEBahrainIsraelKuwaitSaudi ArabiaLebanonJordanEgypt
74%
49%46%
45%
43%29%
17%13%
9%
9%3%1%
Other suppliers • Sheepmeat import demand in MENA is forecast to continue
to grow as urbanisation, desertification and conflict negatively impact domestic sheep rearing, making it difficult for many countries to be self-sufficient.
• Australia is the region’s leading supplier of sheepmeat and live sheep, but faces competition from New Zealand, India and increasingly some European countries.
• New Zealand exports significant volumes of both chilled and frozen lamb, particularly forequarter, mostly to Saudi Arabia and Jordan, and smaller volumes of mutton carcase to Oman. In recent years, some European countries such as Romania, Georgia and Portugal have become more significant suppliers of both live sheep and chilled lamb carcase, particularly to Jordan and Algeria but also lamb cuts to UAE, Oman and Kuwait. India supplies chilled and frozen mutton carcase to UAE, Saudi Arabia, Qatar and Kuwait.
Sheepmeat exports to MENA* by supplier
‘000
tonn
es s
wt
2012 2013 2014 2015 2016 2016 YTD** 2017 YTD**0
200
600400
800
1,000
1,200
1,400
1,600
1,800
Australia NZ India Europe*** OtherSource: DAWR, GTA *MENA-10 ** year-to-date Jan-Sep ***Europe includes EU27 and UK
Live exports • In the 12 months to September 2017, the MENA region was the
top destination for Australia’s live sheep exports, accounting for almost 93% (1.63 million head) of Australia’s total live sheep exports (Source: DAWR, ABS).
• During this period, Australia’s key live sheep export markets in MENA were Kuwait and Qatar, each taking 33% and 28% of Australia’s live sheep to the region. Other significant markets for Australian live sheep include UAE, Oman, Jordan and Israel.
• Australia’s key competitors in the live export market are India, Somalia and Sudan, with some European nations now also emerging, namely Romania, Georgia, Spain and Portugal.
• Live sheep imports to MENA countries tend to be seasonal, depending on the timing of religious celebrations.
• In Saudi Arabia it is also in quick service restaurants where lamb is expected to see its strongest value and volume growth, gaining ground on beef to become the second most popular meat in the segment. In the Kingdom’s full service restaurants, lamb is forecast to perform best among meat proteins, with volumes expected to grow annually at 7.5% until 2021 (Source: GlobalData).
• Dubai’s hosting of the World Expo in 2020 and Qatar’s hosting of the 2022 World Cup is expected to drive growth in the foodservice channel in these markets, with many new hotels planned for construction.
Australian chilled lamb exports to MENA*
Source: DAWR. *MENA-10.
2000
2001
2002
2003
2004
2005
2006
2007
2008
2009
2010
2011
2012
2013
2014
2015
2016
2017
‘000
tonn
es sw
t
0
10
20
30
40
50
60
Top five most important lamb claims on pack or at shelf
UAE Saudi Arabia Jordan
100% all natural 100% all natural Meat colour
Halal certification Halal certification Halal certification
Animal welfare credentials Animal origin No blood in pack
Quality grading Animal welfare credentials Country of origin
Safety certification Quality grading Antibiotic-free
Source: MLA Global Tracker, UAE, Saudi Arabia and Jordan, 2017
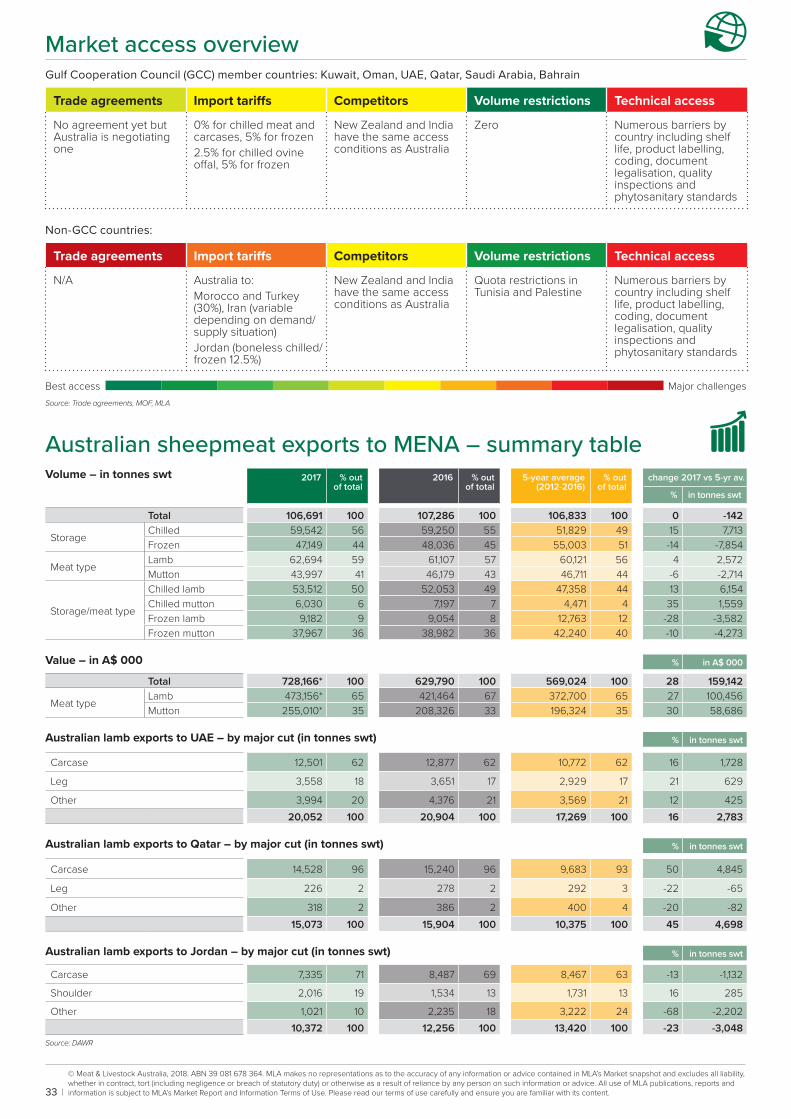
© Meat & Livestock Australia, 2018. ABN 39 081 678 364. MLA makes no representations as to the accuracy of any information or advice contained in MLA’s Market snapshot and excludes all liability, whether in contract, tort (including negligence or breach of statutory duty) or otherwise as a result of reliance by any person on such information or advice. All use of MLA publications, reports and information is subject to MLA’s Market Report and Information Terms of Use. Please read our terms of use carefully and ensure you are familiar with its content.33
Market access overview Gulf Cooperation Council (GCC) member countries: Kuwait, Oman, UAE, Qatar, Saudi Arabia, Bahrain
Trade agreements Import tariffs Competitors Volume restrictions Technical access
No agreement yet but Australia is negotiating one
0% for chilled meat and carcases, 5% for frozen2.5% for chilled ovine offal, 5% for frozen
New Zealand and India have the same access conditions as Australia
Zero Numerous barriers by country including shelf life, product labelling, coding, document legalisation, quality inspections and phytosanitary standards
Non-GCC countries:
Trade agreements Import tariffs Competitors Volume restrictions Technical access
N/A Australia to:Morocco and Turkey (30%), Iran (variable depending on demand/supply situation)Jordan (boneless chilled/frozen 12.5%)
New Zealand and India have the same access conditions as Australia
Quota restrictions in Tunisia and Palestine
Numerous barriers by country including shelf life, product labelling, coding, document legalisation, quality inspections and phytosanitary standards
Best access Major challengesSource: Trade agreements, MOF, MLA
Australian sheepmeat exports to MENA – summary table Volume – in tonnes swt 2017 % out
of total2016 % out
of total5-year average
(2012-2016)% out
of totalchange 2017 vs 5-yr av.
% in tonnes swt
Total 106,691 100 107,286 100 106,833 100 0 -142
StorageChilled 59,542 56 59,250 55 51,829 49 15 7,713 Frozen 47,149 44 48,036 45 55,003 51 -14 -7,854
Meat typeLamb 62,694 59 61,107 57 60,121 56 4 2,572 Mutton 43,997 41 46,179 43 46,711 44 -6 -2,714
Storage/meat type
Chilled lamb 53,512 50 52,053 49 47,358 44 13 6,154 Chilled mutton 6,030 6 7,197 7 4,471 4 35 1,559 Frozen lamb 9,182 9 9,054 8 12,763 12 -28 -3,582 Frozen mutton 37,967 36 38,982 36 42,240 40 -10 -4,273
Value – in A$ 000 % in A$ 000
Total 728,166* 100 629,790 100 569,024 100 28 159,142
Meat typeLamb 473,156* 65 421,464 67 372,700 65 27 100,456 Mutton 255,010* 35 208,326 33 196,324 35 30 58,686
Australian lamb exports to UAE – by major cut (in tonnes swt) % in tonnes swt
Carcase 12,501 62 12,877 62 10,772 62 16 1,728
Leg 3,558 18 3,651 17 2,929 17 21 629
Other 3,994 20 4,376 21 3,569 21 12 425 20,052 100 20,904 100 17,269 100 16 2,783
Australian lamb exports to Qatar – by major cut (in tonnes swt) % in tonnes swt
Carcase 14,528 96 15,240 96 9,683 93 50 4,845
Leg 226 2 278 2 292 3 -22 -65
Other 318 2 386 2 400 4 -20 -82 15,073 100 15,904 100 10,375 100 45 4,698
Australian lamb exports to Jordan – by major cut (in tonnes swt) % in tonnes swt
Carcase 7,335 71 8,487 69 8,467 63 -13 -1,132
Shoulder 2,016 19 1,534 13 1,731 13 16 285
Other 1,021 10 2,235 18 3,222 24 -68 -2,202 10,372 100 12,256 100 13,420 100 -23 -3,048
Source: DAWR