Embed Size (px)
Citation preview

GLOBAL MARKET LEADERIN CHEMICAL DISTRIBUTION
A N N U A L R E P O R T 2 0 1 5

H O U S T O NT E X A S
R E A D I N G P E N N S Y LVA N I A
L A T I N A M E R I C A
In Latin America, Brenntag is the only large and trans-regional
chemical distributor which covers the whole continent with
its broad portfolio of chemical products and services. Our
customers are served by over 1,500 employees from about
70 locations in the 20 most important Latin American countries.
in EUR m 2015 2014
External sales 925.8 864.0
Operating gross profit 201.2 169.5
Operating expenses – 136.5 – 122.7
Operating EBITDA 64.7 46.8
S H A R E O F S A L E S
N O R T H A M E R I C A
Brenntag is one of the market leaders in North America. With
about 180 distribution centres, we operate in all important
industrial areas in the USA. More than 4,000 employees ensure
that our customers in the region have all the products and
services they need.
in EUR m 2015 2014
External sales 3,600.6 3,332.0
Operating gross profit 942.6 802.2
Operating expenses – 577.0 – 478.6
Operating EBITDA 365.6 323.6
S E G M E N T S
Figures exclude all other segments, which, in addition to various holding companies, comprise the international activities of Brenntag International Chemicals.
S H A R E O F S A L E S

S I N G A P O R ER E P U B L I C O F S I N G A P O R E
M Ü L H E I M / R U H RG E R M A N Y
A S I A P A C I F I C
Brenntag entered the Asia Pacific markets in 2008 and con-
tinuously expanded this network with several acquisitions
over the years. Today we have established over 70 locations in
15 countries and a workforce of more than 1,800 employees
which provides all our customers in this region with chemical
products and services.
in EUR m 2015 2014
External sales 834.1 748.2
Operating gross profit 140.0 120.7
Operating expenses – 89.7 – 79.5
Operating EBITDA 50.3 41.2
E M E A
Brenntag is the number one chemical distributor in Europe.
The region operates a dense network of more than 210 distri-
bution centres. From these locations, our workforce of more
than 6,000 employees provides the Brenntag customers with
the chemicals and services they need.
in EUR m 2015 2014
External sales 4,654.4 4,624.7
Operating gross profit 1,024.2 972.0
Operating expenses – 671.2 – 636.1
Operating EBITDA 353.0 335.9
S H A R E O F S A L E S
Figures exclude all other segments, which, in addition to various holding companies, comprise the international activities of Brenntag International Chemicals.
S H A R E O F S A L E S

K E Y F I N A N C I A L F I G U R E S
A T A G L A N C E
1) As part of a stock split, the number of shares was increased in the third quarter of 2014 from 51.5 million to 154.5 million. The number of shares and the share prices have been retroactively adjusted to the stock split.
consolidated income statement
2015 2014 Change in %Change in %
(fx adj.)
Sales EUR m 10,346.1 10,015.6 3.3 – 4.6
Gross Profit EUR m 2,266.0 2,027.5 11.8 2.4
Operating EBITDA EUR m 807.4 726.7 11.1 0.7
Operating EBITDA / Gross Profit % 35.6 35.8
EBITDA EUR m 807.4 726.9 11.1 0.7
Profit after tax EUR m 368.1 339.7 8.4
Earnings per share 1) EUR 2.36 2.20 7.3
consolidated balance sheet Dec. 31,
2015Dec. 31,
2014
Total Assets EUR m 6,976.2 6,215.0
Equity EUR m 2,690.5 2,356.9
Working capital EUR m 1,268.1 1,226.8
Net financial liabilities EUR m 1,676.1 1,409.7
consolidated cash flow
2015 2014
Cash provided by operating activities EUR m 593.7 369.7
Investments in non-current assets (Capex) EUR m – 130.1 – 104.8
Free cash flow EUR m 764.3 521.6
key figures brenntag shareDec. 31,
2015Dec. 31,
2014
Share price EUR 48.28 46.51
No. of shares (unweighted) 1) 154,500,000 154,500,000
Market capitalization EUR m 7,459 7,186
Free float % 100 100

Brenntag is the global market leader in chemical distribution, covering all major markets with its exten-sive product portfolio of both industrial and specialty chemicals. The broad variety of value-added services and a highly experienced management team completes the company profile.
Brenntag is its stakeholders’ first choice because we create true value for all our partners.
We are our CUSTOMERS’ first choice because we deliver best-in-class service offerings.
We are a RELIABLE and the preferred distributor because we have the most talented people in the industry.
We are the number 1 for our SUPPLIERS, because we help them react flexibly to ever-changing market conditions.
We have a strong FINANCIAL PROFILE guaranteeing maximum financial flexibility.
We lead the way in the SPECIALTY CHEMICALS BUSINESS because we are committed to joint business development with our partners.
We are present in all relevant MARKETS and combine global scale with local proximity.
We are committed to EXCELLENCE in all our business activities and safety in particular.
We embrace the high level of responsibility that our leading position in chemical distribution entails by managing the business in a prudent way – now and in the future!
D
fu
rt
he
r
in
fo
rm
at
io
nf
in
an
ci
al
s
ta
te
me
nt
s
C
ma
na
ge
me
nt
r
ep
or
t
B
to
o
ur
s
ha
re
ho
ld
er
s
A

Content
A N N U A L R E P O R T 2 0 1 5 – B R E N N T A G A G
G L O B A L M A R K E T L E A D E R I N C H E M I C A L D I S T R I B U T I O N
C O M P A N Y P R O F I L E
Brenntag is the global market leader in chemical distribution. The company manages complex supply chains for both chemical
manufacturers and users by simplifying market access to thousands of products and services. It combines a global
network with outstanding local execution.
Brenntag is therefore the industry’s most effective and preferred channel to market for partners – really living its philosophy:
“ConnectingChemistry”.
Brenntag operates a global network spanning more than 530 locations in 74 countries. With its global workforce of more
than 14,000 employees, the company generated sales of EUR 10.3 billion in 2015.

Content
A N N U A L R E P O R T 2 0 1 5 – B R E N N T A G A G
G L O B A L M A R K E T L E A D E R I N C H E M I C A L D I S T R I B U T I O N
34 TO OUR SHAREHOLDERS
36 Brenntag on the Stock Market
42 Report of the Supervisory Board
48 Corporate Governance
56 Board of Management
66 Supervisory Board
138 CONSOLIDATED FINANCIAL
STATEMENTS
140 Consolidated Income Statement
141 Consolidated Statement of
Comprehensive Income
142 Consolidated Balance Sheet
144 Consolidated Statement of
Changes in Equity
146 Consolidated Cash Flow Statement
147 Notes
227 Responsibility Statement
228 Annex: List of Shareholdings
68 MANAGEMENT REPORT
70 Basic Information about the Group
79 Report on Economic Position
97 Annual Financial Statements of
Brenntag AG
99 Remuneration Report
114 Employees
116 Health, Safety and Environmental
Protection, Quality Management
120 Events after the End of the Reporting
Period
120 Report on Expected Developments,
Opportunities and Risks
132 Information Required Pursuant to
Section 289, Para. 4 and Section 315,
Para. 4 of the German Commercial
Code and Explanatory Report
137 Corporate Governance Statement
238 FURTHER INFORMATION
240 Independent Auditor’s Report
242 Segment Information
248 Glossary
258 Table Directory
261 Five-year Overview
262 Imprint and Contact
D
fu
rt
he
r
in
fo
rm
at
io
nf
in
an
ci
al
s
ta
te
me
nt
s
C
ma
na
ge
me
nt
r
ep
or
t
B
to
o
ur
s
ha
re
ho
ld
er
s
A

T O O U R S H A R E H O L D E R S
CEO Letter
2

T O O U R S H A R E H O L D E R S
CEO Letter
A N N U A L R E P O R T 2 0 1 5 – B R E N N T A G A G 3
DEAR SHAREHOLDERS,
2015 was a good financial year for Brenntag. We continued to grow and clearly
exceeded our key performance indicators year on year. Above all, I am pleased to
report that we also translated operating profit into a strong free cash flow that was
46.5 % higher than in the previous year, testifying to our attractive business model.
Sales in the financial year 2015 amounted to EUR 10,346.1 million, an increase of
3.3 % (as reported) on the previous year. Gross profit rose by 11.8 % to EUR 2,266.0 mil-
lion. Operating EBITDA also improved in 2015: at EUR 807.4 million, it was up 11.1 % on
the previous year.
2015 was also a year full of challenges, however, particularly in the second half.
Brenntag’s business was impacted by low demand from customers in the oil & gas
industry, the weak global economic development and a lack of growth momentum in
various countries, meaning that we were unable to fully meet our own high expectations
in some areas despite the Group’s positive overall performance.
Our North America region in particular was affected by the significant fall in the
oil price, which reduced the activity levels of all customers in the oil & gas industry
during the year. This was compounded by a noticeable slowdown in US industrial
production in the second half of the year. Against this background, we are satisfied
overall with the North America region’s performance. Steps to reduce operational
capacity in oil & gas were executed to react appropriately to the short and medium
term challenges in the sector.
The Europe, Middle East & Africa (EMEA) region delivered a good earnings
performance in 2015. Brenntag is on a stable footing in this large region and, despite
weaker-than-expected economic growth, achieved a good set of results.
In the Latin America region, our past efforts and investments are now paying off.
Here, Brenntag achieved efficiency improvements and posted very encouraging growth
rates. We are very pleased with this performance, especially given the challenging
conditions in a number of the larger economies in the region.
We can also strike an upbeat tone on the Asia Pacific region. Here, we achieved
further improvements in efficiency and are very pleased overall with our earnings
performance. This diversified region shows a mixed picture, with trends varying from
country to country.
Growth and expansion of the business by acquisition remains a key part of our
long-term strategy. During the year we successfully executed ten acquisitions amount-
ing to more than EUR 550 million enterprise value. The ten acquisitions in total
strengthen and expand our product, market and customer portfolio as well as adding
further operational capability in key regions.
Mülheim an der Ruhr, March 15, 2016
D
fu
rt
he
r
in
fo
rm
at
io
nf
in
an
ci
al
s
ta
te
me
nt
s
C
ma
na
ge
me
nt
r
ep
or
t
B
to
o
ur
s
ha
re
ho
ld
er
s
A

T O O U R S H A R E H O L D E R S
CEO Letter
A N N U A L R E P O R T 2 0 1 5 – B R E N N T A G A G2
Brenntag has long enjoyed an excellent reputation on the capital markets, and
following an upgrade by the rating agency Moody’s in March 2015 our creditworthiness
has been rated investment grade by Moody’s as well as Standard & Poor’s. This is one
of the reasons why we were able to successfully place a bond with warrant units in the
amount of USD 500 million in November. Whilst this transaction was not only important
for funding current and future acquisitions, it also means the Group has a more diversi-
fied financing structure and a more balanced maturity profile.
The Group continues to attract new investors and maintains the support of long
standing shareholders. It goes without saying that we wish to pass on our positive
business performance in 2015 to our shareholders. The Board of Management and
Supervisory Board will therefore propose a dividend of EUR 1.00 per share to the
General Shareholders’ Meeting. This represents a 11.1 % increase on the previous year.
Besides the key financial figures, however, there are many other aspects to our
business that we address. Also with regard to sustainability, we aim to set standards in
our industry and work both globally and locally to enhance sustainability within our
own company and across the chemical industry supply chain. With this in mind, we
maintain close dialogue with customers and suppliers and are committed to transparency.
In 2015, for example, we published our second sustainability report, and we are the only
chemicals distributor to date who has joined the industry initiative “Together for
Sustainability”.
This Annual Report presents our company as what it is – the number 1 in chemical
distribution! The report shows how Brenntag defines, consolidates and extends its
leading position.
All of this, of course, does not simply happen without the hard work, dedication
and ambition of our worldwide organisation with over 14,000 employees in 74 countries.
On behalf of the entire Board of Management, I would like to take this opportu-
nity to thank our employees for their considerable commitment and our shareholders,
customers, suppliers and business partners for the trust they place in us and our strong
working relationship.
Yours sincerely
Steven Holland
Chief Executive Officer

T O O U R S H A R E H O L D E R S
CEO Letter
A N N U A L R E P O R T 2 0 1 5 – B R E N N T A G A G 3
» We take the opportunity to share with you the many aspects of our market leadership – customers, suppliers and markets, efficiency, capabilities and financial strength.«
S T E V E N H O L L A N D Chief Executive Off icer
D
fu
rt
he
r
in
fo
rm
at
io
nf
in
an
ci
al
s
ta
te
me
nt
s
C
ma
na
ge
me
nt
r
ep
or
t
B
to
o
ur
s
ha
re
ho
ld
er
s
A

Highlights of 2015
T O O U R S H A R E H O L D E R S
H I G H L I G H T S O F 2 0 1 5
JANUARY
REINFORCEMENT OF BRAND
IDENTITY THROUGH
”CONNECTING CHEMISTRY”
Brenntag announces the global roll-out
of “ConnectingChemistry” as its key
strap line to enhance its brand identity.
STEVEN HOLLAND’S
TERM EXTENDED TO 2020
The Supervisory Board of Brenntag AG
renews the contract of current Chief
Executive Officer Steven Holland for five
years until February 2020.
JULY
“TOGETHER FOR SUSTAINABILITY”
Brenntag becomes the first chemical
distributor to join “Together for
Sustainability“ (TfS). The aim of this
initiative is to establish a standardized
global programme for the responsible
procurement of goods and services in
the chemical industry.
AUGUST
2015 SUSTAINABILITY REPORT
Brenntag publishes its 2015 Sustainability
Report which outlines among others
Brenntag’s activities in the areas of safety,
resource efficiency, supply chain responsi-
bility and compliance. The report was
prepared in accordance with the standards
of the Global Reporting Initiative.
JUNE
EXPANSION OF THE BOARD OF
MANAGEMENT
Brenntag expands its Board of
Management to five members effective
July 1, 2015. In addition to serving
members Steven Holland, CEO, and
Georg Müller, CFO, Brenntag managers
Karsten Beckmann, Markus Klähn and
Henri Nejade are appointed to the Board.
William Fidler retires from the Board of
Management when his contract expires.
BRENNTAG PAYS A HIGHER
DIVIDEND
The General Shareholders’ Meeting
resolves the distribution of a higher
dividend than in the previous year, in
the amount of EUR 0.90 per share
(+3.8 %). The payout ratio amounts to
41.0 % of the net profit attributable to
Brenntag shareholders.
SUPERVISORY BOARD ELECTIONS
The General Shareholders’ Meeting
elects Stefanie Berlinger to the
six-member Supervisory Board. She
replaces Stephen Clark, who retires
from the Board.
FEBRUARY
ACQUISITION OF LIONHEART CHEMICAL
ENTERPRISES, SOUTH AFRICA
Brenntag acquires Lionheart Chemical
Enterprises, a specialty chemicals
distributor mainly operating in the food
and beverage industry.
MARCH
INVESTMENT GRADE RATING
FROM MOODY’S
The rating agency Moody’s assigns a
“Baa3” rating, underlining Brenntag’s
excellent creditworthiness. Brenntag
is now rated investment grade by
both Moody’s and Standard & Poor’s.
MAY
ACQUISITION OF QUIMICAS
MEROÑO, SPAIN
Brenntag acquires Quimicas Meroño,
S. L., a distributor of industrial
chemicals providing additional
growth opportunities especially
in the food and oil & gas
industries.
A N N U A L R E P O R T 2 0 1 5 – B R E N N T A G A G4

Highlights of 2015
T O O U R S H A R E H O L D E R S
DECEMBER
SEPTEMBER
ACQUISITION OF TAT GROUP,
REPUBLIC OF SINGAPORE
Brenntag announces the acquisition of TAT
Group, a distributor of industrial chemicals.
The acquisition is a significant complement
and important investment in Brenntag’s
geographic and strategic position in the
Asia Pacific region. Via its subsidiaries in
Singapore, South Korea, Vietnam, Hong
Kong and Indonesia, TAT offers its local and
overseas customers a broad range of
solvents and related products.
ACQUISITION OF PARKOTEKS KIMYA
SAN.,TURKEY
Brenntag acquires Parkoteks Kimya San,
a distribution company offering a wide
range of specialty chemicals products
with particular focus on the personal care
industry.
OCTOBER
GROUND BREAKING FOR THE NEW
BRENNTAG HEADQUARTERS
The construction of Brenntag’s new
headquarters gets under way with a
ground breaking ceremony. The modern,
sustainably designed global headquarters
gradually taking shape in Essen is
scheduled for completion by 2017.
NOVEMBER
ACQUISITION OF J.A.M. AND
BERLIN-WINDWARD, USA
Brenntag announces the acquisition
of the two US-based leading
lubricants distributors J.A.M.
Distributing Company and G.H.
Berlin-Windward. Both companies
distribute across the entire
lubricant supply chain in a broad
range of customer industries and
build an excellent platform for
further growth in this consolidating
market.
SUCCESSFUL PLACEMENT OF A
BOND WITH WARRANT UNITS
Brenntag successfully places a
US dollar 500 million senior, unse-
cured bond with warrant units due
2022. The transaction is a highly
attractive funding instrument
with which Brenntag achieves an
even more diversified financing struc-
ture and a balanced maturity profile.
18.08.2015
Haupteingang von der Messeallee(evt. abweichende Darstellung, Werbekonzept nur nachrichtlich)
M I L L I O N U S D O L L A R
RELAUNCH OF CORPORATE WEBSITE – WWW.BRENNTAG.COM
Brenntag gives its corporate website a comprehensive overhaul in terms of
content, technology and design. In addition, the website is optimized based
on responsive web design.
ACQUISITION OF LEIS POLYTECHNIK POLYMERE WERKSTOFFE, GERMANY
Brenntag announces the acquisition of Leis Polytechnik polymere Werkstoffe
GmbH specializing in the development, production and distribution of
high-performance polymer compounds.
TOTAL AMOUNT INVESTED IN ACQUISITIONS IN 2015:
> EUR 550 million
A N N U A L R E P O R T 2 0 1 5 – B R E N N T A G A G 5D
fu
rt
he
r
in
fo
rm
at
io
nf
in
an
ci
al
s
ta
te
me
nt
s
C
ma
na
ge
me
nt
r
ep
or
t
B
to
o
ur
s
ha
re
ho
ld
er
s
A

C U S T O M E R S
IN CHEMICAL DISTRIBUTION QUALITY
OF SERVICE IS KEY TO SUCCESS
B U R J K H A L I F A
Standing at 829.8 metres, the Burj Khalifa in Dubai,
United Arab Emirates, is the world‘s tallest building – followed by
the Shanghai Tower, which is 632 metres high. The Burj Khalifa
was inaugurated on January 4, 2010.

A N N U A L R E P O R T 2 0 1 5 – B R E N N T A G A G 7
FOCUS ON SALES & MARKETING
Brenntag is the preferred partner for customers because we follow an unpar-
alleled approach, enabling us to act flexibly and always meet the individual require-
ments of all our customers. As the number 1 in chemical distribution, Brenntag
serves around 180,000 customers from more than 530 locations around the globe.
Our world-class sales & marketing organization, which makes up more than one
third of our global workforce of more than 14,000 employees, continuously and
pro-actively approaches our customers, be it the smaller customer, mid-sized
customers or even large corporations, which – like Brenntag – operate globally.
The nature of the smaller and mid-sized customers makes chemical distribu-
tion an extremely granular business. In general, these customers order chemical
products in less-than-truck load quantities. These products make the customers’
production processes run smoothly and without outages. The orders are often
placed at short notice and delivery is expected and made within 48 hours. Brenntag
is our customers’ first choice, not only because of its unique, dense network, guar-
anteeing product availability and just-in-time delivery, but also because we place
particular importance on regular customer visits by our sales representatives. This
direct contact and continuous dialogue are highly appreciated by our customers
and essential for establishing and strengthening long-standing relationships of trust.
Large corporations, our so-called ‘global key account customers’, value
Brenntag’s global presence as well as our ability to comply with ever increasing
environmental, safety and compliance regulations, which differ from country to
country. These key account customers also expect to be served in different countries
or even on different continents with a large variety of products and value-added
services to consistent standards.
The chemical distribution business is highly complex, comprising purchase, storage, logistics, sales and marketing as well as a variety of value-added services around the globe. Quality of service is the key to success in this market.
D
fu
rt
he
r
in
fo
rm
at
io
nf
in
an
ci
al
s
ta
te
me
nt
s
C
ma
na
ge
me
nt
r
ep
or
t
B
to
o
ur
s
ha
re
ho
ld
er
s
A

A N N U A L R E P O R T 2 0 1 5 – B R E N N T A G A G8
SERVICE MAKES THE DIFFERENCE
Chemical distribution serves customers from all different industries. To stay on
top of this highly fragmented market and best serve customers’ needs, a chemical
distributor has to provide a wide range of service offerings of the highest quality.
» Our customers’ requirements are as diverse as their businesses. Our pan-European approach supports our partners to manage their supply chain more efficiently.«
K A R S T E N B E C K M A N N Member of the Board of Management Region EMEA (Europe, Middle East & Afr ica) Global Accounts
This is where Brenntag’s understanding of chemical distribution comes into
play. For us, there is much more to the business than simply supplying chemicals to
customers. We see ourselves as an integral part of the value chain, always striving
to support our customers. As a full-line distributor, Brenntag offers a unique port-
folio of both industrial and specialty chemicals and value-added services, leading
to high customer retention. These service offerings vary in complexity – from simply
providing a product, which is the customer’s basic requirement of a reliable distrib-
utor, through filling chemicals in the container sizes needed by the customer to
extensive technical support.
Brenntag, the global market leader, expertly handles this complex meshwork
of supplier requirements, customer needs, relationship management and efficient
logistics while always guaranteeing to meet the highest safety and quality standards.

A N N U A L R E P O R T 2 0 1 5 – B R E N N T A G A G 9
M I X I N G & B L E N D I N G
I N D I V I D U A L L A B E L I N G
R E F I L L I N G
P R O D U C T A V A I L A B I L I T Y
V A L U E - A D D E D S E R V I C E S
CO
MP
LE
XIT
Y
C U S T O M E R S
MAKE APPR.
10% OF BRENNTAG’S
BUSINESS
50GLOBAL
KEY ACCOUNTS
MILLIONLESS-THAN-TRUCKLOAD
DEL IVERIES PER YEAR
≈180,000 STOP-SHOP SOLUTION
G R A N U L A RB U S I N E S S
F U L L - L I N E INDUSTRIAL CHEMICALS
+ SPECIALT Y
CHEMICALSP R O D U C T P O R T F O L I O
D
fu
rt
he
r
in
fo
rm
at
io
nf
in
an
ci
al
s
ta
te
me
nt
s
C
ma
na
ge
me
nt
r
ep
or
t
B
to
o
ur
s
ha
re
ho
ld
er
s
A

R E L I A B I L I T Y
BRENNTAG IS A RELIABLE
PARTNER FOR ALL ITS STAKEHOLDERS
V A S C O D A G A M A B R I D G E
Europe’s longest bridge is the Vasco da Gama bridge, named in
honour of the Portuguese explorer. It spans the Tagus river in Lisbon,
Portugal. It was opened to traffic in 1998, 500 years after da Gama
discovered the sea route from Europe to India.

A N N U A L R E P O R T 2 0 1 5 – B R E N N T A G A G 1 1
CONNECTING CHEMISTRY ON ALL LEVELS
Successful chemical distributors act as a direct link between chemical manu-
facturers and end customers. For Brenntag, chemical distribution is a people business.
Our employees are the cornerstone of the company’s success. Most of Brenntag’s
employees are in direct contact with suppliers and customers, be it as a sales or
customer service representative, a marketing or product manager or a technical
expert in a specific customer industry. Our partners rely on our experts’ experience
and advice resulting in long-standing, trusting and value-creating relationships.
Our employees at all levels know the chemical distribution market and its typical
characteristics – and are always one step ahead of our customers‘ and suppliers‘ needs.
EXPANSION OF BRENNTAG’S BOARD OF MANAGEMENT
The global market leader is led by a highly experienced Board of Manage-
ment, combining decades of relevant expertise gained both outside and within the
Brenntag Group. Brenntag manages the business regionally, holding leading market
positions in Europe, North America, Latin America and the Asia Pacific region. This
is reflected in the composition of the Board of Management, which was extended
in 2015 in order to maximize the company’s full global growth potential and focus
even more on the strategic development of the Group.
SUSTAINABILITY – COMMITMENT WITHIN THE VALUE CHAIN
In order to take the increasing importance of sustainability into account,
chemical distributors have to factor environmental and social aspects into their
business activities and consider the impact of these activities. Therefore, sustain-
ability means striking an appropriate balance between business, ecology and social
issues and reconciling the different priorities. Brenntag has acquired a leading
position in the field of sustainability in the chemical distribution industry. We
embrace the high level of responsibility that our leading position in the market
entails. Sustainability is a fundamental part of our business model and guides
Brenntag’s activities.
Our partners are entitled to expect reliabil-ity from the market leader in chemical distribution. Brenntag has proven its reliability in terms of safety, operational excellence, market knowledge and finan-cial track record – and will continue to do so in the future!
D
fu
rt
he
r
in
fo
rm
at
io
nf
in
an
ci
al
s
ta
te
me
nt
s
C
ma
na
ge
me
nt
r
ep
or
t
B
to
o
ur
s
ha
re
ho
ld
er
s
A

A N N U A L R E P O R T 2 0 1 5 – B R E N N T A G A G1 2
The company focuses on sustainability topics associated with Brenntag’s day-
to-day business and its portfolio of services: safety, efficient use of resources, sup-
ply chain responsibility, compliance and our relationship with our employees and
society at large. We take up the challenge of continuously improving on our per-
formance in these areas on an international level. By optimizing standards and
processes within our corporate structures and providing our employees with suit-
able trainings, we constantly develop our sustainability strategy, thus reconciling
the different aspects of our business activities.
PROVEN STRENGTHS OF THE BUSINESS MODEL
The Brenntag business model has proven its resilience along many axes. It is
highly diversified with regard to customers, suppliers, industries, products and
geographic coverage. The company is independent of any of these parameters
and, as a full-line chemical distributor of both industrial and specialty chemicals,
Brenntag is well positioned to react flexibly to changing market conditions. However,
we do not rest on our laurels but continuously strive to improve our business per-
formance.
» Brenntag has a leading position in chemical distribution. We are fully aware of the responsibility we have towards all our stakeholders. We attach great importance to acting diligently in all our business activities and simultaneously always strive to create true value for our partners.«
S T E V E N H O L L A N D Chief Executive Off icer
A N N U A L R E P O R T 2 0 1 5 – B R E N N T A G A G 1 3
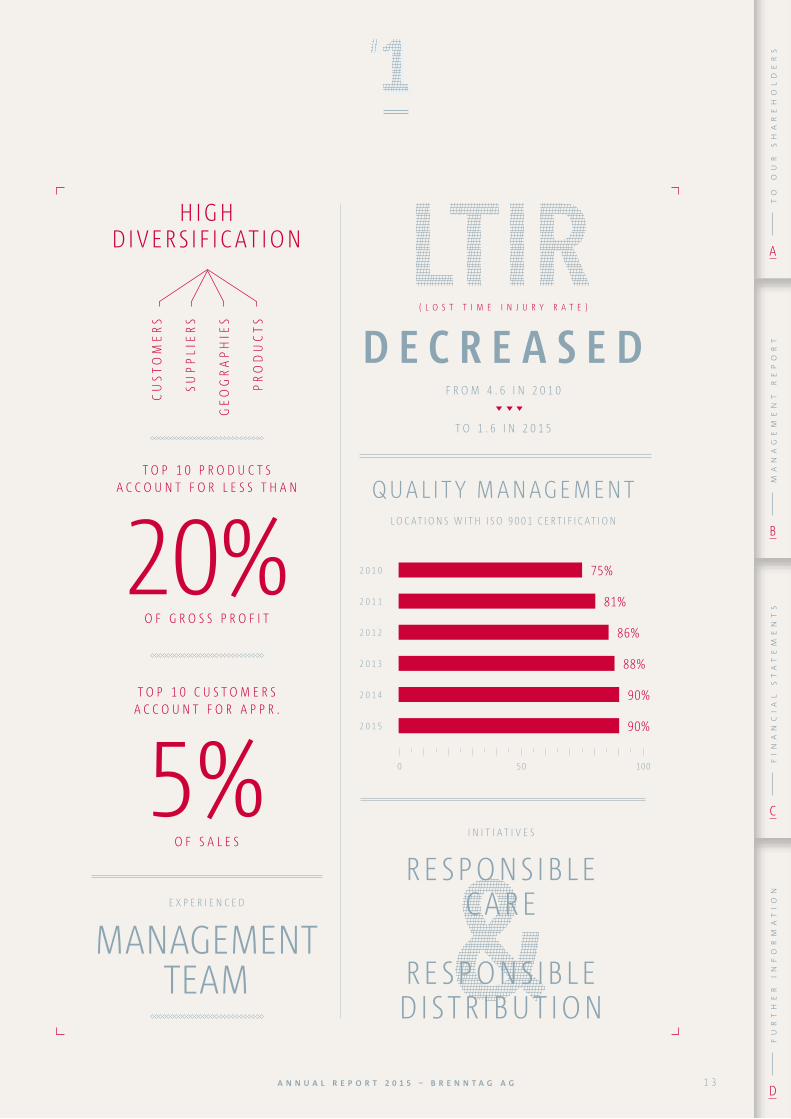
E X P E R I E N C E D
MANAGEMENT TEAM
QUALIT Y MANAGEMENTL O C AT I O N S W I T H I S O 9 0 0 1 C E R T I F I C AT I O N
F R O M 4 . 6 I N 2 0 1 0
T O 1 . 6 I N 2 0 1 5
( L O S T T I M E I N J U R Y R A T E )
I N I T I A T I V E S
H IGH DIVERSIF ICATION
T O P 1 0 P R O D U C T S A C C O U N T F O R L E S S T H A N
20% O F G R O S S P R O F I T
T O P 1 0 C U S T O M E R S A C C O U N T F O R A P P R .
5% O F S A L E S
RESPONSIBLE CARE
RESPONSIBLE D ISTRIBUTION
CU
STO
ME
RS
SU
PP
LIE
RS
GE
OG
RA
PH
IES
PR
OD
UC
TS
2 0 1 1 81%
2 0 1 2 86%
2 0 1 3 88%
2 0 1 4 90%
2 0 1 5 90%
2 0 1 0 75%
0 50 100
D
fu
rt
he
r
in
fo
rm
at
io
nf
in
an
ci
al
s
ta
te
me
nt
s
C
ma
na
ge
me
nt
r
ep
or
t
B
to
o
ur
s
ha
re
ho
ld
er
s
A

S U P P L I E R S
BRENNTAG IS THE FIRST CHOICE FOR CHEMICAL SUPPLIERS
WORLDWIDE
M S C O S C A R
The largest container ships in the world are a family of ships operated by
the Mediterranean Shipping Company. The MSC Oscar, MSC Zoe,
MSC Oliver, MSC Maya and MSC Sveva are each 395.4 metres long and
were named in 2015.

A N N U A L R E P O R T 2 0 1 5 – B R E N N T A G A G 1 5
Consolidation is a highly important topic in chemical distribution and is driven by various factors. Particularly chemical manufacturers, our suppliers, aim to reduce the number of their business part-ners. As a well-known brand in chemical distribution, Brenntag plays a decisive role in this process.
CONSOLIDATION IS DRIVEN BY SUPPLIERS
Brenntag is the link between chemical manufacturers and end customers.
The company acts as the extended arm of chemical manufacturers, the suppliers.
Chemical manufacturers aim to reduce the number of chemical distributors they
work with. Brenntag is a reliable distributor with an excellent reputation and proven
ability to penetrate markets. Therefore, suppliers consistently choose our company
as their preferred channel-to-market partner. Brenntag does business with all global
chemical manufacturers, in total several thousand suppliers.
SUPPLIER RELATIONSHIP MANAGEMENT IS PARAMOUNT
Brenntag plays a key role in the chemical distribution value chain and has to
adapt to the individual requirements of its business partners. Cooperation with our
suppliers is a collaborative and dynamic process designed to introduce different
products to various markets and unfold each product’s full potential while taking
the different market conditions into account.
To make cooperation as efficient as possible, Brenntag has set up a stewardship
process with suppliers. The different steps of this process include defining a vision
and strategy, setting priorities, designing a planning concept, conducting business
reviews and setting up and controlling budgets. The strategy varies, depending on
the country in which the product is to be launched and the individual local market
requirements. While some suppliers provide dedicated marketing plans, others draw
on Brenntag’s business intelligence. With every single one of our numerous customer
D
fu
rt
he
r
in
fo
rm
at
io
nf
in
an
ci
al
s
ta
te
me
nt
s
C
ma
na
ge
me
nt
r
ep
or
t
B
to
o
ur
s
ha
re
ho
ld
er
s
A

A N N U A L R E P O R T 2 0 1 5 – B R E N N T A G A G1 6
» Supplier relationships are one of the key differentiators for distributors. For Brenntag, extending trusting relationships plays a pivotal role. Close and constant dialogue intensifies the important rela-tionship with these stakeholders.«
M A R K U S K L Ä H N Member of the Board of Management Region North Amer ica
visits we gain valuable information which helps us to develop and grow our part-
ners’ business even more effectively. Given the different economic circumstances in
each country, Brenntag’s market knowledge and quality standards on all levels
have become a major asset to our suppliers.
ONGOING OUTSOURCING TREND
Outsourcing is an ongoing trend in the chemical distribution market.
Although chemical manufacturers in general focus on the bulk-quantity business,
some still serve customers ordering smaller quantities. This business is becoming
more and more inefficient and unprofitable for chemical manufacturers. Therefore,
they aim to hand over the less-than-truckload volumes to chemical distributors.
Thanks to its long-standing and value-creating relationships with chemical manu-
facturers around the world, and as a well-known brand in chemical distribution,
Brenntag is predestined to benefit from this trend, now and in the future.

A N N U A L R E P O R T 2 0 1 5 – B R E N N T A G A G 1 7
WIN-WIN SITUATION
V A L U E - C R E A T I N G R E L A T I O N S H I P S W I T H
S U P P L I E R S
S T A N D A R D I Z E D P R O C E S S F O R S U P P L I E R
R E L A T I O N S H I P M A N A G E M E N T
TOP 10 SUPPL IERS MAKE LESS
THAN
BRENNTAG
OF PURCHASE
VALUE
F U L L - L I N ED I S T R I B U T O R
O N E - S T O P - S H O PS O L U T I O N
C U S T O M E R 1
C U S T O M E R 2
C U S T O M E R 3
C U S T O M E R 4
C U S T O M E R 5
C U S T O M E R 6
P R O D U C E R 1
P R O D U C E R 2
P R O D U C E R 3
P R O D U C E R 4
P R O D U C E R 5
P R O D U C E R 6
M A R K E T I N G A R M F O R S U P P L I E R S
D
fu
rt
he
r
in
fo
rm
at
io
nf
in
an
ci
al
s
ta
te
me
nt
s
C
ma
na
ge
me
nt
r
ep
or
t
B
to
o
ur
s
ha
re
ho
ld
er
s
A
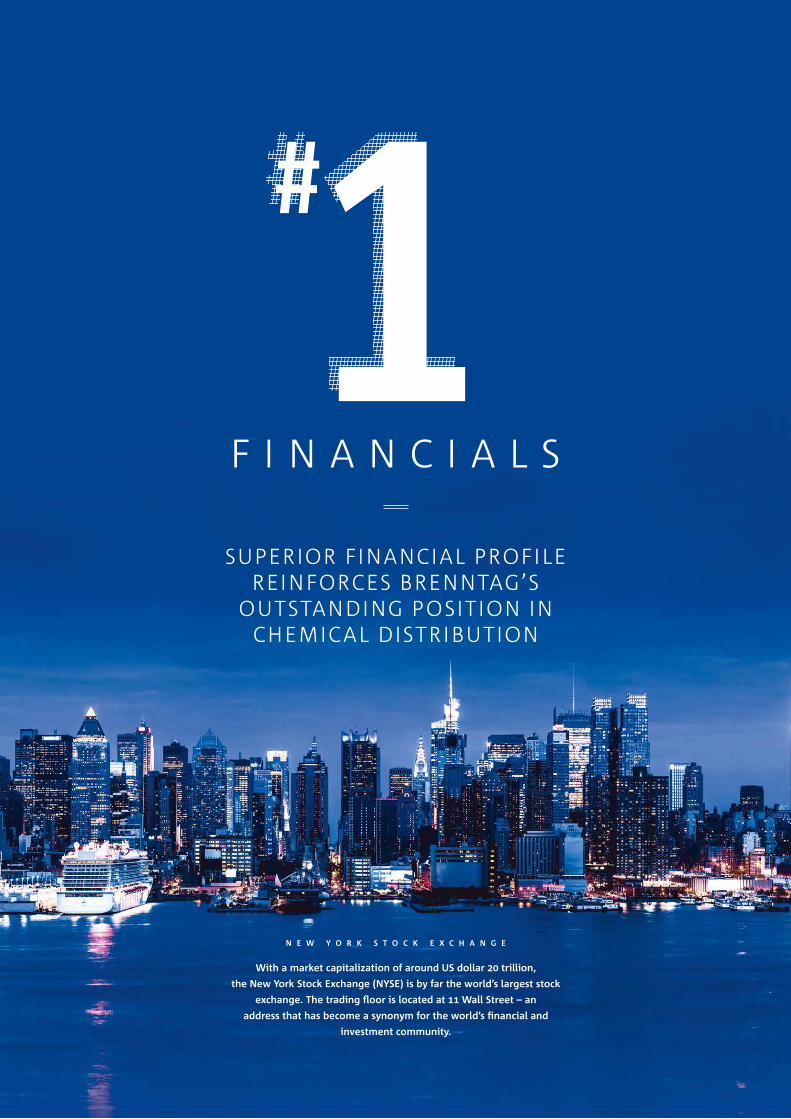
F I N A N C I A L S
SUPERIOR FINANCIAL PROFILE REINFORCES BRENNTAG’S
OUTSTANDING POSITION IN CHEMICAL DISTRIBUTION
N E W Y O R K S T O C K E X C H A N G E
With a market capitalization of around US dollar 20 trillion,
the New York Stock Exchange (NYSE) is by far the world’s largest stock
exchange. The trading floor is located at 11 Wall Street – an
address that has become a synonym for the world’s financial and
investment community.

A N N U A L R E P O R T 2 0 1 5 – B R E N N T A G A G 1 9
PROVEN FINANCIAL TRACK RECORD
Brenntag has proven its resilience in many ways, also on the financial side,
thereby always supporting the strategic pillars of both organic and acquisitive
growth. The company has consistently improved its earnings performance. The
important key performance indicators, EBITDA and gross profit, have shown average
growth of 6.2 % and 6.7 % since the company was floated in 2010. At the same
time, the Group has generated a significant free cash flow year by year.
STRONG CREDIT RATING FROM INTERNATIONALLY RECOGNIZED RATING AGENCIES
The two internationally recognized credit rating agencies, Moody’s and Stan-
dard & Poor’s, have assigned Brenntag an investment grade rating. The investment
grade rating from both agencies indicates high creditworthiness and differentiates
Brenntag from its major competitors. It is also further recognition of Brenntag’s
well- established position in connecting chemistry for suppliers and customers and
our standing in the equity and debt capital markets. The rating lowers funding
risks and enables us to use a broader spectrum of funding instruments.
Many chemical distributors are simply not able to set up a strong and diversified financial profile due to their sheer lack of size. On the other hand, Brenntag as the market leader, has a balanced and resilient financial profile that makes it easier to run the business and strengthens the trust of our partners.
D
fu
rt
he
r
in
fo
rm
at
io
nf
in
an
ci
al
s
ta
te
me
nt
s
C
ma
na
ge
me
nt
r
ep
or
t
B
to
o
ur
s
ha
re
ho
ld
er
s
A

A N N U A L R E P O R T 2 0 1 5 – B R E N N T A G A G2 0
» Our financial flexibility supports our stra-tegy of organic and acquisitive growth. Brenntag’s outstanding financial strength and our vigilant way of managing the business together form the backbone of the company’s long-term development and future success.«
G E O R G M Ü L L E R Chief Financial Off icer
SUSTAINABLE CASH FLOW GENERATION PROVIDES FLEXIBILITY
Our ability to consistently generate a significant cash flow places us in the
comfortable position of being able to use the funds flexibly according to the com-
pany’s financial requirements.
On the one hand, it is our declared objective to pay our shareholders an attrac-
tive dividend of 30 % to 45 % of Brenntag’s net income. With this dividend, we
would like our shareholders to participate directly in the company’s economic suc-
cess. Since the IPO in 2010, we have managed to increase the dividend payment
from year to year and we would like to continue to do so going forward.
On the other hand, growing the business through acquisitions remains a
significant strategic focus for Brenntag. Having cash funds available is one of the
prerequisites for executing further acquisitions. The local management in the
regions and our highly experienced Corporate Mergers & Acquisitions team con-
tinually pinpoint potential targets and perform thorough due diligences for every
single transaction. Our acquisition track record is quite astounding: since 2010 we
have executed acquisitions for about EUR 220 million on average each year and
among others successfully entered the strategically important markets of South
East Asia, China, Australia and the Middle East.
A N N U A L R E P O R T 2 0 1 5 – B R E N N T A G A G 2 1
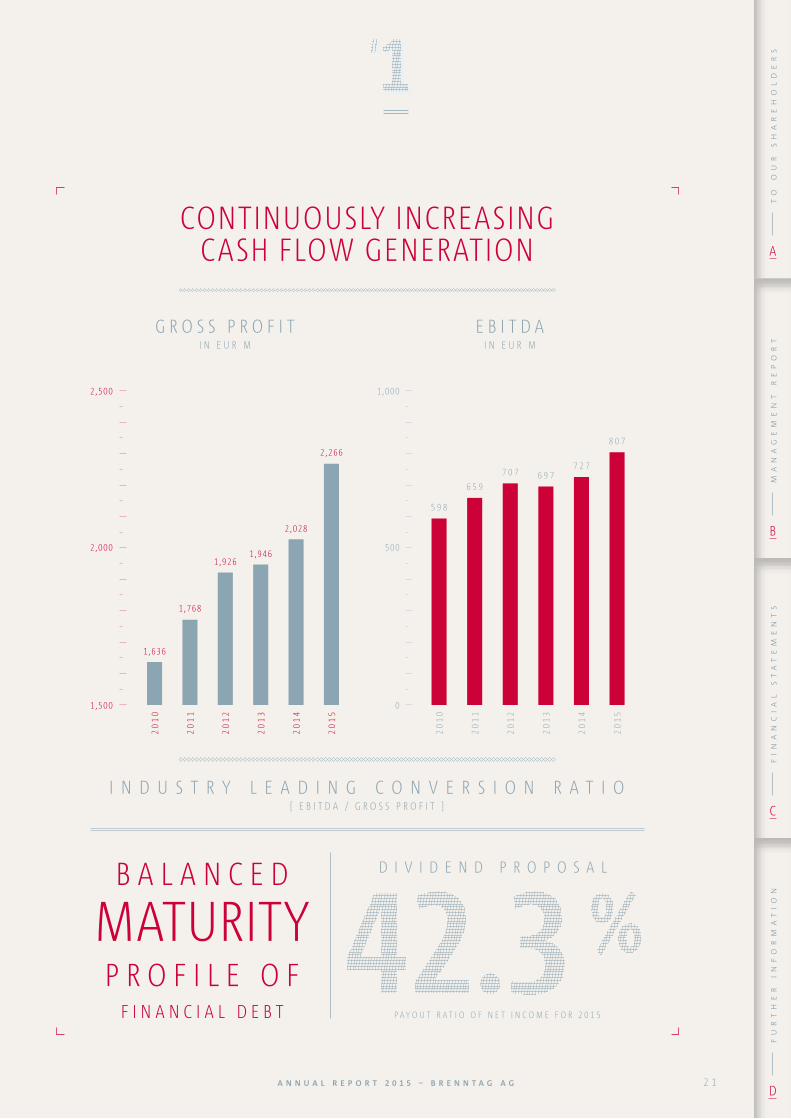
CONTINUOUSLY INCREASING CASH FLOW GENERATION
B A L A N C E D
MATURITY P R O F I L E O F
F I N A N C I A L D E B T P A Y O U T R A T I O O F N E T I N C O M E F O R 2 0 1 5
D I V I D E N D P R O P O S A L
G R O S S P R O F I T I N E U R M
E B I T D A I N E U R M
1,500 0
2 ,000 500
2 ,500 1 ,000
I N D U S T R Y L E A D I N G C O N V E R S I O N R A T I O [ E B I T D A / G R O S S P R O F I T ]
5 9 8
20
10
6 5 92
01
17 0 7
20
12
6 9 7
20
13
7 2 7
20
14
8 0 7
20
15
2 ,028
20
14
1 ,946
20
13
1 ,926
20
12
1 ,768
20
11
1 ,636
20
10
20
15
2 ,266
D
fu
rt
he
r
in
fo
rm
at
io
nf
in
an
ci
al
s
ta
te
me
nt
s
C
ma
na
ge
me
nt
r
ep
or
t
B
to
o
ur
s
ha
re
ho
ld
er
s
A

S P E C I A L T Y C H E M I C A L S
BRENNTAG IS THE LARGEST SPECIALTY CHEMICALS
DISTRIBUTOR WORLDWIDE
E I X O M O N U M E N T A L
The Monumental Axis is at the heart of Brasília’s cityscape.
The street has been featured in the Guinness Book of Records
as having the widest central reservation of a dual carriageway
in the world.

A N N U A L R E P O R T 2 0 1 5 – B R E N N T A G A G 2 3
BRAND REPUTATION SUPPORTS SUCCESS
In the specialty chemicals business, relationships of trust and long-term
engagement with suppliers are decisive. Brenntag has continuously worked on
establishing and intensifying these connections and provides an unrivalled chan-
nel to market. Therefore, the company is the preferred marketing arm of chemical
manufacturers throughout the world.
Our commitment to developing business jointly with our partners is the basis
for success. As Brenntag cooperates with the best specialty chemicals suppliers and
delivers top-quality products, the company creates true value for its customers in
the specialty chemicals business. For them, working with Brenntag not only means
accessing our broad technical expertise but also our extensive market, industry
and product know-how.
UNPARALLELED MARKET ACCESS
Brenntag’s strategy for specialty chemicals is geared to industry focus and
superior customer service. Our highly educated industry experts are always at the
heart of each specific customer industry, continuously identifying country-specific
market characteristics. They visit our partners and then, in a structured project
management process, develop solutions tailor-made to each customer’s unique
and specific needs. By delivering such individual solutions, we actively help our
customers adapt to rapidly changing trends in their end markets.
Brenntag benefits from being a full-line distributor of both industrial and specialty chemicals by efficiently using the same infrastructure for both types of products. The company realizes its full potential by focusing on expanding its successful specialty chemicals business.
D
fu
rt
he
r
in
fo
rm
at
io
nf
in
an
ci
al
s
ta
te
me
nt
s
C
ma
na
ge
me
nt
r
ep
or
t
B
to
o
ur
s
ha
re
ho
ld
er
s
A

A N N U A L R E P O R T 2 0 1 5 – B R E N N T A G A G2 4
» Brenntag is the number one in the special ty chemicals business for good reason. Particularly in this field, Brenntag connects suppliers and customers by promoting innovation in the diverse and rapidly changing markets while guaran-teeing the highest quality and safety standards at the same time.«
S T E V E N H O L L A N D Chief Executive Off icer
HIGH-TECH APPLICATION CENTRES
Brenntag has a global network of application centres equipped with the latest
technology. By testing ingredients and additives in these in-house facilities, our
industry experts provide formulation guidance to achieve cost optimization and
flexibility. We also actively transfer knowledge by organizing events that include
technical trainings, innovation workshops and customer seminars. Last but not least,
this infrastructure supports our commitment to comply fully with ever-growing
quality requirements and standards. We understand the need for full documenta-
tion and provide accompanying quality and safety certificates for each product.

A N N U A L R E P O R T 2 0 1 5 – B R E N N T A G A G 2 5
APPL ICATION CENTERS IN EMEA
R E G U L A R
T E C H N I C A L T R A I N I N G S
I N N O V A T I O N W O R K S H O P S
A N D
S E M I N A R S
F O RC U S T O M E R S &
S U P P L I E R S
HIGHLY T E C H N I C A L L Y
T R A I N E D S A L E S F O R C E
E M E A R E G I O N
PRODUCTIDENTIFICATION
FORMULAIDENTIFICATION
PRODUCTDEVELOPMENTPROCESS
SUPPLY DELIVERY
S P E C I A L T I E S S E L L I N G P R O C E S S I N A S I A P A C I F I C
AC T I V E C U S TO M E R S
C U S TO M E R S I N T H E S P E C I A LT Y C H E M I C A L S B U S I N E S S
TO TA L C O N TAC T S W I T H O U R C U STO M E R S I N 2 0 1 5
L O C AT I O N S W I T H A P P L I C AT I O N C E N T E R S I N E M E A
105,000 64,900 228,000 27
D
fu
rt
he
r
in
fo
rm
at
io
nf
in
an
ci
al
s
ta
te
me
nt
s
C
ma
na
ge
me
nt
r
ep
or
t
B
to
o
ur
s
ha
re
ho
ld
er
s
A

M A R K E T S
SUCCESSFUL CHEMICAL DISTRIBUTION COMBINES
GLOBAL SCALE WITH LOCAL PROXIMITY
G R A N D C A N A L
With a length of 1,794 kilometres, the Grand Canal is the longest
artificial river in the world – and is listed as a UNESCO World Heritage
Site. It links the cities of Beijing and Hangzhou, crossing the
Yellow River as well as the Yangtze River. Some parts of the Grand
Canal date back to the 5th century BC.

A N N U A L R E P O R T 2 0 1 5 – B R E N N T A G A G 2 7
THE BEAUTY OF BEING A
FULL-LINE CHEMICAL DISTRIBUTOR
The chemical distribution industry comprises more than 10,000 players, from
pure industrial to pure specialty chemical distributors. Brenntag is a full-line chem-
ical distributor, offering a wide range of products. But besides its product portfolio,
the company also leads in value-added services. For Brenntag, being a full-line
chemical distributor of both industrial and specialty chemicals is the superior busi-
ness model. The company is the first choice as a one-stop shop for its customers
and helps its suppliers reduce complexity in distributor management. All business
partners benefit from the broader know-how, the shared infrastructure and the
cross-selling potential.
FLEXIBILITY AS ONE OF THE KEY STRENGTHS
Flexibility is one of the key strengths of successful chemical distributors. By
combining global reach with in-depth knowledge of local market conditions and
the ability to adapt to different cultures and individual needs, Brenntag is the pre-
ferred partner for customers and suppliers alike. The world market leader drives
the business regionally in EMEA, North America, Latin America and Asia Pacific and
always strives to be one step ahead of current developments. We operate a dense
global network not only allowing us to provide sophisticated logistics solutions
but also serving as a platform for transferring knowledge and establishing best
practices in our workforce.
Global demand for chemical products is constantly rising – and the customer industries served by chemical distributors can be found everywhere in daily life. Brenntag’s outstanding ability to identify individual market trends and efficiently place products on the market provides a crucial competitive advantage.
D
fu
rt
he
r
in
fo
rm
at
io
nf
in
an
ci
al
s
ta
te
me
nt
s
C
ma
na
ge
me
nt
r
ep
or
t
B
to
o
ur
s
ha
re
ho
ld
er
s
A

A N N U A L R E P O R T 2 0 1 5 – B R E N N T A G A G2 8
» Asia Pacific is a region with diverse characteristics when it comes to people, cultures, market conditions and develop-ments. But it also has the largest growth potential in the mid- to long-term. Having established a robust platform in the past years, we gladly take up the challenge of making our partners even more successful in their local markets.«
H E N R I N E J A D E Member of the Board of Management Region Asia Pacif ic , Global Sourcing
CREATING VALUE BY SHARING
BUSINESS INTELLIGENCE
Brenntag makes several thousand customer visits a week and several million
less-than-truckload deliveries a year worldwide. We continuously strive to better
understand our customers’ and suppliers’ needs. By using our business intelligence,
our partners also benefit from the knowledge we gain. For our suppliers, we pro-
vide detailed market potential analyses for the launch of new products and we also
know the individual requirements of our customers. Thanks to this close relation-
ship with our partners, Brenntag is always right at the heart of any specific customer
industry in the particular region.
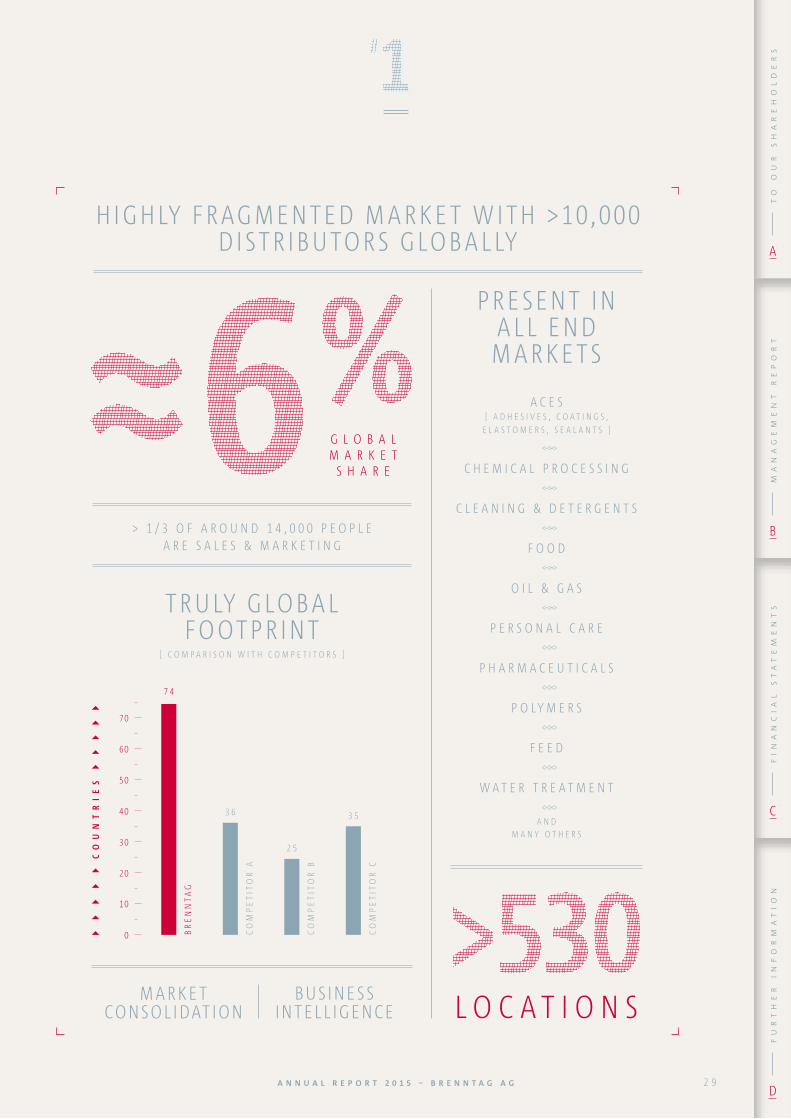
A N N U A L R E P O R T 2 0 1 5 – B R E N N T A G A G 2 9
MARKET CONSOLIDATION
G L O B A L M A R K E T
S H A R E
PRESENT IN ALL END MARKETS
A C E S [ A D H E S I V E S , C O A T I N G S ,
E L A S T O M E R S , S E A L A N T S ]
C H E M I C A L P R O C E S S I N G
C L E A N I N G & D E T E R G E N T S
F O O D
O I L & G A S
P E R S O N A L C A R E
P H A R M A C E U T I C A L S
P O LY M E R S
F E E D
W A T E R T R E A T M E N T
A N D
M A N Y O T H E R S
> 1 / 3 O F A R O U N D 1 4 , 0 0 0 P E O P L E A R E S A L E S & M A R K E T I N G
BUSINESS INTELL IGENCE L O C A T I O N S
TRULY GLOBAL FOOTPRINT
[ C O M P A R I S O N W I T H C O M P E T I T O R S ]
H IGHLY FRAGMENTED MARKET WITH >10 ,000 DISTRIBUTORS GLOBALLY
CO
UN
TR
IE
S
BR
EN
NTA
G
7 4
CO
MP
ET
ITO
R A
3 6
CO
MP
ET
ITO
R B
2 5
CO
MP
ET
ITO
R C
3 5
10
20
30
40
50
60
70
0
D
fu
rt
he
r
in
fo
rm
at
io
nf
in
an
ci
al
s
ta
te
me
nt
s
C
ma
na
ge
me
nt
r
ep
or
t
B
to
o
ur
s
ha
re
ho
ld
er
s
A

E X C E L L E N C E
THE UNIQUE NATURE OF THE GLOBAL
MARKET LEADER IN CHEMICAL DISTRIBUTION
M O U N T E V E R E S T
At 8,848 metres, Mount Everest is the highest mountain on earth.
It is part of the Mahalangur Himal, the highest mountain range
in the world, and soars above Nepal and Tibet where it is also known
as Sagarmāthā and Chomolungma.

A N N U A L R E P O R T 2 0 1 5 – B R E N N T A G A G 3 1
Chemical distribution is a profitable busi-ness. However, if a company is to actively shape the business landscape of this industry, it has to be capable of bringing much more than the sheer distribution of chemicals to the table.
SAFETY FIRST
Brenntag’s market leadership is not just based on pure economic indicators.
Health, safety and environmental protection are of key importance to Brenntag.
Safety comes first and takes precedence over all other aspects of our business. The
company is bound by the highest standards and adopts policies which, in many
countries, far exceed statutory requirements. We focus on establishing an out-
standing safety culture throughout our global operations and strive for zero
accidents and incidents worldwide. Our main priority is to ensure the protection of
our people, our partners and our communities.
LIVING VALUES
We have defined core values which underpin our unique market positioning,
distinguishing us from our competitors. They are the cornerstone of all our employ-
ees’ conduct and they are deeply embedded in our corporate culture. In keeping
with Brenntag’s leading position in the industry, our employees at every level
are encouraged to be leaders in their roles and take ownership of their work. At
Brenntag entrepreneurial thinking and a strict customer-oriented approach come
just as naturally to us as team effort and the development of innovative ideas.
EXCELLENCE IN EXECUTION
As an industry expert with a professional organization, we have proven our
excellence in being an integral part of the chemical distribution value chain and in
playing an important part in the consolidation of the market.
D
fu
rt
he
r
in
fo
rm
at
io
nf
in
an
ci
al
s
ta
te
me
nt
s
C
ma
na
ge
me
nt
r
ep
or
t
B
to
o
ur
s
ha
re
ho
ld
er
s
A

A N N U A L R E P O R T 2 0 1 5 – B R E N N T A G A G3 2
» Brenntag has proven its excellence in execution in many ways. We have profes-sionalized the dynamic interplay of our global organization and our knowledge of local characteristics. By concentrating on our core competence – chemical distribution – we continue to be the number 1 in this market.«
S T E V E N H O L L A N D Chief Executive Off icer
Brenntag demonstrates its reliable expertise in day-to-day-business at every
location around the globe. We not only serve our customers and suppliers in the
most reliable way but also manage to streamline our logistics processes despite
the granularity of the business and the high and diverse safety standards in every
country. Moreover, our strict cost management across all regions together with
constant cash flow generation ensures that the Group is well positioned to benefit
from the growth opportunities in the market.
Alongside organic growth, one of the pillars of our strategy is mergers and
acquisitions. We have a long and successful track record of acquisitions. Since 2010
alone, we have executed more than 30 transactions. All targets have run through
an extensive and thorough due diligence process and have been integrated
smoothly into the Group. We regard ourselves as the first choice for all sellers
given our reputation and track record as a reliable partner in a mergers and acqui-
sition process. While we already have a truly global footprint, we are constantly
working on a number of potential targets, always striving for the continuous
improvement of our portfolio.

A N N U A L R E P O R T 2 0 1 5 – B R E N N T A G A G 3 3
SET UP OF FULL L INE D ISTRIBUTION IN
AS IA PACIF IC WITH
S I N C E
PEOPLE IN 15 COUNTRIES
TRANSACTIONS S INCE 2010
EUR B ILL ION
TOTAL ACQUIS IT ION VOLUME S INCE 2010
ACQUIS IT ION SPEND
EUR MILL ION ON AVERAGE PER YEAR
SINCE 2010
GLOBAL FOOTPRINT
LOCAL PROXIMIT Y
E X C E L L E N C E I N E X E C U T I O N
B E S T - I N - C L A S S S E R V I C E S | T A I L O R - M A D E - S O L U T I O N SL O G I S T I C S | M E R G E R S & A C Q U I S I T I O N S
F I N A N C I A L T R A N S A C T I O N SB E S T - I N - C L A S S P R O F I T A B I L I T Y
MERGERS&
ACQUIS IT IONS
D
fu
rt
he
r
in
fo
rm
at
io
nf
in
an
ci
al
s
ta
te
me
nt
s
C
ma
na
ge
me
nt
r
ep
or
t
B
to
o
ur
s
ha
re
ho
ld
er
s
A

T O O U R S H A R E H O L D E R S
Content
A N N U A L R E P O R T 2 0 1 5 – B R E N N T A G A G3 4
T O O U R S H A R E H O L D E R S
34 – 67

T O O U R S H A R E H O L D E R S
Content
A N N U A L R E P O R T 2 0 1 5 – B R E N N T A G A G 3 5
36 BRENNTAG ON THE STOCK MARKET
42 REPORT OF THE SUPERVISORY BOARD
48 CORPORATE GOVERNANCE
48 Corporate Governance Report
54 Declaration on Corporate Governance
56 Board of Management
66 Supervisory Board
D
fu
rt
he
r
in
fo
rm
at
io
nf
in
an
ci
al
s
ta
te
me
nt
s
C
ma
na
ge
me
nt
r
ep
or
t
B
to
o
ur
s
ha
re
ho
ld
er
s
A

BRENNTAG ON THE STOCK MARKET
DEVELOPMENT OF THE SHARE PRICE
In the first half of 2015 the stock markets saw a positive trend. Uncertainties and political conflicts in
parts of Europe and in some emerging economies faded more and more into the background in
course of the first six months of the year. This positive trend on the stock markets in Europe was also
supported by the European Central Bank’s expansionary monetary policy, the continuing low interest
rate level and the devaluation of the euro against the US dollar. However, from mid-August stock
prices decreased due to fears of an economic slowdown of the Chinese economy, a new crisis in the
emerging markets and ongoing geopolitical conflicts. The European Central Bank’s continued capital-
market- friendly policy, a lower oil price and a euro which remained weak against the US dollar did
not serve as sufficient stimulus to completely offset the increasing sense of uncertainty. Only towards
the end of the year did share prices see a recovering trend.
Similar trends could also be seen in Germany. Both DAX® and MDAX® were not able to maintain their
all-time highs of the first half of 2015 but still closed on a higher level compared to previous year’s end.
The DAX® closing level at the end of 2015 of 10,743 points represented an increase of 9.6 % since the
beginning of the year and the MDAX® increased by 22.7 % to a level of 20,774 points. The Brenntag
share closed at EUR 48.28, up 3.8 % from the beginning of the year. According to the ranking list of
Deutsche Börse AG, Brenntag AG ranked 32nd among all listed companies in Germany in terms of
market capitalization at the end of 2015. The average number of Brenntag shares traded on Xetra®
each day in 2015 was approximately 285,000 compared with around 270,000 in the prior-year period.
a.01 development of the brenntag share price (indexed) brenntag mdax®
DEC JAN FEB MAR APR MAY JUN JUL AUG SEP OCT NOV DEC2014 2015
development of the brenntag share price (indexed)
80
90
100
110
120
130
140
T O O U R S H A R E H O L D E R S
Brenntag on the Stock Market
A N N U A L R E P O R T 2 0 1 5 – B R E N N T A G A G3 6

BRENNTAG IN DIALOGUE WITH THE CAPITAL MARKET
Our Investor Relations activities aim at a fair communication policy which is characterized by equal
treatment of all stakeholders. Through openness and transparency, we want to raise awareness for
our share as an attractive investment and further increase Brenntag’s standing in the capital market.
We communicate our company’s business performance and strategy both continuously and reliably.
This further strengthens the investors’ trust in Brenntag and enables us to achieve a sustainably fair
valuation of our share on the capital market.
In 2015, we again attached significant importance to personal contact with the capital market partici-
pants. The Board of Management and the Investor Relations team were in constant dialogue with
investors and analysts worldwide. We discussed the company’s business performance in detail in
numerous one-on-one and group meetings at road shows, investor conferences and on other occa-
sions like our capital markets day and the Annual General Shareholders’ Meeting. In addition to the
above-mentioned activities, the Board of Management and the Investor Relations team regularly pro-
vided investors, analysts and private shareholders with information on Brenntag AG in numerous
phone calls.
We provide comprehensive and up-to-date information on the Brenntag share and the bonds on the
website at www.brenntag.com under Investor Relations.
In the coming year, we will continue to present the company at numerous road shows and capital
market events. You will find the latest list of dates in our financial calendar on the Brenntag website
under Investor Relations.
SHAREHOLDER STRUCTURE
As of March 1, 2016 notifications had been received, in accordance with Section 21, para. 1 of the
German Securities Trading Act (WpHG), from the following shareholders that their percentage of the
voting rights now exceeds the 3 % or 5 % threshold:
shareholder structure
Shareholder Proportion in % Date of notification
BlackRock >5 June 26, 2015
Threadneedle >5 July 23, 2012
Sun Life / MFS >5 July 3, 2012
Oppenheimer Funds, Inc. >3 Dec. 7, 2015
Norges Bank >3 Dec. 2, 2015
Allianz Global Investors >3 Feb. 25, 2014
a.02 shareholder structure
Brenntag AG Corporate Finance & Investor Relations Phone: + 49 (0) 208 7828 7653 E-mail: [email protected]
The notifications are available at www.brenntag.com/voting_rights_announcements
Further information at www.brenntag.com under Investor Relations
T O O U R S H A R E H O L D E R S
Brenntag on the Stock Market
A N N U A L R E P O R T 2 0 1 5 – B R E N N T A G A G 3 7D
fu
rt
he
r
in
fo
rm
at
io
nf
in
an
ci
al
s
ta
te
me
nt
s
C
ma
na
ge
me
nt
r
ep
or
t
B
to
o
ur
s
ha
re
ho
ld
er
s
A

key figures and master data on the brenntag share
IPOMar. 29, 2010 Dec. 31, 2014 Dec. 31, 2015
No. of shares (unweighted) 1) 154,500,000 154,500,000 154,500,000
Price (Xetra® closing price) 1) 16.67 46.51 48.28
Free float % 29.03 100.00 100.00
Free float market capitalization EUR m 748 7,186 7,459
Most important stock exchange Xetra®
Indices MDAX®, MSCI, STOXX EUROPE 600
ISIN / WKN / trading symbol DE000A1DAHH0 / A1DAHH / BNR
a.03 key figures and master data on the brenntag share
Below you will find the most important information on the Brenntag share:
1) As part of a stock split, the number of shares was increased in the third quarter of 2014 from 51.5 million to 154.5 million. The number of shares and the share prices have been retroactively adjusted to the stock split.
ANALYSTS’ OPINIONS
Currently (as of March 1, 2016) 19 banks regularly publish research reports on the latest develop-
ment of our company and give recommendations. Nine analysts give a buy recommendation for the
Brenntag share, eight recommend holding the share and two are advising to sell. Many analysts
value Brenntag highly as a growth stock with strong cash flow generation.
a.04 analysts’ opinions
analysts’ opinions
9BUY
8HOLD
2SELL
Current analysts’ opinions at www.brenntag.com/analysts_opinions
T O O U R S H A R E H O L D E R S
Brenntag on the Stock Market
A N N U A L R E P O R T 2 0 1 5 – B R E N N T A G A G3 8

key figures and master data on the bonds of the brenntag group
Bond 2018Bond (with Warrants)
2022
Issuer Brenntag Finance B.V. Brenntag Finance B.V.
ListingLuxembourg stock
exchange Frankfurt Freiverkehr
ISIN XS0645941419 DE000A1Z3XQ6
Aggregate principal amount EUR m 400 USD m 500
Denomination EUR 1,000 USD 250,000
Minimum transferrable amount EUR 50,000 USD 250,000
Coupon % 5.50 1.875
Interest payment Jul. 19Semi-
annual Jun. 2 / Dec. 2
Maturity Jul. 19, 2018 Dec. 2, 2022
a.05 key figures and master data on the bonds of the brenntag group
CREDITOR RELATIONS
Brenntag’s strong credit profile is reflected by investment grade ratings from two international rating
agencies: Standard & Poor’s has assigned a “BBB” rating (outlook: stable) and Moody’s has assigned a
“Baa3” rating (outlook: stable).
On November 25, 2015, Brenntag successfully finalized the placement of a senior, unsecured bond
with warrant units due 2022 with a final issue size of USD 500 million and a coupon of 1.875 % per
annum. The offering was placed with institutional investors and was significantly over-subscribed.
The warrants provide for the option to acquire ordinary registered no-par-value shares of Brenntag AG
against payment of the initial exercise price which was fixed at EUR 72.93, representing a 45 % premium
on the prevailing share price on the launch day. The bond with warrant units matures after 7 years.
On July 19, 2011, Brenntag Finance B.V., Amsterdam, Netherlands, an indirectly held 100 % subsidiary
of Brenntag AG, issued a corporate bond with a volume of EUR 400 million. The seven-year bond
bears a coupon of 5.50 %. The issue price was at 99.321 % of the nominal value.
Below you will find the most important information on the bonds of the Brenntag Group:
T O O U R S H A R E H O L D E R S
Brenntag on the Stock Market
A N N U A L R E P O R T 2 0 1 5 – B R E N N T A G A G 3 9D
fu
rt
he
r
in
fo
rm
at
io
nf
in
an
ci
al
s
ta
te
me
nt
s
C
ma
na
ge
me
nt
r
ep
or
t
B
to
o
ur
s
ha
re
ho
ld
er
s
A

GENERAL SHAREHOLDERS’ MEETING
The 2015 Annual General Shareholders’ Meeting of Brenntag AG was held in Düsseldorf on June 9.
Based on the Board of Management’s report on the development of the company in the 2014 finan-
cial year and the future strategy of the Group as well as the general discussion, the shareholders pres-
ent were able to gain a comprehensive picture of Brenntag AG. 51.07 % of the share capital of
154,500,000 shares was represented.
A key item on the agenda of the General Shareholders’ Meeting was the elections to the Supervisory
Board. The shareholders voted to renew the positions of existing members Stefan Zuschke, Dr Thomas
Ludwig, Prof. Dr Edgar Fluri, Doreen Nowotne and Dr Andreas Rittstieg. Stefanie Berlinger was elected
to the six-member Supervisory Board for the first time. She replaces Stephen Clark, who retired from
the committee at the end of the General Shareholders’ Meeting.
The Annual General Shareholders’ Meeting approved the distribution of a dividend of EUR 0.90 (previ-
ous year: EUR 0.87) per share. The payout ratio was 41.0 % of the profit after tax attributable to share-
holders of Brenntag AG for 2014.
ATTRACTIVE DIVIDEND PROPOSAL FOR 2015
It is Brenntag’s declared policy to pay an annual dividend of 30 % to 45 % of its consolidated profit
after tax attributable to shareholders of Brenntag AG. The Board of Management and Supervisory
Board will recommend to shareholders at the General Shareholders’ Meeting to pay a dividend of
EUR 1.00 per share. The payout ratio on the basis of the consolidated profit after tax attributable to
shareholders of Brenntag AG for the year would therefore be 42.3 %. With this payout ratio we would
like our shareholders to directly participate in the positive cash flow development of the company.
EUR 1.00dividend proposal 2015
T O O U R S H A R E H O L D E R S
Brenntag on the Stock Market
A N N U A L R E P O R T 2 0 1 5 – B R E N N T A G A G4 0
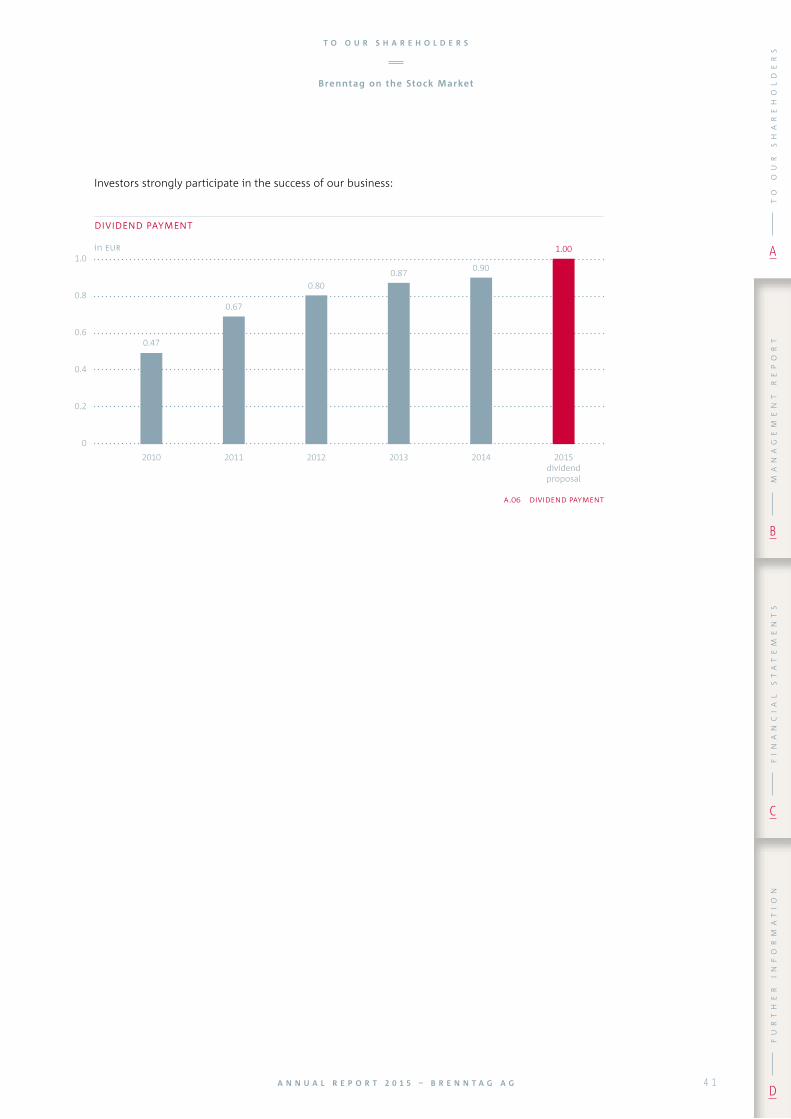
Investors strongly participate in the success of our business:
a.06 dividend payment
dividend payment
1.0
0.8
0.6
0.4
0.2
0
2010 2011 2012 2013 2014 2015dividendproposal
0.900.87
0.80
0.67
0.47
1.00in eur
T O O U R S H A R E H O L D E R S
Brenntag on the Stock Market
A N N U A L R E P O R T 2 0 1 5 – B R E N N T A G A G 4 1D
fu
rt
he
r
in
fo
rm
at
io
nf
in
an
ci
al
s
ta
te
me
nt
s
C
ma
na
ge
me
nt
r
ep
or
t
B
to
o
ur
s
ha
re
ho
ld
er
s
A

REPORT OF THE SUPERVISORY
BOARD
S T E F A N Z U S C H K EChairman
T O O U R S H A R E H O L D E R S
Report of the Supervisory Board
A N N U A L R E P O R T 2 0 1 5 – B R E N N T A G A G4 2

Dear Shareholders,
Brenntag increased earnings again in 2015, even though the economic upturn and growth impetus
expected in some regions and industries were much weaker than forecast or failed to materialize at
all. This positive trend testifies to Brenntag’s fundamentally correct, growth-oriented and forward-
looking positioning and the systematic implementation of its strategy by the company’s management.
COMPOSITION OF THE BOARD OF MANAGEMENT AND SUPERVISORY BOARD
There were changes in the composition of both the Board of Management and the Supervisory Board
of Brenntag AG in the reporting period.
On January 5, 2015, the Supervisory Board resolved to extend the contract of current CEO Steven Holland
by five years until February 29, 2020. On May 28, 2015, the Supervisory Board passed a resolution to
expand the Board of Management from three to five members with effect from July 1, 2015. Karsten
Beckmann, Markus Klähn and Henri Nejade were appointed to the Board of Management to serve
alongside the current members, CEO Steven Holland and CFO Georg Müller. The three long-standing,
experienced Brenntag managers bring additional industry and functional expertise and, in particular,
further international and regional experience and knowledge to the Board of Management. Its expan-
sion enables the company’s overall growth potential to be increased and an even greater focus to be
placed on the Group’s strategic development both globally and in the different regions. William Fidler
stepped down from the Board of Management of Brenntag AG and entered retirement when his con-
tract expired on June 30, 2015. The Supervisory Board expresses its sincere thanks to William Fidler
for his decades-long commitment to Brenntag, during which he contributed in various functions sub-
stantially to the company’s global success.
On June 9, 2015, the Supervisory Board was freshly elected at the Annual General Shareholders’ Meet-
ing of Brenntag AG. The terms of office of existing members Stefan Zuschke, Dr Thomas Ludwig, Prof.
Dr Edgar Fluri, Doreen Nowotne and Dr Andreas Rittstieg were extended. Stefanie Berlinger was
newly elected to the six-member Supervisory Board. She succeeds Stephen Clark, who stepped down
from the Board at the close of the 2015 General Shareholders’ Meeting. The Supervisory Board would
like to thank Stephen Clark on behalf of Brenntag for his outstanding achievements and exceptional
commitment over almost four decades. At its meeting on June 9, 2015, the newly constituted Supervi-
sory Board re-elected Stefan Zuschke as Chairman, Dr Thomas Ludwig as Deputy Chairman and the
members of the Supervisory Board’s standing committees.
COOPERATION BETWEEN THE BOARD OF MANAGEMENT AND SUPERVISORY BOARD
In financial year 2015, the Supervisory Board of Brenntag AG performed the duties assigned to it by
law, by the company’s Articles of Association and by its rules of procedure with great diligence. The
members of the Supervisory Board regularly advised the Board of Management in its management of
the company and monitored its activities. The Board of Management provided the Supervisory Board
with timely and comprehensive information, in both written and verbal form, on the course of busi-
ness, earnings, corporate planning, strategic further development and the Group’s current position.
The Supervisory Board was also kept abreast of Brenntag AG’s risk position, including risk manage-
ment, deviations from plan, and compliance matters. Furthermore, the Chairman of the Supervisory
Board and the Chairman of the Board of Management regularly exchanged information. The Supervi-
sory Board was therefore able to discuss the company’s strategic direction and business transactions
T O O U R S H A R E H O L D E R S
Report of the Supervisory Board
A N N U A L R E P O R T 2 0 1 5 – B R E N N T A G A G 4 3D
fu
rt
he
r
in
fo
rm
at
io
nf
in
an
ci
al
s
ta
te
me
nt
s
C
ma
na
ge
me
nt
r
ep
or
t
B
to
o
ur
s
ha
re
ho
ld
er
s
A

of key importance with the Board of Management and to vote on them. Further information on the
duties of the Supervisory Board can be found in the Corporate Governance Report.
In all cases, the Supervisory Board approved the resolutions proposed by the Board of Management
after examining and discussing them extensively. Please refer to the following chapter, “Topics
addressed in the Supervisory Board meetings”, for details.
The Supervisory Board held four ordinary and three extraordinary meetings in the reporting period.
All members of the Supervisory Board attended each of the ordinary meetings. Two Supervisory Board
members in each case sent apologies for their absence from two extraordinary meetings, while one
Supervisory Board member sent apologies for being absent from the third extraordinary meeting.
TOPICS ADDRESSED IN THE SUPERVISORY BOARD MEETINGS
The main item on the agenda at the ordinary meeting on March 16, 2015 was the 2014 consolidated
financial statements of Brenntag AG. Following detailed explanations from the Board of Management
and the appointed auditors, PricewaterhouseCoopers Aktiengesellschaft Wirtschaftsprüfungsgesell-
schaft, Düsseldorf, and after thorough discussion, the Supervisory Board approved the consolidated
financial statements of Brenntag AG for financial year 2014 as well as the annual financial statements
of Brenntag AG and thereby adopted the 2014 annual financial statements. At the meeting, the Board
of Management also reported on the course of business in the first few months of 2015. One point of
focus here was the development in the North American oil & gas segment and in Brazil and Mexico.
In addition, the Supervisory Board was briefed on specific risks in selected countries and dealt with
the status report on current and planned acquisitions as well as on the integration of the companies
acquired in financial year 2014. Planned refinancing measures and the agenda for the 2015 General
Shareholders’ Meeting were further topics covered at the meeting. Lastly, the Supervisory Board
approved the signing of the lease for Brenntag’s new corporate headquarters in Essen.
The next ordinary meeting took place on June 9, 2015 after the 2015 General Shareholders’ Meeting.
The Board of Management provided the Supervisory Board with detailed information on the current
financial situation of the Group as a whole and the four regions. The possible impact on Brenntag of
the crisis in Greece and the sustained low oil price were also discussed. Other items on the agenda
included an overview of planned acquisitions, the global human resources organization, the planned
refinancing by means of a bond with warrant units and the statutory quota for women on supervisory
and management boards that is required to be observed by listed companies. In addition, the Supervi-
sory Board approved the proposed division of responsibilities on the extended Board of Management
of Brenntag AG as of July 1, 2015.
At the ordinary meeting on September 10, 2015, the Global Human Resources Director newly
appointed in April 2015 presented the next steps in the development of the global HR strategy and
provided an overview of the principal HR projects. At the meeting, the Supervisory Board turned its
attention to the implementation of the German Act to Promote Equal Participation of Women and
Men in Management Positions in the Private and Public Sector (FührposGleichberG) and adopted tar-
gets for the percentage of women on Brenntag AG’s corporate bodies, according to which the current
quota of 33.3 % on the Supervisory Board and 0 % on the Board of Management are to be retained
until June 30, 2017. Another point of focus was the discussion on planned acquisitions. At the meet-
ing, the Supervisory Board approved the acquisition of Turkish distribution company Parkoteks Kimya
San., which focuses on the distribution of specialty chemicals in the personal care sector. In addition,
T O O U R S H A R E H O L D E R S
Report of the Supervisory Board
A N N U A L R E P O R T 2 0 1 5 – B R E N N T A G A G4 4

the Board of Management explained the current business situation, provided information on the bud-
get planning process for financial year 2016 and gave an overview of investor relations activities.
On September 16, 2015, an extraordinary meeting was held by teleconference. This was due to the
planned acquisition of TAT Group, a Singapore-based distributor of industrial chemicals. Following a
detailed explanation of the strategic objectives of this acquisition and the firm’s business model, the
Supervisory Board approved the transaction.
In an extraordinary meeting also held by teleconference on October 21, 2015, the members of the
Supervisory Board turned their attention to the planned acquisition of G.H. Berlin-Windward Inc.
headquartered in Manchester, New Hampshire. The company holds a strong position in the distribu-
tion market for lubricants in the northeast USA. After thorough discussion with the Board of Manage-
ment, the Supervisory Board approved the acquisition.
On November 4, 2015, the Supervisory Board came together in another teleconference and, following
a detailed explanation of the reasons and arrangements by the Board of Management, approved the
acquisition of J.A.M. Distributing Company, LLC, headquartered in Houston, Texas. The US company is
a leading distributor of lubricants on the Gulf Coast and in northern Texas.
In the last meeting of the reporting period on December 17, 2015, the members of the Supervisory
Board discussed the projected results for financial year 2015, the budget planning for 2016 and the
mid-term strategy of the Brenntag Group. Also the impact of digitalisation on the business operations
of Brenntag Group was discussed. The Chairman reported on the Supervisory Board efficiency review
that was conducted in the reporting period. Other agenda items included current acquisition projects
and the Board of Management’s explanation of the Group’s acquisition strategy. The Board of Man-
agement also reported on current HR projects. Following detailed discussion, the Supervisory Board
approved the purchase of a distribution site to be set up in Dongguang (southern China) in order to
expand the business of Zhong Yung, the acquisition of German company Leis Polytechnik polymere
Werkstoffe GmbH and a Group guarantee for ExxonMobil.
After thorough examination and consultation, the Supervisory Board resolved to submit the declara-
tion of conformity with the German Corporate Governance Code in accordance with Section 161 of
the German Stock Corporation Act (AktG), which was signed jointly by the chairmen of the Board of
Management and the Supervisory Board on the same day.
SUPERVISORY BOARD COMMITTEE ACTIVITIES
In financial year 2015, the Supervisory Board of Brenntag AG once again had two committees:
the Audit Committee and the Presiding and Nomination Committee. The chairmen reported in
detail on the current work of the committees in the Supervisory Board meetings. In addition, a
“Convertible / Warrant-linked Bond Committee” was set up in the reporting period.
Until the close of the General Shareholders’ Meeting on June 9, 2015, the members of the Audit Com-
mittee were Prof. Dr Edgar Fluri (Chairman), Doreen Nowotne and Stephen Clark. The latter stepped
down from the Supervisory Board on June 9, 2015. He is followed by Stefanie Berlinger. In the reporting
period, the Audit Committee held four meetings, during which it dealt with the following core topics:
the audit of the consolidated financial statements and the annual financial statements of Brenntag AG
for 2014, monitoring by Corporate Internal Audit, the effectiveness of the internal control system and
the further development of compliance monitoring activities. The work of the auditors was also
T O O U R S H A R E H O L D E R S
Report of the Supervisory Board
A N N U A L R E P O R T 2 0 1 5 – B R E N N T A G A G 4 5D
fu
rt
he
r
in
fo
rm
at
io
nf
in
an
ci
al
s
ta
te
me
nt
s
C
ma
na
ge
me
nt
r
ep
or
t
B
to
o
ur
s
ha
re
ho
ld
er
s
A

addressed and a decision taken on the proposal regarding the election of the auditor for the new
financial year and for the respective quarterly results. Other topics included the Group-wide treasury
organization, information on the German Act Implementing EMIR (European Market Infrastructure
Regulation) and legal changes related to the German Statutory Auditor Supervision Reform Act (APA-
ReG) and the German Statutory Audit Reform Act (AReG).
The Presiding and Nomination Committee, composed of Stefan Zuschke (Chairman), Dr Thomas
Ludwig and Dr Andreas Rittstieg, met twice in the reporting period; in addition, two teleconferences
were held to prepare personnel decisions. On March 16, 2015, the Committee agreed on a recom-
mendation to the Supervisory Board to submit to the General Shareholders’ Meeting on June 9, 2015
a specific motion regarding the candidates for election to the Supervisory Board. On May 28, 2015,
following detailed discussion of the medium- and long-term succession plans, the Committee passed
a resolution on the appointment and the signing of the employment contracts of Board of Manage-
ment members Karsten Beckmann, Markus Klähn and Henri Nejade, and prepared a resolution in this
regard for the Supervisory Board.
On June 29, 2015, the Supervisory Board appointed a “Convertible / Warrant-linked Bond” Committee,
composed of Stefan Zuschke (Chairman), Stefanie Berlinger and Doreen Nowotne, by circular resolu-
tion. This Committee is authorized to pass all the Supervisory Board resolutions necessary in connec-
tion with the issue of a convertible / warrant-linked bond. On November 25, 2015, the Committee
came together for two teleconferences, during which it passed the necessary resolutions approving
the issue of the bond with warrant units maturing in 2022 and the final terms of the issue.
GERMAN CORPORATE GOVERNANCE CODE
The Supervisory Board of Brenntag AG regularly discusses a wide variety of corporate governance
requirements and principles and their implementation within the company. In line with the require-
ments of the German Corporate Governance Code, the Supervisory Board informs the General Share-
holders’ Meeting of any conflicts of interest that have arisen among Supervisory Board members. The
Supervisory Board was not made aware of any such conflicts of interest in the entire reporting period.
On December 17, 2015, the Supervisory Board and the Board of Management jointly submitted a new
declaration of conformity, according to which Brenntag AG complies and plans to continue to comply
with the recommendations of the Government Commission “German Corporate Governance Code”
as amended on May 5, 2015, published by the Federal Ministry of Justice in the official section of the
Federal Gazette (Bundesanzeiger), in each case with the exception of the recommendation in number
4.2.3, para. 3 and number 5.4.1, para. 2 of the Code. The exceptions are declared for the following
reasons: Brenntag AG generally follows the recommendation in number 4.2.3, para. 3. However, two
members of the Board of Management have pension awards based on contractually specified defined
contribution plans that do not aim to achieve a specific level of provision. With regard to pension
awards, therefore, the Supervisory Board does not refer to a targeted level of provision.
Furthermore, the Supervisory Board does not set a regular limit on length of membership of the
Supervisory Board, as recommended in number 5.4.1, para. 2 of the Code. A regular limit on length of
membership of the Supervisory Board does not take into account the advantages which individual
members’ experience brings and which are, if at all possible, to be retained.
In the new declaration of conformity, the Board of Management and Supervisory Board also declare
that, since its last declaration of conformity dated December 15, 2014, Brenntag AG has complied in
T O O U R S H A R E H O L D E R S
Report of the Supervisory Board
A N N U A L R E P O R T 2 0 1 5 – B R E N N T A G A G4 6

the reporting period with all recommendations of the German Corporate Governance Code, as
amended on June 24, 2014, with the exception of the recommendation in number 4.2.3, para. 3 of
the Code. Details on corporate governance in the company can be found in the Corporate Gover-
nance Report.
EXAMINATION AND ADOPTION OF THE ANNUAL FINANCIAL STATEMENTS, APPROVAL OF THE CONSOLIDATED FINANCIAL STATEMENTS, PROPOSAL FOR THE APPROPRIATION OF PROFIT
The annual financial statements of Brenntag AG for the year ended December 31, 2015 and the com-
bined Group management report and management report of Brenntag AG were prepared by the
Board of Management in accordance with the provisions of the German Commercial Code (HGB) and
the German Stock Corporation Act (AktG), and the consolidated financial statements, pursuant to Sec-
tion 315a of the German Commercial Code, in accordance with the principles of the International
Financial Reporting Standards (IFRSs) as adopted in the EU.
PricewaterhouseCoopers Aktiengesellschaft Wirtschaftsprüfungsgesellschaft, Düsseldorf, the auditors
elected by the General Shareholders’ Meeting and appointed by the Supervisory Board, audited and
issued unqualified auditors’ reports on the annual financial statements of Brenntag AG, the combined
Group management report and management report of Brenntag AG and the consolidated financial
statements.
The annual financial statements of Brenntag AG, the consolidated financial statements and the com-
bined Group management report and management report of Brenntag AG as well as the auditors’
audit reports were available to all members of the Supervisory Board in good time ahead of the Audit
Committee meeting on March 4, 2016 and the Supervisory Board meeting on the financial statements
on March 14, 2016. The financial statement documents were discussed in detail on the Audit Commit-
tee and in the Supervisory Board’s meeting on the financial statements, in both cases in the presence
of the auditors, who gave a report.
The Supervisory Board endorses the findings of the audit. Following the preliminary examination by
the Audit Committee and the Supervisory Board’s own review during its meeting on March 14, 2016,
there were no objections to be raised. The Supervisory Board approved the above-mentioned finan-
cial statements prepared by the Board of Management. The annual financial statements were thus
adopted on March 14, 2016. We concur with the Board of Management’s proposal to use the distri-
butable profit to pay a dividend of EUR 1.00 per dividend-bearing no-par-value share.
The Supervisory Board expresses its thanks and appreciation to the Brenntag Board of Management
and all employees for their dedicated work in financial year 2015.
On behalf of the Supervisory Board
Stefan Zuschke
Chairman
Mülheim an der Ruhr, March 2016
T O O U R S H A R E H O L D E R S
Report of the Supervisory Board
A N N U A L R E P O R T 2 0 1 5 – B R E N N T A G A G 4 7D
fu
rt
he
r
in
fo
rm
at
io
nf
in
an
ci
al
s
ta
te
me
nt
s
C
ma
na
ge
me
nt
r
ep
or
t
B
to
o
ur
s
ha
re
ho
ld
er
s
A

CORPORATE GOVERNANCE REPORT
Corporate governance is the good and responsible management and monitoring of a company. In
this chapter, which also makes reference to the Remuneration Report, the Board of Management and
the Supervisory Board of Brenntag AG report in detail, in accordance with number 3.10 of the German
Corporate Governance Code in the version dated May 5, 2015 (hereinafter referred to as “Code”), on
the principles of responsible corporate governance at Brenntag.
COMMITMENT TO RESPONSIBLE CORPORATE GOVERNANCE
Brenntag has always attached great importance to responsible and prudent corporate governance. As
in the previous year, the Board of Management and the Supervisory Board thoroughly examined the
requirements of the Code and their fulfilment in this reporting period. On the basis of these delibera-
tions, the Board of Management and Supervisory Board issued, on December 17, 2015, the declara-
tion of conformity with the recommendations of the Code, made in accordance with Section 161,
para. 1 of the German Stock Corporation Act. The exact wording of the declaration of conformity is
given in the chapter “Corporate Governance Statement” and is also posted on the Brenntag AG web-
site, where declarations of previous years will remain accessible as well. If there are any changes in
the handling of the recommendations of the Code, the declaration of conformity will be updated
during the year and posted in its amended form on the website of Brenntag AG.
In the reporting year, the Government Commission “German Corporate Governance Code” resolved
not only editorial but also material changes to the Code which particularly underline the increasing
importance of the Supervisory Board’s role. The amended version was published in the Federal
Gazette (Bundesanzeiger) on June 12, 2015.
Since its last declaration of conformity in December 2014, Brenntag AG has complied with the recom-
mendations of the Code in the version dated June 24, 2014 with one exception and with the recom-
mendations of the Code in the version dated May 5, 2015 with two exceptions, and also plans to com-
ply in future with the recommendations of the Code in its latest version with two exceptions.
In the current declaration of conformity, an exception to number 4.2.3, para. 3 of the Code was
declared regarding pension awards for Board of Management members as two members of the Board
of Management have contractually specified defined contribution plans that do not aim to achieve a
specific level of provision. Furthermore, the Supervisory Board has not set a regular limit on length of
membership of the Supervisory Board. Therefore, an exception to number 5.4.1, para. 2 of the Code
was declared.
CORPORATE GOVERNANCE
T O O U R S H A R E H O L D E R S
Corporate Governance
A N N U A L R E P O R T 2 0 1 5 – B R E N N T A G A G4 8

COMPOSITION OF THE GOVERNING BODIES
As a company established in accordance with the German Stock Corporation Act, Brenntag AG has a
two-tier management system, consisting of the Board of Management and the Supervisory Board.
COMPOSITION OF THE BOARD OF MANAGEMENT
The Board of Management of Brenntag AG is composed of five members. Steven Holland remains
Chairman of the Board of Management.
COMPOSITION OF THE SUPERVISORY BOARD
The number of members of the Supervisory Board remained unchanged at six members in the report-
ing year. The terms of office of all the members of the Supervisory Board expired at the close of the
General Shareholders’ Meeting, which resolved on the formal discharge of the members of the Super-
visory Board for financial year 2014. Therefore, new elections for the Supervisory Board were held at
the General Shareholders’ Meeting on June 9, 2015. Stephen Clark did not put himself up as a candidate
for a further term of office. The other Supervisory Board members were re-elected. Stefanie Berlinger
was elected as a new Supervisory Board member.
In line with the recommendation in number 5.4.1, para. 2 in conjunction with number 5.4.2 of the
Code, in December 2015 the Supervisory Board specified concrete objectives regarding its composi-
tion which, whilst considering the specifics of the company, take into account the company’s interna-
tional activities, potential conflicts of interest, the number of independent Supervisory Board mem-
bers, diversity and an appropriate degree of female representation:
At least 15 % of the members of the Supervisory Board shall have relevant industry experience.
At least 15 % of the members of the Supervisory Board shall have particularly great experience
gained abroad. This experience may also have been gained in other industries.
At least 50 % of the members of the Supervisory Board shall not hold offices at customers’, suppli-
ers’ or lenders’ of the company.
At least 50 % of the members of the Supervisory Board shall be independent within the meaning of
number 5.4.2 of the German Corporate Governance Code.
At least 33.3 % of the seats on the Supervisory Board shall be filled by women with the appropriate
qualifications by June 30, 2017.
No member of the Supervisory Board shall continue to hold office beyond the close of the General
Shareholders’ Meeting following his / her 70th birthday.
As in the previous year, the Supervisory Board fully meets the objectives which it has set itself and
complies with the requirements of the Code with the two declared exceptions regarding the level of
pension award provision and the regular limit on length of membership of the Supervisory Board.
The composition of the Supervisory Board of Brenntag AG must be chosen in such a way that effective
monitoring of and advice to the Board of Management are ensured. Therefore, members are to be
chosen for their professional qualifications, their knowledge and their particular experience. Stephen
Clark, member of the Supervisory Board of Brenntag AG until June 9, 2015, worked for Brenntag from
1981; from 2006 to 2011 as the Chairman of Brenntag’s Board of Management and, from its IPO in
2010, as Chief Executive Officer of Brenntag AG. Stefan Zuschke and Doreen Nowotne have been
Members of the Supervisory Board www.brenntag.com/supervisory_board
T O O U R S H A R E H O L D E R S
Corporate Governance
A N N U A L R E P O R T 2 0 1 5 – B R E N N T A G A G 4 9D
fu
rt
he
r
in
fo
rm
at
io
nf
in
an
ci
al
s
ta
te
me
nt
s
C
ma
na
ge
me
nt
r
ep
or
t
B
to
o
ur
s
ha
re
ho
ld
er
s
A

advising Brenntag Management GmbH since 2006 and, following its conversion into a stock corpora-
tion, Brenntag AG, and therefore have special company and industry-specific knowledge. Dr Thomas
Ludwig and Dr Andreas Rittstieg have been members of the Supervisory Board of Brenntag AG
since Brenntag AG’s IPO in 2010. Dr Thomas Ludwig has many years of experience in the industry.
Dr Andreas Rittstieg has recognised expertise in the fields of Mergers & Acquisitions, company law
and compliance. Through the election of the Swiss national, Prof. Dr Edgar Fluri, who has particularly
great experience abroad, the company also documents its claim to internationality, also with regard
to its supervisory functions. Stefanie Berlinger, elected to the Supervisory Board of Brenntag AG on
June 9, 2015, has particularly great financial and capital market expertise. In line with the Supervisory
Board’s objectives, only one member of the Supervisory Board held office at customers’, suppliers’ or
lenders’ of the Company as at December 31, 2015.
Once again no specific objectives with regard to employee representatives have been set since the
Supervisory Board of Brenntag AG has no employee representatives as members.
SHARES HELD BY THE BOARD OF MANAGEMENT AND SUPERVISORY BOARD
On December 31, 2015, no member of the Board of Management or the Supervisory Board held share
packages of Brenntag AG or financial instruments relating to such shares, which in each case exceed
1 % of the shares issued by Brenntag AG either directly or indirectly. At that date, the total number of
shares held by all members of the Board of Management and Supervisory Board together also did not
exceed 1 % of the shares issued by the company.
AVOIDANCE OF CONFLICTS OF INTEREST ON THE BOARD OF MANAGEMENT AND THE SUPERVISORY BOARD
There were again no advisory or other service agreements and contracts for work between a member
of the Supervisory Board and the company or the other consolidated subsidiaries in the reporting
period 2015. There were no conflicts of interest of Board of Management or Supervisory Board mem-
bers which are to be reported immediately to the Supervisory Board owing to the duty of loyalty to
the company. Further relevant details can be found in the Report of the Supervisory Board. Further
mandates held by the members of the Supervisory Board on supervisory boards to be established by
law or on comparable domestic and foreign supervisory bodies of business enterprises are listed in
detail in the chapter “Members of the Supervisory Board”. In line with the recommendation of the
Code (cf. number 5.4.5, para. 1), no member of the Board of Management has accepted more than a
total of three supervisory board mandates in non-Group listed companies or in supervisory bodies of
non-Group companies which make similar requirements.
T O O U R S H A R E H O L D E R S
Corporate Governance
A N N U A L R E P O R T 2 0 1 5 – B R E N N T A G A G5 0

REPORTABLE SECURITIES TRANSACTIONS OF BOARD OF MANAGEMENT AND SUPERVISORY BOARD MEMBERS
Pursuant to Section 15a of the German Securities Trading Act (WpHG), any persons working in a man-
agement capacity for an issuer of securities as well as related parties are obliged to report transac-
tions involving Brenntag shares or related financial instruments if the value of the transactions which
they have made in one calendar year reaches or exceeds EUR 5,000. In financial year 2015, seven
transactions were reported to Brenntag AG, all of which were duly published and can also be accessed
at any time on the website of Brenntag AG under the section “Financial News / Directors’ Dealings”.
MATERIAL AMENDMENTS TO THE GERMAN CORPORATE GOVERNANCE CODE
In the reporting year, not only editorial but also material changes were made to the Code which par-
ticularly underline the increasing importance of the Supervisory Board’s role. When setting its objec-
tives regarding composition, the Supervisory Board shall, in future, specify a regular limit on length of
membership of the Supervisory Board. The Supervisory Board shall, in accordance with number 5.1.2
of the latest version of the Code, determine targets in terms of the share of women on the Board of
Management and, in accordance with number 5.4.1., on the Supervisory Board and set deadlines for
achieving the targets.
DECLARATION OF EXCEPTIONS TO THE GERMAN CORPORATE GOVERNANCE CODE
In accordance with number 4.2.3, para. 3 of the Code, for pension plans the Supervisory Board shall
establish the level of provision aimed for in each case – also considering the length of time for which
the individual has been a Board of Management member – and take into account the resulting annual
and long-term expense for the company. In principle, the relevant agreements made with the mem-
bers of the Board of Management meet these requirements. The exception to this recommendation
declared in the 2014 declaration of conformity was declared in the current declaration of conformity
for two members of the Board of Management who have defined contribution plans which do not
aim to achieve a specific level of provision. With regard to pension awards, the Supervisory Board
does not, therefore, refer to a targeted level of provision. From the company’s point of view, this
approach is even preferable to the approach of a defined benefit plan, as external risks and invest-
ment risks are not shifted to the Company.
In accordance with number 5.4.1, para. 2 of the Code, the Supervisory Board shall specify a regular
limit on length of membership of the Supervisory Board. The Supervisory Board has not set such a
limit as a regular limit on the length of membership of the Supervisory Board does not take into
account the advantages of individual members’ experience. An exception was therefore declared in
the current declaration of conformity.
T O O U R S H A R E H O L D E R S
Corporate Governance
A N N U A L R E P O R T 2 0 1 5 – B R E N N T A G A G 5 1D
fu
rt
he
r
in
fo
rm
at
io
nf
in
an
ci
al
s
ta
te
me
nt
s
C
ma
na
ge
me
nt
r
ep
or
t
B
to
o
ur
s
ha
re
ho
ld
er
s
A

D&O INSURANCE DEDUCTIBLE
For details on the D&O insurance (Directors & Officers insurance, liability insurance against financial
losses), we refer you to the information given in the chapter “Remuneration Report”.
APPROPRIATE CONTROL AND RISK MANAGEMENT
An effective risk management and control system is a prerequisite for the Board of Management and
Supervisory Board of Brenntag AG to ensure that opportunities and risks arising from the business
activities of Brenntag AG and its subsidiaries are handled appropriately. One particular focus remains
the financial risks, in particular the liquidity and credit default risks. Systematic risk management
enables potential uncertainties to be identified and assessed at an early stage and risk positions to be
optimized. The Board of Management reports regularly to the Supervisory Board on any existing risks
and their development. The Audit Committee of the Supervisory Board is responsible for monitoring
the accounting process, effectiveness and efficiency of the company’s internal controls, risk manage-
ment and the internal audit system. The Audit Committee’s work is described in detail in the chapter
“Audit Committee”.
Brenntag AG’s controlling, risk management and audit systems are continually refined and regularly
adapted to changing conditions. Details on internal control and risk management system are to be
found in the chapter “Description of the Internal Control / Risk Management System” in the combined
management report.
TRANSPARENCY AND EQUAL TREATMENT THROUGH COMPREHENSIVE INFORMATION
Brenntag AG aims to ensure that communications with the capital market are as transparent as possi-
ble and that all market participants are treated equally. Hereby, it is ensured that all market partici-
pants receive information continuously, promptly and comprehensively. For Brenntag AG, close dia-
logue with its shareholders and potential investors is a matter of course. Various measures are
implemented to ensure the aim of a fair communication policy is achieved. For example, Brenntag AG
regularly informs investors about the current development of business and takes part in various inves-
tor conferences and road shows to ensure a continuous information exchange with capital market
participants. Shareholders also have the opportunity to make contact with the Board of Management
at the General Shareholders’ Meeting. All relevant information is published on the Brenntag AG web-
site in German and English, including, in particular, financial reports, investor presentations, financial
news, ad-hoc news, the Articles of Association as well as details on the General Shareholders’ Meet-
ing and the financial calendar. The financial calendar contains important event and publication dates
and is also published at the end of this annual report.
Details on the Internal Control / Risk Manage-ment System in chapter “Report on Expected Developments, Oppor-tunities and Risks”
T O O U R S H A R E H O L D E R S
Corporate Governance
A N N U A L R E P O R T 2 0 1 5 – B R E N N T A G A G5 2

SHAREHOLDERS AND GENERAL SHAREHOLDERS’ MEETING
As provided for by law and in the Articles of Association, the shareholders of Brenntag AG exercise
their rights before or during the General Shareholders’ Meeting and, in this respect, may also exercise
their voting rights. Each share carries one vote in the General Shareholders’ Meeting. The General
Shareholders’ Meeting resolves, among other things, on the appropriation of profit, the discharge of
the Board of Management and of the Supervisory Board and on the election of the auditors. The
Chairman of the Supervisory Board presides over the General Shareholders’ Meeting. The ordinary
General Shareholders’ Meeting takes place once a year. Shareholders who are registered with the
share register of the company and whose application for participation is received by the company or
any other body designated in the notice of the respective General Shareholders’ Meeting in good
time before the General Shareholders’ Meeting are entitled to participate in the General Sharehold-
ers’ Meeting and exercise their voting rights. Shareholders may exercise their right to vote in the Gen-
eral Shareholders’ Meeting either personally or through a representative of their choice, or by a com-
pany-appointed proxy acting on their instructions. As in the previous year, shareholders were offered
the option of exercising their right to vote at the 2015 General Shareholders’ Meeting in writing by
postal vote, without appointing a person to represent them. It is also planned to offer the option of
postal voting for the 2016 ordinary General Shareholders’ Meeting. To provide information for the
shareholders, Brenntag AG posts the annual report on the past financial year on its website promptly
after the Supervisory Board meeting at which the annual financial statements are adopted. As in the
previous year, notice of the 2016 ordinary General Shareholders’ Meeting will be given at least 36
days before the date on which it is to be held. The invitation to attend will include a list of items on
the agenda as well as an explanation of conditions for attendance and the rights of the shareholders.
All documents and information on the forthcoming ordinary General Shareholders’ Meeting are also
available in good time for downloading from the website of Brenntag AG. After the General Share-
holders’ Meeting, Brenntag AG also publishes attendance and the results of votes on the Internet.
ACCOUNTING AND FINANCIAL STATEMENT AUDITING
The consolidated financial statements of Brenntag AG are prepared in accordance with the Interna-
tional Financial Reporting Standards (IFRS), as adopted by the European Union. The financial state-
ments of Brenntag AG, on which the dividend payment is based, are drawn up in accordance with the
German Commercial Code and the German Stock Corporation Act. For the 2015 financial year, it was
again agreed with the financial statement auditors, PricewaterhouseCoopers Aktiengesellschaft
Wirtschaftsprüfungsgesellschaft, Düsseldorf, that the Chairman of the Audit Committee would be
informed immediately of any possible grounds for exclusion or bias arising during the audit insofar as
they are not immediately eliminated, and that the auditors would report immediately on any findings
or occurrences during the audit which have a significant bearing on the duties of the Supervisory
Board. It was also agreed that the auditors would inform the Supervisory Board or make a note in the
audit report of any facts ascertained during their examination that conflict with the declaration of
conformity with the recommendations known of the Government Commission “German Corporate
Governance Code”; this declaration was issued by the Board of Management and Supervisory Board
pursuant to Section 161 of the German Stock Corporation Act.
T O O U R S H A R E H O L D E R S
Corporate Governance
A N N U A L R E P O R T 2 0 1 5 – B R E N N T A G A G 5 3D
fu
rt
he
r
in
fo
rm
at
io
nf
in
an
ci
al
s
ta
te
me
nt
s
C
ma
na
ge
me
nt
r
ep
or
t
B
to
o
ur
s
ha
re
ho
ld
er
s
A

DECLARATION ON CORPORATE GOVERNANCE
DECLARATION OF CONFORMITY WITH THE RECOMMENDATIONS OF THE GOVERNMENT COMMISSION “GERMAN CORPORATE GOVERNANCE CODE”
On December 17, 2015, the Board of Management and Supervisory Board made the following decla-
ration on the recommendations of the Government Commission “German Corporate Governance
Code” in accordance with Section 161, para. 1 of the German Stock Corporation Act:
“The Board of Management and the Supervisory Board hereby declare that Brenntag AG complies and
plans to continue to comply with the recommendations of the Government Commission ‘German
Corporate Governance Code’ in the version dated May 5, 2015, announced by the Federal Ministry of
Justice in the official section of the Federal Gazette (Bundesanzeiger) with one exception to the
recommendation in number 4.2.3, para. 3 and one to the recommendation in number 5.4.1, para. 2 of
the Code. The exceptions to the recommendations are declared for the following reasons:
Brenntag AG generally follows the recommendation in number 4.2.3, para. 3. However, two members
of the Board of Management have contractually specified defined contribution plans that do not aim
to achieve a specific level of provision. With regard to pension awards, therefore, the Supervisory
Board does not refer to a targeted level of provision.
Furthermore, the Supervisory Board does not set a regular limit on length of membership of the
Supervisory Board, as recommended in number 5.4.1, para. 2 of the Code. A regular limit on length of
membership of the Supervisory Board does not take into account the advantages of individual mem-
bers’ experience.
Furthermore, the Board of Management and the Supervisory Board declare that, since its last declara-
tion of conformity dated December 15, 2014, Brenntag AG has complied with the recommendations
of the Government Commission ‘German Corporate Governance Code’ in the version dated June 24,
2014 with the exception indicated above.”
The current declaration of conformity and declarations of previous years can be viewed at any time
on the company’s website.
COMPLIANCE REPORT AND DISCLOSURES ON CORPORATE GOVERNANCE PRACTICES
In all its business activities, Brenntag is committed to acting honestly, fairly and in good faith in its
dealings with customers, suppliers and competitors as well as with its employees and the public.
As a global company, Brenntag is subject to a large number of laws, directives, regulations and ordi-
nances. Furthermore, Brenntag’s highest priorities are honesty and integrity. Every Brenntag employee
is personally responsible for complying with all applicable laws, directives, policies and regulations.
Our fundamental company values, ethical principles, compliance with laws, rules and regulations as
well as the relevant guidelines and procedures which are of key significance for the company and for
Brenntag’s public reputation are summarized in a Code of Business Conduct and Ethics.
T O O U R S H A R E H O L D E R S
Corporate Governance
A N N U A L R E P O R T 2 0 1 5 – B R E N N T A G A G5 4

This comprehensive Code of Business Conduct and Ethics, which is applicable to all employees, sum-
marizes the fundamental standards Brenntag applies in all its business activities in areas such as
human rights and working conditions, health, safety and the environment, dealings with business
partners and public institutions, bribery and corruption, competition and antitrust law, avoidance of
conflicts of interest as well as data privacy and information security. The aim is to give all employees
guidance in the legal and ethical challenges of their daily work and to encourage proper conduct.
The Code of Business Conduct and Ethics has been communicated throughout the Brenntag Group.
The observance of the rules it contains is monitored by the respective management teams of the
subsidiaries. Every infringement of this code of conduct may lead to disciplinary action and is pun-
ished in line with the customary company policies.
The Brenntag Code of Business Conduct and Ethics is freely available and can be downloaded on the
website at www.brenntag.com under Compliance.
Our compliance programme focuses particularly on observing antitrust law requirements as well as
environmental protection and health. Therefore, employee training courses on these subjects were
again held in the reporting year. The aim is to keep the employees’ knowledge up to date and avoid
any illegal actions as well as to protect the environment and employees.
Brenntag has established procedures throughout the Group for receiving and handling complaints
and anonymous reports of questionable matters. The information received is treated in strict confidence
so the source of the information does not suffer any negative consequences from making complaints
or reports. The reports received are examined and appropriate action taken if a compliance infringe-
ment has taken place. These processes are steered by the Compliance Manager of Brenntag AG.
The Compliance Manager of Brenntag AG provides the Board of Management with information on
compliance matters regularly, in urgent cases immediately. Furthermore, reports on compliance cases
and the development of the Group-wide compliance management system are given in the regular
Audit Committee meetings of the Supervisory Board. The Compliance Manager is supported by an
internal advisory committee, the Compliance Committee, which is composed of various department
heads of Brenntag AG.
The compliance managers in the regions, who are appointed by the regional executive management,
ensure close networking with our business activities through the coordination of compliance manage-
ment at regional level. Regional compliance managers receive, examine and report all compliance
cases and / or compliance questions which are brought to their attention.
WORKING PRACTICES OF THE BOARD OF MANAGEMENT AND SUPERVISORY BOARD AS WELL AS COMPOSITION AND WORKING PRACTICES OF THEIR COMMITTEES
In accordance with the German Stock Corporation Act and the Articles of Association of Brenntag AG,
the Board of Management and the Supervisory Board form the two bodies of the company which
together govern the company and are guided by the principles of the Code as well as their respective
rules of procedure and applicable legislation. The working practices of both bodies are geared to
responsible corporate governance.
T O O U R S H A R E H O L D E R S
Corporate Governance
A N N U A L R E P O R T 2 0 1 5 – B R E N N T A G A G 5 5D
fu
rt
he
r
in
fo
rm
at
io
nf
in
an
ci
al
s
ta
te
me
nt
s
C
ma
na
ge
me
nt
r
ep
or
t
B
to
o
ur
s
ha
re
ho
ld
er
s
A

M A R K U S K L Ä H N
Member of the Board of Management
Region North Amer ica
K A R S T E N B E C K M A N N
Member of the Board of Management
Region EMEA (Europe, Middle East & Afr ica) Global Accounts
BOARD OF MANAGEMENT
T O O U R S H A R E H O L D E R S
Board of Management
A N N U A L R E P O R T 2 0 1 5 – B R E N N T A G A G5 6

S T E V E N H O L L A N D
Chief Executive Officer
Region Latin Amer icaCorporate CommunicationsCorporate DevelopmentCorporate HSECorporate Human RessourcesCorporate Internal AuditCorporate Mergers & Acquisit ionsCompliance
G E O R G M Ü L L E R
Chief Financial Officer
Corporate AccountingCorporate Control l ingCorporate Finance & Investor RelationsCorporate ITCorporate LegalCorporate Risk ManagementCorporate TaxBrenntag International Chemicals
H E N R I N E J A D E
Member of the Board of Management
Region Asia Pacif ic Global Sourcing
T O O U R S H A R E H O L D E R S
Board of Management
A N N U A L R E P O R T 2 0 1 5 – B R E N N T A G A G 5 7D
fu
rt
he
r
in
fo
rm
at
io
nf
in
an
ci
al
s
ta
te
me
nt
s
C
ma
na
ge
me
nt
r
ep
or
t
B
to
o
ur
s
ha
re
ho
ld
er
s
A

BOARD OF MANAGEMENT
The Board of Management is responsible for managing the company and aims to achieve the compa-
ny’s goals by responsible corporate governance, to sustainably increase the value of the company
and, taking account of the company’s interests, to enforce the measures necessary to implement the
company’s policy. The members of the Board of Management bear joint responsibility for the entire
management of the company’s business. They work together in a spirit of collective responsibility
and keep one another informed about all major business transactions and measures adopted in their
respective areas of responsibility. Notwithstanding the joint responsibility of all Board of Management
members for the conduct of Brenntag AG’s business, each Board member is individually responsible
for the areas assigned to him under the assignment-of-business plan or through other resolutions of
the Board of Management.
The Board of Management manages the business of Brenntag AG independently. In doing so, it must
act in the company’s best interest. The Board of Management operates in accordance with the appli-
cable laws and the provisions of their individual service agreements as well as the rules of procedure
and the assignment-of-business plan, both of them adopted by the Supervisory Board. Within the
Brenntag Group, the Board of Management also works towards the observance by the subsidiaries of
all applicable external and internal rules and ensures appropriate risk management and risk monitor-
ing. It develops the strategy of the Brenntag Group in cooperation with the Supervisory Board and
discusses the current status of its implementation with the Supervisory Board at regular intervals.
The transactions for which a resolution adopted by the Board of Management is required by law or by
the Articles of Association of Brenntag AG include but are not limited to the following measures:
Board of Management’s reports to the Supervisory Board (Section 90, para. 1 of the German Stock
Corporation Act),
fundamental organizational measures, such as the conclusion of company agreements, transforma-
tion measures within the meaning of the German Transformation of Companies Act or acquisitions,
carve-outs or the sale of material parts of the company as well as strategy and business planning
issues,
measures related to the implementation and controlling of a monitoring system (Section 91, para. 2
of the German Stock Corporation Act),
issuance of the declaration of conformity (Section 161, para. 1 of the German Stock Corporation Act),
preparation of the annual financial statements and the management report,
convening of the General Shareholders’ Meeting as well as the Board of Management’s requests
and proposals for resolutions to be dealt with and voted on at the General Shareholders’ Meeting,
matters with respect to which the Chairman of the Board of Management or any two members
have requested a resolution by the Board of Management.
Furthermore, internal guidelines applicable throughout the Group have been implemented which
also lay down the requirement of a resolution passed by the entire Board of Management or by indi-
vidual members of the Board of Management for certain matters.
The Board of Management must regularly inform the Supervisory Board, in due time and comprehen-
sively, of all issues of Brenntag AG and its subsidiaries with regard to planning, corporate governance,
business development, the risk situation, risk management and compliance. In addition, the Board of
Management requires the prior consent of the Supervisory Board for certain major matters which are
described in detail in the chapter “Supervisory Board”.
T O O U R S H A R E H O L D E R S
Corporate Governance
A N N U A L R E P O R T 2 0 1 5 – B R E N N T A G A G5 8

The Board of Management is to meet every two weeks but at least once a month. The Board of Man-
agement has a quorum if all its members have received invitations to the meeting and at least half of
its members participate in adopting resolutions. Resolutions may be adopted outside meetings either
by circulating the documents or in another form. The Board of Management must do everything in its
power to ensure that its resolutions are adopted unanimously. Insofar as other majorities are not pre-
scribed by law or by the Articles of Association of Brenntag AG, the Board of Management is to adopt
resolutions with a simple majority of the members of the Board participating in the vote. In the event
of a tie, the chairman of the Board of Management has a second vote. The Board of Management has
currently not set up any committees.
SUPERVISORY BOARD
As the second governing body of a stock corporation (Aktiengesellschaft), the Supervisory Board has
the task of monitoring the management of the company by the Board of Management as well as
advising the Board of Management on the management of the company. The Supervisory Board also
appoints and dismisses the members of the Board of Management and respects diversity when
appointing the Board of Management in line with the recommendations of the Government Commis-
sion “German Corporate Governance Code”. The Supervisory Board regularly discusses the company’s
strategy with the Board of Management and the progress made in its implementation. Furthermore,
the Board of Management regularly informs the Supervisory Board of all issues with regard to planning,
business development, the risk situation and risk management of the company in compliance with
Section 90 of the German Stock Corporation Act (AktG). The Supervisory Board also decides on the
Board of Management’s assignment-of-business plan if the latter cannot decide on it unanimously itself.
Furthermore, the prior consent of the Supervisory Board is required for some major Board of Manage-
ment decisions, including but not limited to major changes in the business strategy of the Brenntag
Group, the acquisition or sale of major plots of land, companies or business operations, agreements
in connection with the granting or raising of loans or the assumption of guarantees, the amount of
which exceeds certain thresholds.
The Supervisory Board has adopted rules of procedure and, according to these rules, holds at least
two meetings in the first two quarters and at least two meetings in the last two quarters of each cal-
endar year. If necessary and on a case-by-case basis, additional meetings are held or circular resolu-
tions are passed outside Supervisory Board meetings.
All members of the Supervisory Board are bound by the company’s best interests and must immedi-
ately inform the Supervisory Board of any conflicts of interest.
As in the previous year, the Supervisory Board of Brenntag AG has six members. The Chairman of the
Supervisory Board is Stefan Zuschke. There are no employee representatives on the Supervisory Board
of Brenntag AG as the German One-Third Employee Participation Act (Drittelbeteiligungsgesetz) and
the German Codetermination Act (Mitbestimmungsgesetz) are not applicable. The Supervisory Board
members are in principle elected for a period up to the close of the General Shareholders’ Meeting
which resolves on the formal discharge of the Supervisory Board for the fourth financial year after
commencement of the respective term of office. The financial year in which the term of office starts is
not counted for this purpose. The General Shareholders’ Meeting can determine a shorter term of
office for the Supervisory Board members. Members of the Supervisory Board may be re-elected. The
next elections to the Supervisory Board will be held as follows: for two Supervisory Board members
owing to the age limit stipulated by the Supervisory Board in line with number 5.4.2 of the German
T O O U R S H A R E H O L D E R S
Corporate Governance
A N N U A L R E P O R T 2 0 1 5 – B R E N N T A G A G 5 9D
fu
rt
he
r
in
fo
rm
at
io
nf
in
an
ci
al
s
ta
te
me
nt
s
C
ma
na
ge
me
nt
r
ep
or
t
B
to
o
ur
s
ha
re
ho
ld
er
s
A

Corporate Governance Code at the General Shareholders’ Meeting which resolves on the formal dis-
charge of the Supervisory Board for financial year 2016; for the other Supervisory Board members at
the General Shareholders’ Meeting which resolves on the formal discharge of the Supervisory Board
for financial year 2019.
The Supervisory Board has a quorum when at least three members participate in the voting. Insofar as
other majorities are not prescribed by law, resolutions are passed by a simple majority. In the event of
a tie, the Chairman has the casting vote. He / she is also authorized to make any declarations on
behalf of the Supervisory Board which are necessary to implement its resolutions.
The Supervisory Board has regulated the work of the Board of Management in the rules of procedure
for the Board of Management, in particular matters which have to be dealt with by the entire Board of
Management as well as the necessary majority for Board of Management resolutions. Information on
the remuneration of the Supervisory Board members can be found in the chapter “Remuneration
report” in the combined management report.
The Supervisory Board reviews the efficiency of its activities on a regular basis but at least once every
two years. The last efficiency review took place in December 2015. The Supervisory Board examined in
particular whether the existing internal rules of procedure have proved to be appropriate for good
corporate governance, how the activities of the Supervisory Board can be made even more efficient
and whether there are further opportunities to implement the corporate governance requirements
even more effectively.
The Supervisory Board has set up two committees from among its members, namely the Presiding
and Nomination Committee as well as the Audit Committee. The members of the committees are
appointed for the entire period of office as members of the Supervisory Board. Each committee chair-
man reports regularly to the Supervisory Board on the committee’s activities.
PRESIDING AND NOMINATION COMMITTEE
The Presiding and Nomination Committee set up by the Supervisory Board of Brenntag AG consists -
as in the previous year – of the Chairman of the Supervisory Board, Stefan Zuschke, and two other
members, Dr Thomas Ludwig and Dr Andreas Rittstieg. The Chairman of the Supervisory Board is
always also the Chairman of the Presiding and Nomination Committee.
The Committee is constantly in contact with the Board of Management between the meetings of the
Supervisory Board and advises the Board of Management on the strategic development of the com-
pany; it coordinates the activities of the Supervisory Board as a whole and monitors compliance by
the Board of Management with the rules of procedure. Furthermore, the Committee makes proposals
regarding the appointment and removal of members of the Board of Management, the terms of the
Board of Management service agreements within the framework of the remuneration system structure
adopted by the Supervisory Board as well as any application to reduce the remuneration of a Board of
Management member, and regularly provides the Supervisory Board with information for reviewing
the remuneration system as a whole.
Furthermore, the Committee represents Brenntag AG vis-à-vis former members of the Board of Man-
agement in accordance with Section 112 of the German Stock Corporation Act, consents to sideline
activities of Board of Management members in accordance with Section 88 of the German Stock Cor-
poration Act and grants loans to the persons named in Sections 89 and 115 of the German Stock Cor-
T O O U R S H A R E H O L D E R S
Corporate Governance
A N N U A L R E P O R T 2 0 1 5 – B R E N N T A G A G6 0

poration Act. In addition, the Committee approves contracts with Supervisory Board members in
accordance with Section 114 of the German Stock Corporation Act and proposes suitable candidates
as Supervisory Board members to the General Shareholders’ Meeting in case of the election of Super-
visory Board members.
AUDIT COMMITTEE
The Supervisory Board of Brenntag AG has set up an Audit Committee, which meets at least four times
in each calendar year and in particular monitors the accounting process and the audit of the annual
financial statements. The Audit Committee has three members who are appointed by the Supervisory
Board. At the present time, they are Prof. Dr Edgar Fluri, Doreen Nowotne and Stefanie Berlinger.
In line with the recommendation of the Code (number 5.3.2), the Chairman of the Audit Committee
shall have special knowledge of and experience in applying accounting principles as well as internal
control procedures and shall also not be a former member of the company’s Board of Management
whose appointment ended less than two years prior to his appointment as Chairman of the Audit
Committee. The Chairman of the Audit Committee, Prof. Dr Edgar Fluri, meets these requirements.
The Chairman reports regularly to the Supervisory Board about the activities of the Committee.
The Audit Committee prepares the resolutions of the Supervisory Board on the auditing and adoption
of the annual financial statements as well as the approval of the consolidated financial statements,
the Board of Management’s proposal for the appropriation of profit and the Supervisory Board’s pro-
posal to the General Shareholders’ Meeting on the election of the auditors for the consolidated
financial statements and the auditors for the half-yearly and quarterly financial reports, insofar as the
latter are audited or reviewed by auditors. For this purpose, the Audit Committee pre-reviews the
documentation relating to the annual and consolidated financial statements, the management report
and the Group management report as well as the proposal for the appropriation of profit. The Audit
Committee discusses the audit reports with the auditor.
The Committee deals with accounting issues on behalf of the Supervisory Board, in particular the
treatment of subjects of fundamental importance, such as the application of new accounting stan-
dards and the monitoring of the accounting process. It deals with half-yearly and quarterly financial
reports as well as their audit or review. Furthermore, it reviews the adequacy and effectiveness of the
company’s internal control system, risk management system and internal audit system.
The Audit Committee also reviews the observance of and compliance with the statutory provisions
and the internal company policies as well as compliance with the relevant rules of the German Corpo-
rate Governance Code. On behalf of the Supervisory Board, the Committee also monitors the audi-
tors’ independence, engages the auditors to conduct the audit of the annual financial statements
and, if necessary, a review of the half-yearly and quarterly financial reports. Furthermore, it gives its
prior consent to additional services to be provided by the auditors and discusses the scope and main
points of the audit as well as the auditors’ cooperation with the Corporate Internal Audit department
and other departments involved in risk management. On behalf of the Supervisory Board, the Com-
mittee authorizes the auditors’ fee.
In addition, the Audit Committee discusses the adequacy of interest hedging for the Group with the
Board of Management as well as deviations of the actual development from targets previously
reported. The Audit Committee is responsible for the receipt and handling of complaints by employees
and third parties about the accounting, the internal company control system, risk management, the
T O O U R S H A R E H O L D E R S
Corporate Governance
A N N U A L R E P O R T 2 0 1 5 – B R E N N T A G A G 6 1D
fu
rt
he
r
in
fo
rm
at
io
nf
in
an
ci
al
s
ta
te
me
nt
s
C
ma
na
ge
me
nt
r
ep
or
t
B
to
o
ur
s
ha
re
ho
ld
er
s
A

audit of the financial statements and other accounting-related issues (whistleblowing). The Audit
Committee may assume other tasks which the Supervisory Board assigns to it. It obtains regular reports
about the work of the Corporate Internal Audit department, in particular about that department’s audit
focuses and audit findings. The same applies to risk management and the monitoring of compliance.
OFFICES OF THE BOARD OF MANAGEMENT AND SUPERVISORY BOARD
MEMBERS OF THE BOARD OF MANAGEMENT
The members of the Board of Management hold the following offices on supervisory boards or com-
parable supervising bodies of companies.
Steven Holland,
London / United Kingdom
Chief Executive Officer
Brenntag Nederland B.V. (Chairman of the Supervisory Board) BRENNTAG Polska sp. z o.o. (Chairman of the Supervisory Board) BRENNTAG QUIMICA, S.A.U. (Member of the Board of Directors) BRENNTAG SA (Chairman of the Supervisory Board)
Karsten Beckmann,
Essen / Germany
Member of the Board of Management since July 1, 2015
BRENNTAG GmbH (Member of the Supervisory Board) BRENNTAG SA (Deputy Chairman of the Supervisory Board) BRENNTAG Polska sp. z o.o. (Member of the Supervisory Board) Brenntag Nederland B.V. (Member of the Supervisory Board)
Markus Klähn,
Wayne, Pennsylvania/USA
Member of the Board of Management since July 1, 2015
None
Georg Müller,
Essen / Germany
Chief Financial Officer
BRENNTAG GmbH (Chairman of the Supervisory Board)
T O O U R S H A R E H O L D E R S
Corporate Governance
A N N U A L R E P O R T 2 0 1 5 – B R E N N T A G A G6 2
Henri Nejade,
Singapore / Republic of Singapore
Member of the Board of Management since July 1, 2015
Brenntag (Shanghai) Chemical Trading Co., Ltd. (Supervisor / Supervisory body)
William Fidler,
Henderson, Kentucky / USA
Member of the Board of Management until June 30, 2015
None
These offices are exclusively offices held in Group company bodies.
MEMBERS OF THE SUPERVISORY BOARD
The members of the Supervisory Board hold the following offices on supervisory boards or compara-
ble supervising bodies of companies.
Stefan Zuschke,
Hamburg / Germany, Managing Director BC Partner Beteiligungsberatung GmbH
Chairman of the Supervisory Board
Aenova Holding GmbH (Chairman of the Advisory Board) Brachem Acquisition S.C.A. (Member of the Advisory Board) Nils Swed AB (Supervisory function on the Board of Directors) Nils Norway I AS (Supervisory function on the Board of Directors) Nils Norway II AS (Supervisory function on the Board of Directors) OME Acquisition S.C.A. (Chairman of the Supervisory Board) OME Investment Acquisition S.C.A. (Chairman of the Supervisory Board) SL Lux Investment (Member of the Advisory Board)
Dr Thomas Ludwig,
Düsseldorf / Germany, Managing Director and Managing Partner Lindsay Goldberg Vogel GmbH
Deputy Chairman of the Supervisory Board
Bandstahl Schulte & Co. GmbH (Chairman of the Advisory Board) Grünenthal GmbH (Member of the Advisory Board) 7 S Group GmbH (Chairman of the Advisory Board until September 3, 2015) TRIMET Aluminium SE (Deputy Chairman of the Supervisory Board, since December 12, 2015 Chair-
man of the Supervisory Board) TRIMET SE (Chairman of the Supervisory Board) Weener Plastik GmbH (Chairman of the Advisory Board until August 20, 2015) VDM Metals GmbH (Chairman of the Supervisory Board since August 1, 2015)
T O O U R S H A R E H O L D E R S
Corporate Governance
A N N U A L R E P O R T 2 0 1 5 – B R E N N T A G A G 6 3D
fu
rt
he
r
in
fo
rm
at
io
nf
in
an
ci
al
s
ta
te
me
nt
s
C
ma
na
ge
me
nt
r
ep
or
t
B
to
o
ur
s
ha
re
ho
ld
er
s
A

Stefanie Berlinger,
Frankfurt / Germany, Managing Director Lilja & Co. GmbH
Member of the Supervisory Board since June 9, 2015
None
Prof. Dr Edgar Fluri,
Binningen / Switzerland, Swiss Certified Public Accountant, member of multiple boards of directors
and supervisory boards
Member of the Supervisory Board
Galerie Beyeler AG (Member of the Board of Directors) Orior AG (Member of the Board of Directors) Laroba AG (formerly Bank La Roche & Co. AG) (Member of the Board of Directors)
Doreen Nowotne,
Hamburg / Germany, Business Advisor
Member of the Supervisory Board
JENOPTIK AG (Member of the Supervisory Board since July 22, 2015)
Dr Andreas Rittstieg,
Hamburg / Germany, Member of the Board of Management Legal and Compliance
Hubert Burda Media Holding Kommanditgesellschaft
Member of the Supervisory Board
Huesker Holding GmbH (Member of the Advisory Board) Kühne Holding AG (Member of the Board of Directors) Tomorrow Focus AG (Member of the Supervisory Board)
Stephen Clark,
Wyomissing, Pennsylvania/USA, Former Chief Executive Officer of Brenntag AG
Member of the Supervisory Board until June 9, 2015
None
T O O U R S H A R E H O L D E R S
Corporate Governance
A N N U A L R E P O R T 2 0 1 5 – B R E N N T A G A G6 4
SPECIFICATIONS PURSUANT TO SECTIONS 76, PARA. 4 AND 111, PARA. 5 OF THE GERMAN STOCK CORPORATION ACT
SPECIFICATION OF TARGETS
The Supervisory Board has set a target of 33.3 % for the percentage of women in the Supervisory
Board and a target of 0 % for the percentage of women in the Board of Management in the period up
to June 30, 2017. The Board of Management has set a target of 30 % for the percentage of women in
the only management level under the Board of Management in the period up to June 30, 2017. The
respective targets reflected the status quo when the resolutions were passed in September 2015.
This, of course, does not mean that the percentage of women will not increase. The period set for
achieving the targets is the longest permissible for companies setting their first target deadline.
T O O U R S H A R E H O L D E R S
Corporate Governance
A N N U A L R E P O R T 2 0 1 5 – B R E N N T A G A G 6 5D
fu
rt
he
r
in
fo
rm
at
io
nf
in
an
ci
al
s
ta
te
me
nt
s
C
ma
na
ge
me
nt
r
ep
or
t
B
to
o
ur
s
ha
re
ho
ld
er
s
A

P R O F . D R E D G A R F L U R I D R A N D R E A S R I T T S T I E G S T E F A N I E B E R L I N G E R
SUPERVISORYBOARD
T O O U R S H A R E H O L D E R S
Supervisory Board
A N N U A L R E P O R T 2 0 1 5 – B R E N N T A G A G6 6

S T E F A N Z U S C H K E
Chairman
of the Supervisory Board
D R T H O M A S L U D W I G
Deputy Chairman
of the Supervisory Board
D O R E E N N O W O T N E
T O O U R S H A R E H O L D E R S
Supervisory Board
A N N U A L R E P O R T 2 0 1 5 – B R E N N T A G A G 6 7D
fu
rt
he
r
in
fo
rm
at
io
nf
in
an
ci
al
s
ta
te
me
nt
s
C
ma
na
ge
me
nt
r
ep
or
t
B
to
o
ur
s
ha
re
ho
ld
er
s
A

C O M B I N E D G R O U P M A N A G E M E N T R E P O R T
A N D M A N A G E M E N T R E P O R T O F
B R E N N T A G A G
68 – 137
M A N A G E M E N T R E P O R T
Content
A N N U A L R E P O R T 2 0 1 5 – B R E N N T A G A G6 8

70 BASIC INFORMATION ABOUT
THE GROUP
70 Group Business Model
72 Vision, Objectives and Strategy
75 Financial Management System
79 REPORT ON ECONOMIC POSITION
79 Economic Environment
79 Business Performance
82 Results of Operations
90 Financial Position
95 Financial and Assets Position
97 ANNUAL FINANCIAL STATEMENTS OF
BRENNTAG AG
97 Results of Operations and Financial
Position of Brenntag AG
99 Appropriation of Distributable Profit
of Brenntag AG
99 REMUNERATION REPORT
99 Board of Management Remuneration
System
112 Remuneration of the Supervisory Board
114 EMPLOYEES
115 Developing our Employees
115 Diversity and Inclusion
116 Remuneration and Benefits
116 HEALTH, SAFETY AND
ENVIRONMENTAL PROTECTION,
QUALITY MANAGEMENT
116 Brenntag’s HSE Strategy
120 EVENTS AFTER THE END OF THE
REPORTING PERIOD
120 REPORT ON EXPECTED DEVELOP
MENTS, OPPORTUNITIES AND RISKS
120 Report on Expected Developments
122 Description of the Internal Control / Risk
Management System
125 Report on Opportunities and Risks
131 Summary of the Opportunities and Risk
Situation
132 INFORMATION REQUIRED PURSU
ANT TO SECTION 289, PARA. 4 AND
SECTION 315, PARA. 4 OF THE GER
MAN COMMERCIAL CODE (HGB) AND
EXPLANATORY REPORT
132 Composition of the Subscribed Capital
132 Restrictions on Voting Rights or Transfer
of Shares
133 Direct or Indirect Interests in the Capital
of the Company Exceeding 10 % of the
Voting Rights
133 Shares with Special Rights Conferring
Powers of Control
133 System of Control of any Employee Par-
ticipation Scheme Where the Control
Rights are not Exercised Directly by the
Employees
133 Legislation and Provisions of the Articles
of Association Applicable to the Appoint-
ment and Removal of the Members of
the Board of Management and Govern-
ing Amendments to the Articles of Asso-
ciation
134 Powers of the Board of Management to
Issue or Repurchase Shares
136 Significant Agreements which Take Effect,
Alter or Terminate Upon a Change of
Control of the Company Following a
Takeover Bid
137 Compensation Agreements with Mem-
bers of the Board of Management or
Employees in the Event of a Takeover Bid
137 CORPORATE GOVERNANCE
STATEMENT
M A N A G E M E N T R E P O R T
Content
A N N U A L R E P O R T 2 0 1 5 – B R E N N T A G A G 6 9D
fu
rt
he
r
in
fo
rm
at
io
nf
in
an
ci
al
s
ta
te
me
nt
s
C
ma
na
ge
me
nt
r
ep
or
t
B

BASIC INFORMATION ABOUT THE GROUP
GROUP BUSINESS MODEL
BUSINESS ACTIVITIES
Brenntag’s growth opportunities along with its resilient business model are based on complete geo-
graphic coverage, a wide product and service portfolio and high diversity across suppliers, customers
and industries.
Connecting chemical manufacturers (our suppliers) and chemical users (our customers), Brenntag
provides complete distribution solutions rather than just chemical products. Brenntag purchases
large-scale quantities of industrial and specialty chemicals from various suppliers, enabling the com-
pany to achieve economies of scale and offer a full-line range of chemical products and value-added
services to around 180,000 customers. Brenntag is the strategic partner and service provider for manu-
facturers of industrial and specialty chemicals at the one end and chemical users at the other end of
the value chain. Brenntag’s role in the value chain is also expressed in our brand identity “Connecting-
Chemistry”.
Brenntag stores the products it purchases in its distribution facilities, packs them into quantities the
customers require and delivers them, typically in less-than-truckloads. Brenntag’s customers world-
wide are active in diverse end-market industries such as adhesives, paints, oil & gas, food, water treat-
ment, personal care and pharmaceuticals. In order to be able to react quickly to the market and cus-
tomers’ and suppliers’ requirements, Brenntag manages its business through its geographically
structured segments EMEA (Europe, Middle East & Africa), North America, Latin America and Asia
Pacific. Brenntag offers a broad range of over 10,000 products as well as extensive value-added ser-
vices (such as just-in-time delivery, product mixing, blending, repackaging, inventory management,
drum return handling as well as technical and laboratory services for specialty chemicals).
Brenntag is the global market leader in full-line chemical distribution. We define market leadership
not just by business volume but also associate it with our philosophy of continually improving the
safety standards at our sites. As a responsible service provider, we continually strive to achieve further
improvements in the supply chain as a whole.
GROUP STRUCTURE
As the ultimate parent company, Brenntag AG is responsible for the strategy of the Group. The central
functions of Brenntag AG are Corporate Controlling, Corporate Finance & Investor Relations, Corpo-
rate HSE (Health, Safety and Environment), Corporate IT, Corporate Accounting, Corporate Mergers &
Acquisitions, Corporate International Human Resources Management, Corporate Development, Cor-
porate Communications, Corporate Legal, Corporate Internal Audit, Compliance, Corporate Risk Man-
agement as well as Corporate Tax.
Further information in chapter “Brenntag’s HSE strategy”
M A N A G E M E N T R E P O R T
Basic Information about the Group
A N N U A L R E P O R T 2 0 1 5 – B R E N N T A G A G7 0

The consolidated financial statements as at December 31, 2015 include Brenntag AG, 27 domestic
(Dec. 31, 2014: 26) and 194 foreign (Dec. 31, 2014: 179) consolidated subsidiaries including structured
entities. Five associates (Dec. 31, 2014: five) have been accounted for using the equity method.
SEGMENTS AND LOCATIONS
The Brenntag Group is managed by the geographically structured segments EMEA (Europe, Middle East &
Africa), North America, Latin America and Asia Pacific. Furthermore, all other segments cover the
central functions for the entire Group and the operations of Brenntag International Chemicals, which
buys and sells chemicals in bulk on an international scale without regional boundaries.
The following graphic gives an overview of the global network and the locations of the
Brenntag Group:
Figures exclude all other segments, which, in addition to various holding companies, comprise the international activities of Brenntag International Chemicals.
1) The number of employees is calculated as the number of employees on the basis of full-time equivalents at the reporting date.
north america
2015
External sales EUR m 3,600.6
Operating gross profit EUR m 942.6
Operating EBITDA EUR m 365.6
Employees 1) 4,525
latin america
2015
External sales EUR m 925.8
Operating gross profit EUR m 201.2
Operating EBITDA EUR m 64.7
Employees 1) 1,511
emea
2015
External sales EUR m 4,654.4
Operating gross profit EUR m 1,024.2
Operating EBITDA EUR m 353.0
Employees 1) 6,482
asia pacific
2015
External sales EUR m 834.1
Operating gross profit EUR m 140.0
Operating EBITDA EUR m 50.3
Employees 1) 1,814
b.01 global network of the brenntag group
M A N A G E M E N T R E P O R T
Basic Information about the Group
A N N U A L R E P O R T 2 0 1 5 – B R E N N T A G A G 7 1D
fu
rt
he
r
in
fo
rm
at
io
nf
in
an
ci
al
s
ta
te
me
nt
s
C
ma
na
ge
me
nt
r
ep
or
t
B
VISION, OBJECTIVES AND STRATEGY
“ConnectingChemistry” describes value creation, purpose and commitment to all our partners within
the supply chain:
Success We support our partners in developing and growing their businesses, and enable them to expand
their market reach. Equally, we are committed to creating value for our shareholders and develop-
ing our employees throughout all stages of their careers.
Expertise We provide our partners with in-depth product, application and industry expertise, and sophisti-
cated market intelligence. We set ourselves apart, drawing on our extensive product and service
portfolio as well as our comprehensive industry coverage on a global level and our ability to devise
creative, tailor-made solutions.
Customer orientation and service excellence We offer powerful channels to market and provide the best customer service in the industry. Only
when our partners are fully satisfied do we consider our service to be delivered.
2020 VISION
Our “2020 Vision” illustrates how we continue to position ourselves in the markets and industries we
serve and is summarized by the following five commitments to our current and future development:
We are the safest chemicals distributor, striving for zero accidents and incidents.
Throughout the world, we connect chemistry by providing the most effective industry channel for
our customers and suppliers.
We are the global leader in all our chosen markets and industries, offering the most professional
sales and marketing organization in the industry, ensuring consistently high standards every day,
everywhere.
We strive to provide a working environment where the best people want to work.
We aim to generate sustainable and high returns for our shareholders and all other stakeholders.
OBJECTIVES AND STRATEGY
With our “2020 Vision”, we pursue our goal to be the preferred distributor for both specialty and
industrial chemicals for our customers and suppliers and, at the same time, the industry leader in
safety, growth and profitability. We aim to achieve this with a clear growth strategy geared to steadily
expanding our leading market position while continually improving profitability.
M A N A G E M E N T R E P O R T
Basic Information about the Group
A N N U A L R E P O R T 2 0 1 5 – B R E N N T A G A G7 2

organic growth and acquisitions
We strive to extend our market leadership by steadily growing our product and service offering
organically in line with the requirements of our regional markets. In doing so, we benefit from lever-
aging our extensive global activities and key strengths. Our proactive sales activities focus on provid-
ing customers with tailored full-service solutions along the entire value chain rather than just products.
In addition, we continue to seek acquisition opportunities that support our strategy. Our strategic
focus is on expanding our presence in emerging markets to capture the expected strong growth in
demand for chemicals in these regions. In the established markets of Western Europe and North
America, we continue to further develop our product and service portfolio as well as to optimize our
national and international distribution networks through acquisitions.
steadily improving profitability
A further element of our strategy is to continually and systematically increase profitability. On the
basis of our entrepreneurial culture, our operational excellence and our resilient business model, we
strive to steadily increase our operating gross profits, EBITDA, cash flows and achieve an attractive
return on capital. Extending the scope of our operations, both organically and through acquisitions,
achieving the resulting economies of scale and placing emphasis on value-added services are major
levers we use to increase profitability and returns.
strategic initiatives
The systematic implementation of our strategy is based on global and regional initiatives.
The focus of our global safety initiative, for instance, is to establish an outstanding safety culture and
to introduce globally harmonized and consistently high safety standards.
In order to offer our business partners the best service in the industry, we are continuously working
worldwide to improve our commercial excellence – that is to say, our effectiveness and efficiency in
procurement, sales and marketing. Our points of focus include systematically expanding business
with regional, pan-regional and global key accounts, for which our broad product offering and exten-
sive geographic network provide unrivalled service capabilities. In addition, we will continue to
actively realize the potential that arises as a result of chemical producers outsourcing supply chain
and commercial activities.
As part of our regional growth strategies, we continue seeking to effectively leverage our capabilities
in rapidly growing and therefore particularly attractive industries such as water treatment, personal
care, pharmaceuticals, food & beverages as well as adhesives, coatings, paints, elastomers and seal-
ants. In oil & gas, we are counting on the segment’s long-term potential in combination with our
excellent capabilities and our supplier and customer network despite the current uncertainty about
the near-term direction of the industry. In order to achieve sustainable growth, we are placing more
emphasis on developing our global oil and gas expertise as well as downstream 1) products and ser-
vices. Further initiatives focus on growing the customer-specific mixing and blending business by pro-
viding value-added services.
Besides our growth initiatives, we continue to improve our operational excellence, in particular by
optimizing our network, adopting best practice solutions throughout the Brenntag Group and opti-
mizing our warehouse and transport logistics on a regional and global level.
Extending our market leadership by steadily growing organically
Improving profitability
Supporting the strategy through global and regional initiatives
1) Downstream: the refining and processing sector of the oil and gas industry
M A N A G E M E N T R E P O R T
Basic Information about the Group
A N N U A L R E P O R T 2 0 1 5 – B R E N N T A G A G 7 3D
fu
rt
he
r
in
fo
rm
at
io
nf
in
an
ci
al
s
ta
te
me
nt
s
C
ma
na
ge
me
nt
r
ep
or
t
B

In our human resources activities, we seek to recruit, develop and retain highly qualified employees.
Last year, we extensively revised our global human resources strategy and launched various new ini-
tiatives with the aim of best positioning the Brenntag brand in the employment market. We place par-
ticular emphasis on our employees’ continuing development and on targeted succession planning.
SUSTAINABILITY
As the global market leader in full-line chemical distribution, we aim to lead the industry in sustain-
ability, too. We are aware of our responsibility to future generations and therefore it is important to
us to operate safely, act as a responsible corporate citizen, minimize our impact on the environment
and ensure our long-term financial viability.
Our sustainability management focuses on the aspects derived from our daily operations and service
portfolio:
Safety
Resource efficiency
Responsibility within the supply chain
Compliance
Employees
Social responsibility
We remain committed to the principles of responsible care and responsible distribution as well as the
principles of the UN Global Compact. We are also a member of “Together for Sustainability”, an industry
initiative that aims to enhance sustainability across the entire chemical supply chain. Detailed infor-
mation on our sustainability management can be found in our latest sustainability report and in the
“Health, Safety and Environmental Protection, Quality Management” chapter of this annual report.
Brenntag is the first chemicals distributor to join the “Together for Sustainability” initiative
M A N A G E M E N T R E P O R T
Basic Information about the Group
A N N U A L R E P O R T 2 0 1 5 – B R E N N T A G A G7 4

FINANCIAL MANAGEMENT SYSTEM
Our goal is to remain the preferred distributor for both industrial and specialty chemicals for our
customers and suppliers and, at the same time, the industry leader in safety, growth and profitability.
We aim to achieve this with a clear growth strategy geared to steadily expanding our leading market
positions while continually and systematically improving profitability.
On the basis of our entrepreneurial culture, our operational excellence and our resilient business
model, we strive to steadily increase our operating gross profits, EBITDA and cash flows and achieve
an attractive return on capital, both through organic growth and acquisitions. Acquisitions help us to
extend our geographic coverage, optimize our portfolio in attractive market segments and achieve
economies of scale.
The financial management system of the Brenntag Group enables us to measure attainment of these
goals. It is based on key performance indicators such as operating gross profit, EBITDA and free cash
flow, and their growth as well as the measurement of return on capital. We also set strict require-
ments for the performance of investment projects and acquisitions.
In the following, the key performance indicators used to measure the Group’s financial performance
are explained. They also include key performance indicators not defined under IFRSs such as EBITDA
and free cash flow so these terms may be defined differently by other companies.
OPERATING GROSS PROFIT
In contrast to manufacturing companies for which sales play a key role, for us as a chemicals distributor
operating gross profit is a more important factor for increasing our company’s value in the long term.
Operating gross profit is defined as the difference between external sales and cost of materials. Our
goal is for the growth of our operating gross profit to exceed the development of macroeconomic
benchmarks. In order to ensure a meaningful measurement of performance at Group or regional
level, we adjust the growth of operating gross profit for currency translation effects. A detailed anal-
ysis of the growth of operating gross profit is given in the chapters “Business Performance of the
Brenntag Group” and “Business Performance in the Segments”.
EBITDA
The key indicator and measure for the financial performance of the Brenntag Group is operating
EBITDA. We use this indicator as it reflects the development of our business operations well and is a
key component of cash flow. Our aim is to continually grow operating EBITDA throughout the busi-
ness cycle. The segments are also primarily controlled on the basis of operating EBITDA, which is the
operating profit as recorded in the consolidated income statement plus amortization of intangible
assets as well as depreciation of property, plant and equipment and investment property, adjusted for
the following items:
Transaction costs: costs connected with restructuring under company law and refinancing. They
are eliminated for purposes of management reporting to permit proper presentation of the operat-
ing performance and comparability on segment level.
Holding charges: certain costs charged between holding companies and operating companies. On
Group level they net to zero.
M A N A G E M E N T R E P O R T
Basic Information about the Group
A N N U A L R E P O R T 2 0 1 5 – B R E N N T A G A G 7 5D
fu
rt
he
r
in
fo
rm
at
io
nf
in
an
ci
al
s
ta
te
me
nt
s
C
ma
na
ge
me
nt
r
ep
or
t
B

Information on the current development of operating EBITDA for the Brenntag Group and the seg-
ments is to be found in the chapters “Business Performance of the Brenntag Group” and “Business
Performance in the Segments”.
RETURN ON CAPITAL
In the Brenntag Group, we measure the return on capital using the metric Return on Net Assets
(RONA). This is defined as:
rona = ebita
(average property, plant and equipment + average working capital)
ebitda
– other additions to property, plant and equipment as well as other additions to intangible assets (Capex)
+ / – changes in working capital
= free cash flow
Average property, plant and equipment for a particular year is defined as the average of values for
property, plant and equipment at each of the following five times: the beginning of the year, the end
of each of the first, second and third quarters, and the end of the year. Average working capital for a
particular year is defined as the average of the values for working capital at each of the following five
times: the beginning of the year, the end of each of the first, second and third quarters, and the end
of the year.
The development of RONA for the Brenntag Group in the reporting year is described in the chapter
“Business Performance of the Brenntag Group”.
CASH GENERATION
Our aim is to generate increasing surplus liquidity. We measure this using free cash flow. This is
defined as:
Free cash flow is an important performance indicator for us as it shows what level of cash is generated
from operating activities and will therefore be available for growth through acquisitions as well as for
lenders, shareholders and tax payments.
The development of free cash flow is described in detail in the chapter “Liquidity”.
M A N A G E M E N T R E P O R T
Basic Information about the Group
A N N U A L R E P O R T 2 0 1 5 – B R E N N T A G A G7 6

ADDITIONAL PERFORMANCE INDICATORS
In addition to the aforementioned financial performance indicators, we use several other metrics to
assess the economic success of our business activities.
For example, the so-called conversion ratio is an indicator we calculate to measure the efficiency of
a segment or the Group, more specifically by expressing operating EBITDA for a given period as a per-
centage of operating gross profit for the same period. The indicator is used primarily to assess longer-
term trends and less so to analyze short-term fluctuations between quarters.
To determine whether a particular investment project is likely to generate value for Brenntag, we take
the modified internal rate of return (MIRR) and the payback period as measures of the risk involved in
the project. An investment project is only approved when the MIRR is above the hurdle rate and the
combination of return and payback seem attractive. The hurdle rate for the MIRR varies depending on
the risk involved in the project and in particular on the respective country risk.
In our efforts to generate increasing cash flow, we analyze the working capital turnover. This is
defined as:
working capital turnover =sales
average working capital
Average working capital is defined for a particular year as the average of the values for working capi-
tal at each of the following five times: the beginning of the year, the end of each of the first, second
and third quarters, and the end of the year.
In addition to these metrics, we have also set strategic objectives as well as financial hurdle rates
which generally have to be considered before acquisitions are executed. Potential acquisitions must in
particular be able to satisfy a hurdle rate of return in the form of free cash flow on capital employed.
The hurdle rate of return again depends above all on the country risk of the acquisition. In addition to
return on net assets (RONA), we also use return on capital employed (ROCE) to measure return on
capital, taking into account the purchase price for acquisitions. This is defined as EBITA / (the average
carrying amount of equity plus the average carrying amount of financial liabilities less the average
carrying amount of cash and cash equivalents). The average carrying amounts in the denominator are
defined for a particular year as the arithmetic average of the amounts at each of the following five
times: the beginning of the year, the end of each of the first, second and third quarters, and the end
of the year.
Further performance indicators such as tax rate and earnings per share (EPS) are only monitored at
Group level. They are not used to measure the performance of Brenntag’s segments since factors such
as interest or tax are less a reflection of the operating performance of the business but are above all
based on central decisions.
M A N A G E M E N T R E P O R T
Basic Information about the Group
A N N U A L R E P O R T 2 0 1 5 – B R E N N T A G A G 7 7D
fu
rt
he
r
in
fo
rm
at
io
nf
in
an
ci
al
s
ta
te
me
nt
s
C
ma
na
ge
me
nt
r
ep
or
t
B

ADJUSTMENT FOR EXCHANGE RATE EFFECTS
Brenntag is an international Group which generates its profits in a large number of Group companies
in different currency areas. These Group companies are mainly located in the euro and US dollar
zones, but many other currency areas are also of significance.
For the purposes of Group accounting, the results of all Group companies are translated into the
Group currency, the euro. The results are always translated at the average rate in the reporting period.
Therefore, the results and in particular the change between reporting periods may not only be
affected by changes in operating performance but also by effects of translation from functional cur-
rencies into the Group currency, the euro (translation effects). As Brenntag considers that it is import-
ant to assess the operating performance of the Group companies and in particular the change in
operating performance between reporting periods free of distortions from translation effects, we also
report the changes adjusted for these effects.
Exchange rate-adjusted financial metrics are not to be seen as substitutes or as more meaningful
financial indicators but always as additional information on sales, operating expenses, earnings or
other metrics.
M A N A G E M E N T R E P O R T
Basic Information about the Group
A N N U A L R E P O R T 2 0 1 5 – B R E N N T A G A G7 8

ECONOMIC ENVIRONMENT
Overall, the worldwide rate of growth in gross domestic product (GDP) was around 3.1 % in 2015, the
lowest it had been since the global financial crisis of 2009. The oil price also hit its lowest level for
eleven years at the end of 2015. This weak trend in the world economy was also reflected in the
Global Manufacturing Purchasing Managers’ Index (PMI), which stood at 50.9 in December 2015, a
reading barely above the 50 neutral mark. Across all sectors of industry, global production grew by
around 1.9 % year on year in 2015.
The European economy turned in a merely moderate performance in 2015. Only private consumption
showed a certain momentum. Industrial production grew by just 1.7 % year on year in 2015.
Following a relatively strong start at the beginning of the year, industrial production in the USA only
expanded by around 1.3 % overall in 2015, a much weaker performance compared with the growth
figures in the previous years. Towards the end of the year, industrial production even fell short of the
prior-year level.
Latin America experienced an economic downturn. Economic conditions remained challenging,
above all in Venezuela, Brazil and Argentina. Overall, industrial production in Latin America con-
tracted by approximately 1.9 % in 2015.
The economies of Asia saw growth momentum slow. China reports GDP growth of around 6.9 % in
2015, its weakest performance for 25 years. With GDP growth at around 2.7 % in 2015, Thailand also
shows a comparatively weak rate of expansion for the region and near-stagnant industrial production.
Industrial production across the region as a whole expanded by around 4.4 % year on year in 2015.
BUSINESS PERFORMANCE
MAJOR EVENTS IMPACTING ON BUSINESS IN 2015
In early March 2015, Brenntag acquired Swedish chemicals distributor Fred Holmberg & Co AB head-
quartered in Malmö. The company is focused on the distribution of chemicals in Scandinavia and also
provides efficient mixing and blending activities. The main site in Kalmar in the southwest of Sweden
has modern filling facilities and direct access to the port. The acquisition combines Fred Holmberg &
Co AB’s cost-efficient logistics set-up with Brenntag Nordic’s comprehensive market coverage. In finan-
cial year 2015, the acquiree generated sales of some EUR 77 million.
Also in March 2015, Brenntag acquired South African distributor LIONHEART CHEMICAL ENTERPRISES
(PROPRIETARY) LIMITED. The company, based in Benoni near Johannesburg, is a specialty distributor
in the South African market operating mainly in the food & beverage sector. Through this acquisition,
Brenntag is strengthening its position in the South African chemical distribution market. Lionheart’s
product portfolio is an excellent complement to our existing regional activities. In addition, we will be
REPORT ON ECONOMIC POSITION
M A N A G E M E N T R E P O R T
Report on Economic Position
A N N U A L R E P O R T 2 0 1 5 – B R E N N T A G A G 7 9D
fu
rt
he
r
in
fo
rm
at
io
nf
in
an
ci
al
s
ta
te
me
nt
s
C
ma
na
ge
me
nt
r
ep
or
t
B

able to combine existing supplier relationships and attract new suppliers. In financial year 2015, the
acquiree generated sales of around EUR 15 million.
In May 2015, Brenntag acquired all shares in Spanish chemicals distributor Quimicas Meroño, S.L. based
near Cartagena. The company offers its industrial customers logistics, blending and storage services.
This acquisition brings Brenntag additional growth opportunities, especially in key industry sectors
such as food and oil & gas. We also benefit from the company’s strong capabilities in value-added ser-
vices and blends. In financial year 2015, Quimicas Meroño generated sales of some EUR 13 million.
In June 2015, following Brenntag’s decision not to extend the international accounts receivable securitiza-
tion programme, the corresponding financial liabilities in the amount of EUR 187.5 million were repaid.
In November 2015, Brenntag Finance B.V., Amsterdam, Netherlands, issued a bond with warrant units
in the amount of USD 500.0 million maturing in December 2022. The bond was issued at 100 % and
bears a coupon of 1.875 % p.a. The issue price comprises the value of the bond (Bond (with Warrants)
2022) (92.7 %) and the value of the warrants entitling the holder to purchase Brenntag AG shares (7.3 %).
Brenntag thus achieves a more diversified financing structure and a more balanced maturity profile.
In November 2015, Brenntag also acquired Parkoteks Kimya Sanayi ve Ticaret Anonim Sirketi based in
Istanbul. The Turkish distribution company markets specialty chemicals with particular focus on the
personal care sector. Established in 1989, Parkoteks has grown strongly and benefits from long-term
and exclusive partnerships with world-leading specialty chemicals manufacturers, enabling the com-
pany to offer its customers a wide range of specialty ingredients. In financial year 2015, the acquiree
generated total sales of some EUR 12 million.
In December 2015, Brenntag acquired a 51 % interest in chemicals distributor Trychem FZCO in Dubai,
United Arab Emirates, thereby strengthening its own market position in the Middle East. In an initial
step, Brenntag will hold 51 % and Tri Star Transport LLC and JRA Holding Limited together 49 %.
This partnership offers sizeable synergies combining Trychem’s impressive local knowledge and
service capability with Brenntag’s extensive portfolio of global accounts and suppliers operating
within the region.
In December 2015, Brenntag significantly expanded its lubricants business in North America by
acquiring two leading distributors, J.A.M. Distributing Company, and related entities, headquartered
in Houston, Texas, and BWE, LLC (G.H. Berlin-Windward), and related entities, headquartered in
East Hartford, Connecticut. J.A.M. and G.H. Berlin-Windward serve a broad range of customer indus-
tries across the entire lubricant supply chain. Both companies offer integrated product and service
solutions focused on a wide range of lubricants serving industrial, commercial, automotive and
marine end markets throughout the US Gulf Coast, Texas and the northeast United States. Both acqui-
sitions are a significant investment in rebalancing our industry mix in North America and complement
our existing business in the less volatile lubricants market. In financial year 2015, G.H. Berlin-Windward
generated total sales of around EUR 217 million and J.A.M. Distributing Company sales of EUR 371 million.
In addition, in late December 2015, Brenntag completed the acquisition of TAT Group, a distributor of
industrial chemicals based in Singapore, Republic of Singapore. TAT has a strong market position, an
excellent reputation and a presence in several Asian countries. The company operates one of the
most attractive distribution sites in a prime location in Singapore, with large warehouses as well as
modern blending and repackaging facilities operating to HSE standards that are a perfect fit with
Brenntag’s principles. What is more, Singapore is the world’s second-largest port and offers access to
the chemical industry zone Jurong Island, making it a preferred hub location. In financial year 2015,
M A N A G E M E N T R E P O R T
Report on Economic Position
A N N U A L R E P O R T 2 0 1 5 – B R E N N T A G A G8 0
Successfully com-pleted acquisitions with enterprise values totalling more than EUR 550 m
Broader diversification of financing structure

the acquiree generated total sales of some EUR 213 million. As at December 31, 2015, Brenntag’s con-
solidated financial statements did not yet include any TAT Group income or expenses, only its assets
and liabilities.
STATEMENT BY THE BOARD OF MANAGEMENT ON BUSINESS PERFORMANCE
In an economic environment that delivered the lowest rate of growth since the global financial crisis
of 2009, the Group clearly exceeded prior-year operating gross profit and operating EBITDA. The
growth was supported by the beneficial exchange rate movements, particularly the appreciation of the
US dollar against the euro. However, operating gross profit and operating EBITDA for financial year
2014 were also surpassed slightly on a constant currency basis. This is attributable to the positive
overall trend in earnings in the EMEA, Latin America and Asia Pacific operating segments. In North
America, we saw a noticeable softening of demand from customers focused in the oil and gas sector
due to the significant reduction in the oil price. This led to a slight decline in operating gross profit in
this segment on a constant currency basis. Looking at the Brenntag Group’s performance excluding
the contribution from the North American oil and gas sector, we were able to lift operating gross
profit by around 4.4 % compared with financial year 2014 on a constant currency basis.
The Brenntag Group recorded a moderate increase in operating expenses on a constant currency
basis. Combined with the slight growth in operating gross profit, this meant that operating EBITDA
was also up slightly on financial year 2014 on a constant currency basis.
Due to exchange rate movements, especially the noticeable appreciation of the US dollar, the
reported growth rates far exceeded those on a constant currency basis.
Average working capital increased year on year in 2015, while annualized working capital turnover
declined in the same period.
Capital expenditure on property, plant and equipment showed a moderate year-on-year increase in
financial year 2015. We continue to make appropriate investment in our existing infrastructure and in
growth projects.
Overall, the changes in operating EBITDA, working capital and capital expenditure resulted in a free
cash flow that clearly exceeded the prior-year level.
The Brenntag Group achieved record results overall in financial year 2015. Nevertheless, we were
unable to fully meet our high expectations, in particular because of the difficult situation in the oil
and gas sector.
M A N A G E M E N T R E P O R T
Report on Economic Position
A N N U A L R E P O R T 2 0 1 5 – B R E N N T A G A G 8 1
Historic highs in oper-ating gross profit and operating EBITDA
D
fu
rt
he
r
in
fo
rm
at
io
nf
in
an
ci
al
s
ta
te
me
nt
s
C
ma
na
ge
me
nt
r
ep
or
t
B

RESULTS OF OPERATIONS
BUSINESS PERFORMANCE OF THE BRENNTAG GROUP
1) Change in % (fx adj.) is the percentage change on a constant currency basis.
Despite a difficult economic environment that delivered the lowest rate of growth since the global
financial crisis of 2009, the Brenntag Group and its segments performed well. In the following, we
only comment on performance where it differs from last year’s forecast.
Change
in EUR m 2015 2014 abs. in % in % (fx adj.) 1)
Sales 10,346.1 10,015.6 330.5 3.3 – 4.6
Operating gross profit 2,321.7 2,078.2 243.5 11.7 2.3
Operating expenses – 1,514.3 – 1,351.5 – 162.8 12.0 3.1
Operating EBITDA 807.4 726.7 80.7 11.1 0.7
Transaction costs / holding charges – 0.2 – 0.2 – –
EBITDA (incl. transaction costs / holding charges) 807.4 726.9 80.5 11.1 0.7
Depreciation of property, plant and equipment – 108.7 – 99.4 – 9.3 9.4 1.1
EBITA 698.7 627.5 71.2 11.3 0.6
Amortization of intangible assets – 36.9 – 35.9 – 1.0 2.8 – 5.4
Net finance costs – 112.5 – 83.8 – 28.7 34.2 –
Profit before tax 549.3 507.8 41.5 8.2 –
Income tax expense – 181.2 – 168.1 – 13.1 7.8 –
Profit after tax 368.1 339.7 28.4 8.4 –
b.02 business performance of the brenntag group
M A N A G E M E N T R E P O R T
Report on Economic Position
A N N U A L R E P O R T 2 0 1 5 – B R E N N T A G A G8 2

sales and volumes
The Brenntag Group achieved sales of EUR 10,346.1 million in financial year 2015, an increase of 3.3 %
compared with financial year 2014. This was mainly supported by the trend in the US dollar exchange
rate. On a constant currency basis, sales declined by 4.6 %, which was primarily due to a fall in prices
on the chemicals market, especially for chemicals based on oil as a raw material. In this period, volumes
remained almost on a par with the previous year. The companies acquired in the course of the year
and therefore consolidated for the first time made a positive contribution.
operating gross profit
The Brenntag Group generated an operating gross profit of EUR 2,321.7 million in financial year 2015,
a year-on-year increase of 11.7 %, or 2.3 % on a constant currency basis. This growth is mainly attrib-
utable to a higher operating gross profit per unit. The aforementioned fall in prices on the chemicals
market did not, therefore, lead to a decline in operating gross profit per unit. In addition to organic
growth, the acquisitions also made a positive contribution to the increase in operating gross profit.
We did not quite meet our forecast. A key factor behind the lower than expected growth was the
decline in operating gross profit from customers in the oil and gas sector in the North America seg-
ment. Adjusted for this North American business sector, the Brenntag Group’s operating gross profit
increased by approximately 4.4 % on a constant currency basis.
operating expenses
The Brenntag Group’s operating expenses amounted to EUR 1,514.3 million in financial year 2015, a
year-on-year increase of 12.0 %, or 3.1 % on a constant currency basis. This moderate rise is mainly
attributable to higher personnel, rent, maintenance and transport costs.
ebitda
The Brenntag Group generated EBITDA of EUR 807.4 million overall in financial year 2015, an increase
of 11.1 %, or 0.7 % on a constant currency basis. Adjusted for transaction costs and holding charges,
operating EBITDA also increased to EUR 807.4 million, up by 11.1 %, or 0.7 % on a constant currency
basis. Earnings were therefore at the upper end of the forecast of EUR 790 million to 810 million pub-
lished in November 2015. However, the growth was less than anticipated in the prior-year report due
to weak business with customers in the oil and gas sector.
depreciation, amortization and net finance costs
Depreciation of property, plant and equipment and amortization of intangible assets totalled
EUR 145.6 million in financial year 2015. Of this figure, EUR 108.7 million relates to depreciation of
property, plant and equipment and EUR 36.9 million to amortization of intangible assets. Overall,
depreciation and amortization increased by EUR 10.3 million compared with financial year 2014.
This slight rise is mainly due to the moderate expansion of capacities.
Net finance costs totalled EUR – 112.5 million (2014: EUR – 83.8 million). The main reason for this
increase was the remeasurement of the purchase price liability for the remaining shares in Zhong
Yung (second tranche), which is contained in this figure as an expense of EUR 23.4 million (2014:
income of EUR 6.1 million). On initial recognition at the end of August 2011, the purchase price
expected to be paid for the remaining shares in Zhong Yung in 2016 was recorded as a liability at its
present value within other comprehensive income. Any changes resulting from unwinding of dis-
counting and changes in the estimate of the purchase price have since been recognized in profit or
loss and as a change in liabilities related to the acquisition of non-controlling interests recognized
within net finance costs. The interest expense, which is part of net finance cost, totalled EUR – 71.5
million and showed a slight improvement on the previous year (EUR – 73.4 million). The bond with
warrant units in the amount of USD 500.0 million issued in November 2015 only had a minor effect
M A N A G E M E N T R E P O R T
Report on Economic Position
A N N U A L R E P O R T 2 0 1 5 – B R E N N T A G A G 8 3
EUR
807.4 mEBITDA
EUR
2,321.7 mOperating gross profit
EUR
10,346.1 mSales
D
fu
rt
he
r
in
fo
rm
at
io
nf
in
an
ci
al
s
ta
te
me
nt
s
C
ma
na
ge
me
nt
r
ep
or
t
B
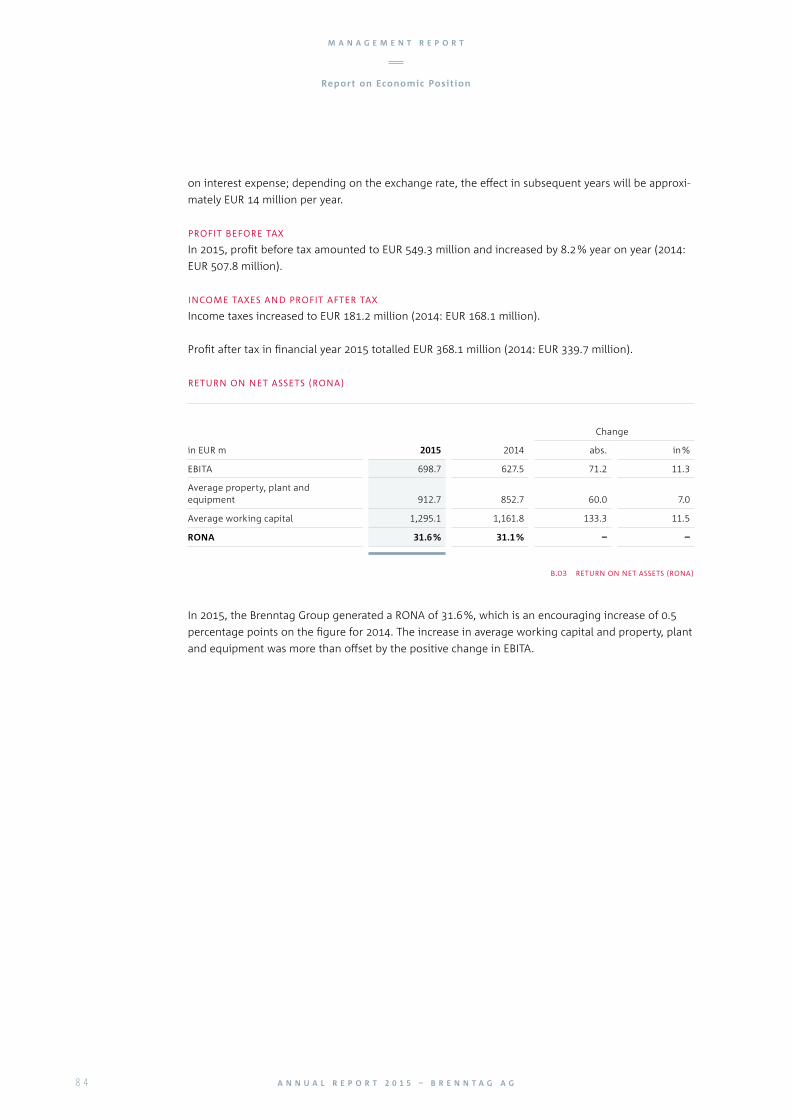
on interest expense; depending on the exchange rate, the effect in subsequent years will be approxi-
mately EUR 14 million per year.
profit before tax
In 2015, profit before tax amounted to EUR 549.3 million and increased by 8.2 % year on year (2014:
EUR 507.8 million).
income taxes and profit after tax
Income taxes increased to EUR 181.2 million (2014: EUR 168.1 million).
Profit after tax in financial year 2015 totalled EUR 368.1 million (2014: EUR 339.7 million).
return on net assets (rona)
In 2015, the Brenntag Group generated a RONA of 31.6 %, which is an encouraging increase of 0.5
percentage points on the figure for 2014. The increase in average working capital and property, plant
and equipment was more than offset by the positive change in EBITA.
Change
in EUR m 2015 2014 abs. in %
EBITA 698.7 627.5 71.2 11.3
Average property, plant and equipment 912.7 852.7 60.0 7.0
Average working capital 1,295.1 1,161.8 133.3 11.5
RONA 31.6 % 31.1 % – –
b.03 return on net assets (rona)
M A N A G E M E N T R E P O R T
Report on Economic Position
A N N U A L R E P O R T 2 0 1 5 – B R E N N T A G A G8 4

BUSINESS PERFORMANCE IN THE SEGMENTS
external sales and volumes
The EMEA segment achieved external sales of EUR 4,654.4 million in financial year 2015, an increase
of 0.6 % on the previous year. On a constant currency basis, this represents a slight decline of 0.6 %,
which was driven mainly by the downward trend in prices for crude oil-based products. Volumes
increased slightly in this period.
operating gross profit
The companies in this segment generated an operating gross profit of EUR 1,024.2 million in financial
year 2015, a year-on-year increase of 5.4 %, or 3.6 % on a constant currency basis. This performance
is attributable to an increase in volumes and a higher operating gross profit per unit. Earnings are
therefore slightly lower than forecast. This is mainly due to the macroeconomic environment not
being as dynamic as expected, particularly in the second half of the year.
operating expenses
Operating expenses in the EMEA segment increased by 5.5 % to EUR 671.2 million in financial year
2015. On a constant currency basis, this represents a rise of 3.8 % compared with financial year 2014.
This moderate increase was mainly the result of higher personnel expenses and volume-driven costs
for transport, maintenance and partly also rent.
2015in EUR m
BrenntagGroup EMEA
North America
Latin America
Asia Pacific
All other
segments
External sales 10,346.1 4,654.4 3,600.6 925.8 834.1 331.2
Operating gross profit 2,321.7 1,024.2 942.6 201.2 140.0 13.7
Operating expenses – 1,514.3 – 671.2 – 577.0 – 136.5 – 89.7 – 39.9
Operating EBITDA 807.4 353.0 365.6 64.7 50.3 – 26.2
b.04 business performance in the segments
Change
in EUR m 2015 2014 abs. in % in % (fx adj.)
External sales 4,654.4 4,624.7 29.7 0.6 – 0.6
Operating gross profit 1,024.2 972.0 52.2 5.4 3.6
Operating expenses – 671.2 – 636.1 – 35.1 5.5 3.8
Operating EBITDA 353.0 335.9 17.1 5.1 3.2
b.05 business performance in the segments / emea
emea (europe, middle east & africa)
M A N A G E M E N T R E P O R T
Report on Economic Position
A N N U A L R E P O R T 2 0 1 5 – B R E N N T A G A G 8 5D
fu
rt
he
r
in
fo
rm
at
io
nf
in
an
ci
al
s
ta
te
me
nt
s
C
ma
na
ge
me
nt
r
ep
or
t
B

operating ebitda
The companies in this segment generated operating EBITDA of EUR 353.0 million in financial year
2015 and thus posted earnings growth of 5.1 % and, on a constant currency basis, 3.2 % compared
with financial year 2014. We are satisfied with this result, especially given the fact that overall eco-
nomic growth was weak.
north america
external sales and volumes
External sales in the North America segment climbed by 8.1 % to EUR 3,600.6 million in financial year
2015. On a constant currency basis, this represents a decline of 8.6 % year on year and is attributable
to a fall in volumes and the downward trend in prices for crude oil-based products.
operating gross profit
The operating gross profit generated by the North American companies was up 17.5 % on financial
year 2014 to EUR 942.6 million in financial year 2015. On a constant currency basis, this represents a
slight decline of 0.5 %. The slight fall in volumes was partly offset by a higher operating gross profit
per unit. This result was lower than forecast and mainly due to the decline in business with customers
in the oil and gas sector. Demand was hit severely by the noticeable fall in the oil price in financial
year 2015. The upstream sector 2), in particular and the midstream sector 2) to a lesser extent were
adversely affected. The downstream sector 2), on the other hand, benefited from the low oil price and
exceeded the prior-year level. Business in the other customer industries grew by approximately 4.6 %
on a constant currency basis in financial year 2015.
operating expenses
Operating expenses in the North America segment amounted to EUR 577.0 million in financial year
2015, a year-on-year increase of 20.6 %, or 2.3 % on a constant currency basis. This moderate rise is
largely due to lower income from fuel surcharges which was partly offset by savings on energy costs.
operating ebitda
The North American companies generated operating EBITDA of EUR 365.6 million in financial year
2015, an increase of 13.0 % compared with the previous year. On a constant currency basis, this rep-
resents a decline of 4.6 % and is therefore below the original forecast. This is primarily attributable to
the noticeable fall in operating gross profit in the oil & gas business. In addition, industrial produc-
tion showed only low growth in this period and weakened noticeably over the course of the year.
Change
in EUR m 2015 2014 abs. in % in % (fx adj.)
External sales 3,600.6 3,332.0 268.6 8.1 – 8.6
Operating gross profit 942.6 802.2 140.4 17.5 – 0.5
Operating expenses – 577.0 – 478.6 – 98.4 20.6 2.3
Operating EBITDA 365.6 323.6 42.0 13.0 – 4.6
b.06 business performance in the segments / north america
2) Upstream: the sector of the oil and gas industry primarily comprising exploration and related activities; midstream: the sector of the oil and gas industry comprising treatment, transportation and storage; downstream: the refining and processing sector of the oil and gas industry.
M A N A G E M E N T R E P O R T
Report on Economic Position
A N N U A L R E P O R T 2 0 1 5 – B R E N N T A G A G8 6

latin america
external sales and volumes
The Latin America segment achieved external sales of EUR 925.8 million in financial year 2015, an
increase of 7.2 % compared with the previous year. On a constant currency basis, external sales
(– 0.1 %) and volumes were almost on a par with the previous year.
operating gross profit
The operating gross profit generated by the Latin American companies increased strongly in financial
year 2015 by 18.7 % to EUR 201.2 million. On a constant currency basis, operating gross profit grew
by 9.8 % year on year. This strong growth is due to a higher operating gross profit per unit.
operating expenses
Operating expenses in the Latin America segment amounted to EUR 136.5 million in financial year
2015, a year-on-year rise of 11.2 %, or 2.6 % on a constant currency basis. This moderate increase is
partly due to higher transport and maintenance costs.
operating ebitda
The Latin American companies generated operating EBITDA of EUR 64.7 million in financial year 2015
and thus posted particularly encouraging earnings growth of 38.2 %. On a constant currency basis,
this represents an increase of 29.1 % compared with financial year 2014. We are very satisfied with
this result, especially given the fact that industrial production contracted.
Change
in EUR m 2015 2014 abs. in % in % (fx adj.)
External sales 925.8 864.0 61.8 7.2 – 0.1
Operating gross profit 201.2 169.5 31.7 18.7 9.8
Operating expenses – 136.5 – 122.7 – 13.8 11.2 2.6
Operating EBITDA 64.7 46.8 17.9 38.2 29.1
b.07 business performance in the segments / latin america
M A N A G E M E N T R E P O R T
Report on Economic Position
A N N U A L R E P O R T 2 0 1 5 – B R E N N T A G A G 8 7D
fu
rt
he
r
in
fo
rm
at
io
nf
in
an
ci
al
s
ta
te
me
nt
s
C
ma
na
ge
me
nt
r
ep
or
t
B

asia pacific
external sales and volumes
The Asia Pacific segment generated external sales of EUR 834.1 million in financial year 2015, an
increase of 11.5 % compared with the previous year. On a constant currency basis, this represents a
decline of 2.3 % and is due to a fall in volumes.
operating gross profit
The operating gross profit generated by the companies in the Asia Pacific segment climbed by 16.0 %
to EUR 140.0 million in financial year 2015. On a constant currency basis, this represents an increase
of 2.3 % and is attributable to a higher operating gross profit per unit. The stronger increase forecast
was therefore not achieved. This was mainly due to the generally difficult economic environment and
in particular the ongoing difficult economic and political situation in Thailand.
operating expenses
Operating expenses in the Asia Pacific segment increased by 12.8 % year on year to EUR 89.7 million
in financial year 2015. On a constant currency basis, however, they declined by a marginal 0.1 % after
temporarily higher costs were incurred in 2014 in connection with the expansion of capabilities in
order to prepare the region for further growth.
operating ebitda
The companies in the Asia Pacific segment generated operating EBITDA of EUR 50.3 million overall in
financial year 2015 and thus posted earnings growth of 22.1 %, or 7.0 % on a constant currency basis.
This growth is only slightly lower than forecast even though economic performance lost momentum
and thus fell short of our expectations.
Change
in EUR m 2015 2014 abs. in % in % (fx adj.)
External sales 834.1 748.2 85.9 11.5 – 2.3
Operating gross profit 140.0 120.7 19.3 16.0 2.3
Operating expenses – 89.7 – 79.5 – 10.2 12.8 – 0.1
Operating EBITDA 50.3 41.2 9.1 22.1 7.0
b.08 business performance in the segments / asia pacific
M A N A G E M E N T R E P O R T
Report on Economic Position
A N N U A L R E P O R T 2 0 1 5 – B R E N N T A G A G8 8

all other segments
In addition to various holding companies, all other segments contain the operations of Brenntag
International Chemicals, which buys and sells chemicals in bulk on an international scale without
regional boundaries.
Brenntag International Chemicals GmbH, Mülheim an der Ruhr, slightly exceeded prior-year operating
EBITDA. This was due to a decline in operating expenses, while operating gross profit remained virtu-
ally unchanged in this period.
In the same period, the holding companies posted operating expenses which were higher than in
financial year 2014. Operating expenses were partly impacted by higher personnel expenses and
costs in connection with the acquisitions.
Overall, the operating EBITDA of all other segments fell by EUR 5.4 million year on year to
EUR – 26.2 million in financial year 2015.
Change
in EUR m 2015 2014 abs. in % in % (fx adj.)
External sales 331.2 446.7 – 115.5 – 25.9 – 25.9
Operating gross profit 13.7 13.8 – 0.1 – 0.7 – 0.7
Operating expenses – 39.9 – 34.6 – 5.3 15.3 15.3
Operating EBITDA – 26.2 – 20.8 – 5.4 26.0 26.0
b.09 business performance in the segments / all other segments
M A N A G E M E N T R E P O R T
Report on Economic Position
A N N U A L R E P O R T 2 0 1 5 – B R E N N T A G A G 8 9D
fu
rt
he
r
in
fo
rm
at
io
nf
in
an
ci
al
s
ta
te
me
nt
s
C
ma
na
ge
me
nt
r
ep
or
t
B

FINANCIAL POSITION
CAPITAL STRUCTURE
The primary objective of capital structure management is to maintain the Group’s financial strength.
Brenntag concentrates on a capital structure which enables the Group to cover its potential financing
requirements at all times. This gives Brenntag a high degree of independence, security and flexibility.
Our liquidity, interest and currency risks are largely managed on a Group-wide basis. Derivative finan-
cial instruments are only used to hedge the above-mentioned risks from underlying transactions and
not for speculative purposes. A Group-wide Finance Guideline ensures the implementation of these
policies and uniform processes throughout the Group.
The most important component in the financing structure of Brenntag AG is the Group-wide syndi-
cated loan agreement running until March 2019, which we concluded with a consortium of interna-
tional banks. The loan is based on variable interest rates with margins depending on leverage, and is
divided into different tranches with different currencies. In addition to these fully drawn tranches, the
loan agreement also contains a revolving credit facility of EUR 600.0 million, which can be drawn
down in various currencies.
While some of our subsidiaries are direct borrowers under the loan, others obtain their financing
from intra-group loans. Total liabilities (excluding accrued interest and before offsetting of transaction
costs) under the syndicated loan amounted to EUR 1,222.3 million as at December 31, 2015. The
revolving credit facility was mostly unused on the reporting date.
In April 2013, parts of the floating-rate syndicated loan were hedged against interest rate risks with
suitable financial instruments. Overall, some 64 % of the financial indebtedness of the Brenntag
Group is currently hedged against the risk of interest rate increases.
The bond (Bond 2018) issued by our Group company Brenntag Finance B.V., Amsterdam, Netherlands,
in July 2011 has a volume of EUR 400.0 million and matures in July 2018. The bond bears a coupon of
5.5 % with interest paid annually. It is guaranteed by Brenntag AG. If any of the events of default
defined in the Conditions of Issue occurs, each holder of the Bond 2018 may terminate his bond and
request that it be repaid immediately. Should the issuer not be able to meet its repayment obliga-
tions, the bondholders are entitled to call on the guarantee provided by Brenntag AG as security.
Furthermore, in November 2015, Brenntag Finance B.V. issued a bond with warrant units in the
amount of USD 500.0 million maturing in December 2022. The bond (Bond (with Warrants) 2022) was
issued at 92.7 % of par and bears a coupon of 1.875 % p.a. with interest payable semi-annually. The
interest expense from the Bond (with Warrants) 2022 comprises the aforementioned interest pay-
ments and the ongoing amortization of the discount. The discount (7.3 % or USD 36.5 million) is the
warrant premium on the warrants to purchase Brenntag AG shares issued together with the Bond
(with Warrants) 2022. The warrant premium was recognized in the Group’s additional paid-in capital.
If a termination event as defined in the bond terms and conditions occurs, each holder of the Bond
(with Warrants) 2022 may terminate his Bond (with Warrants) 2022 and request that it be repaid
immediately. Should the issuer not be able to meet its repayment obligations, the bondholders are
entitled to call on the guarantee provided by Brenntag AG as security.
In addition to the three above-mentioned refinancing instruments, some of our companies make use
of credit lines with local banks on a lesser scale in consultation with the Group management.
M A N A G E M E N T R E P O R T
Report on Economic Position
A N N U A L R E P O R T 2 0 1 5 – B R E N N T A G A G9 0

Based on our decision not to extend the international accounts receivable securitization programme,
we repaid the corresponding financial liabilities in the amount of EUR 187.5 million in June 2015.
According to our short and mid-term financial planning, the capital requirements for operating activi-
ties, investments in property, plant and equipment as well as dividends and acquisitions in the size of
past practice are expected to be covered by the cash provided by operating activities so that no fur-
ther loans are necessary for these purposes. Under the syndicated loan, we also have the previously
mentioned revolving credit facility available to cover short-term liquidity requirements and for gen-
eral corporate purposes.
1) Syndicated loan, Bond 2018 and Bond (with Warrants) 2022 excluding accrued interest and transaction costs.
b.10 maturity profile of our credit portfolio
maturity profile of our credit portfolio 1) as per december 31, 2015
0
200
400
600
800
1,000
1,200
1,400
in EUR m
2017 2018 202120192016 2020 2022
M A N A G E M E N T R E P O R T
Report on Economic Position
A N N U A L R E P O R T 2 0 1 5 – B R E N N T A G A G 9 1D
fu
rt
he
r
in
fo
rm
at
io
nf
in
an
ci
al
s
ta
te
me
nt
s
C
ma
na
ge
me
nt
r
ep
or
t
B

INVESTMENTS
In 2015, investments in property, plant and equipment and intangible assets (excluding additions
from company acquisitions) led to a total cash outflow of EUR 126.7 million (2014: EUR 103.0 million).
We regularly invest in the maintenance, replacement and extension of the infrastructure necessary to
perform our services. Such infrastructure is comprised of warehouses, offices, trucks and vehicles of
our field service as well as IT hardware for various systems.
As the market leader and a responsible chemicals distributor, we attach importance to ensuring that our
property, plant and equipment meet comprehensive health, safety and environmental requirements.
Investments are typically funded from cash flow and / or cash from the respective Group companies.
With larger investment plans which cannot be covered by local funds, financing is provided by the
Group and external borrowings are mostly not necessary.
M A N A G E M E N T R E P O R T
Report on Economic Position
A N N U A L R E P O R T 2 0 1 5 – B R E N N T A G A G9 2

LIQUI DITY
cash flow
In the reporting period, the Group’s net cash inflow from operating activities amounted to
EUR 593.7 million, an increase of EUR 224.0 million year on year. The reduction in working capital in
the reporting year had a particularly positive effect (in 2014 it increased). By contrast, tax payments
were slightly higher.
Of the net cash used in investing activities totalling EUR 621.6 million, EUR 126.7 million was for
payments to acquire intangible assets and property, plant and equipment. The payments to acquire
consolidated subsidiaries, other business units and other financial assets in the amount of
EUR 500.9 million largely comprise the purchase prices for the shares in J.A.M. Distributing Company
and G.H. Berlin-Windward, both headquartered in the USA, and Singapore-based TAT Group.
Of the net cash inflow from financing activities totalling EUR 112.0 million in the reporting period,
EUR 470.3 million was received from the issue of a bond with warrant units in the amount of
USD 500.0 million. This figure includes the premium of EUR 34.3 million for the warrants issued
together with the Bond (with Warrants) 2022 for the purchase of shares of Brenntag AG. The dividend
payment to the Brenntag shareholders led to cash outflows in the amount of EUR 139.1 million.
Furthermore, in connection with the termination of the international accounts receivable securitiza-
tion programme, financial liabilities of EUR 187.5 million were repaid. The other changes, totalling
EUR 88.7 million in cash inflows and EUR 120.4 million in cash outflows, mainly relate to local bank
loans taken out as well as repayments on local bank loans and the revolving credit line under the
syndicated loan.
in EUR m 2015 2014
Net cash provided by operating activities 593.7 369.7
Net cash used in investing activities – 621.6 – 178.2
thereof payments to acquire consolidated subsidiaries, other business units and other financial assets – 500.9 – 82.6
thereof payments to acquire intangible assets and property, plant and equipment – 126.7 – 103.0
thereof proceeds from divestments 6.0 7.4
Net cash provided by / used in financing activities 112.0 – 149.3
Change in cash and cash equivalents 84.1 42.2
b.11 cash flow
M A N A G E M E N T R E P O R T
Report on Economic Position
A N N U A L R E P O R T 2 0 1 5 – B R E N N T A G A G 9 3
Information on the “Consolidated Cash Flow Statement Disclosures” in the consolidated finan-cial statements
D
fu
rt
he
r
in
fo
rm
at
io
nf
in
an
ci
al
s
ta
te
me
nt
s
C
ma
na
ge
me
nt
r
ep
or
t
B
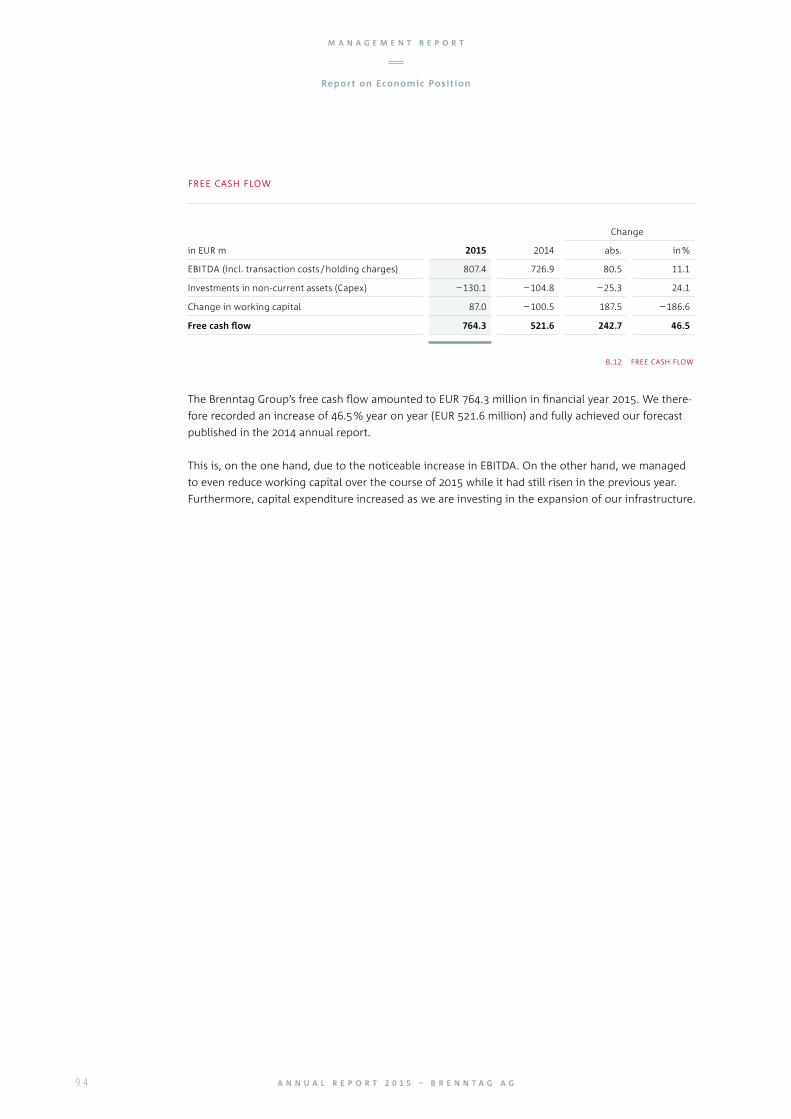
free cash flow
The Brenntag Group’s free cash flow amounted to EUR 764.3 million in financial year 2015. We there-
fore recorded an increase of 46.5 % year on year (EUR 521.6 million) and fully achieved our forecast
published in the 2014 annual report.
This is, on the one hand, due to the noticeable increase in EBITDA. On the other hand, we managed
to even reduce working capital over the course of 2015 while it had still risen in the previous year.
Furthermore, capital expenditure increased as we are investing in the expansion of our infrastructure.
Change
in EUR m 2015 2014 abs. in %
EBITDA (incl. transaction costs / holding charges) 807.4 726.9 80.5 11.1
Investments in non-current assets (Capex) – 130.1 – 104.8 – 25.3 24.1
Change in working capital 87.0 – 100.5 187.5 – 186.6
Free cash flow 764.3 521.6 242.7 46.5
b.12 free cash flow
M A N A G E M E N T R E P O R T
Report on Economic Position
A N N U A L R E P O R T 2 0 1 5 – B R E N N T A G A G9 4

FINANCIAL AND ASSETS POSITION
1) Of the intangible assets as at December 31, 2015, some EUR 1,275 million relates to goodwill and trademarks that were capitalized as part of the purchase price allocation performed on the acquisition of the Brenntag Group by funds advised by BC Partners Limited, Bain Capital, Ltd. and subsidiaries of Goldman Sachs International at the end of the third quarter of 2006 in addition to the relevant intangible assets already existing in the previous Group structure.
As at December 31, 2015, total assets had increased by 12.2 % to EUR 6,976.2 million
(Dec. 31, 2014: EUR 6,215.0 million).
Dec. 31, 2015 Dec. 31, 2014
in EUR m abs. in % abs. in %
Assets
Current assets 3,098.8 44.4 2,935.7 47.2
Cash and cash equivalents 579.1 8.3 491.9 8.0
Trade receivables 1,426.5 20.4 1,407.2 22.6
Other receivables and assets 196.1 2.8 170.8 2.7
Inventories 897.1 12.9 865.8 13.9
Non-current assets 3,877.4 55.6 3,279.3 52.8
Intangible assets 1) 2,772.1 39.7 2,268.0 36.5
Other fixed assets 994.4 14.3 904.3 14.6
Receivables and other assets 110.9 1.6 107.0 1.7
Total assets 6,976.2 100.0 6,215.0 100.0
Liabilities and Equity
Current liabilities 1,738.9 24.9 1,829.5 29.4
Provisions 42.1 0.6 45.1 0.7
Trade payables 1,055.5 15.1 1,046.2 16.8
Financial liabilities 160.8 2.3 334.0 5.4
Miscellaneous liabilities 480.5 6.9 404.2 6.5
Equity and non-current liabilities 5,237.3 75.1 4,385.5 70.6
Equity 2,690.5 38.6 2,356.9 38.0
Non-current liabilities 2,546.8 36.5 2,028.6 32.6
Provisions 272.0 3.9 277.0 4.5
Financial liabilities 2,094.4 30.0 1,567.6 25.1
Miscellaneous liabilities 180.4 2.6 184.0 3.0
Total liabilities and equity 6,976.2 100.0 6,215.0 100.0
b.13 financial and assets position
M A N A G E M E N T R E P O R T
Report on Economic Position
A N N U A L R E P O R T 2 0 1 5 – B R E N N T A G A G 9 5D
fu
rt
he
r
in
fo
rm
at
io
nf
in
an
ci
al
s
ta
te
me
nt
s
C
ma
na
ge
me
nt
r
ep
or
t
B
Thanks to strong cash inflows from the operating activities of the Brenntag Group, cash and cash
equivalents increased by EUR 87.2 million to EUR 579.1 million (Dec. 31, 2014: EUR 491.9 million). The
rise is mainly due to the reduction in working capital. The cash inflow from the bond with warrant
units in the amount of USD 500.0 million was offset by the cash outflow of EUR 500.8 million for pur-
chase price payments for acquisitions completed.
Working capital is defined as trade receivables plus inventories less trade payables. The three compo-
nents of working capital changed in the reporting period as follows:
Trade receivables increased in the reporting period by 1.4 % to EUR 1,426.5 million (Dec. 31, 2014:
EUR 1,407.2 million).
Inventories increased by 3.6 % in the reporting period to EUR 897.1 million (Dec. 31, 2014:
EUR 865.8 million).
With the opposite effect on the change in working capital, trade payables increased by 0.9 % to
EUR 1,055.5 million (Dec. 31, 2014: EUR 1,046.2 million).
Working capital – adjusted for exchange rate effects and acquisitions – decreased from the level at
December 31, 2014 by a total of EUR 87.0 million. At 8.0, annualized working capital turnover 3)
decreased in the reporting period compared with the level of 2014 (8.6).
The intangible assets and other fixed assets of the Brenntag Group increased year on year by 18.7 %
or EUR 594.2 million to EUR 3,766.5 million (Dec. 31, 2014: EUR 3,172.3 million). The change was
mainly a result of acquisitions (EUR 489.5 million), investments in non-current assets (EUR 130.1 mil-
lion) and exchange rate effects (EUR 122.0 million), on the one hand, and depreciation and amortiza-
tion in the amount of EUR 145.6 million, on the other.
Current financial liabilities decreased by EUR 173.2 million to a total of EUR 160.8 million (Dec. 31, 2014:
EUR 334.0 million). The reduction in current financial liabilities was largely due to the termination of
the international accounts receivable securitization programme in June 2015. Current financial liabili-
ties were then mainly temporary local loans taken out by Brenntag companies. In the reporting
period, non-current financial liabilities increased by 33.6 % to EUR 2,094.4 million (Dec. 31, 2014:
EUR 1,567.6 million). The rise in non-current financial liabilities is due to the issue of the bond with
warrant units in the amount of USD 500.0 million and the influence of the stronger US dollar on the
part of the syndicated loan drawn down in US dollars.
Current and non-current provisions amounted to EUR 314.1 million (Dec. 31, 2014: EUR 322.1 mil-
lion). This figure included pension provisions in the amount of EUR 150.9 million (Dec. 31, 2014:
EUR 162.6 million).
As at December 31, 2015, the equity of the Brenntag Group totalled EUR 2,690.5 million
(Dec. 31, 2014: EUR 2,356.9 million).
3) Ratio of annual sales to average working capital; average working capital is defined for a particular year as the average of the values for working capital at the beginning of the year, the end of each of the first, second and third quarters, and the end of the year.
M A N A G E M E N T R E P O R T
Report on Economic Position
A N N U A L R E P O R T 2 0 1 5 – B R E N N T A G A G9 6
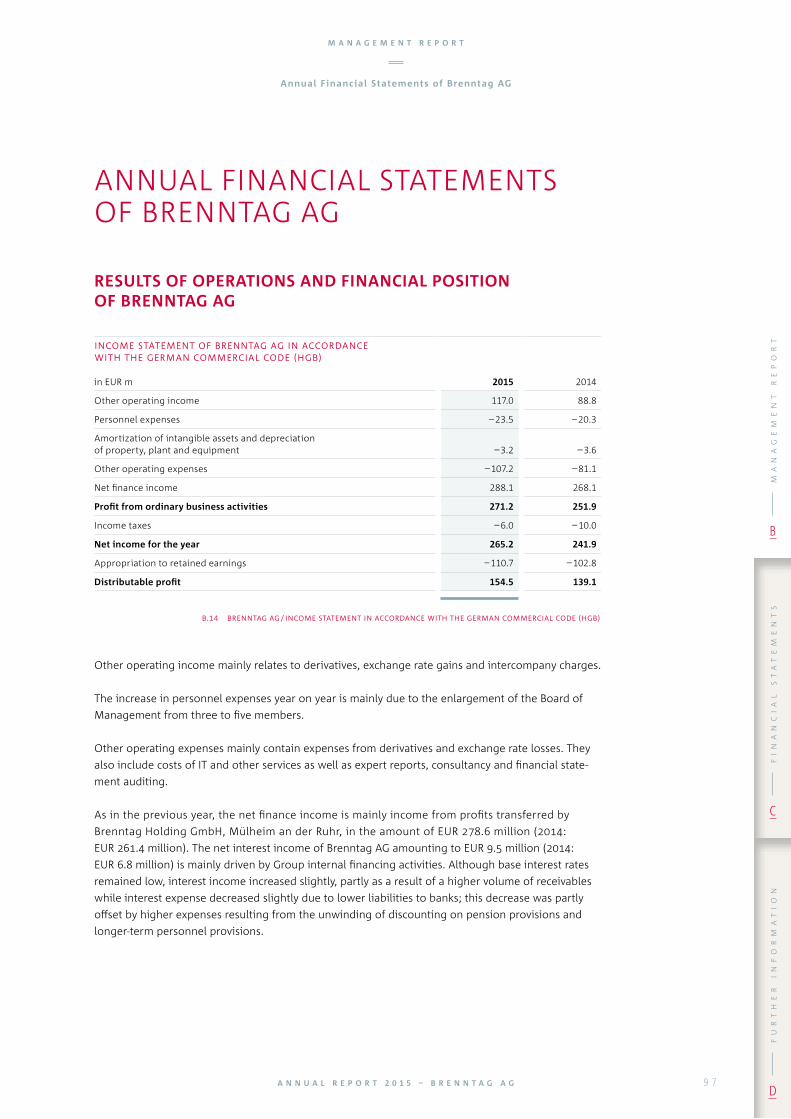
RESULTS OF OPERATIONS AND FINANCIAL POSITION OF BRENNTAG AG
ANNUAL FINANCIAL STATEMENTS OF BRENNTAG AG
Other operating income mainly relates to derivatives, exchange rate gains and intercompany charges.
The increase in personnel expenses year on year is mainly due to the enlargement of the Board of
Management from three to five members.
Other operating expenses mainly contain expenses from derivatives and exchange rate losses. They
also include costs of IT and other services as well as expert reports, consultancy and financial state-
ment auditing.
As in the previous year, the net finance income is mainly income from profits transferred by
Brenntag Holding GmbH, Mülheim an der Ruhr, in the amount of EUR 278.6 million (2014:
EUR 261.4 million). The net interest income of Brenntag AG amounting to EUR 9.5 million (2014:
EUR 6.8 million) is mainly driven by Group internal financing activities. Although base interest rates
remained low, interest income increased slightly, partly as a result of a higher volume of receivables
while interest expense decreased slightly due to lower liabilities to banks; this decrease was partly
offset by higher expenses resulting from the unwinding of discounting on pension provisions and
longer-term personnel provisions.
income statement of brenntag ag in accordance with the german commercial code (hgb)
in EUR m 2015 2014
Other operating income 117.0 88.8
Personnel expenses – 23.5 – 20.3
Amortization of intangible assets and depreciation of property, plant and equipment – 3.2 – 3.6
Other operating expenses – 107.2 – 81.1
Net finance income 288.1 268.1
Profit from ordinary business activities 271.2 251.9
Income taxes – 6.0 – 10.0
Net income for the year 265.2 241.9
Appropriation to retained earnings – 110.7 – 102.8
Distributable profit 154.5 139.1
b.14 brenntag ag / income statement in accordance with the german commercial code (hgb)
M A N A G E M E N T R E P O R T
Annual Financial Statements of Brenntag AG
A N N U A L R E P O R T 2 0 1 5 – B R E N N T A G A G 9 7D
fu
rt
he
r
in
fo
rm
at
io
nf
in
an
ci
al
s
ta
te
me
nt
s
C
ma
na
ge
me
nt
r
ep
or
t
B

The income taxes amounting to EUR 6.0 million (2014: EUR 10.0 million) are for 2015 and prior years.
In the reporting year, EUR 4.1 million relate to current income tax expenses and EUR 1.9 million to
deferred taxes. As at December 31, 2015, temporary accounting differences led to an overall future
tax liability of EUR 4.4 million as deferred tax liabilities exceed deferred tax assets.
In line with its function as a holding company, Brenntag AG’s future results mainly depend on the
receipt of dividends from companies in the Group and therefore also on the business performance of
subsidiaries and decisions on dividend distributions. At Brenntag, intra-Group dividends are distrib-
uted, taking local financing requirements and further constraints into consideration. Even if no intra-
Group dividends are distributed to Brenntag AG in a financial year, there are sufficient reserves to pay
an appropriate dividend to the Brenntag shareholders.
The fixed assets of Brenntag AG in the amount of EUR 2,429.6 million (Dec. 31, 2014: EUR 2,371.2 mil-
lion) almost exclusively comprise shares in affiliated companies.
The equity of Brenntag AG increased by EUR 160.6 million to EUR 2,566.9 million in 2015. This rise
resulted from the net income for the financial year of EUR 265.2 million realized in 2015 minus the divi-
dend of EUR 139.1 million paid for financial year 2014. Furthermore, an amount on conversion into
euros of EUR 34.5 million was collected for the warrants issued by Brenntag AG as part of the USD bond
with warrant units; this resulted in an increase in additional paid-in capital by the same amount.
The subscribed capital is EUR 154.5 million (Dec. 31, 2014: EUR 154.5 million) and, as in the previous
year, is divided into 154,500,000 no-par-value registered shares.
The full annual financial statements of Brenntag AG with the unqualified auditors’ report of the audi-
tors PricewaterhouseCoopers Aktiengesellschaft Wirtschaftsprüfungsgesellschaft, Düsseldorf, are
published in the Federal Gazette and can be ordered as an offprint from Brenntag AG.
balance sheet of brenntag ag in accordance with the german commercial code (hgb) – condensed version
in EUR m Dec. 31, 2015 Dec. 31, 2014
Fixed assets 2,429.6 2,371.2
Current assets including prepaid expenses and excess of plan assets over post-employment benefit liabilities 809.3 747.5
Total assets 3,238.9 3,118.7
Equity 2,566.9 2,406.3
Provisions 43.2 39.5
Liabilities 624.4 670.4
Deferred tax liabilities 4.4 2.5
Total equity and liabilities 3,238.9 3,118.7
b.15 brenntag ag / balance sheet in accordance with the german commercial code (hgb) – condensed version
M A N A G E M E N T R E P O R T
Annual Financial Statements of Brenntag AG
A N N U A L R E P O R T 2 0 1 5 – B R E N N T A G A G9 8

APPROPRIATION OF DISTRIBUTABLE PROFIT OF BRENNTAG AG
The net income of Brenntag AG as at December 31, 2015 was EUR 265,202,364.57. After allowing
for the transfer of EUR 110,702,364.57 to other retained earnings, the distributable profit is
EUR 154,500,000.00.
At the General Shareholders’ Meeting on June 14, 2016, the Board of Management and the Supervisory
Board will propose that the distributable profit of Brenntag AG amounting to EUR 154,500,000.00
be used to pay a dividend of EUR 1.00 per no-par-value share entitled to a dividend; that is a total of
EUR 154,500,000.00.
REMUNERATION REPORT
BOARD OF MANAGEMENT REMUNERATION SYSTEM
The Supervisory Board is responsible for setting the remuneration of the Board of Management mem-
bers. The Presiding and Nomination Committee of the Supervisory Board discusses and reviews the
remuneration system for the Board of Management at regular intervals and prepares resolutions on
any changes thereto.
The remuneration structure introduced when Steven Holland’s service agreement was extended
effective March 1, 2015 was slightly modified again and this modified version was used as a basis for
the service agreements of Karsten Beckmann, Markus Klähn and Henri Nejade, who were newly
appointed to the Board of Management as from July 1, 2015. Georg Müller’s service agreement was
also changed accordingly with effect from April 1, 2015. Following William Fidler’s retirement and
departure from the Board of Management on June 30, 2015, Brenntag has now re-introduced one sin-
gle remuneration system for all members of the Board of Management. The following information on
Board of Management remuneration refers to this current remuneration system and the rules of the
share-based remuneration programme based on virtual shares (Virtual Share Plan) for Steven Holland
and Georg Müller, which is expiring but still applies to the tranches granted in previous years. All
remuneration components under the current remuneration system and the amounts still resulting
from the expiring Virtual Share Plan apply pro rata temporis to financial year 2015.
REMUNERATION COMPONENTS
The total remuneration of the Board of Management consists of three components: a fixed Annual
Base Salary, short-term, capped variable cash remuneration (Annual Bonus) and long-term, capped
variable remuneration (Long Term Incentive Bonus). In addition to the above-mentioned remunera-
tion components, the members of the Board of Management receive pension benefits, contractually
agreed benefits in kind and other benefits.
M A N A G E M E N T R E P O R T
Remuneration Report
A N N U A L R E P O R T 2 0 1 5 – B R E N N T A G A G 9 9
eur 1.00dividend proposal 2015
Further information at www.brenntag.com/general_shareholders _meeting
D
fu
rt
he
r
in
fo
rm
at
io
nf
in
an
ci
al
s
ta
te
me
nt
s
C
ma
na
ge
me
nt
r
ep
or
t
B

annual base salary and short-term variable remuneration 4)
The Annual Base Salary is payable in twelve equal monthly instalments.
The Preliminary Annual Bonus agreed as short-term variable remuneration is based on a contractually
specified amount (Annual Bonus) and depends on the achievement of certain targets based on specific
key performance indicators (KPIs). The KPIs specified are operating EBITDA (70 %), working capital
turnover (WCT; 15 %) and conversion ratio (EBITDA / operating gross profit; 15 %). In the cases of
Karsten Beckmann, Markus Klähn and Henri Nejade, 66.67 % of this bonus is based on targets for the
particular region they are responsible for and 33.33 % on targets for the Group. The sole deciding fac-
tor in the calculation of the Annual Bonus is the achievement of the KPI targets in the financial year
for which the bonus is paid. The targets and the figures actually achieved are translated using the
same exchange rates. If the target set for a KPI is not achieved, this part of the bonus is reduced by
4 % for each 1 % shortfall of the target set. If the target is exceeded, the relevant part of the bonus is
increased by 4 % for each 1 % exceedance of the target set. The KPI targets for the coming financial
year are mutually agreed by the Supervisory Board and Board of Management, or, if they are not sep-
arately set, are derived from the annual budget for the relevant financial year as approved by the
Supervisory Board. In addition, individual performance is taken into account in that, at the end of the
financial year, the Supervisory Board decides on a multiplier for the Preliminary Annual Bonus (amount
after allowance for target shortfalls or exceedances) of between 0.7 and 1.3. The resulting Final
Annual Bonus is capped at 200 % of the Annual Bonus. If the service agreement does not subsist for a
full twelve months in a financial year, the Final Annual Bonus is payable on a pro rata temporis basis.
benefits in kind and other benefits
In addition to the above-mentioned remuneration components, the Board of Management members
receive benefits in kind and other benefits such as a company car, also for private use, or a car allow-
ance and benefits for a health care and long-term care insurance, but not more than 50 % of the pre-
mium they pay into their health care and long-term care insurance. Markus Klähn receives an amount
of max. USD 20,000 p.a. for participation in the US Health Care Plan. Brenntag AG pays the cost of a
yearly medical check-up for Karsten Beckmann. Furthermore, Brenntag AG has taken out Group acci-
dent insurance. In addition, the company has taken out Directors & Officers Insurance (damage lia-
bility insurance) for the Board of Management members. In accordance with the provisions of the
German Act on Appropriateness of Management Board Compensation (VorstAG), a deductible of 10 %
of the damages claimed, but in each year limited to 150 % of the Annual Base Salary, is applied. For
his services as CEO and President of Brenntag Pte. Ltd., Singapore, Henri Nejade also receives from
this subsidiary fixed remuneration in the amount of 500,000 Singapore dollars per annum, depending
on the exchange rate but no more than EUR 335,000. Furthermore, Brenntag AG has undertaken to
reimburse Karsten Beckmann, Markus Klähn and Henri Nejade – where applicable – for advisory
costs incurred in connection with the conclusion of the service agreements. In the event of temporary
disability due to illness, accident, or any other cause not due to the fault of a Member of the Board,
said member is entitled to continued payment of the full Annual Base Salary for a period of nine
months. For the first three months of such incapacity, the full bonus claims regarding the Annual
Bonus and the Long Term Incentive Bonus are also retained.
4) For Steven Holland and Georg Müller, whose service agreements were adjusted with effect from March 1, 2015 and April 1, 2015 respectively, the provisions of the previous service agreements still apply pro rata temporis with regard to short-term variable remuneration in financial year 2015. The annual bonus was calculated as follows: 40 % on operating EBITDA, 20 % on operating gross profit, 20 % on free cash flow and 20 % on RONA of the Group. The annual bonus was determined on the basis of the achievement of the key performance indicator (KPI) targets set both for the specific financial year and the two preceding years (in each case on a consolidated basis). If the target for a KPI was not reached, this part of the bonus was reduced by 3 % for each 1 % shortfall. In case of outperformance, the maximum bonus for that KPI was nonetheless capped at the full achievement amount.
M A N A G E M E N T R E P O R T
Remuneration Report
A N N U A L R E P O R T 2 0 1 5 – B R E N N T A G A G1 0 0

long-term variable remuneration
The Board of Management members are also entitled to participate in a long-term remuneration pro-
gramme (Long Term Incentive Plan).
The long-term variable remuneration is partly based on the development of the share price. On the
basis of a contractually set Annual Target Amount, this remuneration component is subject to a vest-
ing period of in each case three years. 50 % of the Target Amount is contingent on the development
of the value of the company’s shares during these three years (External LTI Portion) and 50 % is con-
tingent on the long-term development of specific Group-wide KPIs (Internal LTI Portion).
50 % of the External LTI Portion is measured by the absolute development of the total shareholder
return for the company’s shares during the vesting period (Absolute External LTI Portion), while the
other 50 % of the External LTI Portion is measured by the relative development of the total share-
holder return for the company’s shares in comparison to the development of the MDAX during the
vesting period (Relative External LTI Portion). The development of the share price is measured by the
total shareholder return (defined as the weighted three months average share price calculated in
accordance with Section 5, para. 1 and para. 3 of the WpÜG-Angebotsverordnung plus all paid divi-
dends and adjusted for capital measures and share splits). The MDAX value, which is compared with
this share price, is the average of the MDAX (Total Return Index) during the three months ending on
the relevant date.
For every percentage point by which the average share price on the last trade day of the vesting
period exceeds or falls short of the average share price on the last trade day before the vesting
period, the Absolute External LTI Portion is increased or decreased by 2 %. For every percentage point
by which the MDAX is over- or underperformed in the vesting period, the Relative External LTI Portion
is increased or decreased by 3 %. The overall External LTI Portion at the end of the relevant vesting
period equals the sum of the Absolute External LTI Portion and Relative External LTI Portion. The
Absolute and Relative External LTI Portions may not be less than EUR 0, the External LTI Portion is
capped overall at 200 % of the contractually set Target Amount for the External LTI Portion.
The Internal LTI Portion is measured by the following KPI targets, which are agreed at the end of each
financial year for the following three-year vesting period in an LTI Bonus Plan: EBITDA (50 %), ROCE
(EBITDA / (book equity + net debt); 25 %) and earnings per share (25 %).
At the end of each financial year during a vesting period, the achievement of the KPI targets in the
particular financial year is calculated for a share of 1/3 of the Internal LTI Portion (Annual Internal LTI
Portion). For every percentage point by which the targets of a given KPI are over- or underperformed
in the particular financial year, the Annual Internal LTI Portion is increased or decreased by 3 %. This
may also lead to a negative Annual Internal LTI Portion. The Internal LTI Portion at the end of the rele-
vant vesting period equals the sum of the Annual Internal LTI Portions. The Internal LTI Portion is also
capped at 200 % of the contractually set Target Amount for the Internal LTI Portion.
The Long Term Incentive Bonus for each financial year equals the sum of the External and Internal LTI
Portions and is capped at 200 % of the Target Amount (LTI Cap).
M A N A G E M E N T R E P O R T
Remuneration Report
A N N U A L R E P O R T 2 0 1 5 – B R E N N T A G A G 1 0 1D
fu
rt
he
r
in
fo
rm
at
io
nf
in
an
ci
al
s
ta
te
me
nt
s
C
ma
na
ge
me
nt
r
ep
or
t
B

Any claims for a Long Term Incentive Bonus are forfeited in the event that the company terminates a
Board of Management member’s service agreement prior to the expiry of its term by virtue of a termi-
nation for cause or in the case of voluntary resignation by a Board of Management member without
the company having set an important cause for such resignation. In all other cases, the contractually
set Target Amount for the relevant ongoing financial year is paid out on a pro rata temporis basis, all
External and Internal LTI Portions granted for prior years but not yet paid out are paid out prema-
turely, whereby, instead of the parameters on the last trade day of the vesting period, the relevant
parameters at the end of the service period are used for measurement.
For Steven Holland and Georg Müller, whose service agreements were adjusted with effect from
March 1, 2015 and April 1, 2015 respectively, the provisions of the previous service agreements for a
long-term, share-based remuneration programme based on virtual shares (Virtual Share Plan) still
apply pro rata temporis with regard to the long-term variable remuneration in financial year 2015.
Under the terms of this Virtual Share Plan, the maximum amount of which was capped, the Board of
Management members were granted a base amount for each financial year. The base amount is
based on points, which depend on the outperformance of quantitative targets and the achievement
of qualitative targets in the relevant financial year and the two preceding years. Each year, 50 % of the
base amount was allocated to virtual shares of the company (allocated virtual shares). The other 50 %
of the base amount not converted into virtual shares (retained base amount) depends on the relative
development of the total shareholder return for the shares of the company in comparison to the
development of the MDAX over a period of four years. The maximum annual payout from this Virtual
Share Plan must not exceed 250 % of the original base amount (cap).
With regard to Steven Holland’s claims under the long-term, share-based remuneration programme
based on virtual shares (Virtual Share Plan) of his previous service agreement, it has been mutually
agreed that the portion relating to the virtual shares is to be continued in accordance with the
provisions of the previous service agreement while the retained base amounts were paid out in 2015
on expiry of the previous service agreement. The base amount for financial year 2015 to which
Steven Holland is entitled pro rata temporis under his previous service agreement will be paid out
in 2016.
The tranches allocated under this plan to Georg Müller up to the end of the previous service agree-
ment will be continued under the provisions of the previous service agreement and paid out at the
times specified therein. The base amount for financial year 2015 due pro rata temporis under the
previous service agreement will be paid out in 2016.
William Fidler’s remuneration for the period from January 1 to June 30, 2015 no longer contained any
short-term variable component. This was replaced by a higher fixed salary. The amounts to which he
is entitled under the long-term, share-based remuneration programme based on virtual shares (Vir-
tual Share Plan) and the pro rata base amount for financial year 2015 which he is due will be paid out
in 2016 in accordance with the provisions of the previous service agreement.
M A N A G E M E N T R E P O R T
Remuneration Report
A N N U A L R E P O R T 2 0 1 5 – B R E N N T A G A G1 0 2

The following table shows the number of virtual shares allocated to each member of the Board of
Management:
virtual shares 1)
StevenHolland
William Fidler
(until Jun. 30, 2015)GeorgMüller Total
2015 – – – –
2014 4,633 2,624 3,101 10,358
b.16 virtual shares
1) As a result of the change in the remuneration structure, no virtual shares were allocated for financial year 2015. The number of virtual shares for 2014 was adjusted in line with the final parameters approved by the Supervisory Board.
pension entitlements
Pension benefits have been agreed individually with each member of the Board of Management.
For the purpose of building up a pension, the Board of Management members receive an annual
amount of 13.5 % of their Annual Base Salary and short-term variable remuneration (at 100 % target
achievement, i.e. irrespective of the actual targets achieved).
In the cases of Steven Holland, Karsten Beckmann and Georg Müller, the relevant amount is trans-
ferred annually into the Deferred Compensation Contingency Plan of Brenntag AG. This plan also con-
tains an arrangement for a widows and orphans pension which would amount to 60 % and 20 %
respectively of the full pension entitlements. The reinsurance policies taken out with the Board of
Management members as beneficiaries are pledged to them.
Markus Klähn uses this amount in the USA for payments up to the maximum amounts possible into
the local defined contribution pension plans “Profit Sharing Plan” and “Pension Plan”. The remainder
is paid out to Markus Klähn for building up further private pension plans. Henri Nejade has the option
either to use this amount in whole or in part for contributions to his French social insurance or to also
pay it annually into the Deferred Compensation Contingency Plan of Brenntag AG.
William Fidler (Board of Management member until June 30, 2015) participates in the USA in the local
defined contribution pension plans which were set up for staff and management on an equal basis. In
2015, as in the previous year, payments were made into two defined contribution plans: the “Profit
Sharing Plan” and the “Pension Plan”.
M A N A G E M E N T R E P O R T
Remuneration Report
A N N U A L R E P O R T 2 0 1 5 – B R E N N T A G A G 1 0 3D
fu
rt
he
r
in
fo
rm
at
io
nf
in
an
ci
al
s
ta
te
me
nt
s
C
ma
na
ge
me
nt
r
ep
or
t
B

The total remuneration of the individual members of the Board of Management is as follows:
total remuneration of the board of management in accordance with the german commercial code (hgb)
in EUR kSteven
HollandKarsten
BeckmannWilliam
FidlerMarkus
KlähnGeorg Müller
HenriNejade Total
Term of service agreement (until Feb. 29, 2020) (until Jun. 30, 2018) (until Jun. 30, 2015) (until Jun. 30, 2018) (until Mar. 31, 2017) (until Jun. 30, 2018)
Annual base salary 2015 870 225 560 225 480 225 2,585
2014 720 – 423 – 480 – 1,623
Company pension (defined contribution plan) 2015 – – 23 66 – – 89
2014 – – 24 – – – 24
Benefits in kind and other benefits 2015 54 12 23 13 25 187 314
2014 57 – 29 – 19 – 105
Total non-performance-based remuneration 2015 924 237 606 304 505 412 2,988
2014 777 – 476 – 499 – 1,752
Short-term variable remuneration 1) 2015 654 186 – 133 346 171 1,490
2014 552 – 325 – 372 – 1,249
Long-term variable remuneration 2) 3) 2015 1,020 267 250 265 610 267 2,679
2014 376 – 213 – 252 – 841
Total performance-based remuneration 2015 1,674 453 250 398 956 438 4,169
2014 928 – 538 – 624 – 2,090
Total remuneration (in accordance with the German Commercial Code (HGB)) 2015 2,598 690 856 702 1,461 850 7,157
2014 1,705 – 1,014 – 1,123 – 3,842
b.17 total remuneration of the board of management in accordance with the german commercial code (hgb)
1) The above figures are based on preliminary assumptions used for measurement of the respective provisions. These figures will be adjusted in the subsequent financial year if the figures finally agreed by the Supervisory Board differ.
2) Fair value of the share-based remuneration granted at the date of grant.3) Where related to the Virtual Share Plan, the figures given for financial year 2015 are based on provisional parameters which were taken as a basis for deter-
mining a provision and which have not yet been approved by the Supervisory Board. The figures for financial year 2014 were adjusted in line with the final parameters approved by the Supervisory Board. The amounts relating to the Long Term Incentive Bonus are based on the assumptions used for measure-ment of the respective provisions.
pension commitments (defined benefit plans) in accordance with the german commercial code (hgb)
in EUR kSteven
HollandKarsten
Beckmann
William Fidler
(until Jun. 30, 2015)Markus
KlähnGeorg Müller
HenriNejade Total
Cost of pension commitments 2015 506 106 – – 467 80 1,159
2014 341 – – – 309 – 650
Present value of pension commitments 2015 1,768 1,141 1) – – 1,749 1) 80 4,738
2014 1,261 – – – 1,281 1) – 2,542
b.18 pension commitments (defined benefit plans) in accordance with the german commercial code (hgb)
1) Of which EUR 312k self-financed by Georg Müller under a deferred compensation plan (2014: EUR 312k) and EUR 59k self-financed by Karsten Beckmann under a deferred compensation plan (2014: EUR – ).
M A N A G E M E N T R E P O R T
Remuneration Report
A N N U A L R E P O R T 2 0 1 5 – B R E N N T A G A G1 0 4

total remuneration of the board of management in accordance with the german commercial code (hgb)
in EUR kSteven
HollandKarsten
BeckmannWilliam
FidlerMarkus
KlähnGeorg Müller
HenriNejade Total
Term of service agreement (until Feb. 29, 2020) (until Jun. 30, 2018) (until Jun. 30, 2015) (until Jun. 30, 2018) (until Mar. 31, 2017) (until Jun. 30, 2018)
Annual base salary 2015 870 225 560 225 480 225 2,585
2014 720 – 423 – 480 – 1,623
Company pension (defined contribution plan) 2015 – – 23 66 – – 89
2014 – – 24 – – – 24
Benefits in kind and other benefits 2015 54 12 23 13 25 187 314
2014 57 – 29 – 19 – 105
Total non-performance-based remuneration 2015 924 237 606 304 505 412 2,988
2014 777 – 476 – 499 – 1,752
Short-term variable remuneration 1) 2015 654 186 – 133 346 171 1,490
2014 552 – 325 – 372 – 1,249
Long-term variable remuneration 2) 3) 2015 1,020 267 250 265 610 267 2,679
2014 376 – 213 – 252 – 841
Total performance-based remuneration 2015 1,674 453 250 398 956 438 4,169
2014 928 – 538 – 624 – 2,090
Total remuneration (in accordance with the German Commercial Code (HGB)) 2015 2,598 690 856 702 1,461 850 7,157
2014 1,705 – 1,014 – 1,123 – 3,842
b.17 total remuneration of the board of management in accordance with the german commercial code (hgb)
pension commitments (defined benefit plans) in accordance with the german commercial code (hgb)
in EUR kSteven
HollandKarsten
Beckmann
William Fidler
(until Jun. 30, 2015)Markus
KlähnGeorg Müller
HenriNejade Total
Cost of pension commitments 2015 506 106 – – 467 80 1,159
2014 341 – – – 309 – 650
Present value of pension commitments 2015 1,768 1,141 1) – – 1,749 1) 80 4,738
2014 1,261 – – – 1,281 1) – 2,542
b.18 pension commitments (defined benefit plans) in accordance with the german commercial code (hgb)
M A N A G E M E N T R E P O R T
Remuneration Report
A N N U A L R E P O R T 2 0 1 5 – B R E N N T A G A G 1 0 5D
fu
rt
he
r
in
fo
rm
at
io
nf
in
an
ci
al
s
ta
te
me
nt
s
C
ma
na
ge
me
nt
r
ep
or
t
B

The remuneration of the Board of Management according to IFRSs presented in the following does
not include the fair value of the newly granted share-based remuneration but rather the share-based
remuneration entitlements earned in the current year plus the change in the value of share-based
remuneration entitlements from previous years that have not yet been paid out. Furthermore, the
current service cost for pension entitlements according to IAS 19 has been added.
board of management remuneration in accordance with ifrss
in EUR kSteven
HollandKarsten
Beckmann
William Fidler
(until Jun. 30, 2015)Markus
KlähnGeorg Müller
HenriNejade Total
Total non-performance-based remuneration 2015 924 237 606 304 505 412 2,988
2014 777 – 476 – 499 – 1,752
Short-term variable remuneration 1) 2015 654 186 – 133 346 171 1,490
2014 552 – 325 – 372 – 1,249
Long-term variable remuneration (share-based remuneration earned in current year) 2015 1,203 89 1,208 88 560 89 3,237
2014 701 – 512 – 153 – 1,366
Current service cost for pension entitlements earned in the current year (defined benefit plans) 2015 221 58 – – 136 58 473
2014 179 – – – 119 – 298
Board of Management remuneration (in accordance with IFRSs) 2015 3,002 570 1,814 525 1,547 730 8,188
2014 2,209 – 1,313 – 1,143 – 4,665
b.19 board of management remuneration in accordance with ifrss
1) The above figures are based on preliminary assumptions used for measurement of the respective provisions. These figures will be adjusted in the subsequent financial year if the figures finally agreed by the Supervisory Board differ.
M A N A G E M E N T R E P O R T
Remuneration Report
A N N U A L R E P O R T 2 0 1 5 – B R E N N T A G A G1 0 6
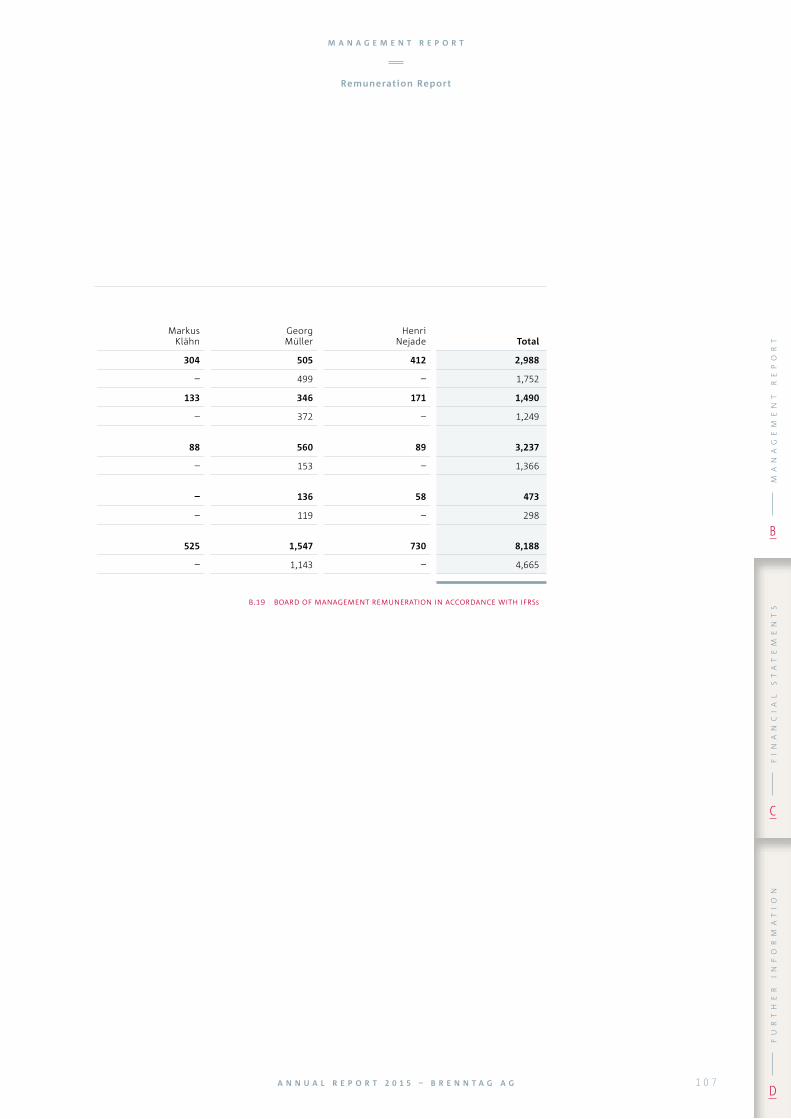
board of management remuneration in accordance with ifrss
in EUR kSteven
HollandKarsten
Beckmann
William Fidler
(until Jun. 30, 2015)Markus
KlähnGeorg Müller
HenriNejade Total
Total non-performance-based remuneration 2015 924 237 606 304 505 412 2,988
2014 777 – 476 – 499 – 1,752
Short-term variable remuneration 1) 2015 654 186 – 133 346 171 1,490
2014 552 – 325 – 372 – 1,249
Long-term variable remuneration (share-based remuneration earned in current year) 2015 1,203 89 1,208 88 560 89 3,237
2014 701 – 512 – 153 – 1,366
Current service cost for pension entitlements earned in the current year (defined benefit plans) 2015 221 58 – – 136 58 473
2014 179 – – – 119 – 298
Board of Management remuneration (in accordance with IFRSs) 2015 3,002 570 1,814 525 1,547 730 8,188
2014 2,209 – 1,313 – 1,143 – 4,665
b.19 board of management remuneration in accordance with ifrss
M A N A G E M E N T R E P O R T
Remuneration Report
A N N U A L R E P O R T 2 0 1 5 – B R E N N T A G A G 1 0 7D
fu
rt
he
r
in
fo
rm
at
io
nf
in
an
ci
al
s
ta
te
me
nt
s
C
ma
na
ge
me
nt
r
ep
or
t
B
COMPENSATION CAP IN THE EVENT OF PREMATURE TERMINATION OF EMPLOYMENT
The employment of Board of Management members may only be terminated for good cause or by
mutual agreement. In accordance with the German Corporate Governance Code, the service agree-
ments of all Board of Management members have a compensation cap. Under the cap, payments to a
Board of Management member for premature termination of Board of Management duties without
good cause may not exceed the value of two years’ total remuneration or the total remuneration for
the remainder of the member’s service agreement, whichever is less.
CHANGE-OF-CONTROL ARRANGEMENTS
Following the termination of William Fidler’s service agreement on June 30, 2015 and the change
of Steven Holland’s service agreement in January 2015, there are no separate change-of-control
arrangements.
POST-CONTRACTUAL NON-COMPETITION CLAUSE
There are no separate post-contractual non-competition clauses.
LOANS
In the reporting year, no loans or advance payments were granted to members of the Board of
Management, nor were any guarantees or other commitments entered into in their favour.
M A N A G E M E N T R E P O R T
Remuneration Report
A N N U A L R E P O R T 2 0 1 5 – B R E N N T A G A G1 0 8

INFORMATION ON REMUNERATION IN ACCORDANCE WITH NUMBER 4.2.5, PARA. 3 OF THE GERMAN CORPORATE GOVERNANCE CODE (GCGC)
The following two tables provide the financial information required by number 4.2.5, para. 3 of
the German Corporate Governance Code (GCGC) regarding the benefits granted and the amounts
allocated. The fixed remuneration and fringe benefits indicated here correspond to the total non-
performance-related remuneration of the Board of Management. The one-year variable remuneration
corresponds to the aforementioned short-term variable remuneration and the multi-year variable
remuneration corresponds to the aforementioned long-term variable remuneration.
Amounts are recognized as having been granted – within the meaning of the German Corporate
Governance Code – in the financial year in which the underlying activity for this remuneration was per-
formed. This is subject to the proviso that a commitment to pay remuneration must have been given at
the time the remuneration report was prepared. In addition, it must be possible to establish a reliable
estimate of the value of this remuneration. The year in which fixed remuneration and fringe benefits
are granted is generally also the year in which they are recognized as an expense. The same applies
to the one-year variable remuneration. Multi-year variable remuneration under the Virtual Share Plan
is recognized as having been granted at the fair value of the newly granted share-based remuneration
in the year for which the base amount is allocated. The multi-year variable remuneration resulting
from the Long Term Incentive Plan is recognized as having been granted in the amount of the portion
(1/3) due for the reporting year of the Target Amount allocated for three years in each case.
Fixed remuneration and fringe benefits are recognized as having been allocated – within the meaning
of the German Corporate Governance Code – in the financial year in which the underlying activity has
been performed, if the value of the final payment has already been determined. For fixed remunera-
tion and fringe benefits, the date on which this allocation is recognized is generally the date on which
it is recognized as an expense. The same applies to the short-term variable remuneration that was
still awarded pro rata temporis to Steven Holland and Georg Müller under the provisions of their
old service agreements; their service agreements were changed with effect from March 1, 2015 and
April 1, 2015 respectively. Allocation of the one-year variable remuneration under the new remuneration
structure and the multi-year variable remuneration is recognized in the financial year of the actual
payout, which is, as a rule, the financial year following the respective vesting period.
M A N A G E M E N T R E P O R T
Remuneration Report
A N N U A L R E P O R T 2 0 1 5 – B R E N N T A G A G 1 0 9D
fu
rt
he
r
in
fo
rm
at
io
nf
in
an
ci
al
s
ta
te
me
nt
s
C
ma
na
ge
me
nt
r
ep
or
t
B

1) Only relates to the one-year variable remuneration for the Board of Management under the old remuneration structure, i.e. in 2015 only to the pro rata tem-poris amount for Steven Holland and Georg Müller, whose service agreements were changed with effect from March 1, 2015 and April 1, 2015 respectively. The amount of one-year variable remuneration under the new remuneration structure had yet to be finalized at the time this remuneration report was prepared.
benefits grantedSteven Holland
Chief Executive Officer
Karsten Beckmann
Member of the Board
of Management
William Fidler
Member of the Board of Manage-
ment (until Jun. 30, 2015)
Markus Klähn
Member of the Board
of Management
Georg Müller
Chief Financial Officer
Henri Nejade
Member of the Board
of Management
in EUR k 2014 20152015 (min)
2015 (max) 2014 2015
2015 (min)
2015 (max) 2014 2015
2015 (min)
2015 (max) 2014 2015
2015 (min)
2015 (max) 2014 2015
2015 (min)
2015 (max) 2014 2015
2015 (min)
2015 (max)
Fixed remuneration 720 870 870 870 – 225 225 225 423 560 560 560 – 225 225 225 480 480 480 480 – 225 225 225
Fringe benefits 57 54 54 54 – 12 12 12 53 46 46 46 – 79 79 79 19 25 25 25 – 187 187 187
Total 777 924 924 924 – 237 237 237 476 606 606 606 – 304 304 304 499 505 505 505 – 412 412 412
One-year variable remuneration 544 654 61 1,428 – 186 – 400 320 – – – – 133 – 406 363 346 61 694 – 171 – 400
Multi-year variable remuneration
LTI Bonus 2015 – 2018 – 257 – 515 – 77 – 154 – – – – – 77 – 153 – 186 – 373 – 77 – 154
Virtual Share Plan 2015 – 2019 – 129 42 199 – – – – – 250 82 384 – – – – – 128 42 199 – – – –
Virtual Share Plan 2014 – 2018 391 – – – – – – – 216 – – – – – – – 261 – – – – – – –
Total 935 1,040 103 2,142 – 263 – 554 536 250 82 384 – 210 – 559 624 660 103 1,266 – 248 – 554
Service cost 179 221 221 221 – 58 58 58 – – – – – – – – 119 136 136 136 – 58 58 58
Total remuneration 1,891 2,185 1,248 3,287 – 558 295 849 1,012 856 688 990 – 514 304 863 1,242 1,301 744 1,907 – 718 470 1,024
b.20 board of management benefits granted
allocationSteven Holland
Chief Executive Officer
Karsten Beckmann
Member of the Board
of Management
William Fidler
Member of the Board of Manage-
ment (until Jun. 30, 2015)
Markus Klähn
Member of the Board
of Management
Georg Müller
Chief Financial Officer
Henri Nejade
Member of the Board
of Management
in EUR k 2015 2014 2015 2014 2015 2014 2015 2014 2015 2014 2015 2014
Fixed remuneration 870 720 225 – 560 423 225 – 480 480 225 –
Fringe benefits 54 57 12 – 46 53 79 – 25 19 187 –
Total 924 777 237 – 606 476 304 – 505 499 412 –
One-year variable remuneration 1) 92 544 – – – 320 – – 92 363 – –
Multi-year variable remuneration
Virtual Share Plan 2010 – 2014 1,495 – – – 1,314 – – – – – – –
Virtual Share Plan 2011 – 2015 371 – – – – – – – – – – –
Virtual Share Plan 2012 – 2016 300 – – – – – – – – – – –
Virtual Share Plan 2013 – 2017 200 – – – – – – – – – – –
Virtual Share Plan 2014 – 2018 189 – – – – – – – – – – –
Other – – – – – – – – – – – –
Total 2,647 544 – – 1,314 320 – – 92 363 – –
Service cost 221 179 58 – – – – – 136 119 58 –
Total remuneration 3,792 1,500 295 – 1,920 796 304 – 733 981 470 –
b.21 board of management allocation
M A N A G E M E N T R E P O R T
Remuneration Report
A N N U A L R E P O R T 2 0 1 5 – B R E N N T A G A G1 1 0

benefits grantedSteven Holland
Chief Executive Officer
Karsten Beckmann
Member of the Board
of Management
William Fidler
Member of the Board of Manage-
ment (until Jun. 30, 2015)
Markus Klähn
Member of the Board
of Management
Georg Müller
Chief Financial Officer
Henri Nejade
Member of the Board
of Management
in EUR k 2014 20152015 (min)
2015 (max) 2014 2015
2015 (min)
2015 (max) 2014 2015
2015 (min)
2015 (max) 2014 2015
2015 (min)
2015 (max) 2014 2015
2015 (min)
2015 (max) 2014 2015
2015 (min)
2015 (max)
Fixed remuneration 720 870 870 870 – 225 225 225 423 560 560 560 – 225 225 225 480 480 480 480 – 225 225 225
Fringe benefits 57 54 54 54 – 12 12 12 53 46 46 46 – 79 79 79 19 25 25 25 – 187 187 187
Total 777 924 924 924 – 237 237 237 476 606 606 606 – 304 304 304 499 505 505 505 – 412 412 412
One-year variable remuneration 544 654 61 1,428 – 186 – 400 320 – – – – 133 – 406 363 346 61 694 – 171 – 400
Multi-year variable remuneration
LTI Bonus 2015 – 2018 – 257 – 515 – 77 – 154 – – – – – 77 – 153 – 186 – 373 – 77 – 154
Virtual Share Plan 2015 – 2019 – 129 42 199 – – – – – 250 82 384 – – – – – 128 42 199 – – – –
Virtual Share Plan 2014 – 2018 391 – – – – – – – 216 – – – – – – – 261 – – – – – – –
Total 935 1,040 103 2,142 – 263 – 554 536 250 82 384 – 210 – 559 624 660 103 1,266 – 248 – 554
Service cost 179 221 221 221 – 58 58 58 – – – – – – – – 119 136 136 136 – 58 58 58
Total remuneration 1,891 2,185 1,248 3,287 – 558 295 849 1,012 856 688 990 – 514 304 863 1,242 1,301 744 1,907 – 718 470 1,024
b.20 board of management benefits granted
allocationSteven Holland
Chief Executive Officer
Karsten Beckmann
Member of the Board
of Management
William Fidler
Member of the Board of Manage-
ment (until Jun. 30, 2015)
Markus Klähn
Member of the Board
of Management
Georg Müller
Chief Financial Officer
Henri Nejade
Member of the Board
of Management
in EUR k 2015 2014 2015 2014 2015 2014 2015 2014 2015 2014 2015 2014
Fixed remuneration 870 720 225 – 560 423 225 – 480 480 225 –
Fringe benefits 54 57 12 – 46 53 79 – 25 19 187 –
Total 924 777 237 – 606 476 304 – 505 499 412 –
One-year variable remuneration 1) 92 544 – – – 320 – – 92 363 – –
Multi-year variable remuneration
Virtual Share Plan 2010 – 2014 1,495 – – – 1,314 – – – – – – –
Virtual Share Plan 2011 – 2015 371 – – – – – – – – – – –
Virtual Share Plan 2012 – 2016 300 – – – – – – – – – – –
Virtual Share Plan 2013 – 2017 200 – – – – – – – – – – –
Virtual Share Plan 2014 – 2018 189 – – – – – – – – – – –
Other – – – – – – – – – – – –
Total 2,647 544 – – 1,314 320 – – 92 363 – –
Service cost 221 179 58 – – – – – 136 119 58 –
Total remuneration 3,792 1,500 295 – 1,920 796 304 – 733 981 470 –
b.21 board of management allocation
M A N A G E M E N T R E P O R T
Remuneration Report
A N N U A L R E P O R T 2 0 1 5 – B R E N N T A G A G 1 1 1D
fu
rt
he
r
in
fo
rm
at
io
nf
in
an
ci
al
s
ta
te
me
nt
s
C
ma
na
ge
me
nt
r
ep
or
t
B

INFORMATION ON PAYMENTS RECEIVED BY FORMER MEMBERS OF THE BOARD OF MANAGEMENT AND THEIR SURVIVING DEPENDANTS
Under the German Commercial Code (HGB), the funding surplus for pension obligations to former
members of the Board of Management and their surviving dependants amounted to EUR 140k as at
December 31, 2015 (Dec. 31, 2014: EUR 785k); in accordance with IFRSs, this provision amounted to
EUR 1,862k (Dec. 31, 2014: EUR 2,971k). In 2015, the cost of pension commitments (defined benefit
plans) under the German Commercial Code (HGB) amounted to EUR 827k (2014: EUR 634k). No
expenses as defined in IFRSs were incurred for pension entitlements vesting in the current year.
REMUNERATION OF THE SUPERVISORY BOARD
The remuneration of the members of the Supervisory Board is laid down in the rules of procedure of
the Supervisory Board of Brenntag AG; by resolution of the General Shareholders’ Meeting dated
June 9, 2015, new rules on Supervisory Board remuneration were introduced, granting the members a
purely fixed remuneration with effect from the beginning of financial year 2015. The chair and mem-
bership of Supervisory Board committees are remunerated separately in line with the German Corpo-
rate Governance Code.
The members of the Supervisory Board each receive annual fixed remuneration in the amount of
EUR 120k in addition to reimbursement of their expenses. The chairman of the Supervisory Board
receives a base remuneration of EUR 210k and the deputy chairman EUR 150k.
The chairman of the Audit Committee receives an additional EUR 85k per year and every other mem-
ber of the Audit Committee an additional EUR 25k per year. The chairman of the Presiding and
Nomination Committee receives an additional EUR 15k and every other member of the Presiding
and Nomination Committee an additional EUR 10k per year.
M A N A G E M E N T R E P O R T
Remuneration Report
A N N U A L R E P O R T 2 0 1 5 – B R E N N T A G A G1 1 2
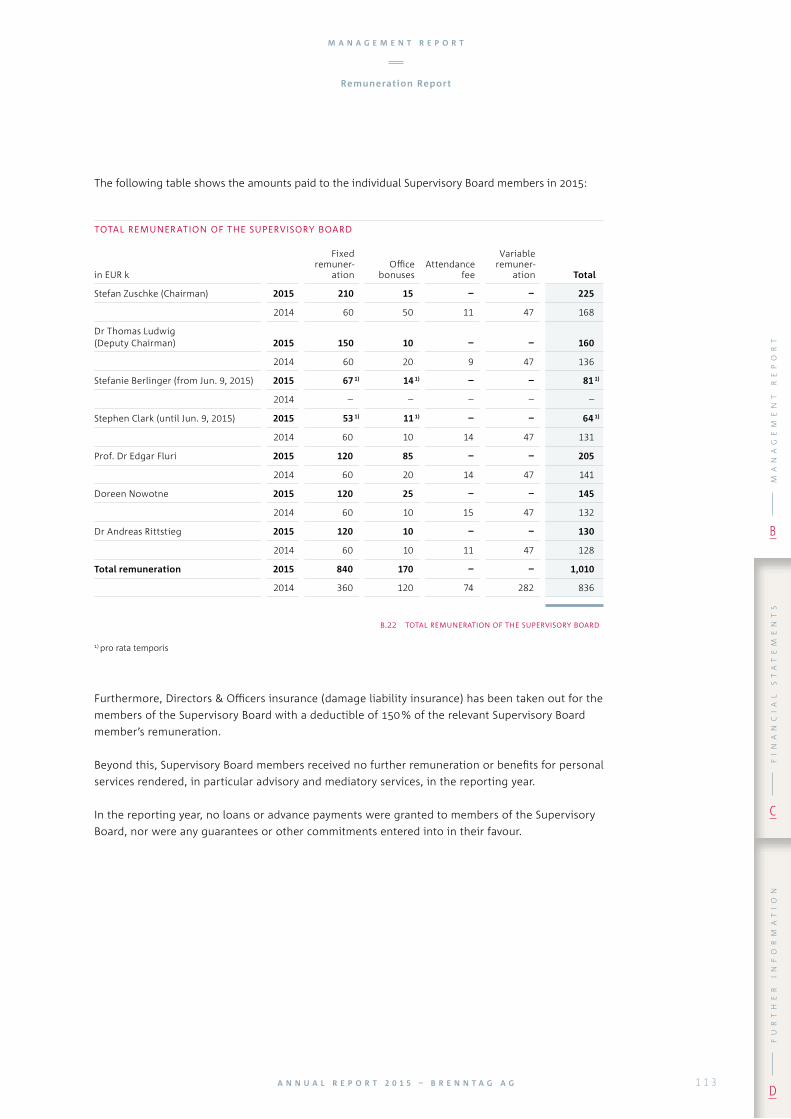
The following table shows the amounts paid to the individual Supervisory Board members in 2015:
total remuneration of the supervisory board
in EUR k
Fixed remuner-
ationOffice
bonusesAttendance
fee
Variable remuner-
ation Total
Stefan Zuschke (Chairman) 2015 210 15 – – 225
2014 60 50 11 47 168
Dr Thomas Ludwig (Deputy Chairman) 2015 150 10 – – 160
2014 60 20 9 47 136
Stefanie Berlinger (from Jun. 9, 2015) 2015 67 1) 14 1) – – 81 1)
2014 – – – – –
Stephen Clark (until Jun. 9, 2015) 2015 53 1) 11 1) – – 64 1)
2014 60 10 14 47 131
Prof. Dr Edgar Fluri 2015 120 85 – – 205
2014 60 20 14 47 141
Doreen Nowotne 2015 120 25 – – 145
2014 60 10 15 47 132
Dr Andreas Rittstieg 2015 120 10 – – 130
2014 60 10 11 47 128
Total remuneration 2015 840 170 – – 1,010
2014 360 120 74 282 836
b.22 total remuneration of the supervisory board
1) pro rata temporis
Furthermore, Directors & Officers insurance (damage liability insurance) has been taken out for the
members of the Supervisory Board with a deductible of 150 % of the relevant Supervisory Board
member’s remuneration.
Beyond this, Supervisory Board members received no further remuneration or benefits for personal
services rendered, in particular advisory and mediatory services, in the reporting year.
In the reporting year, no loans or advance payments were granted to members of the Supervisory
Board, nor were any guarantees or other commitments entered into in their favour.
M A N A G E M E N T R E P O R T
Remuneration Report
A N N U A L R E P O R T 2 0 1 5 – B R E N N T A G A G 1 1 3D
fu
rt
he
r
in
fo
rm
at
io
nf
in
an
ci
al
s
ta
te
me
nt
s
C
ma
na
ge
me
nt
r
ep
or
t
B
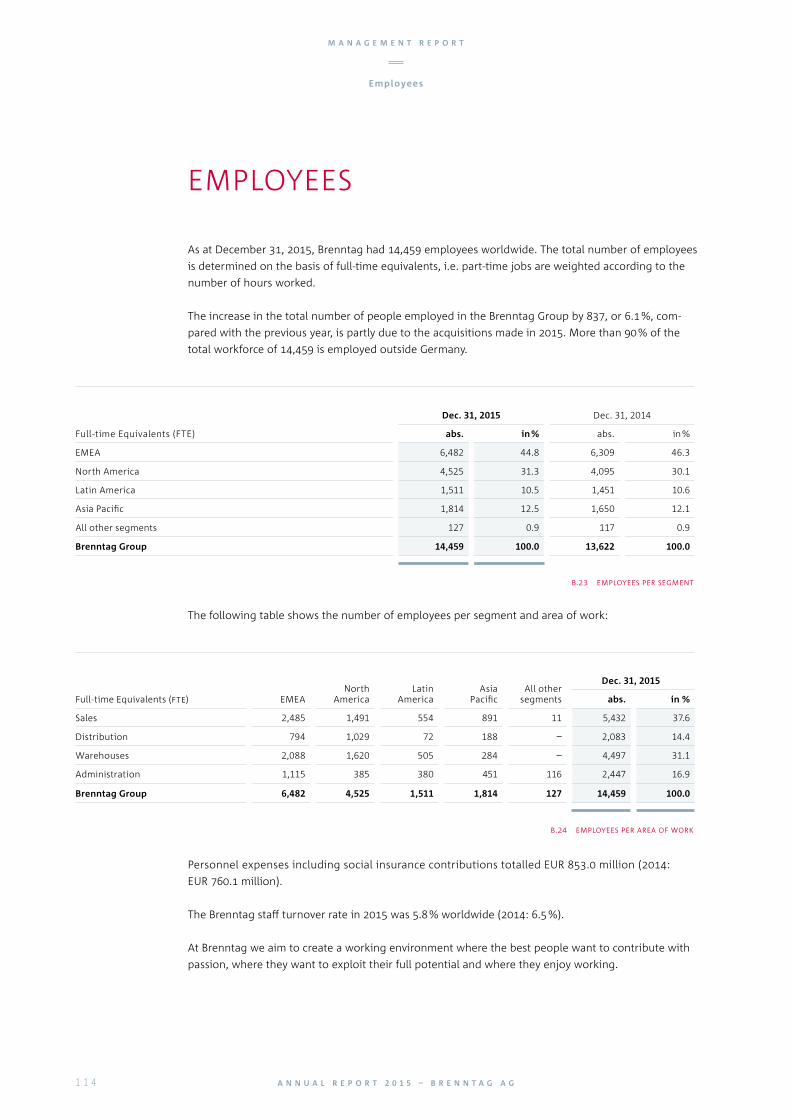
As at December 31, 2015, Brenntag had 14,459 employees worldwide. The total number of employees
is determined on the basis of full-time equivalents, i.e. part-time jobs are weighted according to the
number of hours worked.
The increase in the total number of people employed in the Brenntag Group by 837, or 6.1 %, com-
pared with the previous year, is partly due to the acquisitions made in 2015. More than 90 % of the
total workforce of 14,459 is employed outside Germany.
EMPLOYEES
The following table shows the number of employees per segment and area of work:
Personnel expenses including social insurance contributions totalled EUR 853.0 million (2014:
EUR 760.1 million).
The Brenntag staff turnover rate in 2015 was 5.8 % worldwide (2014: 6.5 %).
At Brenntag we aim to create a working environment where the best people want to contribute with
passion, where they want to exploit their full potential and where they enjoy working.
Dec. 31, 2015 Dec. 31, 2014
Full-time Equivalents (FTE) abs. in % abs. in %
EMEA 6,482 44.8 6,309 46.3
North America 4,525 31.3 4,095 30.1
Latin America 1,511 10.5 1,451 10.6
Asia Pacific 1,814 12.5 1,650 12.1
All other segments 127 0.9 117 0.9
Brenntag Group 14,459 100.0 13,622 100.0
b.23 employees per segment
Full-time Equivalents (fte) EMEANorth
AmericaLatin
AmericaAsia
PacificAll other
segments
Dec. 31, 2015
abs. in %
Sales 2,485 1,491 554 891 11 5,432 37.6
Distribution 794 1,029 72 188 – 2,083 14.4
Warehouses 2,088 1,620 505 284 – 4,497 31.1
Administration 1,115 385 380 451 116 2,447 16.9
Brenntag Group 6,482 4,525 1,511 1,814 127 14,459 100.0
b.24 employees per area of work
M A N A G E M E N T R E P O R T
Employees
A N N U A L R E P O R T 2 0 1 5 – B R E N N T A G A G1 1 4

DEVELOPING OUR EMPLOYEES
Developing our employees is important for us as we want them to perform and grow and therefore
we invest in our people. This is done in a number of ways. We train on the job, give them challenging
assignments, coach and have a large number of training courses and other measures in place across
the globe. When designing and implementing our development measures, we always take into
account our employees’ current position.
Placements are available for students, giving them the opportunity to work on specific projects and
tasks and gain valuable experience. For graduates in many countries we offer trainee programmes
where they can combine their theoretical knowledge and practical experience while at the same time
getting an insight into many different aspects of our company and how to interact. Our early career
advancement measures are often based on specialization and focus. Therefore, we make sure our
people are state-of-the-art in their respective functional areas. Here we have many training pro-
grammes in place at different levels in our organization. Furthermore, we also address personal skills
so our people can develop themselves in these areas. Our employees are critical for our success.
Therefore, we want our employees who are responsible for leading others to perform this leadership
role professionally at all levels within our organization.
To make sure our leaders are ready for their leadership tasks, we train them in different aspects of
leadership at local, regional and global level. A customized Executive Development Program has been
put in place that has been designed in cooperation with a renowned business school specifically for
the unique needs of Brenntag’s executives. With experienced professors and a sophisticated curricu-
lum, participants gain valuable know-how that can be applied directly to the business.
The program prepares the participants to handle Brenntag’s current and future challenges success-
fully. The participants enhance their general management skills and comprehensive leadership abili-
ties. Furthermore, the program provides a unique opportunity for people from different regions to
exchange their ideas and thoughts as well as to build a network across the Brenntag world.
DIVERSITY AND INCLUSION
The company’s headquarters is in Mülheim an der Ruhr, Germany. Brenntag has more than 530 loca-
tions in 74 countries with a global workforce of more than 14,000 people. This means we have col-
leagues from many different nationalities with many diverse backgrounds. We have people with many
years of experience and we have people who have just started their careers.
Integrity and responsibility are two of our core values and we are fully committed to our ethical prin-
ciples and values. As a consequence, we treat all our employees fairly and with respect.
We work in teams across the globe in order to create value for all our partners and our people. Diver-
sity and inclusion determine every single aspect of our actions.
M A N A G E M E N T R E P O R T
Employees
A N N U A L R E P O R T 2 0 1 5 – B R E N N T A G A G 1 1 5D
fu
rt
he
r
in
fo
rm
at
io
nf
in
an
ci
al
s
ta
te
me
nt
s
C
ma
na
ge
me
nt
r
ep
or
t
B

Health, safety, environmental protection and the long-term conservation of natural resources are of
key importance to Brenntag. This principle is the basis of our global HSE strategy (HSE: health, safety
and environment).
BRENNTAG’S HSE STRATEGY
SAFETY POLICY
The health of our employees and the safety of our sites are an absolute priority for Brenntag. We
work on continually improving work processes and plant safety.
PRODUCT STEWARDSHIP POLICY
Brenntag takes appropriate measures to ensure the proper handling of our products while they are
under the Group’s stewardship. This includes procurement, packaging, classification and labelling,
handling, storage and safe transportation, the preparation of product dossiers and safety instructions,
and disposal, where necessary.
HEALTH, SAFETY AND ENVIRONMENTAL PROTECTION, QUALITY MANAGEMENT
REMUNERATION AND BENEFITS
We offer a competitive remuneration and benefits package. Remuneration may differ depending on
local market conditions, regulations and legislation.
The value-based remuneration system for the management level provides for variable and fixed com-
ponents. The ratio of fixed to variable pay components depends on the influence the particular man-
ager can have on the success of the company. As an incentive system, the remuneration and target
agreement system is based on the Management by Objectives model, the variable remuneration com-
ponents being closely linked to the company’s results and personal performance.
Furthermore, there are both defined benefit and defined contribution pension plans for employees of
the Brenntag Group. The pension obligations differ due to the legal, tax and economic conditions of
the respective country and depend on the number of years of service and the pay grade of the respec-
tive employee.
M A N A G E M E N T R E P O R T
Health, Safety and Environmental Protection, Quality Management
A N N U A L R E P O R T 2 0 1 5 – B R E N N T A G A G1 1 6
Health, safety and environment are an absolute priority for Brenntag

ENVIRONMENTAL POLICY
Brenntag works continually on minimizing environmental impacts on the soil, water and air.
COMPLIANCE POLICY
Brenntag is committed to complying with all health, safety and environmental legal requirements,
including import and export regulations as well as selling and use restrictions for chemicals in all our
operations and sales organizations.
QUALITY POLICY
Brenntag ensures the quality of its products and services by implementing ISO 9001 quality manage-
ment systems at regional level.
Brenntag takes part in the Responsible Care / Responsible Distribution (RC/RD) Programme of the orga-
nization of the International Council of Chemical Trade Associations (ICCTA). Brenntag is therefore
committed to the implementation of the eight guidelines laid down in the global programme cover-
ing the following areas:
Legal requirements
Management of risk
Policies and documentation
Provision of information
Training
Emergency response
Ongoing improvements
Community interaction
The implementation of the contents of the RC / RD Programme in the Group is reviewed by indepen-
dent experts applying the relevant regional assessment systems; in Europe: European Single Assess-
ment Document (ESAD); in North America: Responsible Distribution Verification (RDV); in Latin Amer-
ica: Calidad, Seguridad, Salud y Medio Ambiente (CASA). By this means, environmental performance
and safe handling of chemicals are reviewed and documented by independent experts. The Asia
Pacific region is step by step signing up to this worldwide Responsible Care Programme.
Uniform procedures for the safe handling of chemicals are established by regional HSE coordinators
and HSE teams. These procedures are recorded and documented in regionally applicable HSE manuals
down to the level of the individual warehouse sites. Compliance with these procedures is reviewed in
internal and external audits.
Training courses for our employees are of central importance for safety at work. This begins with an
introduction course for new recruits and continues with instructions in special work procedures and
the use of equipment. Like all other training courses, the training prescribed by law is documented at
the individual warehouse sites. Electronic media such as e-learning and video clips are being increas-
ingly included in the training programmes.
M A N A G E M E N T R E P O R T
Health, Safety and Environmental Protection, Quality Management
A N N U A L R E P O R T 2 0 1 5 – B R E N N T A G A G 1 1 7D
fu
rt
he
r
in
fo
rm
at
io
nf
in
an
ci
al
s
ta
te
me
nt
s
C
ma
na
ge
me
nt
r
ep
or
t
B

Brenntag has developed several programmes which measure performance in the fields of quality,
safety, health and the environment. The individual programmes are based on uniform evaluation cri-
teria and are geared to promoting the overall safety culture, avoiding accidents and improving work-
place safety. The following programmes are in place taking specific regional circumstances into con-
sideration:
EMEA: “Safety First Award”
North America: “Brenntag Cornerstone Process”
Latin America: “CASA Management System”
Asia Pacific: “5-Star Facility Award”
Accidents at work and similar occurrences are recorded and evaluated centrally according to a stan-
dardized system. Key lessons learned are communicated throughout the entire organization and
included in the aforementioned HSE manuals. Brenntag’s policy of continually improving processes
has led to the number of reportable industrial accidents within the Group falling again in 2015. This
led to a reduction in the Lost Time Injury Rate (1 day / 1 million) 5) from 1.9 in 2014 to 1.6 in 2015.
In 2015, in the context of its “2020 Vision”, Brenntag launched the “BEST” (Brenntag Enhanced Safety
Thinking) initiative with the aim of constantly improving the culture of safety throughout the Brenn-
tag Group. Core elements include developing a standard on safe conduct, a Group-wide employee
survey based on that standard and the plans of action to be derived from the survey findings.
Together with independent environmental experts, Brenntag continuously examines and evaluates at
each site the environmental risks including historical data which allow inter alia conclusions to be
drawn about possible contamination. This information is collated in an environmental database which
also serves as a basis for determining environmental provisions and is an instrument for organizing
necessary environmental remediation work.
Data that are necessary for the safe handling of our products during storage, transport and within the
delivery chain are stored in central databases at Brenntag. The data are thus available to most of the
Group. More companies are continually being connected to these central databases. In this way, it is
e.g. possible to implement all amendments to European laws simultaneously in all countries and
make them accessible to the staff. This is therefore an important prerequisite for efficient and system-
atic chemicals management.
The basis for quality management within the Brenntag Group is the internationally applicable ISO
9001 standard. By December 31, 2015, some 90 % of our operating sites had introduced quality man-
agement systems certified according to this standard. Furthermore, 105 sites are certified according
to the international standard ISO 14001 for environmental management systems.
5) Lost Time Injury Rate (LTIR) – number of industrial accidents resulting in at least one day’s absence from work per one million working hours. The metric was changed in 2015 from LTIR3d (3 days / 1 million) to LTIR1d (1 day / 1 million).
M A N A G E M E N T R E P O R T
Health, Safety and Environmental Protection, Quality Management
A N N U A L R E P O R T 2 0 1 5 – B R E N N T A G A G1 1 8
REGULATORY ENVIRONMENT
REACH – the chemicals regulation of the European Union – has formed the legal framework for safer
handling of chemicals to protect the environment and human health, while complying with sustain-
ability objectives, since it came into force on June 1, 2007. The registration of chemical substances is a
key component of the REACH regulation and spans three phases over a period of eleven years. Fur-
thermore, REACH governs the low-risk use of chemical substances and preparations at both manufac-
turer and user levels.
Brenntag is affected by REACH in several aspects of its business operations: as a distributor – within
the meaning of REACH – Brenntag ensures the smooth provision of safety information on substances;
as an importer and, in specific cases, as a manufacturer in that the Brenntag companies concerned
register the chemicals according to the tonnage thresholds, while the individual sites ensure that the
various operating processes (filling, diluting, mixing and blending) are in compliance with REACH and
the other administrative duties under REACH on the side of the user are met.
Another important piece of legislation in Europe alongside REACH is the Biocidal Product Regulation
(BPR, Regulation (EU) No. 528 / 2012), which governs the placing on the market and use of biocidal
products and has been in force since September 2013 with transitional periods for some of the
aspects it covers. Albeit to a lesser extent than REACH, the BPR affects the operating and administra-
tive processes of Brenntag’s biocidal products business to a high degree of complexity.
A transnational team of experts, consisting of a European network of experienced HSE and regulatory
specialists, is deployed to ensure that operating and business processes are in compliance with the
regulations. Working closely with the management on the sourcing and sales side, they make sure
that Brenntag meets all of the numerous regulatory requirements professionally and efficiently.
M A N A G E M E N T R E P O R T
Health, Safety and Environmental Protection, Quality Management
A N N U A L R E P O R T 2 0 1 5 – B R E N N T A G A G 1 1 9D
fu
rt
he
r
in
fo
rm
at
io
nf
in
an
ci
al
s
ta
te
me
nt
s
C
ma
na
ge
me
nt
r
ep
or
t
B

REPORT ON EXPECTED DEVELOPMENTS
The International Monetary Fund forecasts that growth in the global economy, measured in terms of
GDP, will be still at a low level in 2016. As regards the individual segments of the Brenntag Group,
North America is expected to remain on the low growth level achieved in 2015. The economy is likely
to continue to be adversely affected by the uncertainty surrounding the oil price development.
Growth in Europe is expected to be low and only slightly stronger than in 2015. Negative economic
growth is anticipated for Latin America in 2016. The Asian economies are predicted to achieve the
highest growth. Weighted by the sales generated by Brenntag in the individual countries, this results
in a forecast average growth rate of 2.4 %.
Against this background, we currently expect the following Group and segment performance in finan-
cial year 2016 in local currencies, i.e. excluding exchange rate effects:
We believe that the Brenntag Group will see growth in all relevant earnings parameters. Operating
gross profit should increase meaningfully due to the acquisitions carried out in 2015 and higher vol-
umes in the existing business. All regions are expected to support this performance, albeit to different
degrees. The effects of the downturn in the oil and gas business in North America weigh on the other-
REPORT ON EXPECTED DEVELOPMENTS, OPPORTUNITIES AND RISKS
In mid-February 2016, the Venezuelan government further devalued the country’s currency, the
bolivar. Since February 2015, Venezuela had had three parallel currency exchange mechanisms:
CENCOEX (official preferred exchange rate, exclusively for imports of certain essential goods such
as food and medicines, 6.30 bolivars per US dollar), SICAD (auction rate, most recently around
13.50 bolivars per US dollar) and SIMADI (permitted purchase and sale of foreign currency with
fewer restrictions, most recently around 200 bolivars per US dollar). In February 2016, this three-tier
model was converted to a dual model, under which CENCOEX (although devalued to 10 bolivars
per US dollar) and SIMADI will be the only official exchange mechanisms available. For Brenntag,
the resulting change on translation of the net assets of its Venezuelan subsidiary from the local
currency into the functional currency, the US dollar, will give rise to foreign exchange losses of
approximately EUR 20 million. Further currency translation effects may arise on the measurement
of inventories, which currently amount to approximately EUR 10 million.
EVENTS AFTER THE END OF THE REPORTING PERIOD
M A N A G E M E N T R E P O R T
A N N U A L R E P O R T 2 0 1 5 – B R E N N T A G A G1 2 0
Events After the End of the Reporting Per iod Report on Expected Developments, Opportunities and Risks
Further growth of all relevant KPIs expected

wise positive trend expected in the regions, however. Overall, operating EBITDA should show mean-
ingful growth.
For the EMEA segment, we expect a meaningful increase in operating gross profits which is mainly
based on the forecast of higher volumes. Among other things, we aim to grow by extending the life
science, lubricants and water treatment businesses and, in tandem, to expand in high-growth regions
such as Africa, the Middle East and Turkey. Overall, we expect a meaningful growth in operating
EBITDA.
In the North America segment, we predict a significant increase in operating gross profit, driven in
particular by the expansion of the lubricants business made possible by the acquisition of G.H. Berlin-
Windward und J.A.M. Distributing Company. At the same time, we see a heightened degree of uncer-
tainty about the near-term direction of the oil and gas sector due to the current fall in the crude oil
price. For the other areas of business, however, we expect a positive trend overall and therefore
believe that we will be able to achieve a significant increase in operating EBITDA. In addition, our
diversified portfolio across the entire oil and gas value chain and active cost management will help
to mitigate the short-term effects of the weakness in this sector.
In the Latin America segment, we expect a clear decline in operating gross profit due to the devalua-
tion and change to the currency exchange mechanism that took place in Venezuela in February 2016.
We plan to expand our activities in countries such as Mexico, Brazil and Columbia as well as our prod-
uct portfolio, particularly in the area of food and feed. Given the very volatile political and economic
situation and bearing in mind the devaluation and change to the currency exchange mechanism that
took place in Venezuela in February 2016, we believe that operating EBITDA will be down significantly
on the high level reached in the previous year despite the positive trend in many countries.
In the Asia Pacific segment, besides sustained organic growth, we also expect to benefit noticeably
from the acquisition of TAT Group, which is active in several Asian countries. We therefore forecast
significant growth in operating gross profit, which we aim to translate into a significant increase in
operating EBITDA. We also expect a positive trend in operating gross profit and operating EBITDA for
existing business in this segment.
Given the planned increase in business volume as a result of organic growth and the acquisitions
carried out in 2015, we expect average working capital to grow significantly compared with 2015.
We will continue to focus on customer and supplier relationship management and work continuously
to bring about sustained improvements in warehouse logistics. As a result, we expect to be able to
accelerate the working capital turnover achieved in 2015 despite challenging market conditions.
In order to bring property, plant and equipment capacities into line with the increasing volume of
business and support organic growth, we plan to make appropriate investments in property, plant
and equipment in 2016. We expect capital expenditure to increase to approximately EUR 150 million,
primarily as a result of projects to expand our business operations.
The exceptionally high free cash flow achieved in 2015 benefitted from a reduction in working capital
supported by the decrease in chemical pricing. As the reduction in working capital is not expected to
be repeated in 2016, we expect a reduction in free cash flow of more than 10 % despite the positive
development of EBITDA. We expect to be able to continue our acquisition strategy and dividend pol-
icy while maintaining Group liquidity at an adequate level without increasing net financial liabilities.
M A N A G E M E N T R E P O R T
Report on Expected Developments, Opportunities and Risks
A N N U A L R E P O R T 2 0 1 5 – B R E N N T A G A G 1 2 1D
fu
rt
he
r
in
fo
rm
at
io
nf
in
an
ci
al
s
ta
te
me
nt
s
C
ma
na
ge
me
nt
r
ep
or
t
B

DESCRIPTION OF THE INTERNAL CONTROL / RISK MANAGEMENT SYSTEM
The aim of risk management is to avoid potential risks and to identify, monitor and mitigate arising
risks at an early stage. Therefore, our risk management system consists of risk reporting (an early
detection system), controlling and an internal monitoring system as well as individual measures to
identify risks at an early stage and limit any known risks. The planning, control and reporting pro-
cesses of all operational and legal units as well as the central functions are integral parts of the risk
management system of the Brenntag Group.
RISK REPORTING (EARLY DETECTION SYSTEM)
We continually identify and analyze risks in the Group companies and constantly improve internal
workflows and the IT systems used throughout the Group.
The risk inventories performed and documented every six months at our Group companies and
regional holding companies are an important instrument for global risk management. Risks of smaller
subsidiaries are reported by the respective regional holding. In addition, all units have been
instructed to immediately report any significant risks suddenly occurring (ad-hoc reporting) to the
head office of the Group.
Each risk inventory is performed both centrally and decentrally and gathers estimations on existing
risks. Standardized risk catalogues giving examples of the typical risks for the Brenntag Group are
used as a system for gathering this information.
Any risks which are identified are assessed with regard to their probability of occurrence and the
potential damage. The risks are assessed according to the following risk classification model, divided
into possible extent of damage and probability of occurrence:
a) Possible extent of damage:
Insignificant
Low
Medium
High
Critical
b) Probability of occurrence:
Highly improbable (≤ 10 %)
Improbable (11 – 20 %)
Possible (21 – 50 %)
Probable (51 – 90 %)
Highly probable (≥ 91 %)
First, the gross risk is assessed. The gross risk is the maximum damage if no counteraction is taken. If
a risk can be reliably counteracted by effective action, these measures are to be shown in risk profiles
and assessed with regard to their effectiveness. The residual risk (net risk) is then the gross risk less
the effect of measures taken to reduce the risk.
M A N A G E M E N T R E P O R T
Report on Expected Developments, Opportunities and Risks
A N N U A L R E P O R T 2 0 1 5 – B R E N N T A G A G1 2 2

According to their estimated probability of occurrence and the possible extent of damage, i.e. the
negative impact on the results of operations and financial position and our cash flow, we classify net
risks as “high”, “medium” or “low”, which gives the following risk matrix:
Probability of occurrence
Highly improbable
Improbable Possible Probable Highly probable
Poss
ible
ext
ent
of
dam
age
Critical Medium Medium High High High
High Low Medium Medium High High
Medium Low Low Medium Medium High
Low Low Low Low Medium Medium
Insignificant Low Low Low Low Low
b.25 risk assessment matrix
The individual risks reported are consolidated at segment level and for the Group and then presented
to the Board of Management. Risk reporting only covers risks but not opportunities.
The process for systematically identifying and assessing risks for the Group companies is regularly
audited by the Corporate Internal Audit department.
CONTROLLING
Our Corporate Controlling department immediately processes the information gained from the
monthly and quarterly reports and can thus identify and communicate risks and opportunities. This
also includes an analysis of the reasons for any deviations from budgeted figures. On the basis of any
identified deviations from the budgeted figures, the Corporate Controlling department examines the
achievability of targets in forecasts made at specified times, indicating the associated opportunities
and risks. The financial performance indicators examined are mainly those described in the chapter
“Financial Management System”, above all operating EBITDA.
The continuous evaluation of opportunity and risk potential in all segments is also an elementary part
of our strategy, which is described in detail in the chapter “Vision, Objectives and Strategy”. As part
of our annual strategy planning process, we analyze the market opportunity and risk situation in each
Brenntag region and, on this basis, establish goals and value-enhancing measures designed to miti-
gate risks and exploit opportunities. Finally, the situation analysis and business operation plans are
reviewed regularly in quarterly discussions on business performance.
M A N A G E M E N T R E P O R T
Report on Expected Developments, Opportunities and Risks
A N N U A L R E P O R T 2 0 1 5 – B R E N N T A G A G 1 2 3D
fu
rt
he
r
in
fo
rm
at
io
nf
in
an
ci
al
s
ta
te
me
nt
s
C
ma
na
ge
me
nt
r
ep
or
t
B

INTERNAL MONITORING SYSTEM
Another important part of risk management in the Brenntag Group is the internal monitoring system
which consists of the organizational security measures, internal controls and the internal audit.
The internal control system comprises all central and decentralized policies and regulations which the
Board of Management and the regional and local managements lay down with the aim of ensuring
the effectiveness and efficiency of the workflows and processes,
the completeness, correctness and reliability of internal and external financial reporting as well as
the Group-wide observance of applicable laws and regulations (compliance).
Both the efficiency of the workflows and processes and the effectiveness of the internal control sys-
tems set up in the decentralized units as well as the reliability of the systems used are regularly exam-
ined by the Corporate Internal Audit department. The results of these audits are reported immedi-
ately. Thus, we ensure that the Board of Management is kept continuously informed of any
weaknesses and any resulting risks, along with the appropriate recommendations to eliminate the
weaknesses.
INTERNAL CONTROL SYSTEM WITH REGARD TO THE (GROUP) ACCOUNTING PROCESS (REPORT IN ACCORDANCE WITH SECTION 289, PARA. 5 AND SECTION 315, PARA. 2, NO. 5 OF THE GERMAN COMMERCIAL CODE (HGB))
The Group accounting process is controlled by the Corporate Accounting department. A major ele-
ment of the internal control system with regard to the (Group) accounting process is an IFRS account-
ing manual applicable throughout the Group which specifies accounting and measurement policies
for all companies included in the consolidated financial statements. Preparation of the consolidated
financial statements is supported by the use of uniform, standardized reporting and consolidation
software (SAP SEM-BCS) containing comprehensive testing and validation routines. The services of
external experts are used for special areas of accounting, e.g. the annual goodwill impairment test as
well as environmental and pension actuarial reports to determine the relevant provisions.
Furthermore, there are other Group-wide guidelines which have concrete effects on accounting,
above all the “Internal Control Guideline”, which contains requirements on the performance of moni-
toring routines as well as the separation of functions, four-eyes principle and access authorizations,
the “Transfer Pricing Guideline” as well as the “Finance Guideline”.
The Corporate Internal Audit department regularly checks compliance with these Group guidelines at
our subsidiaries.
Furthermore, the external auditors perform quarterly reviews of selected companies to aid in ensur-
ing that the regulations specified in the accounting manual have been observed. The security and
proper functioning of the software used is confirmed by the auditors in the annual audits.
M A N A G E M E N T R E P O R T
Report on Expected Developments, Opportunities and Risks
A N N U A L R E P O R T 2 0 1 5 – B R E N N T A G A G1 2 4

REPORT ON OPPORTUNITIES AND RISKS
Our business policy is geared to steadily improving the efficiency and underlying profitability of our
Group. The Brenntag Group and its companies operating in the field of chemical distribution and
related areas are confronted with a number of risks which may arise from their business activities. At
the same time, these business activities do not only lead to risks but also to many opportunities to
safeguard and enhance the company’s competitiveness.
Projects, in particular the strategic initiatives (see chapter “Vision, Objectives and Strategy”), are regu-
larly implemented to maintain and strengthen the Group’s profitable growth. These projects mainly
focus on developing sales opportunities but also on cost optimization.
To limit or entirely eliminate possible financial consequences of risks which may occur, we have pro-
cured appropriate insurances for the size of our businesses to cover damage and liability risks.
In the following, we describe risks and opportunities which could influence the operational perfor-
mance and financial and earnings situation of the Brenntag Group. We have systematically grouped
together similar, organizationally or functionally related risks in risk categories. The order of risks
within the categories reflects the current assessment of the relative degree of risk for Brenntag. The
estimates made per risk category relate to the net risk. Additional risks and opportunities which we
do not yet know or risks which we currently estimate to be insignificant may also have an impact on
our business. Unless stipulated otherwise or obvious from the context, the following statements on
risks and opportunities refer to all our segments.
Economic and political stability:
Due to the international nature of our business, we are exposed to a number of economic, political
and other risks and cannot entirely exclude that our decentralized structure may lead to incidents
or developments which may damage our business or financial situation. For example, the instability
of the economic and political situation in some regions or countries in which Brenntag operates
may have a negative impact on our business and our operating result. On the other hand, countries
and regions with an unstable economic and political situation are often emerging markets which
offer great opportunities through above-average growth. Overall, the international nature of our
business balances out the risks since we do a large percentage of our business in stable economies.
Economic downturns may also have a negative impact on the sales and operating gross profit of
our company. The latest economic developments, high unemployment in certain countries, the
high levels of debt of public-sector finance as well as the potential effects of government measures
to consolidate public finance throughout the world may lead to falling demand. In a recession,
lower profitability of our customers could lead to higher bad debt losses, for which credit insurance
cover can scarcely be obtained owing to the economic environment. However, the high level of
diversification of our business by geography, customer industries, suppliers, products and custom-
ers provides high resilience.
We assess the possible extent of damage of these risks as medium. We consider the probability of
occurrence of these risks to be possible. Overall, we rate these risks as medium risks.
M A N A G E M E N T R E P O R T
Report on Expected Developments, Opportunities and Risks
A N N U A L R E P O R T 2 0 1 5 – B R E N N T A G A G 1 2 5D
fu
rt
he
r
in
fo
rm
at
io
nf
in
an
ci
al
s
ta
te
me
nt
s
C
ma
na
ge
me
nt
r
ep
or
t
B

Market risks and opportunities:
Brenntag’s strategic development is geared to the current global, regional and local market
growth drivers.
We see major sales opportunities, which are of strategic significance for Brenntag, in the particu-
larly attractive focus industries water treatment, personal care, pharmaceuticals, food and bever-
ages, oil & gas as well as adhesives, sealants, coatings and elastomers. Our global network and our
comprehensive portfolio of products and services also place us in a unique position to meet cus-
tomers’ increasing demands for pan-regional and global total solutions. The growing demand for
customer-specific solutions, blending and services and alternative sales channels also open up fur-
ther growth opportunities. While the continuing fall in oil and gas prices causes a higher than
usual level of uncertainty regarding the short-term development of this customer industry, particu-
larly in the North America region, we trust the long-term potential as well as our excellent capabili-
ties and supplier and customer network.
As an international Group, we see opportunities in all our regions to extend our market lead. The
continuous expansion of our geographic presence, particularly in the emerging markets of Latin
America, Eastern Europe and Asia, also offers above-average growth opportunities. We will con-
tinue to optimally exploit the opportunities presented by company acquisitions and the active con-
solidation of the fragmented chemical distribution market.
In terms of product sourcing, our global presence enables us to achieve economies of scale. The
optimization of our local product portfolios through sales partnership agreements with chemical
producers for new products or product categories offers further potential. In addition, we will con-
tinue to actively realize the potential that arises as a result of chemical producers outsourcing sup-
ply chain and sales activities. The high density of our distribution network and the experienced pro-
fessional organization at all levels of the Brenntag Group are key elements for tapping this potential.
In addition, the systematic implementation of our strategic priorities, which we explain in detail in
the chapter “Vision, Objectives and Strategy”, creates further opportunities. At local level, we create
the right conditions through our operating activities to effectively and efficiently exploit the oppor-
tunities which the markets offer.
In the local markets we serve, we face growing competition, also from other chemicals distributors.
This increase in competition, which is partly due to the increasing pan-regional activities and con-
solidation among our competitors, is a sales risk which might negatively impact our sales and earn-
ings. Therefore, we continually work to improve our portfolio of products and services. Our local
business might also be impacted by customers relocating to low-cost countries. However, we see
our global presence as a decisive factor in balancing out these local risks.
We offset the sourcing-side risk for the supply of strategically important raw materials as far as
possible with long-term contracts and / or partnerships with different suppliers and alternative sup-
ply sources. However, the purchase prices can vary considerably depending on the market situation
and impact our cost structures. To safeguard our competitiveness, we counteract these risks by
adjusting selling prices, international procurement and by strict cost management.
M A N A G E M E N T R E P O R T
Report on Expected Developments, Opportunities and Risks
A N N U A L R E P O R T 2 0 1 5 – B R E N N T A G A G1 2 6

We counteract the risk arising from future market developments by constantly monitoring our mar-
kets and competitors as well as by holding regular strategy meetings.
We assess the possible extent of damage of these risks as high. We consider the probability of
occurrence of these risks to be possible. Overall, we rate these risks as medium risks.
Financial risks and opportunities:
Our business is exposed to exchange rate, interest rate, credit and price risks.
Due to the fact that we operate in countries with different currencies, changes in exchange rates
may have positive or negative translation effects on the results of the Group. In particular, any
change in the euro / US dollar exchange rate may have a considerable positive or negative impact as
a major part of our business is conducted in the US dollar area. We decided not to hedge exchange
rate differences resulting from the translation of financial statements of subsidiaries whose func-
tional currency is not the euro (translation risks). On the other hand, transaction exposures result-
ing from the translation of foreign currency receivables and liabilities into the functional currency
of a subsidiary are systematically monitored. This is based on a Group-wide Finance Guideline
which lays down basic requirements and objectives, threshold values and hedging instruments to
be used. The Finance Guideline requires Group companies to offset the risks of open net foreign
currency exposure by suitable instruments such as forward and swap contracts and to keep them
within certain limits. Any exceptions exceeding the above limits are to be agreed on a case-by-case
basis with Corporate Finance.
Unfavourable political developments and financial policy decisions in specific countries may have a
particularly negative impact. For example, the devaluation of the bolivar by the Venezuelan govern-
ment in mid-February 2016 including further changes in exchange rate regulations will lead to
exchange-rate-related expenses in 2016. Further changes to legislation on exchange rates and
resulting impacts on profits cannot be ruled out at present.
We limit risks for our cash investments by only doing business with banks and business partners
with credit ratings we consider to be strong. Payments are also handled through such banks. The
largely unused revolving credit facility under the syndicated loan is made available by a large num-
ber of international banks so here again availability is ensured as best possible through high diver-
sity. Risks of uncollectible receivables are reduced by continually monitoring our customers’ credit
ratings and payment behaviour and setting appropriate credit limits. The risk is limited by the large
number of customers the company has in different countries; even the largest customer accounts
for only about 1 % of Group sales. In addition, risks are limited by taking out credit insurances.
The Brenntag Group is partly financed with debt capital. We are confident that our loan agree-
ments, credit lines, the bonds issued and liquid funds available are adequate to cover the future
liquidity needs of our Group, even if requirements should increase unexpectedly. Like comparable
loan agreements, our syndicated loan contains a number of customary affirmative and negative
covenants. In particular, we have undertaken to comply with a threshold value for leverage (the
ratio of net debt to EBITDA).
M A N A G E M E N T R E P O R T
Report on Expected Developments, Opportunities and Risks
A N N U A L R E P O R T 2 0 1 5 – B R E N N T A G A G 1 2 7D
fu
rt
he
r
in
fo
rm
at
io
nf
in
an
ci
al
s
ta
te
me
nt
s
C
ma
na
ge
me
nt
r
ep
or
t
B

This metric is determined in accordance with the definitions in the loan agreement, which are not
the same as the corresponding terms used in the consolidated financial statements. The threshold
value for leverage has, in our opinion, been established so that it would require a very unusual
development of business for Brenntag not to be able to meet it. The observance of the covenant is
regularly checked and confirmed to the lenders every quarter. If there are any indications of an
unfavourable development with respect to its fulfilment, scenario calculations are made in order to
be able to take suitable action at an early stage if necessary. On the basis of the latest calculation of
leverage and with a view to the key mid-term planning figures, there is no indication that fulfilment
of the threshold value may be jeopardized. In the event of the Brenntag Group’s sustained breach
of this covenant, the facility agent appointed by the lenders may foreclose the loans if he deems
this move necessary to safeguard the lenders’ interests. As the Group’s main financing instruments
(syndicated loan and two bonds) all contain so-called cross-default clauses, any breach of contract
or calling due of outstanding amounts in respect to one financing instrument could also have a
negative impact on the others.
The terms and conditions of the financing instruments are also influenced by the Group’s credit rat-
ing. A change in the rating which the international rating agencies Standard & Poor’s and Moody’s
assign to Brenntag may impact on the Group’s financing conditions. The rating may have a positive
or a negative impact. Both rating agencies assign an investment grade rating, thereby confirming
Brenntag’s high credit standing: Moody’s currently rates Brenntag at “Baa3” with a stable outlook,
while Standard & Poor’s has given Brenntag a rating of “BBB” with a stable outlook.
The majority of Brenntag’s financing is based on variable interest rates which are subject to fluctua-
tions in market interest rates. This means that Brenntag has both the opportunity to participate in
falling market interest rates but also the risk of incurring higher interest cost as a result of rising
market interest rates. The split between variable and fixed interest rates is determined as part of
interest risk management. We hedge some of the risks from our financing by using derivative
instruments, such as foreign exchange forwards, interest rate and currency swaps or combined
instruments. Financial risks are mainly hedged by Corporate Finance at the head office of the
Group. If individual companies hedge financial risks from operating activities themselves, this is
done in consultation with and under the supervision of Group headquarters. This permits a balanc-
ing of risks throughout the Group. Further information on the financial risks is to be found in the
chapter “Reporting of Financial Instruments” in the Notes to the consolidated financial statements.
We assess the possible extent of damage of these risks as medium. We consider the probability of
occurrence of these risks to be possible. Overall, we rate these risks as medium risks.
M A N A G E M E N T R E P O R T
Report on Expected Developments, Opportunities and Risks
A N N U A L R E P O R T 2 0 1 5 – B R E N N T A G A G1 2 8

Quality, safety, health and environmental risks:
We counter the risks arising from the distribution of chemicals by maintaining a high standard of
safety precautions at our warehouses and – where necessary – improving them. Environmental,
health and safety risks are monitored on the basis of a uniform environmental, health and safety
strategy as well as through Group-wide standards set as binding requirements in regional manuals
(health, safety and environmental protection). Furthermore, we regularly inform our employees
and customers about how to handle chemicals safely and about emergency procedures in the event
of accidents.
The handling and distribution of chemicals is governed by a large number of regulations and laws.
Changes to this regulatory framework (e.g. restrictions or new requirements) may lead to lower
sales or involve higher costs to satisfy these regulations. However, we also see ourselves in a good
position due to our scale, the central systems we have in place and our expertise.
Risks may arise if the products purchased and delivered to customers do not meet the specified and
agreed quality. However, there are procedures in place providing a good level of assurance that
products are procured from reliable sources and are of appropriate quality.
We assess the possible extent of damage of these risks as high. We consider the probability of
occurrence of an individual risk with a high extent of damage to be improbable. Overall, we rate
these risks as medium risks.
IT risks and opportunities:
IT risks arise from the increasing networking of our systems. This can include networks failing and
data being falsified or destroyed due to operating and program errors or external influences. We
counteract these risks by continually investing in hardware and software as well as by using virus
scanners, firewall systems, data backup mechanisms as well as access and authorization checks.
These measures are monitored using Group-wide IT security standards. On the other hand, the
increasing use of IT offers efficiency gains in operating work flows and in improved communica-
tions with customers and suppliers. The IT-supported handling of our business processes also gen-
erally improves the quality and reliability of internal controls.
We assess the possible extent of damage of these risks as low. Given the protective measures we
have put in place, we consider the probability of occurrence of these risks to be improbable. Over-
all, we rate these risks as low risks.
Personnel risks and opportunities:
Although not a problem to date, personnel risks mainly result from the potential turnover of staff
in key positions. Brenntag limits these risks by targeted long-term succession planning as well as
performance-based compensation with success-based incentive systems. Moreover, we offer world-
wide career opportunities. Information on our staff development programmes is provided in the
chapter “Employees”. The staff turnover rate was 5.8 % worldwide in 2015.
We assess the possible extent of damage of these risks as low. We consider the probability of
occurrence of these risks to be improbable. Overall, we rate these risks as low risks.
M A N A G E M E N T R E P O R T
Report on Expected Developments, Opportunities and Risks
A N N U A L R E P O R T 2 0 1 5 – B R E N N T A G A G 1 2 9D
fu
rt
he
r
in
fo
rm
at
io
nf
in
an
ci
al
s
ta
te
me
nt
s
C
ma
na
ge
me
nt
r
ep
or
t
B

Acquisition risks and opportunities:
In the Brenntag Group, every decision to acquire is linked to minimum requirements on the internal
rate of return of the particular investment. The company valuations which include the findings of
due diligence work performed are of central importance in acquisitions. The acquisition of compa-
nies always involves risks surrounding the integration of employees and business operations. We
strive to limit these risks with adequate transaction structures by conducting opportunity and risk
analyses at an early stage in the approval process, with the support of external consultants and
with specific contract structures (e.g. incentive, warranty and retention clauses). In the past, M&A
activities focused on Europe, North America and Asia. For future acquisitions in emerging markets
like Asia, Latin America and Eastern Europe, typical characteristics for target companies in these
countries are relatively high purchase prices coupled with higher risks (e.g. compliance risks, higher
working capital funding requirements, integration risks, foreign currency risks). However, there are
also considerably greater opportunities in these countries owing to the higher growth rates.
We assess the possible extent of damage of these risks as insignificant. We consider the probability
of occurrence of these risks to be possible. Overall, we rate these risks as low risks.
Legal risks:
Brenntag AG and individual subsidiaries have been named as defendants in various legal actions
and proceedings arising in connection with its activities as a global group. Sometimes, Brenntag is
also the subject of investigations by the authorities. Brenntag cooperates with the relevant authori-
ties and, where appropriate, conducts internal investigations regarding potential wrongdoings with
the assistance of in-house and external counsel.
In 2013, Brenntag received the decision of the French Competition Authority in relation to the allo-
cation of customers and coordination of prices. In this, the Authority imposed a fine of EUR 47.8 mil-
lion against BRENNTAG SA and another party as well as a separate fine of EUR 5.3 million against
the other party - the fines were for violations of the French competition law in the period from
1998 until 2005. Brenntag had to pay the fine in the third quarter of 2013 but does not agree with
the legal assessment of the facts and the determination of the fine and has therefore appealed
against the decision of the French Competition Authority. BRENNTAG SA applied for leniency in
2006 and has actively contributed to the investigation and provided all information and proof work-
ing closely together with the French Competition Authority regarding the clarification of the facts.
Regarding the ongoing investigation by the French Competition Authority concerning whether
BRENNTAG SA has illegally made use of its market position, a decision by the Authority is still
pending. The status of the investigation does not permit an assessment of the outcome. Based
on current knowledge, Brenntag further assumes that claims for civil liability arising from the
above-mentioned proceedings are not sufficiently substantiated.
We now estimate the previously reported risk in connection with investigations against a French
manufacturer of medical devices to be highly improbable and will therefore only report in future on
this risk if there are any changes.
As a global company, Brenntag has to comply with the country-specific tax laws and regulations in
each jurisdiction. Tax exposures could result in particular from current and future tax audits of our
German and foreign subsidiaries. These exposures are generally reflected in the balance sheet by
recognizing provisions.
M A N A G E M E N T R E P O R T
Report on Expected Developments, Opportunities and Risks
A N N U A L R E P O R T 2 0 1 5 – B R E N N T A G A G1 3 0

The German Brenntag companies are currently the subject of routine tax audits for the years 2006
to 2012. Potential tax exposures could result from the acquisition of the Brenntag Group in 2006. In
this context, the German fiscal authorities are verifying the tax deductibility of transaction costs
and interest expenses paid on a shareholder loan granted by the former owner. As the fiscal authori-
ties have yet to complete a final review of the two cases, it is currently unclear whether and to what
extent a potential tax exposure exists. Brenntag is confident that the previous treatment of the
items is in line with the applicable tax laws and so has in neither case recognized any tax provisions.
Given the number of legal disputes and other proceedings that Brenntag is involved in, the possibil-
ity that a ruling against Brenntag may be made in some of these proceedings cannot be completely
eliminated. The company contests actions and proceedings where it considers it appropriate. Provi-
sions are established for ongoing legal disputes on the basis of the estimated risk and, if necessary,
with the help of external consultants. It is very difficult to predict the outcome of such matters, par-
ticularly in cases in which claimants seek indeterminate compensation. Any adverse decisions ren-
dered in such cases may have material effects on Brenntag’s net assets, financial position and
results of operations for a reporting period. However, Brenntag currently does not expect its assets,
financial position and results of operations to be materially affected.
We assess the possible extent of damage on occurrence of the legal risks as medium. We consider
the probability of occurrence of these risks to be improbable. Overall, we rate these risks as low risks.
SUMMARY OF THE OPPORTUNITIES AND RISK SITUATION
In the year under review, we once again continually updated and assessed the risk situation for the
Brenntag Group. In our opinion, the risks described in the chapter “Report on Opportunities and
Risks” do not jeopardize the continued existence of the company, neither individually nor collectively.
We are convinced that we can continue to successfully master the challenges arising from the risks
described above.
M A N A G E M E N T R E P O R T
Report on Expected Developments, Opportunities and Risks
A N N U A L R E P O R T 2 0 1 5 – B R E N N T A G A G 1 3 1D
fu
rt
he
r
in
fo
rm
at
io
nf
in
an
ci
al
s
ta
te
me
nt
s
C
ma
na
ge
me
nt
r
ep
or
t
B

COMPOSITION OF THE SUBSCRIBED CAPITAL
As at December 31, 2015, the subscribed capital of Brenntag AG totalled EUR 154,500,000. The share
capital is divided into 154,500,000 no-par-value registered shares, each with a notional value of EUR 1.00.
According to article 7, para. 3 of the Articles of Association of Brenntag AG, any right of shareholders
to certification of their shares is excluded to the extent permitted by law and that certification is not
required under the rules of any stock exchange on which the share is admitted for trading. The com-
pany is entitled to issue share certificates embodying several shares (consolidated certificates). Pursu-
ant to Section 67, para. 2 of the German Stock Corporation Act (AktG) only those persons recorded in
the company’s share register will be recognized as shareholders of Brenntag AG. For purposes of
recording the shares in the company’s share register, shareholders are required to submit to Brenntag
AG the number of shares held by them, and, in the case of individuals, their name, address and date
of birth, or in the case of legal entities, their company name, business address and registered offices.
All shares confer the same rights and obligations. At the General Shareholders’ Meeting, each share
has one vote and accounts for the shareholders’ proportionate share in the net income of Brenntag
AG. Excepted from this rule are any treasury shares held by Brenntag AG that do not entitle Brenntag
AG to any membership rights. Brenntag AG does not currently have any treasury shares. The share-
holders’ rights and obligations are governed by the provisions of the German Stock Corporation Act,
in particular by Sections 12, 53a ff., 118 ff. and 186 of the German Stock Corporation Act.
RESTRICTIONS ON VOTING RIGHTS OR TRANSFER OF SHARES
The Board of Management of Brenntag AG is not aware of any agreements between the shareholders
relating to restrictions on voting rights or on the transfer of shares. Restrictions on voting rights or
the transfer of shares by the members of the Supervisory Board are to be found in the remuneration
report.
INFORMATION REQUIRED PURSUANT TO SECTION 289, PARA. 4 AND SECTION 315, PARA. 4 OF THE GERMAN COMMERCIAL CODE (HGB) AND EXPLANATORY REPORT
Articles of Association of Brenntag AG at www.brenntag.com/articles_of_association
M A N A G E M E N T R E P O R T
A N N U A L R E P O R T 2 0 1 5 – B R E N N T A G A G1 3 2
Information Required Pursuant to Section 289, para. 4 and Section 315, para. 4 of the German Commercial Code (HGB) and Explanatory Report

DIRECT OR INDIRECT INTERESTS IN THE CAPITAL OF THE COMPANY EXCEEDING 10 % OF THE VOTING RIGHTS
Section 21 of the German Securities Trading Act (WpHG) requires that any investor whose percentage
of voting rights in Brenntag AG reaches, exceeds or falls below certain thresholds as the result of pur-
chases, disposals or otherwise must notify Brenntag AG and the German Federal Financial Supervisory
Authority (Bundesanstalt für Finanzdienstleistungsaufsicht). As at December 31, 2015, the company is
not aware of any direct or indirect interests in the capital of Brenntag AG that exceed 10 % of the vot-
ing rights. All voting right notifications in accordance with Section 21 of the German Securities Trad-
ing Act received by Brenntag AG in the reporting period can be viewed on the company’s website at
www.brenntag.com under Investor Relations.
SHARES WITH SPECIAL RIGHTS CONFERRING POWERS OF CONTROL
There are no shares with special rights conferring powers of control.
SYSTEM OF CONTROL OF ANY EMPLOYEE PARTICIPATION SCHEME WHERE THE CONTROL RIGHTS ARE NOT EXERCISED DIRECTLY BY THE EMPLOYEES
Brenntag AG does not have a general employee participation scheme.
LEGISLATION AND PROVISIONS OF THE ARTICLES OF ASSOCIA-TION APPLICABLE TO THE APPOINTMENT AND REMOVAL OF THE MEMBERS OF THE BOARD OF MANAGEMENT AND GOV-ERNING AMENDMENTS TO THE ARTICLES OF ASSOCIATION
The appointment and removal of members of the Board of Management are subject to the provisions
of Sections 84 and 85 of the German Stock Corporation Act. The Supervisory Board appoints the
members of the Board of Management for a maximum term of five years. Their appointment may be
resolved according to article 12, para. 4 of the Articles of Association of Brenntag AG by simple majority
of votes. In the event of a tie, the chairman of the Supervisory Board has the casting vote. According
to article 8, para. 1 of the Articles of Association of Brenntag AG, the Board of Management consists
of one or more persons. The specific number of members of the Board of Management is determined
by the Supervisory Board. The Board of Management of Brenntag AG currently consists of five members.
Contrary to Sections 133, para. 1 and 179, para. 2, sentence 1 of the German Stock Corporation Act,
article 19 of the Articles of Association of Brenntag AG stipulates that in cases where the majority of
the share capital represented is required, the simple majority of the capital represented is sufficient.
This, on the other hand, does not apply to amendments to the object of the company as Section 179,
para. 2, sentence 2 of the German Stock Corporation Act only permits amendments to a company’s
Articles of Association regarding the object of the company to be adopted with larger majorities so
that the requirements of Section 179, para. 2, sentence 1 of the German Stock Corporation Act remain
thus far. The authority to adopt purely formal amendments to the Articles of Association is transferred
M A N A G E M E N T R E P O R T
A N N U A L R E P O R T 2 0 1 5 – B R E N N T A G A G 1 3 3
Information Required Pursuant to Section 289, para. 4 and Section 315, para. 4 of the German Commercial Code (HGB) and Explanatory Report
D
fu
rt
he
r
in
fo
rm
at
io
nf
in
an
ci
al
s
ta
te
me
nt
s
C
ma
na
ge
me
nt
r
ep
or
t
B

to the Supervisory Board under article 13, para. 2 of the Articles of Association of Brenntag AG. In
addition, by resolution of the General Shareholders’ Meeting on June 17, 2014, the Supervisory Board
is authorized to amend the Articles of Association in connection with the creation of new authorized
capital after implementation of the capital increase and after expiry of the authorization period with-
out use of the authorized capital.
POWERS OF THE BOARD OF MANAGEMENT TO ISSUE OR REPURCHASE SHARES
AUTHORIZATION TO CREATE AUTHORIZED CAPITAL
By resolution of the General Shareholders’ Meeting on June 17, 2014, the Board of Management was
authorized, subject to the consent of the Supervisory Board, to increase the registered share capital of
Brenntag AG in one or more tranches by up to EUR 77,250,000 in aggregate by issuing up to
77,250,000 new no-par-value registered shares against cash contributions or non-cash contributions
in the period ending on June 16, 2019. In principle, shareholders are to be granted a subscription
right for new shares. However, in certain cases the Board of Management is authorized, subject to the
consent of the Supervisory Board, to exclude the statutory subscription right in relation to one or
more increases in the registered share capital within the scope of the authorized share capital. This
shall apply, for example, if the increase in the registered share capital is effected against contribution
in cash and provided that the issue price of the new shares is not substantially lower (within the
meaning of Section 203, para. 1 and para. 2 and Section 186, para. 3, sentence 4 of the German Stock
Corporation Act) than the market price for shares in the Company of the same class and having the
same conditions already listed at the time of the final determination of the issue price and provided
that the amount of the registered share capital represented by the shares issued pursuant to this
paragraph subject to the exclusion of the statutory subscription right in accordance with Section 186,
para. 3, sentence 4 of the German Stock Corporation Act does not exceed 10 % of the registered
share capital in the amount of EUR 154,500,000 (simplified exclusion of subscription rights). Details
can be found in the Articles of Association of Brenntag AG, which are available on the website at
www.brenntag.com under Investor Relations.
The Board of Management determines, subject to the consent of the Supervisory Board, the further
details regarding the rights attached to the shares and the conditions of the share issue.
AUTHORIZATION TO PURCHASE AND USE TREASURY SHARES IN ACCORDANCE WITH SECTION 71, PARA. 1, NO. 8 OF THE GERMAN STOCK CORPORATION ACT
By resolution of the General Shareholders’ Meeting on June 17, 2014, the Board of Management was
authorized, subject to the consent of the Supervisory Board, to purchase treasury shares up to a total
amount equal to no more than 10 % of the registered share capital. In this connection, the shares pur-
chased on the basis of this authorization together with other shares of the Company which Brenntag
AG has already purchased and still holds shall not exceed 10 % of the respective registered share capi-
tal. The authorization may be exercised to the full extent of repurchases thereby authorized or in par-
tial amounts, on one or several occasions. It took effect upon the conclusion of the General Share-
holders’ Meeting on June 17, 2014 and shall apply until June 16, 2019. If the purchase of shares is
effected on the stock market, the purchase price may not be more than 10 % higher or lower than the
arithmetic mean value of the closing prices on the Frankfurt am Main stock exchange for the last five
trading days preceding the purchase or the assumption of an obligation to purchase. If purchase is
M A N A G E M E N T R E P O R T
A N N U A L R E P O R T 2 0 1 5 – B R E N N T A G A G1 3 4
Information Required Pursuant to Section 289, para. 4 and Section 315, para. 4 of the German Commercial Code (HGB) and Explanatory Report

effected by way of a public purchase offer to all shareholders or by other means in accordance with
Section 53a of the German Stock Corporation Act, the purchase price paid to the shareholders in each
case may not be more than 10 % higher or lower than the arithmetic mean value of the closing prices
on the Frankfurt am Main stock exchange for the last five trading days preceding the publication of
the offer or, in the case of purchase by other means, preceding the purchase. The authorization may
be exercised for any purpose permitted by law. Treasury shares may, under certain circumstances, also
be used subject to exclusion of the shareholders’ subscription rights existing in principle and in par-
ticular by way of simplified exclusion of subscription rights as specified above.
AUTHORIZATION TO ISSUE BONDS AND TO CREATE CONDITIONAL CAPITAL
By resolution of the General Shareholders’ Meeting on June 17, 2014, the Board of Management was
authorized, subject to the consent of the Supervisory Board, to issue in one or more tranches in the
period up to June 16, 2019 registered or bearer warrant-linked or convertible bonds as well as profit-
sharing certificates conferring option or conversion rights in an aggregate nominal amount of up to
EUR 2,000,000,000 of limited or unlimited term (hereinafter collectively “Bonds”) and to grant the
holders or creditors of the Bonds option or conversion rights for up to 25,750,000 new shares of
Brenntag AG with a pro-rata amount of the registered share capital of up to EUR 25,750,000 further
subject to the terms and conditions of the respective warrant-linked or convertible bonds and / or terms
and conditions of the profit-sharing certificates to be defined by the Board of Management (herein-
after in each case “Terms and Conditions”). Other than in euros, the Bonds may also be issued – sub-
ject to the limitation to the corresponding equivalent value in euros – in a foreign legal currency. The
Bonds may also be issued by companies which are controlled by Brenntag AG or in which it holds a
majority interest; in such case, the Board of Management was authorized, subject to the consent of
the Supervisory Board, to assume on behalf of Brenntag AG, the guarantee for the Bonds and to grant
the holders of such Bonds option and / or conversion rights for shares of Brenntag AG and to effect
any further declarations and acts as are required for a successful issue. The issues of the Bonds may
in each case be divided into partial bonds with equal entitlement amongst themselves. The issue of
Bonds may also be effected against non-cash contributions, provided that the value of the non-cash
contribution is equal to the issue price and such issue price is not substantially lower than the market
value of the Bonds. The Board of Management is authorized, under certain circumstances and subject
to the consent of the Supervisory Board, to exclude the subscription right of the shareholders for
the Bonds. However, such authorization to exclude the subscription rights shall apply only provided
that the shares issued to fulfil the option or conversion rights and / or in the case of fulfilment of the
conversion obligation represent no more than 10 % of the registered share capital. Decisive for the
threshold of 10 % is the registered share capital in the amount of EUR 154,500,000 (simplified exclu-
sion of subscription rights).
If convertible bonds or profit-sharing certificates conferring conversion rights are issued, their holders
shall be granted the right to convert their Bonds into new shares of Brenntag AG further subject to
the specific Terms and Conditions.
If bonds with warrant units or profit-sharing certificates conferring option rights are issued, one or more
warrants shall be attached to each partial bond and / or each profit-sharing certificate which entitle
the holder to subscribe shares of Brenntag AG further subject to the specific Terms and Conditions.
By resolution of the General Shareholders’ Meeting on June 17, 2014, the registered share capital of
Brenntag AG was conditionally increased by up to EUR 25,750,000 by issuing up to 25,750,000 new
no-par-value registered shares conferring profit-sharing rights from the beginning of the financial
M A N A G E M E N T R E P O R T
A N N U A L R E P O R T 2 0 1 5 – B R E N N T A G A G 1 3 5
Information Required Pursuant to Section 289, para. 4 and Section 315, para. 4 of the German Commercial Code (HGB) and Explanatory Report
D
fu
rt
he
r
in
fo
rm
at
io
nf
in
an
ci
al
s
ta
te
me
nt
s
C
ma
na
ge
me
nt
r
ep
or
t
B

year in which they were issued. The conditional capital increase serves to grant shares to the holders
or creditors of warrant-linked or convertible bonds as well as profit-sharing certificates with option or
conversion rights which are issued in the period up to June 16, 2019, based on the authorization
approved by the General Shareholders’ Meeting. The conditional capital increase will only be imple-
mented to the extent that warrants or conversion rights under bonds with warrant units and convert-
ible bonds have been exercised or conversion obligations under such Bonds have to be fulfilled and
to the extent that neither treasury shares nor new shares from the authorized capital are used to fulfil
such claims. The Board of Management was authorized to stipulate the additional details of the
implementation of the conditional capital increase.
In November 2015, Brenntag issued bonds with warrant units in the amount of USD 500.0 million. The
bonds were offered only to institutional investors outside the USA. Shareholders’ subscription rights
were excluded. The bonds (Bond (with Warrants) 2022), which are guaranteed by Brenntag AG, were
issued by Brenntag Finance B.V., Amsterdam, Netherlands, with warrants issued by Brenntag AG
attached. The warrants entitle the holder to purchase Brenntag AG ordinary shares by paying the
strike price applicable at that time. The bonds-with-warrants issue generated options on approxi-
mately 6.5 million shares. This is equal to 4.2 % of the registered share capital on the reporting date.
In the event of any future capital measures under the current authorizations described above,
Brenntag may, therefore, only further exclude the subscription right by way of the simplified exclusion
of subscription rights up to a maximum amount, as at the reporting date, of 5.8 % of the registered
share capital. The Terms and Conditions of the bonds with warrant units allow Brenntag to settle
exercised options both from the conditional capital described above and from the authorized capital
described above or from the treasury shares it holds or to buy back the warrants. The bonds with
warrant units, the underlying bonds and the warrants have a term of seven years. The investor may
detach the warrants from the bonds. The bonds with warrant units, bonds detached from warrants
and detached warrants were admitted to trading on the Open Market (Freiverkehr) segment of the
Frankfurt Stock Exchange. Holders have been able to exercise their warrants since January 12, 2016.
SIGNIFICANT AGREEMENTS WHICH TAKE EFFECT, ALTER OR TERMINATE UPON A CHANGE OF CONTROL OF THE COMPANY FOLLOWING A TAKEOVER BID
The most important component in Brenntag’s financing concept is the Group-wide loan agreement
that it has concluded with a consortium of international banks. The total loan volume is described
under the chapter “Capital structure”. The main conditions are laid down in a “Syndicated Facilities
Agreement”. Under this agreement, individual lenders have the right to terminate the agreement if
any person or group of persons acting in concert acquire directly or indirectly more than 50 % of the
shares issued or the voting rights in Brenntag AG. The right to terminate in the event of a change of
control is preceded by a 30-day negotiating period on the continuation of the loan agreements. If the
parties involved cannot reach agreement on the continuation of the loan agreements in this period,
each lender can within ten days terminate his involvement as a lender in the agreement by giving
notice of at least another 30 days and request payment of the outstanding loan amounts.
The Bond 2018 for EUR 400.0 million issued by Brenntag Finance B.V. on July 19, 2011 also contains
provisions for the event of a change of control under Article 5 of the Conditions of Issue. According
to said provisions, the bond creditors may demand early repayment of the bond if the rating (in each
case as defined in the Conditions of Issue) has been downgraded within a certain period after the
change of control.
M A N A G E M E N T R E P O R T
A N N U A L R E P O R T 2 0 1 5 – B R E N N T A G A G1 3 6
Information Required Pursuant to Section 289, para. 4 and Section 315, para. 4 of the German Commercial Code (HGB) and Explanatory Report

Section 5 of the bond terms and conditions and section 7 of the warrant terms and conditions relat-
ing to the bond with warrant units in the amount of USD 500.0 million issued by Brenntag Finance
B.V. in November contain provisions governing a change of control, under which bondholders may
request the Bond (with Warrants) 2022 to be repaid early following an agreed period if one or more
persons within the meaning of Section 22, para. 2 of the German Securities Trading Act (WpHG) hold(s)
50 % or more of the voting rights in Brenntag AG. The terms and conditions of the warrants issued
with the bonds state that, in the event of a change of control, the holders of the warrants may receive
the right to purchase shares at a lower strike price during a specified period following the change of
control. The size of the adjustment to the strike price declines over the term of the warrants and is set
out in more detail in the terms and conditions of the warrants. According to the bond terms and condi-
tions, a change of control occurs if one or more persons within the meaning of Section 22, para. 2 of
the German Securities Trading Act hold(s) 50 % or more of the voting rights in Brenntag AG.
COMPENSATION AGREEMENTS WITH MEMBERS OF THE BOARD OF MANAGEMENT OR EMPLOYEES IN THE EVENT OF A TAKEOVER BID
There are no compensation agreements with members of the Board of Management or employees in
the event of a takeover bid.
CORPORATE GOVERNANCE STATEMENT
The Corporate Governance declaration to be made pursuant to Section 289a of the German Commercial
Code (HGB) is to be found in the chapter “To our Shareholders” in connection with the Corporate Gover-
nance Report. It is also available on the website at www.brenntag.com under Investor Relations.
M A N A G E M E N T R E P O R T
Corporate Governance Statement
A N N U A L R E P O R T 2 0 1 5 – B R E N N T A G A G 1 3 7
Further information in chapter “Corporate Governance”
D
fu
rt
he
r
in
fo
rm
at
io
nf
in
an
ci
al
s
ta
te
me
nt
s
C
ma
na
ge
me
nt
r
ep
or
t
B

C O N S O L I D A T E D F I N A N C I A L
S T A T E M E N T S
138 – 237
C O N S O L I D A T E D F I N A N C I A L S T A T E M E N T S
Content
A N N U A L R E P O R T 2 0 1 5 – B R E N N T A G A G1 3 8

140 CONSOLIDATED INCOME STATEMENT
141 CONSOLIDATED STATEMENT OF
COMPREHENSIVE INCOME
142 CONSOLIDATED BALANCE SHEET
144 CONSOLIDATED STATEMENT OF
CHANGES IN EQUITY
146 CONSOLIDATED CASH FLOW
STATEMENT
147 NOTES
147 Key Financial Figures by Segment
148 Group Key Financial Figures
149 General Information
150 Consolidation Policies and Methods
162 Accounting and Measurement Policies
172 Consolidated Income Statement
Disclosures
179 Consolidated Balance Sheet Disclosures
211 Consolidated Cash Flow Statement
Disclosures
211 Segment Reporting
213 Other Financial Obligations and
Contingent Liabilities
214 Legal Proceedings and Disputes
215 Reporting of Financial Instruments
224 Related Parties
225 Audit Fees for the Auditors of the
Consolidated Financial Statements
226 Exemptions pursuant to Section 264,
para. 3 / Section 264b of the German
Commercial Code
226 Declaration of Conformity with the
German Corporate Governance Code
226 Events after the End of the Reporting
Period
227 RESPONSIBILITY STATEMENT
228 ANNEX
228 List of Shareholdings in Accordance with
Section 313, para. 2 of the German Com-
mercial Code as at December 31, 2015
C O N S O L I D A T E D F I N A N C I A L S T A T E M E N T S
Content
A N N U A L R E P O R T 2 0 1 5 – B R E N N T A G A G 1 3 9D
fu
rt
he
r
in
fo
rm
at
io
nf
in
an
ci
al
s
ta
te
me
nt
s
C
D

in EUR m Note 2015 2014
Sales 1.) 10,346.1 10,015.6
Cost of sales 2.) – 8,080.1 – 7,988.1
Gross profit 2,266.0 2,027.5
Selling expenses 3.) – 1,461.2 – 1,311.3
Administrative expenses 4.) – 166.5 – 151.9
Other operating income 5.) 45.4 43.1
Other operating expenses 6.) – 21.9 – 15.8
Operating profit 661.8 591.6
Share of profit or loss of equity-accounted investments 3.7 3.3
Interest income 7.) 3.3 3.0
Interest expense 8.) – 74.8 – 76.4
Change in liabilities relating to acquisition of non-controlling interests recognized in profit or loss 9.) – 24.9 4.0
Other net finance costs 10.) – 19.8 – 17.7
Net finance costs – 112.5 – 83.8
Profit before tax 549.3 507.8
Income tax expense 11.) – 181.2 – 168.1
Profit after tax 368.1 339.7
Attributable to:
Shareholders of Brenntag AG 365.0 339.3
Non-controlling interests 3.1 0.4
Basic earnings per share in euro 13.) 2.36 2.20
Diluted earnings per share in euro 13.) 2.36 2.20
c.01 consolidated income statement
CONSOLIDATED INCOME STATEMENT
C O N S O L I D A T E D F I N A N C I A L S T A T E M E N T S
Consolidated Income Statement
A N N U A L R E P O R T 2 0 1 5 – B R E N N T A G A G1 4 0
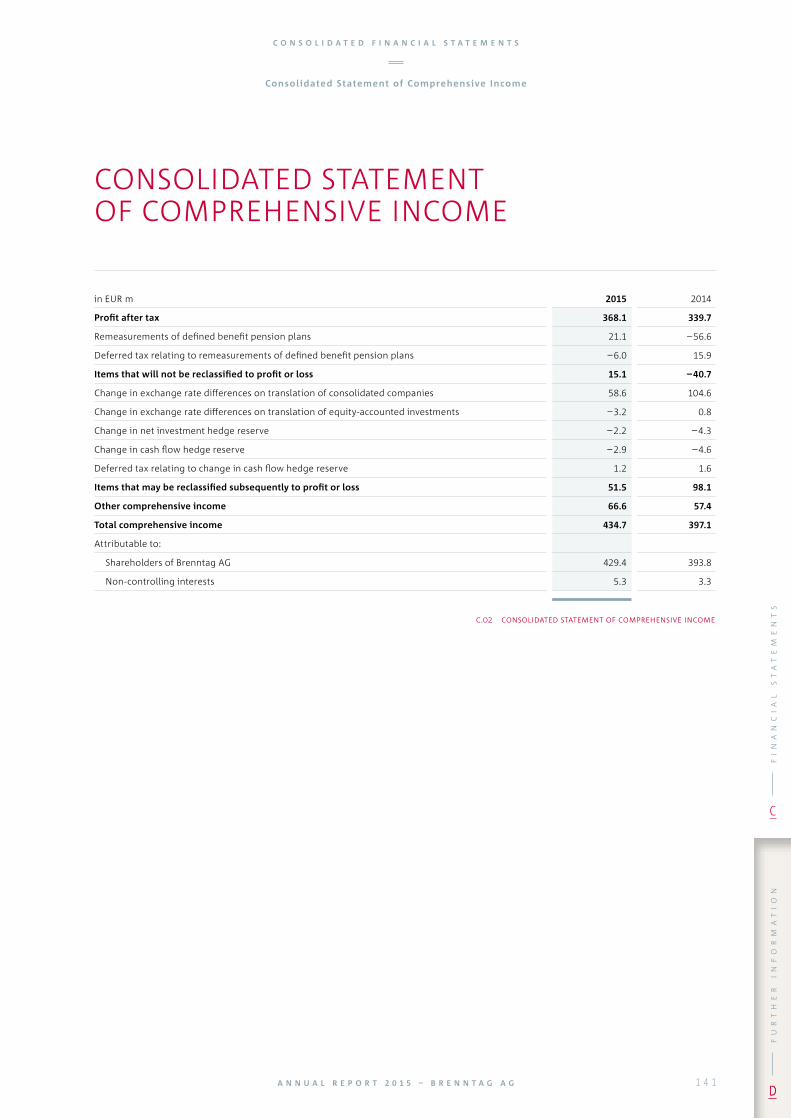
in EUR m 2015 2014
Profit after tax 368.1 339.7
Remeasurements of defined benefit pension plans 21.1 – 56.6
Deferred tax relating to remeasurements of defined benefit pension plans – 6.0 15.9
Items that will not be reclassified to profit or loss 15.1 – 40.7
Change in exchange rate differences on translation of consolidated companies 58.6 104.6
Change in exchange rate differences on translation of equity-accounted investments – 3.2 0.8
Change in net investment hedge reserve – 2.2 – 4.3
Change in cash flow hedge reserve – 2.9 – 4.6
Deferred tax relating to change in cash flow hedge reserve 1.2 1.6
Items that may be reclassified subsequently to profit or loss 51.5 98.1
Other comprehensive income 66.6 57.4
Total comprehensive income 434.7 397.1
Attributable to:
Shareholders of Brenntag AG 429.4 393.8
Non-controlling interests 5.3 3.3
c.02 consolidated statement of comprehensive income
CONSOLIDATED STATEMENT OF COMPREHENSIVE INCOME
C O N S O L I D A T E D F I N A N C I A L S T A T E M E N T S
Consolidated Statement of Comprehensive Income
A N N U A L R E P O R T 2 0 1 5 – B R E N N T A G A G 1 4 1D
fu
rt
he
r
in
fo
rm
at
io
nf
in
an
ci
al
s
ta
te
me
nt
s
C
D

CONSOLIDATED BALANCE SHEET
assets
in EUR m Note Dec. 31, 2015 Dec. 31, 2014
Current assets
Cash and cash equivalents 14.) 579.1 491.9
Trade receivables 15.) 1,426.5 1,407.2
Other receivables 16.) 137.0 127.7
Other financial assets 17.) 10.2 7.9
Current tax assets 47.9 34.3
Inventories 18.) 897.1 865.8
Non-current assets held for sale 19.) 1.0 0.9
3,098.8 2,935.7
Non-current assets
Property, plant and equipment 20.) 971.9 879.3
Intangible assets 21.) 2,772.1 2,268.0
Equity-accounted investments 22.) 22.5 25.0
Other receivables 16.) 21.1 13.8
Other financial assets 17.) 38.4 31.2
Deferred tax assets 11.) 51.4 62.0
3,877.4 3,279.3
Total assets 6,976.2 6,215.0
C O N S O L I D A T E D F I N A N C I A L S T A T E M E N T S
Consolidated Balance Sheet
A N N U A L R E P O R T 2 0 1 5 – B R E N N T A G A G1 4 2

liabilities and equity
in EUR m Note Dec. 31, 2015 Dec. 31, 2014
Current liabilities
Trade payables 23.) 1,055.5 1,046.2
Financial liabilities 24.) 160.8 334.0
Other liabilities 25.) 370.5 360.8
Other provisions 26.) 42.1 45.1
Liabilities relating to acquisition of non-controlling interests 28.) 63.3 –
Current tax liabilities 46.7 43.4
1,738.9 1,829.5
Non-current liabilities
Financial liabilities 24.) 2,094.4 1,567.6
Other liabilities 25.) 2.6 2.2
Other provisions 26.) 121.1 114.4
Provisions for pensions and other post-employment benefits 27.) 150.9 162.6
Liabilities relating to acquisition of non-controlling interests 28.) 5.4 39.7
Deferred tax liabilities 11.) 172.4 142.1
2,546.8 2,028.6
Equity 29.)
Subscribed capital 154.5 154.5
Additional paid-in capital 1,491.4 1,457.1
Retained earnings 938.0 700.7
Other comprehensive income 62.5 13.2
Equity attributable to Brenntag shareholders 2,646.4 2,325.5
Equity attributable to non-controlling interests 44.1 31.4
2,690.5 2,356.9
Total liabilities and equity 6,976.2 6,215.0
c.03 consolidated balance sheet
C O N S O L I D A T E D F I N A N C I A L S T A T E M E N T S
Consolidated Balance Sheet
A N N U A L R E P O R T 2 0 1 5 – B R E N N T A G A G 1 4 3D
fu
rt
he
r
in
fo
rm
at
io
nf
in
an
ci
al
s
ta
te
me
nt
s
C
D

in EUR m Subscribed capital Additional
paid-in capital Retained earningsExchange rate
differencesNet investment hedge reserve
Cash flow hedge reserve
Deferred taxes relating to
cash flow hedge reserve
Equity attributable to Brenntag
shareholdersNon-controlling
interests Equity
Dec. 31, 2013 51.5 1,560.1 536.0 – 85.4 – 2.1 8.7 – 3.2 2,065.6 28.1 2,093.7
Dividends – – – 133.9 – – – – – 133.9 – – 133.9
Capital increase from company funds 103.0 – 103.0 – – – – – – – –
Profit after tax – – 339.3 – – – – 339.3 0.4 339.7
Other comprehensive income – – – 40.7 102.5 – 4.3 – 4.6 1.6 54.5 2.9 57.4
Total comprehensive income – – 298.6 102.5 – 4.3 – 4.6 1.6 393.8 3.3 397.1
Dec. 31, 2014 154.5 1,457.1 700.7 17.1 – 6.4 4.1 – 1.6 2,325.5 31.4 2,356.9
Dividends – – – 139.1 – – – – – 139.1 – 0.1 – 139.2
Capital increase from warrants issued – 34.3 – – – – – 34.3 – 34.3
Business combinations – – – – – – – – 7.5 7.5
Transactions with owners – – – 3.7 – – – – – 3.7 – – 3.7
Profit after tax – – 365.0 – – – – 365.0 3.1 368.1
Other comprehensive income – – 15.1 53.2 – 2.2 – 2.9 1.2 64.4 2.2 66.6
Total comprehensive income – – 380.1 53.2 – 2.2 – 2.9 1.2 429.4 5.3 434.7
Dec. 31, 2015 154.5 1,491.4 938.0 70.3 – 8.6 1.2 – 0.4 2,646.4 44.1 2,690.5
c.04 consolidated statement of changes in equity
CONSOLIDATED STATEMENT OF CHANGES IN EQUITY
C O N S O L I D A T E D F I N A N C I A L S T A T E M E N T S
Consolidated Statement of Changes in Equity
A N N U A L R E P O R T 2 0 1 5 – B R E N N T A G A G1 4 4

in EUR m Subscribed capital Additional
paid-in capital Retained earningsExchange rate
differencesNet investment hedge reserve
Cash flow hedge reserve
Deferred taxes relating to
cash flow hedge reserve
Equity attributable to Brenntag
shareholdersNon-controlling
interests Equity
Dec. 31, 2013 51.5 1,560.1 536.0 – 85.4 – 2.1 8.7 – 3.2 2,065.6 28.1 2,093.7
Dividends – – – 133.9 – – – – – 133.9 – – 133.9
Capital increase from company funds 103.0 – 103.0 – – – – – – – –
Profit after tax – – 339.3 – – – – 339.3 0.4 339.7
Other comprehensive income – – – 40.7 102.5 – 4.3 – 4.6 1.6 54.5 2.9 57.4
Total comprehensive income – – 298.6 102.5 – 4.3 – 4.6 1.6 393.8 3.3 397.1
Dec. 31, 2014 154.5 1,457.1 700.7 17.1 – 6.4 4.1 – 1.6 2,325.5 31.4 2,356.9
Dividends – – – 139.1 – – – – – 139.1 – 0.1 – 139.2
Capital increase from warrants issued – 34.3 – – – – – 34.3 – 34.3
Business combinations – – – – – – – – 7.5 7.5
Transactions with owners – – – 3.7 – – – – – 3.7 – – 3.7
Profit after tax – – 365.0 – – – – 365.0 3.1 368.1
Other comprehensive income – – 15.1 53.2 – 2.2 – 2.9 1.2 64.4 2.2 66.6
Total comprehensive income – – 380.1 53.2 – 2.2 – 2.9 1.2 429.4 5.3 434.7
Dec. 31, 2015 154.5 1,491.4 938.0 70.3 – 8.6 1.2 – 0.4 2,646.4 44.1 2,690.5
c.04 consolidated statement of changes in equity
C O N S O L I D A T E D F I N A N C I A L S T A T E M E N T S
Consolidated Statement of Changes in Equity
A N N U A L R E P O R T 2 0 1 5 – B R E N N T A G A G 1 4 5D
fu
rt
he
r
in
fo
rm
at
io
nf
in
an
ci
al
s
ta
te
me
nt
s
C
D

in EUR m Note 2015 2014
30.)
Profit after tax 368.1 339.7
Depreciation and amortization 20.) / 21.) 145.6 135.3
Income tax expense 11.) 181.2 168.1
Income taxes paid – 174.2 – 164.8
Net interest expense 7.) / 8.) 71.5 73.4
Interest paid (netted against interest received) – 67.2 – 70.2
Dividends received 3.1 3.8
Changes in provisions – 5.9 – 5.8
Changes in current assets and liabilities
Inventories 64.2 – 51.1
Receivables 109.2 – 76.9
Liabilities – 112.8 37.6
Non-cash change in liabilities relating to acquisition of non-controlling interests 9.) 24.9 – 4.0
Other non-cash items and reclassifications – 14.0 – 15.4
Net cash provided by operating activities 593.7 369.7
Proceeds from the disposal of other financial assets – 0.1
Proceeds from the disposal of intangible assets and property, plant and equipment 6.0 7.3
Payments to acquire consolidated subsidiaries and other business units – 500.8 – 82.0
Payments to acquire other financial assets – 0.1 – 0.6
Payments to acquire intangible assets and property, plant and equipment – 126.7 – 103.0
Net cash used in investing activities – 621.6 – 178.2
Proceeds from warrants issued 34.3 –
Dividends paid to Brenntag shareholders – 139.1 – 133.9
Profits distributed to non-controlling interests – 1.9 – 1.8
Proceeds from borrowings 524.7 61.8
Repayments of borrowings – 306.0 – 75.4
Net cash provided by / used in financing activities 112.0 – 149.3
Change in cash and cash equivalents 84.1 42.2
Effect of exchange rate changes on cash and cash equivalents 3.1 22.9
Cash and cash equivalents at beginning of period 14.) 491.9 426.8
Cash and cash equivalents at end of period 14.) 579.1 491.9
c.05 consolidated cash flow statement
CONSOLIDATED CASH FLOW STATEMENT
C O N S O L I D A T E D F I N A N C I A L S T A T E M E N T S
Consolidated Cash Flow Statement
A N N U A L R E P O R T 2 0 1 5 – B R E N N T A G A G1 4 6

segment reporting in accordance with ifrs 8 1)
in EUR m EMEA 4) North
AmericaLatin
AmericaAsia
PacificAll other
segmentsConsoli-
dation Group
External sales
2015 4,654.4 3,600.6 925.8 834.1 331.2 – 10,346.1
2014 4,624.7 3,332.0 864.0 748.2 446.7 – 10,015.6
Change in % 0.6 8.1 7.2 11.5 – 25.9 – 3.3
fx adjusted change in % – 0.6 – 8.6 – 0.1 – 2.3 – 25.9 – – 4.6
Inter-segment sales2015 9.9 6.2 1.3 – 0.7 – 18.1 –
2014 9.0 6.5 1.9 3.6 0.8 – 21.8 –
Operating gross profit 2)
2015 1,024.2 942.6 201.2 140.0 13.7 – 2,321.7
2014 972.0 802.2 169.5 120.7 13.8 – 2,078.2
Change in % 5.4 17.5 18.7 16.0 – 0.7 – 11.7
fx adjusted change in % 3.6 – 0.5 9.8 2.3 – 0.7 – 2.3
Gross profit
2015 – – – – – – 2,266.0
2014 – – – – – – 2,027.5
Change in % – – – – – – 11.8
fx adjusted change in % – – – – – – 2.4
Operating EBITDA (Segment result)
2015 353.0 365.6 64.7 50.3 – 26.2 – 807.4
2014 335.9 323.6 46.8 41.2 – 20.8 – 726.7
Change in % 5.1 13.0 38.2 22.1 26.0 – 11.1
fx adjusted change in % 3.2 – 4.6 29.1 7.0 26.0 – 0.7
EBITDA
2015 – – – – – – 807.4
2014 – – – – – – 726.9
Change in % – – – – – – 11.1
fx adjusted change in % – – – – – – 0.7
Operating EBITDA / Operating gross profit 2)
2015 in % 34.5 38.8 32.2 35.9 – 191.2 – 34.8
2014 in % 34.6 40.3 27.6 34.1 – 150.7 – 35.0
Investments in non-current assets (capex) 3)
2015 59.0 52.0 12.3 6.1 0.7 – 130.1
2014 56.9 32.5 9.6 5.1 0.7 – 104.8
c.06 segment reporting in accordance with ifrs 8
NOTES
KEY FINANCIAL FIGURES BY SEGMENT
for the period from January 1 to December 31
1) For further information on segment reporting in accordance with IFRS 8, see Note 31.).2) External sales less cost of materials.3) Investments in non-current assets are the other additions to property, plant and equipment and intangible assets.4) Europe, Middle East & Africa.
C O N S O L I D A T E D F I N A N C I A L S T A T E M E N T S
Notes
A N N U A L R E P O R T 2 0 1 5 – B R E N N T A G A G 1 4 7D
fu
rt
he
r
in
fo
rm
at
io
nf
in
an
ci
al
s
ta
te
me
nt
s
C
D

in EUR m 2015 2014
EBITDA (incl. transaction costs / holding charges) 807.4 726.9
Investments in non-current assets (capex) 1) – 130.1 – 104.8
Changes in working capital 2) 3) 87.0 – 100.5
Free cash flow 764.3 521.6
c.07 free cash flow
in EUR m 2015 2014
Operating EBITDA (segment result) 1) 807.4 726.7
Transaction costs / holding charges 2) – 0.2
EBITDA 807.4 726.9
Depreciation of property, plant and equipment – 108.7 – 99.2
Impairment of property, plant and equipment – – 0.2
EBITA 698.7 627.5
Amortization of intangible assets 3) – 36.9 – 35.9
Impairment of intangible assets – –
EBIT 661.8 591.6
Net finance costs – 112.5 – 83.8
Profit before tax 549.3 507.8
c.08 reconciliation from operating ebitda to profit before tax
GROUP KEY FINANCIAL FIGURES
1) Investments in non-current assets are the other additions to property, plant and equipment and intangible assets.2) Definition of working capital: trade receivables plus inventories less trade payables.3) Adjusted for exchange rate effects and acquisitions.
1) Including operating EBITDA all other segments.2) Transaction costs: costs associated with restructuring under company law and refinancing. They are eliminated for management
reporting purposes to permit proper presentation of operating performance and comparability at segment level. Holding charges: certain costs charged between holding companies and operating companies. At Group level they net to zero.
3) For the period January 1 to December 31, 2015, this figure includes amortization of customer relationships totalling EUR 27.7 million (2014: EUR 28.3 million).
C O N S O L I D A T E D F I N A N C I A L S T A T E M E N T S
Notes
A N N U A L R E P O R T 2 0 1 5 – B R E N N T A G A G1 4 8

in EUR m 2015 2014
EBITA 698.7 627.5
Average property, plant and equipment 912.7 852.7
Average working capital 1,295.1 1,161.8
RONA 1) 31.6 % 31.1 %
c.09 determination of rona
1) RONA stands for Return on Net Assets and is defined as EBITA divided by the sum of average property, plant and equipment and average working capital. Average property, plant and equipment is defined for a particular year as the average of the values for property, plant and equipment at each of the following five times: the beginning of the year, the end of each of the first, second and third quarters, and the end of the year. Average working capital is defined for a particular year as the average of the values for working capital at each of the following five times: the beginning of the year, the end of each of the first, second and third quarters, and the end of the year.
in EUR m 2015 2014
Operating gross profit 2,321.7 2,078.2
Production / mixing & blending costs – 55.7 – 50.7
Gross profit 2,266.0 2,027.5
c.10 reconciliation of operating gross profit to gross profit
GENERAL INFORMATION
As one of the world’s leading chemicals distributors with more than 530 locations, Brenntag 1) offers
its customers and suppliers an extensive range of services, global supply chain management and a
highly developed chemical distribution network in EMEA, North and Latin America as well as in the
Asia Pacific region.
These consolidated financial statements of Brenntag AG were prepared by the Board of Management
of Brenntag AG on March 7, 2016, authorized for publication and submitted to the Supervisory Board
for approval at its meeting on March 14, 2016.
The consolidated financial statements of Brenntag AG are denominated in euros (EUR). Unless other-
wise stated, the amounts are in millions of euros (EUR million). For arithmetic reasons, rounding
differences of ± one unit after the decimal point (EUR, % etc.) may occur.
1) Brenntag AG, Stinnes-Platz 1, 45472 Mülheim an der Ruhr
C O N S O L I D A T E D F I N A N C I A L S T A T E M E N T S
Notes
A N N U A L R E P O R T 2 0 1 5 – B R E N N T A G A G 1 4 9D
fu
rt
he
r
in
fo
rm
at
io
nf
in
an
ci
al
s
ta
te
me
nt
s
C
D

CONSOLIDATION POLICIES AND METHODS
STANDARDS APPLIED
The consolidated financial statements have been prepared in accordance with IFRSs (International
Financial Reporting Standards), as adopted in the EU.
The IFRSs comprise the standards (International Financial Reporting Standards and International
Accounting Standards) issued by the International Accounting Standards Board (IASB) and the inter-
pretations by the IFRS Interpretations Committee (IFRS IC) and the former Standing Interpretations
Committee (SIC).
The accounting methods applied comply with all the standards and interpretations existing and
adopted by the EU as at December 31, 2015 whose application is mandatory. In addition, the German
commercial law provisions to be applied in accordance with Section 315a, para. 1 of the German
Commercial Code were taken into account.
The following revised and new standards issued by the International Accounting Standards Board
(IASB) were applied by the Brenntag Group for the first time:
The new IFRIC 21 (Levies) and the Annual Improvements to IFRSs (2011–2013 Cycle) were applied for
the first time in financial year 2015.
IFRIC 21 (Levies) addresses the accounting for levies imposed by a government that are not income
taxes within the meaning of IAS 12 (Income Taxes) and clarifies, in particular, when obligations to pay
such levies are required to be recognized as liabilities in the financial statements. In most cases, the
change in the timing of recognition of a liability also results in a change in the timing of recognition
of the related expense in the income statement. The first-time application of IFRIC 21 does not have
any effect on the presentation of the Group’s net assets, financial position and results of operations
for financial year 2015 as a whole. During the financial year, however, the timing of recognition of
expenses and liabilities from levies imposed by a government changed in some cases, thereby affect-
ing the interim consolidated financial statements. The prior-year amounts in the interim consolidated
financial statements were therefore adjusted accordingly. Retrospective application of IFRIC 21 did not
have any effect on the Brenntag Group’s equity as at December 31, 2014.
Operating EBITDA, EBITDA and profit before tax for the periods in 2014 changed as follows:
EMEANorth
AmericaLatin
AmericaAsia
PacificAll other
segments Group
January 1 to March 31, 2014 – 2.0 – 2.2 – 0.2 – – – 4.4
April 1 to June 30, 2014 0.7 1.1 – – – 1.8
July 1 to September 30, 2014 0.7 0.2 0.1 – – 1.0
October 1 to December 31, 2014 0.6 0.9 0.1 – – 1.6
January 1 to December 31, 2014 – – – – – –
c.11 effects of retrospective application of ifric 21 (levies)
C O N S O L I D A T E D F I N A N C I A L S T A T E M E N T S
Notes
A N N U A L R E P O R T 2 0 1 5 – B R E N N T A G A G1 5 0

The annual improvements to IFRSs contain a number of minor amendments to various standards that
are intended to clarify the content of the standards and eliminate any existing inconsistencies. They
did not have a material effect on the presentation of the Group’s net assets, financial position and
results of operations.
The following (in some cases revised) standards and interpretations had been published by the end
of 2015, but their adoption is not yet mandatory. They will probably only be applied in Brenntag’s
consolidated financial statements when their adoption is mandatory and if they are endorsed by the
European Union.
Probable first-time adoption in 2016:
Amendment to IAS 19 (Employee Benefits (revised 2011)) regarding employee contributions to
defined benefit plans
Amendments to IFRS 11 (Joint Arrangements) regarding the acquisition of an interest in a joint
operation
Amendments to IAS 16 (Property, Plant and Equipment) and IAS 38 (Intangible Assets) regarding
acceptable methods of depreciation and amortization
Amendments to IAS 1 (Presentation of Financial Statements) in connection with the Disclosure
Initiative
Annual Improvements to IFRSs (2010–2012 Cycle)
Annual Improvements to IFRSs (2012–2014 Cycle)
Amendments to IFRS 10 (Consolidated Financial Statements), IFRS 12 (Disclosure of Interests in
Other Entities) and IAS 28 (Investments in Associates and Joint Ventures (revised 2011)) regarding
the application of the consolidation exception for investment entities – not relevant to Brenntag
Amendments to IAS 27 (Separate Financial Statements) regarding the use of the equity method in
separate financial statements – not relevant to Brenntag
Amendments to IAS 16 (Property, Plant and Equipment) and IAS 41 (Agriculture) regarding account-
ing for bearer plants – not relevant to Brenntag
IAS 19 (Employee Benefits (revised 2011)) provides for the sharing of risks between employees and
employer to be taken into account when employees make their own contributions on the basis of the
formal terms of a plan. This may lead to a reduction in the present value of the benefit obligation.
Provided that the contributions are independent of the number of years of service, the amendment to
IAS 19 leads to an option permitting the full amount of such contributions paid by employees to be
taken into account in the present value of the defined benefit obligation.
C O N S O L I D A T E D F I N A N C I A L S T A T E M E N T S
Notes
A N N U A L R E P O R T 2 0 1 5 – B R E N N T A G A G 1 5 1D
fu
rt
he
r
in
fo
rm
at
io
nf
in
an
ci
al
s
ta
te
me
nt
s
C
D

The amendments to IFRS 11 (Joint Arrangements) regarding the acquisition of an interest in a joint
operation clarify that the acquisition of an interest, or of an additional interest, in a joint operation
that constitutes a business is a business combination in accordance with IFRS 3 and therefore the
rules set out in IFRS 3 are required to be applied to the extent that they do not conflict with IFRS 11.
In cases where additional interests are acquired and joint control is retained, previously held interests
in the same joint operation are not remeasured.
The amendments to IAS 16 (Property, Plant and Equipment) and IAS 38 (Intangible Assets) regarding
acceptable methods of depreciation and amortization clarify that depreciation of items of property,
plant and equipment may not be calculated on the basis of revenues from the sale of goods manufac-
tured using those assets. Revenue is presumed to be an inappropriate basis for amortizing an intan-
gible asset, except in circumstances where the rights embodied in that intangible asset are expressed
directly as a measure of revenue (as is the case for rights to a product which end when a specific rev-
enue threshold is achieved) or when revenue and the consumption of the economic benefits of the
intangible asset are highly correlated. It is also clarified that a fall in the sales price of goods manufac-
tured and services provided using property, plant and equipment and intangible assets may be an
indication that those items of property, plant and equipment and intangible assets are impaired.
The amendments to IAS 1 (Presentation of Financial Statements) made in connection with the Disclo-
sure Initiative are intended to ensure that much more emphasis is placed on the materiality concept.
The objective of the clarifications is to free the IFRS financial statements from immaterial information
and to give more prominence to relevant information.
The annual improvements to IFRSs contain a number of minor amendments to various standards that
are intended to clarify the content of the standards and eliminate any existing inconsistencies.
The aforementioned revised standards and annual improvements to IFRSs do not have a material
effect on the presentation of the Group’s net assets, financial position and results of operations.
Probable first-time adoption in 2018:
IFRS 15 (Revenue from Contracts with Customers) IFRS 9 (Financial Instruments)
C O N S O L I D A T E D F I N A N C I A L S T A T E M E N T S
Notes
A N N U A L R E P O R T 2 0 1 5 – B R E N N T A G A G1 5 2

The new IFRS 15 (Revenue from Contracts with Customers) provides new rules on accounting for rev-
enue and replaces IAS 18 (Revenue) and IAS 11 (Construction Contracts). Revenue is measured at the
amount of consideration the entity expects to receive in exchange for the goods or services provided.
The transfer of risks and rewards is no longer the deciding factor for recognizing revenue. Revenue is
required to be recognized when the customer obtains control of the agreed goods or services and
can obtain benefits from them. The new IFRS 15 provides a five-step model for recognizing revenue:
(i.) Identify the contract(s) with a customer
(ii.) Identify the separate performance obligations
(iii.) Determine the transaction price
(iv.) Allocate the transaction price to the separate performance obligations
(v.) Recognize revenue when (or as) the entity satisfies a performance obligation
IFRS 9 (Financial Instruments) sets out new rules on the accounting for and measurement of financial
assets in particular. This includes the requirement to recognize expected losses as well as incurred
losses in future when accounting for impairments of financial assets accounted for at amortized cost.
In addition, the rules governing hedge accounting have been completely revised. The aim of the new
rules is to ensure that hedge accounting more closely reflects the entity’s economic risk management.
Brenntag is currently examining the effects of the new standards and expects this examination to be
completed in the next 18 months. At present, it is, however, not yet possible to make a sufficiently
reliable assessment of the effects of the new standards on the presentation of the Group’s net assets,
financial position and results of operations.
The amendments to IFRS 10 (Consolidated Financial Statements) and IAS 28 (Investments in Associates
and Joint Ventures) regarding an inconsistency between the standards have been postponed for an
indefinite period.
In addition to the above standards that had been issued by the end of 2015, the new IFRS 16 (Leases)
was issued in January 2016. If endorsed by the European Union, it will be effective from January 1, 2019.
Under the new rules, lessees will be required to recognize all leases in the balance sheet in the form
of a right-of-use asset and a corresponding lease liability. In the income statement, leases will in all
cases be presented as a financing transaction, i.e. the right-of-use asset will usually have to be depre-
ciated on a straight-line basis and the lease liability adjusted using the effective interest method.
Only leases with a total term of up to twelve months and leases of low-value assets are exempt from
recognition in the balance sheet. Lessees may elect to account for these in a similar way to the former
operating leases.
An exact quantification of the effects on the presentation of the Group´s net assets, financial position
and results of operations is not yet available at the present time.
C O N S O L I D A T E D F I N A N C I A L S T A T E M E N T S
Notes
A N N U A L R E P O R T 2 0 1 5 – B R E N N T A G A G 1 5 3D
fu
rt
he
r
in
fo
rm
at
io
nf
in
an
ci
al
s
ta
te
me
nt
s
C
D

SCOPE OF CONSOLIDATION
As at December 31, 2015, the consolidated financial statements include Brenntag AG and 27 domestic
(Dec. 31, 2014: 26) and 194 foreign (Dec. 31, 2014: 179) consolidated subsidiaries including structured
entities.
The table below shows the changes in the number of consolidated companies including structured
entities:
Dec. 31, 2014 Additions Disposals Dec. 31, 2015
Domestic consolidated companies 27 1 – 28
Foreign consolidated companies 179 29 14 194
Total consolidated companies 206 30 14 222
c.12 changes in scope of consolidation
The additions relate to entities acquired in business combinations accounted for under IFRS 3.
The disposals result from mergers and from the liquidation of companies no longer operating.
Five associates (Dec. 31, 2014: five) are accounted for using the equity method.
A full list of shareholdings for the Brenntag Group in accordance with Section 313, para. 2 of the
German Commercial Code (HGB) can be found in the Annex to the Notes.
Regulatory restrictions already existing in Venezuela and the further changes made in February 2016
limit the ability of our Venezuelan subsidiary to distribute dividends and to make certain other payments
to Brenntag Group companies. These currency transfer restrictions affect net assets totalling about
EUR 31 million as at December 31, 2015 (Dec. 31, 2014: about EUR 19 million), of which EUR 14.1 mil-
lion as at December 31, 2015 relates to cash and cash equivalents (Dec. 31, 2014: EUR 5.3 million).
In the case of three subsidiaries where Brenntag does not hold the majority of the voting rights, it
nevertheless has the power to direct the relevant activities. The structured entities individually listed
in the List of Shareholdings in accordance with Section 313, para. 2 of the German Commercial Code
(HGB) are a leasing company, a logistics company and a sales company.
BUSINESS COMBINATIONS IN ACCORDANCE WITH IFRS 3
In early March 2015, Brenntag closed its acquisitions of all shares in Fred Holmberg & Co AB, head-
quartered in Malmö, Sweden, and LIONHEART CHEMICAL ENTERPRISES (PROPRIETARY) LIMITED, head-
quartered in Benoni near Johannesburg, South Africa.
Fred Holmberg & Co AB, Sweden, is focused on the distribution of chemicals in Scandinavia and also
provides efficient mixing and blending activities. The main site in Kalmar in the southwest of Sweden
has modern filling facilities and direct access to the port. The acquisition combines Fred Holmberg &
Co AB’s cost-efficient logistics set-up with Brenntag’s comprehensive market coverage in Scandinavia.
C O N S O L I D A T E D F I N A N C I A L S T A T E M E N T S
Notes
A N N U A L R E P O R T 2 0 1 5 – B R E N N T A G A G1 5 4

LIONHEART CHEMICAL ENTERPRISES (PROPRIETARY) LIMITED, South Africa, is a specialty distributor in
the South African market operating mainly in the food & beverage sector. Through this acquisition,
Brenntag is strengthening its position in the South African chemical distribution market.
In May 2015, all shares were acquired in Spanish chemicals distributor Quimicas Meroño, S.L. based
near Cartagena. The company offers its industrial customers logistics, blending and storage services.
This acquisition brings Brenntag additional growth opportunities, especially in key industry sectors
such as food and oil & gas. Brenntag also benefits from the company’s strong capabilities in value-
added services and blends.
In early November 2015, Brenntag completed its acquisition of 100 % of the shares in Parkoteks
Kimya Sanayi ve Ticaret Anonim Şirketi (Parkoteks) based in Istanbul, Turkey. Parkoteks markets
specialty chemicals with particular focus on the personal care sector. Established in 1989, Parkoteks
has grown strongly and benefits from long-term and exclusive partnerships with world-leading
specialty chemicals manufacturers, enabling the company to offer its customers a wide range of
specialty ingredients.
In early December 2015, Brenntag acquired a 51 % interest in chemicals distributor Trychem FZCO in
Dubai, United Arab Emirates (UAE). In an initial step, Brenntag will hold 51 % and Tri Star Transport LLC
and JRA Holding together 49 %. This partnership offers sizeable synergies combining Trychem’s
impressive local knowledge and service capability with Brenntag’s extensive portfolio of global
accounts and suppliers operating within the region.
In December 2015, Brenntag significantly expanded its lubricants business in North America by
acquiring two leading distributors, J.A.M. Parent Company, LLC and related entities (J.A.M.), headquar-
tered in Houston, Texas, and BWE, LLC and related entities (G.H. Berlin-Windward), headquartered in
East Hartford, Connecticut. J.A.M. and G.H. Berlin-Windward serve a broad range of customer indus-
tries across the entire lubricant supply chain. Both companies offer integrated product and service
solutions focused on a wide range of lubricants serving industrial, commercial, automotive and marine
end markets throughout the Gulf Coast, Texas and the northeast United States. Both acquisitions are a
significant investment in rebalancing Brenntag’s industry mix in North America and complement our
existing business in the less volatile lubricants market.
In addition, in late December 2015, Brenntag completed the acquisition of TAT Petroleum Pte Ltd and
related entities (TAT Group), a distributor of industrial chemicals, based in Singapore, Republic of
Singapore. The TAT Group has a strong market position, an excellent reputation and a presence in
several Asian countries. The company operates one of the most attractive distribution sites in a prime
location in Singapore, with large warehouses as well as modern blending and repackaging facilities
operating to HSE standards that are a perfect fit with Brenntag’s principles. What is more, Singapore is
the world’s second-largest port and offers access to the chemical industry zone Jurong Island, making
it a preferred hub location.
C O N S O L I D A T E D F I N A N C I A L S T A T E M E N T S
Notes
A N N U A L R E P O R T 2 0 1 5 – B R E N N T A G A G 1 5 5D
fu
rt
he
r
in
fo
rm
at
io
nf
in
an
ci
al
s
ta
te
me
nt
s
C
D
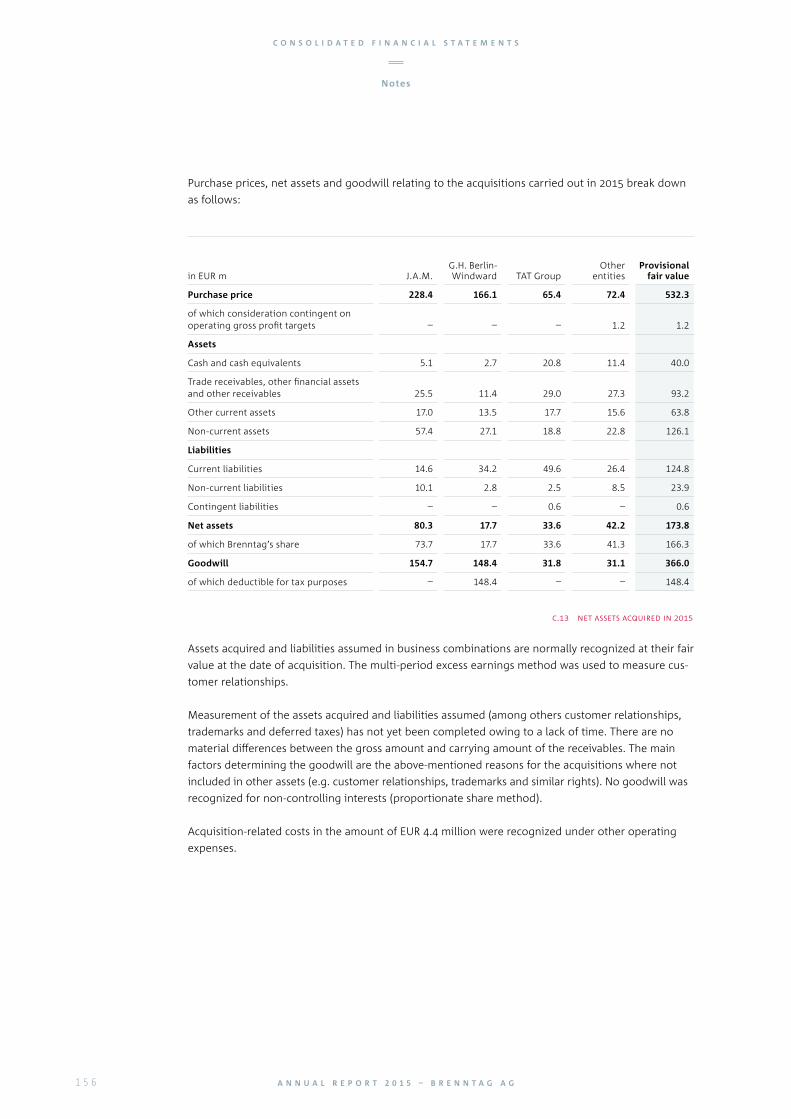
in EUR m J.A.M.G.H. Berlin- Windward TAT Group
Other entities
Provisional fair value
Purchase price 228.4 166.1 65.4 72.4 532.3
of which consideration contingent on operating gross profit targets – – – 1.2 1.2
Assets
Cash and cash equivalents 5.1 2.7 20.8 11.4 40.0
Trade receivables, other financial assets and other receivables 25.5 11.4 29.0 27.3 93.2
Other current assets 17.0 13.5 17.7 15.6 63.8
Non-current assets 57.4 27.1 18.8 22.8 126.1
Liabilities
Current liabilities 14.6 34.2 49.6 26.4 124.8
Non-current liabilities 10.1 2.8 2.5 8.5 23.9
Contingent liabilities – – 0.6 – 0.6
Net assets 80.3 17.7 33.6 42.2 173.8
of which Brenntag’s share 73.7 17.7 33.6 41.3 166.3
Goodwill 154.7 148.4 31.8 31.1 366.0
of which deductible for tax purposes – 148.4 – – 148.4
c.13 net assets acquired in 2015
Assets acquired and liabilities assumed in business combinations are normally recognized at their fair
value at the date of acquisition. The multi-period excess earnings method was used to measure cus-
tomer relationships.
Measurement of the assets acquired and liabilities assumed (among others customer relationships,
trademarks and deferred taxes) has not yet been completed owing to a lack of time. There are no
material differences between the gross amount and carrying amount of the receivables. The main
factors determining the goodwill are the above-mentioned reasons for the acquisitions where not
included in other assets (e.g. customer relationships, trademarks and similar rights). No goodwill was
recognized for non-controlling interests (proportionate share method).
Acquisition-related costs in the amount of EUR 4.4 million were recognized under other operating
expenses.
Purchase prices, net assets and goodwill relating to the acquisitions carried out in 2015 break down
as follows:
C O N S O L I D A T E D F I N A N C I A L S T A T E M E N T S
Notes
A N N U A L R E P O R T 2 0 1 5 – B R E N N T A G A G1 5 6

Since their acquisition by Brenntag, the business units acquired in 2015 have generated the following
sales and the following profit after tax:
in EUR m J.A.M.G.H. Berlin- Windward TAT Group
Other entities
Provisional fair value
Trademarks
Carrying amount 6.5 3.2 – 0.1 9.8
Annual amortization 1.3 0.6 – 0.0 1.9
Customer relationships and similar rights
Carrying amount 21.0 18.8 11.7 12.5 64.0
Annual amortization 7.5 6.7 3.6 3.8 21.6
Software, licences and similar rights
Carrying amount – – 0.1 1.8 1.9
Annual amortization – – 0.0 0.6 0.6
c.14 intangible assets acquired
Carrying amounts and annual amortization of the intangible assets contained in non-current assets,
in each case at the exchange rate on the acquisition date, break down as follows:
in EUR m J.A.M. G.H. Berlin- Windward TAT Group
Other entities Total
Sales 15.7 10.1 – 89.1 114.9
Profit after tax 0.0 0.4 – 3.4 3.8
c.15 sales and profit after tax of the businesses acquired since acquisition
If the above-mentioned business combinations had taken place with effect from January 1, 2015, sales
of about EUR 11,178 million would have been reported for the Brenntag Group in the reporting
period. Profit after tax would have been about EUR 390 million.
C O N S O L I D A T E D F I N A N C I A L S T A T E M E N T S
Notes
A N N U A L R E P O R T 2 0 1 5 – B R E N N T A G A G 1 5 7D
fu
rt
he
r
in
fo
rm
at
io
nf
in
an
ci
al
s
ta
te
me
nt
s
C
D

Goodwill from the business combinations conducted in 2014 and 2015 changed as follows:
in EUR m J.A.M.
G.H. Berlin-
Windward TAT GroupOther
entities Goodwill
Dec. 31, 2014 – – – 69.3 69.3
Exchange rate differences 0.9 0.7 – 14.9 16.5
Business combinations in 2015 154.7 148.4 31.8 31.1 366.0
Adjustments in the measurement period – – – –2.4 –2.4
Dec. 31, 2015 155.6 149.1 31.8 112.9 449.4
c.17 changes in goodwill
in EUR m Provisional
fair value AdjustmentsFinal
fair value
Purchase price 110.1 – 1.4 108.7
of which consideration contingent on operating gross profit targets 5.1 – 5.1
Assets
Cash and cash equivalents 5.3 – 5.3
Trade receivables, other financial assets and other receivables 31.9 – 31.9
Other current assets 11.2 – 0.4 10.8
Non-current assets 34.1 1.7 35.8
Liabilities
Current liabilities 33.7 0.3 34.0
Contingent liabilities 8.5 – 0.6 7.9
Net assets 40.3 1.0 41.3
Goodwill 69.8 – 2.4 67.4
of which deductible for tax purposes 44.2 – 0.8 43.4
c.16 net assets acquired in 2014
The measurement of the assets and liabilities of the acquired business of Kemira Water Danmark A / S,
based in Copenhagen, Denmark, Gafor Distribuidora S.A., headquartered in São Paulo, Brazil, Philchem,
Inc., based in Houston, Texas, USA, CHIMAB S.p.A., based in Campodarsego near Padua, Italy, and
SURTIQUIMICOS S.A., based in Bogotá, Columbia, which were all acquired in 2014, has been completed.
The purchase prices, net assets acquired and goodwill were adjusted as follows in the measurement
period:
C O N S O L I D A T E D F I N A N C I A L S T A T E M E N T S
Notes
A N N U A L R E P O R T 2 0 1 5 – B R E N N T A G A G1 5 8

The net cash outflow in 2015 resulting from business combinations has been determined as follows:
in EUR m
Cost of acquisition in 2015 532.3
Less purchase price components not yet paid 1.4
Less cash and cash equivalents acquired 40.0
Plus subsequent purchase price payments for business combinations from prior years 9.9
Payments to acquire consolidated subsidiaries and other business units 500.8
c.18 reconciliation of acquisition costs to payments to acquire consolidated subsidiaries and other business units
CONSOLIDATION METHODS
The consolidated financial statements include the financial statements – prepared according to uni-
form accounting policies – of Brenntag AG and all entities controlled by Brenntag. This is the case
when the following conditions are met:
Brenntag has decision-making power over the relevant activities of the other entity.
Brenntag has exposure, or rights, to variable returns from its involvement with the other entity.
Brenntag has the ability to use its decision-making power over the relevant activities of the other
entity to affect the amount of the variable returns of the other entity.
Control may be based on voting rights or arise from other contractual arrangements. Accordingly, the
scope of consolidation includes, in addition to entities in which Brenntag AG directly or indirectly con-
trols the majority of voting rights, structured entities which are controlled as a result of contractual
arrangements.
Inclusion in the consolidated financial statements commences at the date on which control is
obtained and ends when control is lost.
Acquisitions are accounted for using the acquisition method in accordance with IFRS 3. The cost of an
acquired business unit is considered to be the fair value of the assets given. The acquisition-related
costs are recognized as an expense. Contingent consideration is recognized as a liability at the acqui-
sition-date fair value when determining the cost. If Brenntag gains control but does not acquire 100 %
of the shares, the corresponding non-controlling interest is recognized.
However, if, owing to contractual agreements, it is virtually certain at the acquisition date that further
shares will be acquired at a fixed price, or if non-controlling shareholders receive the right to tender
their shares at any time at a fixed price, appropriate liabilities are recognized for these shares.
Non-controlling interests are then not presented as the seller does not retain significant risks and
rewards from the shares. If payment of a variable price has been agreed for the purchase of further
shares instead of a fixed price, and, as a result, the seller still retains significant risks and rewards from
the shares, corresponding liabilities are also recognized for these shares, but these liabilities reduce
equity and corresponding non-controlling interests are presented.
C O N S O L I D A T E D F I N A N C I A L S T A T E M E N T S
Notes
A N N U A L R E P O R T 2 0 1 5 – B R E N N T A G A G 1 5 9D
fu
rt
he
r
in
fo
rm
at
io
nf
in
an
ci
al
s
ta
te
me
nt
s
C
D

Identifiable assets, liabilities and contingent liabilities of an acquiree that are eligible for recognition
are generally measured at their fair value at the transaction date, irrespective of the share of any
non-controlling interests. Any remaining differences between cost and the share of the net assets
acquired are recognized as goodwill.
In the event of an acquisition in stages which leads to control of a company being obtained, or in the
event of a share sale involving a loss of control, the shares already held in the first case or the remain-
ing shares in the second case are measured at fair value through profit or loss. Acquisitions or dispos-
als of shares which have no effect on existing control are recognized in equity.
Receivables, liabilities, expenses, income and intercompany profits or losses within the Brenntag Group
are eliminated.
Associates and joint ventures of the Brenntag Group where Brenntag has significant influence or joint
control are accounted for using the equity method. Significant influence is generally considered to
exist when Brenntag AG holds between 20 % and 50 % of the voting rights either directly or indirectly.
The same consolidation policies apply to companies accounted for using the equity method as to con-
solidated companies, whereby recognized goodwill is contained in the carrying amount of invest-
ments accounted for using the equity method. Brenntag’s share of the profit / loss after tax of the
companies accounted for using the equity method is recognized in the income statement.
The accounting policies of the companies accounted for using the equity method were, as far as nec-
essary, adjusted in line with the accounting policies of Brenntag.
CURRENCY TRANSLATION
Foreign currency receivables and liabilities in the single-entity financial statements are stated on ini-
tial recognition at the spot exchange rate at the date of the transaction. At the reporting or settle-
ment date, foreign currency receivables and liabilities are translated at the closing rate. The resulting
differences are recognized in profit or loss.
The items contained in the financial statements of a Group company are measured on the basis of the
currency of the relevant primary economic environment in which the company operates (functional
currency). The presentation currency of the Brenntag Group is the euro.
The single-entity financial statements of the companies whose functional currency is not the euro are
translated into euros as follows:
Assets and liabilities are translated at the closing rate, income and expense at the annual average
rate. Any differences resulting from currency translation are recognized in other comprehensive
income. Goodwill and fair value adjustments resulting from the acquisition of foreign companies are
assigned to the foreign company and also translated at the closing rate.
For some companies in Latin America and in the Asia Pacific region, the functional currency is the
US dollar and not the local currency. Non-monetary items, primarily property, plant and equipment,
goodwill and other intangible assets as well as environmental provisions, are translated from the
local currency into US dollars using the exchange rate at the transaction date. Monetary items are
C O N S O L I D A T E D F I N A N C I A L S T A T E M E N T S
Notes
A N N U A L R E P O R T 2 0 1 5 – B R E N N T A G A G1 6 0

translated at the closing rate. All income and expenses are translated at the average exchange rate for
the reporting period with the exception of depreciation and amortization, impairment losses and
reversals of impairment losses as well as income and expenses incurred in connection with environ-
mental provisions. These are translated at the same exchange rates as the underlying assets and liabil-
ities. The resulting foreign currency differences are recognized in profit or loss. After translation of
the items in the single-entity financial statements into the functional currency, the US dollar, the same
method is used for translation from US dollars into the Group currency, the euro, as for companies
whose functional currency is the local currency.
The single-entity financial statements of foreign companies accounted for using the equity method
are translated using the same principles.
The euro exchange rates of major currencies changed as follows:
EUR 1 = currencies
Closing rate Average rate
Dec. 31, 2015 Dec. 31, 2014 2015 2014
Canadian dollar (CAD) 1.5116 1.4063 1.4186 1.4661
Swiss franc (CHF) 1.0835 1.2024 1.0679 1.2146
Chinese yuan renminbi (CNY) 7.0608 7.5358 6.9733 8.1857
Danish crown (DKK) 7.4626 7.4453 7.4587 7.4548
Pound sterling (GBP) 0.7340 0.7789 0.7258 0.8061
Polish zloty (PLN) 4.2639 4.2732 4.1841 4.1843
Swedish crown (SEK) 9.1895 9.3930 9.3535 9.0985
US dollar (USD) 1.0887 1.2141 1.1095 1.3285
c.19 exchange rates of main currencies
C O N S O L I D A T E D F I N A N C I A L S T A T E M E N T S
Notes
A N N U A L R E P O R T 2 0 1 5 – B R E N N T A G A G 1 6 1D
fu
rt
he
r
in
fo
rm
at
io
nf
in
an
ci
al
s
ta
te
me
nt
s
C
D
ACCOUNTING AND MEASUREMENT POLICIES
REVENUE RECOGNITION
Revenue from the sale of goods is only recognized – net of value-added tax, cash discounts, discounts
and rebates – if the following conditions are met:
The significant risks and rewards of ownership of the goods have been transferred to the buyer.
Brenntag retains neither continuing managerial involvement to the degree usually associated with
ownership nor effective control over the goods sold.
The amount of revenue can be measured reliably.
It is probable that the economic benefits associated with the transaction will flow to Brenntag.
The costs incurred or to be incurred in respect of the transaction can be measured reliably.
This is generally the case when the goods have been collected by the customer or have been dis-
patched by Brenntag or by a third party.
Revenue arising from service business is recognized by reference to the stage of completion of the
transaction at the reporting date, provided that all the following criteria are met:
The amount of revenue can be measured reliably.
It is sufficiently probable that the economic benefits associated with the transaction will flow to
Brenntag.
The stage of completion of the transaction at the reporting date can be measured reliably.
The costs incurred for the transaction and the cost to complete the transaction can be measured
reliably.
If the above-mentioned criteria are not met, revenue from service business is only recognized to the
extent of the expenses recognized that are recoverable.
Interest income is recognized as the interest accrues using the effective interest method.
Dividend income is recognized when the right to receive payment is established.
CASH AND CASH EQUIVALENTS
Cash and cash equivalents include cash on hand, cheques and deposits held with banks with an origi-
nal term of three months or less.
TRADE RECEIVABLES, OTHER RECEIVABLES AND OTHER FINANCIAL ASSETS
Financial assets are divided into the following categories in line with the categories stipulated in IAS 39:
Loans and receivables
Available-for-sale financial assets
Financial assets at fair value through profit and loss
C O N S O L I D A T E D F I N A N C I A L S T A T E M E N T S
Notes
A N N U A L R E P O R T 2 0 1 5 – B R E N N T A G A G1 6 2

The financial assets are subsequently measured at amortized cost or at fair value 2) depending on
which of the above categories they are allocated to. In determining the fair value, IFRS 13 provides
for a three-level hierarchy which reflects the extent to which the inputs used to determine fair value
are market-based:
Level 1: Fair value determined using quoted or market prices in an active market
Level 2: Fair value determined using quoted or market prices in an active market for similar
financial assets or liabilities, or other measurement methods for which significant inputs used
are based on observable market data
Level 3: Fair value determined using measurement methods for which significant inputs used
are not based on observable market data
Cash and cash equivalents, trade receivables, other receivables and receivables included in other
financial assets are classified into the loans and receivables category. They are measured at fair value
plus transaction costs on initial recognition and carried at amortized cost in subsequent periods.
If there are objective indications that financial assets classified as loans and receivables are not fully
collectible, a specific valuation allowance reflecting the credit risk is recognized in profit or loss.
Furthermore, country-specific collective valuation allowances are recognized for receivables in the
same credit risk classes. Credit risk is based primarily on the extent to which the receivables are past
due. The impairment losses are always posted to an allowance account in the balance sheet. If a
receivable is uncollectible, the gross amount and the impairment loss are both derecognized.
Securities and shares in companies where Brenntag does not have at least significant influence pre-
sented as other financial assets are classified as available-for-sale financial assets. They are measured
on initial recognition at fair value plus transaction costs and subsequently at fair value. If these securi-
ties or company shares are traded in an active market, the fair value is the published quoted price at
the reporting date (Level 1). If there is no active market, the fair value is established by using a suit-
able valuation technique (Level 2 or 3). Changes in fair value are recognized directly in equity in the
revaluation reserve.
If impairments are permanent, the income and expenses previously posted to the revaluation reserve
are reversed without affecting profit or loss. Any additional impairment losses are recognized directly
as expense. If the reasons for the impairment no longer exist, the impairment losses are reversed to
profit or loss, except for impairment losses on equity instruments.
Derivative financial instruments presented as other financial assets which are not included in cash
flow hedge accounting are classified as financial assets at fair value through profit or loss. They are
measured at fair value on initial recognition and in subsequent periods. Changes in fair value are
recognized directly in profit or loss.
No use is made of the option to designate non-derivative financial assets and liabilities as at fair value
through profit or loss on their initial recognition.
2) Fair value is defined as the price that would be received to sell an asset or paid to transfer a liability in an orderly transaction between independent market participants at the measurement date.
C O N S O L I D A T E D F I N A N C I A L S T A T E M E N T S
Notes
A N N U A L R E P O R T 2 0 1 5 – B R E N N T A G A G 1 6 3D
fu
rt
he
r
in
fo
rm
at
io
nf
in
an
ci
al
s
ta
te
me
nt
s
C
D

The fair values of foreign exchange forward transactions and foreign exchange swaps are established
by comparing forward rates and discounted to the present value (Level 2). The fair values of interest
rate swaps are determined using the discounted cash flow method on the basis of current interest
curves allowing for the non-performance risk (Level 2).
Non-derivative financial assets are initially recognized at the respective settlement date. Derivative
financial instruments are recognized in the balance sheet when Brenntag becomes a party to the con-
tractual provisions of that instrument.
Financial assets are derecognized if the contractual rights to the cash flows from the financial asset
have expired or have been transferred and Brenntag has transferred substantially all the risks and
rewards of ownership.
INVENTORIES
Inventories mainly comprise merchandise. They are initially recognized at cost. Production costs for
the inventories produced through further processing are also capitalized.
Inventories are subsequently measured in accordance with IAS 2 at the lower of cost (on the basis of
the average cost formula) and net realizable value. Net realizable value is the estimated selling price
in the ordinary course of business less the estimated costs of completion and the estimated costs nec-
essary to make the sale. Net realizable value also reflects effects of obsolescence or reduced market-
ability. Earlier valuation allowances on inventories are reversed if the net realizable value of the inven-
tories increases again.
NON-CURRENT ASSETS HELD FOR SALE
In accordance with IFRS 5, non-current assets held for sale are recognized separately as such if their
carrying amount will be recovered principally through a sale transaction rather than through continu-
ing use. Fair value is determined on the basis of the best possible use. They are measured at the
lower of their amortized carrying amount and fair value less costs of disposal. Non-current assets
held for sale are no longer depreciated.
PROPERTY, PLANT AND EQUIPMENT
Property, plant and equipment is carried at cost of acquisition or construction, and, except for land,
depreciated over its estimated useful life on a straight-line basis. If major components of an item of
property, plant and equipment have different useful lives, these components are accounted for sepa-
rately and depreciated over their respective useful lives.
Acquisition costs include all expenditure directly attributable to the acquisition.
C O N S O L I D A T E D F I N A N C I A L S T A T E M E N T S
Notes
A N N U A L R E P O R T 2 0 1 5 – B R E N N T A G A G1 6 4

The cost of self-constructed property, plant and equipment comprises direct material and construc-
tion costs, appropriate allocations of material and construction overheads and an appropriate share
of the depreciation expense on assets used in construction. Expenses for company pension plans and
discretionary employee benefits that are attributable to construction are recognized in the construc-
tion costs if they can be directly allocated.
In accordance with IAS 23, borrowing costs for assets with a production time of at least twelve months
up to the date of completion (qualifying assets) are capitalized as part of the cost of construction.
In accordance with IAS 16, future costs for any restoration obligation are recognized as an increase in
the cost of acquisition or construction of the respective asset and a corresponding provision is estab-
lished at the time of acquisition or construction of the item of property, plant and equipment. The
restoration obligation is generally determined on the basis of estimates of the future discounted cash
flows. The additional cost of acquisition or construction is depreciated over the useful life of the asset
and the discounting of the corresponding provision is unwound over the useful life of the asset.
Leased assets classified as finance leases in accordance with IAS 17 are measured at the lower of their
fair value and the present value of the minimum lease payments at the inception of the lease. They
are depreciated over their estimated useful lives or – provided the transfer of ownership is not
probable – the contract term, whichever is shorter. The present values of future lease payments for
assets recognized as finance leases are recognized as financial liabilities.
In accordance with IAS 20, government grants and assistance for investments are deducted from the
related asset.
Depreciation charges on property, plant and equipment are allocated to the relevant function in the
income statement.
When items of property, plant and equipment are sold, the difference between the net proceeds and
the carrying amount of the respective asset is recognized as a gain or loss in other operating income
or expenses.
Assets are depreciated over the following useful lives:
Useful life
Land use rights 40 to 50 years
Buildings 15 to 50 years
Installations and building improvements 8 to 20 years
Technical equipment and machinery 3 to 20 years
Vehicles 5 to 8 years
Other equipment, operating and office equipment 2 to 10 years
c.20 useful lives of property, plant and equipment
C O N S O L I D A T E D F I N A N C I A L S T A T E M E N T S
Notes
A N N U A L R E P O R T 2 0 1 5 – B R E N N T A G A G 1 6 5D
fu
rt
he
r
in
fo
rm
at
io
nf
in
an
ci
al
s
ta
te
me
nt
s
C
D

Useful life
Concessions, industrial and similar rights as well as software and trademarks with definite useful lives 3 to 10 years
Customer relationships and similar rights 3 to 15 years
c.21 useful lives of intangible assets
INTANGIBLE ASSETS
Intangible assets include customer relationships and similar rights purchased, the “Brenntag” trade-
mark, other trademarks, software, concessions and similar rights as well as goodwill from the acquisi-
tion of consolidated subsidiaries and other business units.
Intangible assets acquired through business combinations are measured on initial recognition at their
acquisition-date fair value.
Separately acquired intangible assets are carried at cost.
Acquired software licenses are recognized at cost plus directly attributable costs incurred to acquire
and bring to use the specific software.
In addition to goodwill, the “Brenntag” trademark has an indefinite useful life as no assumption can be
made about its durability or the sustainability of its economic use. The other intangible assets are amor-
tized on a straight-line basis over their estimated useful lives. The following useful lives are assumed:
Amortization charges on intangible assets are allocated to the relevant function in the income
statement.
IMPAIRMENT TESTING OF NON-CURRENT NON-FINANCIAL ASSETS
In accordance with IAS 36, non-current non-financial assets are tested for impairment whenever there
is an objective indication that the carrying amount may not be recoverable.
Assets that have an indefinite useful life and are, therefore, not subject to amortization are also tested
for impairment at least annually.
Impairment exists when the carrying amount of an asset exceeds the estimated recoverable amount.
Recoverable amount is the higher of fair value less costs of disposal and value in use.
Value in use is the present value of the future cash flows expected to be derived from an asset. If the
carrying amount is higher than the recoverable amount, the asset is written down to the recoverable
amount.
If the recoverable amount of an individual asset cannot be determined, the recoverable amount of
the cash-generating unit (CGU) to which this asset belongs is determined and compared with the car-
rying amount of the CGU.
C O N S O L I D A T E D F I N A N C I A L S T A T E M E N T S
Notes
A N N U A L R E P O R T 2 0 1 5 – B R E N N T A G A G1 6 6

Impairments, except for impairments of goodwill, are reversed as soon as the reasons for the impair-
ment no longer exist.
Goodwill is tested for impairment regularly, at least annually, after completion of the annual budget
process by comparing the carrying amount of the relevant cash-generating unit with its recoverable
amount.
For the goodwill impairment test, the operating segments of the segment reporting were identified
as relevant CGUs.
If the carrying amount of a segment exceeds the recoverable amount, an impairment exists in the
amount of the difference. In this case, the goodwill of the relevant segment would first be written
down. Any remaining impairment would be allocated to the segment assets in proportion to the net
carrying amounts of the assets at the reporting date. The carrying amount of an individual asset must
not be less than the highest of fair value less costs of disposal, value in use (in each case in as far as
they can be determined) and zero.
OTHER PROVISIONS
In accordance with IAS 37, other provisions are recognized when the Group has a present legal or con-
structive obligation towards third parties as a result of past events, it is more likely than not that an
outflow of resources will be required to settle the obligation, and the amount can be reliably estimated.
Non-current provisions are recognized at the present value of the expected outflow and their dis-
counting is unwound over the period until their expected utilization.
If the projected obligation declines as a result of a change in an estimate, the provision is reversed by
the corresponding amount and the resulting income is usually recognized in the function in which
the original charge was recognized.
Provisions in accordance with IFRS 2 are established for cash-settled, share-based payments. The long-
term, share-based remuneration programme based on virtual shares, the new Long-Term Incentive
Programme for the members of the Board of Management and the Long-Term Incentive Plan for Exec-
utives and Senior Managers are classified as cash-settled, share-based payments. Provisions are estab-
lished for the resulting obligations. The obligations are measured at fair value. They are recognized as
personnel expenses over the vesting period during which the beneficiaries acquire a vested right
(unconditional right). The fair value is remeasured at each reporting date and at the settlement date.
C O N S O L I D A T E D F I N A N C I A L S T A T E M E N T S
Notes
A N N U A L R E P O R T 2 0 1 5 – B R E N N T A G A G 1 6 7D
fu
rt
he
r
in
fo
rm
at
io
nf
in
an
ci
al
s
ta
te
me
nt
s
C
D

PROVISIONS FOR PENSIONS AND OTHER POST-EMPLOYMENT BENEFITS
The Group’s pension obligations comprise both defined contribution and defined benefit pension
plans.
The contributions to be paid into defined contribution pension plans are recognized directly as
expense. Provisions for pension obligations are not established as, in these cases, Brenntag has no
additional obligation apart from the obligation to pay the premiums.
In accordance with IAS 19, provisions are established for defined benefit plans, unless the plans are
multi-employer pension funds for which insufficient information is available. The obligations arising
from these defined benefit plans are determined using the projected unit credit method. The pro-
jected unit credit method determines the expected benefits to be paid after retirement taking
dynamic measurement parameters into account and spreads them over the entire length of service of
the employees participating in the plan. For this purpose, an actuarial valuation is obtained every
year. The actuarial assumptions for the discount rate, salary increase rate, pension trend, life expec-
tancy and cost increases for medical care used to calculate the defined benefit obligation are estab-
lished on the basis of the respective economic circumstances. The plan assets measured at fair value
are deducted from the present value of the defined benefit obligation (gross pension obligation). Plan
assets are assets where the claim to said assets has, in principle, been assigned to the beneficiaries.
This results in the net liability required to be recognized or the net asset required to be recognized.
The discount rate is determined by reference to market yields at the end of the reporting period on
fixed-rate senior corporate bonds. The currency and term of the corporate bonds taken as a basis are
consistent with the currency and estimated term of the post-employment benefit obligations.
Life expectancy is determined using the latest mortality tables.
The pension costs are made up of the three components:
Component Constituents Recognized in
Service cost - Current service cost- Past service cost incl. gains and losses from plan curtailments- Gains and losses from plan settlements
Personnel expenses
Net interest expense - Unwinding of discounting on defined pension obligation (DBO)- Interest income from plan assets
Interest expense
Remeasurements - Actuarial gains and losses on DBO (from experience adjust-ments and from changes in measurement parameters)
- Changes in value of plan assets not already contained in net interest expense
Other comprehensive income
c.22 pension cost components
As a result of the inclusion of the remeasurement components in other comprehensive income, the
balance sheet shows the full extent of the net obligation avoiding volatility in profit or loss which may
result in particular from changes in the calculation parameters.
Multi-employer defined benefit plans are treated as defined contribution plans when insufficient
information is available.
C O N S O L I D A T E D F I N A N C I A L S T A T E M E N T S
Notes
A N N U A L R E P O R T 2 0 1 5 – B R E N N T A G A G1 6 8

TRADE PAYABLES, FINANCIAL LIABILITIES AND OTHER LIABILITIES
Based on the categories under IAS 39, non-derivative liabilities reported as trade payables, financial
liabilities and other liabilities are classified as financial liabilities measured at amortized cost. They are
initially recognized at their fair value net of transaction costs incurred. They are subsequently carried
at amortized cost using the effective interest method.
Derivative financial instruments with negative fair values reported within financial liabilities are
accounted for and measured in the same way as derivative financial instruments with positive fair val-
ues reported within other financial assets.
Finance lease liabilities are stated at their amortized cost.
LIABILITIES RELATING TO ACQUISITION OF NON-CONTROLLING INTERESTS
Liabilities relating to the acquisition of non-controlling interests contain non-contingent and contin-
gent purchase price obligations to acquire non-controlling interests and liabilities arising from limited
partners’ rights to repayment of contributions.
They are recognized at their fair value (present value of the purchase price obligation) as a liability
not affecting profit or loss. Unwinding of discounting and changes in estimates of non-contingent
purchase price liabilities and liabilities arising from limited partners’ rights to repayment of contribu-
tions are recognized in profit or loss. Exchange rate-related changes are recognized within other com-
prehensive income if the liability is included in net investment hedge accounting.
DEFERRED TAXES AND CURRENT INCOME TAXES
Current income taxes for current and prior periods are recognized at the amount expected to be paid
to or recovered from the tax authorities.
Deferred taxes are determined in accordance with IAS 12 (Income Taxes). They arise from temporary
differences between the carrying amounts of assets and liabilities in the IFRS balance sheet and their
tax base, from consolidation adjustments and from tax loss carryforwards where it is likely that there
will be sufficient income in subsequent years for these loss carryforwards to be utilized.
Deferred tax assets are recognized to the extent that it is likely that future taxable profit will be avail-
able against which the temporary differences and unutilized loss carryforwards can be utilized.
No deferred taxes are recognized for the difference between the net assets and the tax base of sub-
sidiaries (outside basis differences) provided Brenntag is able to control the timing of the reversal of
the temporary difference and it is unlikely that the temporary difference will reverse in the foresee-
able future.
Deferred taxes for domestic companies are calculated on the basis of the combined income tax rate
of the German consolidated tax group of Brenntag AG of 32 % (2014: 32 %) for corporate income tax,
solidarity surcharge and trade income tax, and for foreign companies, at local tax rates. These are tax
rates which can be expected to apply on the basis of laws in the different countries that have been
enacted or substantially enacted at the reporting date.
C O N S O L I D A T E D F I N A N C I A L S T A T E M E N T S
Notes
A N N U A L R E P O R T 2 0 1 5 – B R E N N T A G A G 1 6 9D
fu
rt
he
r
in
fo
rm
at
io
nf
in
an
ci
al
s
ta
te
me
nt
s
C
D

Deferred tax assets and liabilities are netted against each other if they relate to the same tax author-
ity, the company has a legally enforceable right to set them off against each other and they mature in
the same period.
BOND WITH WARRANT UNITS
The bond with warrant units consists of the bond (Bond (with Warrants) 2022) and the warrant com-
ponents. Upon issue, these components were recognized separately at fair value, including transac-
tion costs.
The Bond (with Warrants) 2022 is classified as financial liabilities measured at amortized cost and in
subsequent periods will be measured at amortized cost using the effective interest method.
The warrants constitute equity as they entitle the holder to acquire a fixed number of Brenntag
shares at a specified strike price. Upon issue, they were therefore taken directly to additional paid-in
capital and recognized at fair value (warrant premium), including transaction costs. There will be no
subsequent measurement.
NET INVESTMENT HEDGES
When a net investment in a foreign operation is hedged (net investment hedge), exchange rate-related
changes in liabilities included in net investment hedge accounting, calculated on the effective portion,
are recognized within equity in the net investment hedge reserve. In the event of the sale of part or
all of the foreign operation, the amount previously presented in the net investment hedge reserve is
recognized in profit or loss.
CASH FLOW HEDGES
The hedge-effective portion of changes in the fair value of derivative financial instruments included in
cash flow hedge accounting is recognized within equity in the cash flow hedge reserve. Gains or losses
from the effective portion of these derivatives are only reclassified to the income statement when the
underlying hedged item is recognized in profit or loss. If the cash flows from a hedged item are no
longer expected, the accumulated gains or losses recognized in equity are reclassified to profit or loss
immediately. Ineffective portions of hedge accounting are recognized in profit or loss immediately.
ASSUMPTIONS AND ESTIMATES
Preparation of the consolidated financial statements requires the use of assumptions and estimates
which may affect the reported amounts of assets and liabilities and income and expenses. These
assumptions and estimates mainly relate to the calculation and discounting of cash flows when
impairment tests are performed, the probability of occurrence as well as interest rates and other meas-
urement parameters used to measure provisions, particularly for environmental risks and defined
benefit pension obligations, and the estimation of the amount of the purchase price obligation to
acquire the non-controlling interest in the Zhong Yung Group. Furthermore, assumptions are made as
to the realization of future tax benefits from loss carryforwards and to the useful lives of intangible
assets and property, plant and equipment.
C O N S O L I D A T E D F I N A N C I A L S T A T E M E N T S
Notes
A N N U A L R E P O R T 2 0 1 5 – B R E N N T A G A G1 7 0
If the WACC (weighted average cost of capital after taxes) taken as a basis for goodwill impairment
testing had been one percentage point higher, as in 2014, no impairment would have arisen. A 10 %
lower free cash flow, with all other conditions remaining the same, would, as in 2014, also not have
led to an impairment. A 20 % lower growth rate over the entire planning period, with all other condi-
tions remaining the same, would, as in 2014, also not have led to any impairment.
If the discount rates used to determine the environmental provisions had been one percentage point
higher or lower and all other conditions had remained the same, the provision would have decreased
by EUR 5.2 million (Dec. 31, 2014: EUR 4.7 million) or increased by EUR 5.9 million (Dec. 31, 2014:
EUR 5.3 million), respectively.
Sensitivity analyses of defined benefit pension obligations are described in the section “Provisions for
Pensions and Other Post-employment Benefits”.
The actual amounts may differ from the assumptions and estimates in individual cases. Adjustments
are recognized in profit or loss when estimates are revised.
CASH FLOW STATEMENT
The cash flow statement classifies cash flows by operating, investing and financing activities. The cash
provided by operating activities is determined using the indirect method on the basis of the profit / loss
after tax. Interest payments made and received, tax payments and dividends received are presented as
components of cash provided by operating activities. The effects of acquisitions of consolidated sub-
sidiaries and other business units as defined by IFRS 3 (Business Combinations) are eliminated from
the individual items of the cash flow statement and combined under cash flow from investing activi-
ties. Repayments of finance lease liabilities are presented as cash used for financing activities. Cash
and cash equivalents in the cash flow statement correspond to the cash and cash equivalents in the
balance sheet. The effect of exchange rate changes on cash and cash equivalents is shown separately.
SEGMENT REPORTING
Segment reporting under IFRS 8 (Operating Segments) is based on the management approach.
Reporting is based on the internal control and reporting information used by the top management to
assess segment performance and allocate resources.
C O N S O L I D A T E D F I N A N C I A L S T A T E M E N T S
Notes
A N N U A L R E P O R T 2 0 1 5 – B R E N N T A G A G 1 7 1D
fu
rt
he
r
in
fo
rm
at
io
nf
in
an
ci
al
s
ta
te
me
nt
s
C
D

CONSOLIDATED INCOME STATEMENT DISCLOSURES
1.) SALES
The sales of EUR 10,346.1 million (2014: EUR 10,015.6 million) mainly relates to the sale of goods.
Sales of EUR 0.8 million (2014: EUR 0.8 million) were generated with related parties.
2.) COST OF SALES
Cost of sales includes cost of materials and other operating expenses attributable to this line item.
Cost of materials amounts to EUR 8,024.4 million (2014: EUR 7,937.4 million). Cost of sales also
includes a net expense in the amount of EUR 4.3 million (2014: EUR 3.2 million) from valuation allow-
ances and reversals of valuation allowances on inventories.
3.) SELLING EXPENSES
Selling expenses include all direct selling and distribution costs as well as respective overheads
incurred in the reporting period and attributable directly or proportionately to this line item.
Rental and lease expenses for operating leases total EUR 118.1 million (2014: EUR 97.2 million), of
which EUR 0.6 million (2014: EUR 0.6 million) are for contingent rents. They are mainly presented
under selling expenses.
4.) ADMINISTRATIVE EXPENSES
Administrative expenses contain all costs of a general administrative nature provided they are not
attributable to other functions.
5.) OTHER OPERATING INCOME
in EUR m 2015 2014
Income from the disposal of non-current assets 4.5 3.6
Income from the reversal of liabilities and provisions no longer required 10.6 8.2
Income from receivables derecognized in prior periods 0.2 0.1
Miscellaneous operating income 30.1 31.2
Total 45.4 43.1
c.23 other operating income
C O N S O L I D A T E D F I N A N C I A L S T A T E M E N T S
Notes
A N N U A L R E P O R T 2 0 1 5 – B R E N N T A G A G1 7 2

6.) OTHER OPERATING EXPENSES
7.) INTEREST INCOME
Interest income in the amount of EUR 3.3 million (2014: EUR 3.0 million) is interest income from third
parties.
8.) INTEREST EXPENSE
in EUR m 2015 2014
Valuation allowances on trade receivables – 10.2 – 7.3
Valuation allowances on other receivables – – 0.1
Income from the reversal of valuation allowances on trade receivables 4.8 3.4
Income from the reversal of valuation allowances on other receivables 0.1 0.1
Losses on the disposal of non-current assets – 0.6 – 0.7
Miscellaneous operating expenses – 16.0 – 11.2
Total – 21.9 – 15.8
c.24 other operating expenses
in EUR m 2015 2014
Interest expense on liabilities to third parties – 65.4 – 66.9
Expense from the fair value measurement of interest rate swaps – 3.3 – 2.8
Net interest expense on defined benefit pension plans – 3.4 – 3.8
Interest expense on other provisions – 1.8 – 1.9
Interest expense on finance leases – 0.9 – 1.0
Total – 74.8 – 76.4
c.25 interest expense
C O N S O L I D A T E D F I N A N C I A L S T A T E M E N T S
Notes
A N N U A L R E P O R T 2 0 1 5 – B R E N N T A G A G 1 7 3D
fu
rt
he
r
in
fo
rm
at
io
nf
in
an
ci
al
s
ta
te
me
nt
s
C
D

10.) OTHER NET FINANCE COSTS
in EUR m 2015 2014
Exchange-rate gain / loss on foreign currency receivables and liabilities 3.1 – 9.5
Exchange-rate loss on foreign currency derivatives – 24.5 – 7.4
Miscellaneous other net finance income / finance costs 1.6 – 0.8
Total – 19.8 – 17.7
c.27 other net finance costs
9.) CHANGE IN LIABILITIES RELATING TO ACQUISITION OF NON-CONTROLLING INTERESTS RECOGNIZED IN PROFIT OR LOSS
in EUR m 2015 2014
Unwinding of discounting of liabilities relating to acquisition of non-controlling interests – 7.5 – 1.1
Change in estimate of liabilities relating to acquisition of non-controlling interests – 15.9 7.2
Change in liabilities recognized in profit or loss arising from limited partners’ rights to repayment of contributions – 1.5 – 2.1
Total – 24.9 4.0
c.26 change in liabilities relating to acquisition of non-controlling interests recognized in profit or loss
For further information, please refer to Note 28.).
C O N S O L I D A T E D F I N A N C I A L S T A T E M E N T S
Notes
A N N U A L R E P O R T 2 0 1 5 – B R E N N T A G A G1 7 4
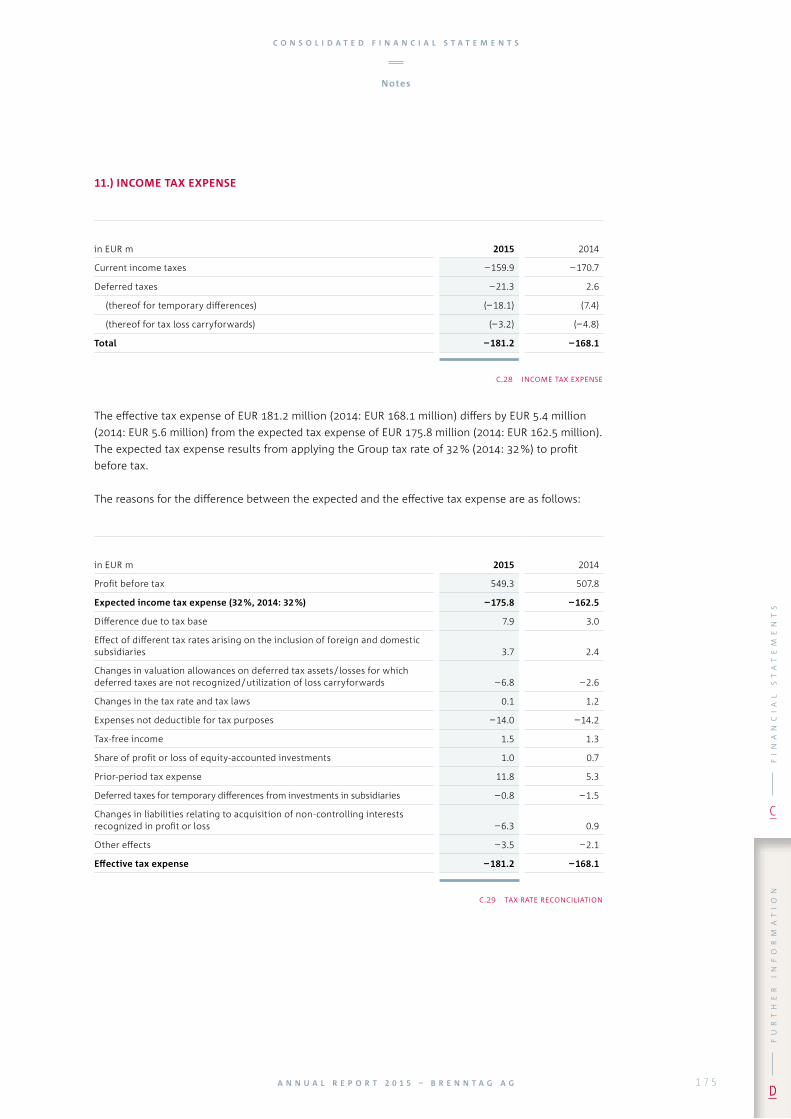
11.) INCOME TAX EXPENSE
in EUR m 2015 2014
Current income taxes – 159.9 – 170.7
Deferred taxes – 21.3 2.6
(thereof for temporary differences) (– 18.1) (7.4)
(thereof for tax loss carryforwards) (– 3.2) (– 4.8)
Total – 181.2 – 168.1
c.28 income tax expense
The effective tax expense of EUR 181.2 million (2014: EUR 168.1 million) differs by EUR 5.4 million
(2014: EUR 5.6 million) from the expected tax expense of EUR 175.8 million (2014: EUR 162.5 million).
The expected tax expense results from applying the Group tax rate of 32 % (2014: 32 %) to profit
before tax.
The reasons for the difference between the expected and the effective tax expense are as follows:
in EUR m 2015 2014
Profit before tax 549.3 507.8
Expected income tax expense (32 %, 2014: 32 %) – 175.8 – 162.5
Difference due to tax base 7.9 3.0
Effect of different tax rates arising on the inclusion of foreign and domestic subsidiaries 3.7 2.4
Changes in valuation allowances on deferred tax assets / losses for which deferred taxes are not recognized / utilization of loss carryforwards – 6.8 – 2.6
Changes in the tax rate and tax laws 0.1 1.2
Expenses not deductible for tax purposes – 14.0 – 14.2
Tax-free income 1.5 1.3
Share of profit or loss of equity-accounted investments 1.0 0.7
Prior-period tax expense 11.8 5.3
Deferred taxes for temporary differences from investments in subsidiaries – 0.8 – 1.5
Changes in liabilities relating to acquisition of non-controlling interests recognized in profit or loss – 6.3 0.9
Other effects – 3.5 – 2.1
Effective tax expense – 181.2 – 168.1
c.29 tax rate reconciliation
C O N S O L I D A T E D F I N A N C I A L S T A T E M E N T S
Notes
A N N U A L R E P O R T 2 0 1 5 – B R E N N T A G A G 1 7 5D
fu
rt
he
r
in
fo
rm
at
io
nf
in
an
ci
al
s
ta
te
me
nt
s
C
D
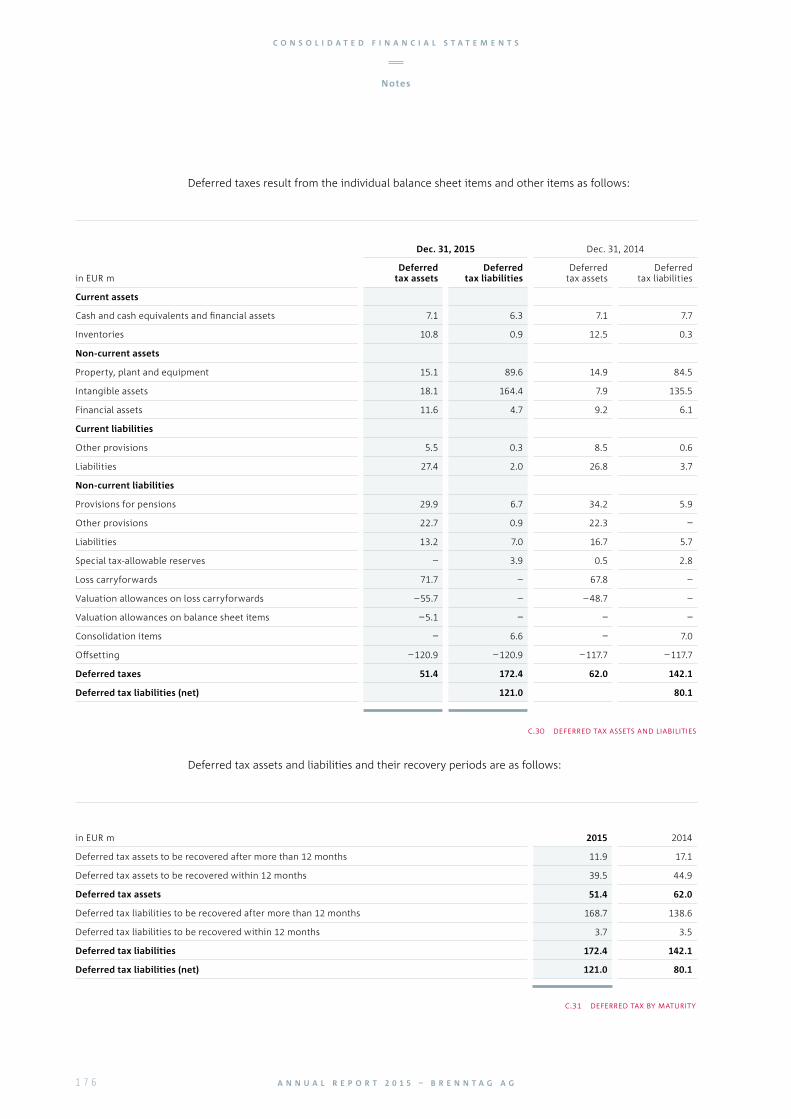
Dec. 31, 2015 Dec. 31, 2014
in EUR m Deferred
tax assetsDeferred
tax liabilitiesDeferred
tax assetsDeferred
tax liabilities
Current assets
Cash and cash equivalents and financial assets 7.1 6.3 7.1 7.7
Inventories 10.8 0.9 12.5 0.3
Non-current assets
Property, plant and equipment 15.1 89.6 14.9 84.5
Intangible assets 18.1 164.4 7.9 135.5
Financial assets 11.6 4.7 9.2 6.1
Current liabilities
Other provisions 5.5 0.3 8.5 0.6
Liabilities 27.4 2.0 26.8 3.7
Non-current liabilities
Provisions for pensions 29.9 6.7 34.2 5.9
Other provisions 22.7 0.9 22.3 –
Liabilities 13.2 7.0 16.7 5.7
Special tax-allowable reserves – 3.9 0.5 2.8
Loss carryforwards 71.7 – 67.8 –
Valuation allowances on loss carryforwards – 55.7 – – 48.7 –
Valuation allowances on balance sheet items – 5.1 – – –
Consolidation items – 6.6 – 7.0
Offsetting – 120.9 – 120.9 – 117.7 – 117.7
Deferred taxes 51.4 172.4 62.0 142.1
Deferred tax liabilities (net) 121.0 80.1
c.30 deferred tax assets and liabilities
Deferred taxes result from the individual balance sheet items and other items as follows:
Deferred tax assets and liabilities and their recovery periods are as follows:
in EUR m 2015 2014
Deferred tax assets to be recovered after more than 12 months 11.9 17.1
Deferred tax assets to be recovered within 12 months 39.5 44.9
Deferred tax assets 51.4 62.0
Deferred tax liabilities to be recovered after more than 12 months 168.7 138.6
Deferred tax liabilities to be recovered within 12 months 3.7 3.5
Deferred tax liabilities 172.4 142.1
Deferred tax liabilities (net) 121.0 80.1
c.31 deferred tax by maturity
C O N S O L I D A T E D F I N A N C I A L S T A T E M E N T S
Notes
A N N U A L R E P O R T 2 0 1 5 – B R E N N T A G A G1 7 6

Deferred tax liabilities (net) changed as follows:
in EUR m 2015 2014
Deferred tax liabilities (net) at Jan. 1 80.1 97.1
Exchange rate differences 1.2 0.8
Income / expense in profit and loss 21.3 – 2.6
Income taxes recognized in other comprehensive income 4.8 – 17.5
Business combinations 13.6 2.3
Deferred tax liabilities (net) at Dec. 31 121.0 80.1
c.32 change in deferred tax liabilities (net)
Dec. 31, 2015 Dec. 31, 2014
in EUR m Loss carry-
forwards
thereof loss carryforwards
for which deferred taxes
are not recognized
Loss carry- forwards
thereof loss carryforwards
for which deferred taxes
are not recognized
Within one year 3.2 (2.4) 8.4 (7.6)
2 to 5 years 26.1 (22.1) 12.8 (11.6)
6 to 9 years 9.6 (9.6) 3.8 (3.8)
More than 9 years 282.4 (270.6) 258.8 (238.9)
Unlimited 171.5 (130.9) 202.8 (143.2)
Total 492.8 (435.6) 486.6 (405.1)
c.33 tax loss carryforwards
The existing tax loss carryforwards can be utilized as follows:
Deferred tax on loss carryforwards is measured based on the expected taxable income derived from
the current mid-term planning, allowing for restrictions on loss carryforwards and their utilization
(minimum taxation).
Deferred taxes of EUR 16.0 million (Dec. 31, 2014: EUR 19.1 million) were recognized for loss carry-
forwards of EUR 57.2 million (Dec. 31, 2014: EUR 81.5 million) which are likely to be utilized. These
include loss carryforwards of US subsidiaries for state taxes totalling EUR 11.8 million (tax rate
between 5 % and 7 %) (Dec. 31, 2014: EUR 19.9 million).
No deferred taxes were recognized for loss carryforwards of EUR 435.6 million (Dec. 31, 2014:
EUR 405.1 million) which are not likely to be utilized. This figure includes domestic corporation tax
and trade tax loss carryforwards totalling EUR 93.3 million (Dec. 31, 2014: EUR 93.3 million) as well
as loss carryforwards totalling EUR 270.6 million (Dec. 31, 2014: EUR 238.7 million) of US subsidiaries
for state taxes (tax rate between 5 % and 7 %).
C O N S O L I D A T E D F I N A N C I A L S T A T E M E N T S
Notes
A N N U A L R E P O R T 2 0 1 5 – B R E N N T A G A G 1 7 7D
fu
rt
he
r
in
fo
rm
at
io
nf
in
an
ci
al
s
ta
te
me
nt
s
C
D

Temporary differences in connection with investments in subsidiaries for which no deferred tax liabili-
ties were recognized amount to EUR 457.8 million (Dec. 31, 2014: EUR 369.4 million).
12.) PERSONNEL EXPENSES / EMPLOYEES
Personnel expenses amount to EUR 853.0 million (2014: EUR 760.1 million). This line item includes
wages and salaries totalling EUR 679.5 million (2014: EUR 605.3 million) as well as social insurance
contributions of EUR 173.5 million (2014: EUR 154.8 million), of which pension expenses (including
employer contributions to the statutory pension insurance fund) account for EUR 53.4 million (2014:
EUR 48.4 million). Net interest expense from defined benefit plans is not included in personnel
expenses but presented within net finance costs under interest expense. Personnel expenses for the
share-based remuneration programmes on the basis of virtual shares amount to EUR 3.1 million
(2014: EUR 3.3 million).
The average number of employees breaks down by segment as follows:
2015 2014
EMEA 6,655 6,473
North America 4,196 4,085
Latin America 1,513 1,450
Asia Pacific 1,679 1,615
All other segments 133 125
Total 14,176 13,748
c.34 employees by segment
As at December 31, 2015, the Brenntag Group had a workforce of 14,707 (Dec. 31, 2014: 13,870). Of
this figure, 1,455 (Dec. 31, 2014: 1,438) were employed in Germany.
13.) EARNINGS PER SHARE
Earnings per share in the amount of EUR 2.36 (2014: EUR 2.20) are determined by dividing the share
of profit after tax of EUR 365.0 million (2014: EUR 339.3 million) attributable to the shareholders of
Brenntag AG by the number of shares (154.5 million).
In November 2015, Brenntag issued a bond with warrant units, the warrants of which entitle holders
to purchase Brenntag shares. The warrants had no diluting effect as the average Brenntag share price
is lower than the strike price of the warrants. The diluted earnings per share is therefore the basic
earnings per share.
C O N S O L I D A T E D F I N A N C I A L S T A T E M E N T S
Notes
A N N U A L R E P O R T 2 0 1 5 – B R E N N T A G A G1 7 8
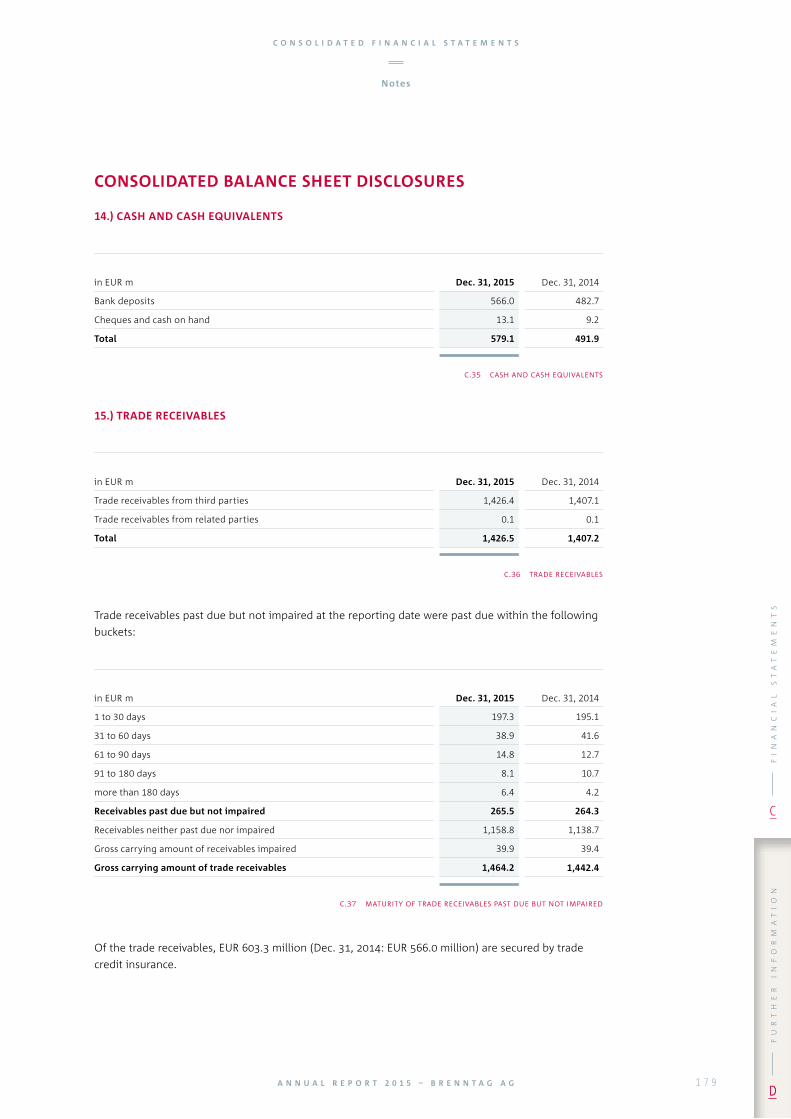
CONSOLIDATED BALANCE SHEET DISCLOSURES
14.) CASH AND CASH EQUIVALENTS
in EUR m Dec. 31, 2015 Dec. 31, 2014
Bank deposits 566.0 482.7
Cheques and cash on hand 13.1 9.2
Total 579.1 491.9
c.35 cash and cash equivalents
15.) TRADE RECEIVABLES
in EUR m Dec. 31, 2015 Dec. 31, 2014
Trade receivables from third parties 1,426.4 1,407.1
Trade receivables from related parties 0.1 0.1
Total 1,426.5 1,407.2
c.36 trade receivables
Trade receivables past due but not impaired at the reporting date were past due within the following
buckets:
in EUR m Dec. 31, 2015 Dec. 31, 2014
1 to 30 days 197.3 195.1
31 to 60 days 38.9 41.6
61 to 90 days 14.8 12.7
91 to 180 days 8.1 10.7
more than 180 days 6.4 4.2
Receivables past due but not impaired 265.5 264.3
Receivables neither past due nor impaired 1,158.8 1,138.7
Gross carrying amount of receivables impaired 39.9 39.4
Gross carrying amount of trade receivables 1,464.2 1,442.4
c.37 maturity of trade receivables past due but not impaired
Of the trade receivables, EUR 603.3 million (Dec. 31, 2014: EUR 566.0 million) are secured by trade
credit insurance.
C O N S O L I D A T E D F I N A N C I A L S T A T E M E N T S
Notes
A N N U A L R E P O R T 2 0 1 5 – B R E N N T A G A G 1 7 9D
fu
rt
he
r
in
fo
rm
at
io
nf
in
an
ci
al
s
ta
te
me
nt
s
C
D

Impairment losses on trade receivables changed as follows:
Dec. 31, 2015 Dec. 31, 2014
in EUR m thereof current
thereof current
Value-added tax receivables 34.8 (34.8) 30.6 (30.6)
Receivables from packaging 13.2 (13.2) 20.4 (20.4)
Reimbursement claims – environment 3.2 (–) 4.4 (–)
Suppliers with debit balances 5.2 (5.2) 4.5 (4.5)
Receivables from insurance claims 5.7 (5.7) 7.1 (7.1)
Deposits 3.5 (3.5) 3.6 (3.6)
Receivables from commissions and rebates 17.1 (17.1) 15.4 (15.4)
Prepayments 18.2 (18.1) 15.1 (15.1)
Receivables from other taxes 6.4 (6.4) 4.3 (4.3)
Receivables from long-term service contracts 4.8 (–) 3.8 (–)
Plan assets not netted with provisions for pensions 2.5 (–) – (–)
Receivables from employees 0.6 (0.6) 0.6 (0.6)
Miscellaneous other receivables 25.7 (16.0) 16.1 (11.2)
Prepaid expenses 17.2 (16.4) 15.6 (14.9)
Total 158.1 (137.0) 141.5 (127.7)
c.39 other receivables
Accumulated impairment losses on trade receivables
in EUR m 2015 2014
Jan. 1 35.2 36.0
Exchange rate differences 0.7 1.3
Added 10.2 7.3
Reversed – 4.8 – 3.4
Utilized – 3.6 – 6.0
Dec. 31 37.7 35.2
c.38 change in impairment losses on trade receivables
16.) OTHER RECEIVABLES
In the EMEA segment, most of the trade receivables are secured by trade credit insurance. In the Latin
America and Asia Pacific segments, there is trade credit insurance for most of the receivables in cer-
tain countries. In the North America segment as well as in some countries in the EMEA, Latin America
and Asia Pacific segments, there is no trade credit insurance.
C O N S O L I D A T E D F I N A N C I A L S T A T E M E N T S
Notes
A N N U A L R E P O R T 2 0 1 5 – B R E N N T A G A G1 8 0

17.) OTHER FINANCIAL ASSETS
Remaining term
in EUR mless than
1 year 1 to 5 yearsmore than
5 yearsDec. 31,
2015
Financial receivables from third parties 7.0 35.4 – 42.4
Derivative financial instruments 2.8 2.0 – 4.8
Available-for-sale financial assets 0.3 – 1.0 1.3
Financial receivables from related parties 0.1 – – 0.1
Total 10.2 37.4 1.0 48.6
c.40 other financial assets / dec. 31, 2015
Remaining term
in EUR mless than
1 year 1 to 5 yearsmore than
5 yearsDec. 31,
2014
Financial receivables from third parties 4.5 26.1 – 30.6
Derivative financial instruments 2.2 4.9 – 7.1
Available-for-sale financial assets 1.1 – 0.2 1.3
Financial receivables from related parties 0.1 – – 0.1
Total 7.9 31.0 0.2 39.1
c.41 other financial assets / dec. 31, 2014
18.) INVENTORIES
The inventories break down as follows:
in EUR m Dec. 31, 2015 Dec. 31, 2014
Merchandise 874.4 839.7
Finished goods 16.7 20.3
Raw materials and supplies 6.0 5.8
Total 897.1 865.8
c.42 inventories
C O N S O L I D A T E D F I N A N C I A L S T A T E M E N T S
Notes
A N N U A L R E P O R T 2 0 1 5 – B R E N N T A G A G 1 8 1D
fu
rt
he
r
in
fo
rm
at
io
nf
in
an
ci
al
s
ta
te
me
nt
s
C
D

19.) NON-CURRENT ASSETS HELD FOR SALE
Non-current assets held for sale of EUR 1.0 million (Dec. 31, 2014: EUR 0.9 million) are recognized
under current assets; as in the previous year, these relate entirely to the North America segment.
Non-current assets held for sale are carried at the lower of carrying amount and fair value less costs
of disposal. For material amounts, the fair value is determined using external appraisals and is there-
fore required to be classified into Level 2 or 3 of the IFRS 13 measurement hierarchy. No impairments
had to be recognized in the reporting period.
C O N S O L I D A T E D F I N A N C I A L S T A T E M E N T S
Notes
A N N U A L R E P O R T 2 0 1 5 – B R E N N T A G A G1 8 2

in EUR m
Land, land rights and buildings
Technical equipment and
machinery
Other equipment,
operating and office
equipment
Prepayments and assets
under construction Total
Cost
Dec. 31, 2013 645.2 459.8 227.2 30.8 1,363.0
Exchange rate differences 22.1 32.7 6.5 1.9 63.2
Business combinations 0.6 1.9 0.6 0.3 3.4
Other additions 6.5 25.3 30.6 36.1 98.5
Disposals – 0.6 – 4.4 – 37.0 – 0.2 – 42.2
Transfers 14.1 16.3 3.8 – 35.0 – 0.8
Dec. 31, 2014 687.9 531.6 231.7 33.9 1,485.1
Exchange rate differences 20.6 27.8 7.8 1.7 57.9
Business combinations 18.0 25.5 4.9 0.2 48.6
Other additions 8.4 28.5 28.7 58.7 124.3
Disposals – 1.0 – 6.8 – 22.0 – – 29.8
Transfers 10.9 8.3 13.8 – 35.1 – 2.1
Dec. 31, 2015 744.8 614.9 264.9 59.4 1,684.0
Accumulated depreciation and impairment
Dec. 31, 2013 146.7 229.1 142.5 – 518.3
Exchange rate differences 5.3 17.4 3.9 – 26.6
Depreciation 22.5 42.5 34.2 – 99.2
Impairment 0.2 – – – 0.2
Disposals – 0.3 – 3.4 – 34.8 – – 38.5
Transfers 0.1 – – 0.1 – –
Dec. 31, 2014 174.5 285.6 145.7 – 605.8
Exchange rate differences 5.9 15.6 4.4 – 25.9
Depreciation 24.6 48.1 36.0 – 108.7
Impairment – – – – –
Disposals – 0.8 – 5.7 – 20.8 – – 27.3
Transfers – – 6.5 5.5 – – 1.0
Dec. 31, 2015 204.2 337.1 170.8 – 712.1
Carrying amounts at Dec. 31, 2015 540.6 277.8 94.1 59.4 971.9
Carrying amounts at Dec. 31, 2014 513.4 246.0 86.0 33.9 879.3
c.43 property, plant and equipment
20.) PROPERTY, PLANT AND EQUIPMENT
There were no impairments of property, plant and equipment in the reporting year. The net carrying
amounts of the property, plant and equipment subject to impairment in 2014 totalled EUR 2.8 million.
The carrying amounts for assets recognized on the basis of finance leases total EUR 4.4 million (Dec. 31,
2014: EUR 4.7 million) for land and buildings, EUR 1.7 million (Dec. 31, 2014: EUR 0.2 million) for
C O N S O L I D A T E D F I N A N C I A L S T A T E M E N T S
Notes
A N N U A L R E P O R T 2 0 1 5 – B R E N N T A G A G 1 8 3D
fu
rt
he
r
in
fo
rm
at
io
nf
in
an
ci
al
s
ta
te
me
nt
s
C
D

technical equipment and machinery, and EUR 7.4 million (Dec. 31, 2014: EUR 5.1 million) for other
equipment, operating and office equipment.
The carrying amounts of property, plant and equipment serving as collateral for liabilities to banks
amount to EUR 13.7 million (Dec. 31, 2014: EUR 13.2 million). The carrying amounts of property, plant
and equipment which are subject to restrictions on their disposal total EUR 3.0 million (Dec. 31, 2014:
EUR 2.8 million).
The volume of government grants totals EUR 1.2 million (Dec. 31, 2014: EUR 1.2 million).
21.) INTANGIBLE ASSETS
in EUR m Goodwill Trademarks
Customer relationships
and similar rights
Software, licences and
similar rights Total
Cost
Dec. 31, 2013 1,807.2 214.5 108.2 48.1 2,178.0
Exchange rate differences 117.9 1.3 5.3 2.9 127.4
Business combinations 69.7 – 30.4 – 100.1
Other additions – – – 6.3 6.3
Disposals – – – 23.6 – 0.9 – 24.5
Transfers – – – 0.4 0.4
Dec. 31, 2014 1,994.8 215.8 120.3 56.8 2,387.7
Exchange rate differences 90.2 1.2 4.6 2.4 98.4
Business combinations 363.6 9.8 65.6 1.9 440.9
Other additions – – – 5.8 5.8
Disposals – – 0.5 – 45.6 – 0.5 – 46.6
Transfers – – – 2.3 2.3
Dec. 31, 2015 2,448.6 226.3 144.9 68.7 2,888.5
Accumulated amortization and impairment
Dec. 31, 2013 – 11.5 57.6 34.6 103.7
Exchange rate differences – 0.9 1.7 1.9 4.5
Amortization – 2.3 28.3 5.3 35.9
Disposals – – – 23.6 – 0.8 – 24.4
Dec. 31, 2014 – 14.7 64.0 41.0 119.7
Exchange rate differences – 0.8 2.6 1.8 5.2
Amortization – 2.7 27.7 6.5 36.9
Disposals – – 0.5 – 45.6 – 0.5 – 46.6
Transfers – – – 1.2 1.2
Dec. 31, 2015 – 17.7 48.7 50.0 116.4
Carrying amounts at Dec. 31, 2015 2,448.6 208.6 96.2 18.7 2,772.1
Carrying amounts at Dec. 31, 2014 1,994.8 201.1 56.3 15.8 2,268.0
c.44 intangible assets
C O N S O L I D A T E D F I N A N C I A L S T A T E M E N T S
Notes
A N N U A L R E P O R T 2 0 1 5 – B R E N N T A G A G1 8 4

The goodwill and the “Brenntag” trademark are assets with an indefinite useful life. They are tested
regularly, at least annually, for impairment after completion of the annual budget process. The carry-
ing amount of the “Brenntag” trademark is EUR 196.9 million as in the previous year.
Of the intangible assets as at December 31, 2015, some EUR 1,275 million (Dec. 31, 2014:
EUR 1,217 million) relate to goodwill and trademarks that were recognized as part of the purchase
price allocation performed on the acquisition of the Brenntag Group by funds advised by BC Partners
Limited, Bain Capital, Ltd. and subsidiaries of Goldman Sachs International at the end of the third
quarter of 2006 in addition to the relevant intangible assets already existing in the previous Group
structure.
The regional allocation of goodwill to the groups of cash-generating units relevant for impairment
testing is as follows:
in EUR m Dec. 31, 2015 Dec. 31, 2014
EMEA 846.3 808.1
North America 1,277.5 892.3
Latin America 79.6 86.6
Asia Pacific 216.8 179.6
All other segments 28.4 28.2
Group 2,448.6 1,994.8
c.45 regional allocation of goodwill
Fair value less costs of disposal is taken as the recoverable amount. This amount is determined on
the basis of a recognized company valuation model. The company valuation model is based on cash
flow plans, which are in turn based on the five-year plan approved by the Board of Management and
applicable at the date of the performance of the impairment test. The five-year plan consists of the
mid-term planning for the first three years submitted by the Group companies and aggregated at
segment level (bottom up) and an extrapolation for the two following years performed by the Manage-
ment (top down). The fair value thus determined is required to be classified into Level 3 of the IFRS 13
meas urement hierarchy.
The cash flow forecasts for the impairment test of the financial year ended December 31, 2015 were
derived from the budget for 2016 and the plan years 2017 to 2020. The growth rates are based on
management’s historical experience and expectations as to future trends in markets and costs as well
as quantities and prices on the basis of external macroeconomic data. After the, in some cases, much
higher growth rates in the years 2016 to 2020 (detailed planning period), the assumed growth rates
for the period from 2021 onwards are 1.0 % in EMEA (2014: 1.0 %), 1.25 % in North America (2014:
1.25 %) and 2.0 % in Latin America and Asia Pacific (2014: 2.0 %).
The region-specific WACC used to discount the cash flows thus determined is based on a risk-free
interest rate of 1.50 % (2014: 1.75 %) and a market risk premium of 6.25 % (2014: 6.25 %). The esti-
mates of daily yield curves published by the German central bank, the Bundesbank, are taken as a
basis for determining the risk-free interest rate. The beta factor used and the capital structure are
derived from a peer group. Furthermore, region-specific tax rates and country risk premiums (accord-
ing to Damodaran) are used.
C O N S O L I D A T E D F I N A N C I A L S T A T E M E N T S
Notes
A N N U A L R E P O R T 2 0 1 5 – B R E N N T A G A G 1 8 5D
fu
rt
he
r
in
fo
rm
at
io
nf
in
an
ci
al
s
ta
te
me
nt
s
C
D
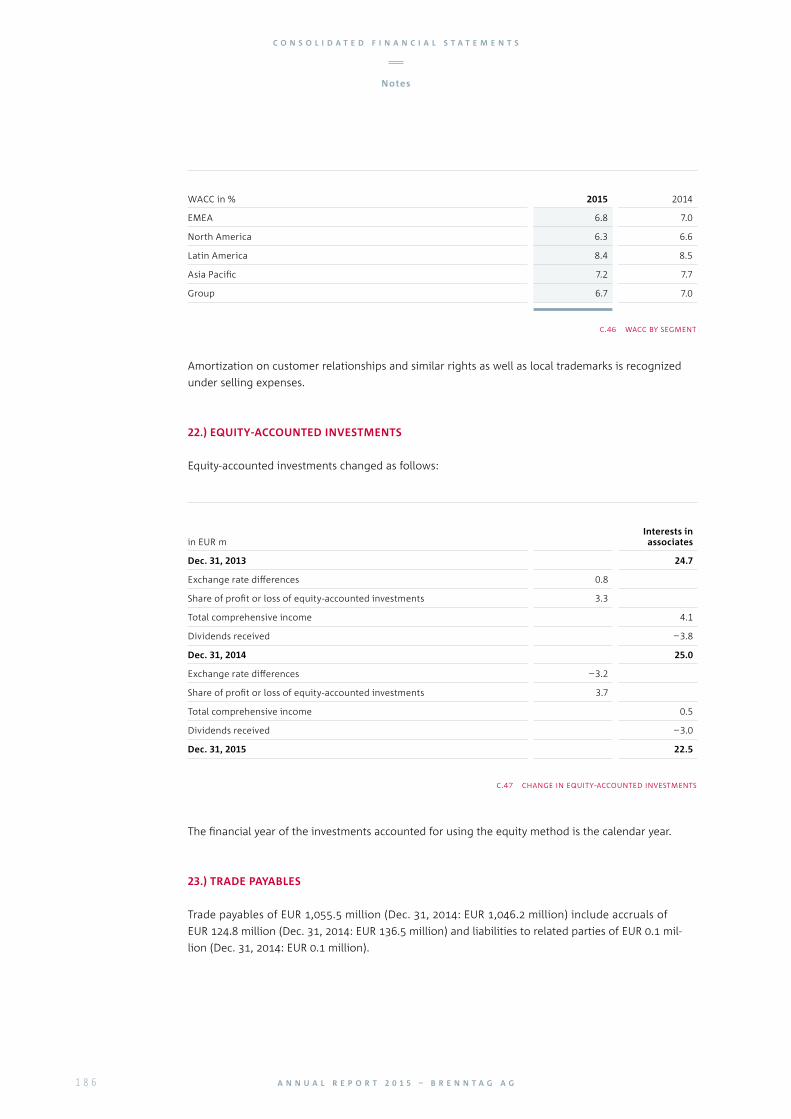
WACC in % 2015 2014
EMEA 6.8 7.0
North America 6.3 6.6
Latin America 8.4 8.5
Asia Pacific 7.2 7.7
Group 6.7 7.0
c.46 wacc by segment
Amortization on customer relationships and similar rights as well as local trademarks is recognized
under selling expenses.
22.) EQUITY-ACCOUNTED INVESTMENTS
Equity-accounted investments changed as follows:
in EUR mInterests in associates
Dec. 31, 2013 24.7
Exchange rate differences 0.8
Share of profit or loss of equity-accounted investments 3.3
Total comprehensive income 4.1
Dividends received – 3.8
Dec. 31, 2014 25.0
Exchange rate differences – 3.2
Share of profit or loss of equity-accounted investments 3.7
Total comprehensive income 0.5
Dividends received – 3.0
Dec. 31, 2015 22.5
c.47 change in equity-accounted investments
The financial year of the investments accounted for using the equity method is the calendar year.
23.) TRADE PAYABLES
Trade payables of EUR 1,055.5 million (Dec. 31, 2014: EUR 1,046.2 million) include accruals of
EUR 124.8 million (Dec. 31, 2014: EUR 136.5 million) and liabilities to related parties of EUR 0.1 mil-
lion (Dec. 31, 2014: EUR 0.1 million).
C O N S O L I D A T E D F I N A N C I A L S T A T E M E N T S
Notes
A N N U A L R E P O R T 2 0 1 5 – B R E N N T A G A G1 8 6

24.) FINANCIAL LIABILITIES
Remaining term
in EUR mless than
1 year 1 to 5 yearsmore than
5 years Dec. 31, 2015
Liabilities under syndicated loan 0.9 1,213.8 – 1,214.7
Other liabilities to banks 128.7 0.2 5.3 134.2
Bond 2018 9.9 396.6 – 406.5
Bond (with Warrants) 2022 0.7 – 422.5 423.2
Finance lease liabilities 3.6 6.9 3.9 14.4
Derivative financial instruments 4.3 – – 4.3
Other financial liabilities 12.7 45.2 – 57.9
Total 160.8 1,662.7 431.7 2,255.2
Cash and cash equivalents 579.1
Net financial liabilities 1,676.1
c.48 financial liabilities / dec. 31, 2015
Remaining term
in EUR mless than
1 year 1 to 5 yearsmore than
5 years Dec. 31, 2014
Liabilities under syndicated loan 2.5 1,121.6 – 1,124.1
Other liabilities to banks 288.0 2.5 6.1 296.6
Bond 2018 9.9 395.3 – 405.2
Finance lease liabilities 2.8 6.1 3.4 12.3
Derivative financial instruments 3.6 0.4 – 4.0
Other financial liabilities 27.2 32.2 – 59.4
Total 334.0 1,558.1 9.5 1,901.6
Cash and cash equivalents 491.9
Net financial liabilities 1,409.7
c.49 financial liabilities / dec. 31, 2014
The syndicated bullet loan is a loan agreement with a consortium of international banks. The syndicated
loan is divided into different tranches with different currencies.
C O N S O L I D A T E D F I N A N C I A L S T A T E M E N T S
Notes
A N N U A L R E P O R T 2 0 1 5 – B R E N N T A G A G 1 8 7D
fu
rt
he
r
in
fo
rm
at
io
nf
in
an
ci
al
s
ta
te
me
nt
s
C
D

The liabilities under the syndicated loan break down as follows:
in EUR m Remaining
term
Interest rate above
EURIBOR / LIBOR Dec. 31, 2015
Tranches
Tranche A Mar. 28, 2019 1.05 % 386.4
Tranche B Mar. 28, 2019 1.05 % 835.9
Total 1,222.3
Accrued interest 0.9
Transaction costs – 8.5
Liabilities under syndicated loan 1,214.7
c.50 liabilities under syndicated loan / dec. 31, 2015
in EUR m Remaining
term
Interest rate above
EURIBOR / LIBOR Dec. 31, 2014
Tranches
Tranche A Mar. 28, 2019 1.15 % 382.6
Tranche B Mar. 28, 2019 1.15 % 749.5
Total 1,132.1
Accrued interest 2.5
Transaction costs – 10.5
Liabilities under syndicated loan 1,124.1
c.51 liabilities under syndicated loan / dec. 31, 2014
In addition to the above-mentioned tranches, the syndicated loan also includes a revolving credit
facility in the amount of EUR 600.0 million (Dec. 31, 2014: EUR 600.0 million), which was virtually
unutilized as at December 31, 2015.
The EUR 400.0 million bond (Bond 2018) matures in July 2018. At an issue price of 99.321 %, the Bond
2018 bears a coupon of 5.5 % with interest paid annually. The bond with warrant units in the amount
of USD 500.0 million issued in November 2015 matures in December 2022. The Bond (with Warrants)
2022 was issued at 92.7 % of par and bears a coupon of 1.875 % p.a. with interest payable semi-
annually. The discount (7.3 % or USD 36.5 million) is the warrant premium on the warrants to purchase
Brenntag shares issued together with the Bond (with Warrants) 2022. The warrant premium was
recognized in the additional paid-in capital of Brenntag AG. The Bond 2018 and the Bond (with
Warrants) 2022 were issued by our Group company, Brenntag Finance B.V., Amsterdam, Netherlands.
C O N S O L I D A T E D F I N A N C I A L S T A T E M E N T S
Notes
A N N U A L R E P O R T 2 0 1 5 – B R E N N T A G A G1 8 8

As at December 31, 2014, the other liabilities to banks included an amount of EUR 182.7 million owed
to banks by Brenntag Funding Ltd., Dublin, Ireland under the international accounts receivable securi-
tization programme. Following Brenntag’s decision not to extend the international accounts receiv-
able securitization programme, the corresponding financial liabilities were repaid in June 2015.
Of the other liabilities to banks, EUR 30.8 million are secured by inventories in the amount of
EUR 12.3 million.
Detailed disclosures concerning the terms of the syndicated loan, the Bond 2018 and the bond with
warrant units are included in the chapters “Capital structure” and “Financial risks and opportunities”
in the management report.
The following table shows the reconciliation of future minimum lease payments to liabilities under
finance leases:
in EUR mMinimum lease
paymentsInterest
componentFinance lease
liabilities
less than 1 year 4.4 0.8 3.6
1 to 2 years 3.3 0.6 2.7
2 to 3 years 2.5 0.5 2.0
3 to 4 years 1.8 0.4 1.4
4 to 5 years 1.2 0.4 0.8
more than 5 years 6.5 2.6 3.9
Dec. 31, 2015 19.7 5.3 14.4
c.52 minimum lease payments / 2015
in EUR mMinimum lease
paymentsInterest
componentFinance lease
liabilities
less than 1 year 3.7 1.0 2.7
1 to 2 years 3.1 0.7 2.4
2 to 3 years 2.3 0.5 1.8
3 to 4 years 1.6 0.4 1.2
4 to 5 years 1.1 0.3 0.8
more than 5 years 6.1 2.7 3.4
Dec. 31, 2014 17.9 5.6 12.3
c.53 minimum lease payments / 2014
C O N S O L I D A T E D F I N A N C I A L S T A T E M E N T S
Notes
A N N U A L R E P O R T 2 0 1 5 – B R E N N T A G A G 1 8 9D
fu
rt
he
r
in
fo
rm
at
io
nf
in
an
ci
al
s
ta
te
me
nt
s
C
D

Dec. 31, 2015 Dec. 31, 2014
in EUR mthereof current
thereof current
Liabilities to employees 103.0 (103.0) 100.9 (100.9)
Liabilities from packaging 63.1 (63.1) 68.6 (68.6)
Liabilities from value-added tax 45.1 (45.1) 44.3 (44.3)
Customers with credit balances 27.0 (27.0) 23.9 (23.9)
Liabilities from other taxes 20.1 (20.1) 17.6 (17.6)
Liabilities to insurance companies 16.8 (16.8) 16.0 (16.0)
Liabilities from sales deductions, rebates 13.7 (13.7) 12.6 (12.6)
Deferred income 7.5 (7.2) 7.7 (7.4)
Liabilities from social insurance contributions 9.8 (9.8) 9.1 (9.1)
Liabilities from the acquisition of assets 10.5 (10.5) 7.7 (7.7)
Miscellaneous other liabilities 56.5 (54.2) 54.6 (52.7)
Total 373.1 (370.5) 363.0 (360.8)
c.54 other liabilities
25.) OTHER LIABILITIES
Other liabilities include accruals of EUR 40.6 million (Dec. 31, 2014: EUR 36.8 million).
26.) OTHER PROVISIONS
Other provisions changed as follows:
in EUR m Environmental
provisions
Provisions for personnel expenses
Miscellaneous provisions Total
Jan. 1, 2015 103.1 27.1 29.3 159.5
Exchange rate differences 6.4 0.5 0.8 7.7
Additions from business combinations 0.8 0.3 0.5 1.6
Unwinding of discounting 1.5 0.2 0.2 1.9
Utilized – 7.0 – 12.8 – 12.4 – 32.2
Reversed – 3.2 – 1.8 – 4.8 – 9.8
Added 3.2 9.9 19.3 32.4
Transferred – – 2.0 4.1 2.1
Dec. 31, 2015 104.8 21.4 37.0 163.2
c.55 change in other provisions
C O N S O L I D A T E D F I N A N C I A L S T A T E M E N T S
Notes
A N N U A L R E P O R T 2 0 1 5 – B R E N N T A G A G1 9 0

Other provisions have the following maturities:
in EUR m Dec. 31, 2015 Dec. 31, 2014
less than 1 year 42.1 45.1
1 to 5 years 59.4 62.3
more than 5 years 61.7 52.1
Total 163.2 159.5
c.56 maturity of other provisions
environmental provisions
The recognition and measurement of environmental provisions are coordinated centrally by external
independent experts. The provision amounts are determined on the basis of individual cost estimates
for each case. Allowance is made not only for the nature and severity of pollution but also for the
conditions at the respective sites and the sovereign territories in which these sites are located.
Environmental provisions are stated at their present values. They are discounted at maturity-
dependent, risk-free interest rates for the respective functional currencies. Increases in the future
expenditure due to inflation are allowed for. The discount rates for environmental provisions are
between 0.0 and 6.9 %, depending on the currency.
As at December 31, 2015, environmental provisions total EUR 104.8 million (Dec. 31, 2014: EUR 103.1 mil-
lion). They mainly relate to the rehabilitation of soil and ground water for current and former, owned
and leased sites but also cover costs for further and accompanying measures such as necessary envi-
ronmental inspections and observations. The provisions include EUR 23.0 million (Dec. 31, 2014:
EUR 22.4 million) for contingencies for which a cash outflow is not likely but nevertheless possible.
In line with the requirements of IFRS 3, these contingencies have entered the balance sheet largely
through the purchase price allocation in connection with the acquisition of the Brenntag Group by
funds advised by BC Partners Limited, Bain Capital, Ltd. and subsidiaries of Goldman Sachs International
at the end of the third quarter of 2006.
Due to the nature and the large number of parameters which have to be considered when determin-
ing environmental provisions, there are uncertainties in their measurement. This applies both to the
amount and the timing of future expenditure. However, based on the information available at the
time of the preparation of these financial statements, it can be assumed that the environmental provi-
sions are reasonable and any additional amounts incurred would not have any material effect on the
net assets, financial position and results of operations of the Group.
In some cases, special agreements have been reached which ensure that the cost of any future envi-
ronmental work necessary will be borne by third parties. If receipt of payment from the third party is
virtually certain provided Brenntag meets its obligations, these reimbursement claims are recognized.
They are generally measured in the same way as the corresponding provisions. The amount recog-
nized does not exceed the amount of the provision. The reimbursement claims recognized at
December 31, 2015 amount to EUR 3.2 million (Dec. 31, 2014: EUR 4.4 million).
C O N S O L I D A T E D F I N A N C I A L S T A T E M E N T S
Notes
A N N U A L R E P O R T 2 0 1 5 – B R E N N T A G A G 1 9 1D
fu
rt
he
r
in
fo
rm
at
io
nf
in
an
ci
al
s
ta
te
me
nt
s
C
D

provisions for personnel expenses
Provisions for personnel expenses primarily contain obligations arising from future variable and indi-
vidual one-time payments, payments in connection with employee long-service anniversary bonuses,
early retirement regulations and pre-retirement part-time work compensation. Provisions for share-
based remuneration programmes on the basis of virtual shares are also presented under this item.
These programmes are long-term bonus systems for members of the Board of Management of
Brenntag AG, on the one hand, and for executives and senior managers of the Brenntag Group, on
the other.
Long-term share-based remuneration programmes for the members of the Board of Management
and Long-Term Incentive Plan for Executives and Senior Managers (LTI Plan)
In 2015, one single remuneration system was introduced for all members of the Board of Manage-
ment of Brenntag AG, which also includes a long-term share-based remuneration programme (Long
Term Incentive Plan). The long-term variable remuneration is awarded every year and is partly based
on the development of the share price. On the basis of a contractually set Annual Target Amount, this
remuneration component is subject to a vesting period of in each case three years. 50 % of the Target
Amount is contingent on the development of the value of the company’s shares during these three
years (External LTI Portion) and 50 % is contingent on the long-term development of specific Group-
wide KPIs (Internal LTI Portion).
50 % of the External LTI Portion is measured by the absolute development of the total shareholder
return for the company’s shares during the vesting period (Absolute External LTI Portion), while the
other 50 % of the External LTI Portion is measured by the relative development of the total share-
holder return for the company’s shares in comparison to the development of the MDAX during the
vesting period (Relative External LTI Portion). For every percentage point by which the average share
price on the last trade day of the vesting period exceeds or falls short of the average share price on
the last trade day before the vesting period, the Absolute External LTI Portion is increased or
decreased by 2 %. For every percentage point by which the MDAX is over- or underperformed in the
vesting period, the Relative External LTI Portion is increased or decreased by 3 %. The overall External
LTI Portion at the end of the relevant vesting period equals the sum of the Absolute External LTI Por-
tion and Relative External LTI Portion. The Absolute External LTI Portion and Relative External LTI Por-
tion may not be less than EUR 0, the External LTI Portion is capped overall at 100 % of the Target
Amount (for sum of External and Internal LTI Portions).
The Internal LTI Portion is measured by the following KPI targets, which are agreed at the end of each
financial year for the following vesting period in an LTI Bonus Plan: EBITDA, ROCE and earnings per
share. At the end of each financial year during a vesting period, the achievement of the KPI targets in
the particular financial year is calculated for a share of 1/3 of the Internal LTI Portion. For every per-
centage point by which the targets of a given KPI are over- or underperformed in the particular finan-
cial year, the Annual Internal LTI Portion is increased or decreased by 3 %. This may also lead to a neg-
ative Annual Internal LTI Portion. The overall Internal LTI Portion at the end of the relevant vesting
period equals the sum of the Annual Internal LTI Portions. The Internal LTI Portion is capped at 100 %
of the portion of the contractually set Target Amount (for sum of External and Internal LTI Portions).
The Long Term Incentive Bonus for each financial year equals the sum of the External and Internal LTI
Portions.
C O N S O L I D A T E D F I N A N C I A L S T A T E M E N T S
Notes
A N N U A L R E P O R T 2 0 1 5 – B R E N N T A G A G1 9 2
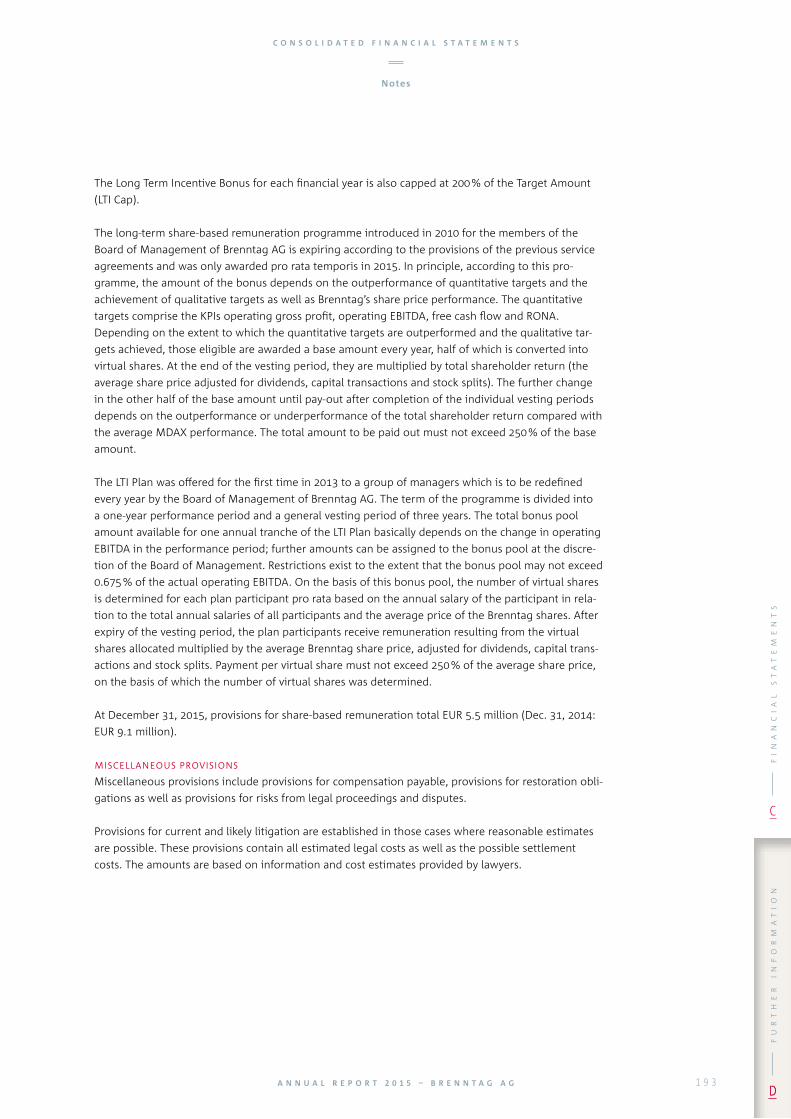
The Long Term Incentive Bonus for each financial year is also capped at 200 % of the Target Amount
(LTI Cap).
The long-term share-based remuneration programme introduced in 2010 for the members of the
Board of Management of Brenntag AG is expiring according to the provisions of the previous service
agreements and was only awarded pro rata temporis in 2015. In principle, according to this pro-
gramme, the amount of the bonus depends on the outperformance of quantitative targets and the
achievement of qualitative targets as well as Brenntag’s share price performance. The quantitative
targets comprise the KPIs operating gross profit, operating EBITDA, free cash flow and RONA.
Depending on the extent to which the quantitative targets are outperformed and the qualitative tar-
gets achieved, those eligible are awarded a base amount every year, half of which is converted into
virtual shares. At the end of the vesting period, they are multiplied by total shareholder return (the
average share price adjusted for dividends, capital transactions and stock splits). The further change
in the other half of the base amount until pay-out after completion of the individual vesting periods
depends on the outperformance or underperformance of the total shareholder return compared with
the average MDAX performance. The total amount to be paid out must not exceed 250 % of the base
amount.
The LTI Plan was offered for the first time in 2013 to a group of managers which is to be redefined
every year by the Board of Management of Brenntag AG. The term of the programme is divided into
a one-year performance period and a general vesting period of three years. The total bonus pool
amount available for one annual tranche of the LTI Plan basically depends on the change in operating
EBITDA in the performance period; further amounts can be assigned to the bonus pool at the discre-
tion of the Board of Management. Restrictions exist to the extent that the bonus pool may not exceed
0.675 % of the actual operating EBITDA. On the basis of this bonus pool, the number of virtual shares
is determined for each plan participant pro rata based on the annual salary of the participant in rela-
tion to the total annual salaries of all participants and the average price of the Brenntag shares. After
expiry of the vesting period, the plan participants receive remuneration resulting from the virtual
shares allocated multiplied by the average Brenntag share price, adjusted for dividends, capital trans-
actions and stock splits. Payment per virtual share must not exceed 250 % of the average share price,
on the basis of which the number of virtual shares was determined.
At December 31, 2015, provisions for share-based remuneration total EUR 5.5 million (Dec. 31, 2014:
EUR 9.1 million).
miscellaneous provisions
Miscellaneous provisions include provisions for compensation payable, provisions for restoration obli-
gations as well as provisions for risks from legal proceedings and disputes.
Provisions for current and likely litigation are established in those cases where reasonable estimates
are possible. These provisions contain all estimated legal costs as well as the possible settlement
costs. The amounts are based on information and cost estimates provided by lawyers.
C O N S O L I D A T E D F I N A N C I A L S T A T E M E N T S
Notes
A N N U A L R E P O R T 2 0 1 5 – B R E N N T A G A G 1 9 3D
fu
rt
he
r
in
fo
rm
at
io
nf
in
an
ci
al
s
ta
te
me
nt
s
C
D
27.) PROVISIONS FOR PENSIONS AND OTHER POST-EMPLOYMENT BENEFITS
There are both defined contribution and defined benefit pension plans for the employees of the
Brenntag Group. The pension obligations vary depending on the legal, tax and economic circum-
stances in the respective country and the employee’s years of service with the company and pay grade.
defined contribution plans
A large number of the employees of the Brenntag Group will receive benefits from the statutory social
insurance fund, into which the contributions are paid as part of their salary. In addition, various other
pension fund commitments exist at the companies of the Brenntag Group. As the company has no
further obligations after payment of the retirement pension contributions to the state social insur-
ance fund and private insurance companies, these plans are treated as defined contribution plans.
Current pension contribution payments are recognized as expense for the relevant period. In financial
year 2015, pension expenses in the Brenntag Group total EUR 24.2 million (2014: EUR 22.6 million)
for employer contributions to the statutory pension insurance fund and EUR 17.4 million (2014:
EUR 16.9 million) for non-statutory defined contribution plans.
In the USA, subsidiaries of the Brenntag Group pay into defined benefit plans maintained by more
than one employer (so-called multi-employer plans). These multi-employer defined benefit plans are
accounted for in the consolidated financial statements as defined contribution plans because the
information required to use defined benefit accounting is not available in a timely manner and in suf-
ficient detail. Furthermore, there is no consistent and reliable basis for allocating the obligation, plan
assets and cost to individual participating employers, which is necessary for defined benefit account-
ing in accordance with IAS 19.
If other participating employers do not meet their payment obligations, Brenntag may be liable for
the obligations of those employers. Any potential withdrawal from the plans by an entity may lead to
that entity having to offset the potential shortfall relating to its share of the plan. The funding level of
the individual plans ranges from about 37 % to 92 % as at December 31, 2015 (about 35 % to 95 %
as at December 31, 2014). Brenntag Group subsidiaries account for approximately 0.04 % to 4.2 % of
the total contributions (2014: approximately 0.04 % to 4.5 %), depending on the plan. Withdrawal
from all plans at the present time would lead to an estimated one-time expense of approximately
EUR 28 million or approximately USD 31 million (2014: approximately EUR 23 million or approximately
USD 30 million). No withdrawal from any of these plans is intended at this time.
In financial year 2015, contributions of EUR 2.4 million or USD 2.6 million (2014: EUR 1.9 million or
USD 2.6 million) were paid. The contributions are included in the above-mentioned contributions for
non-statutory defined contribution plans. The contributions are expected to amount to approximately
EUR 2.5 million in 2016.
C O N S O L I D A T E D F I N A N C I A L S T A T E M E N T S
Notes
A N N U A L R E P O R T 2 0 1 5 – B R E N N T A G A G1 9 4

defined benefit plans
The defined benefit plans of the Brenntag Group are funded by provisions and largely covered by
assets. The principal obligations (over 90 % of the total volume) are in Switzerland, Germany, Canada
and the Netherlands. The remaining obligations are spread over another eleven countries in the
EMEA, Latin America and Asia Pacific segments.
Switzerland
In Switzerland, every employer is obliged by national law to set up a company retirement pension
scheme. When determining the pension benefits, the minimum requirements of the Federal Law on
Occupational Retirement, Surviving Dependants’ and Disability Pensions (Bundesgesetz über die
beruflichen Alters-, Hinterlassenen- und Invalidenvorsorge (BVG)) and the corresponding regulations
are required to be observed.
The Swiss group company maintains a funded pension plan for its employees. The assets of this plan
are held in two autonomous foundations. The foundation board is made up of equal numbers of
employer and employee representatives. It is responsible for setting the investment strategy, for
changes in the pension plan rules and in particular also for determining the financing of the pension
benefits.
The pension benefits are based on the retirement assets accrued. The annual retirement credits and
interest are credited to these retirement assets. On retirement, the insured person has the choice
between a life-long pension, a lump-sum settlement or parts thereof. In addition to the retirement
benefits, the pension benefits also include disability and surviving dependants’ pensions. The insured
person may also dispose of parts of his accrued retirement assets prematurely if this serves to
improve his pension situation. If there is a change of employer, the retirement assets are transferred
to the pension scheme of the new employer.
The employee and employer contributions are set by the foundation board. According to the BVG, the
employer pays at least 50 % of the necessary contributions. In the case of Brenntag Schweizerhall AG,
the employer pays some 70 % of the contributions in accordance with the rules of the plan.
As the contributions to the pension plan that the employees in Switzerland pay are based on formal
rules, the risk distribution between employee and employer is taken into account when measuring
the obligation. In the case of Brenntag Schweizerhall AG, this leads to an insignificant reduction in the
present value of the benefit obligation.
Germany
The German group companies have retirement pension plans which are based on contractual provi-
sions or works agreements:
The Employee Pension Plan 2000 / 2012 (Mitarbeiter Vorsorgeplan 2000 / 2012) is a pension plan
funded by the employer. The employer awards an annual pension contribution of between EUR 250
and EUR 500 depending on length of service, which is converted into pension modules. The amount
of the benefits depends on the pension modules accrued before retirement.
The Pension Scheme 2000 / 2012 for Executives (Leistungsordnung 2000 / 2012 für Führungskräfte) of
the German Brenntag companies is a pension plan for executives funded by the employer in the form
of individual commitments. The annual pension contribution depends on the pensionable remuneration
(basis of assessment). The annual basis of assessment is the sum total of the fixed remuneration,
Christmas and vacation allowances and bonuses but no more than three times the contribution
C O N S O L I D A T E D F I N A N C I A L S T A T E M E N T S
Notes
A N N U A L R E P O R T 2 0 1 5 – B R E N N T A G A G 1 9 5D
fu
rt
he
r
in
fo
rm
at
io
nf
in
an
ci
al
s
ta
te
me
nt
s
C
D

assessment limit for the statutory pension system. The pension contribution is a maximum of 4 %
of the basis of assessment up to the contribution assessment limit plus a maximum of 10 % for parts
exceeding the contribution assessment limit. The annual pension contributions are converted into
pension modules. The amount of the benefits depends on the pension modules accrued before retire-
ment.
All employees have the option to convert pay components into an entitlement to pension benefits
within the meaning of the German Company Pension Act (Betriebsrentengesetz (BetrAVG)) by partici-
pating in the Pension Plan Through Employee-funded Pension Commitments (Vorsorgeplan über
mitarbeiterfinanzierte Versorgungszusagen). The annual pension contribution for participating
employees is between at least EUR 250 and a maximum of 4 % of the contribution assessment limit
for the statutory pension system (Section 1a BetrAVG). The company also pays an additional pension
allowance of 15 % to the converted amount provided that the pension contribution comes from remu-
neration subject to statutory pension insurance contributions. Furthermore, through the Deferred
Compensation Plan (DCP), employees have the option to convert pay components into an entitlement
to pension benefits. The individual pension contribution must be at least EUR 5,000. The converted
employee contributions are protected by a reinsurance policy pledged to the employee who is enti-
tled to the pension. With both employee-funded plans, the employees must decide every year on the
pension contribution they wish to make.
In addition to the retirement benefits, the pension benefits also include surviving dependants’ pen-
sions and – except in the case of the Deferred Compensation Plan (DCP) – disability benefits.
The Pension Scheme 2000 / 2012 for Executives (Leistungsordnung 2000 / 2012 für Führungskräfte) is a
pure retirement pension plan with a monthly life-long pension. With the other pension plans, if the
capital amount is no more than EUR 25,000, the pension benefit is paid out as a lump sum or, if the
capital amount is more than EUR 25,000, the pension benefit is paid as an annual capital instalment
spread over a maximum of five years or as a life-long pension.
The retirement pension entitlements of the members of the Board of Management are described in
the chapter “Remuneration Report” of the Group management report.
Furthermore, in Germany, Brenntag still has isolated retirement and disability pension commitments
under pension plans set up in the past. These commitments depend on the years of service and the
pay grades of the respective employees. They are mainly commitments involving monthly pension
payments.
Canada
In Canada, Brenntag maintains an employer-funded pension plan with a life-long monthly pension for
employees who joined the company before December 31, 2011. The basis of assessment for calculat-
ing the annual pension is 1 % of the average salary of the three highest annual salaries of the benefi-
ciary multiplied by the number of years of service. In addition to the retirement benefits, the pension
benefits include disability and surviving dependants’ pensions.
C O N S O L I D A T E D F I N A N C I A L S T A T E M E N T S
Notes
A N N U A L R E P O R T 2 0 1 5 – B R E N N T A G A G1 9 6

The plan participants in the employer-funded pension plan who are under 50 or who have less than
15 years of service or less than 55 points (sum of age and years of service) must pay into a defined
contribution plan newly set up in 2014 in order to continue to build up their retirement pension. The
employees’ contribution is 3 % of their salary. The employer’s contribution is 4 % for this compulsory
part. The employees may voluntarily increase their contribution by a further 3 %. The employer’s con-
tribution for this voluntary part is between 3.25 % and 6 %, depending on the years of service. The
payment obligation accrued up to the date of transition remains.
Employees who joined the company on or after January 1, 2012 must pay at least 3 % of their salary
into a defined contribution pension plan in order to build up a retirement pension. The employer’s
contribution is 3 %. The employees may voluntarily increase their contribution by a further 3 %. The
employer’s contribution for this voluntary part is also 3 %.
For employees in Canada who joined the company up to and including May 31, 2013, there is an
employer-funded supplementary medical cost plan in retirement as well as a life insurance payment
of CAD 5,000 on retirement. As this plan has the characteristics of a pension, it is classified under pen-
sions and other post-employment benefits.
Netherlands
Company pension systems play a prominent role in the Netherlands as the pay-as-you-go statutory
pension scheme only provides a basic pension.
The companies maintain a funded retirement plan for their employees. When there is a change of
employer, the credit balance from the plan assets can either be transferred to the pension scheme of
the new employer or remain in the company. About 20 % of the retirement pension plan is funded by
the employee and about 80 % by the employer. Depending on the employer’s commitment, the basis
of assessment for calculating the annual pension is the last salary before the employee reaches retire-
ment age or the average salary over the employee’s active career before reaching retirement age.
Depending on the employer’s commitment, the annual pension is between 1.5 % and 1.75 % of the
salary reduced by a base amount and multiplied by the number of years of service. This base amount
represents the basic pension under the statutory pension scheme. The retirement pension plan is a
pure pension plan with a life-long monthly pension. In addition to the retirement benefits, the pen-
sion benefits include disability and surviving dependants’ pensions.
Risks arising from defined benefit pension plans
Brenntag is exposed to risks arising from the plans. An increase in life expectancy, salaries, as well as
the adjustment of pensions in line with inflation as required by law in Germany, or an increase in
medical costs in Canada, would lead to higher cash outflows and, in combination with falling discount
rates, in each case to higher present values of the defined benefit obligation. There is investment risk
in Switzerland primarily with regard to the proportion of the plan assets invested in shares. There is
no investment risk in Germany or the Netherlands as the plan assets consist solely of insurance policies.
In Canada, the plan assets consisting of external fund shares are in principle exposed to investment
risk. In order to minimize this risk, the plan assets in Canada are subject by law to an audit every three
years to establish whether the assets invested are sufficient to fund the pension obligations.
C O N S O L I D A T E D F I N A N C I A L S T A T E M E N T S
Notes
A N N U A L R E P O R T 2 0 1 5 – B R E N N T A G A G 1 9 7D
fu
rt
he
r
in
fo
rm
at
io
nf
in
an
ci
al
s
ta
te
me
nt
s
C
D

in EUR m Switzerland Germany Canada Netherlands Other countries Dec. 31, 2015
Present value of the defined benefit obligation 132.3 97.2 56.7 53.6 29.0 368.8
Fair value of plan assets – 108.2 – 17.0 – 45.0 – 46.0 – 4.2 – 220.4
Provisions for pensions and other post-employment benefits – net 24.1 80.2 11.7 7.6 24.8 148.4
thereof assets recognized – – 2.5 – – 2.5
Provisions for pensions and other post-employment benefits recognized in the balance sheet 24.1 80.2 14.2 7.6 24.8 150.9
c.58 provisions for pensions and other post-employment benefits by country / dec. 31, 2015
in % Switzerland Germany Canada Netherlands Other countries Weighted
Discount rate2015 0.70 2.40 4.20 2.40 3.17 2.13
2014 1.00 1.90 4.00 1.90 2.86 2.03
Expected salary trend2015 1.00 2.70 2.75 2.70 3.48 2.16
2014 1.50 2.70 3.25 2.70 3.62 2.47
Expected pension trend2015 0.25 1.75 2.25 1.75 2.26 1.33
2014 0.50 2.00 2.25 2.00 2.44 1.59
Medical cost trend2015 n.a. n.a. 6.23 n.a. n.a. 6.23
2014 n.a. n.a. 6.38 n.a. n.a. 6.38
c.57 actuarial parameters applied
Actuarial parameters applied
The plan assets are measured at fair value. The calculation of the present value of the benefit obligations
is based on the following main actuarial parameters. When several countries are grouped together,
the values are average values weighted by the present value of the respective benefit obligation:
With respect to life expectancy, in Germany the Heubeck 2005 G mortality tables (generational tables)
are taken as a basis. In Switzerland, the BVG-2010 generational mortality tables are used. In the Nether-
lands, we use the “Prognose Tafel 2014” table and, in Canada, the “UP94 generational mortality table”.
Provisions for pensions and other post-employment benefits by country
C O N S O L I D A T E D F I N A N C I A L S T A T E M E N T S
Notes
A N N U A L R E P O R T 2 0 1 5 – B R E N N T A G A G1 9 8

in EUR m Switzerland Germany Canada Netherlands Other countries Dec. 31, 2014
Present value of the defined benefit obligation 120.4 102.4 61.7 62.3 28.1 374.9
Fair value of plan assets – 96.6 – 15.8 – 43.7 – 52.4 – 3.8 – 212.3
Provision for pensions and other post-employment benefits recognized in the balance sheet 23.8 86.6 18.0 9.9 24.3 162.6
c.59 provision for pensions and other post-employment benefits by country / dec. 31, 2014
Pension obligations, plan assets and provisions for pensions and other post-employment benefits rec-
ognized in the balance sheet changed as follows:
Change in the present value of the defined benefit obligations
in EUR m Principal
pension plansOther
countries 2015Principal
pension plansOther
countries 2014
Present value of pension obligations at the beginning of the period 346.8 28.1 374.9 261.9 21.2 283.1
Exchange rate differences 9.0 0.1 9.1 4.9 0.6 5.5
Addition from business combinations – – – – 1.1 1.1
Utilizations – 11.8 – 1.0 – 12.8 – 9.3 – 1.0 – 10.3
Service cost
Current service cost 10.1 1.7 11.8 8.1 1.2 9.3
Past service cost – – – – 0.8 – – 0.8
Employee contributions 1.5 – 1.5 1.4 – 1.4
Interest expense on the present value of the obligation 6.7 0.9 7.6 8.7 0.9 9.6
Settlements – 1.5 – – 1.5 – – –
Remeasurement components
Change in economic assumptions – 17.7 – 1.9 – 19.6 70.0 4.2 74.2
Change in demographic assumptions – – – 1.4 – 1.4
Experience adjustments – 3.3 1.1 – 2.2 0.5 – 0.1 0.4
Present value of pension obligations at the end of the period 339.8 29.0 368.8 346.8 28.1 374.9
c.60 change in the present value of the defined benefit obligations
C O N S O L I D A T E D F I N A N C I A L S T A T E M E N T S
Notes
A N N U A L R E P O R T 2 0 1 5 – B R E N N T A G A G 1 9 9D
fu
rt
he
r
in
fo
rm
at
io
nf
in
an
ci
al
s
ta
te
me
nt
s
C
D

in EUR m Principal
pension plansOther
countries 2015Principal
pension plansOther
countries 2014
Fair value of plan assets at the beginning of the period 208.5 3.8 212.3 178.7 3.4 182.1
Exchange rate differences 7.2 – 0.1 7.1 3.8 – 3.8
Utilizations – 10.3 – 0.2 – 10.5 – 7.9 – 0.3 – 8.2
Employer contributions 7.4 0.6 8.0 7.8 0.6 8.4
Administrative costs for plan assets – 0.4 – – 0.4 – 0.4 – – 0.4
Employee contributions 1.5 – 1.5 1.4 – 1.4
Interest income on plan assets 4.1 0.1 4.2 5.6 0.2 5.8
Settlements – 1.1 – – 1.1 – – –
Remeasurement components Income / (expense) from plan assets(excl. amounts in net interest expense) – 0.7 – – 0.7 19.5 – 0.1 19.4
Fair value of plan assets at the end of the period 216.2 4.2 220.4 208.5 3.8 212.3
c.61 change in the fair value of plan assets
The present value of pension obligations totalling EUR 368.8 million (Dec. 31, 2014: EUR 374.9 mil-
lion) includes pension obligations for members of the Board of Management amounting to EUR 16.0
million (Dec. 31, 2014: EUR 14.5 million). This figure includes pension obligations in the amount of
EUR 9.3 million for former members of the Board of Management.
The income from settlements in the amount of EUR 0.4 million recognized in 2015 (pension obliga-
tion of EUR 1.5 million less fair value of plan assets of EUR 1.1 million) is the result of a relocation of
business and the consequent reduction in workforce numbers.
In the Netherlands, the basis of assessment for calculating the annual pension has been reduced. A
cap of EUR 100,000 has also been set for wages and salaries used in the pension calculation. In addi-
tion, for commitments for which the last salary prior to reaching retirement is taken to calculate the
pension and multiplied by the years of service and a multiplier, the multiplier has been reduced from
1.75 % to 1.657 %. In 2014, the resulting return of EUR 0.8 million is presented as a plan amendment
in past service cost.
Change in the fair value of plan assets
C O N S O L I D A T E D F I N A N C I A L S T A T E M E N T S
Notes
A N N U A L R E P O R T 2 0 1 5 – B R E N N T A G A G2 0 0

Change in provisions for pensions and other post-employment benefits recognized in the
balance sheet
in EUR m Principal
pension plansOther
countries 2015Principal
pension plansOther
countries 2014
Provisions for pensions and other post-employment benefits at the beginning of the period 138.3 24.3 162.6 83.2 17.8 101.0
Exchange rate differences 1.8 0.2 2.0 1.1 0.6 1.7
Addition from business combinations – – – – 1.1 1.1
Utilizations – 1.5 – 0.8 – 2.3 – 1.4 – 0.7 – 2.1
Employer contributions – 7.4 – 0.6 – 8.0 – 7.8 – 0.6 – 8.4
Service cost 10.1 1.7 11.8 7.3 1.2 8.5
Administrative costs for plan assets 0.4 – 0.4 0.4 – 0.4
Net interest expense 2.6 0.8 3.4 3.1 0.7 3.8
Settlements – 0.4 – – 0.4 – – –
Remeasurement components – 20.3 – 0.8 – 21.1 52.4 4.2 56.6
Provision for pensions and other post-employment benefits – net 123.6 24.8 148.4 – – –
thereof assets recognized 2.5 – 2.5 – – –
Provision for pensions and other post-employment benefits recognized in the balance sheet 126.1 24.8 150.9 138.3 24.3 162.6
c.62 change in provisions for pensions and other post-employment benefits recognized in the balance sheet
Recognized provisions for pensions include EUR 14.1 million (Dec. 31, 2014: EUR 15.0 million) for the
supplemental medical cost plan in Canada. Pension costs recognized in the income statement for obli-
gations under defined benefit plans total EUR 15.2 million (2014: EUR 12.7 million). Net interest
expense is presented within net finance costs. Service cost and administrative costs for plan assets are
allocated to the functions within operating profit.
C O N S O L I D A T E D F I N A N C I A L S T A T E M E N T S
Notes
A N N U A L R E P O R T 2 0 1 5 – B R E N N T A G A G 2 0 1D
fu
rt
he
r
in
fo
rm
at
io
nf
in
an
ci
al
s
ta
te
me
nt
s
C
D

in EUR m Principal
pension plansOther
countries 2015Principal
pension plansOther
countries 2014
Present value of the pension obligations funded by plan assets, thereof: 261.8 10.2 272.0 263.6 8.4 272.0
Active members with lump-sum payout – 7.8 7.8 – 6.4 6.4
Active members with monthly pension 124.2 2.0 126.2 123.9 1.6 125.5
Active members with option to choose 19.2 – 19.2 18.7 – 18.7
Former employees with vested rights to lump-sum payment 0.2 – 0.2 0.2 – 0.2
Former employees with vested rights to monthly pension 13.2 – 13.2 15.7 – 15.7
Former employees with vested rights with option to choose 6.6 – 6.6 7.1 – 7.1
Pensioners with monthly pension 98.4 0.4 98.8 98.0 0.4 98.4
Present value of the pension obligations not funded by plan assets, thereof: 63.9 18.8 82.7 68.2 19.7 87.9
Active members with lump-sum payout 14.4 9.8 24.2 14.1 11.3 25.4
Active members with monthly pension 24.8 8.9 33.7 29.0 7.8 36.8
Active members with option to choose – – – – – –
Former employees with vested rights to lump-sum payment 3.5 – 3.5 3.4 – 3.4
Former employees with vested rights to monthly pension 3.0 – 3.0 3.2 – 3.2
Former employees with vested rights with option to choose – – – – – –
Pensioners with monthly pension 18.2 0.1 18.3 18.5 0.6 19.1
Medical cost plan 14.1 – 14.1 15.0 – 15.0
Present value of pension obligations at the end of the period 339.8 29.0 368.8 346.8 28.1 374.9
Weighted average duration of the pension obligations in years 17 15 17 17 15 17
c.63 breakdown of the present values of defined benefit obligations by members
The present values of the defined benefit obligations break down as follows into active members, for-
mer employees with vested rights and pensioners, split according to the payout method, resulting in
the following weighted average duration of the defined benefit obligations:
C O N S O L I D A T E D F I N A N C I A L S T A T E M E N T S
Notes
A N N U A L R E P O R T 2 0 1 5 – B R E N N T A G A G2 0 2

The pension payments to be made by the company directly amount to EUR 2.3 million in 2015
(2014: EUR 2.1 million). From today’s point of view, the cash outflow resulting from pension pay-
ments made by the company directly will remain at a level of EUR 2 to 3 million in the long term.
The pension payments expected to be made by the company directly in 2016 total EUR 2.9 million.
The fair value of the plan assets disaggregates into the following asset classes:
in EUR m Switzerland Germany Canada Netherlands Other countries Dec. 31, 2015
Shares 10.6 – 21.4 – – 32.0
Fixed-interest securities 11.9 – 22.0 – 1.0 34.9
Insurance policies 78.9 17.0 – 46.0 2.5 144.4
Cash and cash equivalents 6.8 – 1.6 – 0.7 9.1
Fair value of plan assets 108.2 17.0 45.0 46.0 4.2 220.4
c.64 fair value of the plan assets by asset class / dec. 31, 2015
in EUR m Switzerland Germany Canada Netherlands Other countries Dec. 31, 2014
Shares 9.2 – 24.3 – – 33.5
Fixed-interest securities 12.1 – 18.8 – 0.9 31.8
Insurance policies 68.9 15.8 – 52.4 2.4 139.5
Cash and cash equivalents 6.4 – 0.6 – 0.5 7.5
Fair value of plan assets 96.6 15.8 43.7 52.4 3.8 212.3
c.65 fair value of the plan assets by asset class / dec. 31, 2014
The plan assets are solely for fulfilling the defined benefit obligations and constitute protection for
pension entitlements, which is a legal requirement in some countries and is voluntary in other countries.
The structure of the plan assets is reviewed at regular intervals. All assets, which, in Brenntag’s case,
mainly consist of insurance policies, are tailored long-term to the amount and maturity of the pension
commitments, taking investment risks and statutory regulations governing the investment of retire-
ment assets into account.
Owing to the composition of the plan assets, investment risk at Brenntag is limited to securities traded
in active markets (shares and fixed-interest securities). This part is subject to market fluctuations (2015:
30.4 % of plan assets; 2014: 30.8 % of plan assets). All other assets are not traded in an active market.
The payments made into the plan assets, which, according to the plan rules, consist almost exclusively
of obligatory payments, amount to EUR 8.0 million (2014: EUR 8.4 million). From today’s point-of-view,
the cash outflow resulting from contributions made by the company will remain at a level of EUR 7 to
9 million in the long term. Payments into plan assets for financial year 2016 are expected to total
EUR 7.2 million.
C O N S O L I D A T E D F I N A N C I A L S T A T E M E N T S
Notes
A N N U A L R E P O R T 2 0 1 5 – B R E N N T A G A G 2 0 3D
fu
rt
he
r
in
fo
rm
at
io
nf
in
an
ci
al
s
ta
te
me
nt
s
C
D

Sensitivity analysis of the present value of the defined benefit obligation
The sensitivity analysis takes into account in each case the change in an assumption and the resulting
effects on the defined benefit obligations, the other assumptions remaining the same as in the origi-
nal calculation.
in EUR m Principal
pension plansOther
countries 2015Principal
pension plansOther
countries 2014
Discount rate
Increase by 0.5 percentage points – 25.0 – 1.7 – 26.7 – 27.0 – 1.7 – 28.7
Decrease by 0.5 percentage points 28.3 1.8 30.1 30.3 1.8 32.1
Expected salary trend
Increase by 0.5 percentage points 2.5 1.2 3.7 2.8 1.3 4.1
Decrease by 0.5 percentage points – 2.4 – 1.1 – 3.5 – 2.6 – 1.1 – 3.7
Expected pension trend
Increase by 0.5 percentage points 9.9 0.7 10.6 9.9 0.7 10.6
Decrease by 0.5 percentage points – 9.2 – 0.7 – 9.9 – 9.1 – 0.6 – 9.7
Medical cost trend
Increase by 0.5 percentage points 1.4 – 1.4 1.3 – 1.3
Decrease by 0.5 percentage points – 1.2 – – 1.2 – 1.1 – – 1.1
c.66 sensitivity analysis of the present value of the defined benefit obligation
A 10 % decrease in the mortality rates leads to an increase in life expectancy, depending on the indi-
vidual age of each beneficiary. That means, for example, that the life expectancy of a 63-year-old
employee as at December 31, 2015 increases by about one year. In order to determine the sensitivity
of longevity, the mortality rates for the beneficiaries were reduced by 10 %. If the mortality rates
decreased by 10 %, the present value of the defined benefit obligation would increase by EUR 10.6
million (2014: EUR 11.0 million) in the case of the principal pension plans and by EUR 0.4 million
(2014: EUR 0.3 million) in the other countries.
28.) LIABILITIES RELATING TO ACQUISITION OF NON-CONTROLLING INTERESTS
The liabilities relating to the acquisition of non-controlling interests break down as follows:
in EUR m Dec. 31, 2015 Dec. 31, 2014
Liabilities relating to acquisition of non-controlling interests 67.0 37.6
Liabilities arising from limited partners' rights to repayment of contributions 1.7 2.1
Total 68.7 39.7
c.67 liabilities relating to acquisition of non-controlling interests
C O N S O L I D A T E D F I N A N C I A L S T A T E M E N T S
Notes
A N N U A L R E P O R T 2 0 1 5 – B R E N N T A G A G2 0 4
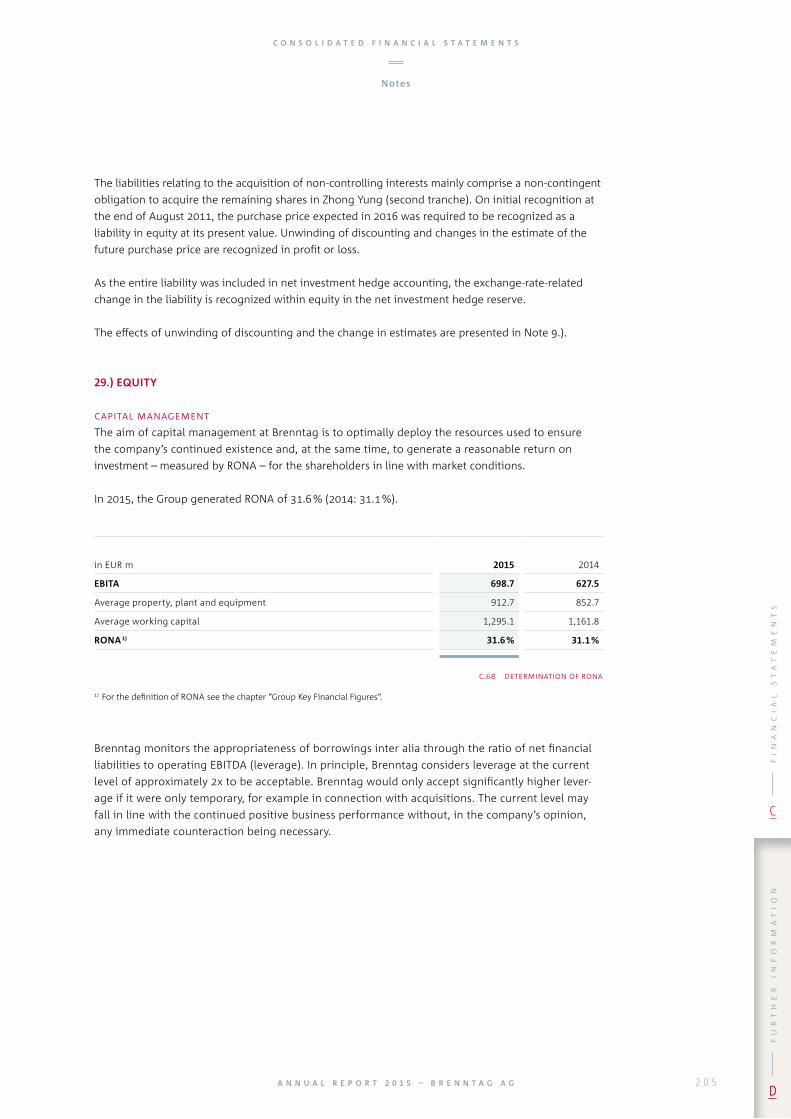
The liabilities relating to the acquisition of non-controlling interests mainly comprise a non-contingent
obligation to acquire the remaining shares in Zhong Yung (second tranche). On initial recognition at
the end of August 2011, the purchase price expected in 2016 was required to be recognized as a
liability in equity at its present value. Unwinding of discounting and changes in the estimate of the
future purchase price are recognized in profit or loss.
As the entire liability was included in net investment hedge accounting, the exchange-rate-related
change in the liability is recognized within equity in the net investment hedge reserve.
The effects of unwinding of discounting and the change in estimates are presented in Note 9.).
29.) EQUITY
capital management
The aim of capital management at Brenntag is to optimally deploy the resources used to ensure
the company’s continued existence and, at the same time, to generate a reasonable return on
investment – measured by RONA – for the shareholders in line with market conditions.
In 2015, the Group generated RONA of 31.6 % (2014: 31.1 %).
in EUR m 2015 2014
EBITA 698.7 627.5
Average property, plant and equipment 912.7 852.7
Average working capital 1,295.1 1,161.8
RONA 1) 31.6 % 31.1 %
c.68 determination of rona
1) For the definition of RONA see the chapter “Group Key Financial Figures”.
Brenntag monitors the appropriateness of borrowings inter alia through the ratio of net financial
liabilities to operating EBITDA (leverage). In principle, Brenntag considers leverage at the current
level of approximately 2x to be acceptable. Brenntag would only accept significantly higher lever-
age if it were only temporary, for example in connection with acquisitions. The current level may
fall in line with the continued positive business performance without, in the company’s opinion,
any immediate counteraction being necessary.
C O N S O L I D A T E D F I N A N C I A L S T A T E M E N T S
Notes
A N N U A L R E P O R T 2 0 1 5 – B R E N N T A G A G 2 0 5D
fu
rt
he
r
in
fo
rm
at
io
nf
in
an
ci
al
s
ta
te
me
nt
s
C
D

subscribed capital
As at December 31, 2015, the subscribed capital of Brenntag AG totalled EUR 154.5 million. The share
capital is divided into 154,500,000 no-par-value registered shares, each with a notional value of EUR 1.00.
According to article 7, para. 3 of the Articles of Association of Brenntag AG, any right of sharehold-
ers to certification of their shares is excluded to the extent permitted by law and that certification is
not required under the rules of any stock exchange on which the share is admitted for trading. The
company is entitled to issue share certificates embodying several shares (consolidated certificates).
Pursuant to Section 67, para. 2 of the German Stock Corporation Act (AktG) only those persons
recorded in the company’s share register will be recognized as shareholders of Brenntag AG. For
purposes of recording the shares in the company’s share register, shareholders are required to sub-
mit to Brenntag AG the number of shares held by them, and, in the case of individuals, their name,
address and date of birth, or in the case of legal entities, their company name, business address
and registered offices. All shares confer the same rights and obligations. At the General Sharehold-
ers’ Meeting, each share has one vote and accounts for the shareholders’ proportionate share in
the net income of Brenntag AG. Excepted from this rule are any treasury shares held by Brenntag AG
that do not entitle Brenntag AG to any membership rights. Brenntag AG does not currently have
any treasury shares. The shareholders’ rights and obligations are governed by the provisions of the
German Stock Corporation Act, in particular by Sections 12, 53a ff., 118 ff. and 186 of the German
Stock Corporation Act.
In the previous year, by resolution of the General Shareholders’ Meeting on June 17, 2014, the
share capital of EUR 51.5 million was increased to the new figure of EUR 154.5 million by converting
EUR 103.0 million of the additional paid-in capital shown in the balance sheet as at December 31, 2013.
This capital increase was carried out by issuing 103,000,000 new registered shares to the sharehold-
ers. Each existing shareholder thereby received two further shares for each share already held, so that
the portion of the share capital owned by the shareholders remained unchanged despite the capital
increase.
in EUR m 2015 2014
Non-current financial liabilities 2,094.4 1,567.6
Current financial liabilities 160.8 334.0
Less cash and cash equivalents – 579.1 – 491.9
Net financial liabilities 1,676.1 1,409.7
Operating EBITDA 807.4 726.7
Net financial liabilities / operating EBITDA 2.1x 1.9x
c.69 net financial liabilities / operating ebitda
The ratio of net financial liabilities to operating EBITDA increased from 1.9 to 2.1 due to the business
combinations carried out in the reporting year.
C O N S O L I D A T E D F I N A N C I A L S T A T E M E N T S
Notes
A N N U A L R E P O R T 2 0 1 5 – B R E N N T A G A G2 0 6

additional paid-in capital
The additional paid-in capital amounts to EUR 1,491.4 million (2014: EUR 1,457.1 million).
As a result of the issue of the bond with warrant units in November 2015, the additional paid-in capi-
tal increased by EUR 34.5 million. This increase is the warrant premium which was recognized in the
Group’s additional paid-in capital. Costs in the amount of EUR 0.3 million in connection with the issue
of the bond with warrant units were offset directly against the additional paid-in capital, taking rele-
vant tax effects in the amount of EUR 0.1 million into account.
retained earnings
The retained earnings include cumulative profit after tax and the remeasurement component of the
defined benefit pension plans including deferred taxes. Furthermore, transactions with owners are
also recognized here. The latter are effects of share purchases and sales which have no influence on
existing control and are recognized in retained earnings. In financial year 2015, liabilities relating to
the acquisition of non-controlling interests in the amount of EUR 3.7 million were recognized directly
in equity on initial recognition.
As proposed by the Board of Management and the Supervisory Board, the ordinary General Shareholders’
Meeting of Brenntag AG on June 9, 2015 passed a resolution to pay a dividend of EUR 139.1 million
(2014: EUR 133.9 million). Based on 154.5 million shares, that is a dividend of EUR 0.90 (2014: EUR 0.87)
per no-par-value share entitled to a dividend.
At the General Shareholders’ Meeting on June 14, 2016, the Board of Management and the Super-
visory Board will propose that a dividend of EUR 154,500,000.00 be paid. Based on 154.5 million
shares, this is a dividend of EUR 1.00 per no-par-value share entitled to a dividend.
other components of equity / non-controlling interests
Other components of equity contain the cumulative gain / loss from exchange rate differences, the net
investment hedge reserve and the cash flow hedge reserve including deferred taxes.
The cumulative gain / loss from exchange rate differences contains the differences from the translation
of the financial statements of foreign companies into the Group currency (euro), which are recognized
in other comprehensive income.
Exchange rate differences from liabilities included in net investment hedge accounting are recognized
within equity in the net investment hedge reserve.
The cash flow hedge reserve contains the effective portions of the cumulative changes in the fair
value of derivative financial instruments included in cash flow hedge accounting.
C O N S O L I D A T E D F I N A N C I A L S T A T E M E N T S
Notes
A N N U A L R E P O R T 2 0 1 5 – B R E N N T A G A G 2 0 7D
fu
rt
he
r
in
fo
rm
at
io
nf
in
an
ci
al
s
ta
te
me
nt
s
C
D

powers of the board of management to issue and repurchase shares
Authorization to create authorized capital
By resolution of the General Shareholders’ Meeting on June 17, 2014, the Board of Management was
authorized, subject to the consent of the Supervisory Board, to increase the registered share capital of
Brenntag AG in one or more tranches by up to EUR 77,250,000 in aggregate by issuing up to 77,250,000
new no-par-value registered shares against cash contributions or non-cash contributions in the period
ending on June 16, 2019. In principle, shareholders are to be granted a subscription right for new
shares. However, in certain cases the Board of Management is authorized, subject to the consent of the
Supervisory Board, to exclude the statutory subscription right in relation to one or more increases in the
registered share capital within the scope of the authorized share capital. This shall apply, for example, if
the increase in the registered share capital is effected against contribution in cash and provided that the
issue price of the new shares is not substantially lower (within the meaning of Section 203, para. 1 and
para. 2 and Section 186, para. 3, sentence 4 of the German Stock Corporation Act) than the market price
for shares in the Company of the same class and having the same conditions already listed at the time
of the final determination of the issue price and provided that the amount of the registered share capi-
tal represented by the shares issued pursuant to this paragraph subject to the exclusion of the statutory
subscription right in accordance with Section 186, para. 3, sentence 4 of the German Stock Corporation
Act does not exceed 10 % of the registered share capital in the amount of EUR 154,500,000 (simplified
exclusion of subscription rights). Details can be found in the Articles of Association of Brenntag AG,
which are available on the website at www.brenntag.com under Investor Relations.
The Board of Management determines, subject to the consent of the Supervisory Board, the further
details regarding the rights attached to the shares and the conditions of the share issue.
Non-controlling interests comprise the shares of non-Group shareholders in the equity of consoli-
dated entities. The non-controlling interests changed as follows:
in EUR m
Subscribed capital, retained
earnings and additional
paid-in capitalExchange-rate
differencesNon-controlling
interests
Dec. 31, 2013 25.7 2.4 28.1
Profit after tax 0.4 – 0.4
Other comprehensive income – 2.9 2.9
Total comprehensive income 0.4 2.9 3.3
Dec. 31, 2014 26.1 5.3 31.4
Dividends – 0.1 – – 0.1
Business combinations 7.5 – 7.5
Profit after tax 3.1 – 3.1
Other comprehensive income – 2.2 2.2
Total comprehensive income 3.1 2.2 5.3
Dec. 31, 2015 36.6 7.5 44.1
c.70 change in non-controlling interests
C O N S O L I D A T E D F I N A N C I A L S T A T E M E N T S
Notes
A N N U A L R E P O R T 2 0 1 5 – B R E N N T A G A G2 0 8

Authorization to purchase and use treasury shares in accordance with Section 71, para. 1, No. 8 of
the German Stock Corporation Act
By resolution of the General Shareholders’ Meeting on June 17, 2014, the Board of Management was
authorized, subject to the consent of the Supervisory Board, to purchase treasury shares up to a total
amount equal to no more than 10 % of the registered share capital. In this connection, the shares pur-
chased on the basis of this authorization together with other shares of the Company which Brenntag AG
has already purchased and still holds shall not exceed 10 % of the respective registered share capital.
The authorization may be exercised to the full extent of repurchases thereby authorized or in partial
amounts, on one or several occasions. It took effect upon the conclusion of the General Shareholders’
Meeting on June 17, 2014 and shall apply until June 16, 2019. If the purchase of shares is effected on
the stock market, the purchase price may not be more than 10 % higher or lower than the arithmetic
mean value of the closing prices on the Frankfurt am Main stock exchange for the last five trading days
preceding the purchase or the assumption of an obligation to purchase. If purchase is effected by way
of a public purchase offer to all shareholders or by other means in accordance with Section 53a of the
German Stock Corporation Act, the purchase price paid to the shareholders in each case may not be
more than 10 % higher or lower than the arithmetic mean value of the closing prices on the Frankfurt
am Main stock exchange for the last five trading days preceding the publication of the offer or, in the
case of purchase by other means, preceding the purchase. The authorization may be exercised for any
purpose permitted by law. Treasury shares may, under certain circumstances, also be used subject to
exclusion of the shareholders’ subscription rights existing in principle and in particular by way of simpli-
fied exclusion of subscription rights as specified above.
Authorization to issue bonds and to create conditional capital
By resolution of the General Shareholders’ Meeting on June 17, 2014, the Board of Management was
authorized, subject to the consent of the Supervisory Board, to issue in one or more tranches in the
period up to June 16, 2019 registered or bearer warrant-linked or convertible bonds as well as profit-
sharing certificates conferring option or conversion rights in an aggregate nominal amount of up to
EUR 2,000,000,000 of limited or unlimited term (hereinafter collectively “Bonds”) and to grant the hold-
ers or creditors of the Bonds option or conversion rights for up to 25,750,000 new shares of Brenntag AG
with a pro-rata amount of the registered share capital of up to EUR 25,750,000 further subject to the
terms and conditions of the respective warrant-linked or convertible bonds and / or terms and condi-
tions of the profit-sharing certificates to be defined by the Board of Management (hereinafter in each
case “Terms and Conditions”). Other than in euros, the Bonds may also be issued – subject to the limita-
tion to the corresponding equivalent value in euros – in a foreign legal currency. The Bonds may also be
issued by companies which are controlled by Brenntag AG or in which it holds a majority interest; in
such case, the Board of Management was authorized, subject to the consent of the Supervisory Board,
to assume on behalf of Brenntag AG, the guarantee for the Bonds and to grant the holders of such
Bonds option and / or conversion rights for shares of Brenntag AG and to effect any further declarations
and acts as are required for a successful issue. The issues of the Bonds may in each case be divided into
partial bonds with equal entitlement amongst themselves. The issue of Bonds may also be effected
against non-cash contributions, provided that the value of the non-cash contribution is equal to the
issue price and such issue price is not substantially lower than the market value of the Bonds. The Board
of Management is authorized, under certain circumstances and subject to the consent of the Supervi-
sory Board, to exclude the subscription right of the shareholders for the Bonds. However, such authori-
zation to exclude the subscription rights shall apply only provided that the shares issued to fulfil the
option or conversion rights and / or in the case of fulfilment of the conversion obligation represent no
more than 10 % of the registered share capital. Decisive for the threshold of 10 % is the registered share
capital in the amount of EUR 154,500,000 (simplified exclusion of subscription rights).
C O N S O L I D A T E D F I N A N C I A L S T A T E M E N T S
Notes
A N N U A L R E P O R T 2 0 1 5 – B R E N N T A G A G 2 0 9D
fu
rt
he
r
in
fo
rm
at
io
nf
in
an
ci
al
s
ta
te
me
nt
s
C
D

If convertible bonds or profit-sharing certificates conferring conversion rights are issued, their holders
shall be granted the right to convert their Bonds into new shares of Brenntag AG further subject to
the specific Terms and Conditions.
If warrant-linked bonds or profit-sharing certificates conferring option rights are issued, one or more
warrants shall be attached to each partial bond and / or each profit-sharing certificate which entitle
the holder to subscribe shares of Brenntag AG further subject to the specific Terms and Conditions.
By resolution of the General Shareholders’ Meeting on June 17, 2014, the registered share capital of
Brenntag AG was conditionally increased by up to EUR 25,750,000 by issuing up to 25,750,000 new
no-par-value registered shares conferring profit-sharing rights from the beginning of the financial
year in which they were issued. The conditional capital increase serves to grant shares to the holders
or creditors of warrant-linked or convertible bonds as well as profit-sharing certificates with option or
conversion rights which are issued in the period up to June 16, 2019, based on the authorization
approved by the General Shareholders’ Meeting. The conditional capital increase will only be imple-
mented to the extent that warrants or conversion rights under warrant-linked bonds and convertible
bonds have been exercised or conversion obligations under such Bonds have to be fulfilled and to the
extent that neither treasury shares nor new shares from the authorized capital are used to fulfil such
claims. The Board of Management was authorized to stipulate the additional details of the implemen-
tation of the conditional capital increase.
In November 2015, Brenntag issued bonds with warrant units in the amount of USD 500.0 million. The
bonds were offered only to institutional investors outside the USA. Shareholders’ subscription rights
were excluded. The bonds (Bond (with Warrants) 2022), which are guaranteed by Brenntag AG, were
issued by Brenntag Finance B.V., with warrants issued by Brenntag AG attached. The warrants entitle the
holder to purchase Brenntag AG ordinary shares by paying the strike price applicable at that time. The
bonds-with-warrants issue generated options on approximately 6.5 million shares. This is equal to
4.2 % of the registered share capital on the reporting date. In the event of any future capital measures
under the current authorizations described above, Brenntag may, therefore, only further exclude the
subscription right by way of the simplified exclusion of subscription rights up to a maximum amount,
as at the reporting date, of 5.8 % of the registered share capital. The Terms and Conditions of the
bonds with warrant units allow Brenntag to settle exercised options both from the conditional capital
described above and from the authorized capital described above or from the treasury shares it holds
or to buy back the warrants. The bonds with warrants, the underlying bonds and the warrants have a
term of seven years. The investor may detach the warrants from the bonds. The bonds with warrants,
bonds detached from warrants and detached warrants were admitted to trading on the Open Market
(Freiverkehr) segment of the Frankfurt Stock Exchange.
C O N S O L I D A T E D F I N A N C I A L S T A T E M E N T S
Notes
A N N U A L R E P O R T 2 0 1 5 – B R E N N T A G A G2 1 0

in EUR m 2015 2014
Decrease / increase in inventories 64.2 – 51.1
Decrease / increase in gross trade receivables 109.9 – 68.4
Decrease / increase in trade payables – 90.2 20.8
Valuation allowances on trade receivables and on inventories 1) 3.1 – 1.8
Change in working capital 2) 87.0 – 100.5
c.71 change in working capital
At 8.0, the annualized working capital turnover 3) in the reporting period fell by 0.6 compared with the
level of 2014 (8.6).
Of the interest payments, EUR 3.2 million (2014: EUR 3.0 million) relate to interest received and
EUR 70.4 million (2014: EUR 73.2 million) to interest paid.
3) Ratio of annual sales to average working capital. Average working capital is defined for a particular year as the average of the values for working capital at each of the following five times: the beginning of the year, the end of each of the first, second and third quarters, and the end of the year.
1) Presented within other non-cash items.2) Adjusted for exchange-rate effects and acquisitions.
31.) SEGMENT REPORTING
The Brenntag Group operates solely in the chemical distribution business and is managed through
the regions EMEA, North America, Latin America and Asia Pacific. The activities are allocated to these
segments on the basis of the location of the registered office of the respective subsidiary. Allocation
of the activities on the basis of the location of the registered offices of the customers would not lead
to a different segmentation. The geographical segmentation reflects control and supervision by the
management and permits a reliable estimate of risks and rewards.
Central functions for the entire Group and the international business of Brenntag International
Chemicals are combined as all other segments.
30.) CONSOLIDATED CASH FLOW STATEMENT DISCLOSURES
The net cash inflow from operating activities amounting to EUR 593.7 million was influenced by cash
inflows from the reduction in working capital of EUR 87.0 million.
The reduction in working capital resulted from changes in inventories, gross trade receivables and
trade payables as well as from valuation allowances on trade receivables and inventories as follows:
C O N S O L I D A T E D F I N A N C I A L S T A T E M E N T S
Notes
A N N U A L R E P O R T 2 0 1 5 – B R E N N T A G A G 2 1 1D
fu
rt
he
r
in
fo
rm
at
io
nf
in
an
ci
al
s
ta
te
me
nt
s
C
D

The allocation of external sales to the different countries is shown in the following table:
in EUR m Germany USA UK France Others Group
External sales2015 1,138.3 3,323.6 503.5 495.6 4,885.1 10,346.1
2014 1,291.7 3,049.1 510.7 519.0 4,645.1 10,015.6
c.73 external sales by country
in EUR m Germany USA UK France Others Group
Property, plant and equipment
Dec. 31, 2015 88.2 267.2 42.0 88.4 486.1 971.9
Dec. 31, 2014 90.6 196.3 41.6 89.0 461.8 879.3
Intangible assetsDec. 31, 2015 378.6 1,237.9 128.6 145.6 881.4 2,772.1
Dec. 31, 2014 379.4 800.2 124.7 147.9 815.8 2,268.0
c.72 non-current assets by country
All consolidation adjustments between the segments are presented separately. Differences between
the figures from the segment reporting and the corresponding figures in the consolidated financial
statements are presented as a reconciliation. All transactions between companies within a segment
have been eliminated. The Group accounts for inter-segment sales transactions as if the transactions
were made with third parties at current prices (arm’s length principle).
The key earnings metric used at Brenntag for segment management is operating EBITDA. Operating
EBITDA is the operating profit / loss as reported in the consolidated income statement plus amortiza-
tion of intangible assets and depreciation of property, plant and equipment, adjusted for the follow-
ing items:
Transaction costs: costs associated with restructuring under company law and refinancing. They are
eliminated for management reporting purposes to permit proper presentation of operating perfor-
mance and comparability at segment level.
Holding charges: certain costs charged between holding companies and operating companies. At
Group level they net to zero.
There are no significant non-cash items in the reporting period.
In financial year 2015, there were no impairments of property, plant and equipment and intangible
assets. In 2014, impairment losses on property, plant and equipment in the amount of EUR 0.2 million
related to the EMEA segment. They were presented in selling expenses.
Non-current assets comprise property, plant and equipment and intangible assets. Non-current assets
are allocated to the different countries as follows:
C O N S O L I D A T E D F I N A N C I A L S T A T E M E N T S
Notes
A N N U A L R E P O R T 2 0 1 5 – B R E N N T A G A G2 1 2

32.) OTHER FINANCIAL OBLIGATIONS AND CONTINGENT LIABILITIES
The following other financial obligations exist:
Remaining term
in EUR mless than
1 year 1 to 5 yearsmore than
5 years Dec. 31, 2015
Purchase commitments in respect of property, plant and equipment 1.0 – – 1.0
Obligations from future minimum lease payments for operating leases 80.4 194.6 79.4 354.4
Total 81.4 194.6 79.4 355.4
c.74 other financial obligations and contingent liabilities / dec. 31, 2015
Remaining term
in EUR mless than
1 year 1 to 5 yearsmore than
5 years Dec. 31, 2014
Purchase commitments in respect of property, plant and equipment 0.9 – – 0.9
Obligations from future minimum lease payments for operating leases 67.6 154.3 31.3 253.2
Total 68.5 154.3 31.3 254.1
c.75 other financial obligations and contingent liabilities / dec. 31, 2014
Obligations from future minimum lease payments for operating leases mainly relate to obligations
from the leasing of land and buildings as well as operating and office equipment.
In connection with the elimination of environmental damage, as at December 31, 2015, there are con-
tingent liabilities with a fair value of EUR 2.5 million (Dec. 31, 2014: EUR 2.7 million).
C O N S O L I D A T E D F I N A N C I A L S T A T E M E N T S
Notes
A N N U A L R E P O R T 2 0 1 5 – B R E N N T A G A G 2 1 3D
fu
rt
he
r
in
fo
rm
at
io
nf
in
an
ci
al
s
ta
te
me
nt
s
C
D
33.) LEGAL PROCEEDINGS AND DISPUTES
Brenntag AG and individual subsidiaries have been named as defendants in various legal actions and
proceedings arising in connection with its activities as a global group. Occasionally, Brenntag is also
the subject of investigations by the authorities. Brenntag cooperates with the relevant authorities
and, where appropriate, conducts internal investigations regarding potential wrongdoings with the
assistance of in-house and external counsel.
In 2013, Brenntag received the decision of the French Competition Authority in relation to the alloca-
tion of customers and coordination of prices. In this, the Authority imposed a fine of EUR 47.8 million
against BRENNTAG SA and another party as well as a separate fine of EUR 5.3 million against the other
party - the fines were for violations of French competition law in the period from 1998 until 2005.
Brenntag had to pay the fine in the third quarter of 2013 but does not agree with the legal assess-
ment of the facts and the determination of the fine and has therefore appealed against the decision
of the French Competition Authority. BRENNTAG SA applied for leniency in 2006 and has actively con-
tributed to the investigation and provided all information and proof, working closely together with
the French Competition Authority regarding the clarification of the facts. Regarding the ongoing
investigation by the French Competition Authority concerning whether BRENNTAG SA has illegally
made use of its market position, a decision by the authority is still pending. The status of the investi-
gation does not permit an assessment of the outcome. Based on current knowledge, Brenntag further
assumes that claims for civil liability arising from the above-mentioned proceedings are not suffi-
ciently substantiated.
We now estimate the previously reported risk in connection with investigations against a French
manufacturer of medical devices to be highly improbable and will therefore only report in future on
this risk if there are any changes.
As a global company, Brenntag has to comply with the country-specific tax laws and regulations in
each jurisdiction. Tax exposures could result in particular from current and future tax audits of our
German and foreign subsidiaries. These exposures are generally reflected in the balance sheet by rec-
ognizing provisions.
The German Brenntag companies are currently the subject of routine tax audits for the years 2006 to
2012. Potential tax exposures could result from the acquisition of the Brenntag Group in 2006. In this
context, the German fiscal authorities are verifying the tax deductibility of transaction costs and inter-
est expenses paid on a shareholder loan granted by the former owner. As the fiscal authorities have
yet to complete a final review of the two cases, it is currently unclear whether and to what extent a
potential tax exposure exists. Brenntag is confident that the previous treatment of the items is in line
with the applicable tax laws and so has in neither case recognized any tax provisions.
Given the number of legal disputes and other proceedings that Brenntag is involved in, the possibility
that a ruling against Brenntag may be made in some of these proceedings cannot be completely elim-
inated. The company contests actions and proceedings where it considers it appropriate. Provisions
are established for ongoing legal disputes on the basis of the estimated risk and, if necessary, with
the help of external consultants. It is very difficult to predict the outcome of such matters, particularly
in cases in which claimants seek indeterminate compensation. Any adverse decisions rendered in
such cases may have material effects on Brenntag’s net assets, financial position and results of opera-
tions for a reporting period. However, Brenntag currently does not expect its assets, financial position
and results of operations to be materially affected.
C O N S O L I D A T E D F I N A N C I A L S T A T E M E N T S
Notes
A N N U A L R E P O R T 2 0 1 5 – B R E N N T A G A G2 1 4

34.) REPORTING OF FINANCIAL INSTRUMENTS
CARRYING AMOUNTS AND FAIR VALUES BY MEASUREMENT CATEGORY
The classification of the financial assets recognized in the balance sheet according to the measurement
categories under IAS 39 is shown in the table below:
in EUR m 2015
Measurement in the balance sheet:At amortized
cost At fair value Dec. 31, 2015
Classification of financial assets:Loans and
receivables
Financial assets at fair value
through profit or loss
Available-for-sale financial
assets
Derivatives designated
in hedge accounting
Total carrying amount Fair value
Cash and cash equivalents 579.1 – – – 579.1 579.1
Trade receivables 1,426.5 – – – 1,426.5 1,426.5
Other receivables 81.7 – – – 81.7 81.7
Other financial assets 42.4 2.4 1.3 2.5 48.6 48.6
Total 2,129.7 2.4 1.3 2.5 2,135.9 2,135.9
c.76 classification of financial assets by measurement category / dec. 31, 2015
in EUR m 2014
Measurement in the balance sheet:At amortized
cost At fair value Dec. 31, 2014
Classification of financial assets:Loans and
receivables
Financial assets at fair value
through profit or loss
Available-for-sale financial
assets
Derivatives designated
in hedge accounting
Total carrying amount Fair value
Cash and cash equivalents 491.9 – – – 491.9 491.9
Trade receivables 1,407.2 – – – 1,407.2 1,407.2
Other receivables 75.8 – – – 75.8 75.8
Other financial assets 30.7 2.2 1.3 4.9 39.1 39.1
Total 2,005.6 2.2 1.3 4.9 2,014.0 2,014.0
c.77 classification of financial assets by measurement category / dec. 31, 2014
The majority of the financial assets measured at amortized cost have remaining terms of less than
one year. Their carrying amounts at the reporting date approximate their fair values.
Of the other receivables recognized in the balance sheet, EUR 76.4 million (Dec. 31, 2014:
EUR 65.7 million) are not financial assets within the meaning of IFRS 7. They are mainly receivables
from value-added tax and other taxes, prepaid expenses and prepayments.
C O N S O L I D A T E D F I N A N C I A L S T A T E M E N T S
Notes
A N N U A L R E P O R T 2 0 1 5 – B R E N N T A G A G 2 1 5D
fu
rt
he
r
in
fo
rm
at
io
nf
in
an
ci
al
s
ta
te
me
nt
s
C
D

The classification of the financial liabilities recognized in the balance sheet according to the measure-
ment categories under IAS 39 is shown in the table below:
in EUR m 2015
Measurement in the balance sheet: At amortized cost At fair value Dec. 31, 2015
Classification of financial liabilities:
Not designated
in hedge accounting
Designated in hedge
accounting
Financial liabilities at
fair value through
profit or loss
Derivatives designated
in hedge accounting
Carrying amount
under IAS 17
Total carrying amount Fair value
Trade payables 1,055.5 – – – – 1,055.5 1,055.5
Other liabilities 187.0 – – – – 187.0 187.0
Liabilities relating to acquisition of non-controlling interests 5.4 63.3 – – – 68.7 69.3
Financial liabilities 2,236.5 – 4.3 – 14.4 2,255.2 2,293.6
Total 3,484.4 63.3 4.3 – 14.4 3,566.4 3,605.4
c.78 classification of financial liabilities by measurement category / dec. 31, 2015
in EUR m 2014
Measurement in the balance sheet: At amortized cost At fair value Dec. 31, 2014
Classification of financial liabilities:
Not designated
in hedge accounting
Designated in hedge
accounting
Financial liabilities at
fair value through
profit or loss
Derivatives designated
in hedge accounting
Carrying amount
under IAS 17
Total carrying amount Fair value
Trade payables 1,046.2 – – – – 1,046.2 1,046.2
Other liabilities 181.5 – – – – 181.5 181.5
Liabilities relating to acquisition of non-controlling interests 2.1 37.6 – – – 39.7 40.2
Financial liabilities 1,885.3 – 3.6 0.4 12.3 1,901.6 1,956.2
Total 3,115.1 37.6 3.6 0.4 12.3 3,169.0 3,224.1
c.79 classification of financial liabilities by measurement category / dec. 31, 2014
C O N S O L I D A T E D F I N A N C I A L S T A T E M E N T S
Notes
A N N U A L R E P O R T 2 0 1 5 – B R E N N T A G A G2 1 6

The majority of the trade payables and other liabilities measured at amortized cost have remaining
terms of less than one year. Their carrying amounts at the reporting date therefore approximate their
fair values. The fair values of the financial liabilities have been determined by applying the discounted
cash flow method on the basis of current interest curves (Level 2 of the fair value hierarchy). The fair
values of the liabilities relating to the acquisition of non-controlling interests were determined on the
basis of a recognized company valuation model. The company valuation model is based on cash flow
plans (Level 3 of the fair value hierarchy).
Of the other liabilities recognized in the balance sheet, EUR 186.1 million (Dec. 31, 2014: EUR 181.5
million) are not financial liabilities within the meaning of IFRS 7. They are mainly liabilities to employ-
ees, liabilities from value-added tax and other taxes, as well as deferred income.
The allocation of the financial assets and liabilities recognized in the balance sheet at fair value to the
levels of the IFRS 13 fair value hierarchy is shown in the table below:
in EUR m
Hierarchy level Level 1 Level 2 Level 3 Dec. 31, 2015
Financial assets at fair value through profit or loss – 2.4 – 2.4
Derivatives designated in hedge accounting with a positive fair value – 2.5 – 2.5
Financial liabilities at fair value through profit or loss – 4.3 – 4.3
Available-for-sale financial assets 1.3 – – 1.3
c.80 financial instruments according to fair value hierarchy / dec. 31, 2015
in EUR m
Hierarchy level Level 1 Level 2 Level 3 Dec. 31, 2014
Financial assets at fair value through profit or loss – 2.2 – 2.2
Derivatives designated in hedge accounting with a positive fair value – 4.9 – 4.9
Financial liabilities at fair value through profit or loss – 3.6 – 3.6
Derivatives designated in hedge accounting with a negative fair value – 0.4 – 0.4
Available-for-sale financial assets 1.3 – – 1.3
c.81 financial instruments according to fair value hierarchy / dec. 31, 2014
C O N S O L I D A T E D F I N A N C I A L S T A T E M E N T S
Notes
A N N U A L R E P O R T 2 0 1 5 – B R E N N T A G A G 2 1 7D
fu
rt
he
r
in
fo
rm
at
io
nf
in
an
ci
al
s
ta
te
me
nt
s
C
D

The net gains / losses from financial assets and liabilities broken down into measurement categories
are as follows:
in EUR m 2015
Interest Change in liabilities relating to acquisition
of non-controlling interests recognized in
profit or loss
At fair value Currency translation
Impair-ments,
netNet
gain / lossMeasurement category: Income Expense Gains Losses Gains Losses
Loans and receivables 3.3 – – – – 83.1 – 55.3 – 5.3 25.8
Financial liabilities meas- ured at amortized cost – – 63.8 – 24.9 – – 60.5 – 85.2 – – 113.4
Financial assets and liabilities at fair value through profit or loss – – – 36.8 – 61.3 – – – – 24.5
Derivatives designated in hedge accounting – – 3.3 – – – – – – – 3.3
Total 3.3 – 67.1 – 24.9 36.8 – 61.3 143.6 – 140.5 – 5.3 – 115.4
c.82 net gains / losses from financial assets and liabilities / 2015
in EUR m 2014
Interest Change in liabilities relating to acquisition
of non-controlling interests recognized in
profit or loss
At fair value Currency translation
Impair-ments,
netNet
gain / lossMeasurement category: Income Expense Gains Losses Gains Losses
Loans and receivables 3.0 – – – – 66.5 – 56.2 – 4.0 9.3
Financial liabilities meas- ured at amortized cost – – 64.7 4.0 – – 29.8 – 49.6 – – 80.5
Financial assets and liabilities at fair value through profit or loss – – – 30.5 – 37.9 – – – – 7.4
Derivatives designated in hedge accounting – – 2.8 – – – – – – – 2.8
Total 3.0 – 67.5 4.0 30.5 – 37.9 96.3 – 105.8 – 4.0 – 81.4
c.83 net gains / losses from financial assets and liabilities / 2014
C O N S O L I D A T E D F I N A N C I A L S T A T E M E N T S
Notes
A N N U A L R E P O R T 2 0 1 5 – B R E N N T A G A G2 1 8

Of the interest expense on liabilities to third parties contained in interest expense, EUR 1.7 million
(2014: EUR 2.2 million) is interest expense which is not part of the effective interest on financial liabili-
ties measured at amortized cost.
With the exception of valuation allowances on trade receivables and other receivables, net gains and
losses on subsequent measurement are presented within net finance costs. Valuation allowances
on trade receivables and other receivables are presented under other operating expenses and the
income from the receipt of trade receivables derecognized in prior periods is presented within other
operating income.
OFFSETTING OF FINANCIAL ASSETS AND LIABILITIES
The gross amounts of financial assets and liabilities are offset on the basis of netting arrangements in
the balance sheet as follows or they are subject to the following enforceable master netting arrange-
ments or similar agreements that do not meet the requirements for offsetting in the balance sheet:
in EUR m
Gross amounts of financial assets and
liabilities Offsetting
Gross carrying amounts in the
balance sheet
Enforceable master netting arrangements
and similar arrangements
Dec. 31, 2015 Net amount
Trade receivables 1,465.7 – 39.2 1,426.5 – 9.7 1,416.8
Other receivables 158.1 – 158.1 – 0.1 158.0
Other financial assets 53.0 – 53.0 – 0.9 52.1
Trade payables 1,060.9 – 5.4 1,055.5 – 7.9 1,047.6
Other liabilities 406.9 – 33.8 373.1 – 1.9 371.2
Financial liabilities 2,252.1 – 2,252.1 – 0.9 2,251.2
c.84 offsetting of financial assets and liabilities / dec. 31, 2015
in EUR m
Gross amounts of financial assets and
liabilities Offsetting
Gross carrying amounts in the
balance sheet
Enforceable master netting arrangements
and similar arrangements
Dec. 31, 2014Net amount
Trade receivables 1,444.6 – 37.4 1,407.2 – 4.6 1,402.6
Other receivables 141.5 – 141.5 – 0.1 141.4
Other financial assets 39.1 – 39.1 – 0.3 38.8
Trade payables 1,052.0 – 5.8 1,046.2 – 4.5 1,041.7
Other liabilities 394.6 – 31.6 363.0 – 0.2 362.8
Financial liabilities 1,901.6 – 1,901.6 – 0.3 1,901.3
c.85 offsetting of financial assets and liabilities / dec. 31, 2014
C O N S O L I D A T E D F I N A N C I A L S T A T E M E N T S
Notes
A N N U A L R E P O R T 2 0 1 5 – B R E N N T A G A G 2 1 9D
fu
rt
he
r
in
fo
rm
at
io
nf
in
an
ci
al
s
ta
te
me
nt
s
C
D

NATURE AND EXTENT OF RISKS ARISING FROM FINANCIAL INSTRUMENTS
According to IFRS 7, risks arising from financial instruments can typically be divided into currency
risks, interest rate risks, credit risks and liquidity risks.
The sources of as well as the processes and policies used to manage these risks are described in detail
in the chapter “Financial risks and opportunities” in the management report.
currency risks
Currency risks arise particularly when monetary items or contracted future transactions are in a
currency other than the functional currency of a company. Forward exchange contracts and cross-
currency swaps are used as hedging instruments. The derivative financial instruments used have
maturities of less than one year and are not included in hedge accounting.
Unfavourable political developments and financial policy decisions in specific countries may have a
particularly negative impact. For example, the devaluation of the bolivar by the Venezuelan govern-
ment in mid-February 2016 including further changes in exchange rate regulations in 2016 will lead
to exchange-rate-related expenses. Further changes to legislation on exchange rates and resulting
impacts on profits cannot be ruled out at present.
The entire liability relating to the acquisition of non-controlling interests in Zhong Yung has been
included in net investment hedge accounting so the exchange-rate-related changes in the liability are
recognized in the net investment hedge reserve. As a result, the net investment hedge reserve
changed as follows:
in EUR m Net investment hedge reserve
Dec. 31, 2014 – 6.4
Transfer to net investment hedge reserve – 2.2
Dec. 31, 2015 – 8.6
c.86 change in net investment hedge reserve
If the euro had been worth 10 % more or less in each case against major currencies as at
December 31, 2015, translation of monetary items in foreign currency into the Group currency, the
euro, allowing for the foreign exchange forward deals and foreign exchange swaps still open on
December 31, 2015, would have resulted in the following changes in net finance costs:
C O N S O L I D A T E D F I N A N C I A L S T A T E M E N T S
Notes
A N N U A L R E P O R T 2 0 1 5 – B R E N N T A G A G2 2 0

in EUR m Cash flow hedge reserve
Dec. 31, 2014 4.1
Reclassification to profit and loss 3.0
Measurement at fair value – 5.9
Dec. 31, 2015 1.2
c.88 change in cash flow hedge reserve
If the market interest rate at December 31, 2015 had been 25 basis points (2014: 25 basis points)
higher or lower (relative to the total amount of derivatives and variable-rate financial liabilities as
at December 31, 2015), the cash flow hedge reserve would have been EUR 2.0 million higher
(Dec. 31, 2014: EUR 3.5 million higher) or EUR 2.7 million lower (Dec. 31, 2014: EUR 3.5 million
lower). The negative impact on net finance costs would have been EUR 1.9 million or the positive
impact EUR 1.9 million (2014: negative impact of EUR 2.3 million or positive impact of EUR 2.3 million).
2015 2014
in EUR m + 10 % – 10 % + 10 % – 10 %
USD – 1.4 1.8 – 1.8 2.2
GBP 0.2 – 0.3 1.0 – 1.2
CHF – 0.1 0.1 1.1 – 1.4
c.87 sensitivity analysis currency risk
If the euro had risen or fallen against the Chinese yuan renminbi (CNY), the net investment hedge
reserve would have been reduced by EUR 6.3 million (Dec. 31, 2014: EUR 3.7 million) or increased by
EUR 6.3 million (Dec. 31, 2014: EUR 3.7 million).
interest rate risks
Interest rate risks can occur due to changes in market interest rates. The risks result from changes in
the fair values of fixed-rate financial instruments or from changes in the cash flows of variable-rate
financial instruments. In April 2013, parts of the floating-rate syndicated loan were hedged against
interest rate risks in the long term with interest swaps and the interest swaps were included in cash
flow hedge accounting.
The cash flow hedge reserve changed as follows:
C O N S O L I D A T E D F I N A N C I A L S T A T E M E N T S
Notes
A N N U A L R E P O R T 2 0 1 5 – B R E N N T A G A G 2 2 1D
fu
rt
he
r
in
fo
rm
at
io
nf
in
an
ci
al
s
ta
te
me
nt
s
C
D

credit risks
Non-derivative financial instruments entail credit risk when contractually agreed payments are not
made by the contracting parties. The maximum credit risk on non-derivative financial instruments
corresponds to their carrying amounts. The expected credit risk from individual receivables is allowed
for by recognizing write-downs of the assets. See also Note 15.).
With the derivative financial instruments used, the maximum credit risk is the sum total of all positive
fair values of these instruments as, in the event of non-performance by the contracting parties, losses
on assets would be restricted to this amount.
liquidity risks
Liquidity risk is the risk that the Brenntag Group may in future not be able to meet its contractual pay-
ment obligations. Due to the fact that the Brenntag Group’s business is not subject to any pronounced
seasonal fluctuations, there is relatively little fluctuation in liquidity during the financial year.
To ensure that the Brenntag Group can pay at all times, it not only has appropriate liquidity reserves
in the form of cash and cash equivalents but also credit lines under the syndicated loan which can be
utilized as needed. In order to identify the liquidity risks, the Group has a multi-annual liquidity plan
which is regularly reviewed and adjusted if necessary.
The undiscounted cash flows resulting from financial liabilities are shown in the following table:
Cash flows 2016 – 2021 ff.
in EUR m
Carrying amount Dec. 31,
2015 2016 2017 2018 2019 2020 2021 ff.
Trade payables 1,055.5 1,055.5 – – – – –
Other liabilities 187.0 184.4 0.5 0.6 0.2 0.2 1.1
Liabilities relating to acquisition of non-controlling interests 68.7 68.7 – – – – –
Liabilities under syndicated loan 1,214.7 16.8 16.8 16.8 1,226.3 – –
Other liabilities to banks 134.2 128.7 0.2 – – – 5.3
Bond 2018 406.5 22.0 22.0 422.0 – – –
Bond (with Warrants) 2022 423.2 8.6 8.6 8.6 8.6 8.6 476.5
Finance lease liabilities 14.4 4.4 3.3 2.5 1.8 1.2 6.5
Derivative financial instruments 4.3
of which cash inflows – 477.9 – – – – –
of which cash outflows – 482.2 0.4 – – – –
Other financial liabilities 57.9 12.7 20.8 21.5 1.3 1.6 –
Total 3,566.4 1,506.1 72.6 472.0 1,238.2 11.6 489.4
c.89 future cash flows from financial liabilities / dec. 31, 2015
C O N S O L I D A T E D F I N A N C I A L S T A T E M E N T S
Notes
A N N U A L R E P O R T 2 0 1 5 – B R E N N T A G A G2 2 2

Cash flows 2015 – 2020 ff.
in EUR m
Carrying amount Dec. 31,
2014 2015 2016 2017 2018 2019 2020 ff.
Trade payables 1,046.2 1,046.2 – – – – –
Other liabilities 181.5 179.3 1.6 0.1 – – 0.5
Liabilities relating to acquisition of non-controlling interests 39.7 – 41.3 – – – –
Liabilities under syndicated loan 1,124.1 15.5 15.5 15.5 15.5 1,135.9 –
Other liabilities to banks 296.6 288.7 2.5 – – – 6.1
Bond 2018 405.2 22.0 22.0 22.0 422.0 – –
Finance lease liabilities 12.3 3.7 3.1 2.3 1.6 1.0 6.1
Derivative financial instruments 4.0
of which cash inflows – 401.6 – – – – –
of which cash outflows – 406.1 0.4 – – – –
Other financial liabilities 59.4 27.2 22.1 3.5 2.8 3.8 –
Total 3,169.0 1,587.1 108.5 43.4 441.9 1,140.7 12.7
c.90 future cash flows from financial liabilities / dec. 31, 2014
derivative financial instruments
The notional amount and fair values of derivative financial instruments are shown in the table below:
Dec. 31, 2015 Dec. 31, 2014
in EUR m Notional amount
Positive fair value
Negative fair value
Notional amount
Positive fair value
Negative fair value
Foreign exchange forward transactions and foreign exchange swaps not included in hedge accounting 637.3 2.4 4.1 500.6 2.2 3.6
Interest rate swaps in hedge accounting 459.3 2.5 – 511.8 4.9 0.4
Interest rate swaps not included in hedge accounting 100.0 – 0.2 – – –
Total 4.9 4.3 7.1 4.0
c.91 derivative financial instruments
C O N S O L I D A T E D F I N A N C I A L S T A T E M E N T S
Notes
A N N U A L R E P O R T 2 0 1 5 – B R E N N T A G A G 2 2 3D
fu
rt
he
r
in
fo
rm
at
io
nf
in
an
ci
al
s
ta
te
me
nt
s
C
D

35.) RELATED PARTIES
In the course of its normal business activities, Brenntag AG also obtains services from and provides
services for related entities. These related entities are the subsidiaries included in the consolidated
financial statements as well as associates accounted for using the equity method and their subsidiaries.
Related persons are the members of the Board of Management and Supervisory Board of Brenntag AG
and members of their families.
The total remuneration of the Board of Management due in the short term including the remuneration
for performing their tasks at subsidiaries amounts to EUR 4.5 million for financial year 2015 (2014:
EUR 3.0 million). Furthermore, there are long-term remuneration programmes for members of the
Board of Management that are partly based on the development of the share price. The resulting
bonus earned in 2015 plus changes in the amount of entitlements not yet paid out total EUR 3.2 million
(2014: EUR 1.4 million). The cost (excluding interest expense) for the pension entitlements earned in
the reporting year (defined benefit plans) and the defined contribution pension plans amounts to
EUR 0.5 million (thereof: EUR 0.5 million for defined benefit plans); in 2014: EUR 0.3 million (thereof:
EUR 0.3 million for defined benefit plans). The total remuneration of the Board of Management is
therefore EUR 8.2 million (2014: EUR 4.7 million). In financial year 2015, no expense for remuneration
to former members of the Board of Manage ment was incurred. Other than the payout of EUR 1.0 mil-
lion under a post-employment non-competition clause, no further remuneration was paid to former
members of the Board of Management in financial year 2014.
The Board of Management remuneration system and the remuneration of each member of the Board
of Management are detailed in the remuneration report, which is an integral part of the combined
management report.
The total remuneration of the members of the Supervisory Board due in the short term amounts to
EUR 1.0 million for financial year 2015 (2014: EUR 0.8 million).
The Supervisory Board remuneration system and the remuneration of each member of the Super-
visory Board are detailed in the remuneration report, which is an integral part of the combined man-
agement report.
Apart from the aforementioned, there were no transactions with related persons.
C O N S O L I D A T E D F I N A N C I A L S T A T E M E N T S
Notes
A N N U A L R E P O R T 2 0 1 5 – B R E N N T A G A G2 2 4

in EUR m 2015 2014
Sales from transactions with associates 0.8 0.8
Goods and services rendered by associates 0.7 0.9
Sales from transactions with companies at which related persons perform a supervisory function 0.2 0.2
c.92 transactions with related parties
in EUR m Dec. 31, 2015 Dec. 31, 2014
Trade receivables from associates 0.1 0.1
Trade payables to associates 0.1 0.1
Financial receivables from associates 0.1 0.1
c.93 receivables from and payables to related parties
36.) AUDIT FEES FOR THE AUDITORS OF THE CONSOLIDATED FINANCIAL STATEMENTS
The following fees for the services of the auditors of the consolidated financial statements,
PricewaterhouseCoopers Aktiengesellschaft Wirtschaftsprüfungsgesellschaft, Düsseldorf, were
recognized as expenses:
in EUR m 2015 2014
Financial statement audit services 0.8 0.8
Other assurance services 0.2 0.2
Tax advisory services 0.1 0.1
Other services rendered – 0.3
Total 1.1 1.4
c.94 audit fees for the auditors of the consolidated financial statements
The transactions of Brenntag AG with consolidated subsidiaries as well as between consolidated sub-
sidiaries have been eliminated.
The following business transactions were performed on terms equivalent to those that prevail in
arm’s length transactions:
C O N S O L I D A T E D F I N A N C I A L S T A T E M E N T S
Notes
A N N U A L R E P O R T 2 0 1 5 – B R E N N T A G A G 2 2 5D
fu
rt
he
r
in
fo
rm
at
io
nf
in
an
ci
al
s
ta
te
me
nt
s
C
D

39.) EVENTS AFTER THE END OF THE REPORTING PERIOD
In mid-February 2016, the Venezuelan government further devalued the country’s currency, the boli-
var. Since February 2015, Venezuela had had three parallel currency exchange mechanisms: CENCOEX
(official preferred exchange rate, exclusively for imports of certain essential goods such as food and
medicines, 6.30 bolivars per USD), SICAD (auction rate, most recently around 13.50 bolivars per USD)
and SIMADI (permitted purchase and sale of foreign currency with fewer restrictions, most recently
around 200 bolivars per USD). In February 2016, this three-tier model was converted to a dual model,
under which CENCOEX (although devalued to 10 bolivars per USD) and SIMADI will be the only official
exchange mechanisms available. For Brenntag, the resulting change on translation of the net assets
of its Venezuelan subsidiary from the local currency into the functional currency, the US dollar, will
give rise to foreign exchange losses of approximately EUR 20 million. Further currency translation
effects may arise on the measurement of inventories, which currently amount to approximately
EUR 10 million.
37.) EXEMPTIONS PURSUANT TO SECTION 264, PARA. 3 / SECTION 264B OF THE GERMAN COMMERCIAL CODE
For financial year 2015, the following subsidiaries of Brenntag AG are making use of the exemptions
pursuant to Section 264, para. 3 and Section 264b of the German Commercial Code:
Brenntag Holding GmbH, Mülheim an der Ruhr
Brenntag Germany Holding GmbH, Mülheim an der Ruhr
Brenntag Foreign Holding GmbH, Mülheim an der Ruhr
Brenntag Beteiligungs GmbH, Mülheim an der Ruhr
BRENNTAG GmbH, Duisburg
BRENNTAG International Chemicals GmbH, Mülheim an der Ruhr
Brenntag Real Estate GmbH, Mülheim an der Ruhr
BCD Chemie GmbH, Hamburg
CLG Lagerhaus GmbH & Co. KG, Mülheim an der Ruhr
Brenntag Vermögensverwaltungs GmbH & Co. KG, Zossen
CM Komplementär 03–018 GmbH & Co. KG, Mülheim an der Ruhr
CM Komplementär 03–019 GmbH & Co. KG, Mülheim an der Ruhr
CM Komplementär 03–020 GmbH & Co. KG, Mülheim an der Ruhr
38.) DECLARATION OF CONFORMITY WITH THE GERMAN CORPORATE GOVERNANCE CODE
On December 17, 2015, the Board of Management and Supervisory Board issued the declaration of
conformity with the recommendations of the government commission “German Corporate Gover-
nance Code” for financial year 2015 as required by Section 161 of the German Stock Corporation Act.
The declaration of conformity can be viewed at any time on the website of Brenntag AG
(http://www.brenntag.com/media/documents/compliance/declaration_of_conformity_2015.pdf).
C O N S O L I D A T E D F I N A N C I A L S T A T E M E N T S
Notes
A N N U A L R E P O R T 2 0 1 5 – B R E N N T A G A G2 2 6

RESPONSIBILITY STATEMENT
To the best of our knowledge, and in accordance with the applicable reporting principles, the consoli-
dated financial statements give a true and fair view of the assets, liabilities, financial position and
profit or loss of the Group and the Group management report, which is combined with the manage-
ment report of Brenntag AG, includes a fair review of the development and performance of the busi-
ness and the position of the Group, together with a description of the material opportunities and
risks associated with the expected development of the Group.
Mülheim an der Ruhr, March 7, 2016
Brenntag AG
BOARD OF MANAGEMENT
Steven Holland Karsten Beckmann Markus Klähn
Georg Müller Henri Nejade
C O N S O L I D A T E D F I N A N C I A L S T A T E M E N T S
Notes
A N N U A L R E P O R T 2 0 1 5 – B R E N N T A G A G 2 2 7D
fu
rt
he
r
in
fo
rm
at
io
nf
in
an
ci
al
s
ta
te
me
nt
s
C
D

ANNEX LIST OF SHAREHOLDINGS IN ACCORDANCE WITH SECTION 313, PARA. 2 OF THE GERMAN COMMERCIAL CODE AS AT DECEMBER 31, 2015
No. Company Seat
Held directly
% 1)
Held indirectly
% 1)
Effective net
holding % 1)
Via No.
1 Brenntag AG Mülheim an der Ruhr 0.00 0.00 0.00
consolidated subsidiaries
Algeria
2 Alliance Chimie Algerie SPA Algiers 0.00 100.00 99.94 70
Argentina
3 Brenntag Argentina S.A. Buenos Aires 0.00 90.00 10.00
100.00 119111
Australia
4 Brenntag Australia Pty. Ltd. Highett 0.00 100.00 100.00 147
5 Brenntag Pty. Ltd. i. L. Highett 0.00 100.00 100.00 4
Bangladesh
6 BRENNTAG BANGLADESH FORMULATION LTD. Dhaka 0.00 100.00 100.00 119
7 BRENNTAG BANGLADESH LTD. Dhaka 0.00 100.00 100.00 119
8 BRENNTAG BANGLADESH SERVICES LTD. Dhaka 0.00 100.00 100.00 7
Belgium
9 BRENNTAG NV Deerlijk 0.00 99.99 0.01
100.00 6752
10 European Polymers and Chemicals Distribution BVBA
Deerlijk 0.00 100.00 100.00 123
Bermuda
11 HCI Ltd. Hamilton 0.00 100.00 100.00 12
12 Pelican Chemical Traders Ltd. Hamilton 0.00 100.00 100.00 26
Bolivia
13 Brenntag Bolivia S.R.L. Santa Cruz 0.00 90.00 10.00
100.00 119 112
Brazil
14 Brenntag Quimica Brasil Ltda. Guarulhos, São Paulo 0.00 100.00 100.00 119
Bulgaria
15 BRENNTAG BULGARIA EOOD Sofia 0.00 100.00 100.00 119
Chile
16 Brenntag Chile Comercial e Industrial Limitada
Santiago 0.00 95.00 5.00
100.00 119 112
C O N S O L I D A T E D F I N A N C I A L S T A T E M E N T S
Notes
A N N U A L R E P O R T 2 0 1 5 – B R E N N T A G A G2 2 8

No. Company Seat
Held directly
% 1)
Held indirectly
% 1)
Effective net
holding % 1)
Via No.
China
17 Tianjin Zhong Rong Chemical Storage Co., Ltd. Tianjin 0.00 100.00 51.00 81
18 Tianjin Tai Rong Chemical Trading Co., Ltd. Tianjin 0.00 100.00 51.00 21
19 TAT Petroleum (Guangzhou) Ltd Guangzhou 0.00 100.00 100.00 2) 148
20 Shanghai Yi Rong International Trading Co., Ltd. Shanghai 0.00 75.3024.70
51.00 2181
21 Shanghai Jia Rong Trading Co., Ltd. Shanghai 0.00 100.00 51.00 17
22 Shanghai Anyijie Chemical Logistic Co., Ltd. Shanghai 0.00 100.00 51.00 17
23 Guangzhou Fan Ya Jia Rong Trading Co., Ltd. Guangzhou 0.00 60.0040.00
51.00 2118
24 Brenntag (Shanghai) Chemical Trading Co., Ltd. Shanghai 0.00 100.00 100.00 119
Costa Rica
25 Quimicos Holanda Costa Rica S.A. San Jose 0.00 100.00 100.00 119
Curaçao
26 H.C.I. (Curaçao) N.V. Curaçao 0.00 100.00 100.00 119
27 HCI Shipping N.V. Curaçao 0.00 100.00 100.00 26
Denmark
28 Aktieselskabet af 1. Januar 1987 Ballerup 0.00 100.00 100.00 30
29 Brenntag Biosector A/S Ballerup 0.00 100.00 100.00 30
30 Brenntag Nordic A/S Ballerup 0.00 100.00 100.00 119
Germany
31 Fred Holmberg & Co GmbH Hamburg 0.00 100.00 100.00 2) 142
32 ROSEA Grundstücks-Vermietungsgesellschaft mbH & Co. Objekt Hüttenheim KG
Düsseldorf 0.00 94.00 94.00 3) 49
33 CVP Chemie-Vertrieb Berlin GmbH Berlin 0.00 100.00 51.00 36
34 CVM Chemie-Vertrieb Magdeburg GmbH & Co. KG Schönebeck 0.00 100.00 51.00 36
35 CVH Chemie-Vertrieb Verwaltungsgesellschaft mbH Hanover 0.00 51.00 51.00 49
36 CVH Chemie-Vertrieb GmbH & Co. Hannover KG Hanover 0.00 51.00 51.00 49
37 CVB Albert Carl GmbH & Co. KG Berlin Berlin 0.00 100.00 51.00 36
38 CM Komplementär 03–020 GmbH & Co. KG Mülheim an der Ruhr 0.00 100.00 0.00
100.00 3953
39 CM Komplementär 03–019 GmbH & Co. KG Mülheim an der Ruhr 0.00 100.00 0.00
100.00 4054
40 CM Komplementär 03–018 GmbH & Co. KG Mülheim an der Ruhr 0.00 100.00 0.00
100.00 5055
41 CLG Lagerhaus GmbH & Co. KG Mülheim an der Ruhr 0.00 100.00 100.00 49
42 CLG Lagerhaus GmbH Duisburg 0.00 100.00 100.00 49
43 Brenntag Vermögensverwaltungs GmbH & Co. KG Zossen 0.00 100.00 100.00 52
44 Brenntag Vermögensmanagement GmbH Zossen 100.00 0.00 100.00 1
45 Brenntag Real Estate GmbH Mülheim an der Ruhr 0.00 100.00 100.00 52
46 BRENNTAG International Chemicals GmbH Mülheim an der Ruhr 0.00 100.00 100.00 49
47 Brenntag Holding GmbH Mülheim an der Ruhr 100.00 0.00 100.00 1
C O N S O L I D A T E D F I N A N C I A L S T A T E M E N T S
Notes
A N N U A L R E P O R T 2 0 1 5 – B R E N N T A G A G 2 2 9D
fu
rt
he
r
in
fo
rm
at
io
nf
in
an
ci
al
s
ta
te
me
nt
s
C
D

No. Company Seat
Held directly
% 1)
Held indirectly
% 1)
Effective net
holding % 1)
Via No.
48 BRENNTAG GmbH Duisburg 0.00 100.00 100.00 49
49 Brenntag Germany Holding GmbH Mülheim an der Ruhr 0.00 100.00 100.00 52
50 Brenntag Foreign Holding GmbH Mülheim an der Ruhr 0.00 100.00 100.00 52
51 Brenntag Finanz-Service GmbH i. L. Mülheim an der Ruhr 0.00 100.00 100.00 48
52 Brenntag Beteiligungs GmbH Mülheim an der Ruhr 0.00 100.00 100.00 47
53 Blitz 03–1163 GmbH Mülheim an der Ruhr 0.00 100.00 100.00 39
54 Blitz 03–1162 GmbH Mülheim an der Ruhr 0.00 100.00 100.00 40
55 Blitz 03–1161 GmbH Mülheim an der Ruhr 0.00 100.00 100.00 50
56 BCD Chemie GmbH Hamburg 0.00 100.00 100.00 49
57 BBG - Berlin-Brandenburger Lager- und Distribu-tionsgesellschaft Biesterfeld Brenntag mbH
Hoppegarten 0.00 50.0050.00
100.00 4956
Dominican Republic
58 HCI CHEMCENTRAL DOM. REP. S.R.L. Santo Domingo 0.00 99.800.100.10
100.00 1192627
59 BRENNTAG CARIBE S.R.L. Santo Domingo 0.00 100.000.00
100.00 119111
Ecuador
60 BRENNTAG ECUADOR S.A. Guayaquil 0.00 100.00 0.00
100.00 119111
El Salvador
61 BRENNTAG EL SALVADOR, S.A. DE C.V. Soyapango 0.00 99.99 0.01
100.00 119112
Finland
62 Brenntag Nordic Oy Vantaa 0.00 100.00 100.00 119
France
63 SOCIETE COMMERCIALE TARDY ET CIE. SARL Vitrolles 0.00 51.00 50.97 66
64 Multisol International Services SAS Sotteville-lès-Rouen 0.00 80.0020.00
100.00 6773
65 BRACHEM FRANCE HOLDING SAS Chassieu 0.00 100.00 100.00 47
66 BRENNTAG EXPORT SARL Vitrolles 0.00 100.00 99.94 71
67 BRENNTAG FRANCE HOLDING SAS Chassieu 0.00 100.00 100.00 65
68 BRENNTAG FRANCE SAS Paris 0.00 100.00 99.94 71
69 BRENNTAG INVESTISSEMENTS SAS Chassieu 0.00 100.00 100.00 67
70 BRENNTAG MAGHREB SAS Vitrolles 0.00 100.00 99.94 66
71 BRENNTAG SA Chassieu 0.00 99.94 99.94 67
72 METAUSEL SAS Chassieu 0.00 100.00 99.94 71
73 Multisol France SAS Villebon-sur-Yvette 0.00 100.00 100.00 67
Ghana
74 Brenntag Ghana Limited Accra 0.00 100.00 100.00 119
Greece
75 Brenntag Hellas Chimika Monoprosopi EPE Penteli 0.00 100.00 100.00 124
C O N S O L I D A T E D F I N A N C I A L S T A T E M E N T S
Notes
A N N U A L R E P O R T 2 0 1 5 – B R E N N T A G A G2 3 0

No. Company Seat
Held directly
% 1)
Held indirectly
% 1)
Effective net
holding % 1)
Via No.
Guatemala
76 BRENNTAG GUATEMALA S.A. Guatemala City 0.00 99.97 0.03
100.00 119111
Honduras
77 INVERSIONES QUIMICAS, S.A. San Pedro Sula 0.00 98.51 1.49
100.00 119111
Hong Kong
78 Brenntag Hong Kong Limited Hong Kong 0.00 99.96 0.04
100.00 119111
79 TAT Petroleum (HK) Pte Ltd Hong Kong 0.00 100.00 100.00 2) 148
80 Yuen Fung Hong Petroleum Co., Ltd Hong Kong 0.00 100.00 100.00 2) 79
81 Zhong Yung (International) Chemical Co., Limited Hong Kong 0.00 51.00 51.00 119
India
82 Brenntag Ingredients (India) Private Limited Mumbai 0.00 100.00 100.00 147
Indonesia
83 PT TAT Petroleum Indonesia South Jakarta 0.00 99.00 99.00 2) 148
84 PT. Brenntag Jakarta Selatan 0.00 100.00 100.00 147
85 PT. Dharmala HCI i.L. Jakarta 0.00 91.14 91.14 119
Ireland
86 Brenntag Chemicals Distribution (Ireland) Limited Dublin 0.00 100.00 100.00 215
Italy
87 NATURAL WORLD S.R.L. Lugo 0.00 100.00 100.00 89
88 CHIMAB S.p.A. Campodarsego (Padua) 0.00 100.00 100.00 89
89 BRENNTAG S.P.A. Milan 0.00 100.00 100.00 119
Canada
90 BRENNTAG CANADA INC. Toronto 0.00 100.00 100.00 109
Colombia
91 SURTIQUIMICOS S.A. Bogotá 0.00 100.00 100.00 92
92 BRENNTAG COLOMBIA S.A. Bogotá D.C. 0.00 94.874.150.410.380.19
100.00 119112
27111
26
Croatia
93 BRENNTAG HRVATSKA d.o.o. Zagreb 0.00 100.00 100.00 124
Latvia
94 SIA BRENNTAG LATVIA Riga 0.00 100.00 100.00 135
95 SIA DIPOL BALTIJA Riga 0.00 100.00 100.00 186
Lithuania
96 UAB BRENNTAG LIETUVA Kaunas 0.00 100.00 100.00 135
C O N S O L I D A T E D F I N A N C I A L S T A T E M E N T S
Notes
A N N U A L R E P O R T 2 0 1 5 – B R E N N T A G A G 2 3 1D
fu
rt
he
r
in
fo
rm
at
io
nf
in
an
ci
al
s
ta
te
me
nt
s
C
D

No. Company Seat
Held directly
% 1)
Held indirectly
% 1)
Effective net
holding % 1)
Via No.
Malaysia
97 BRENNTAG SDN. BHD. Kuala Lumpur 0.00 100.00 100.00 147
98 BRENNTAG MALAYSIA SERVICES SDN. BHD. i. L. Kuala Lumpur 0.00 100.00 100.00 100
99 BRENNTAG MALAYSIA SDN. BHD. Kuala Lumpur 0.00 100.00 100.00 119
100 AKASHI SDN. BHD. Kuala Lumpur 0.00 100.00 100.00 97
Morocco
101 ALCOCHIM MAROC S.A.R.L. Casablanca 0.00 100.00 99.94 70
102 BRENNTAG MAROC S.A.R.L associé unique Casablanca 0.00 100.00 99.94 70
Mauritius
103 Multisol Mauritius Limited Ebene 0.00 100.00 100.00 209
Mexico
104 AMCO INTERNACIONAL S.A. DE C.V. Mexico City 0.00 100.000.00
100.00 105106
105 BRENNTAG MÉXICO, S.A. DE C.V. Cuautitlan Izcalli 0.00 99.990.01
100.00 119112
106 BRENNTAG PACIFIC, S. DE R.L. DE C.V. Tijuana 0.00 99.001.00
100.00 196194
New Zealand
107 BRENNTAG NEW ZEALAND LIMITED Wellington 0.00 100.00 100.00 147
Nicaragua
108 BRENNTAG NICARAGUA, S.A. Managua 0.00 99.99 0.01
100.00 119111
Netherlands
109 Holland Chemical International B.V. Dordrecht 0.00 100.00 100.00 119
110 HCI U.S.A. Holdings B.V. Amsterdam 0.00 100.00 100.00 118
111 HCI Central Europe Holding B.V. Amsterdam 0.00 100.00 100.00 119
112 H.C.I. Chemicals Nederland B.V. Amsterdam 0.00 100.00 100.00 119
113 Brenntag Vastgoed B.V. Dordrecht 0.00 100.00 100.00 114
114 Brenntag Nederland B.V. Dordrecht 0.00 100.00 100.00 119
115 Brenntag HoldCo B.V. Amsterdam 0.00 100.00 100.00 47
116 Brenntag Finance B.V. Amsterdam 0.00 100.00 100.00 119
117 BRENNTAG Dutch C.V. Amsterdam 0.00 99.900.10
100.00 119112
118 BRENNTAG Coöperatief U.A. Amsterdam 0.00 99.001.00
100.00 194193
119 BRENNTAG (Holding) B.V. Amsterdam 0.00 74.0026.00
100.00 11550
Nigeria
120 Brenntag Chemicals Nigeria Limited Onikan-Lagos 0.00 90.00 10.00
100.00 119111
Norway
121 BRENNTAG NORDIC AS Borgenhaugen 0.00 100.00 100.00 143
C O N S O L I D A T E D F I N A N C I A L S T A T E M E N T S
Notes
A N N U A L R E P O R T 2 0 1 5 – B R E N N T A G A G2 3 2

No. Company Seat
Held directly
% 1)
Held indirectly
% 1)
Effective net
holding % 1)
Via No.
Austria
122 Provida GmbH Vienna 0.00 100.00 100.00 124
123 JLC-Chemie Handels GmbH Wiener Neustadt 0.00 100.00 100.00 124
124 Brenntag CEE GmbH Vienna 0.00 99.900.10
100.00 12552
125 Brenntag Austria Holding GmbH Vienna 0.00 100.00 100.00 9
Panama
126 BRENNTAG PANAMA S.A. Panama City 0.00 100.00 100.00 26
Peru
127 BRENNTAG PERU S.A.C. Lima 0.00 100.000.00
100.00 119111
Philippines
128 BRENNTAG INGREDIENTS INC. Makati City 0.00 100.00 100.00 119
Poland
129 PHU ELMAR sp. z o.o. Bydgoszcz 0.00 100.00 100.00 135
130 Obsidian Company sp. z o.o. Warsaw 0.00 100.00 100.00 135
131 Motor Polimer sp. z o.o. Suchy Las 0.00 100.00 100.00 10
132 Fred Holmberg & Co Polska Sp.z o.o. Warsaw 0.00 100.00 100.00 2) 135
133 FORCHEM sp. z o.o. Warsaw 0.00 100.00 100.00 10
134 Eurochem Service Polska sp. z o.o. Warsaw 0.00 100.00 100.00 135
135 BRENNTAG Polska sp. z o.o. Kedzierzyn-Kozle 0.00 61.0039.00
100.00 9124
Portugal
136 Brenntag Portugal - Produtos Quimicos, Lda. Sintra 0.00 73.6726.05
0.28
100.00 50119
49
Puerto Rico
137 Brenntag Puerto Rico, Inc. Caguas 0.00 100.00 100.00 119
Romania
138 BRENNTAG S.R.L. Chiajna 0.00 100.00 100.00 111
Russia
139 OOO BRENNTAG Moscow 0.00 100.00 100.00 124
140 OOO MULTISOL Moscow 0.00 100.00 100.00 211
141 OOO Tride Rus Moscow 0.00 100.00 100.00 170
Sweden
142 Brenntag Nordic AB Malmö 0.00 100.00 100.00 144
143 Brenntag Nordic Holding AB Malmö 0.00 100.00 100.00 119
144 Brenntag Nordic Investment AB Malmö 0.00 100.00 100.00 143
Switzerland
145 Brenntag Schweizerhall AG Basel 0.00 100.00 100.00 67
C O N S O L I D A T E D F I N A N C I A L S T A T E M E N T S
Notes
A N N U A L R E P O R T 2 0 1 5 – B R E N N T A G A G 2 3 3D
fu
rt
he
r
in
fo
rm
at
io
nf
in
an
ci
al
s
ta
te
me
nt
s
C
D

No. Company Seat
Held directly
% 1)
Held indirectly
% 1)
Effective net
holding % 1)
Via No.
Singapore
146 Axxmo International Pte Ltd Singapore 0.00 100.00 100.00 2) 119
147 BRENNTAG PTE. LTD. Singapore 0.00 100.00 100.00 119
148 TAT Petroleum Pte Ltd Singapore 0.00 100.00 100.00 2) 119
Slovakia
149 BRENNTAG SLOVAKIA s.r.o. Pezinok 0.00 100.00 100.00 124
Slovenia
150 BRENNTAG LJUBLJANA d.o.o. Ljubljana 0.00 100.00 100.00 124
Spain
151 BRENNTAG QUIMICA, S.A.U. Dos Hermanas 0.00 100.00 100.00 67
152 Devon Chemicals S.A. Barcelona 0.00 100.00 100.00 119
153 Quimicas Merono, S.L. Cartagena 0.00 100.00 100.00 2) 151
Sri Lanka
154 BRENNTAG LANKA (PRIVATE) LIMITED Athurugiriya 0.00 100.00 100.00 119
South Africa
155 Canada Oil Sales (Proprietary) Limited Cape Town 0.00 100.00 100.00 157
156 LIONHEART CHEMICAL ENTERPRISES (PROPRIETARY) LIMITED
Benoni 0.00 100.00 100.00 2) 119
157 Multisol South Africa (Proprietary) Limited Cape Town 0.00 100.00 100.00 209
158 Trade Firm 100 (Proprietary) Limited Cape Town 0.00 100.00 100.00 157
South Korea
159 TAT Korea Petroleum Co., Ltd Seoul 0.00 100.00 100.00 2) 148
Taiwan
160 Brenntag (Taiwan) Co., Ltd. Taipeh 0.00 100.00 100.00 119
161 Brenntag Chemicals Co., Ltd. Taipeh 0.00 100.00 100.00 119
Thailand
162 Brenntag Enterprises (Thailand) Co., Ltd. Bangkok 0.00 51.00 49.00
100.00 164119
163 Brenntag Ingredients (Thailand) Public Company Limited
Bangkok 0.00 51.00 49.00
100.00 162119
164 Brenntag Service (Thailand) Co., Ltd. Bangkok 0.00 51.01 48.99
100.00 162119
165 Thai-Dan Corporation Limited Bangkok 0.00 99.90 0.05 0.05
100.00 163162164
Czech Republic
166 Brenntag CR s.r.o. Prague 0.00 100.00 100.00 124
Tunisia
167 ALLIANCE - TUNISIE S.A.R.L. Tunis 0.00 100.00 99.94 70
Turkey
168 BRENNTAG KIMYA TICARET LIMITED SIRKETI Istanbul 0.00 100.00 100.00 124
169 Parkoteks Kimya Sanayi ve Ticaret Anonim Sirketi Istanbul 0.00 100.00 100.00 2) 124
C O N S O L I D A T E D F I N A N C I A L S T A T E M E N T S
Notes
A N N U A L R E P O R T 2 0 1 5 – B R E N N T A G A G2 3 4
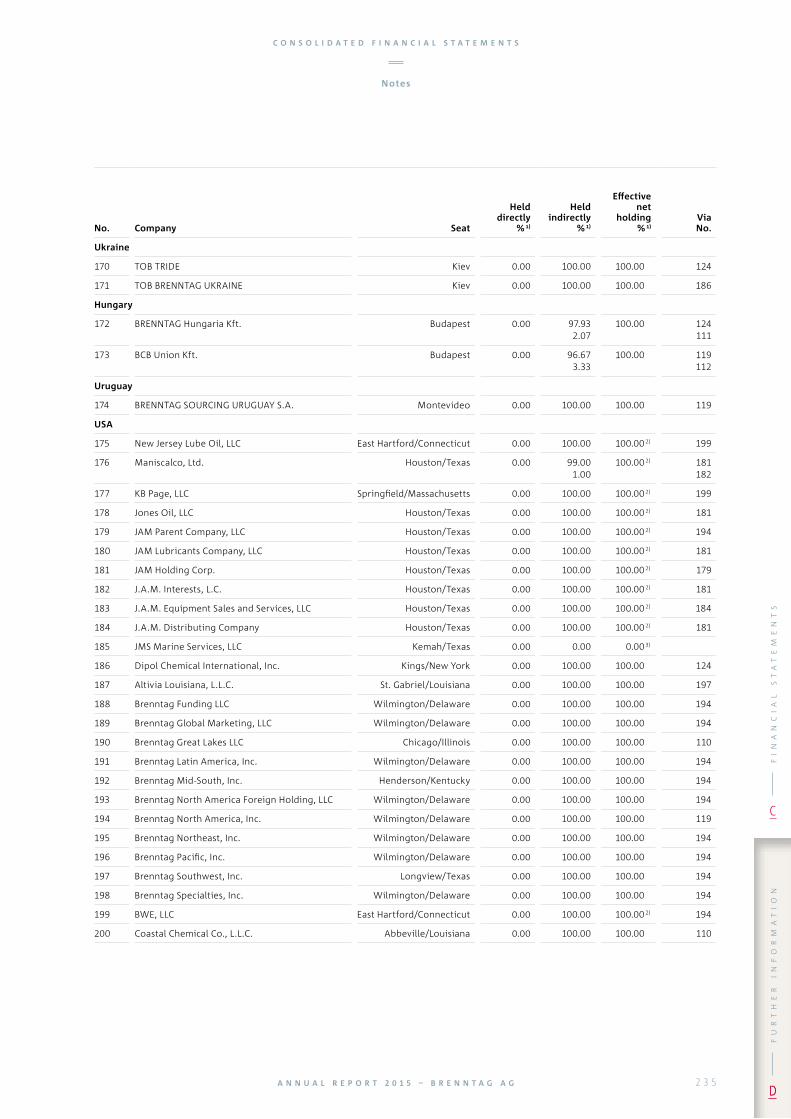
No. Company Seat
Held directly
% 1)
Held indirectly
% 1)
Effective net
holding % 1)
Via No.
Ukraine
170 TOB TRIDE Kiev 0.00 100.00 100.00 124
171 TOB BRENNTAG UKRAINE Kiev 0.00 100.00 100.00 186
Hungary
172 BRENNTAG Hungaria Kft. Budapest 0.00 97.93 2.07
100.00 124111
173 BCB Union Kft. Budapest 0.00 96.67 3.33
100.00 119112
Uruguay
174 BRENNTAG SOURCING URUGUAY S.A. Montevideo 0.00 100.00 100.00 119
USA
175 New Jersey Lube Oil, LLC East Hartford/Connecticut 0.00 100.00 100.00 2) 199
176 Maniscalco, Ltd. Houston/Texas 0.00 99.001.00
100.00 2) 181182
177 KB Page, LLC Springfield/Massachusetts 0.00 100.00 100.00 2) 199
178 Jones Oil, LLC Houston/Texas 0.00 100.00 100.00 2) 181
179 JAM Parent Company, LLC Houston/Texas 0.00 100.00 100.00 2) 194
180 JAM Lubricants Company, LLC Houston/Texas 0.00 100.00 100.00 2) 181
181 JAM Holding Corp. Houston/Texas 0.00 100.00 100.00 2) 179
182 J.A.M. Interests, L.C. Houston/Texas 0.00 100.00 100.00 2) 181
183 J.A.M. Equipment Sales and Services, LLC Houston/Texas 0.00 100.00 100.00 2) 184
184 J.A.M. Distributing Company Houston/Texas 0.00 100.00 100.00 2) 181
185 JMS Marine Services, LLC Kemah/Texas 0.00 0.00 0.00 3)
186 Dipol Chemical International, Inc. Kings/New York 0.00 100.00 100.00 124
187 Altivia Louisiana, L.L.C. St. Gabriel/Louisiana 0.00 100.00 100.00 197
188 Brenntag Funding LLC Wilmington/Delaware 0.00 100.00 100.00 194
189 Brenntag Global Marketing, LLC Wilmington/Delaware 0.00 100.00 100.00 194
190 Brenntag Great Lakes LLC Chicago/Illinois 0.00 100.00 100.00 110
191 Brenntag Latin America, Inc. Wilmington/Delaware 0.00 100.00 100.00 194
192 Brenntag Mid-South, Inc. Henderson/Kentucky 0.00 100.00 100.00 194
193 Brenntag North America Foreign Holding, LLC Wilmington/Delaware 0.00 100.00 100.00 194
194 Brenntag North America, Inc. Wilmington/Delaware 0.00 100.00 100.00 119
195 Brenntag Northeast, Inc. Wilmington/Delaware 0.00 100.00 100.00 194
196 Brenntag Pacific, Inc. Wilmington/Delaware 0.00 100.00 100.00 194
197 Brenntag Southwest, Inc. Longview/Texas 0.00 100.00 100.00 194
198 Brenntag Specialties, Inc. Wilmington/Delaware 0.00 100.00 100.00 194
199 BWE, LLC East Hartford/Connecticut 0.00 100.00 100.00 2) 194
200 Coastal Chemical Co., L.L.C. Abbeville/Louisiana 0.00 100.00 100.00 110
C O N S O L I D A T E D F I N A N C I A L S T A T E M E N T S
Notes
A N N U A L R E P O R T 2 0 1 5 – B R E N N T A G A G 2 3 5D
fu
rt
he
r
in
fo
rm
at
io
nf
in
an
ci
al
s
ta
te
me
nt
s
C
D

No. Company Seat
Held directly
% 1)
Held indirectly
% 1)
Effective net
holding % 1)
Via No.
Venezuela
201 HOLANDA VENEZUELA, C.A. Valencia 0.00 100.00 100.00 119
202 INVERSIONES HCI-CHEMCENTRAL de VENEZUELA, C.A.
Caracas 0.00 100.00 100.00 201
203 QUIMICOS BARCELONA, C.A. Caracas 0.00 100.00 100.00 201
United Arab Emirates
204 Trychem FZCO Jebel Ali, Dubai 0.00 51.00 51.00 2) 119
205 Trychem Trading L.L.C. Port Saeed, Dubai 0.00 100.00 51.00 2) 204
United Kingdom
206 Water Treatment Solutions Limited Leeds 0.00 100.00 100.00 215
207 Murgatroyd's Salt & Chemical Company Limited Leeds 0.00 100.00 100.00 217
208 Multisol Limited Leeds 0.00 100.00 100.00 213
209 Multisol Holdings Limited Leeds 0.00 100.00 100.00 208
210 Multisol Group Limited Leeds 0.00 100.00 100.00 215
211 Multisol Europe Limited Leeds 0.00 100.00 100.00 209
212 Multisol EBT Limited Leeds 0.00 100.00 100.00 208
213 Multisol Chemicals Limited Leeds 0.00 100.00 100.00 210
214 Brenntag UK Limited Leeds 0.00 100.00 100.00 215
215 Brenntag UK Holding Limited Leeds 0.00 100.00 100.00 69
216 Brenntag UK Group Limited Leeds 0.00 100.00 100.00 215
217 Brenntag Inorganic Chemicals Limited Leeds 0.00 100.00 100.00 215
218 Brenntag Inorganic Chemicals (Thetford) Limited Leeds 0.00 100.00 100.00 215
219 Brenntag Colours Limited Leeds 0.00 100.00 100.00 215
Vietnam
220 BRENNTAG VIETNAM CO. LTD. Ho Chi Minh City 0.00 100.00 100.00 147
221 Nam Giang Trading and Service Co., Ltd Ho Chi Minh City 0.00 0.00 0.00 3)
222 TAT Vietnam Petroleum Co., Ltd Ho Chi Minh City 0.00 90.00 90.00 2) 148
investments accounted for using the equity method
Denmark
223 Borup Kemi I/S Borup 0.00 33.33 33.33 28
Germany
224 SOFT CHEM GmbH Laatzen 0.00 33.40 17.03 35
South Africa
225 Crest Chemicals (Proprietary) Limited Woodmead 0.00 50.00 50.00 119
Thailand
226 Berli Asiatic Soda Co., Ltd. Bangkok 0.00 50.00 50.00 163
227 Siri Asiatic Co., Ltd. Bangkok 0.00 50.00 50.00 163
1) Shares in capital of the company2) Business combination in accordance with IFRS 33) Structured entity
C O N S O L I D A T E D F I N A N C I A L S T A T E M E N T S
Notes
A N N U A L R E P O R T 2 0 1 5 – B R E N N T A G A G2 3 6

C O N S O L I D A T E D F I N A N C I A L S T A T E M E N T S
Notes
A N N U A L R E P O R T 2 0 1 5 – B R E N N T A G A G 2 3 7D
fu
rt
he
r
in
fo
rm
at
io
nf
in
an
ci
al
s
ta
te
me
nt
s
C
D

F U R T H E R I N F O R M A T I O N
238 – 262
F U R T H E R I N F O R M A T I O N
Content
A N N U A L R E P O R T 2 0 1 5 – B R E N N T A G A G2 3 8

240 INDEPENDENT AUDITOR’S REPORT
242 SEGMENT INFORMATION
248 GLOSSARY
258 TABLE DIRECTORY
261 FIVEYEAR OVERVIEW
262 IMPRINT AND CONTACT
F U R T H E R I N F O R M A T I O N
Content
A N N U A L R E P O R T 2 0 1 5 – B R E N N T A G A G 2 3 9D
fu
rt
he
r
in
fo
rm
at
io
n

INDEPENDENT AUDITOR’S REPORT
TO BRENNTAG AG, MÜLHEIM AN DER RUHR
report on the consolidated financial statements
We have audited the accompanying consolidated financial statements of Brenntag AG, Mülheim
an der Ruhr, and its subsidiaries, which comprise the consolidated statement of financial position,
the consolidated income statement, the consolidated statement of comprehensive income, the con-
solidated statement of changes in equity, the consolidated statement of cash flows and the notes to
the consolidated financial statements for the business year from January 1 to December 31, 2015.
Board of Managing Directors’ Responsibility for the Consolidated Financial Statements
The Board of Managing Directors of Brenntag AG, Mülheim an der Ruhr, is responsible for the pre pa-
ration of these consolidated financial statements. This responsibility includes that these consolidated
financial statements are prepared in accordance with International Financial Reporting Standards, as
adopted by the EU, and the additional requirements of German commercial law pursuant to Section
315a (1) HGB (“Handelsgesetzbuch”: German Commercial Code) and that these consolidated financial
statements give a true and fair view of the net assets, financial position and results of operations of the
group in accordance with these requirements. The Board of Managing Directors is also responsible for
the internal controls as the Board of Managing Directors determines are necessary to enable the prepa-
ration of consolidated financial statements that are free from material misstatement, whether due to
fraud or error.
Auditor’s Responsibility
Our responsibility is to express an opinion on these consolidated financial statements based on our
audit. We conducted our audit in accordance with Section 317 HGB and German generally accepted
standards for the audit of financial statements promulgated by the Institut der Wirtschaftsprüfer
(Institute of Public Auditors in Germany) (IDW) and additionally observed the International Standards
on Auditing (ISA). Accordingly, we are required to comply with ethical requirements and plan and
perform the audit to obtain reasonable assurance about whether the consolidated financial state-
ments are free from material misstatement.
An audit involves performing audit procedures to obtain audit evidence about the amounts and
disclosures in the consolidated financial statements. The selection of audit procedures depends
on the auditor’s professional judgment. This includes the assessment of the risks of material
misstatement of the consolidated financial statements, whether due to fraud or error. In assessing
those risks, the auditor considers the internal control system relevant to the entity’s preparation of
consolidated financial statements that give a true and fair view. The aim of this is to plan and per-
form audit procedures that are appropriate in the given circumstances, but not for the purpose of
expressing an opinion on the effectiveness of the group’s internal control system. An audit also
includes evaluating the appropriateness of accounting policies used and the reasonableness of
accounting estimates made by the Board of Managing Directors, as well as evaluating the overall
presentation of the consolidated financial statements.
We believe that the audit evidence we have obtained is sufficient and appropriate to provide a basis
for our audit opinion.
F U R T H E R I N F O R M A T I O N
Independent Auditor ’s Report
A N N U A L R E P O R T 2 0 1 5 – B R E N N T A G A G2 4 0

Audit Opinion
According to Section 322 (3) Clause 1 HGB, we state that our audit of the consolidated financial
statements has not led to any reservations.
In our opinion based on the findings of our audit, the consolidated financial statements comply, in
all material respects, with IFRSs, as adopted by the EU, and the additional requirements of German
commercial law pursuant to Section 315a (1) HGB and give a true and fair view of the net assets and
financial position of the Group as at December 31, 2015 as well as the results of operations for the
business year then ended, in accordance with these requirements.
report on the group management report
We have audited the accompanying group management report, which is combined with the man-
agement report of the company, of Brenntag AG, Mülheim an der Ruhr, for the business year from
January 1 to December 31, 2015. The Board of Managing Directors of Brenntag AG, Mülheim an der
Ruhr, is responsible for the preparation of the combined management report in accordance with the
requirements of German commercial law applicable pursuant to Section 315a (1) HGB. We conducted
our audit in accordance with Section 317 (2) HGB and German generally accepted standards for the
audit of the combined management report promulgated by the Institut der Wirtschaftsprüfer (Insti-
tute of Public Auditors in Germany) (IDW). Accordingly, we are required to plan and perform the audit
of the combined management report to obtain reasonable assurance about whether the combined
management report is consistent with the consolidated financial statements and the audit findings,
as a whole provides a suitable view of the Group’s position and suitably presents the opportunities
and risks of future development.
According to Section 322 (3) Clause 1 HGB we state, that our audit of the combined management
report has not led to any reservations.
In our opinion based on the findings of our audit of the consolidated financial statements and com-
bined management report, the combined management report is consistent with the consolidated
financial statements, as a whole provides a suitable view of the Group’s position and suitably presents
the opportunities and risks of future development.
Düsseldorf, March 7, 2016
PricewaterhouseCoopers
Aktiengesellschaft
Wirtschaftsprüfungsgesellschaft
sgd. Thomas Tandetzki sgd. ppa. Frank Schemann
Wirtschaftsprüfer Wirtschaftsprüfer
(German Public Auditor) (German Public Auditor)
F U R T H E R I N F O R M A T I O N
Independent Auditor ’s Report
A N N U A L R E P O R T 2 0 1 5 – B R E N N T A G A G 2 4 1D
fu
rt
he
r
in
fo
rm
at
io
n

SEGMENT INFORMATION
BUSINESS PERFORMANCE OF THE BRENNTAG GROUP
2015
Change
in EUR m 2015 2014 abs. in % in % (fx adj.)
Sales 10,346.1 10,015.6 330.5 3.3 – 4.6
Operating gross profit 2,321.7 2,078.2 243.5 11.7 2.3
Operating expenses – 1,514.3 – 1,351.5 – 162.8 12.0 3.1
Operating EBITDA 807.4 726.7 80.7 11.1 0.7
Transaction costs / holding charges – 0.2 – 0.2 – –
EBITDA (incl. transaction costs / holding charges) 807.4 726.9 80.5 11.1 0.7
Depreciation of property. plant and equipment – 108.7 – 99.4 – 9.3 9.4 1.1
EBITA 698.7 627.5 71.2 11.3 0.6
Amortization of intangible assets – 36.9 – 35.9 – 1.0 2.8 – 5.4
Net finance costs – 112.5 – 83.8 – 28.7 34.2 –
Profit before tax 549.3 507.8 41.5 8.2 –
Income tax expense – 181.2 – 168.1 – 13.1 7.8 –
Profit after tax 368.1 339.7 28.4 8.4 –
d.01 business performance of the brenntag group/ 2015
q4 2015
Change
in EUR m Q4 2015 Q4 2014 abs. in % in % (fx adj.)
Sales 2,473.3 2,511.0 – 37.7 – 1.5 – 6.6
Operating gross profit 567.0 536.2 30.8 5.7 – 0.3
Operating expenses – 374.4 – 337.7 – 36.7 10.9 5.2
Operating EBITDA 192.6 198.5 – 5.9 – 3.0 – 9.6
Transaction costs / holding charges – – – – –
EBITDA (incl. transaction costs / holding charges) 192.6 198.5 – 5.9 – 3.0 – 9.6
Depreciation of property. plant and equipment – 28.2 – 25.8 – 2.4 9.3 3.3
EBITA 164.4 172.7 – 8.3 – 4.8 – 11.5
Amortization of intangible assets – 8.5 – 9.0 0.5 – 5.6 – 8.5
Net finance costs – 43.7 – 19.6 – 24.1 123.0 –
Profit before tax 112.2 144.1 – 31.9 – 22.1 –
Income tax expense – 38.1 – 42.5 4.4 – 10.4 –
Profit after tax 74.1 101.6 – 27.5 – 27.1 –
d.02 business performance of the brenntag group / q4 2015
F U R T H E R I N F O R M A T I O N
Segment Information
A N N U A L R E P O R T 2 0 1 5 – B R E N N T A G A G2 4 2

BUSINESS PERFORMANCE IN THE SEGMENTS
2015
in EUR m Brenntag
Group EMEANorth
AmericaLatin
AmericaAsia
PacificAll other
segments
External sales 10,346.1 4,654.4 3,600.6 925.8 834.1 331.2
Operating gross profit 2,321.7 1,024.2 942.6 201.2 140.0 13.7
Operating expenses – 1,514.3 – 671.2 – 577.0 – 136.5 – 89.7 – 39.9
Operating EBITDA 807.4 353.0 365.6 64.7 50.3 – 26.2
d.03 business performance in the segments / 2015
q4 2015
in EUR m Brenntag
Group EMEANorth
AmericaLatin
AmericaAsia
PacificAll other
segments
External sales 2,473.3 1,102.9 861.9 225.6 217.0 65.9
Operating gross profit 567.0 248.9 230.0 50.5 35.3 2.3
Operating expenses – 374.4 – 164.2 – 146.4 – 32.7 – 21.9 – 9.2
Operating EBITDA 192.6 84.7 83.6 17.8 13.4 – 6.9
d.04 business performance in the segments / q4 2015
emea
2015
Change
in EUR m 2015 2014 abs. in % in % (fx adj.)
External sales 4,654.4 4,624.7 29.7 0.6 – 0.6
Operating gross profit 1,024.2 972.0 52.2 5.4 3.6
Operating expenses – 671.2 – 636.1 – 35.1 5.5 3.8
Operating EBITDA 353.0 335.9 17.1 5.1 3.2
d.05 business performance in the segments / emea 2015
q4 2015
Change
in EUR m Q4 2015 Q4 2014 abs. in % in % (fx adj.)
External sales 1,102.9 1,105.7 – 2.8 – 0.3 – 0.9
Operating gross profit 248.9 238.4 10.5 4.4 3.4
Operating expenses – 164.2 – 154.0 – 10.2 6.6 5.6
Operating EBITDA 84.7 84.4 0.3 0.4 – 0.6
d.06 business performance in the segments / emea q4 2015
F U R T H E R I N F O R M A T I O N
Segment Information
A N N U A L R E P O R T 2 0 1 5 – B R E N N T A G A G 2 4 3D
fu
rt
he
r
in
fo
rm
at
io
n

north america
2015
Change
in EUR m 2015 2014 abs. in % in % (fx adj.)
External sales 3,600.6 3,332.0 268.6 8.1 – 8.6
Operating gross profit 942.6 802.2 140.4 17.5 – 0.5
Operating expenses – 577.0 – 478.6 – 98.4 20.6 2.3
Operating EBITDA 365.6 323.6 42.0 13.0 – 4.6
d.07 business performance in the segments / north america 2015
latin america
2015
Change
in EUR m 2015 2014 abs. in % in % (fx adj.)
External sales 925.8 864.0 61.8 7.2 – 0.1
Operating gross profit 201.2 169.5 31.7 18.7 9.8
Operating expenses – 136.5 – 122.7 – 13.8 11.2 2.6
Operating EBITDA 64.7 46.8 17.9 38.2 29.1
d.09 business performance in the segments / latin america 2015
q4 2015
Change
in EUR m Q4 2015 Q4 2014 abs. in % in % (fx adj.)
External sales 861.9 876.6 – 14.7 – 1.7 – 13.0
Operating gross profit 230.0 214.3 15.7 7.3 – 5.0
Operating expenses – 146.4 – 124.1 – 22.3 18.0 5.0
Operating EBITDA 83.6 90.2 – 6.6 – 7.3 – 18.5
d.08 business performance in the segments / north america q4 2015
q4 2015
Change
in EUR m Q4 2015 Q4 2014 abs. in % in % (fx adj.)
External sales 225.6 233.2 – 7.6 – 3.3 – 4.2
Operating gross profit 50.5 48.5 2.0 4.1 3.2
Operating expenses – 32.7 – 33.6 0.9 – 2.7 – 2.6
Operating EBITDA 17.8 14.9 2.9 19.5 15.7
d.10 business performance in the segments / latin america q4 2015
F U R T H E R I N F O R M A T I O N
Segment Information
A N N U A L R E P O R T 2 0 1 5 – B R E N N T A G A G2 4 4

asia pacific
2015
Change
in EUR m 2015 2014 abs. in % in % (fx adj.)
External sales 834.1 748.2 85.9 11.5 – 2.3
Operating gross profit 140.0 120.7 19.3 16.0 2.3
Operating expenses – 89.7 – 79.5 – 10.2 12.8 – 0.1
Operating EBITDA 50.3 41.2 9.1 22.1 7.0
d.11 business performance in the segments / asia pacific 2015
all other segments
2015
Change
in EUR m 2015 2014 abs. in % in % (fx adj.)
External sales 331.2 446.7 – 115.5 – 25.9 – 25.9
Operating gross profit 13.7 13.8 – 0.1 – 0.7 – 0.7
Operating expenses – 39.9 – 34.6 – 5.3 15.3 15.3
Operating EBITDA – 26.2 – 20.8 – 5.4 26.0 26.0
d.13 business performance in the segments / all other segments 2015
q4 2015
Change
in EUR m Q4 2015 Q4 2014 abs. in % in % (fx adj.)
External sales 217.0 196.3 20.7 10.5 3.1
Operating gross profit 35.3 32.3 3.0 9.3 2.0
Operating expenses – 21.9 – 19.9 – 2.0 10.1 3.7
Operating EBITDA 13.4 12.4 1.0 8.1 – 0.7
d.12 business performance in the segments / asia pacific q4 2015
q4 2015
Change
in EUR m Q4 2015 Q4 2014 abs. in % in % (fx adj.)
External sales 65.9 99.2 – 33.3 – 33.6 – 33.6
Operating gross profit 2.3 2.7 – 0.4 – 14.8 – 14.8
Operating expenses – 9.2 – 6.1 – 3.1 50.8 50.8
Operating EBITDA – 6.9 – 3.4 – 3.5 102.9 102.9
d.14 business performance in the segments / all other segments q4 2015
F U R T H E R I N F O R M A T I O N
Segment Information
A N N U A L R E P O R T 2 0 1 5 – B R E N N T A G A G 2 4 5D
fu
rt
he
r
in
fo
rm
at
io
n

KEY FINANCIAL FIGURES BY SEGMENT for the period from January 1 to December 31
segment reporting in accordance with ifrs 8 1) / 2015
in EUR m EMEA 4)North
AmericaLatin
AmericaAsia
PacificAll other
segmentsConsoli-
dation Group
External sales
2015 4,654.4 3,600.6 925.8 834.1 331.2 – 10,346.1
2014 4,624.7 3,332.0 864.0 748.2 446.7 – 10,015.6
Change in % 0.6 8.1 7.2 11.5 – 25.9 – 3.3
fx adjusted change in % – 0.6 – 8.6 – 0.1 – 2.3 – 25.9 – – 4.6
Inter-segment sales2015 9.9 6.2 1.3 – 0.7 – 18.1 –
2014 9.0 6.5 1.9 3.6 0.8 – 21.8 –
Operating gross profit 2)
2015 1,024.2 942.6 201.2 140.0 13.7 – 2,321.7
2014 972.0 802.2 169.5 120.7 13.8 – 2,078.2
Change in % 5.4 17.5 18.7 16.0 – 0.7 – 11.7
fx adjusted change in % 3.6 – 0.5 9.8 2.3 – 0.7 – 2.3
Gross profit
2015 – – – – – – 2,266.0
2014 – – – – – – 2,027.5
Change in % – – – – – – 11.8
fx adjusted change in % – – – – – – 2.4
Operating EBITDA (Segment result)
2015 353.0 365.6 64.7 50.3 – 26.2 – 807.4
2014 335.9 323.6 46.8 41.2 – 20.8 – 726.7
Change in % 5.1 13.0 38.2 22.1 26.0 – 11.1
fx adjusted change in % 3.2 – 4.6 29.1 7.0 26.0 – 0.7
EBITDA
2015 – – – – – – 807.4
2014 – – – – – – 726.9
Change in % – – – – – – 11.1
fx adjusted change in % – – – – – – 0.7
Operating EBITDA / Operating gross profit 2)
2015 in % 34.5 38.8 32.2 35.9 – 191.2 – 34.8
2014 in % 34.6 40.3 27.6 34.1 – 150.7 – 35.0
Investments in non-current assets (Capex) 3)
2015 59.0 52.0 12.3 6.1 0.7 – 130.1
2014 56.9 32.5 9.6 5.1 0.7 – 104.8
d.15 segment reporting in accordance with ifrs 8 / 2015
1) Further information on segment reporting in accordance with IFRS 8 is to be found under Note 31.).2) External sales less cost of materials.3) The other additions to property, plant and equipment and intangible assets are shown as Investments in non-current assets.4) Europe, Middle East & Africa.
F U R T H E R I N F O R M A T I O N
Segment Information
A N N U A L R E P O R T 2 0 1 5 – B R E N N T A G A G2 4 6

KEY FINANCIAL FIGURES BY SEGMENT for the period from October 1 to December 31
segment reporting in accordance with ifrs 8 1) / q4 2015
in EUR m EMEA 4)North
AmericaLatin
AmericaAsia
PacificAll other
segmentsConsoli-
dation Group
External sales
2015 1,102.9 861.9 225.6 217.0 65.9 – 2,473.3
2014 1,105.7 876.6 233.2 196.3 99.2 – 2,511.0
Change in % – 0.3 – 1.7 – 3.3 10.5 – 33.6 – – 1.5
fx adjusted change in % – 0.9 – 13.0 – 4.2 3.1 – 33.6 – – 6.6
Inter-segment sales2015 2.2 0.3 – – 0.1 – 2.6 –
2014 2.5 1.7 0.3 0.9 0.4 – 5.8 –
Operating gross profit 2)
2015 248.9 230.0 50.5 35.3 2.3 – 567.0
2014 238.4 214.3 48.5 32.3 2.7 – 536.2
Change in % 4.4 7.3 4.1 9.3 – 14.8 – 5.7
fx adjusted change in % 3.4 – 5.0 3.2 2.0 – 14.8 – – 0.3
Gross profit
2015 – – – – – – 552.9
2014 – – – – – – 521.4
Change in % – – – – – – 6.0
fx adjusted change in % – – – – – – 0.0
Operating EBITDA (Segment result)
2015 84.7 83.6 17.8 13.4 – 6.9 – 192.6
2014 84.4 90.2 14.9 12.4 – 3.4 – 198.5
Change in % 0.4 – 7.3 19.5 8.1 102.9 – – 3.0
fx adjusted change in % – 0.6 – 18.5 15.7 – 0.7 102.9 – – 9.6
EBITDA
2015 – – – – – – 192.6
2014 – – – – – – 198.5
Change in % – – – – – – – 3.0
fx adjusted change in % – – – – – – – 9.6
Operating EBITDA / Operating gross profit 2)
2015 in % 34.0 36.3 35.2 38.0 – 300.0 – 34.0
2014 in % 35.4 42.1 30.7 38.4 – 125.9 – 37.0
Investments in non-current assets (Capex) 3)
2015 29.8 27.2 7.2 2.8 0.2 – 67.2
2014 20.0 13.1 5.8 2.0 – 0.5 – 40.4
d.16 segment reporting in accordance with ifrs 8 / q4 2015
1) Further information on segment reporting in accordance with IFRS 8 is to be found under Note 31.).2) External sales less cost of materials.3) The other additions to property, plant and equipment and intangible assets are shown as Investments in non-current assets.4) Europe, Middle East & Africa.
F U R T H E R I N F O R M A T I O N
Segment Information
A N N U A L R E P O R T 2 0 1 5 – B R E N N T A G A G 2 4 7D
fu
rt
he
r
in
fo
rm
at
io
n

A
accounts receivable securitization programme |
Financing instrument that secures the lender by transferring
trade receivables.
additional paid-in capital | Part of equity resulting
from contributions by the shareholders, e.g. if new shares
are issued at a price above the par value as part of a
capital increase.
ad-hoc publicity | Obligation of issuers of securities to
immediately report and publish any inside information that
directly affects them. The obligation to release such inside
information without delay is contained in Section 15 of the
German Securities Trading Act. The aim is to avoid the abuse
of inside information and enhance market transparency.
B
bearer share | Bearer shares are not issued in a person’s
name and is therefore wholly owned by whoever hold the
physical share certificate. It grants the holder of the share all
shareholder rights. As a result, these shares can be bought
or sold without any formal process.
best practices | A best practice is a method or technique
that has consistently shown results superior to those
achieved by other means and that is used as a benchmark.
board of management | In addition to the ➔ Supervisory
Board, the Board of Management is the second body of a
stock corporation required according to the German Stock
Corporation Act. The Board of Management is, among other
things, responsible for the management of the company
and its representation. It is appointed by the Supervisory
Board for maximum periods of five years.
bond | Security which represents a loan liability of the
issuer and is generally traded on a stock market. The buyer
of the bonds therefore becomes a lender and, in return,
receives interest payments which are specified in the coupon.
bond with warrant units | A special form of a ➔ bond
that, in addition to the bond portion, includes option rights
to buy Brenntag AG shares. The bond with warrant units is
composed of a straight bond and warrants. Both portions
can be detached as well as combined again by the investor.
The bond with warrant units, the straight bond and the
warrants each have their own ISIN and can therefore be
traded separately on the stock exchange. The bond portion
was issued at a discount reflecting the warrant premium.
This discount will be appreciated over the lifetime of the
instrument. The warrant premium was recognized in the
additional paid-in capital.
C
cagr | CAGR is the abbreviation for compound annual
growth rate and refers to the average annual growth rate.
capex | Capex is the abbreviation for capital expenditure
and is an indicator for investments in non-current assets.
At Brenntag, Capex is defined as additions to property, plant
and equipment as well as acquired software, licences and
similar rights, as far as they are not related to a business
combination (see the Notes to the Consolidated Financial
Statements, Notes 20 and 21).
cash flow | This is an indicator of the liquidity of an entity.
The total change in cash and cash equivalents consists of the
cash flow from operating activities (operating cash flow), the
cash flow used in investing activities and the cash flow from
financing activities. Cash flow from operating activities is
available e.g. for investments, repayment of debt or distri-
bution of ➔ dividends.
cash flow hedge reserve | If certain criteria are met,
the effective part of the fair value measurement of hedging
instruments designated as a ➔ cash flow hedge can be rec-
ognized in other comprehensive income (OCI).
cash flow hedges | Cash flow hedges are used to hedge
the risk of cash flow fluctuations. This risk can relate either
to assets or liabilities recognized in the balance sheet or arise
from a planned transaction. Cash flow fluctuations can be
caused, for example, by variations in interest rates or exchange
rates, which are counteracted e.g. by concluding ➔ interest
rate swaps or ➔ foreign exchange forward transactions.
GLOSSARY
F U R T H E R I N F O R M A T I O N
Glossary
A N N U A L R E P O R T 2 0 1 5 – B R E N N T A G A G2 4 8

cash generating unit (cgu) | Identifiable group of
assets that generates cash inflows that are largely independent
of the cash flows from other (groups of) assets. It is used to
determine potential impairments of assets that cannot be
calculated separately.
compliance | General term for the observance of all appli-
cable laws, external and internal regulations, principles,
procedures and standards.
consolidated financial statements | Consolidated
financial statements comprise the financial statements of
a group of entities as if they were a single entity. All relation-
ships between the legally independent but economically
affiliated entities are eliminated, so that the consolidated
financial statements only show the activities of the Group
with third parties.
contingent liability | Possible obligation which must
not be recognized due to significant uncertainty regarding
its occurrence and / or amount. Contingent liabilities are to
be reported as additional information in the Notes.
controlling | Corporate Controlling provides analyses
on the performance of Group entities using numerous key
performance indicators and supports the decision-making
process on resource allocation (e.g. investments). The
department is also responsible for the monthly management
reporting process as well as the forecasting and planning
processes.
conversion ratio | The conversion ratio at Brenntag is cal-
culated as the quotient of operating EBITDA and gross profit.
It represents one of the most important efficiency ratios.
corporate governance | This refers to the regulatory
framework for the management and monitoring of a com-
pany. A large proportion of this regulatory framework is
included in the ➔ German Corporate Governance Code.
cost of sales | Cost of sales includes cost of materials for
merchandise, raw materials and supplies, services purchased,
inventory changes in finished and semi-finished goods, other
own work capitalized and operating costs.
covenants | This term refers to clauses or (subsidiary)
agreements in loan agreements and bond conditions. They
are contractually binding warranties given by the borrower
or bond debtor for the term of a loan agreement.
cross-default clause | Clause in a loan agreement or
bond conditions under which a default is deemed to have
occurred if the borrower is in default with other creditors
without being in default of the loan agreement containing
the clause.
cross-selling | At Brenntag, we understand cross-selling
to mean both the selling of our existing product portfolio
to new customers, e.g. those who come to Brenntag as a
result of acquisitions, and also the selling of newly acquired
product portfolios to our existing customers.
currency swap | Financial transaction with a counterparty
(generally a bank) undertaken as part of foreign currency
management. The two parties to the contract first swap
two sums in different currencies and, at the same time,
conclude an agreement to reverse the swap at a future point
in time. The underlying exchange rates for the two swaps
are usually different.
D
d&o insurance | Directors’ and officers’ insurance is a
liability insurance for pure financial damages that covers
bodies of the company against claims by third parties and by
the company for breaches of their duty of care.
dax | The “Deutsche Aktienindex DAX® “ (DAX® German
stock exchange index) is the top index on the German stock
exchange and measures the development of the 30 largest
and highest-selling companies on the German stock market.
deferred tax assets | Deferred tax assets are recognized
as future tax benefit resulting from temporary differences
between the IFRS carrying amount and tax balance sheet
carrying value as well as from tax loss carryforwards. Deferred
tax assets may result in future tax refunds. However, at the
reporting date, there are no effective tax receivables from
tax authorities resulting from deferred taxes.
F U R T H E R I N F O R M A T I O N
Glossary
A N N U A L R E P O R T 2 0 1 5 – B R E N N T A G A G 2 4 9D
fu
rt
he
r
in
fo
rm
at
io
n

deferred tax liabilities | Deferred tax liabilities are
recognized as the amount of income tax payable in future
periods in respect of differences between the IFRS carrying
amount and tax balance sheet carrying amount. Deferred
tax liabilities may result in future tax payments. However,
at the reporting date, there are no effective tax liabilities to
tax authorities resulting from deferred taxes.
derivatives | Derivatives ➔ financial instruments or deriva-
tives are linked to a price, index, exchange rate or similar
variable and require no or only a minor initial investment
compared with contracts with a similar response to changes
in market factors. Examples of derivatives are ➔ foreign
exchange forward transactions and ➔ interest rate swaps.
designated sponsor | A designated sponsor is a credit
institute, brokerage company or securities trading house
admitted to the stock exchange as a market participant. It
provides additional liquidity in the Xetra® electronic trading
system for the issuers of shares by undertaking to enter
binding bid and ask limits for the supported shares in the
order book in continuous trading and in auctions. This
enables investors to buy or sell supported shares at any time
at prices in line with market conditions.
discounted cash flow method | Method for valuing
assets, particularly companies. The company’s value is equal
to the present value of the future cash flows generated by
the company which are available to the investors. When
calculating the present value, the future cash flows are dis-
counted at a risk-adjusted interest rate to the valuation date.
distributable profit / loss | The distributable profit / loss
is designated by the provisions of German commercial law
in relation to corporations as that part of the profit on the
use of which the ➔ General Shareholders’ Meeting or general
meeting decides. It constitutes the upper limit of any distri-
bution of profit / ➔ dividends. The distributable profit / loss is
an item in ➔ single-entity financial statements drawn up in
accordance with the provisions of the German Commercial
Code (HGB) and is not shown in consolidated IFRS financial
statements.
diversification | Diversification at Brenntag means a
broad range as regards geography, end markets, customers,
products and suppliers. This high extent of diversification
makes Brenntag largely independent of individual market
segments or regions.
dividend | The dividend is the proportion of the profit
paid out for each share owned. The ➔ General Shareholders’
Meeting decides on the amount of dividend.
E
earnings per share | Performance indicator calculated by
dividing the portion of profit after tax attributable to share-
holders of Brenntag AG by the average weighted number of
shares in circulation.
ebita | Earnings Before Interest, Taxes and Amortization.
EBITA is a profitability performance indicator.
ebitda | Earnings Before Interest, Taxes, Depreciation and
Amortization. At Brenntag, EBITDA is a key performance
indicator of the Group.
emea | Europe, Middle East & Africa
equity method | Accounting method for investments in
companies that are not fully included with their assets and
liabilities in the ➔ consolidated financial statements. The
carrying amount is adjusted to reflect changes in pro-rata
equity of the investment. This change is recognized in the
consolidated income statement.
euribor | This is the abbreviation for European Interbank
Offered Rate and it serves as both a reference interest rate
for loans and invested funds in the short-term customer
sector as well as for fixed-time deposits in the interbank
sector (between the banks). To calculate EURIBOR, banks in
the eurozone state at what interest rates they are lending
money to other banks and what rates they are being offered.
external sales | External sales cover all sales with third
parties occurring as part of the normal course of business.
Sales between consolidated subsidiaries including structured
entities are not included.
F U R T H E R I N F O R M A T I O N
Glossary
A N N U A L R E P O R T 2 0 1 5 – B R E N N T A G A G2 5 0

F
fair value | Fair value is defined as the price that would be
received to sell an asset or paid to transfer a liability in an
orderly transaction between independent market participants
at the measurement date.
federal gazette “bundesanzeiger” | The electronic
German Federal Gazette is the central platform for official
publications and announcements and for legal news about
companies.
finance lease | Agreement to convey the right to use an
asset in return for a single or series of payment(s) transfer-
ring substantially all the risks and rewards incidental to the
ownership of the asset. The asset is to be recognized by the
lessee (owner of the right to use the asset).
financial covenants | Subgroup of covenants in which
the lender agrees to meet specific performance indicators.
financial instruments | Financial instruments as defined
by IFRSs are contracts that give rise to a financial asset
(cash, shares, receivables etc.) of one entity and, at the same
time, a financial liability or equity instrument (residual inter-
est in the assets of an entity after deducting all its liabilities)
of another entity.
focus industries | Brenntag has identified six focus indus-
tries in which we expect above-average growth. These are
the ACES segments (adhesives, coatings, elastomers, paints
and sealants), the food industry, the oil and gas industry, the
personal care industry, pharmaceuticals and water treatment.
foreign exchange forward | Transaction involving a
fixed agreement between two parties to perform a currency
transaction at a fixed rate on a future date.
forward contract | Financial transaction with a counter-
party (generally a bank) undertaken as part of foreign currency
management. The two parties to the contract conclude an
agreement to swap two currencies at a future point in time
at a specified exchange rate.
free cash flow | Ratio for measuring operational cash
generation. At Brenntag, free cash flow is defined as ➔ EBITDA less ➔ Capex plus / less changes in ➔ working capital.
free float | Free float refers to shares that are not owned
by major shareholders and can therefore be acquired and
traded by the general public. As a rule, the larger the free
float, the easier it is for investors to buy and sell the stock.
fuel additives | Fuel additives are substances added to
fuels to obtain additional effects, e.g. engine cleaning or
increased fuel storage life.
full-time equivalents | Number of employees on a
full-time equivalent basis, i.e. part-time jobs are weighted
according to the number of hours worked.
fx-adjusted | Adjusted for translation effects of exchange
rates varying over time. Comparability of financial data
relating to two reporting periods with different exchange
rates is improved by translating both values at the same cur-
rent exchange rate.
G
general shareholders’ meeting (gsm) | The GSM is the
institution where shareholders can exercise their rights from
their shareholding. An ordinary GSM takes place regularly
and at least once a year. The GSM is, inter alia, responsible
for: the appointment and removal of the members of the
Supervisory Board (but not of the employee representatives,
if existing); decides on the appropriation of profits; discharge
of the Board of Management and Supervisory Board.
german corporate governance code | A collection of
rules on corporate governance compiled by the German
government commission on the “Corporate Governance Code”.
The Code focuses on rules concerning the shareholders and
the general shareholders’ meeting, cooperation between
the management and supervisory boards, the management
and supervisory boards themselves and general rules on
transparency, accounting and auditing. As well as repeating
statutory regulations, the Code also contains “recommenda-
tions” and “suggestions”. According to Section 161 of the
German Stock Corporation Act, the Board of Management
and the Supervisory Board are obliged to publish a declara-
tion of conformity with the Code and explain deviations
from the “recommendations”.
F U R T H E R I N F O R M A T I O N
Glossary
A N N U A L R E P O R T 2 0 1 5 – B R E N N T A G A G 2 5 1D
fu
rt
he
r
in
fo
rm
at
io
n

global key accounts | At Brenntag, we take care of our
key accounts at local, national, pan-regional and global level
and develop and implement tailor-made concepts for their
optimum supply with industrial and specialty chemicals. For
our customers, this means they can concentrate on their
core business secure in the knowledge that they have a part-
ner they can rely on.
goodwill | Goodwill is the difference between the pur-
chase price of an investment in a subsidiary and the ➔ fair
value of the acquired share in net assets at the date of
acquisition.
gross profit | Gross profit is defined as ➔ operating gross
profit less production and ➔ mixing & blending costs.
(group) treasury | Designates the Group finance
department, which looks after matters such as financing,
cash investment and the management of financial risks.
H
hedging | Hedging is a strategy to protect against interest
rate, currency or share price risks, e.g. by ➔ derivative financial
instruments (options, swaps and forward contracts etc.).
hse | HSE stands for Health, Safety and Environment. HSE
therefore covers topics concerning occupational health and
safety and environmental protection.
hub-and-spoke system | Brenntag sites are generally
operated via an efficient ‘hub and spoke’ model. Large bulk
quantities are received at Brenntag’s ‘hub’ locations which
have large tank farms, warehouses and mixing and blending
facilities, plus sometimes white room facilities. From our hubs
we supply our ‘spoke’ facilities which accommodate smaller
tank farms and warehouses and are located in close proxim-
ity to our customers to ensure prompt and smooth delivery.
I
ibc | IBC stands for intermediate bulk container. Consisting
of a plastic tank and tubular metal frame, these are used
mostly for liquids. A capacity of 1,000 litres is typical.
iccta | The International Council of Chemical Trade Associa-
tions (established in 1991) represents the interests of over
1,500 chemical distributors worldwide. ICCTA was set up to
fill the need to have a worldwide chemical association coor-
dinating work on issues and programmes of international
interest across chemical trade associations.
ifrs / ias | International accounting standards issued by the
IASB (International Accounting Standards Board) with the
aim of creating transparent and comparable accounting
principles. By decree of the European Parliament and the
European Council, these are to be used by publicly traded
EU companies. IFRS stands for International Financial
Reporting Standards. IAS means International Accounting
Standards.
impairment test | The carrying amount of an asset is
compared with its recoverable amount. The recoverable
amount is the higher of ➔ fair value less costs of disposal and
value in use. The value in use is the present value of future
cash flows expected to be obtained from the use. If the
carrying amount is higher than the recoverable amount, the
carrying amount has to be adjusted to the recoverable
amount (impairment).
industrial chemicals | Industrial chemicals is the term
used at Brenntag to distinguish standard chemical products
that have specific properties and effects from ➔ specialty
chemicals. The manufacturer of the product is generally
irrelevant for the user.
insider information | Insider Information as defined in
Section 13 of the German Securities Trading Act (WpHG) is
any concrete information about any circumstances or events
in connection with an issuer of insider securities or with
insider securities themselves such as shares as well as options
or trading in futures in connection with such shares is are
not known to the public and that could, in the event of
becoming publically known, significantly influence the stock
exchange price or the market value of such insider securities.
F U R T H E R I N F O R M A T I O N
Glossary
A N N U A L R E P O R T 2 0 1 5 – B R E N N T A G A G2 5 2

institutional investor | Institutional investors include
banks, insurers and asset management companies but
also companies investing their retirement contributions in
securities.
interest hedging | Hedging against interest rate varia-
tions that occur with variable interest-rate loans. Instru-
ments used can be ➔ interest-rate swaps or ➔ caps, for
example.
interest-rate swap | Financial transaction with a counter-
party (generally a bank) concluded in respect of an existing
variable interest-rate loan to fix the total interest cost at a
previously defined level.
investment property | Land, buildings or parts of build-
ings held to earn rentals or for capital appreciation or both.
investor relations | Department in charge of communi-
cation with shareholders, investors, analysts and financial
media. The objective is to provide information that is neces-
sary to evaluate the development of the company.
isin number | The International Securities Identification
Number (ISIN) serves to clearly identify securities on a
worldwide basis and has in the meantime replaced the
national securities identification number (WKN).
iso | The International Organisation for Standardisation, or
ISO for short, is the international association of national
standardisation organisations and prepares standards with
international validity. The ISO 9001 standard lays down
internationally accepted requirements for quality manage-
ment systems as regards the quality of production, services
and development.
J
just-in-time delivery | With just-in-time deliveries, the
customer does not store supplies but orders the products as
required (“just in time”) from the supplier.
L
leverage | This term has various meanings in the world of
finance. In this document, it refers to the ratio of net debt to ➔ EBITDA.
libor | This is the abbreviation for London Interbank
Offered Rate and is the reference interest rate on the inter-
bank money market. It serves as a reference interest rate for
loans. To calculate it, London banks state at what interest
rates they are lending to other banks and what interest rates
they are being offered.
ltir | LTIR stands for Lost Time Injury Rate. This perfor-
mance indicator gives the number of industrial accidents per
hours worked. The LTIR1d (1 day / 1 million) published in the
Annual Report gives the number of industrial accidents
resulting in at least one day’s absence from work per one
million working hours.
M
market capitalization | Market capitalization indicates
the value of the equity of a listed stock corporation on the
market. It is calculated by multiplying the number of shares
issued by the current share price.
mdax | The MDAX® stock index calculated by the German
Stock Exchange covers 50 medium-sized companies from the
classic industries that follow the 30 DAX® values.
mixing & blending | The term “mixing & blending”
describes the mixing and formulation of solid and liquid
chemicals in the correct mixing ratio with constant quality
as well as the filling of products in the desired packaging
unit. Brenntag offers its customers not just distribution ser-
vices but the complete mixing & blending of end products at
our distribution centres as a value-added service.
moody’s | International rating agency ➔ rating.
msci | MSCI provides various services for institutional inves-
tors and has been calculating a number of indices since 1968.
F U R T H E R I N F O R M A T I O N
Glossary
A N N U A L R E P O R T 2 0 1 5 – B R E N N T A G A G 2 5 3D
fu
rt
he
r
in
fo
rm
at
io
n

multi-period excess earnings method | Method for
measuring intangible assets. The present value is based on
the cash flows generated solely by the intangible asset to be
measured. At Brenntag, the multi-period excess earnings
method is used to measure acquired customer relationships
and similar rights.
N
net debt | This is essentially financial liabilities (debt) less
the existing liquidity, although both terms can be defined
differently in various (loan) agreements.
net financial liabilities | Part of total financial liabilities
not covered by cash and cash equivalents (also see the Notes
to the consolidated financial statements, Note 24).
net investment hedge | A net investment hedge uses
derivative or non-derivative ➔ financial instruments to hedge
exchange rate-related fluctuations in the net assets of foreign
business operations by recognizing the effective portion of
the exchange rate-related fluctuations of the hedging instru-
ments within equity in the net investment hedge reserve
and thus compensating the exchange rate-related fluctua-
tions in the net assets of the foreign business operations.
no-par-value share | No-par-value shares have no nomi-
nal value. All issued no-par-value shares must represent the
same portion of the share capital of a publicly listed company.
O
one-stop shop | One-stop shop means that our customers
can obtain a comprehensive range of speciality and indus-
trial chemicals and services from a single source.
operating gross profit | Operating gross profit is defined
as sales less costs of materials. For Brenntag as a chemicals
distributor, operating gross profit is a key performance
indicator for the management at Group and segment level.
operating lease | Agreement to convey the right to use
an asset in return for a single or series of payment(s) not to
be classified as ➔ finance lease. There is no asset or liability
to be recognized by the lessee. The periodic payments are
operating expenses in the lessee’s accounts.
option (shares) | Right for a certain period of time to buy
(call) or sell (put) ➔ shares of the issuer at a strike price.
ordinary share | ➔ Share carrying all standard rights,
especially voting rights.
outsourcing | Outsourcing at Brenntag is understood to
mean that chemicals manufacturers pass on their small and
medium-sized customers to Brenntag so that in future they
obtain their chemicals from Brenntag.
P
packaging | Packaging refers to packing or packing material.
packing drum | A packing drum is a packing unit in which
a product is sold and delivered. Typical packing drum sizes
are e.g. cans, barrels or IBCs (➔ IBC).
payout ratio | The payout ratio indicates the percentage
of the profit after tax distributed to the shareholders as a ➔ dividend.
plan assets | Plan assets are assets which are available to
be used only to pay or fund employee benefits and are not
– even in bankruptcy – available to the entity’s own credi-
tors. The assets classified as plan assets are netted against
the pension obligations.
prime standard | The Prime Standard is an EU-regulated
segment and the listing segment for companies that target
not only German investors, but also international investors.
In addition to the requirements for admission to the General
Standard, which imposes the statutory requirements of the
regulated market, admission to Prime Standard requires the
fulfilment of further transparency criteria. Being listed in
Prime Standard is a prerequisite for a company to be included
in the selection indices (DAX, MDAX, SDAX, TecDAX) of FWB
Frankfurter Wertpapierbörse (the Frankfurt Stock Exchange).
F U R T H E R I N F O R M A T I O N
Glossary
A N N U A L R E P O R T 2 0 1 5 – B R E N N T A G A G2 5 4
R
rating | The assessment and valuation of the financial sol-
vency of a debtor or certain financing instruments of a
debtor by external, neutral rating agencies. In this document
they are the international rating agencies Standard & Poor’s
and Moody’s.
reach | REACH (Registration, Evaluation, Authorisation of
Chemicals) is a regulation of the European Union, adopted
to improve the protection of human health and the environ-
ment from the risks that can be posed by chemicals.
receivables loan agreement | Financing instrument
that secures the lender by transferring trade receivables.
recycling | Recycling is generally understood as the re-use
or reprocessing of products no longer required.
registered share | A type of stock – which, contrary to a ➔ bearer share is registered in the name of the owner, who
is also recorded in the share register of the company. The
share register enables the company to gain a better under-
standing of its shareholder structure.
regulated market | The regulated market is a market
segment with strict entry requirements and follow-up
requirements. The regulated market is an organized market
in accordance with Section 2, para. 5 of the Securities Trad-
ing Act. This means that the admission and follow-up
requirements for the participants and the organization of
trading are legally regulated. In addition to the admission
requirements, issuers on the Frankfurt Stock Exchange opt
for a transparency standard. Issuers in the regulated market
can choose either the general or the prime standard. Issuers
in the open market choose the entry standard. This choice
determines the follow-up requirements.
relief-from-royalty method | Valuation method for
intangible assets, in particular ➔ trademarks. The value is
determined by estimating the fictitious licence fees which
would hypothetically have to be paid to a licensor. The value
is the discounted amount of licence fees saved in the future.
These licence fees are calculated as a percentage of a reference
parameter (usually sales) in line with the industry standard.
responsible care / responsible distribution | Respon-
sible Care / Responsible Distribution (RC / RD) is a global ini-
tiative of the chemical industry and chemicals traders. It is a
voluntary commitment to act responsibly and do more than
is required by law: to promote sustainability, demonstrate
product stewardship, make plants and the surrounding areas
safer as well as improve occupational health and safety and
environmental protection.
retained earnings | Part of equity that mainly comprises
non-distributed profit and, for the IFRS consolidated financial
statements, other comprehensive income (OCI).
return on capital | This performance indicator shows a
profit in the income statement as a proportion of the capital
employed, in other words the interest earned on the capital
employed. In the Brenntag Group, we measure the return on
capital using the metric ➔ RONA (Return on Net Assets).
road show | Presentation of a company to shareholders
and potential investors in various financial centres. The road
show is an important investor relations measure to stimulate
interest in the company and help market the share.
roce | Return on Capital Employed (ROCE) is defined as ➔ EBITA divided by the average carrying amount of equity +
the average carrying amount of financial liabilities less the
average carrying amount of cash and cash equivalents. The
average carrying amounts in the denominator are defined
for a particular year as the arithmetic average of the amounts
at each of the following five times: the beginning of the
year, the end of each of the first, second and third quarters,
and the end of the year. At Brenntag, ROCE is used for the
measurement of the ➔ return on capital.
rona | Return on Net Assets (RONA) is defined as ➔ EBITA
divided by the total of average property, plant and equipment
and average ➔ working capital. At Brenntag, RONA is used
for the measurement of the ➔ return on capital.
F U R T H E R I N F O R M A T I O N
Glossary
A N N U A L R E P O R T 2 0 1 5 – B R E N N T A G A G 2 5 5D
fu
rt
he
r
in
fo
rm
at
io
n

S
segment | Component of an entity which is reported sepa-
rately. In general, the definition is based on the internal
reporting (management approach). The Brenntag Group is
managed by geographically structured segments.
share | Security representing a part of a company’s overall
share capital. Owning a share entitles the shareholder,
among others, to participate in General Shareholders’ Meet-
ings, to vote at General Shareholders’ Meetings and to
receive ➔ dividends.
share register | Companies, which – like Brenntag AG,
have issued ➔ registered shares, maintain a share register, in
which the name, date of birth and address of the share-
holder and the number of shares held are kept (Section 67
of the Stock Corporation Act (Aktiengesetz)).
share split | A share split is an action in which a company
divides its existing shares into multiple shares. The primary
motive is to make shares more affordable and improve the
marketability of its shares. Although the number of shares
outstanding increases by a specific multiple, the total value
of the shares remains the same compared to pre-split
amounts. The proportion that each individual shareholder
holds in the company is unchanged. The shareholder holds
a greater number of shares than before the split as the com-
pany’s assets are distributed over more shares than before.
single-entity financial statements | Single-entity
financial statements are the annual financial statements of a
separate company. In Germany, they must be prepared in
accordance with the statutory provisions of the German
Commercial Code (HGB) and generally accepted accounting
principles (“GoB”). They are the basis for determining the
distribution of ➔ dividends and also taxation.
sourcing activities | Brenntag has extensive experience
and know-how in managing efficient sourcing relationships
with national and international suppliers of chemical products.
specialty chemicals | Speciality chemicals which are often
developed for customized applications are distinguished
from ➔ industrial chemicals by their individual formulations.
Which manufacturer produces the speciality chemical is of
prime importance for the user.
standard & poor’s | International rating agency ➔ rating
subscribed capital | The subscribed capital of a stock
corporation is the share capital which is laid down in the
Articles of Association.
supervisory board | Mandatory control body of a stock
corporation, regulated in the German Stock Corporation Act.
The members of the Supervisory Board are in general
elected by the General Shareholders’ Meeting. The most
important functions of the Supervisory Board are the
appointment and removal of the Board of Management as
well as the monitoring of its management and the approval
of the annual financial statements.
supply chain management | Brenntag provides large
chemical producers and the processing industry with effi-
cient logistic networks. We provide transport, warehousing
and distribution and assist production and marketing
processes. We warrant highest efficiency and best safety
standards. We optimize supply chains, synchronize distribu-
tion, take on monitoring tasks and assume responsibility for
VMI (Vendor Managed Inventory) stocks, and control and
scheduling of follow-up orders for goods.
swap contracts | Financial transaction with a counterparty
(generally a bank) to hedge financial risks (such as interest
rate and currency risks) arising in the course of business.
syndicated facilities agreement | Loan in which at
least two lenders grant a loan to one (or more) borrower(s)
on uniform terms and conditions.
syndicated loan | Loan in which at least two lenders
grant a loan to one (or more) borrower(s) on uniform terms
and conditions.
F U R T H E R I N F O R M A T I O N
Glossary
A N N U A L R E P O R T 2 0 1 5 – B R E N N T A G A G2 5 6

T
trademark | A trademark generally refers to a brand
name and at Brenntag includes both the name and the blue-
red logo.
trading symbol | A three-digit combination of letters
and possibly numbers. The trading symbol is allocated by
WM Datenservice, the body responsible for issuing the
WKN and ISIN in Germany. Any share can be unambiguously
identified from both trading symbol and also the WKN
(German securities ID number) or ISIN (International Securi-
ties Identification Number).
V
voting right | The shareholder is entitled to vote on res-
olutions that are proposed at the ➔ General Shareholders’
Meeting of the company he or she is a shareholder of.
The weight of his or her vote depends on the amount of ➔ shares held
W
wacc | The WACC (Weighted Average Cost of Capital) is a
company-specific capital cost rate and is calculated as the
weighted average of cost of equity and borrowing costs.
working capital | Brenntag defines working capital as
trade receivables plus inventories less trade payables. Work-
ing capital is an indicator for funds tied up in the operating
business activities that are available in the short term.
working capital turnover, annualised | Working
capital turnover is defined as sales divided by average ➔ working capital. Average working capital is defined for a
particular year as the average of the values for working capi-
tal at each of the following five times: the beginning of the
year, the end of each of the first, second and third quarters,
and the end of the year.
X
xetra | The term Xetra® stands for the electronic stock
exchange trading system of Deutsche Börse AG (Exchange
Electronic Trading System).
F U R T H E R I N F O R M A T I O N
Glossary
A N N U A L R E P O R T 2 0 1 5 – B R E N N T A G A G 2 5 7D
fu
rt
he
r
in
fo
rm
at
io
n

TABLE DIRECTORY
F U R T H E R I N F O R M A T I O N
Table Directory
A N N U A L R E P O R T 2 0 1 5 – B R E N N T A G A G2 5 8
a to our shareholders a.01 Development of the Brenntag Share Price (Indexed) 36a.02 Shareholder Structure 37a.03 Key Figures and Master Data on the Brenntag Share 38a.04 Analysts’ Opinions 38a.05 Key Figures and Master Data on the Bonds
of the Brenntag Group 39a.06 Dividend Payment 41
b management report
b.01 Global Network of the Brenntag Group 71b.02 Business Performance of the Brenntag Group 82b.03 Return on Net Assets (rona) 84b.04 Business Performance in the Segments 85b.05 Business Performance in the Segments / EMEA 85b.06 Business Performance in the Segments / North America 86b.07 Business Performance in the Segments / Latin America 87b.08 Business Performance in the Segments / Asia Pacific 88b.09 Business Performance in the Segments / All Other Segments 89b.10 Maturity Profile of our Credit Portfolio 91b.11 Cash Flow 93b.12 Free Cash Flow 94b.13 Financial and Assets Position 95b.14 Income Statement of Brenntag AG in Accordance with the
German Commercial Code (hgb) 97b.15 Brenntag AG / Balance Sheet in Accordance with the
German Commercial Code (hgb) – Condensed Version 98b.16 Virtual Shares 103b.17 Total Remuneration of the Board of Management in
Accordance with the German Commercial Code (hgb) 104b.18 Pension Commitments (Defined Benefit Plans) in
Accordance with the German Commercial Code (hgb) 104b.19 Board of Management Remuneration in Accordance
with IFRSs 106b.20 Board of Management Benefits Granted 110b.21 Board of Management Allocation 110b.22 Total Remuneration of the Supervisory Board 113b.23 Employees per Segment 114b.24 Employees per Area of Work 114b.25 Risk Assessment Matrix 123
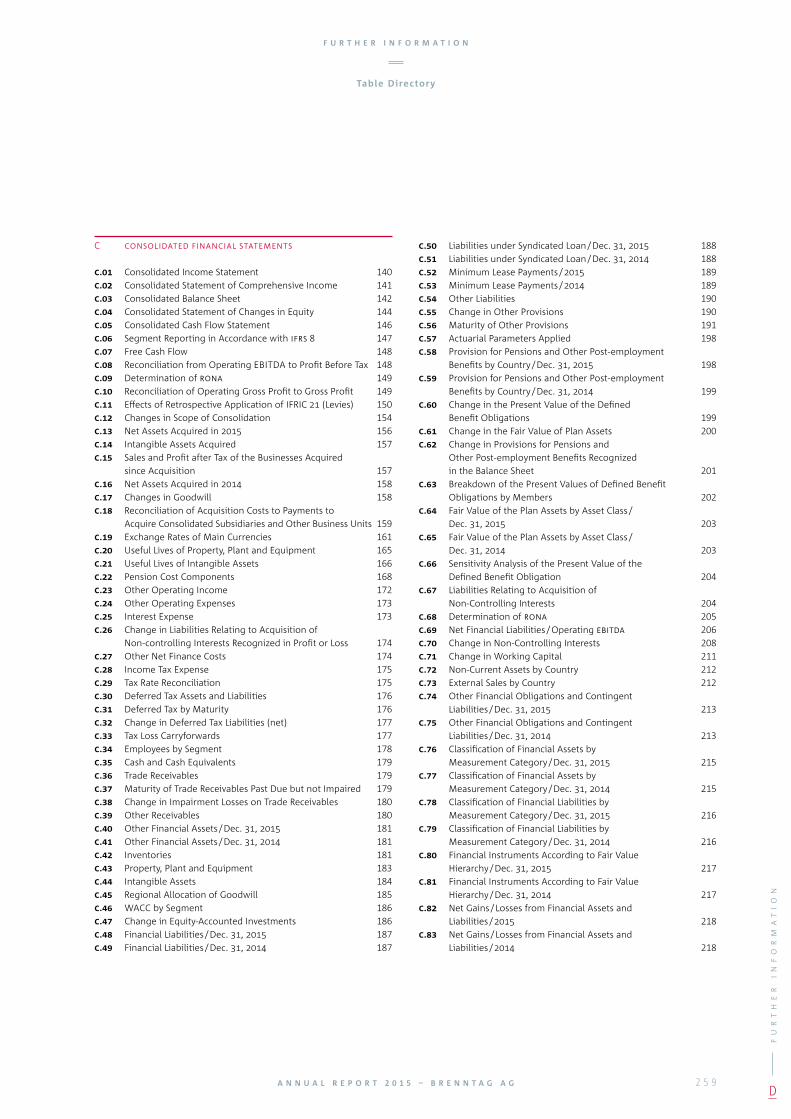
F U R T H E R I N F O R M A T I O N
Table Directory
A N N U A L R E P O R T 2 0 1 5 – B R E N N T A G A G 2 5 9
C consolidated financial statements
c.01 Consolidated Income Statement 140c.02 Consolidated Statement of Comprehensive Income 141c.03 Consolidated Balance Sheet 142c.04 Consolidated Statement of Changes in Equity 144c.05 Consolidated Cash Flow Statement 146c.06 Segment Reporting in Accordance with ifrs 8 147c.07 Free Cash Flow 148c.08 Reconciliation from Operating EBITDA to Profit Before Tax 148c.09 Determination of rona 149c.10 Reconciliation of Operating Gross Profit to Gross Profit 149c.11 Effects of Retrospective Application of IFRIC 21 (Levies) 150c.12 Changes in Scope of Consolidation 154c.13 Net Assets Acquired in 2015 156c.14 Intangible Assets Acquired 157c.15 Sales and Profit after Tax of the Businesses Acquired
since Acquisition 157c.16 Net Assets Acquired in 2014 158c.17 Changes in Goodwill 158c.18 Reconciliation of Acquisition Costs to Payments to
Acquire Consolidated Subsidiaries and Other Business Units 159c.19 Exchange Rates of Main Currencies 161c.20 Useful Lives of Property, Plant and Equipment 165c.21 Useful Lives of Intangible Assets 166c.22 Pension Cost Components 168c.23 Other Operating Income 172c.24 Other Operating Expenses 173c.25 Interest Expense 173c.26 Change in Liabilities Relating to Acquisition of
Non-controlling Interests Recognized in Profit or Loss 174c.27 Other Net Finance Costs 174c.28 Income Tax Expense 175c.29 Tax Rate Reconciliation 175c.30 Deferred Tax Assets and Liabilities 176c.31 Deferred Tax by Maturity 176c.32 Change in Deferred Tax Liabilities (net) 177c.33 Tax Loss Carryforwards 177c.34 Employees by Segment 178c.35 Cash and Cash Equivalents 179c.36 Trade Receivables 179c.37 Maturity of Trade Receivables Past Due but not Impaired 179c.38 Change in Impairment Losses on Trade Receivables 180c.39 Other Receivables 180c.40 Other Financial Assets / Dec. 31, 2015 181c.41 Other Financial Assets / Dec. 31, 2014 181c.42 Inventories 181c.43 Property, Plant and Equipment 183c.44 Intangible Assets 184c.45 Regional Allocation of Goodwill 185c.46 WACC by Segment 186c.47 Change in Equity-Accounted Investments 186c.48 Financial Liabilities / Dec. 31, 2015 187c.49 Financial Liabilities / Dec. 31, 2014 187
c.50 Liabilities under Syndicated Loan / Dec. 31, 2015 188c.51 Liabilities under Syndicated Loan / Dec. 31, 2014 188c.52 Minimum Lease Payments / 2015 189c.53 Minimum Lease Payments / 2014 189c.54 Other Liabilities 190c.55 Change in Other Provisions 190c.56 Maturity of Other Provisions 191c.57 Actuarial Parameters Applied 198c.58 Provision for Pensions and Other Post-employment
Benefits by Country / Dec. 31, 2015 198c.59 Provision for Pensions and Other Post-employment
Benefits by Country / Dec. 31, 2014 199c.60 Change in the Present Value of the Defined
Benefit Obligations 199c.61 Change in the Fair Value of Plan Assets 200c.62 Change in Provisions for Pensions and
Other Post-employment Benefits Recognized in the Balance Sheet 201
c.63 Breakdown of the Present Values of Defined Benefit Obligations by Members 202
c.64 Fair Value of the Plan Assets by Asset Class / Dec. 31, 2015 203
c.65 Fair Value of the Plan Assets by Asset Class / Dec. 31, 2014 203
c.66 Sensitivity Analysis of the Present Value of the Defined Benefit Obligation 204
c.67 Liabilities Relating to Acquisition of Non-Controlling Interests 204
c.68 Determination of rona 205c.69 Net Financial Liabilities / Operating ebitda 206c.70 Change in Non-Controlling Interests 208c.71 Change in Working Capital 211c.72 Non-Current Assets by Country 212c.73 External Sales by Country 212c.74 Other Financial Obligations and Contingent
Liabilities / Dec. 31, 2015 213c.75 Other Financial Obligations and Contingent
Liabilities / Dec. 31, 2014 213c.76 Classification of Financial Assets by
Measurement Category / Dec. 31, 2015 215c.77 Classification of Financial Assets by
Measurement Category / Dec. 31, 2014 215c.78 Classification of Financial Liabilities by
Measurement Category / Dec. 31, 2015 216c.79 Classification of Financial Liabilities by
Measurement Category / Dec. 31, 2014 216c.80 Financial Instruments According to Fair Value
Hierarchy / Dec. 31, 2015 217c.81 Financial Instruments According to Fair Value
Hierarchy / Dec. 31, 2014 217c.82 Net Gains / Losses from Financial Assets and
Liabilities / 2015 218c.83 Net Gains / Losses from Financial Assets and
Liabilities / 2014 218
D
fu
rt
he
r
in
fo
rm
at
io
n

F U R T H E R I N F O R M A T I O N
Table Directory
A N N U A L R E P O R T 2 0 1 5 – B R E N N T A G A G2 6 0
c.84 Offsetting of Financial Assets and Liabilities / Dec. 31, 2015 219c.85 Offsetting of Financial Assets and Liabilities / Dec. 31, 2014 219c.86 Change in Net Investment Hedge Reserve 220c.87 Sensitivity Analysis Currency Risk 221c.88 Change in Cash Flow Hedge Reserve 221c.89 Future Cash Flows from Financial Liabilities / Dec. 31, 2015 222c.90 Future Cash Flows from Financial Liabilities / Dec. 31, 2014 223c.91 Derivative Financial Instruments 223c.92 Transactions with Related Parties 225c.93 Receivables from and Payables to Related Parties 225c.94 Audit Fees for the Auditors of the Consolidated
Financial Statements 225
d further information
d.01 Business Performance of the Brenntag Group / 2015 242d.02 Business Performance of the Brenntag Group / Q4 2015 242d.03 Business Performance in the Segments / 2015 243d.04 Business Performance in the Segments / Q4 2015 243d.05 Business Performance in the Segments / EMEA 2015 243d.06 Business Performance in the Segments / EMEA Q4 2015 243d.07 Business Performance in the Segments / North America 2015 244d.08 Business Performance in the Segments / North America Q4 2015 244d.09 Business Performance in the Segments / Latin America 2015 244d.10 Business Performance in the Segments / Latin America Q4 2015 244d.11 Business Performance in the Segments / Asia Pacific 2015 245d.12 Business Performance in the Segments / Asia Pacific Q4 2015 245d.13 Business Performance in the Segments / All Other
Segments 2015 245d.14 Business Performance in the Segments / All Other
Segments Q4 2015 245d.15 Segment Reporting in Accordance with IFRS 8 / 2015 246d.16 Segment Reporting in Accordance with IFRS 8 / Q4 2015 247d.17 Consolidated Income Statement 261d.18 Consolidated Balance Sheet 261d.19 Consolidated Cash Flow 261d.20 Key Figures Brenntag Share 261

FIVEYEAR OVERVIEW
consolidated income statement
2015 2014 2013 2012 2011
Sales EUR m 10,346.1 10,015.6 9,769.5 9,689.9 8,679.3
Gross profit EUR m 2,266.0 2,027.5 1,945.5 1,925.7 1,768.0
Operating EBITDA EUR m 807.4 726.7 698.3 707.0 660.9
Operating EBITDA/Gross profit % 35.6 35.8 35.9 36.7 37.4
EBITDA EUR m 807.4 726.9 696.8 707.0 658.8
Profit after tax EUR m 368.1 339.7 338.9 337.8 279.3
Earnings per share EUR 2.36 2.20 2.20 2.17 1.80
d.17 consolidated income statement
consolidated balance sheet
Dec. 31, 2015 Dec. 31, 2014 Dec. 31, 2013 Dec 31, 2012 Dec 31, 2011
Total assets EUR m 6,976.2 6,215.0 5,627.3 5,708.1 5,570.9
Equity EUR m 2,690.5 2,356.9 2,093.7 1,944.2 1,737.6
Working capital EUR m 1,268.1 1,226.8 1,044.4 1,018.6 961.1
Net financial liabilities EUR m 1,676.1 1,409.7 1,341.7 1,482.9 1,493.6
d.18 consolidated balance sheet
consolidated cash flow
2015 2014 2013 2012 2011
Cash provided by operating activities EUR m 593.7 369.7 357.8 433.0 349.6
Investments in non-current assets (Capex) EUR m – 130.1 – 104.8 – 97.2 – 94.7 – 86.0
Free cash flow EUR m 764.3 521.6 543.4 579.3 511.8
d.19 consolidated cash flow
key figures brenntag share
Dec. 31, 2015 Dec. 31, 2014 Dec. 31, 2013 Dec 31, 2012 Dec 31, 2011
Share price EUR 48.28 46.51 44.92 33.14 23.98
No. of shares (unweighted) 154,500,000 154,500,000 154,500,000 154,500,000 154,500,000
Market capitalization EUR m 7,459 7,186 6,939 5,121 3,705
Free float % 100.00 100.00 100.00 100.00 63.98
d.20 key figures brenntag share
F U R T H E R I N F O R M A T I O N
Five-Year Overview
A N N U A L R E P O R T 2 0 1 5 – B R E N N T A G A G 2 6 1D
fu
rt
he
r
in
fo
rm
at
io
n

IMPRINT AND CONTACT
F U R T H E R I N F O R M A T I O N
Impr int and Contact
A N N U A L R E P O R T 2 0 1 5 – B R E N N T A G A G2 6 2
Issuer
Brenntag AG
Stinnes-Platz 1
45472 Mülheim an der Ruhr, Germany
Phone: + 49 (0) 208 7828 0
Fax: + 49 (0) 208 7828 698
E-mail: [email protected]
Internet: www.brenntag.com
Contact
Brenntag AG
Corporate Finance & Investor Relations
Thomas Langer, Diana Alester, René Weinberg
Phone: +49 (0) 208 7828 7653
Fax: +49 (0) 208 7828 7755
E-mail: [email protected]
Concept and text
Brenntag AG
Corporate Finance & Investor Relations
Design
MPM Corporate Communication Solutions
Untere Zahlbacher Straße 13
55131 Mainz, Germany
Phone: + 49 (0) 61 31 95 69 0
Fax: + 49 (0) 61 31 95 69 112
E-mail: [email protected]
Internet: www.mpm.de
Woeste Druck + Verlag GmbH & Co. KG, Essen
Information on the Annual ReportThis translation is only a convenience translation. In case of any differences only the German version is binding.
Information on rounding Due to commercial rounding, minor differences may occur when using rounded amounts or rounded percentages.
DisclaimerThis report may contain forward-looking statements based on current assumptions and forecasts made by Brenntag AG and other information currently available to the company. Various known and unknown risks, uncertainties and other factors could lead to material differences between the actual future results, financial situation, development or perfor-mance of the company and the estimates given here. Brenntag AG does not intend, and does not assume any liability whatsoever, to update these forward-looking statements or to conform them to future events or developments.
Print compensatedId-No. 1327318
www.bvdm-online.de

2016
Deutsche Bank German / Austrian
Corporate Conference
[ B E R L I N ]
2016
General Shareholders’
Meeting
[ D Ü S S E L D O R F ]
2016
Interim ReportQ2 2016
2016
Mainfirst Corporate Conference
[ C O P E N H A G E N ]
2016
Interim ReportQ1 2016
2016
JP Morgan Business Services Conference
[ L O N D O N ]
2016
Interim ReportQ3 2016
F I N A N C I A L C A L E N D A R
2 0 1 6

Brenntag AG Corporate Finance & Investor Relations Stinnes-Platz 1 45472 Mülheim an der Ruhr Germany
Phone: + 49 (0) 208 7828 7653 Fax: + 49 (0) 208 7828 7755 E-mail: [email protected]