Embed Size (px)
Citation preview

GLOBAL M&A MARKET REVIEW FINANCIAL RANKINGS
1H 2015

CONTENTS
1. Introduction2. Global M&A Heat Map3. Global M&A Regional Review4. Global M&A League Tables5. Americas M&A Regional Review6. Americas M&A League Tables8. EMEA M&A Regional Review9. EMEA M&A League Tables
12. APAC M&A Regional Review13. APAC M&A League Tables16. Disclaimer
DATA SUBMISSIONS AND QUERIES
Contact Phone Email North America Rachel Campanelli +1-646-324-4657 [email protected]
EMEA Paula Cook Dinan +44-20-3525-8104 [email protected]
Asia Pacific Parker Leung +852-2977-6108 [email protected]
General M&A queries may be submitted to: [email protected], [email protected], [email protected]
The Bloomberg M&A Advisory League Tables are the definitive publication of M&A advisory rankings. The tables represent the top financial and legal advisors across a broad array of deal types, regions, and industry sectors. The rankings data is comprised of mergers, acquisitions, divestitures, spin-offs, debt-for-equity-swaps, joint ventures, private placements of common equity and convertible securities, and the cash injection component of recapitalization according to Bloomberg standards.
Bloomberg M&A delivers real-time coverage of the M&A market from nine countries around the world. We provide a global perspective and local insight into unique deal structures in various markets through a network of over 800 financial and legal advisory firms, ensuring an accurate reflection of key market trends. Our quarterly league table rankings are a leading benchmark for legal and financial advisory performance, and our Bloomberg Brief newsletter provides summary highlights of weekly M&A activity and top deal trends.
Visit {NI LEAG CRL <GO>} to download copies of the final release and a full range of market specific league table results. On the web, visit: http://www.bloomberg.com/professional/solutions/investment-banking/.
Due to the dynamic nature of the Professional Service product, league table rankings may vary between this release and data found on the Bloomberg Professional Service.
1H 2015
GLOBAL M&A FINANCIAL ADVISORY RANKINGS
©2015 Bloomberg Finance L.P. All rights reserved.

Scale in USD Bln. 0 - 23 - 5
6 - 1516 - 3031 - 5051 - 80
81 - 100101 - 300301 - 900
901 -
Glob
al M
&A
Revi
ew |
1H
2015
Deal volume and adviser market share for any regional involvement (target, seller, or acquirer).
North America USD 1.1T 1. JPMorgan Chase & Co 29.4%2. Goldman Sachs & Co 29.3%3. Morgan Stanley 26.9%
Western Europe USD 489.0B 1. Goldman Sachs & Co 38.7%2. Morgan Stanley 35.4% 3. JPMorgan Chase & Co 35.1%
Latin America & Caribbean USD 75.4B 1. Bank of America Merrill Lynch 22.0%2. JPMorgan Chase & Co 17.3% 3. UBS AG 16.5%
Middle East & Africa USD 54.8B 1. Bank of America Merrill Lynch 21.2%2. JPMorgan Chase & Co 17.2% 3. Morgan Stanley 14.4%
Asia Pacific USD 643.6B 1. Goldman Sachs & Co 16.3% 2. Credit Suisse Group AG 14.9% 3. Citigroup Inc 14.2%
Eastern Europe USD 23.7B 1. JPMorgan Chase & Co 17.1%2. Citigroup Inc 7.3% 3. Goldman Sachs & Co 6.8%
Global M&A Heat Map
2
DateTotal Value
(Mln.)Amount
(Bln.) % of Total% YoY
Change
Number of deals 17,708 Consumer, Non-cyclical $382.9 20.8% 7.8%
Volume (Bln.) $1,833 Financial $348.9 19.0% 14.5%
Avg Deal Size (Mln.) $103 Communications $266.2 14.5% -2.8%
Energy $232.1 12.6% 75.1%
Industrial $171.2 9.3% -6.1%
Goldman Sachs & Co Technology $141.1 7.7% 104.7%
Number of deals 174 Consumer, Cyclical $138.1 7.5% 9.5%
Volume (Bln.) $533.8 Diversified $63.7 3.5% 330.5%
Avg Deal Size (Bln.) $3.1 Basic Materials $57.1 3.1% -8.5%
Utilities $36.3 2.0% -38.8%
Amount (Bln.)
% Change Deal Count
% Change Volume
Company Takeover $1,238.5 7.5% 41.8%
Cross Border $700.4 22.2% 10.0%
Private Equity $358.5 20.8% 10.7%
Asset Sale $273.9 4.1% -20.3%
Tender Offer $162.2 -9.0% 29.7%
Venture Capital $52.3 24.8% 49.8%
Spin-off $25.5 24.7% -73.4%
Minority Purchase $170.0 22.0% 32.2%
Majority Purchase $98.6 11.3% -13.8%
Quarterly Volume represents any involvement (target, seller, or acquirer).
Global M&A: Industry Breakdown
Glo
bal M
&A
Revi
ew |
1H
2015
Global M&A Regional Review Global M&A: Premium Breakdown
Global M&A: Highlights of 1H 2015
Summary IndustryAcquirerTarget Seller
BG Group PLC Royal Dutch Shell PLC -
Global M&A: Quarterly Volume
4/8/2015
Top Adviser
$34,869.9Perrigo Co PLC Mylan NV -
- Hutchison Whampoa Ltd
3/25/2015 $55,422.9
1/9/2015 $41,705.3
Kraft Foods Group Inc HJ Heinz Co
4/8/2015 $79,308.5
5/26/2015 $79,249.7Time Warner Cable IncCharter Communications
Inc-
Deal Type
Global M&A: Deal Type Breakdown
CK Hutchison Holdings Ltd
-
0
2,000
4,000
6,000
8,000
10,000
$0
$200
$400
$600
$800
$1,000
$1,200
2010 Q2 2011 Q2 2012 Q2 2013 Q2 2014 Q2 2015 Q2
Volume (Bln.) Deal Count
20%
28% 36%
13%
1% 2% 0-10%
10-25%
25-50%
50-75%
75-100%
100%+
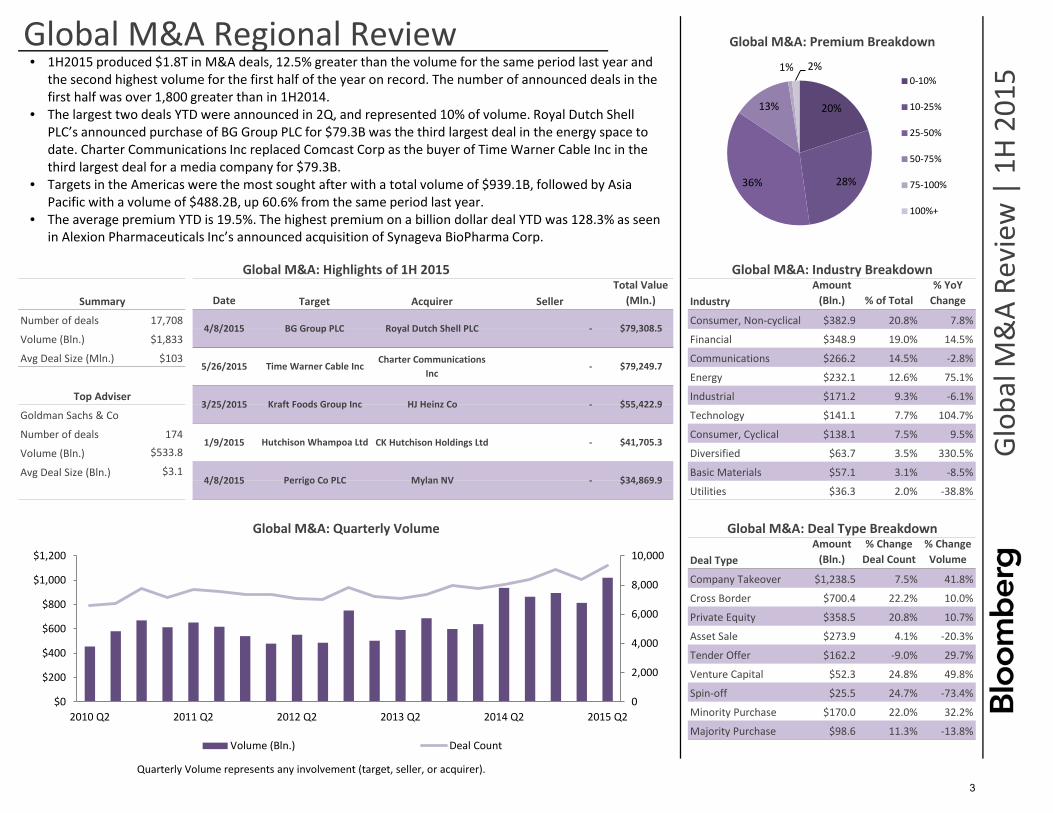
• 1H2015 produced $1.8T in M&A deals, 12.5% greater than the volume for the same period last year andthe second highest volume for the first half of the year on record. The number of announced deals in thefirst half was over 1,800 greater than in 1H2014.
• The largest two deals YTD were announced in 2Q, and represented 10% of volume. Royal Dutch ShellPLC’s announced purchase of BG Group PLC for $79.3B was the third largest deal in the energy space to date. Charter Communications Inc replaced Comcast Corp as the buyer of Time Warner Cable Inc in the third largest deal for a media company for $79.3B.
• Targets in the Americas were the most sought after with a total volume of $939.1B, followed by AsiaPacific with a volume of $488.2B, up 60.6% from the same period last year.
• The average premium YTD is 19.5%. The highest premium on a billion dollar deal YTD was 128.3% as seenin Alexion Pharmaceuticals Inc’s announced acquisition of Synageva BioPharma Corp.
3

Global Announced Deals 01/01/2015 - 06/30/2015 Cross Border Announced Deals 01/01/2015 - 06/30/2015
Goldman Sachs & Co 1 29.13 533,819 174 1 30.8 -1.67 JPMorgan Chase & Co 1 36.9 258,331 83 6 18.57 18.33JPMorgan Chase & Co 2 26.25 480,950 142 6 14.31 11.94 Bank of America Merrill Lynch 2 34.61 242,327 68 3 21.99 12.62Morgan Stanley 3 24.99 457,853 169 3 23.77 1.21 Goldman Sachs & Co 3 30.09 210,681 105 2 30.78 -0.69Bank of America Merrill Lynch 4 23.1 423,284 109 2 25 -1.90 Morgan Stanley 4 25.38 177,719 74 1 33.99 -8.60Citigroup Inc 5 15.58 285,551 107 5 15.27 0.31 Deutsche Bank AG 5 16.55 115,847 50 7 17.76 -1.22Credit Suisse Group AG 6 14.78 270,838 82 7 13.46 1.32 Citigroup Inc 6 15.99 111,978 60 5 21.62 -5.63Lazard Ltd 7 12.4 227,225 109 4 17.1 -4.70 Credit Suisse Group AG 7 15.83 110,816 45 9 17.39 -1.57Centerview Partners LLC 8 11.8 216,295 21 17 4.63 7.17 Simon Robertson Associates LLP 8 11.33 79,308 1 26 2 9.33Barclays PLC 9 9.04 165,663 72 9 10.11 -1.07 Lazard Ltd 9 10.42 72,975 70 4 21.87 -11.45Deutsche Bank AG 10 8.74 160,137 84 8 11 -2.26 Barclays PLC 10 9.85 68,972 37 14 8.18 1.67HSBC Bank PLC 11 5.99 109,839 34 15 4.83 1.16 Rothschild Ltd 11 9.05 63,339 79 8 17.65 -8.60Guggenheim Capital LLC 12 5.82 106,594 10 98 0.13 5.69 UBS AG 12 8.07 56,530 35 15 7.68 0.39LionTree Advisors LLC 13 5.12 93,845 6 106 0.11 5.01 Evercore Partners Inc 13 6.35 44,439 25 27 2 4.35Evercore Partners Inc 14 4.99 91,344 58 18 2.79 2.19 HSBC Bank PLC 14 6.23 43,610 29 10 11.18 -4.95Allen & Co Inc 15 4.89 89,684 7 36 1.21 3.68 Moelis & Co 15 4.9 34,294 24 54 0.46 4.44Rothschild Ltd 16 4.64 85,036 121 10 8.73 -4.09 BNP Paribas SA 16 3.34 23,412 24 12 9.84 -6.49UBS AG 17 4.54 83,119 54 11 6.09 -1.56 RBC Capital Markets 17 3.28 22,947 18 21 3.27 0.01Simon Robertson Associates LLP 18 4.33 79,308 1 45 0.81 3.52 Macquarie Group Ltd 18 3.22 22,535 19 19 3.83 -0.61Somerley Group Ltd 19 4.19 76,836 31 29 1.51 2.68 Mizuho Financial Group Inc 19 3.13 21,882 13 130 0.04 3.09Macquarie Group Ltd 20 3.15 57,656 45 22 2.05 1.10 Somerley Group Ltd 20 2.91 20,402 18 41 1.03 1.88
TOTAL 1,832,364 17,709 TOTAL 700,157 6,489
Global Private Equity Announced Deals 01/01/2015 - 06/30/2015
JPMorgan Chase & Co 1 20.78 76,304 43 4 19.39 1.38Morgan Stanley 2 18.07 66,354 56 2 28.74 -10.67Bank of America Merrill Lynch 3 17.38 63,840 34 3 21.35 -3.97Goldman Sachs & Co 4 16.48 60,532 55 1 30.32 -13.83Deutsche Bank AG 5 14.01 51,449 32 5 17.52 -3.51Citigroup Inc 6 11.71 43,005 27 6 15.13 -3.42Credit Suisse Group AG 7 9.41 34,541 27 8 13.91 -4.50Wells Fargo & Co 8 8.61 31,618 14 23 3.18 5.43Centerview Partners LLC 9 8.56 31,450 8 46 0.53 8.03Barclays PLC 10 8.5 31,212 31 9 13.86 -5.36Macquarie Group Ltd 11 6.96 25,576 14 20 3.41 3.55Kimberlite Group LLC 12 6.24 22,912 5 - - 6.24Moelis & Co 13 5.18 19,015 18 26 2.78 2.40Houlihan Lokey Inc 14 4.73 17,385 21 31 1.46 3.27Lazard Ltd 15 4.51 16,546 46 10 9.13 -4.63RBC Capital Markets 16 4.4 16,152 15 12 6.13 -1.73Rothschild Ltd 17 4.17 15,312 50 14 5.67 -1.50UBS AG 18 4.1 15,065 17 7 14.03 -9.93PricewaterhouseCoopers LLP 19 3.71 13,631 59 33 1.25 2.46HSBC Bank PLC 20 3.28 12,048 14 29 1.75 1.53
TOTAL 367,227 4,852 324,191
2014MKT SHR CHANGERANK
MKT SHR (%)
VOLUME USD (Mln)
DEAL COUNT RANK
MKT SHR (%) RANK
2015 2014MKT SHR CHANGE FIRM
2015MKT SHR
(%)VOLUME USD
(Mln)DEAL
COUNT RANKMKT SHR
(%)
FIRM
2015 2014MKT SHR CHANGE
FIRM
RANKMKT SHR
(%)VOLUME USD
(Mln)DEAL
COUNT RANKMKT SHR
(%)
1,577,330 636,865
4

Country
United States $864.8 92.1% 12.2%
Canada $35.1 3.7% -43.7%
Brazil $15.3 1.6% -49.1%
British Virgin Islands $7.7 0.8% 139.4%
Mexico $7.3 0.8% -34.6%
Colombia $6.1 0.6% 75.3%
Bermuda $5.6 0.6% 50.5%
Chile $3.4 0.4% -59.7%
DateTotal Value
(Mln.)Amount
(Bln.) % of Total% YoY
Change
Number of deals 8,107 Consumer, Non-cyclical $283.1 30.2% 16.7%
Volume (Bln.) $939.1 Financial $161.1 17.2% 28.9%
Avg Deal Size (Mln.) $115.8 Communications $153.6 16.4% -10.7%
Technology $99.0 10.6% 96.7%
Energy $96.4 10.3% 9.9%
JPMorgan Chase & Co Industrial $60.5 6.5% 18.9%
Number of deals 78 Consumer, Cyclical $49.6 5.3% -9.1%
Volume (Bln.) $298.0 Basic Materials $20.9 2.2% -42.4%
Avg Deal Size (Bln.) $3.8 Utilities $11.4 1.2% -71.1%
Diversified $1.3 0.1% -80.0%
Amount (Bln.)
% Change Deal Count
% Change Volume
Company Takeover $687.2 3.1% 38.0%
Cross Border $212.5 21.8% 1.3%
Private Equity $200.2 17.9% 3.4%
Asset Sale $159.2 -8.4% -17.3%
Tender Offer $107.6 25.0% 172.1%
Venture Capital $33.1 15.3% 31.6%
Spin-off $2.8 7.3% -96.9%
Minority Purchase $67.4 15.6% 34.1%
Majority Purchase $14.4 24.5% -43.7%
Quarterly Volume represents any involvement (target, seller, or acquirer).
Americas M&A: Quarterly Volume Americas M&A: Deal Type Breakdown
Deal Type
3/4/2015 Pharmacyclics Inc AbbVie Inc - $19,776.9
5/28/2015 Broadcom Corp Avago Technologies Ltd - $29,805.9
Amount (Bln.) % of Total
% YoY Change
Top Adviser4/8/2015 Perrigo Co PLC Mylan NV - $34,869.9
3/25/2015 Kraft Foods Group Inc HJ Heinz Co - $55,422.9
Glob
al M
&A
Revi
ew |
1H
2015
5/26/2015 Time Warner Cable IncCharter Communications
Inc- $79,249.7
Americas M&A Regional Review Americas M&A: Country Breakdown
Americas M&A: Highlights of 1H 2015
Summary Target Acquirer Seller Industry
Americas M&A: Industry Breakdown
0
1,000
2,000
3,000
4,000
5,000
6,000
$0
$100
$200
$300
$400
$500
$600
$700
2010 Q2 2011 Q2 2012 Q2 2013 Q2 2014 Q2 2015 Q2
Volume (Bln.) Deal Count
• The US continues to drive M&A activity in the Americas, with an increase of 12.2% in volume from1H2014.
• Dealmaking in Brazil fell close to 50%, impacted by a devaluation of currency and an overall economicslowdown in the country.
• The consumer, non-cyclical industry was the most targeted in 1H2015 with the largest deal volume aswell as the highest deal count at a total of $283.1B and 1,923 deals. This was driven by thepharmaceutical and food sub-sectors.
• For the second year in a row, telecommunications had the largest deal in the first half with CharterCommunications Inc announcing its acquisition of Time Warner Cable Inc. However, volume in thetelecommunications sub-sector as a whole is down 57.7% compared to the same period last year.
5
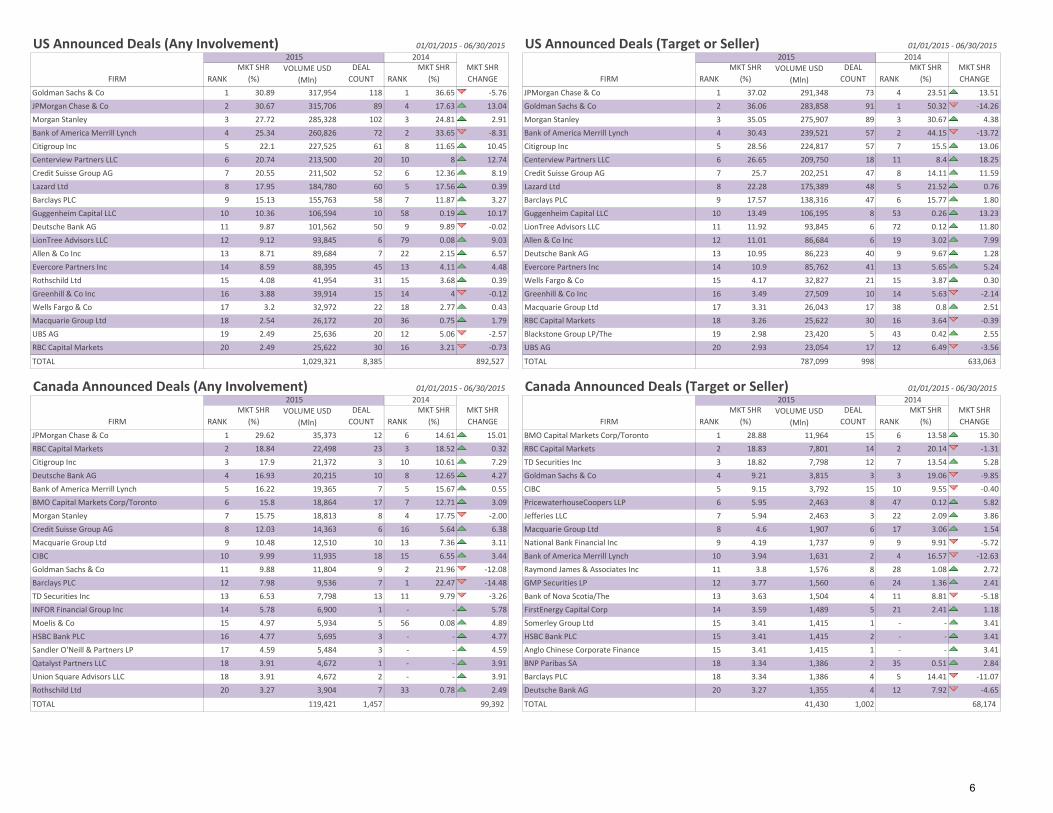
US Announced Deals (Any Involvement) 01/01/2015 - 06/30/2015 US Announced Deals (Target or Seller) 01/01/2015 - 06/30/2015
Goldman Sachs & Co 1 30.89 317,954 118 1 36.65 -5.76 JPMorgan Chase & Co 1 37.02 291,348 73 4 23.51 13.51JPMorgan Chase & Co 2 30.67 315,706 89 4 17.63 13.04 Goldman Sachs & Co 2 36.06 283,858 91 1 50.32 -14.26Morgan Stanley 3 27.72 285,328 102 3 24.81 2.91 Morgan Stanley 3 35.05 275,907 89 3 30.67 4.38Bank of America Merrill Lynch 4 25.34 260,826 72 2 33.65 -8.31 Bank of America Merrill Lynch 4 30.43 239,521 57 2 44.15 -13.72Citigroup Inc 5 22.1 227,525 61 8 11.65 10.45 Citigroup Inc 5 28.56 224,817 57 7 15.5 13.06Centerview Partners LLC 6 20.74 213,500 20 10 8 12.74 Centerview Partners LLC 6 26.65 209,750 18 11 8.4 18.25Credit Suisse Group AG 7 20.55 211,502 52 6 12.36 8.19 Credit Suisse Group AG 7 25.7 202,251 47 8 14.11 11.59Lazard Ltd 8 17.95 184,780 60 5 17.56 0.39 Lazard Ltd 8 22.28 175,389 48 5 21.52 0.76Barclays PLC 9 15.13 155,763 58 7 11.87 3.27 Barclays PLC 9 17.57 138,316 47 6 15.77 1.80Guggenheim Capital LLC 10 10.36 106,594 10 58 0.19 10.17 Guggenheim Capital LLC 10 13.49 106,195 8 53 0.26 13.23Deutsche Bank AG 11 9.87 101,562 50 9 9.89 -0.02 LionTree Advisors LLC 11 11.92 93,845 6 72 0.12 11.80LionTree Advisors LLC 12 9.12 93,845 6 79 0.08 9.03 Allen & Co Inc 12 11.01 86,684 6 19 3.02 7.99Allen & Co Inc 13 8.71 89,684 7 22 2.15 6.57 Deutsche Bank AG 13 10.95 86,223 40 9 9.67 1.28Evercore Partners Inc 14 8.59 88,395 45 13 4.11 4.48 Evercore Partners Inc 14 10.9 85,762 41 13 5.65 5.24Rothschild Ltd 15 4.08 41,954 31 15 3.68 0.39 Wells Fargo & Co 15 4.17 32,827 21 15 3.87 0.30Greenhill & Co Inc 16 3.88 39,914 15 14 4 -0.12 Greenhill & Co Inc 16 3.49 27,509 10 14 5.63 -2.14Wells Fargo & Co 17 3.2 32,972 22 18 2.77 0.43 Macquarie Group Ltd 17 3.31 26,043 17 38 0.8 2.51Macquarie Group Ltd 18 2.54 26,172 20 36 0.75 1.79 RBC Capital Markets 18 3.26 25,622 30 16 3.64 -0.39UBS AG 19 2.49 25,636 20 12 5.06 -2.57 Blackstone Group LP/The 19 2.98 23,420 5 43 0.42 2.55RBC Capital Markets 20 2.49 25,622 30 16 3.21 -0.73 UBS AG 20 2.93 23,054 17 12 6.49 -3.56
TOTAL 1,029,321 8,385 TOTAL 787,099 998
Canada Announced Deals (Any Involvement) 01/01/2015 - 06/30/2015 Canada Announced Deals (Target or Seller) 01/01/2015 - 06/30/2015
JPMorgan Chase & Co 1 29.62 35,373 12 6 14.61 15.01 BMO Capital Markets Corp/Toronto 1 28.88 11,964 15 6 13.58 15.30RBC Capital Markets 2 18.84 22,498 23 3 18.52 0.32 RBC Capital Markets 2 18.83 7,801 14 2 20.14 -1.31Citigroup Inc 3 17.9 21,372 3 10 10.61 7.29 TD Securities Inc 3 18.82 7,798 12 7 13.54 5.28Deutsche Bank AG 4 16.93 20,215 10 8 12.65 4.27 Goldman Sachs & Co 4 9.21 3,815 3 3 19.06 -9.85Bank of America Merrill Lynch 5 16.22 19,365 7 5 15.67 0.55 CIBC 5 9.15 3,792 15 10 9.55 -0.40BMO Capital Markets Corp/Toronto 6 15.8 18,864 17 7 12.71 3.09 PricewaterhouseCoopers LLP 6 5.95 2,463 8 47 0.12 5.82Morgan Stanley 7 15.75 18,813 8 4 17.75 -2.00 Jefferies LLC 7 5.94 2,463 3 22 2.09 3.86Credit Suisse Group AG 8 12.03 14,363 6 16 5.64 6.38 Macquarie Group Ltd 8 4.6 1,907 6 17 3.06 1.54Macquarie Group Ltd 9 10.48 12,510 10 13 7.36 3.11 National Bank Financial Inc 9 4.19 1,737 9 9 9.91 -5.72CIBC 10 9.99 11,935 18 15 6.55 3.44 Bank of America Merrill Lynch 10 3.94 1,631 2 4 16.57 -12.63Goldman Sachs & Co 11 9.88 11,804 9 2 21.96 -12.08 Raymond James & Associates Inc 11 3.8 1,576 8 28 1.08 2.72Barclays PLC 12 7.98 9,536 7 1 22.47 -14.48 GMP Securities LP 12 3.77 1,560 6 24 1.36 2.41TD Securities Inc 13 6.53 7,798 13 11 9.79 -3.26 Bank of Nova Scotia/The 13 3.63 1,504 4 11 8.81 -5.18INFOR Financial Group Inc 14 5.78 6,900 1 - - 5.78 FirstEnergy Capital Corp 14 3.59 1,489 5 21 2.41 1.18Moelis & Co 15 4.97 5,934 5 56 0.08 4.89 Somerley Group Ltd 15 3.41 1,415 1 - - 3.41HSBC Bank PLC 16 4.77 5,695 3 - - 4.77 HSBC Bank PLC 15 3.41 1,415 2 - - 3.41Sandler O'Neill & Partners LP 17 4.59 5,484 3 - - 4.59 Anglo Chinese Corporate Finance 15 3.41 1,415 1 - - 3.41Qatalyst Partners LLC 18 3.91 4,672 1 - - 3.91 BNP Paribas SA 18 3.34 1,386 2 35 0.51 2.84Union Square Advisors LLC 18 3.91 4,672 2 - - 3.91 Barclays PLC 18 3.34 1,386 4 5 14.41 -11.07Rothschild Ltd 20 3.27 3,904 7 33 0.78 2.49 Deutsche Bank AG 20 3.27 1,355 4 12 7.92 -4.65
TOTAL 119,421 1,457 TOTAL 41,430 1,002
892,527 633,063
99,392 68,174
FIRM
2015 2014MKT SHR CHANGE FIRM
2015 2014VOLUME USD
(Mln)MKT SHR CHANGERANK
MKT SHR (%)
VOLUME USD (Mln)
DEAL COUNT RANK
MKT SHR (%) RANK
MKT SHR (%)
DEAL COUNT RANK
MKT SHR (%)
FIRM
2015 2014MKT SHR CHANGE FIRM
2015 2014MKT SHR CHANGERANK
MKT SHR (%)
VOLUME USD (Mln)
DEAL COUNT RANK
MKT SHR (%) RANK
MKT SHR (%)
VOLUME USD (Mln)
DEAL COUNT RANK
MKT SHR (%)
6

Latin America Announced Deals (Any Involvement) 01/01/2015 - 06/30/2015 Brazil Announced Deals (Any Involvement) 01/01/2015 - 06/30/2015
Bank of America Merrill Lynch 1 29.73 13,892 10 4 21.67 8.06 Deutsche Bank AG 1 40.16 8,677 3 18 3.91 36.26Deutsche Bank AG 2 23.86 11,149 5 9 16.23 7.63 Banco BTG Pactual SA 2 35.79 7,732 8 1 42.6 -6.81Rothschild Ltd 3 23.63 11,043 6 10 14.35 9.29 Rothschild Ltd 3 30.24 6,532 4 4 31.52 -1.29UBS AG 4 20.36 9,511 3 17 5.46 14.89 Banco Santander SA 4 27.69 5,981 8 3 39.57 -11.88Credit Suisse Group AG 5 20.28 9,476 6 3 22.24 -1.96 Bank of America Merrill Lynch 5 25.89 5,594 6 5 27.44 -1.55JPMorgan Chase & Co 6 18.2 8,504 5 26 1.76 16.45 Banco Itau BBA SA 6 25.56 5,523 17 2 41.68 -16.12Citigroup Inc 7 17.59 8,220 5 1 25.4 -7.80 Morgan Stanley 7 21.26 4,593 4 14 7.22 14.04Banco BTG Pactual SA 8 16.55 7,732 8 8 19.26 -2.71 Moelis & Co 8 19.81 4,280 1 30 0.21 19.60Banco Santander SA 9 16.22 7,577 10 2 22.57 -6.35 HSBC Bank PLC 8 19.81 4,280 1 - - 19.81GMP Securities LP 10 12.32 5,757 1 - - 12.32 UBS AG 10 17.38 3,754 2 12 10.69 6.69Banco Itau BBA SA 11 12.27 5,732 19 5 21.54 -9.28 Credit Suisse Group AG 11 17.21 3,719 4 6 24 -6.78Morgan Stanley 12 9.83 4,593 5 7 19.45 -9.62 Bank of Nova Scotia/The 12 4.17 900 1 - - 4.17HSBC Bank PLC 13 9.38 4,385 3 20 4 5.39 Caixa Banco de Investimento SA 13 4.05 876 1 - - 4.05Moelis & Co 14 9.16 4,280 1 47 0.09 9.07 Banco do Brasil SA 14 3.91 845 4 24 0.7 3.21Goldman Sachs & Co 15 6.11 2,856 8 6 20.35 -14.23 JPMorgan Chase & Co 15 2.79 602 1 20 1.31 1.48PricewaterhouseCoopers LLP 16 4.91 2,296 7 58 - 4.91 Goldman Sachs & Co 16 2.02 437 4 8 18.13 -16.10Ernst & Young 17 4.68 2,186 2 59 - 4.68 PricewaterhouseCoopers LLP 17 0.92 198 4 36 - 0.92Alfaro Davila y Rios SC 18 4.6 2,150 1 - - 4.60 GCA Savvian Corp 17 0.92 198 1 - - 0.92Industrial & Commercial Bank of China Ltd 19 4.49 2,098 1 - - 4.49 Quadrangle Group LLC 17 0.92 198 2 36 - 0.92Bank of Nova Scotia/The 20 2.28 1,064 3 35 0.37 1.91 Citigroup Inc 20 0.8 174 2 9 16.38 -15.58
TOTAL 46,725 426 TOTAL 21,604 22976,305 32,530
FIRM
2015 2014MKT SHR CHANGE FIRM
2015 2014MKT SHR CHANGERANK
MKT SHR (%)
VOLUME USD (Mln)
DEAL COUNT RANK
MKT SHR (%) RANK
MKT SHR (%)
VOLUME USD (Mln)
DEAL COUNT RANK
MKT SHR (%)
7

Country
United Kingdom $193.3 48.1% 148.9%
France $36.9 9.2% -68.0%
Germany $25.8 6.4% -37.5%
Italy $23.6 5.9% 164.1%
Netherlands $16.2 4.0% -1.3%
Switzerland $15.8 3.9% -12.5%
Spain $12.6 3.1% -40.6%
Finland $8.0 2.0% -21.0%
DateTotal Value (USD Mln.)
Amount (Bln.) % of Total
% YoY Change
Number of deals 4,356 Energy $95.6 23.3% 226.4%
Volume (Bln.) $410 Financial $77.7 18.9% -6.1%
Avg Deal Size (Mln.) $92.5 Industrial $55.6 13.5% -37.3%
Communications $55.6 13.5% -25.6%
Consumer, Non-cyclical $49.5 12.1% -18.4%
Goldman Sachs & Co Consumer, Cyclical $38.3 9.3% -3.5%
Number of deals 69 Technology $14.0 3.4% 93.2%
Volume (Bln.) $178.7 Utilities $11.0 2.7% 19.4%
Avg Deal Size (Bln.) $2.6 Basic Materials $6.9 1.7% -38.7%
Diversified $6.2 1.5% 113.6%
Amount (Bln.)
% Change Deal Count
% Change Volume
Company Takeover $274.9 10.0% 26.7%
Cross Border $347.7 15.8% 13.8%
Private Equity $98.9 9.0% 25.3%
Asset Sale $69.9 20.6% -35.5%
Tender Offer $45.5 -38.2% -7.4%
Venture Capital $7.1 4.4% 28.8%
Spin-off $2.5 -41.7% -50.8%
Minority Purchase $29.8 -6.8% -8.0%
$29.8 -10.9% -23.7%
Quarterly Volume represents any involvement (target, seller, or acquirer).
Glob
al M
&A
Revi
ew |
1H
2015
Majority Purchase
EMEA M&A Review EMEA M&A: Country Breakdown
EMEA M&A Highlights of 1H 2015
Summary Target Acquirer Seller Industry
4/8/2015 BG Group PLC Royal Dutch Shell PLC - $79,308.5
- $11,473.4
Top Adviser4/15/2015 Alcatel-Lucent Nokia OYJ - $11,669.9
3/24/2015 Telefonica UK Ltd Hutchison Whampoa Ltd Telefonica SA $15,125.1
6/24/2015 Delhaize Group SA Koninklijke Ahold NV
EMEA M&A: Quarterly Volume EMEA M&A: Deal Type Breakdown
Deal Type
2/19/2015 Rexam PLC Ball Corp - $8,500.6
EMEA M&A: Industry Breakdown
Amount (Bln.) % of Total
% YoY Change
0
1,000
2,000
3,000
4,000
$0
$100
$200
$300
$400
2010 Q2 2011 Q2 2012 Q2 2013 Q2 2014 Q2 2015 Q2
Volume (Bln.) Deal Count
• At $409.7B, a marginal 0.6% increase on 1H2014, volume in EMEA was consistent with that of theprevious last half of the year.
• The oil and gas industry replaced real estate as the top industry by volume in the region, driven by theacquisition of BG Group PLC by Royal Dutch Shell PLC, at $79.3B. Shell's offer represented a 54.1%premium at the time of announcement, driven mainly by BG's LNG assets. The premium was doublethat of Mobil Corp when acquired by Exxon Corp in 1998 (26.2%).
• The average premium in 1H2015 increased compared to 1H2014 (24.28% from 19.4%), withacquisitions within the mining industry drawing particularly high premiums of 78.9%.
• Private equity volume in 1H2015 increased 25.3% from the same period of the prior year. Privateequity in EMEA increased at a higher rate than the global benchmark change of 10.7% YTD.
8

Europe Announced Deals (Any Involvement) 01/01/2015 - 06/30/2015 Europe Announced Deals (Target or Seller) 01/01/2015 - 06/30/2015
Goldman Sachs & Co 1 37.85 190,312 78 2 27.52 10.32 Goldman Sachs & Co 1 42.97 177,416 67 2 30.07 12.90Morgan Stanley 2 34.37 172,825 59 1 32.44 1.93 JPMorgan Chase & Co 2 40.08 165,458 52 11 17.95 22.13JPMorgan Chase & Co 3 34.13 171,628 59 8 19.53 14.60 Bank of America Merrill Lynch 3 37.16 153,417 40 7 23.01 14.15Bank of America Merrill Lynch 4 33.74 169,650 46 5 24.07 9.66 Morgan Stanley 4 33.78 139,468 51 1 33.94 -0.16Simon Robertson Associates LLP 5 15.77 79,308 1 23 2.28 13.50 Simon Robertson Associates LLP 5 19.21 79,308 1 25 2.26 16.95Deutsche Bank AG 6 14.24 71,582 40 6 21.75 -7.51 Deutsche Bank AG 6 14.51 59,892 32 5 25.04 -10.53Lazard Ltd 7 13.2 66,386 72 3 25.34 -12.14 Rothschild Ltd 7 13.66 56,404 102 6 24.09 -10.43Credit Suisse Group AG 8 11.95 60,102 27 9 17.53 -5.58 Lazard Ltd 8 11.08 45,743 59 3 28.29 -17.21Rothschild Ltd 9 11.92 59,925 104 7 19.99 -8.07 UBS AG 9 9.12 37,638 27 14 13.03 -3.91Citigroup Inc 10 11.3 56,847 44 4 24.09 -12.78 HSBC Bank PLC 10 7.48 30,886 16 13 13.65 -6.16UBS AG 11 8.22 41,353 30 14 11.13 -2.90 Barclays PLC 11 7.33 30,265 26 15 11.53 -4.20HSBC Bank PLC 12 6.31 31,741 18 13 11.52 -5.21 Citigroup Inc 12 7.08 29,220 35 4 26.25 -19.17Barclays PLC 13 6.02 30,265 27 15 10.72 -4.70 Credit Suisse Group AG 13 5.6 23,132 20 8 21.57 -15.96BNP Paribas SA 14 5.29 26,588 28 11 15.58 -10.29 BNP Paribas SA 14 5.35 22,103 25 10 19.65 -14.30Moelis & Co 15 4.66 23,409 14 47 0.43 4.22 Moelis & Co 15 4.15 17,133 9 58 0.23 3.92Greenhill & Co Inc 16 2.67 13,434 7 27 1.71 0.96 Greenhill & Co Inc 16 3.25 13,434 7 29 1.55 1.70RBC Capital Markets 17 2.65 13,346 10 30 1.36 1.29 RBC Capital Markets 17 3.04 12,570 9 30 1.42 1.62Macquarie Group Ltd 18 2.52 12,697 14 32 1.15 1.37 Zaoui & Co LLP 18 2.83 11,670 1 16 8.56 -5.73Zaoui & Co LLP 19 2.32 11,670 1 16 6.79 -4.47 PricewaterhouseCoopers LLP 19 2.56 10,578 106 34 1.07 1.49PricewaterhouseCoopers LLP 20 2.24 11,248 115 37 0.86 1.37 Goodbody Corporate Finance Ltd 20 2.15 8,862 2 - - 2.15
TOTAL 502,856 5,326 TOTAL 412,843 4,274
UK Announced Deals (Any Involvement) 01/01/2015 - 06/30/2015 Germany Announced Deals (Any Involvement) 01/01/2015 - 06/30/2015
Goldman Sachs & Co 1 47.75 115,500 42 3 21.04 26.72 Deutsche Bank AG 1 26.38 11,075 8 2 37.13 -10.75Bank of America Merrill Lynch 2 47.58 115,073 25 2 22.1 25.47 Morgan Stanley 2 26.33 11,056 6 1 40.51 -14.17JPMorgan Chase & Co 3 43.02 104,053 33 1 25.95 17.07 Bank of America Merrill Lynch 3 25.76 10,815 5 5 25.95 -0.19Morgan Stanley 4 37.9 91,660 21 4 16.94 20.95 Citigroup Inc 4 22.32 9,370 7 7 15.56 6.75Simon Robertson Associates LLP 5 32.79 79,308 1 11 6.25 26.54 JPMorgan Chase & Co 5 16.03 6,731 7 3 31.45 -15.42Rothschild Ltd 6 11.79 28,511 51 10 9.16 2.63 Credit Suisse Group AG 6 15.47 6,494 4 13 5.55 9.91UBS AG 7 11.78 28,486 15 7 12.24 -0.46 Moelis & Co 7 14.9 6,254 1 46 - 14.90Barclays PLC 8 10.7 25,875 19 9 10.17 0.53 Mizuho Financial Group Inc 8 2.75 1,155 1 44 - 2.75Deutsche Bank AG 9 10.02 24,225 16 8 11.54 -1.53 Arpwood Capital Pvt Ltd 9 2.71 1,138 1 - - 2.71HSBC Bank PLC 10 7.93 19,179 7 22 2.55 5.38 Lazard Ltd 10 2.35 985 7 12 7.24 -4.89Moelis & Co 11 6.98 16,887 7 41 0.45 6.53 Deloitte Touche Tohmatsu ILA Group Ltd 11 2.04 855 2 46 - 2.04Citigroup Inc 12 6.82 16,493 16 5 15.88 -9.06 Barclays PLC 12 1.73 727 2 11 8.4 -6.67Credit Suisse Group AG 13 5.97 14,429 13 21 2.62 3.35 Pohjola Bank Oyj 13 1.59 669 1 - - 1.59Greenhill & Co Inc 14 5.51 13,325 5 20 4.66 0.85 Rothschild Ltd 14 1.48 620 9 4 26.15 -24.67Macquarie Group Ltd 15 5.25 12,687 11 35 0.72 4.53 Nomura Holdings Inc 15 1.45 607 3 21 0.69 0.76RBC Capital Markets 16 4.78 11,552 7 23 2.28 2.49 Sumitomo Mitsui Financial Group Inc 16 0.82 346 1 - - 0.82PricewaterhouseCoopers LLP 17 4.27 10,320 50 26 1.35 2.91 Guggenheim Capital LLC 17 0.67 280 1 - - 0.67Lazard Ltd 18 3.18 7,696 23 6 14.45 -11.26 PricewaterhouseCoopers LLP 18 0.62 262 10 40 0.02 0.60Banco Santander SA 19 2.48 5,995 3 18 4.92 -2.44 Augusta & Co PLC 19 0.38 159 1 - - 0.38Centerview Partners LLC 20 1.99 4,807 2 31 1.02 0.97 RBC Capital Markets 20 0.3 126 1 - - 0.30
TOTAL 241,862 2,167 TOTAL 41,984 872203,665 86,135
559,015 443,160
FIRM
2015 2014MKT SHR CHANGE FIRM
2015 2014MKT SHR CHANGERANK
MKT SHR (%)
VOLUME USD (Mln)
DEAL COUNT RANK
MKT SHR (%) RANK
MKT SHR (%)
VOLUME USD (Mln)
DEAL COUNT RANK
MKT SHR (%)
2014MKT SHR CHANGERANK
MKT SHR (%)
VOLUME USD (Mln)
DEAL COUNT RANK
MKT SHR (%) RANK
MKT SHR (%)
VOLUME USD (Mln)
DEAL COUNT RANK
MKT SHR (%)FIRM
2015 2014MKT SHR CHANGE FIRM
2015
9

France Announced Deals (Any Involvement) 01/01/2015 - 06/30/2015 Italy Announced Deals (Any Involvement) 01/01/2015 - 06/30/2015
JPMorgan Chase & Co 1 37.45 27,253 10 18 10.92 26.54 Lazard Ltd 1 49.74 16,926 9 3 28.17 21.57BNP Paribas SA 2 34.51 25,111 19 6 48.31 -13.80 Morgan Stanley 2 47.87 16,289 8 15 3.65 44.22Bank of America Merrill Lynch 3 32.71 23,800 4 11 29.2 3.51 Goldman Sachs & Co 3 43.35 14,751 11 4 24.23 19.12Morgan Stanley 4 30.61 22,277 11 2 59 -28.38 Rothschild Ltd 4 41.45 14,104 9 7 16.57 24.88Goldman Sachs & Co 5 29.28 21,305 8 8 43.45 -14.17 Deutsche Bank AG 5 31.02 10,557 5 5 22.89 8.14Rothschild Ltd 6 22.07 16,060 39 5 51.91 -29.84 JPMorgan Chase & Co 6 29.84 10,155 4 1 36.52 -6.68Credit Suisse Group AG 7 18.28 13,305 7 4 55.01 -36.73 Credit Suisse Group AG 7 26.5 9,017 6 29 - 26.50Lazard Ltd 8 16.62 12,091 25 1 64.27 -47.65 Citigroup Inc 8 23.36 7,950 9 12 6.35 17.02Zaoui & Co LLP 9 16.04 11,670 1 13 26.19 -10.15 BDT & Co LLC 9 17.37 5,911 1 - - 17.37UBS AG 10 10.25 7,461 2 15 17.58 -7.33 Bank of America Merrill Lynch 10 12.99 4,421 8 2 35.02 -22.03Davy Corporate Finance 11 10.08 7,337 1 - - 10.08 UBS AG 11 9.99 3,398 7 - - 9.99Goodbody Corporate Finance Ltd 11 10.08 7,337 1 - - 10.08 HSBC Bank PLC 12 9.75 3,318 4 18 1.65 8.11HSBC Bank PLC 11 10.08 7,337 4 10 38.77 -28.68 Credit Agricole Corporate & Investment Bank SA 13 7.89 2,686 4 29 - 7.89Societe Generale SA 14 7.7 5,606 15 7 43.77 -36.06 Vitale & Associati SpA 14 7.17 2,439 2 24 0.67 6.50Barclays PLC 15 6.3 4,582 7 14 19.27 -12.98 Piper Jaffray & Co 15 4.11 1,397 1 - - 4.11Citigroup Inc 16 6.03 4,387 3 9 40.63 -34.60 Intesa Sanpaolo SpA 16 2.84 967 5 14 5.42 -2.58Deutsche Bank AG 17 4.84 3,521 2 12 27.56 -22.72 Equita SIM SpA 17 2.69 916 2 - - 2.69Blackstone Group LP/The 18 2.07 1,508 1 - - 2.07 Mediobanca SpA 17 2.69 916 5 - - 2.69Credit Agricole Corporate & Investment Bank SA 19 1.4 1,020 8 3 55.08 -53.68 Nomura Holdings Inc 19 2.57 875 2 16 1.82 0.75Daiwa Securities Group Inc 20 1.07 779 14 24 0.75 0.32 Leonardo & Co SpA 20 1.35 461 3 8 14.65 -1329.0%
TOTAL 72,767 753 TOTAL 34,028 291
Benelux Announced Deals (Any Involvement) 01/01/2015 - 06/30/2015 Iberia Announced Deals (Any Involvement) 01/01/2015 - 06/30/2015
Goldman Sachs & Co 1 69.53 101,692 9 6 36.34 33.19 UBS AG 1 44.36 19,365 4 3 44.17 0.19JPMorgan Chase & Co 2 67.87 99,262 11 9 29.93 37.94 HSBC Bank PLC 2 36.79 16,062 4 21 2.69 34.10Morgan Stanley 3 67.07 98,096 9 1 65.14 1.93 Moelis & Co 3 34.64 15,125 1 - - 34.64Bank of America Merrill Lynch 4 62.95 92,060 5 2 49.24 13.70 Morgan Stanley 4 22.15 9,672 12 6 35.47 -13.32Simon Robertson Associates LLP 5 54.23 79,308 1 - - 54.23 Citigroup Inc 5 18.86 8,232 7 27 0.89 17.97Lazard Ltd 6 13.16 19,248 16 5 41.72 -28.55 Goldman Sachs & Co 6 18.44 8,050 9 2 47.43 -28.99Credit Suisse Group AG 7 12.37 18,086 3 14 24.48 -12.11 Lazard Ltd 7 13.09 5,716 7 14 13.54 -0.44Deutsche Bank AG 8 9.57 14,001 5 8 31.51 -21.94 Rothschild Ltd 8 10.53 4,597 6 15 13 -2.47Barclays PLC 9 2.03 2,968 3 13 24.49 -22.46 Bank of America Merrill Lynch 9 7.13 3,114 5 5 39.58 -32.44BNP Paribas SA 10 1.89 2,770 6 11 25.78 -23.89 RBC Capital Markets 10 5.83 2,545 1 - - 5.83Societe Generale SA 11 1.51 2,209 1 12 24.98 -23.47 Banco BPI SA 11 3.92 1,713 3 - - 3.92HSBC Bank PLC 12 1.5 2,189 2 26 0.62 0.88 PricewaterhouseCoopers LLP 12 3.41 1,490 18 26 1.2 2.22Somerley Group Ltd 13 1.26 1,838 3 - - 1.26 Deutsche Bank AG 13 2.99 1,306 2 7 35.25 -32.26Blackstone Group LP/The 14 1.03 1,508 2 - - 1.03 Caixa Banco de Investimento SA 14 2.52 1,101 4 19 6.08 -3.56Anglo Chinese Corporate Finance 15 0.97 1,415 1 - - 0.97 Intesa Sanpaolo SpA 15 1.77 775 1 - - 1.77Intesa Sanpaolo SpA 16 0.53 775 1 - - 0.53 Societe Generale SA 16 1.55 679 4 11 27.45 -25.90Evercore Partners Inc 17 0.51 744 4 23 0.82 -0.31 Banco Espirito Santo de Investimento SA 17 0.52 225 3 29 0.7 -0.18ABN AMRO Bank NV 18 0.49 723 10 15 14.56 -14.07 Banco do Brasil SA 18 0.49 215 2 - - 0.49Rothschild Ltd 19 0.41 595 15 18 3.16 -2.76 KPMG Corporate Finance LLC 19 0.49 213 3 17 9.1 -8.61Lincoln International LLC 20 0.35 509 3 46 - 0.35 Valence Group/The 20 0.37 163 1 - - 0.37
TOTAL 146,254 586 TOTAL 43,659 301
144,843 21,398
77,952 36,522
MKT SHR CHANGE
2014MKT SHR CHANGE
MKT SHR (%)
VOLUME USD (Mln)
DEAL COUNT RANK
MKT SHR (%)
2015 2014MKT SHR CHANGE FIRM
2015VOLUME USD
(Mln)DEAL
COUNT
FIRM
2015 2014MKT SHR CHANGERANK
MKT SHR (%)
VOLUME USD (Mln)
DEAL COUNT RANK
MKT SHR (%)
FIRM RANKMKT SHR
(%)VOLUME USD
(Mln)DEAL
COUNT RANKMKT SHR
(%) RANKMKT SHR
(%) RANKMKT SHR
(%)
FIRM
2015 2014
RANK
10
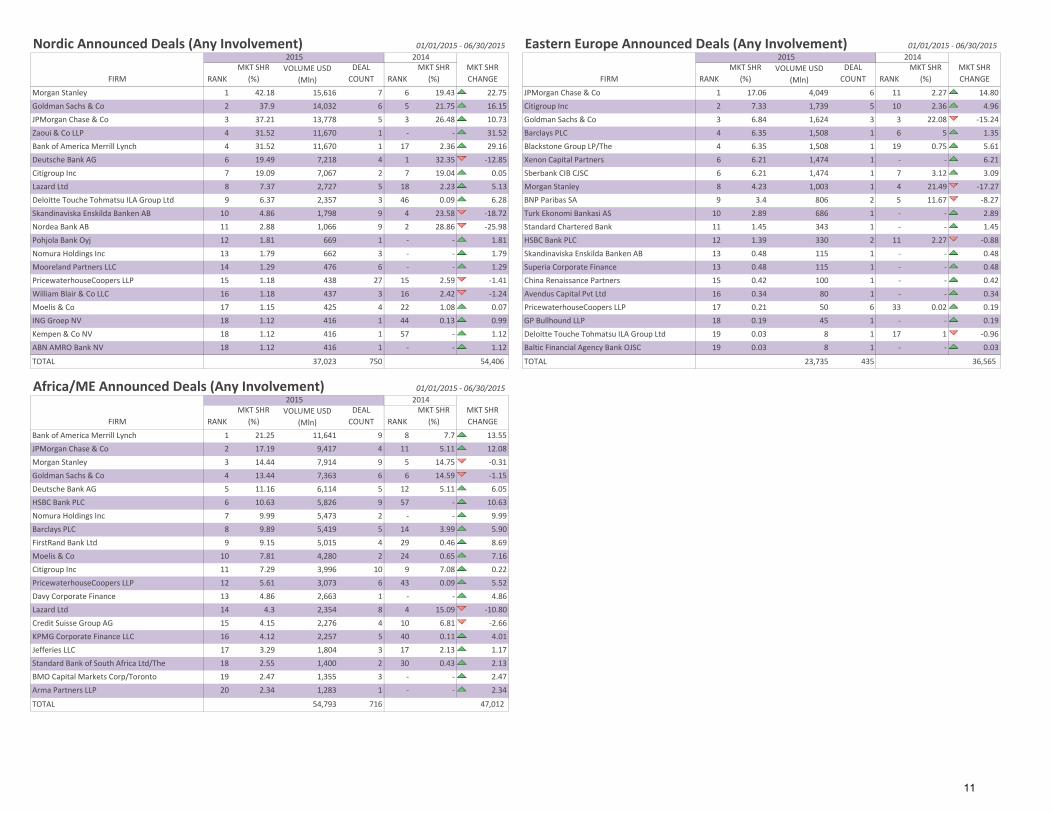
Nordic Announced Deals (Any Involvement) 01/01/2015 - 06/30/2015 Eastern Europe Announced Deals (Any Involvement) 01/01/2015 - 06/30/2015
Morgan Stanley 1 42.18 15,616 7 6 19.43 22.75 JPMorgan Chase & Co 1 17.06 4,049 6 11 2.27 14.80Goldman Sachs & Co 2 37.9 14,032 6 5 21.75 16.15 Citigroup Inc 2 7.33 1,739 5 10 2.36 4.96JPMorgan Chase & Co 3 37.21 13,778 5 3 26.48 10.73 Goldman Sachs & Co 3 6.84 1,624 3 3 22.08 -15.24Zaoui & Co LLP 4 31.52 11,670 1 - - 31.52 Barclays PLC 4 6.35 1,508 1 6 5 1.35Bank of America Merrill Lynch 4 31.52 11,670 1 17 2.36 29.16 Blackstone Group LP/The 4 6.35 1,508 1 19 0.75 5.61Deutsche Bank AG 6 19.49 7,218 4 1 32.35 -12.85 Xenon Capital Partners 6 6.21 1,474 1 - - 6.21Citigroup Inc 7 19.09 7,067 2 7 19.04 0.05 Sberbank CIB CJSC 6 6.21 1,474 1 7 3.12 3.09Lazard Ltd 8 7.37 2,727 5 18 2.23 5.13 Morgan Stanley 8 4.23 1,003 1 4 21.49 -17.27Deloitte Touche Tohmatsu ILA Group Ltd 9 6.37 2,357 3 46 0.09 6.28 BNP Paribas SA 9 3.4 806 2 5 11.67 -8.27Skandinaviska Enskilda Banken AB 10 4.86 1,798 9 4 23.58 -18.72 Turk Ekonomi Bankasi AS 10 2.89 686 1 - - 2.89Nordea Bank AB 11 2.88 1,066 9 2 28.86 -25.98 Standard Chartered Bank 11 1.45 343 1 - - 1.45Pohjola Bank Oyj 12 1.81 669 1 - - 1.81 HSBC Bank PLC 12 1.39 330 2 11 2.27 -0.88Nomura Holdings Inc 13 1.79 662 3 - - 1.79 Skandinaviska Enskilda Banken AB 13 0.48 115 1 - - 0.48Mooreland Partners LLC 14 1.29 476 6 - - 1.29 Superia Corporate Finance 13 0.48 115 1 - - 0.48PricewaterhouseCoopers LLP 15 1.18 438 27 15 2.59 -1.41 China Renaissance Partners 15 0.42 100 1 - - 0.42William Blair & Co LLC 16 1.18 437 3 16 2.42 -1.24 Avendus Capital Pvt Ltd 16 0.34 80 1 - - 0.34Moelis & Co 17 1.15 425 4 22 1.08 0.07 PricewaterhouseCoopers LLP 17 0.21 50 6 33 0.02 0.19ING Groep NV 18 1.12 416 1 44 0.13 0.99 GP Bullhound LLP 18 0.19 45 1 - - 0.19Kempen & Co NV 18 1.12 416 1 57 - 1.12 Deloitte Touche Tohmatsu ILA Group Ltd 19 0.03 8 1 17 1 -0.96ABN AMRO Bank NV 18 1.12 416 1 - - 1.12 Baltic Financial Agency Bank OJSC 19 0.03 8 1 - - 0.03
TOTAL 37,023 750 TOTAL 23,735 435
Africa/ME Announced Deals (Any Involvement) 01/01/2015 - 06/30/2015
Bank of America Merrill Lynch 1 21.25 11,641 9 8 7.7 13.55JPMorgan Chase & Co 2 17.19 9,417 4 11 5.11 12.08Morgan Stanley 3 14.44 7,914 9 5 14.75 -0.31Goldman Sachs & Co 4 13.44 7,363 6 6 14.59 -1.15Deutsche Bank AG 5 11.16 6,114 5 12 5.11 6.05HSBC Bank PLC 6 10.63 5,826 9 57 - 10.63Nomura Holdings Inc 7 9.99 5,473 2 - - 9.99Barclays PLC 8 9.89 5,419 5 14 3.99 5.90FirstRand Bank Ltd 9 9.15 5,015 4 29 0.46 8.69Moelis & Co 10 7.81 4,280 2 24 0.65 7.16Citigroup Inc 11 7.29 3,996 10 9 7.08 0.22PricewaterhouseCoopers LLP 12 5.61 3,073 6 43 0.09 5.52Davy Corporate Finance 13 4.86 2,663 1 - - 4.86Lazard Ltd 14 4.3 2,354 8 4 15.09 -10.80Credit Suisse Group AG 15 4.15 2,276 4 10 6.81 -2.66KPMG Corporate Finance LLC 16 4.12 2,257 5 40 0.11 4.01Jefferies LLC 17 3.29 1,804 3 17 2.13 1.17Standard Bank of South Africa Ltd/The 18 2.55 1,400 2 30 0.43 2.13BMO Capital Markets Corp/Toronto 19 2.47 1,355 3 - - 2.47Arma Partners LLP 20 2.34 1,283 1 - - 2.34
TOTAL 54,793 716
54,406 36,565
47,012
FIRM
2015 2014MKT SHR CHANGE FIRM
2015 2014
RANKMKT SHR
(%)VOLUME USD
(Mln)DEAL
COUNT RANKMKT SHR
(%)
FIRMDEAL
COUNT RANKMKT SHR
(%)
MKT SHR (%) RANK
MKT SHR (%)
VOLUME USD (Mln)
DEAL COUNTRANK
MKT SHR CHANGE
2015 2014MKT SHR CHANGERANK
MKT SHR (%)
VOLUME USD (Mln)
11

DateTotal Value (USD Mln.)
Number of deals 5,048
Volume (Bln.) $488.2
Avg Deal Size (Mln.) $95.4
Goldman Sachs & Co
Number of deals 27
Volume (Bln.) $79.5
Avg Deal Size (Bln.) $2.9
Deal TypeAmount
(Bln.)% Change
Deal Count% YoY
Change
Company Takeover $282.4 13.3% 81.1%
Cross Border $145.2 34.0% 24.2%
Private Equity $59.1 75.5% 18.7%
Asset Sale $44.1 16.5% 8.6%
Tender Offer $9.0 0.8% -74.7%
Venture Capital $12.0 158.9% 182.4%
Spin-off $20.3 75.0% 605.7%
Minority Purchase $72.3 72.0% 58.8%
Majority Purchase $54.4 20.9% 11.4%
Graphs represent any regional involvement (target, seller, or acquirer.)
SK Holdings Co Ltd
Japan M&A: Quarterly Volume
$10,682.81/30/2015Adani Ports & Special
Economic Zone LtdShareholders Adani Enterprises Ltd
-
-
APAC M&A: Breakdown
Greater China M&A: Quarterly Volume
5/26/2015 Samsung C&T Corp Cheil Industries Inc - $10,938.2
Top Adviser3/24/2015
China Overseas Land & Investment Ltd
China State Construction Engineering Corp Ltd
- $11,199.8
4/20/2015
$41,705.3
SK C&C Co Ltd $26,731.5
APAC M&A Regional Review
Glob
al M
&A
Revi
ew |
1H
2015
APAC M&A: Quarterly Volume
Australia/NZ M&A: Quarterly Volume
APAC M&A: Highlights of 1H 2015
Summary Target Acquirer Seller
1/9/2015 Hutchison Whampoa Ltd CK Hutchison Holdings Ltd
23%
11%
11% 11%
11%
10%
8%
6% 6% 3%
APAC Industry Breakdown Financial
Communications
Diversified
Industrial
Consumer, Non-cyclical
Consumer, Cyclical
Energy
Basic Materials
Technology
Utilities
01,0002,0003,0004,000
$0$100$200$300$400
Volume (Bln.) Deal Count
0
200
400
600
$0
$20
$40
$60
$80
Volume (Bln.) Deal Count
0
500
1,000
1,500
$0
$50
$100
$150
$200
Volume (Bln.) Deal Count
0
200
400
600
800
$0
$50
$100
Volume (Bln.) Deal Count
• In 1H2015, APAC M&A volume and deal count (any involvement) increased 65.0% and 32.1% to$643.8B and 6,234 respectively, compared to 1H2014. The Greater China region saw the highest dealvolume (any involvement) in the APAC region in 1H2015, increasing 91.7% to $354.9B year-on-year.
• The largest M&A deal in 2Q2015 was SK C&C Co Ltd's takeover of SK Holdings Co Ltd for $26.7B. Thiswas also the largest ever deal announced in South Korea at the time of announcement.
• The most targeted industry in APAC by volume was the financial industry, whose $119.4B contributedto 24.3% of the overall volume in 1H2015. The industry's biggest deal was the $11.2B privateplacement of China Overseas Land & Investment Ltd to China State Construction Engineering Corp Ltd.
• The average premium paid to APAC targets was 11.0%, with most premiums falling between 0 and10%.
12

APAC Ex-Japan Announced Deals (Any Involvement) 01/01/2015 - 06/30/2015 APAC Ex-Japan Announced Deals (Target or Seller) 01/01/2015 - 06/30/2015
Goldman Sachs & Co 1 16.59 96,562 38 1 15.97 0.62 Goldman Sachs & Co 1 16.94 79,539 25 2 15.05 1.88Credit Suisse Group AG 2 15.1 87,856 26 4 10.29 4.81 Somerley Group Ltd 2 15.73 73,889 27 5 8.26 7.47Citigroup Inc 3 14.91 86,796 34 3 12.41 2.51 HSBC Bank PLC 3 13.72 64,408 9 18 4.47 9.25Bank of America Merrill Lynch 4 14.33 83,398 21 5 10.12 4.21 Morgan Stanley 4 11.05 51,906 28 1 15.75 -4.70HSBC Bank PLC 5 13.94 81,153 13 18 3.84 10.10 Credit Suisse Group AG 5 10.55 49,547 17 7 7.24 3.31JPMorgan Chase & Co 6 13.65 79,426 31 7 7.98 5.67 Bank of America Merrill Lynch 6 9.7 45,573 17 4 8.27 1.43Somerley Group Ltd 7 13.2 76,836 31 9 6.98 6.23 Citigroup Inc 7 9.42 44,229 23 3 11.37 -1.95Morgan Stanley 8 12.13 70,585 37 2 15.46 -3.34 Anglo Chinese Corporate Finance 8 8.88 41,705 1 193 - 8.88Deutsche Bank AG 9 10.27 59,751 21 6 8.46 1.80 PricewaterhouseCoopers LLP 9 7.36 34,545 46 14 5.55 1.81UBS AG 10 7.76 45,170 21 17 4.52 3.24 JPMorgan Chase & Co 10 7.02 32,987 24 8 7.05 -0.02Anglo Chinese Corporate Finance 11 7.41 43,120 2 213 - 7.41 Macquarie Group Ltd 11 6.37 29,928 16 6 7.26 -0.88Macquarie Group Ltd 12 7.14 41,526 22 11 6.39 0.74 JM Financial Ltd 12 4.86 22,818 8 27 1.48 3.38Barclays PLC 13 6.6 38,417 9 27 1.59 5.01 Deutsche Bank AG 13 4.49 21,104 15 9 6.81 -2.32PricewaterhouseCoopers LLP 14 6.58 38,298 54 16 4.77 1.82 CITIC Securities Co Ltd 14 4.16 19,526 19 11 6.18 -2.02Moelis & Co 15 5.63 32,791 9 58 0.35 5.28 Southwest Securities Co Ltd 15 4.01 18,836 20 33 1.26 2.76Evercore Partners Inc 16 5.38 31,284 6 28 1.45 3.92 Axis Bank Ltd 16 3.99 18,721 6 150 0.02 3.97JM Financial Ltd 17 3.92 22,818 8 32 1.25 2.67 UBS AG 17 3.8 17,827 14 16 5.03 -1.24Rothschild Ltd 18 3.54 20,627 19 12 5.86 -2.32 Mizuho Financial Group Inc 18 3.67 17,227 4 137 0.03 3.64Lazard Ltd 19 3.46 20,133 11 10 6.63 -3.17 Huatai Securities Co Ltd 19 3.31 15,533 16 62 0.29 3.02CITIC Securities Co Ltd 20 3.36 19,526 19 8 7.36 -4.00 Grant Samuel Securities Pty Ltd 20 3.03 14,216 4 22 3.54 -0.51
TOTAL 581,980 5,110 TOTAL 469,620 4,345
APAC Private Equity (Any Involvement) 01/01/2015 - 06/30/2015
Morgan Stanley 1 23.7 22,570 16 1 33.11 -9.42Bank of America Merrill Lynch 2 21.75 20,715 9 10 12.77 8.98Moelis & Co 3 17.26 16,439 4 52 0.08 17.18Citigroup Inc 4 16.25 15,478 10 8 14.1 2.15Deutsche Bank AG 5 13.05 12,426 8 7 14.35 -1.30Macquarie Group Ltd 6 12.12 11,542 5 9 13.67 -1.55Credit Suisse Group AG 7 9.79 9,323 4 4 20.93 -11.14JPMorgan Chase & Co 8 9.39 8,941 7 16 7.19 2.20UBS AG 9 7.13 6,795 4 12 12.12 -4.98PricewaterhouseCoopers LLP 10 5.96 5,680 6 20 2.3 3.66Goldman Sachs & Co 11 5.14 4,893 9 2 30.97 -25.83HSBC Bank PLC 12 4.82 4,594 3 15 9.27 -4.45Centerview Partners LLC 13 4.41 4,200 2 30 1.34 3.07Kimberlite Group LLC 13 4.41 4,200 1 - - 4.41Wells Fargo & Co 13 4.41 4,200 2 - - 4.41Rothschild Ltd 16 3.98 3,792 5 6 14.91 -10.93RBC Capital Markets 17 3.98 3,788 1 - - 3.98Industrial & Commercial Bank of China Ltd 18 3.51 3,341 3 26 1.52 1.99Barclays PLC 19 3.32 3,166 6 18 3.5 -0.17Ernst & Young 20 2.6 2,479 5 13 11.56 -8.96
TOTAL 95,250 992
288,718
61,161
MKT SHR CHANGE
DEAL COUNT RANK
MKT SHR (%)
RANKMKT SHR
(%)
MKT SHR (%)
VOLUME USD (Mln)
DEAL COUNT RANK
MKT SHR (%) RANK
MKT SHR (%)
VOLUME USD (Mln)
FIRM
2015 2014MKT SHR CHANGE
341,965
FIRM
2015 2014MKT SHR CHANGE FIRM
2015
RANK
RANKMKT SHR
(%)VOLUME USD
(Mln)DEAL
COUNT
2014
13
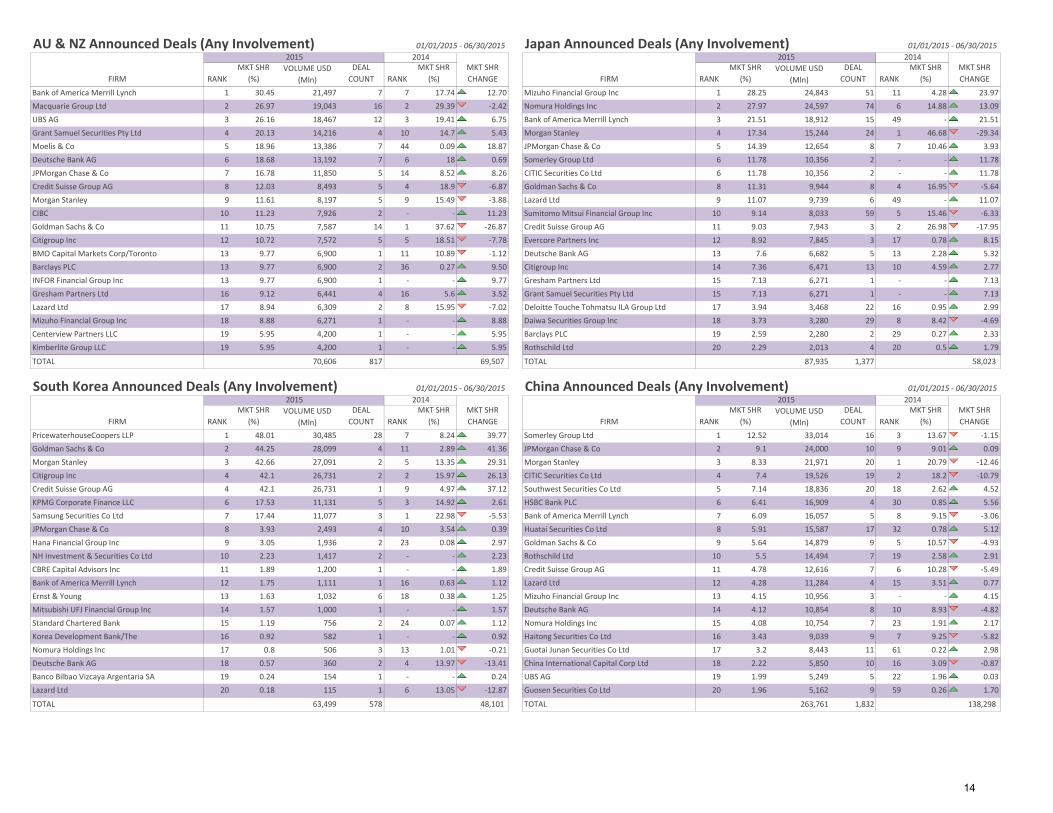
AU & NZ Announced Deals (Any Involvement) 01/01/2015 - 06/30/2015 Japan Announced Deals (Any Involvement) 01/01/2015 - 06/30/2015
Bank of America Merrill Lynch 1 30.45 21,497 7 7 17.74 12.70 Mizuho Financial Group Inc 1 28.25 24,843 51 11 4.28 23.97Macquarie Group Ltd 2 26.97 19,043 16 2 29.39 -2.42 Nomura Holdings Inc 2 27.97 24,597 74 6 14.88 13.09UBS AG 3 26.16 18,467 12 3 19.41 6.75 Bank of America Merrill Lynch 3 21.51 18,912 15 49 - 21.51Grant Samuel Securities Pty Ltd 4 20.13 14,216 4 10 14.7 5.43 Morgan Stanley 4 17.34 15,244 24 1 46.68 -29.34Moelis & Co 5 18.96 13,386 7 44 0.09 18.87 JPMorgan Chase & Co 5 14.39 12,654 8 7 10.46 3.93Deutsche Bank AG 6 18.68 13,192 7 6 18 0.69 Somerley Group Ltd 6 11.78 10,356 2 - - 11.78JPMorgan Chase & Co 7 16.78 11,850 5 14 8.52 8.26 CITIC Securities Co Ltd 6 11.78 10,356 2 - - 11.78Credit Suisse Group AG 8 12.03 8,493 5 4 18.9 -6.87 Goldman Sachs & Co 8 11.31 9,944 8 4 16.95 -5.64Morgan Stanley 9 11.61 8,197 5 9 15.49 -3.88 Lazard Ltd 9 11.07 9,739 6 49 - 11.07CIBC 10 11.23 7,926 2 - - 11.23 Sumitomo Mitsui Financial Group Inc 10 9.14 8,033 59 5 15.46 -6.33Goldman Sachs & Co 11 10.75 7,587 14 1 37.62 -26.87 Credit Suisse Group AG 11 9.03 7,943 3 2 26.98 -17.95Citigroup Inc 12 10.72 7,572 5 5 18.51 -7.78 Evercore Partners Inc 12 8.92 7,845 3 17 0.78 8.15BMO Capital Markets Corp/Toronto 13 9.77 6,900 1 11 10.89 -1.12 Deutsche Bank AG 13 7.6 6,682 5 13 2.28 5.32Barclays PLC 13 9.77 6,900 2 36 0.27 9.50 Citigroup Inc 14 7.36 6,471 13 10 4.59 2.77INFOR Financial Group Inc 13 9.77 6,900 1 - - 9.77 Gresham Partners Ltd 15 7.13 6,271 1 - - 7.13Gresham Partners Ltd 16 9.12 6,441 4 16 5.6 3.52 Grant Samuel Securities Pty Ltd 15 7.13 6,271 1 - - 7.13Lazard Ltd 17 8.94 6,309 2 8 15.95 -7.02 Deloitte Touche Tohmatsu ILA Group Ltd 17 3.94 3,468 22 16 0.95 2.99Mizuho Financial Group Inc 18 8.88 6,271 1 - - 8.88 Daiwa Securities Group Inc 18 3.73 3,280 29 8 8.42 -4.69Centerview Partners LLC 19 5.95 4,200 1 - - 5.95 Barclays PLC 19 2.59 2,280 2 29 0.27 2.33Kimberlite Group LLC 19 5.95 4,200 1 - - 5.95 Rothschild Ltd 20 2.29 2,013 4 20 0.5 1.79
TOTAL 70,606 817 TOTAL 87,935 1,377
South Korea Announced Deals (Any Involvement) 01/01/2015 - 06/30/2015 China Announced Deals (Any Involvement) 01/01/2015 - 06/30/2015
PricewaterhouseCoopers LLP 1 48.01 30,485 28 7 8.24 39.77 Somerley Group Ltd 1 12.52 33,014 16 3 13.67 -1.15Goldman Sachs & Co 2 44.25 28,099 4 11 2.89 41.36 JPMorgan Chase & Co 2 9.1 24,000 10 9 9.01 0.09Morgan Stanley 3 42.66 27,091 2 5 13.35 29.31 Morgan Stanley 3 8.33 21,971 20 1 20.79 -12.46Citigroup Inc 4 42.1 26,731 2 2 15.97 26.13 CITIC Securities Co Ltd 4 7.4 19,526 19 2 18.2 -10.79Credit Suisse Group AG 4 42.1 26,731 1 9 4.97 37.12 Southwest Securities Co Ltd 5 7.14 18,836 20 18 2.62 4.52KPMG Corporate Finance LLC 6 17.53 11,131 5 3 14.92 2.61 HSBC Bank PLC 6 6.41 16,909 4 30 0.85 5.56Samsung Securities Co Ltd 7 17.44 11,077 3 1 22.98 -5.53 Bank of America Merrill Lynch 7 6.09 16,057 5 8 9.15 -3.06JPMorgan Chase & Co 8 3.93 2,493 4 10 3.54 0.39 Huatai Securities Co Ltd 8 5.91 15,587 17 32 0.78 5.12Hana Financial Group Inc 9 3.05 1,936 2 23 0.08 2.97 Goldman Sachs & Co 9 5.64 14,879 9 5 10.57 -4.93NH Investment & Securities Co Ltd 10 2.23 1,417 2 - - 2.23 Rothschild Ltd 10 5.5 14,494 7 19 2.58 2.91CBRE Capital Advisors Inc 11 1.89 1,200 1 - - 1.89 Credit Suisse Group AG 11 4.78 12,616 7 6 10.28 -5.49Bank of America Merrill Lynch 12 1.75 1,111 1 16 0.63 1.12 Lazard Ltd 12 4.28 11,284 4 15 3.51 0.77Ernst & Young 13 1.63 1,032 6 18 0.38 1.25 Mizuho Financial Group Inc 13 4.15 10,956 3 - - 4.15Mitsubishi UFJ Financial Group Inc 14 1.57 1,000 1 - - 1.57 Deutsche Bank AG 14 4.12 10,854 8 10 8.93 -4.82Standard Chartered Bank 15 1.19 756 2 24 0.07 1.12 Nomura Holdings Inc 15 4.08 10,754 7 23 1.91 2.17Korea Development Bank/The 16 0.92 582 1 - - 0.92 Haitong Securities Co Ltd 16 3.43 9,039 9 7 9.25 -5.82Nomura Holdings Inc 17 0.8 506 3 13 1.01 -0.21 Guotai Junan Securities Co Ltd 17 3.2 8,443 11 61 0.22 2.98Deutsche Bank AG 18 0.57 360 2 4 13.97 -13.41 China International Capital Corp Ltd 18 2.22 5,850 10 16 3.09 -0.87Banco Bilbao Vizcaya Argentaria SA 19 0.24 154 1 - - 0.24 UBS AG 19 1.99 5,249 5 22 1.96 0.03Lazard Ltd 20 0.18 115 1 6 13.05 -12.87 Guosen Securities Co Ltd 20 1.96 5,162 9 59 0.26 1.70
TOTAL 63,499 578 TOTAL 263,761 1,832
69,507 58,023
FIRM
2015 2014MKT SHR CHANGE FIRM
2015 2014MKT SHR CHANGERANK
MKT SHR (%)
VOLUME USD (Mln)
DEAL COUNT RANK
MKT SHR (%) RANK
MKT SHR (%)
VOLUME USD (Mln)
DEAL COUNT RANK
MKT SHR (%)
48,101 138,298
FIRM
2015 2014MKT SHR CHANGE FIRM
2015 2014MKT SHR CHANGERANK
MKT SHR (%)
VOLUME USD (Mln)
DEAL COUNT RANK
MKT SHR (%) RANK
MKT SHR (%)
VOLUME USD (Mln)
DEAL COUNT RANK
MKT SHR (%)
14

Hong Kong Announced Deals (Any Involvement) 01/01/2015 - 06/30/2015 Taiwan Announced Deals (Any Involvement) 01/01/2015 - 06/30/2015
HSBC Bank PLC 1 52.26 62,783 6 8 11.87 40.39 Morgan Stanley 1 31.98 2,606 5 - - 31.98Somerley Group Ltd 2 37.52 45,078 23 13 9.06 28.46 PricewaterhouseCoopers LLP 2 13.66 1,113 3 8 4.16 9.50Goldman Sachs & Co 3 36.68 44,065 6 1 38.84 -2.17 CBRE Capital Advisors Inc 3 11.08 903 1 - - 11.08Anglo Chinese Corporate Finance 4 35.89 43,120 2 82 - 35.89 Stifel Financial Corp 4 6.29 512 1 11 0.97 5.32Moelis & Co 5 16.15 19,405 2 - - 16.15 Rothschild Ltd 5 5.04 411 1 - - 5.04UBS AG 6 13.44 16,152 3 17 6.94 6.51 Goldman Sachs & Co 5 5.04 411 1 6 6.54 -1.50Morgan Stanley 7 8.92 10,718 7 6 18.82 -9.90 Credit Suisse Group AG 7 3.42 279 1 17 - 3.42Deutsche Bank AG 8 3.86 4,640 2 5 21.13 -17.27 JPMorgan Chase & Co 8 1.82 149 1 - - 1.82Bank of America Merrill Lynch 9 3.86 4,634 2 3 27.71 -23.86 Lazard Ltd 9 1.23 100 1 - - 1.23Rothschild Ltd 10 3.49 4,199 2 31 0.84 2.65 Optima Capital Ltd 10 0.94 77 1 - - 0.94Macquarie Group Ltd 11 3.15 3,788 1 83 - 3.15 Asia Capital PLC/Sri Lanka 10 0.94 77 1 - - 0.94RBC Capital Markets 11 3.15 3,788 1 34 0.68 2.47 Somerley Group Ltd 10 0.94 77 1 15 0.22 0.72Citigroup Inc 11 3.15 3,788 2 2 37.49 -34.34 Yuanta Securities Co Ltd 13 0.8 65 2 1 34.79 -33.99JPMorgan Chase & Co 14 3.09 3,712 7 4 22.47 -19.38 KGI Securities Co Ltd 14 0.63 51 2 2 16.48 -15.86Credit Suisse Group AG 15 3 3,603 4 7 16.22 -13.23 CTBC Financial Holding Co Ltd 15 0.38 31 1 13 0.46 -0.09CITIC Securities Co Ltd 16 0.96 1,155 4 9 10.24 -9.28 Kingston Financial Group Ltd 16 0.24 20 2 - - 0.24Standard Chartered Bank 17 0.92 1,104 3 29 0.88 0.04 REORIENT Financial Markets Ltd 16 0.24 20 2 - - 0.24Goldin Financial Holdings Ltd 18 0.72 862 1 63 0.09 0.62 SAC Capital Private Ltd 18 0.22 18 1 - - 0.22Kingston Financial Group Ltd 19 0.7 847 16 38 0.42 0.28 Generational Equity 19 - - 1 - - -China Galaxy Securities Co Ltd 20 0.47 565 4 21 1.99 -1.52
TOTAL 120,144 696 TOTAL 8,151 114
SE Asia Announced Deals (Any Involvement) 01/01/2015 - 06/30/2015 India Announced Deals (Any Involvement) 01/01/2015 - 06/30/2015
Bank of America Merrill Lynch 1 57.47 50,200 6 4 19.8 37.66 JM Financial Ltd 1 59.94 22,818 8 4 18.87 41.07JPMorgan Chase & Co 2 53.64 46,857 9 9 11.67 41.97 Axis Bank Ltd 2 49.18 18,721 6 33 0.26 48.92Credit Suisse Group AG 3 44.34 38,732 9 3 21.37 22.97 Macquarie Group Ltd 3 48.56 18,488 2 13 5.55 43.02Citigroup Inc 4 43.59 38,079 7 7 11.94 31.65 Citigroup Inc 4 14.67 5,583 5 1 37.15 -22.49Deutsche Bank AG 5 39.02 34,086 2 5 13.18 25.84 Bank of America Merrill Lynch 5 11.91 4,535 3 2 21.3 -9.38Barclays PLC 6 36.08 31,517 7 36 0.82 35.26 Morgan Stanley 6 9.07 3,454 3 16 3.94 5.13Evercore Partners Inc 7 35.09 30,656 4 33 1.01 34.08 Walker Chandiok & Co 7 6.63 2,524 2 - - 6.63Nomura Holdings Inc 8 13.43 11,732 4 15 7.11 6.32 JPMorgan Chase & Co 8 6.34 2,415 3 17 3.57 2.78Mizuho Financial Group Inc 9 11.86 10,356 2 64 0.09 11.77 PricewaterhouseCoopers LLP 9 6.33 2,410 5 44 0.01 6.32Somerley Group Ltd 9 11.86 10,356 2 16 6.49 5.37 Lazard Ltd 10 6.11 2,325 2 49 - 6.11CITIC Securities Co Ltd 9 11.86 10,356 2 53 0.26 11.59 Tudor Pickering Holt & Co 11 5.65 2,150 1 - - 5.65Morgan Stanley 12 7.41 6,470 5 11 11.1 -3.69 Standard Chartered Bank 12 4.31 1,641 2 12 6.56 -2.25UBS AG 13 7.24 6,329 3 18 3.81 3.44 Deutsche Bank AG 13 3.31 1,258 2 27 0.81 2.50HSBC Bank PLC 14 6.97 6,084 7 13 8.53 -1.56 Arpwood Capital Pvt Ltd 14 2.99 1,138 1 - - 2.99GMP Securities LP 15 6.6 5,768 2 - - 6.60 Goldman Sachs & Co 15 2.19 833 3 5 18.23 -16.04Moelis & Co 16 4.9 4,280 2 43 0.57 4.33 Centerview Partners LLC 16 1.97 750 1 - - 1.97Goldman Sachs & Co 17 3.02 2,642 8 2 21.38 -18.36 Credit Suisse Group AG 16 1.97 750 1 19 2.26 -0.29DBS Group Holdings Ltd 18 2.97 2,590 3 1 22.89 -19.93 Avendus Capital Pvt Ltd 18 1.73 659 14 25 1 0.73KPMG Corporate Finance LLC 19 2.55 2,225 2 10 11.45 -8.90 Ernst & Young 19 1.42 540 13 14 4.59 -3.17CIMB 20 1.45 1,267 10 19 3.56 -2.11 KPMG Corporate Finance LLC 20 0.96 367 7 21 1.73 -0.76
TOTAL 87,354 984 TOTAL 38,068 738
69,018 7,552
74,467 22,611
MKT SHR CHANGE
DEAL COUNT
FIRM
2015 2014MKT SHR CHANGE FIRM
2015 2014MKT SHR CHANGERANK
MKT SHR (%)
VOLUME USD (Mln)
DEAL COUNT RANK
MKT SHR (%) RANK
MKT SHR (%)
VOLUME USD (Mln)
DEAL COUNT RANK
MKT SHR (%)
RANKMKT SHR
(%)VOLUME USD
(Mln)DEAL
COUNT RANKMKT SHR
(%) RANKMKT SHR
(%)VOLUME USD
(Mln) RANKMKT SHR
(%)FIRM
2015 2014MKT SHR CHANGE FIRM
2015 2014
15

Bloomberg League Criteria
Announced Global League Tables are based upon announced total values, unless otherwise stated in the title. Non-US dollar values are converted to US dollars at the time of announcement.
Credit will be given to transactions in which Bloomberg classifies as mergers, acquisitions, divestitures, self-tenders, or spin-offs.
Regional and industry League Tables will be based on the country of risk and industry of the ultimate publicly traded parent of a privately held company where applicable.
Advisors to any member of an investor group, consortium, or joint venture are eligible for full credit.
Advisory fees hold no weight over advisory credit.
General Database Criteria
A transaction is considered to have been announced upon the release of terms offered by the acquirer, and acknowledgement of the offer by the target company.
Deals that are considered to be in proposed status will not be granted credit.
Full versions of Bloomberg’s League Tables Standards & Guidelines can be accessed on Bloomberg Professional:
{LPHP MA:0:1 2841628<GO>}.
Bloomberg L.P. reserves the right of final decision concerning league eligibility and requires adequate documentation for the same. Bloomberg L.P. and its suppliers believe the information herein was obtained from reliable sources, but they do not guarantee its accuracy. Neither the information nor the opinion expressed constitutes a solicitation of the purchase or sale of securities or commodities. Due to the dynamic nature of the Professional Service product, League Table rankings may vary between the quarterly/year-end publications and data found on the Bloomberg Professional Service.
16