Embed Size (px)
Citation preview
Global J. Environ. Sci. Manage. 6(SI): 65-84, Autumn 2020
*Corresponding Author:Email: [email protected]: +886-4-2332-3000 Fax: +886-4-2374-2337
Global Journal of Environmental Science and Management (GJESM)
Homepage: https://www.gjesm.net/
SPECIAL ISSUE: COVID-19CASE STUDY
Impact of COVID-19 large scale restriction on environment and economy in IndonesiaR.E. Caraka1,2,7, Y. Lee2, R. Kurniawan3, R. Herliansyah4, P.A. Kaban3, B.I. Nasution3, P.U. Gio5, R.C. Chen1,*, T. Toharudin6, B. Pardamean7,8
1Department of Information Management, College of Informatics, Chaoyang University of Technology, Taichung City, Taiwan2Department of Statistics, College of Natural Science, Seoul National University 56-1 Mountain, Sillim-dong, Gwanak-gu, Seoul metrópolis, Korea3Polytechnic Statistics, DKI Jakarta, Indonesia4Department of Mathematics, Kalimantan Institute of Technology, Kalimantan Timur, Indonesia5Department of Mathematics, Universitas Sumatera Utara, North Sumatera, Indonesia6Department of Statistics, Padjadjaran University, West Java, Indonesia7Bioinformatics and Data Science Research Center, Bina Nusantara University, DKI Jakarta, Indonesia 8Computer Science Department, BINUS Graduate Program Master of Computer Science Bina Nusantara University, DKI Jakarta, Indonesia
COVID-19 has a severe and widespread impact, especially in Indonesia. COVID-19 was first reported in Indonesia on March 03, 2020 then rapidly spread to all 34 provinces by April 09, 2020. Since then, COVID-19 is declared a state of national disaster and health emergency. This research analyzes the difference of CO, HCHO, NO2, and SO2 density in Jakarta, West Java, Central Java, and South Sulawesi before and during the pandemic. Also, this study assesses the effect of large scale restrictions on the economic growth during COVID-19 pandemic in Indonesia. In a nutshell, the results on Wilcoxon and Fisher test by significance level α=5% as well as odds ratio showed that there are significant differences of CO density in all regions with highest odds ratio in East Java (OR=9.07), significant differences of HCHO density in DKI Jakarta, East Java, and South Sulawesi. There are significant differences of NO2 density before and during public activities limitation in DKI Jakarta, West Java, East Java, and South Sulawesi. However, the results show that there are no significant differences of SO2 density in all regions. In addition, this research shows that there are significant differences of retail, grocery and pharmacy, and residental mobility before and during the COVID-19 pandemic in Indonesia. This research also shows that during the COVID-19 pandemic there are severe economic losses, industry, companies, and real disruptions are severe for all levels of life due to large scale restrictions.
©2020 GJESM. All rights reserved.
ARTICLE INFO
Article History:Received 02 April 2020Revised 25 May 2020Accepted 02 June 2020
Keywords:Coronavirus disease (COVID-19)EconomyEnvironmentIndonesiaOdds ratioWilcoxon
ABSTRAC T
DOI: 10.22034/GJESM.2019.06.SI.07
NUMBER OF REFERENCES
48NUMBER OF FIGURES
10NUMBER OF TABLES
5
Note: Discussion period for this manuscript open until January 1, 2021 on GJESM website at the “Show Article.
66
R.E. Caraka et al.
INTRODUCTION
Disaster risk assessment is intended to provide more detailed and precise information about the possibility of the object affected and the risks faced. By knowing all of that, the agency responsible for disaster management can make efforts for better disaster management and more efficient planning and preparedness steps. Disaster management is a set of policies and administrative decisions and operational activities related to various stages of all levels of disaster. A broader definition of human-created disasters recognizes that human activity causes all disasters because humans have chosen to be in natural phenomena that cause adverse effects on humans. Disasters can be seen as a series of phases of a time continum. Identifying and understanding these phases’ helps to describe the needs associated with disasters and conceptualize adequate disaster management activities (Djalente et al., 2020) Reducing the number of fatalities and material losses can be achieved, among others, by increasing the community’s preparedness in facing disasters. Preparedness causes the community to act quickly and appropriately in saving themselves and their assets from the impact of the disaster that occurs. Preparedness is one of the essential elements of disaster risk reduction activities that are pro-active before a disaster occurs. Preparedness of a community is not always separated from aspects such as emergency response, recovery, reconstruction, and mitigation. Various pre-disaster preparation steps are needed to ensure the achievement of a certain level of preparedness. The implementation of emergency response activities and post-disaster recovery can indicate the effectiveness of community preparedness. Disaster mitigation can be used as a basis or guide in development planning and increase community knowledge in dealing with and reducing the impact of disasters so that people can live and work safely. In principle, mitigation must be carried out for all types of disasters, including natural disasters and natural disasters caused by human intervention and should be routine and sustainable activities. However, the term mitigation in climate change terminology differently in disaster terminology (Caraka et al., 2020). Mitigation in the terminology of disasters is defined as an effort made to reduce impacts and risks both by nature and humans. The term mitigation in the terminology of disasters
includes adaptation. Orders are also responsible for equipping people with knowledge that is more environmentally friendly and disaster response (Kaban et al., 2019). Thus, the community will become better aware of how to respond and deal with disasters at any time. Besides that, for the community that utilizes natural resources to support economic activities or private sector users to be more prudent in utilizing the availability of the environment for economic activities, also pay more attention to environmental aspects that are balanced and well maintained. In addition to taking such preventive measures, post-disaster revitalization measures must also be taken of physical structures (damaged buildings, injuries, and other forms of physical material), social, psychological, and economic aspects (Kurniawan et al., 2018). Because of that, disaster mitigation also requires preparedness aspects of the community. Previously, diseases as national disasters such as the Post-earthquake Zika virus Ecuador (Reina Ortiz et al., 2017), Chikungunya in India (Bhowmik, et al., 2010), Neisseria gonorrhoeae (Whiley et al., 2012), Ebola virus (Siddle, et al., 2016). Disasters triggered by natural hazards can strike at that moment, with devastating consequences for humans, infrastructure, assets, and the whole economy. Moreover, a pandemic coronavirus (COVID-19) falls into this category. Beyond its enormous health impact, there are significant economic losses for households, companies and governments as well as a massive disruption to life and livelihoods as a result of locking, supply chain disruptions, and a sharp decline in commercial activity. The recommendations for physical distancing issued by the Indonesian government kept people at home and did not go out to do their usual activities. So that indirectly has a significant impact on environmental changes during the lockdown. In line with this, The President of the Republic of Indonesia established COVID-19 as a National Disaster. ASEAN has actively reconvened and utilised its existing health regional mechanism to try to have a coherent response to the impacts (Djalante et al., 2012). Therefore, (Djalante et al., 2020) recommend the knowledge and science provision in understanding disaster and health-related emergency risks and DRR in COVID-19. Table 1 represents the travel advisory in ASEAN. The Indonesian government has three times determined the status of a national disaster, before the COVID-19 outbreak. Although
67
Global J. Environ. Sci. Manage., 6(SI): 65-84, Autumn 2020
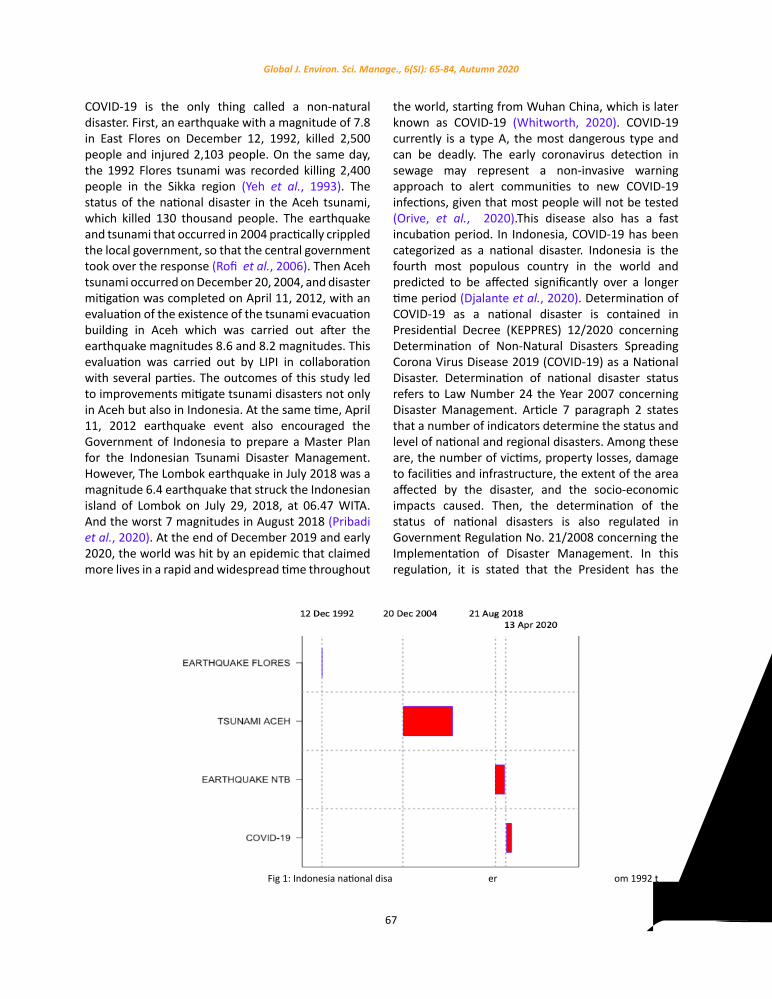
COVID-19 is the only thing called a non-natural disaster. First, an earthquake with a magnitude of 7.8 in East Flores on December 12, 1992, killed 2,500 people and injured 2,103 people. On the same day, the 1992 Flores tsunami was recorded killing 2,400 people in the Sikka region (Yeh et al., 1993). The status of the national disaster in the Aceh tsunami, which killed 130 thousand people. The earthquake and tsunami that occurred in 2004 practically crippled the local government, so that the central government took over the response (Rofi et al., 2006). Then Aceh tsunami occurred on December 20, 2004, and disaster mitigation was completed on April 11, 2012, with an evaluation of the existence of the tsunami evacuation building in Aceh which was carried out after the earthquake magnitudes 8.6 and 8.2 magnitudes. This evaluation was carried out by LIPI in collaboration with several parties. The outcomes of this study led to improvements mitigate tsunami disasters not only in Aceh but also in Indonesia. At the same time, April 11, 2012 earthquake event also encouraged the Government of Indonesia to prepare a Master Plan for the Indonesian Tsunami Disaster Management. However, The Lombok earthquake in July 2018 was a magnitude 6.4 earthquake that struck the Indonesian island of Lombok on July 29, 2018, at 06.47 WITA. And the worst 7 magnitudes in August 2018 (Pribadi et al., 2020). At the end of December 2019 and early 2020, the world was hit by an epidemic that claimed more lives in a rapid and widespread time throughout
the world, starting from Wuhan China, which is later known as COVID-19 (Whitworth, 2020). COVID-19 currently is a type A, the most dangerous type and can be deadly. The early coronavirus detection in sewage may represent a non-invasive warning approach to alert communities to new COVID-19 infections, given that most people will not be tested (Orive, et al., 2020).This disease also has a fast incubation period. In Indonesia, COVID-19 has been categorized as a national disaster. Indonesia is the fourth most populous country in the world and predicted to be affected significantly over a longer time period (Djalante et al., 2020). Determination of COVID-19 as a national disaster is contained in Presidential Decree (KEPPRES) 12/2020 concerning Determination of Non-Natural Disasters Spreading Corona Virus Disease 2019 (COVID-19) as a National Disaster. Determination of national disaster status refers to Law Number 24 the Year 2007 concerning Disaster Management. Article 7 paragraph 2 states that a number of indicators determine the status and level of national and regional disasters. Among these are, the number of victims, property losses, damage to facilities and infrastructure, the extent of the area affected by the disaster, and the socio-economic impacts caused. Then, the determination of the status of national disasters is also regulated in Government Regulation No. 21/2008 concerning the Implementation of Disaster Management. In this regulation, it is stated that the President has the
Fig 1: Indonesia national disasters from 1992 to 2020
Fig 1: Indonesia national disasters from 1992 to 2020
68
Impact of COVID-19 on environment and economy
authority to determine the status of national disasters. Then it is necessary to pay attention to the Government Regulation in Lieu of Acts to implement the provisions of Article 12 paragraph (21 Government Regulations in Lieu of Law Number I of 2020 concerning State Financial Policies and Financial System Stability for Handling the COVID-19 Pandemic and/or in the framework of Facing Threats that Endanger the National Economy and/or Financial System Stability, it is necessary to stipulate Presidential Regulation 54 of 2020 concerning Changes in Posture and Details of the State Budget for the 2020.
Whether realize it or not, lockdowns or large scale restriction regulations to prevent the spread of COVID-19 have an impact on the environment
and also the economy (Isafan., 2020). DTR and humidity might affect the mortality of COVID-19 in Wuhan, which deserves further investigation from a larger range of studying area (Ma et al., 2020). In India, PM2.5 had maximum reduction in most regions (Sharma et al., 2020). Also, The positive indirect effects revolve around the reduction of PM2.5 and NO2 concentrations in China, France, Germany, Spain, and Italy (Zambrano-Monserrate et al., 2020), Beside, AT parameter had a linear relationship with the number of people afflicted with COVID-19 in different provinces of Iran and that the transmission rate of coronavirus did not have a high sensibility to it (Jahangiri et al., 2020). Temperatures above 8 to 10 °C were associated with decreased COVID-19 daily confirmed cases rate (Shi et al., 2020).
Table 1: Travel advisory ASEAN briefing
Country Notes Brunei
▪ Citizens and foreign residents in the country are banned from leaving the nation. The number of cases has risen to 50.
ambodia
▪ Cambodia has announced a ban on the entry of foreigners from Italy, Germany, Spain, France and the US for 30 days. ▪ Cambodia has ordered the closure of schools in the capital, Phnom Penh, and the popular tourist destination of Siem Reap.
Indonesia
▪ Indonesia will temporarily ban domestic air and sea travel beginning Friday until early June to stop non-essential travel during the month of Ramadan. ▪ The Governor of Jakarta has said that the current large scale restriction policy in the city is likely to be extended.
Laos
▪ The government has closed all international checkpoints to stop passengers from exiting and entering the country. The country has confirmed eight cases of COVID-19. ▪ The US government has provided personal protective equipment to Laos which included 440 protective goggles, 1,500 surgical gowns, and 220 face shields, along with biohazard disposal bags, aprons, N95 face masks, safety boxes, gloves, and hand sanitizer supplies.
Malaysia ▪ The country has extended the restriction on movement and travel for a further two weeks until April 28. Myanmar
▪ Myanmar will release 25,000 prisoners amid coronavirus fears
Philippines
▪ The President has extended the lockdown of Metro Manila to May 15.
Singapore
▪ The Prime Minister has extended the lockdown measures until June 1 after the city-state saw a sharp rise in cases. ▪ The government has now made wearing a mask compulsory for anyone going outside. Anyone found without a mask will be fined 300 Singapore dollars (US$212), while repeat offenders could be prosecuted in court and face higher fines.
Thailand
▪ Thailand has extended a ban on incoming passenger flights until the end of the April. ▪ Thailand has announced an indefinite, nationwide curfew starting on Friday. Residents will not be allowed to leave their premises between 10 p.m. and 4 a.m.
Vietnam
▪ Vietnam ended the social isolation guidelines at the end of April 22, though restrictions will continue in some high-risk areas. While the social isolation guidelines in Hanoi and Ho Chi Minh City have also been lifted, some restrictions continue to remain for bars, clubs, spas, theatres, sports centres, and others while the gathering of more than 20 people is prohibited. Restaurants and eateries that operate must comply with strict guidelines from local authorities. ▪ Taxis, buses, Grab services and inter-provincial transport have also resumed though with restrictions as per the transport authorities. ▪ Honda Vietnam announced that it would resume automobile and bike production from April 23.
Table 1: Travel advisory ASEAN briefing
69
Global J. Environ. Sci. Manage., 6(SI): 65-84, Autumn 2020
During COVID-19 pandemic in Turkey, daily temperature has the highest correlation with the number of cases. In other words, the lower the temperature on a day, the higher is the number of COVID-19 cases on that day (Şahin, 2020). Also, temperature average (°C) was significantly correlated with COVID-19 in DKI Jakarta (Tosepu et al., 2020). There are reductions in PM10, SO2, and NO2 concentrations during the COVID-19 in Salé City (Morocco) (Otmani et al., 2020). Related to the lockdown policy, it will also have an impact on the economic side (Baldwin et al., 2020). Assessing the economic impact of the COVID-19 pandemic is essential for policymaker. Poverty kills poor people, but the outbreak of COVID-19 shows that if diseases are generated in poor countries due to overcrowding, poor public health and interaction with wild animals, these diseases can kill people of any socioeconomic group in any society (McKibbin et al., 2020). Therefore, (Guerrieri et al., 2020) suggest the optimal policy to face a pandemic. Their suggestion is a model which combines monetary policy loosening and abundant social insurance. Regarding the stock price (Toda, 2020) predicts that the stock price decreases by 50% during the epidemic, but recovers quickly afterwards because the epidemic is a short-lived labour supply shock. To accelerate recovery and minimize the impact of COVID-19 in Indonesia. The Government of Indonesia established the Coronavirus Disease Mitigation Acceleration Task Force by involving ministries, institutions and other government units such as the Ministry of Health, the Indonesian National Police, the Indonesian National Armed Forces, and regional governments. This research aims to analyze the environmental and economic changes due to the COVID-19 pandemic in Indonesia. The environmental change is examined from the condition of pollutant components of CO, HCHO, NO2, and SO2 from January 01 to April 30, 2020. The time period covers the phases before and during the COVID-19 pandemic in Indonesia. In order to narrow the focus of the study, the study area of this research is five provinces with the most confirmed COVID-19 cases (DKI Jakarta, West Java, East Java, Sentral Java, and South Sulawesi).
MATERIALS AND METHODS
Study areaAfter the first confirmed case was found in DKI
Jakarta, within short period of time the capital of Indonesia became the COVID-19 epicenter.
Population density, mobility and rapid aconomic activites are the factors in increasing the cases. The inter-census population survey, projects the population of DKI Jakarta in 2020 to increase by 72 thousand to 10.57 million. West Java is geographically bordering with DKI Jakarta, several areas of West Java become satellite cities that support economic activities in DKI Jakarta. East Java is the province with the second largest gross regional domestic product in Indonesia after DKI Jakarta with Rp2.352.42 trillion (2019) with the manufacturing sector as the largest GRDP contributor (30.24%). Central Java is located in the middle of Java Island, bordering with West Java and East Java. The three provinces in Java Island dominate around 46% of the total population in Indonesia. West Java with 49.570.000 population, East Java with 39.960.000 population, and Central Java with 34.740.000 population. South Sulawesi is a province on the Sulawesi Island, Indonesia with a total of 8.928.004 population.
Data collectionIn this study, the differences of CO, HCHO, NO2,
and SO2 densities was measure in the five study areas. Then, Sentinel-5P used to get the data which accesed and extracted using Google Earth Engine. The Copernicus Sentinel-5 Precursor (Sentinel-5P) mission dedicated to perform atmospheric measurements with high spatio-temporal resolution, to be used for air quality, ozone & UV radiation, and climate monitoring & forecasting. The mission consists of one satellite carrying the TROPOspheric Monitoring Instrument (TROPOMI) instrument (European Space Agency, 2020). Google Earth Engine is a platform that can be used to access and analyze geospatial datasets on a large scale (Gorelick et al., 2017). Then, employ the python API to make requests to the Earth Engine servers. The data collected is daily average of pollutant density during period the January 1 to April 30, therefore there are missing values. Also, Impute the missing values using interpolation techniques with R (R Core Team, 2008) and imputeTS package (Moritz et al., 2017). After the data series is complete, the data is labelled and splitted into two categories with the date of the first confirmed case in Indonesia (March 2, 2020) as cut off: data until the first confirmed case and data after the first confirmed case. Table 3 represents more clearly. Regarding the mobility analysis, the data used
70
R.E. Caraka et al.
are from Apple and Google mobility report. In April, Google published mobility reports of every country, including Indonesia, which contains aggregated and anonymized mobility trend data from March to April 2020. (Aktay et al., 2020) provide a full explanation of the data anonymization process. Similarly, Apple also published its anonymized mobility data, yet no documentation is given to explain the of data anonymization process.
Data analysisDue to the small size of the data, Wilcoxon test
with an alpha significance level 5%α = by using Eq. 1 is performed to test the differences. Wilcoxon can also be used to compare the mean values of a variable from two paired sample data.
1 0, 1, 2, ,
1 0i
ii
dW for i n
d>
= = …− <
1
.n
i ii
T r d W=
=∑ (1)
ir d Explains the ranking value of the difference
value id which is then absolute. iW Will be obtained for the Wilcoxon marked rank test. To find the average Wilcoxon ranking using Eq. 2.
( ) ( )14
n nE T
+=
( ) ( )( )1 2 1
24n n n
V T+ +
=
( )( )
T E TZ
V T
−=
(2)
Then, the significance level can be chosen from
1% -10% depending on the researcher. For a two-side test, H0 is accepted if 1 1
2 2
Z Z Zα α− < < . For the right side, reject H0 if 1 Z Z α−≥ . For the left side, reject H0 if 1 Z Z α−≤. The value of 1Z α−− and 1
2
Z α can be obtained from the standard Z normal distribution table (Caraka et al.,
2017). Then the associasion is measured using ODDS Ratio. In brief, Odds Ratio (OR) is the probability of an event occurring compared to the chance of an event not occurring (Pardamean et al., 2018; Kurniawan et al., 2019). The probability of an event is symbolized by π and Eq. 3 represents the ODDS.
1ODDS π
π=
−
( )1ODDS π π− = (3)
( )ODDS ODDSπ π= +
1ODDS
ODDSπ=
+
RESULTS AND DISCUSSION
Impact on density of CO, HCHO, NO2, and SO2densityIn this section, the analysis of COVID-19 impact
is performed in several regions in Indonesia where public activities limitation implemented. The density of CO, HCHO, NO2, and SO2 are measured, respectively. Air pollution is defined when there are substances in the air that significantly change the composition and composition of the air under normal conditions. The presence of these pollutants in the form of toxic gases and small particles is also called aerosols. Air polluted with particles and gases can cause health problems that vary with different level, and type, it depends on chemical composition. Determination of pollution or whether an area of air based on the parameters in Table 2.
Air pollution, both the spread and reaction of pollutants, is influenced by aspects of topography, geography and meteorology. In other words, the size of the environmental impact due to air pollution is closely related to the local weather and climate or related to the direction and speed of the wind, air temperature, humidity, rainfall, and solar radiation. Carbon dioxide (CO2) is one of the natural gases in the air(Caraka et al., 2019).. This gas has the characteristics
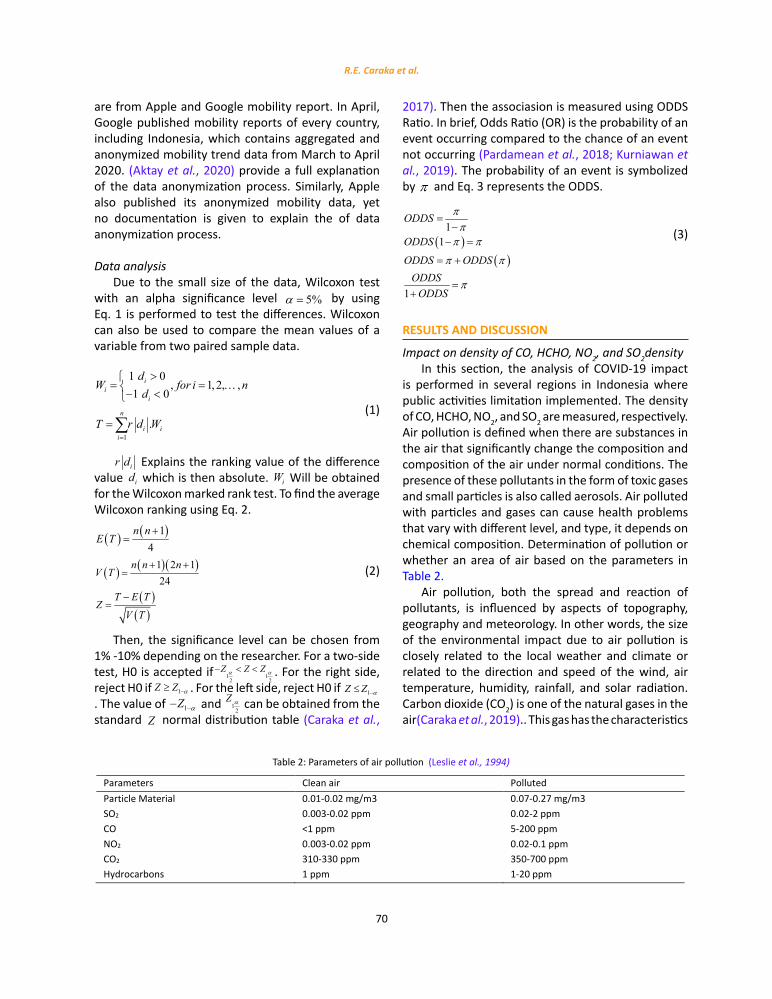
Table 2: Parameters of air pollution (Leslie et al., 1994)
Parameters Clean air Polluted Particle Material 0.01-0.02 mg/m3 0.07-0.27 mg/m3 SO2 0.003-0.02 ppm 0.02-2 ppm CO <1 ppm 5-200 ppm NO2 0.003-0.02 ppm 0.02-0.1 ppm CO2 310-330 ppm 350-700 ppm Hydrocarbons 1 ppm 1-20 ppm
Table 2: Parameters of air pollution (Leslie et al., 1994)
71
Global J. Environ. Sci. Manage., 6(SI): 65-84, Autumn 2020
of non-toxic and colourless. Some experts claim that CO2 is not a significant component of air pollution. However, based on the American Conference Limit Value (TLV), CO2 at a concentration of 30.000 ppm can cause low-level poisoning, increased heart rate and respiratory distress in humans, although it is difficult to find regions on earth with such concentrations.
CO2 also has the potential to affect humans at specific concentrations negatively. After the first COVID-19 case was announced in Indonesia, the government imposed a large-scale social limitation, and DKI Jakarta became the COVID-19 epicentre in Indonesia. The Indonesia large-scale social restrictions policies in each city are different; at this stage, we analyze
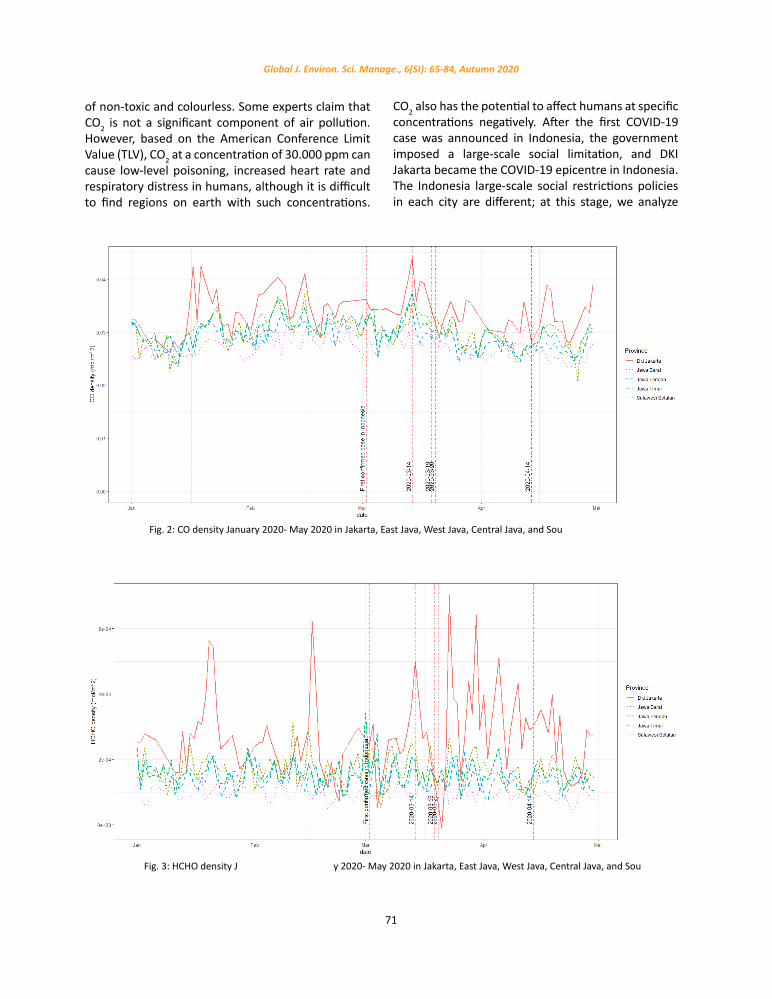
Fig. 2: CO density January 2020- May 2020 in Jakarta, East Java, West Java, Central Java, and South Sulawesi.
Fig. 2: CO density January 2020- May 2020 in Jakarta, East Java, West Java, Central Java, and South Sulawesi.
Fig. 3: HCHO density January 2020- May 2020 in Jakarta, East Java, West Java, Central Java, and South Sulawesi
Fig. 3: HCHO density January 2020- May 2020 in Jakarta, East Java, West Java, Central Java, and South Sulawesi
72
Impact of COVID-19 on environment and economy
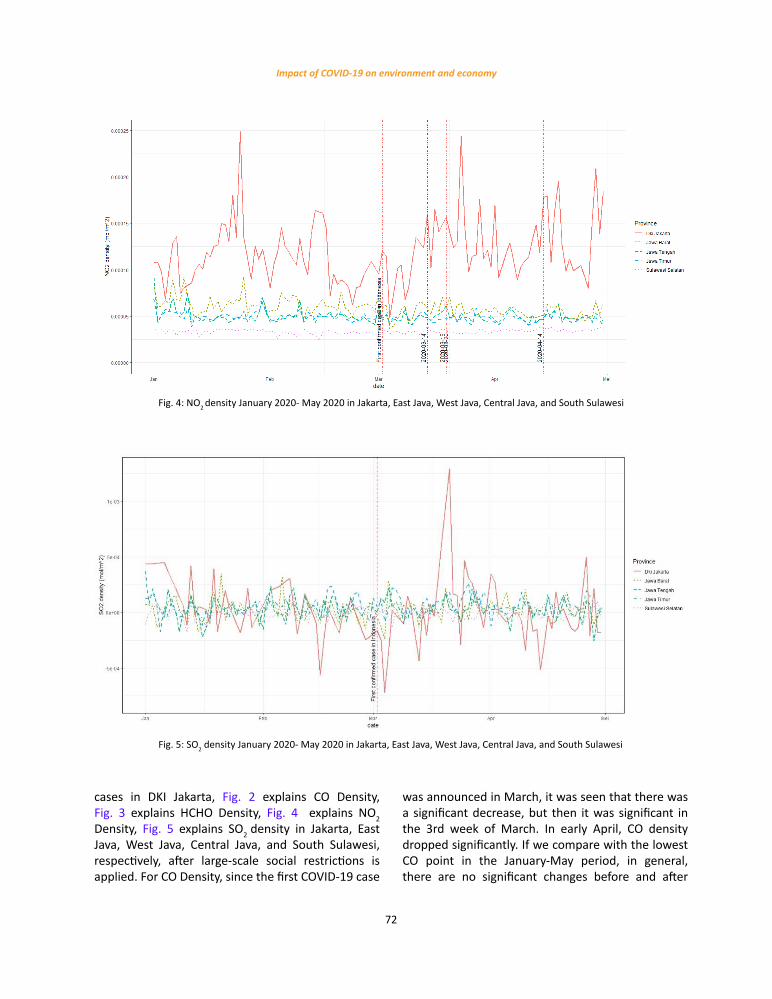
cases in DKI Jakarta, Fig. 2 explains CO Density, Fig. 3 explains HCHO Density, Fig. 4 explains NO2 Density, Fig. 5 explains SO2 density in Jakarta, East Java, West Java, Central Java, and South Sulawesi, respectively, after large-scale social restrictions is applied. For CO Density, since the first COVID-19 case
was announced in March, it was seen that there was a significant decrease, but then it was significant in the 3rd week of March. In early April, CO density dropped significantly. If we compare with the lowest CO point in the January-May period, in general, there are no significant changes before and after
Fig. 4: NO2 density January 2020- May 2020 in Jakarta, East Java, West Java, Central Java, and South Sulawesi
Fig. 4: NO2 density January 2020- May 2020 in Jakarta, East Java, West Java, Central Java, and South Sulawesi
Fig. 5: SO2 density January 2020- May 2020 in Jakarta, East Java, West Java, Central Java, and South Sulawesi
Fig. 5: SO2 density January 2020- May 2020 in Jakarta, East Java, West Java, Central Java, and South Sulawesi
73
Global J. Environ. Sci. Manage., 6(SI): 65-84, Autumn 2020
Indonesia large-scale social restrictions is applied. In other cases, HCHO, NO2, and SO2 also found no significant differences. However, HCHO can reach its lowest point in March, as well as NO2 and SO2. If we pay attention to the pattern of increase, then there is the same relationship in each variable. For example, if SO2 rises then HCHO, NCHO, CO, each also rises, and vice versa.
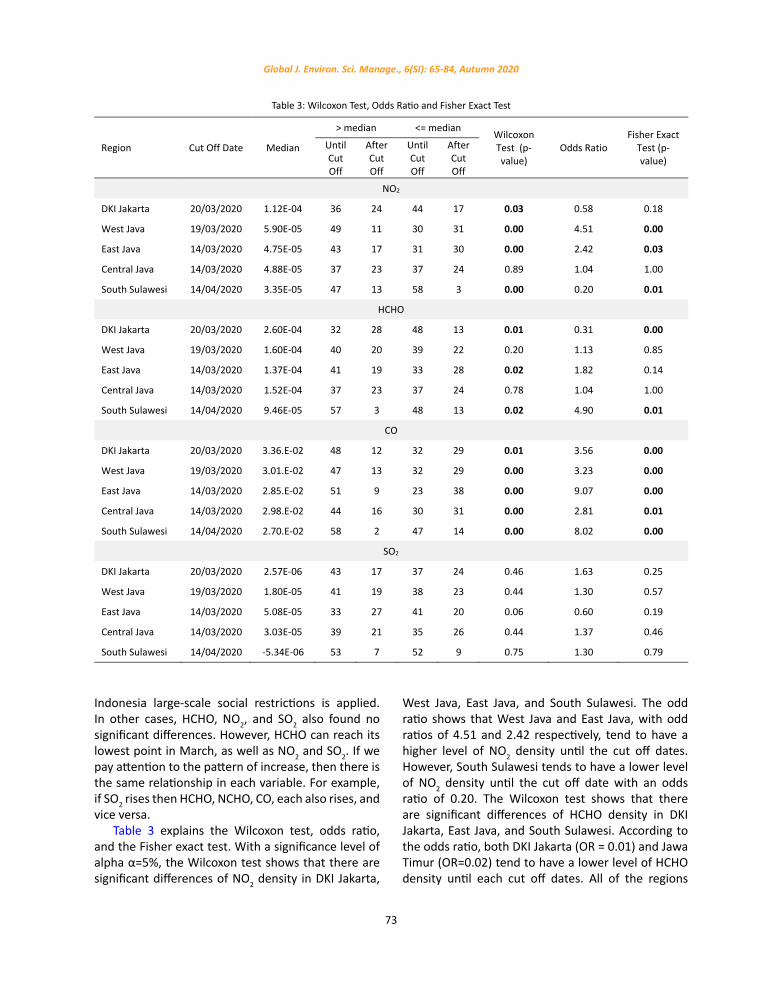
Table 3 explains the Wilcoxon test, odds ratio, and the Fisher exact test. With a significance level of alpha α=5%, the Wilcoxon test shows that there are significant differences of NO2 density in DKI Jakarta,
West Java, East Java, and South Sulawesi. The odd ratio shows that West Java and East Java, with odd ratios of 4.51 and 2.42 respectively, tend to have a higher level of NO2 density until the cut off dates. However, South Sulawesi tends to have a lower level of NO2 density until the cut off date with an odds ratio of 0.20. The Wilcoxon test shows that there are significant differences of HCHO density in DKI Jakarta, East Java, and South Sulawesi. According to the odds ratio, both DKI Jakarta (OR = 0.01) and Jawa Timur (OR=0.02) tend to have a lower level of HCHO density until each cut off dates. All of the regions
Table 3: Wilcoxon Test, Odds Ratio and Fisher Exact Test
Region Cut Off Date Median
> median <= median Wilcoxon Test (p-value)
Odds Ratio Fisher Exact
Test (p-value)
Until Cut Off
After Cut Off
Until Cut Off
After Cut Off
NO2
DKI Jakarta 20/03/2020 1.12E-04 36 24 44 17 0.03 0.58 0.18
West Java 19/03/2020 5.90E-05 49 11 30 31 0.00 4.51 0.00
East Java 14/03/2020 4.75E-05 43 17 31 30 0.00 2.42 0.03
Central Java 14/03/2020 4.88E-05 37 23 37 24 0.89 1.04 1.00
South Sulawesi 14/04/2020 3.35E-05 47 13 58 3 0.00 0.20 0.01
HCHO
DKI Jakarta 20/03/2020 2.60E-04 32 28 48 13 0.01 0.31 0.00
West Java 19/03/2020 1.60E-04 40 20 39 22 0.20 1.13 0.85
East Java 14/03/2020 1.37E-04 41 19 33 28 0.02 1.82 0.14
Central Java 14/03/2020 1.52E-04 37 23 37 24 0.78 1.04 1.00
South Sulawesi 14/04/2020 9.46E-05 57 3 48 13 0.02 4.90 0.01
CO
DKI Jakarta 20/03/2020 3.36.E-02 48 12 32 29 0.01 3.56 0.00
West Java 19/03/2020 3.01.E-02 47 13 32 29 0.00 3.23 0.00
East Java 14/03/2020 2.85.E-02 51 9 23 38 0.00 9.07 0.00
Central Java 14/03/2020 2.98.E-02 44 16 30 31 0.00 2.81 0.01
South Sulawesi 14/04/2020 2.70.E-02 58 2 47 14 0.00 8.02 0.00
SO2
DKI Jakarta 20/03/2020 2.57E-06 43 17 37 24 0.46 1.63 0.25
West Java 19/03/2020 1.80E-05 41 19 38 23 0.44 1.30 0.57
East Java 14/03/2020 5.08E-05 33 27 41 20 0.06 0.60 0.19
Central Java 14/03/2020 3.03E-05 39 21 35 26 0.44 1.37 0.46
South Sulawesi 14/04/2020 -5.34E-06 53 7 52 9 0.75 1.30 0.79
Table 3: Wilcoxon Test, Odds Ratio and Fisher Exact Test
74
R.E. Caraka et al.
A
B
A
B
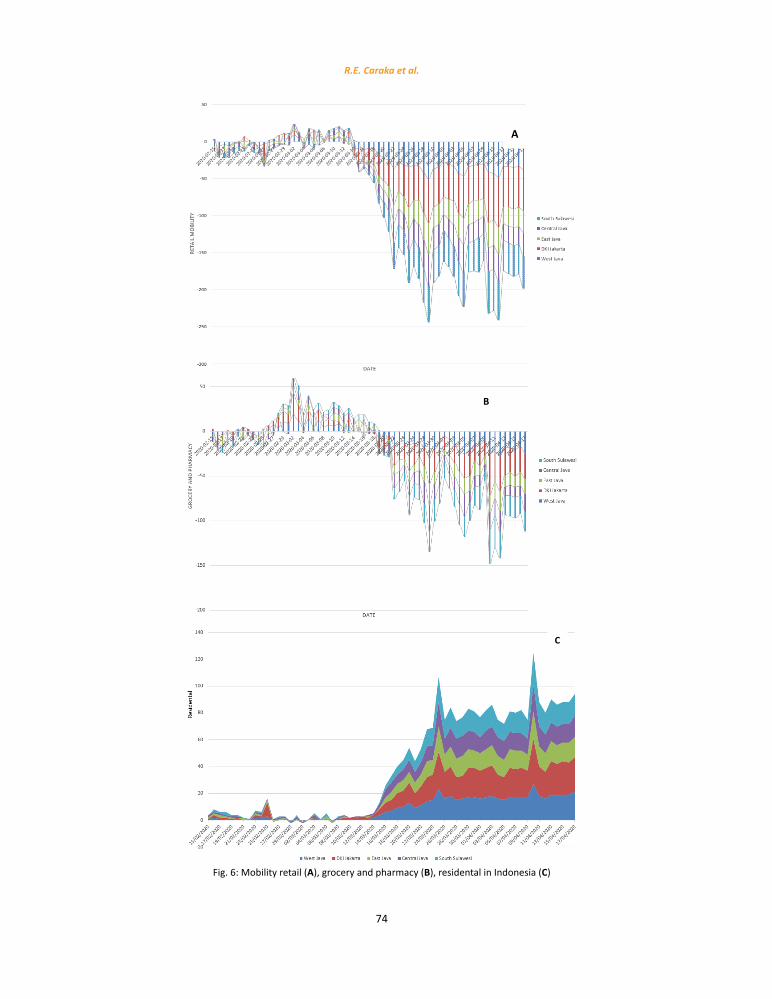
Fig. 6: Mobility retail (A), grocery and pharmacy (B), residental in Indonesia (C)
C
Fig. 6: Mobility retail (A), grocery and pharmacy (B), residental in Indonesia (C)
75
Global J. Environ. Sci. Manage., 6(SI): 65-84, Autumn 2020
have significant differences of CO density, concluded from the Wilcoxon test. All of the regions also have odd ratios> 1, showing that all of the observations tend to have a higher level of CO density until the cut off dates. In contrast, both the Wilcoxon test and odd ratio show that there are no significant differences of SO2 density nor any tendency in all of the regions before and after each cut off dates.The average ratio of formaldehyde concentrations in oxidants was 21.22%. Apart from oxidant and ozone gas, the formation of formaldehyde is also influenced by several meteorological factors such as sunlight intensity. According (Haagen-Smit, 1959) sunlight will help hydrocarbons to react with Nox to form ozone and formaldehyde through photochemical reactions. In other words, HC and NOx will react assisted by the high intensity of the Sun so that from March to April, it feels hot in Jakarta. Regarding the PM2.5 pollution (Caraka et al., 2019), the increase of only 1 𝜇g/m3 in PM2.5 is associated with an 8% increase in the COVID-19 death rate (95% confidence interval [CI]: 2%, 15%) (Wu et al., 2020). HCHO also hazardous air pollutant and inferring cancer risks (Zhu et al., 2017). This study expects that higher the HCHO will increase the risk of contracting COVID-19. In line with this, (Ogen, 2020) proof exposure to NO2 causes inflammatory in the lungs, it is now necessary to examine whether the presence of an initial inflammatory condition is related to the response of the immune system to the coronavirus. At the same time, (Pansini et al., 2020) do the correlation levels of air pollution with COVID-19 spread and mortality and they found a significant correlation which allows us to infer that leaving in an area with low air quality seems to be a risk factor for becoming infected and dying from this new form of coronavirus. Pollen in the atmosphere increases general immune responses and are a casual factor reducing the spread of flu-like viruses (Barcelo, 2020).
Finally, it should be noted again regarding the area of green open space in each area and also population density (Isaifan et al., 2018; Isaifan et al., 2020). In urban areas, green space has a very important role in the supply of oxygen and cleaning dirty air. Therefore, if an area does not have enough green space, it will have a negative impact on the environment and surrounding communities. One effect of the lack of green open space in urban areas is the limited amount of oxygen production that can be produced
by green open space, so that pollutant gases are not absorbed properly. The results also proves that there are no significant changes of SO2 density. In summary, the Wilcoxon test, ODDS ratio and graph visualization provide the same conclusions.
Mobility before and after Large scale restrictionThe COVID-19 pandemic has changed the pattern
of population mobility, as can be seen in Fig. 6A The large scale restriction policy makes a significant difference in the pattern of population mobility to visit markets, supermarkets, pharmacies, and retail (Ouhsine et al., 2020). However, Fig. 6B represents there was a significant surge in population mobility visiting supermarkets and pharmacies at the beginning of March 2020. Fig. 6C represents resident mobility increased after the second week of March 2020. The social distancing policy on population obstruction that can be found is only in the form of movement of people within a limited geographical range, or proximity, for example only in residential areas/neighborhoods, from residences to markets, to supermarkets, to pharmacies, and a small extent to the workplace (for those who still have to come to work). Fig. 6C also shows an increase of 37% of the population that travelled around residential areas during March 2020 compared to the previous two months. While going to the market and pharmacy down 67%, even those are going to the mall/cafe down by 77%. The decrease in travel is expected to be higher in line with the increase in positive cases of COVID-19. This pattern of population mobility will continue throughout the COVID-19 pandemic, at least until the COVID-19 curve has shown a decline, or at least has started to be flat.
Economy impactSince the Indonesia government implemented
social restriction, many companies have implemented a system of reducing employee density by working two weeks and two weeks off to reduce the spread of the coronavirus, of course, this has an impact on declining production, and the company is experiencing massive losses, starting from manufacturing companies, the garment industry, to services. In manufacturing companies, it is very disturbed by the supply chain so that it hinders the production process. In the tourism sector, visitors drastically reduced because of many cancellation of flight departure, so it also has an
76
R.E. Caraka et al.
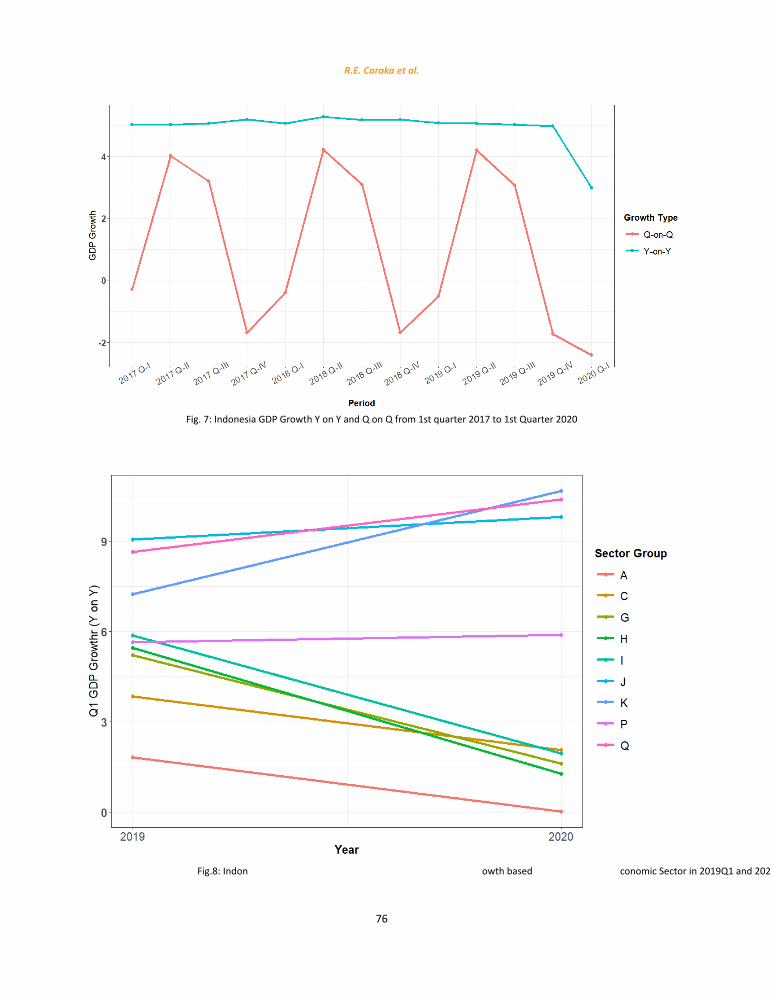
Fig. 7: Indonesia GDP Growth Y on Y and Q on Q from 1st quarter 2017 to 1st Quarter 2020
Fig. 7: Indonesia GDP Growth Y on Y and Q on Q from 1st quarter 2017 to 1st Quarter 2020
Fig.8: Indonesia Y on Y GDP growth based on Economic Sector in 2019Q1 and 2020Q1
Fig.8: Indonesia Y on Y GDP growth based on Economic Sector in 2019Q1 and 2020Q1
77
Global J. Environ. Sci. Manage., 6(SI): 65-84, Autumn 2020
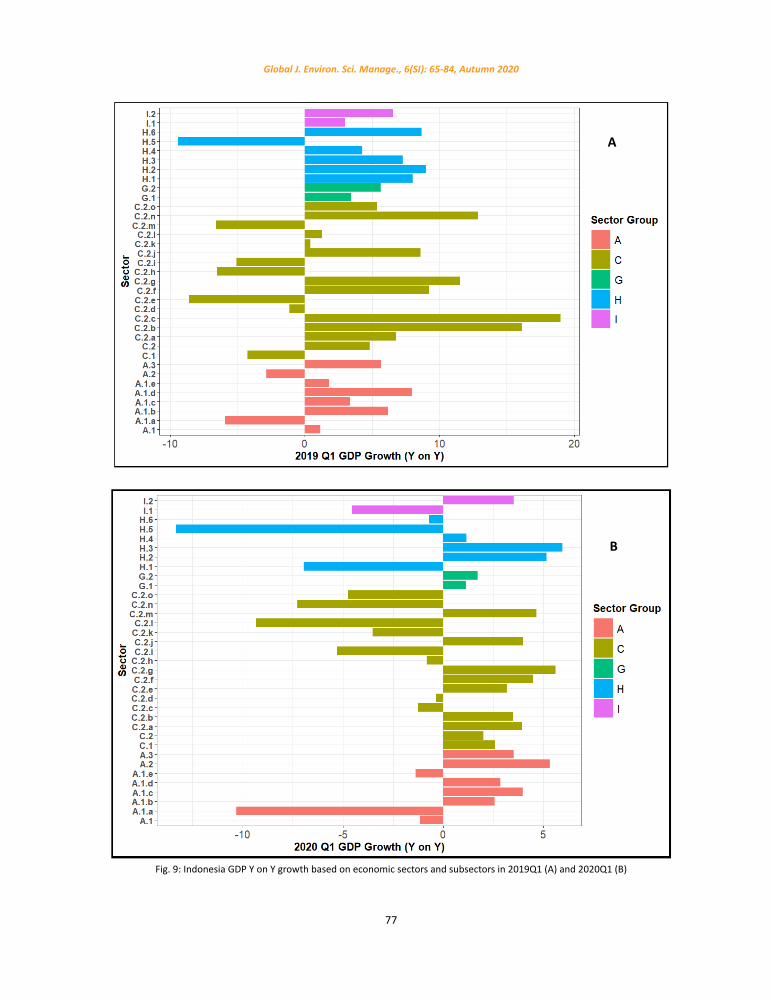
Fig. 9: Indonesia GDP Y on Y growth based on economic sectors and subsectors in 2019Q1 (A) and 2020Q1 (B)
A
B
Fig. 9: Indonesia GDP Y on Y growth based on economic sectors and subsectors in 2019Q1 (A) and 2020Q1 (B)
78
R.E. Caraka et al.
impact on catering and non-food retail companies. To begin with, Bank Indonesia projecting Indonesia’s economic growth this year will be depressed at the level of 2.1%. This is due to the continued spread of COVID-19, both domestically and abroad. Bank Indonesia (BI) has also revised its economic growth projection to below 5%, or only around 2.5 %, which is usually able to grow to 5.02%. This was caused by slowing economic growth due to the COVID-19 pandemic. This delay was marked by deteriorating external environmental conditions and weakening domestic demand in line with declining business and consumer sentiment. COVID-19 pandemic will have adverse implications for the world economy and Indonesia this year because it coincides with falling commodity prices and financial market turmoil. This year’s inflation is projected to increase to a level of 3%, due to the tight food supply and currency depreciation which is expected to be offset in part by lower non-subsidized fuel prices, as well as additional subsidies for electricity and food. However, in 2021 inflation is believed to return to normal levels, which is 2.8%. Therefore, Fig. 7 represents the condition of Indonesia’s economic growth has fluctuations between quarters. From the first quarter to the second quarter, it experienced a significant increase because in the second period most economic activities were generally carried out from the second quarter to the third quarter, which experienced lower growth. However, the economic situation in the fourth quarter and first quarter experienced a contraction (negative growth). Yet, At the end of the year and the beginning of the year there is usually a decline in economic activity. As a result, inventory becomes large, causing a price decline in this period. Still, it happens with the same pattern every year. However, if seen from year to year, the condition of the Indonesian economy until the end of 2019 can be declared quite good. This can be seen from the year-on-year economic growth in Indonesia that is able to hold around 5%. The cyclic pattern that occurs between quarters causes an increase in economic growth every year. In the first quarter of 2020, economic growth experienced a significant decline. Inter-quarter economic growth fell deeper, at 2.41%.Meanwhile, the chain economic growth declined to 2.97. In other words, it happens because there is a global pandemic, the COVID-19 outbreak. This pandemic has paralyzed various economic activities,
sectors in Indonesia.At the same time, Fig. 8 represents only a few
sectors experienced an increase in GDP growth, including sector J (information and communication), K (financial services and insurance), P (Education Services), and Q (health services and social activities). The three sectors are crucial in this COVID-19 pandemic. People still need the internet as a means of communication, health insurance, and the number of patients visiting health facilities, especially for self-examination and treatment of COVID-19. Meanwhile, other sectors experienced a decline. Some sectors that experienced a significant decrease were sector A (Agriculture, Forestry, and Fisheries), C (industry), G (Trade), H (Transportation and warehousing) and I (providing food and drink accommodation).
More detail, in the agricultural sector there are three subsectors which experienced a significant decline. The food crop sector (A.1.a) exsiccate to -10.91% from -5.93%. Meanwhile, the livestock subsector contracted by 1.39% in this quarter. The forestry sub-sector experienced a significant increase to 5.31% from -2.84%. Otherwise, regarding the industrial sector, many subsectors that initially tended to have high growth fell this quarter, especially the textile industry (C.2.c), furniture (C.2.n), and other manufacturing industries (C.2.o). There is one industry that grew in this quarter, namely the transportation equipment industry, which amounted to 4.64 %, wherein the previous year the industry experienced a contraction. The decline in the industrial sector caused by not running the economic activity in this pandemic condition optimally. Residents are encouraged to remain at home to minimize the spread so that the income of the population also decreases resulting in demand for goods and services to decrease significantly. Fig. 9 represents, In the trade sector a decline in growth but not until a contraction occurs. The transportation and warehousing sector also tends to decrease. The rail and warehousing subsector experienced a contraction of -6.96% and -0.73%, respectively, from which previously experienced quite tremendous growth. Meanwhile, air transport subsector fell further by 13.31%. The accommodation subsector (I.1) experienced a contraction of 4.55% due to the widespread closure of lodging due to this pandemic. Meanwhile, the growth of the food and beverage subsector (I.2) has decreased but has not affected
79
Global J. Environ. Sci. Manage., 6(SI): 65-84, Autumn 2020
contractions. Nevertheless, even if the restaurant or cafe is closed, the customer can order meals by online.
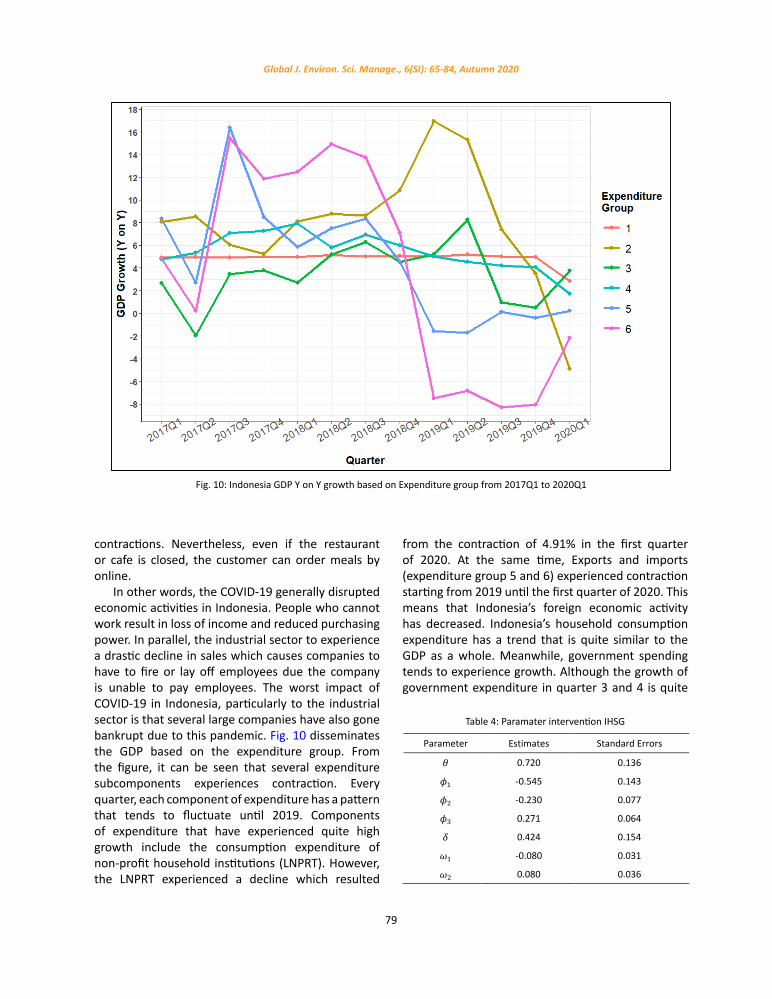
In other words, the COVID-19 generally disrupted economic activities in Indonesia. People who cannot work result in loss of income and reduced purchasing power. In parallel, the industrial sector to experience a drastic decline in sales which causes companies to have to fire or lay off employees due the company is unable to pay employees. The worst impact of COVID-19 in Indonesia, particularly to the industrial sector is that several large companies have also gone bankrupt due to this pandemic. Fig. 10 disseminates the GDP based on the expenditure group. From the figure, it can be seen that several expenditure subcomponents experiences contraction. Every quarter, each component of expenditure has a pattern that tends to fluctuate until 2019. Components of expenditure that have experienced quite high growth include the consumption expenditure of non-profit household institutions (LNPRT). However, the LNPRT experienced a decline which resulted
from the contraction of 4.91% in the first quarter of 2020. At the same time, Exports and imports (expenditure group 5 and 6) experienced contraction starting from 2019 until the first quarter of 2020. This means that Indonesia’s foreign economic activity has decreased. Indonesia’s household consumption expenditure has a trend that is quite similar to the GDP as a whole. Meanwhile, government spending tends to experience growth. Although the growth of government expenditure in quarter 3 and 4 is quite
Fig. 10: Indonesia GDP Y on Y growth based on Expenditure group from 2017Q1 to 2020Q1
Fig. 10: Indonesia GDP Y on Y growth based on Expenditure group from 2017Q1 to 2020Q1
Table 4: Paramater intervention IHSG
Parameter Estimates Standard Errors
𝜃𝜃 0.720 0.136
𝜙𝜙1 -0.545 0.143
𝜙𝜙2 -0.230 0.077
𝜙𝜙3 0.271 0.064
𝛿𝛿 0.424 0.154
𝜔𝜔1 -0.080 0.031
𝜔𝜔2 0.080 0.036
Table 4: Paramater intervention IHSG
80
R.E. Caraka et al.
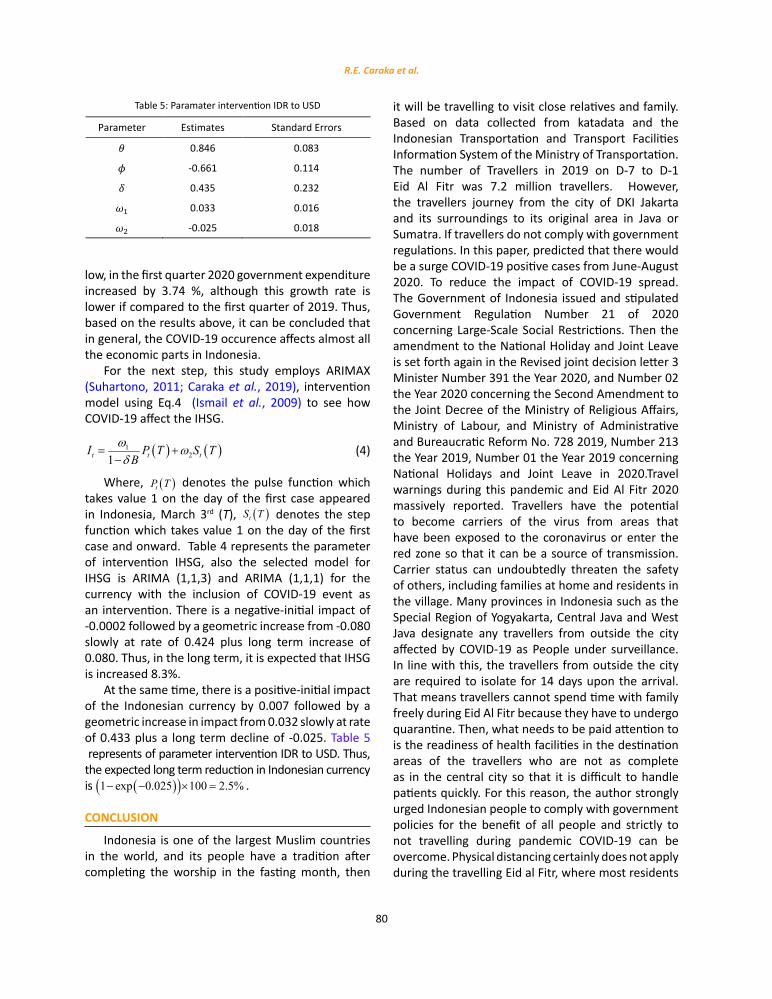
low, in the first quarter 2020 government expenditure increased by 3.74 %, although this growth rate is lower if compared to the first quarter of 2019. Thus, based on the results above, it can be concluded that in general, the COVID-19 occurence affects almost all the economic parts in Indonesia.
For the next step, this study employs ARIMAX (Suhartono, 2011; Caraka et al., 2019), intervention model using Eq.4 (Ismail et al., 2009) to see how COVID-19 affect the IHSG.
( ) ( )121t t tI P T S T
Bω ωδ
= +−
(4)
Where, ( )tP T denotes the pulse function which takes value 1 on the day of the first case appeared in Indonesia, March 3rd (T), ( )tS T denotes the step function which takes value 1 on the day of the first case and onward. Table 4 represents the parameter of intervention IHSG, also the selected model for IHSG is ARIMA (1,1,3) and ARIMA (1,1,1) for the currency with the inclusion of COVID-19 event as an intervention. There is a negative-initial impact of -0.0002 followed by a geometric increase from -0.080 slowly at rate of 0.424 plus long term increase of 0.080. Thus, in the long term, it is expected that IHSG is increased 8.3%.
At the same time, there is a positive-initial impact of the Indonesian currency by 0.007 followed by a geometric increase in impact from 0.032 slowly at rate of 0.433 plus a long term decline of -0.025. Table 5 represents of parameter intervention IDR to USD. Thus, the expected long term reduction in Indonesian currency is ( )( )1 exp 0.025 100 2.5%− − × = .
CONCLUSION
Indonesia is one of the largest Muslim countries in the world, and its people have a tradition after completing the worship in the fasting month, then
it will be travelling to visit close relatives and family. Based on data collected from katadata and the Indonesian Transportation and Transport Facilities Information System of the Ministry of Transportation. The number of Travellers in 2019 on D-7 to D-1 Eid Al Fitr was 7.2 million travellers. However, the travellers journey from the city of DKI Jakarta and its surroundings to its original area in Java or Sumatra. If travellers do not comply with government regulations. In this paper, predicted that there would be a surge COVID-19 positive cases from June-August 2020. To reduce the impact of COVID-19 spread. The Government of Indonesia issued and stipulated Government Regulation Number 21 of 2020 concerning Large-Scale Social Restrictions. Then the amendment to the National Holiday and Joint Leave is set forth again in the Revised joint decision letter 3 Minister Number 391 the Year 2020, and Number 02 the Year 2020 concerning the Second Amendment to the Joint Decree of the Ministry of Religious Affairs, Ministry of Labour, and Ministry of Administrative and Bureaucratic Reform No. 728 2019, Number 213 the Year 2019, Number 01 the Year 2019 concerning National Holidays and Joint Leave in 2020.Travel warnings during this pandemic and Eid Al Fitr 2020 massively reported. Travellers have the potential to become carriers of the virus from areas that have been exposed to the coronavirus or enter the red zone so that it can be a source of transmission. Carrier status can undoubtedly threaten the safety of others, including families at home and residents in the village. Many provinces in Indonesia such as the Special Region of Yogyakarta, Central Java and West Java designate any travellers from outside the city affected by COVID-19 as People under surveillance. In line with this, the travellers from outside the city are required to isolate for 14 days upon the arrival. That means travellers cannot spend time with family freely during Eid Al Fitr because they have to undergo quarantine. Then, what needs to be paid attention to is the readiness of health facilities in the destination areas of the travellers who are not as complete as in the central city so that it is difficult to handle patients quickly. For this reason, the author strongly urged Indonesian people to comply with government policies for the benefit of all people and strictly to not travelling during pandemic COVID-19 can be overcome. Physical distancing certainly does not apply during the travelling Eid al Fitr, where most residents
Table 5: Paramater intervention IDR to USDTable 5: Paramater intervention IDR to USD
Parameter Estimates Standard Errors
𝜃𝜃 0.846 0.083
𝜙𝜙 -0.661 0.114
𝛿𝛿 0.435 0.232
𝜔𝜔1 0.033 0.016
𝜔𝜔2 -0.025 0.018
81
Global J. Environ. Sci. Manage., 6(SI): 65-84, Autumn 2020
take of public transportation to travelling back to their hometowns. Besides, Travelers will find it difficult to maintain physical distance from each other while in the vehicle so that they cannot suppress COVID-19 transmission as a government appeal. Based on the analysis, it can be concluded that in the five provinces with the highest mobility in Indonesia, namely DKI Jakarta, West Java, Central Java, East Java and South Sulawesi. There were no significant differences of SO2 in all of region.In addition, the highest odds ratio NO2 in South sulawesi, and the lowest odds ratio CO in east Java. In a nutshell, during this pandemic, the author are strongly recommend the government to allocate more needs to individuals. This research shown that many people were experiencing a crisis due to this pandemic. During the Eid Al Fitr, in Indonesia may offer a much chance to expand COVID-19 transmission, activity will become normal, pollution will increase and there may be a second surge and significant increase in positive cases of COVID-19. In general, it is seen from the density of pollution that it is better to do large scale restrictions. Nevertheless, if extend the large scale restrictions. Then, the economy will gradually weaken. In line with this, the government should do the ‘new normal’, which carries out activities like normal, but there are still restrictions on behaviour. Like wearing a mask, routinely washing hands with soap, keeping a physical distance, avoiding crowds.
AUTHOR CONTRIBUTIONS
R.E. Caraka leads this study and has reviewed COVID-19 related kinds of literature, designed and developed the concept of all analysis prepared, writing, and edited the manuscript text. Y. Lee performed the supervised the project and helped to provide the study grant. R. Kurniawan performed the environmental analysis. R. Herliansyah analyzed impact COVID-19 in economy and creates the intervention model. P.A. Kaban performed the environmental analysis and created all descriptive graph in environmental and provide the dataset. B.I. Nasution analyzed impact COVID-19 in economy and analysis of GDP growth and provide the dataset. P.U. Gio edited the manuscript. R.C. Chen perfomed the supervision and provide the study grant. T. Toharudin performed the supervision and provides the research grant. B. Pardamean also performed the supervision and provide the research grant.
ACKNOWLEDGMENTS
This study is fully supported by National Research Foundation of Korea grants [NRF-2019R1A2C1002408]. The study is as part of Ministry of Science and Technology (MOST) under grant [107-2221-E-324-018-MY2] and [106-2218-E-324-002]. This paper in part of Chaoyang University of Technology and the Higher Education Sprout Project, Ministry of Education (MOE), Taiwan, under the project name: “The R&D and the cultivation of talent for health-enhancement products”. The study is also part of Hibah Artikel Universitas Padjadjaran under grant [1733/UN6.3.1/LT/2020]. This research in part of Bina Nusantara University.
CONFLICT OF INTEREST
The authors declare no potential conflict of interest regarding the publication of this work. In addition, the ethical issues including plagiarism, informed consent, misconduct, data fabrication and, or falsification, double publication and, or submission, and redundancy have been completely witnessed by the authors.
ABBREVIATIONS
°C The degree CelsiusAPI Application Programming Interface
ARIMAAutoregressive integrated moving average
AT ambient temperatureBI Bank IndonesiaBPS Statistics IndonesiaCO Carbon monoxideCOVID-19 Coronovirus disease 2019DRR Disaster Risk ReductionDTR Diurnal Temperature RangeGDP Gross Domestic ProductGRDP Gross regional domestic productH0 A null hypothesisHCHO FormaldehydeIHSG IDX Composite
katadataCompany with expertise in data analysis and business publication in Indonesia
82
R.E. Caraka et al.
LIPIThe Indonesian Institute of Sciences is the governmental authority for science and research in Indonesia
LNPRT consumption expenditure of non-profit household institutions
MOE Ministry of EducationMOST Ministry of Science and TechnologyNO2 Nitrogen dioxideNOx Nitrogen OxideNRF National Research Foundation
ODDSThe probability that one thing is so or will happen rather than another : chances
OR Odds Ratio
PM particulate matter (also called particle pollution)
PPM Parts-per notationQ on Q Quarter on quarterQx xth quarterRupiah Indonesian rupiah
SARS-CoV-2 Severe acute respiratory syndrome coronavirus 2
SO2 Sulfur dioxideTLV American Conference Limit ValueTROPOMI TROPOspheric Monitoring InstrumentUSD United States DollarUV UltravioletWITA Central Indonesian Time (WITA)Y on Y Year on year
REFERENCESAktay, A.: Bavadekar, S.: Cossoul,G.: Davis, J.: Desfontaines, D.:
Fabrikant, A.: abrilovich, E.: Gadepalli, K.: Gipson, B.: Guevara, M.: Kamatah, C.: Kansal, M.: Lange, A.: Mandayam, C.: Oplinger, A.: Plunkte, C.: Roessler, T.: Scholsberg, A.: Shekel, T.: Vispute, S.: Viu, M.: Wellenius, G.: Williams,B.: Wilson, R.J., (2020). Google COVID-19 community mobility reports: Anonymization process description (version 1.0). ArXiv, 2004.04145. (5 pages)
Baldwin, R.; Mauro, B.W., (2020). Economics in the time of COVID-19. A VoxEU.org Book. CEPR Press (123 pages).
Barcelo, D., (2020). An environmental and health perspective for COVID-19 outbreak: Meteorology and Air Quality Influence, Sewage Epidemiology Indicator, Hospitals Disinfection, Drug Therapies and Recommendations. J. Environ. Chem. Eng., 8(4): 104006 (4 pages).
Bhowmik, D.; Bhattacharjee, C.; Sampath Kumar, K.P., (2010). Chikungunya epidemic in India- A major public-health disaste.
Res. J. Pharm. Biol. Chem., Sci., 1(4): 63-73 (11 pages).Caraka, R.E.; Chen, R.C.; Toharudin, T.; Pardamean, B.; Yasin, H.;
Wu, S.H., (2019). Prediction of status particulate matter 2.5 using State Markov Chain Stochastic Process and HYBRID VAR-NN-PSO’, IEEE Access, 7: 161654–161665 (12 pages).
Caraka, R.E.; Chen, R.C.; Toharudin, T.; Tahmid, M.; Pardamean, B.; Putra, R.M., (2020). Evaluation Performance of SVR Genetic Algorithm and Hybrid PSO in Rainfall Forecasting. ICIC Express Letters Part B: Applications. 11(7): 631–639 (9 pages).
Caraka, R.E.; Bakar, S.A.; Tahmid, M., (2019). Rainfall Forecasting Multi Kernel Support Vector Regression Seasonal Autoregressive Integrated Moving Average. AIP Conference Proceedings, 020014 (7 pages).
Caraka, R.E.; Yasin, H., (2017). Geographically Weighted Regression (GWR) Sebuah Pendekatan Regresi Geografis. 1st edn. Yogyakarta: MOBIUS GRAHA ILMU (155 pages).
Djalante, R.; Lassa, J.; Setiamarga, D.; Mahfud, C.; Sudjatma, A.; Indrawan, M.; Haryanto, B.; Sinapoy, M.S.; Rafliana, I.; Djalante, S.; Gunawan, L.A.; Anindito, R.; Warsilah, H.; Surtiari, I.G.A., (2020). Review and analysis of current responses to COVID-19 in Indonesia: Period of January to March 2020., Progress Disaster Sci., 6: 100091 (9 pages).
Djalante, R.; Thomalla, F., (2012). Disaster risk reduction and climate change adaptation in Indonesia. Int. J. Disaster Resilience Built Environ., 3(2): 166–180 (15 pages).
European Space Agency, (2020). Sentinel-5P, 2020. Gorelick, N.; Gorelick, N.; Hancher, M.; Dixon, M.; Ilyushchenko,
S.; Thau, D.; Moore, R., (2017). Google Earth Engine: Planetary-scale geospatial analysis for everyone. Remote Sens. Environ., 202: 18–27 (10 pages).
Guerrieri, V.; Lorenzoni, G.; Straub, L.; Werning, I., (2020.) ‘Macroeconomic Implications of COVID-19: Can Negative Supply Shocks Cause Demand Shortages? SSRN Electr. J., (37 pages).
Haagen-Smit, A.J., (1959). Urban Air Pollution. Adv. Geophysics, 6: 1–18 (18 pages).
Ismail, Z.; Ismail, Z.; Suhartono; Yahaya, A.; Efendi, R., (2009). Intervention model for analyzing the impact of terrorism to tourism industry. J. Math. Stat., 5(4): 322–329 (7 pages).
Isaifan., (2020). The dramatic impact of Coronavirus outbreak on air quality: Has it saved as much as it has killed so far? Global J. Environ. Sci. Manage., 6(3): 275-288 (14 pages).
Isaifan, R. J.; Al-Thani, H.; Ayoub, M.; Aissa, B.; Koc, M., (2018). The Economic Value of Common Urban Trees in the State of Qatar from an Air Quality Control Perspective. J. Environ. Sci. Pollut. Res., 4(3): 285–288. (4 pages)
Isaifan, R. J.; Baldauf, R. W. (2020). Estimating Economic and Environmental Benefits of Urban Trees in Desert Regions. Front. Ecol. Evol., 8; 1–14 (14 pages).
Jahangiri, M.; Jahangiri, M.; Najafgholipour, M., (2020). The sensitivity and specificity analyses of ambient temperature and population size on the transmission rate of the novel coronavirus (COVID-19) in different provinces of Iran. Sci. Total Environ., 728: 138872 (19 pages).
Kaban, P. A.; Kurniawan, R.; Caraka, R.E.; Pardamean, B.; Yuniarto, B.; Sukim., (2019). Biclustering method to capture the spatial pattern and to identify the causes of social vulnerability in Indonesia: A new recommendation for disaster mitigation policy. Procedia Comput. Sci., 157: 31–37 (7 pages).
Kurniawan, R.; Siagian, T.H.; Yuniarto, B.; Nasution, B.I.; Caraka, R.E.,
83
Global J. Environ. Sci. Manage., 6(SI): 65-84, Autumn 2020
(2018). Construction of social vulnerability index in Indonesia using partial least squares structural equation modeling. Int. J. Eng. Technol., 7(4): 6131–6136 (6 pages).
Kurniawan, R.; Sohibien, G.P.D.; Rahani, R., (2019). Cara Mudah Belajar Statistik Data and Eksplorasi (256 pages).
Leslie, George B.; F. W. Lunau., (1994).Indoor air pollution: problems and priorities. Cambridge University Press (130 pages).
Ma, X.; Ma, X.; Vervoort, D.; Reddy, C.; Park, K.B.; Makasa, E., (2020). Emergency and essential surgical healthcare services during COVID-19 in low- and middle-income countries: A Perspective. Int. J. Surgery. IJS Publishing Group Ltd. (14 pages).
McKibbin, W. J.; Fernando, R., (2020). The global macroeconomic Impacts of COVID-19: Seven Scenario. SSRN Electr. J., CAMA Working Paper No. 19/2020 (45 pages).
Moritz, S.; Bartz-Beielstein, T., (2017). The R Journal: 9(1): 207–218 (12 pages).
Ogen, Y., (2020). Assessing nitrogen dioxide (NO2) levels as a contributing factor to coronavirus (COVID-19) fatality. Sci. Total Environ., 726 (14 pages).
Orive, G.; Lertxundi, U.; Barcelo, D., (2020). Early SARS-CoV-2 outbreak detection by sewage-based epidemiology. Sci. Total Environ., 732: 139298 (8 pages).
Ouhsine; A. Ouigmane; El. Layati; B. Aba; R. Isaifan; M. Berkani Impact of COVID-19 on the qualitative and quantitative aspect of household solid waste, Global Journal of Environmental Science and Management, Volume 6, Special Issue (Covid-19). 41-52 (12 pages).
Otmani, A.; Benchrif, A.; Tahri, M.; Bounakhla, M.; Mahjoub, El.; Krombi, M.,(2020). Impact of Covid-19 lockdown on PM10, SO2 and NO2 concentrations in Salé City (Morocco). Sci. Total Environ., 735(2): 139541 (5 pages).
Pansini, R.; Fornacca, D., (2020). Initial evidence of higher morbidity and mortality due to SARS-CoV-2 in regions with lower air quality. MedRxiv. (17 pages).
Pardamean, B.; Budiarto, A.; Caraka, R.E., (2018). Bioinformatika dengan R Tingkat Lanjut. 1st edn. Yogyakarta: Teknosains (147 pages).
Pribadi, K.S.; Pradoto, Rani G.; Hanafi, E.A.; Rasmawan. I.M.A.B., (2020). Lombok earthquake, one year later: Housing sector recovery in E3S Web of Conferences (10 pages).
R Core Team., (2008). R software. R Foundation for Statistical Computing.
Reina Ortiz, M.; Le, N.K.; Sharma, V.; Hoare, I.; Quizhpe, E.; Teran, E.; Naik, E.; Salihu, H.M.; Izurieta, R., (2017). Post-earthquake Zika virus surge: Disaster and public health threat amid climatic conduciveness. Scientific Reports (10 pages).
Rofi, A.; Doocy, S.; Robinson, C., (2006). Tsunami mortality and displacement in Aceh province, Indonesia’, Disasters (11 pages).
Şahin, M., (2020). Impact of weather on COVID-19 pandemic in Turkey. Sci. Total Environ., 728: 138810 (11 pages).
Sharma, S.; Zhang, M.; Anshika.; Gao, J.; Zhang, H.; Kota, S.H., (2020). Effect of restricted emissions during COVID-19 on air quality in India. Sci. Total Environ., 728: 138878 (6 pages).
Shi, P.; Dong, Y.; Yan, H.; Zhao, C.; Li, X.; Liu, W.; He, M.; Tang, S.; Xi, S., (2020). Impact of temperature on the dynamics of the COVID-19 outbreak in China. Sci. Total Environ., 728: 138890 (28 pages).
Siddle, J.; Tolleson-Rinehart, S.; Brice, J., (2016). Survey of Emergency Department staff on disaster preparedness and training for Ebola virus disease. Am. J. Disaster Med., 32338640 (13 pages).
Suhartono., (2011). Time Series Forecasting by using Seasonal Autoregressive Integrated Moving Average: Subset, Multiplicative or Additive Model. J. Math. Stat., 7 (1): 20-27 (8 pages).
Toda, A.A., (2020). Susceptible-Infected-Recovered (SIR) Dynamics of COVID-19 and Economic Impac. 1–15 (15 pages).
Tosepu, R.; Gunawan, J.; Effendy, D.S.; Ahmad, L.A.O.I.; Lestari, H.; Bahar, H.; Asfian, P., (2020). Correlation between weather and Covid-19 pandemic in Jakarta, Indonesia. Sci. Total Environ., 725: 138436 (4 pages).
Whiley, D.M.; Goire, N.; Lahra, M.M.; Donovan, B.; Limnios, A.E.; Nissen, M.D.; Sloots, T.P., (2012). The ticking time bomb: Escalating antibiotic resistance in Neisseria gonorrhoeae is a public health disaster in waiting. J. Antimicrob. Chemother., (3 pages).
Whitworth, J., (2020). COVID-19: a fast evolving pandemic. Transactions of The Royal Society of Tropical Medicine and Hygiene (2 pages).
Wu, X.; Nethery, R.C.; Sabath, M.B.; Braun, D.; Dominici, F., (2020). Exposure to air pollution and COVID-19 mortality in the United States: A nationwide cross-sectional study. J. Chem. Info. Model., (36 pages).
Yeh, H.; Imamura, F.; Synolakis, C.; Tsuji, Y.; Liu, P.; Shi, S., (1993). The Flores Island tsunamis. Eos, Transactions American Geophysical Union (5 pages).
Zambrano-Monserrate, M. A.; Ruano, M. A.; Sanchez-Alcalde, L., (2020). Indirect effects of COVID-19 on the environment. Sci. Total Environ. 728: 138813 (4 pages).
Zhu, L.; Jacob, D.J.; Keutsch, F.N.; Mickley, L.J.; Scheffe, R.; Strum, M.; González Abad, G.; Chance, K.; Yang, K.; Rappenglück, B.; Millet, D.B.; Baasandorj, M.; Jaeglé, L.; Shah, V., (2017). Formaldehyde (HCHO) As a Hazardous Air Pollutant: Mapping Surface Air Concentrations from Satellite and Inferring Cancer Risks in the United State. Environ. Sci. Technol., 51(10): 5650–5657 (8 pages).
84
R.E. Caraka et al.
AUTHOR (S) BIOSKETCHES
Caraka, R.E., Ph.D. Candidate, Department of Information Management, College of Informatics, Chaoyang University of Technology, Taichung City, Taiwan. Department of Statistics, College of Natural Science, Seoul National University 56-1 Mountain, Sillim-dong, Gwanak-gu, Seoul metrópolis, Korea. Bioinformatics and Data Science Research Center, Bina Nusantara University, Jakarta, Indonesia. Statistical Calculator (STATCAL), Medan, North Sumatera, Indonesia. Email: [email protected]
Lee, Y., Ph.D., Professor, Department of Statistics, College of Natural Science, Seoul National University 56-1 Mountain, Sillim-dong, Gwanak-gu, Seoul metrópolis, Korea. Email: [email protected]
Kurniawan, R., M.Sc.., Lecturer, Polytechnic Statistics (STIS), DKI Jakarta, Indonesia. Email: [email protected]
Herliansyah, R., Ph.D. Candidate, School of Mathematical Sciences, The University of Edinburgh. Department of Mathematics, Kalimantan Institute of Technology, North Kalimantan, Indonesia. Email: [email protected]
Kaban, P.A., S.T.Stat., Polytechnic Statistics (STIS), DKI Jakarta, Indonesia. Statistics Indonesia (BPS), North Sumatera, Indonesia. Email: [email protected]
Nasution, B.I., S.T.Stat., Polytechnic Statistics (STIS), DKI Jakarta, Indonesia. Statistics Indonesia (BPS), North Kalimantan, Indonesia. Email: [email protected]
Gio, P.U., Ph.D. Candidate, Department of Mathematics, Universitas Sumatera Utara, Indonesia. Statistical Calculator, Medan, North Sumatera, Indonesia. Email: [email protected]
Chen, R.C., Ph.D., Distinguished Professor, Department of Information Management, College of Informatics, Chaoyang University of Technology, Taichung City, Taiwan. Email: [email protected]
Toharudin, T., Ph.D., Professor, Department of Statistics, Universitas Padjadjaran, Indonesia. Email: [email protected]
Pardamean, B., Ph.D., Professor, Bioinformatics and Data Science Research Center, Bina Nusantara University, Jakarta, Indonesia. BINUS Graduate Program – Master of Computer Science, Bina Nusantara University, Indonesia. Email: [email protected]
HOW TO CITE THIS ARTICLE
Caraka, R.E.; Lee, Y.; Kurniawan, R.; Herliansyah, R.; Kaban, P.A.; Nasution, B.I.; Gio, P.U.; Chen, R.C.; Toharudin, T.; Pardamean, B., (2020). Impact of COVID-19 large scale restriction on environment and economy in Indonesia. Global J. Environ. Sci. Manage., 6(SI): 65-84.
DOI: 10.22034/GJESM.2019.06.SI.07
url: https://www.gjesm.net/article_40288.html
COPYRIGHTS
©2020 The author(s). This is an open access article distributed under the terms of the Creative Commons Attribution (CC BY 4.0), which permits unrestricted use, distribution, and reproduction in any medium, as long as the original authors and source are cited. No permission is required from the authors or the publishers.