Embed Size (px)
Citation preview

Global IPO Watch Q2 2020A PwC Global IPO Centre publication
PwC | Global IPO Watch Q2 2020
Q2 2020 overview
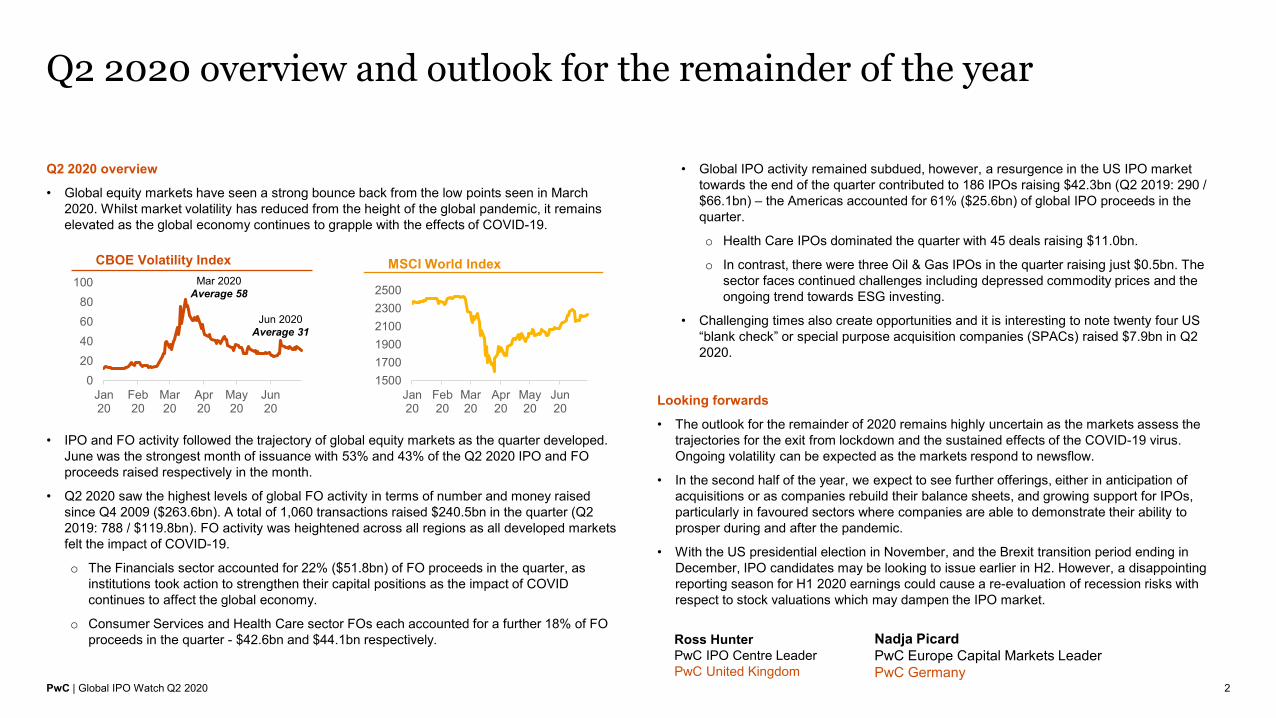
• Global equity markets have seen a strong bounce back from the low points seen in March 2020. Whilst market volatility has reduced from the height of the global pandemic, it remains elevated as the global economy continues to grapple with the effects of COVID-19.
• IPO and FO activity followed the trajectory of global equity markets as the quarter developed. June was the strongest month of issuance with 53% and 43% of the Q2 2020 IPO and FO proceeds raised respectively in the month.
• Q2 2020 saw the highest levels of global FO activity in terms of number and money raised since Q4 2009 ($263.6bn). A total of 1,060 transactions raised $240.5bn in the quarter (Q2 2019: 788 / $119.8bn). FO activity was heightened across all regions as all developed markets felt the impact of COVID-19.
o The Financials sector accounted for 22% ($51.8bn) of FO proceeds in the quarter, as institutions took action to strengthen their capital positions as the impact of COVID continues to affect the global economy.
o Consumer Services and Health Care sector FOs each accounted for a further 18% of FO proceeds in the quarter - $42.6bn and $44.1bn respectively.
Q2 2020 overview and outlook for the remainder of the year
2
• Global IPO activity remained subdued, however, a resurgence in the US IPO market towards the end of the quarter contributed to 186 IPOs raising $42.3bn (Q2 2019: 290 / $66.1bn) – the Americas accounted for 61% ($25.6bn) of global IPO proceeds in the quarter.
o Health Care IPOs dominated the quarter with 45 deals raising $11.0bn.
o In contrast, there were three Oil & Gas IPOs in the quarter raising just $0.5bn. The sector faces continued challenges including depressed commodity prices and the ongoing trend towards ESG investing.
• Challenging times also create opportunities and it is interesting to note twenty four US “blank check” or special purpose acquisition companies (SPACs) raised $7.9bn in Q2 2020.
Looking forwards
• The outlook for the remainder of 2020 remains highly uncertain as the markets assess the trajectories for the exit from lockdown and the sustained effects of the COVID-19 virus. Ongoing volatility can be expected as the markets respond to newsflow.
• In the second half of the year, we expect to see further offerings, either in anticipation of acquisitions or as companies rebuild their balance sheets, and growing support for IPOs, particularly in favoured sectors where companies are able to demonstrate their ability to prosper during and after the pandemic.
• With the US presidential election in November, and the Brexit transition period ending in December, IPO candidates may be looking to issue earlier in H2. However, a disappointing reporting season for H1 2020 earnings could cause a re-evaluation of recession risks with respect to stock valuations which may dampen the IPO market.
Ross HunterPwC IPO Centre LeaderPwC United Kingdom
Nadja PicardPwC Europe Capital Markets LeaderPwC Germany
CBOE Volatility Index MSCI World Index
020406080
100
Jan20
Feb20
Mar20
Apr20
May20
Jun20
Mar 2020Average 58
Jun 2020Average 31
150017001900210023002500
Jan20
Feb20
Mar20
Apr20
May20
Jun20

PwC | Global IPO Watch Q2 2020
IPO and Further Offer (FO) Q2 2020 highlights
3
Q2 2020 highlights
T-Mobile US raised $15.9bn via a FO on NASDAQ in June to fund the repurchase of its shares from Softbank - the largest FO of the quarter.
The largest IPO of the quarter took place on Euronext Amsterdam - JDE Peet’s raised $2.9bn.
Reliance Industries’ $7.0bn FO in June 2020 was India’s largest ever rights issue.
China continues to dominate IPO issuance in the Asia-Pacific region, raising 66% of the 2020 YTD proceeds in the region
FO activity was buoyant in Australia - 231 transactions raised $21.7bn in the first half of 2020 (H1 2019: 152 / $10.1bn).
Q2 2020 highlights
• There were 186 IPOs in Q2 2020, raising a total of $42.3bn, a modest increase from Q1 2020 ($35.7bn), but significantly lower than Q2 2019.
• Q2 2020 saw the highest levels of global FO activity in terms of number and money raised since Q4 2009 –1,060 FOs raised $240.5bn in the quarter, over double Q1 2020 FO proceeds ($93.6bn).
• Despite subdued IPO activity in the region, EMEA saw the largest IPO of the quarter with pure play coffee and tea company JDE Peet’s listing in Amsterdam.
• There were no financial sponsor backed IPOs in either EMEA or Asia Pacific during this quarter – in the US, a fifth of IPOs were sponsor backed.
• Twenty four US “blank check” or special purpose acquisition companies (SPACs) raised $7.9bn in Q2 2020.Singapore Airlines raised
$3.8bn through with a FO in June 2020 as the aviation industry suffered from global travel restrictions.

PwC | Global IPO Watch Q2 2020
Global money raised via IPOs and FOs
4
The US saw the highest levels of IPO and FO activity in the first half of 2020. The China IPO market continues to prove resilient to challenging global economic conditions. UK IPO activity remains subdued, whereas FO activity is notably higher.
Global money raised via IPOs and FOs (10-year overview)
FO m
oney
rais
ed &
# of
dea
lsIP
O m
oney
rais
ed &
# of
dea
ls
Note: Top countries have been selected based on money raised in 2020YTD. Source: Dealogic as of 30 June 2020.
Top countries 2020YTD
$178.8bn$142.5bn
$195.6bn
$274.3bn
$206.9bn
$142.5bn
$209.0bn $223.6bn$199.2bn
$78.0bn
1,041
728 865
1,167 1,185 1,013
1,523
1,198 1,040
393
2011 2012 2013 2014 2015 2016 2017 2018 2019 2020YTD
IPO - Q1 IPO - Q2 IPO - Q3 IPO - Q4 IPO - #
$479.9bn $509.3bn$588.2bn $613.5bn
$685.8bn$551.1bn
$620.8bn
$462.6bn $457.8bn
$334.0bn
2,9022,508
3,046 3,178 3,323 3,1863,571
2,839 2,783
1,659
2011 2012 2013 2014 2015 2016 2017 2018 2019 2020YTD
FO - Q1 FO - Q2 FO - Q3 FO - Q4 FO - #
United States, 47%
China, 26%
Hong Kong, 5%
Netherlands, 4%
Thailand, 3%
Other, 15%
United States, 44%
United Kingdom, 8%
Hong Kong, 8%
Australia, 7%
India, 6%
Other, 27%
Q2: $66.1bn Q2: $42.3bn
Q2: $119.8bn Q2: $240.5bn
% of total money raised
% of total money raised

PwC | Global IPO Watch Q2 2020
60
70
80
90
100
110
Jan 20 Feb 20 Mar 20 Apr 20 May 20 Jun 20Inde
x re
base
d to
100
FTSE 100 Hang Seng S&P 500
Global indices
Overview of global IPO and FO activity
5
IPO and IPO activity followed the trajectory of global equity markets as the quarter developed - June was the strongest month of issuance with 53% and 43% of the Q2 2020 IPO and FO proceeds raised respectively.
Global IPO and FO activity
IPO pricing dynamics
2
41) Overallotment exercised (%) presents the percentage of IPOs in which the
overallotment option has been exercised (either fully or partially).
Note: IPOs are classified as ‘In Range’ if the IPO is priced in the middle 50% of the price range. The top and bottom 25% are classified as ‘Top of Range’ and ‘Bottom of Range’.
Source: Dealogic, Bloomberg as of 30 June 2020.
• Q2 2020 saw a lower number of IPOs as compared to Q1 2020 (#207), however, proceeds of $42.3bn were up 18% from the first quarter. IPO activity was significantly lower than Q2 2019.
• 1,060 FOs raised $240.5bn in Q2 2020, this was over double Q1 2020 ($93.6bn) and Q2 2019 proceeds ($119.8bn).
• Despite heightened levels of volatility and uncertainty caused by COVID-19, IPOs priced relatively favourably as compared to 2019.
• After the sell-off experienced in March 2020, global equity markets have risen in Q2 2020, but are facing unfavourable economic data including record levels of unemployment in some developed nations.
1
2
3
2018 2019 Q2 2018 Q2 2019 Apr 20 May 20 Jun 20 Q2 2020IPO activityNumber of IPOs 1,198 1,040 325 290 53 49 84 186
% sponsor-backed 8.1% 6.6% 11.1% 10.7% 0.0% 6.1% 11.9% 7.0%
Money raised $223.6bn $199.2bn $62.2bn $66.1bn $8.3bn $11.7bn $22.3bn $42.3bn
% sponsor-backed 15.5% 18.2% 22.1% 26.4% 0.0% 7.6% 38.8% 22.5%
Advanced metricsFree float % 32.4% 31.1% 32.4% 32.6% 29.9% 34.5% 30.2% 31.3%
Overallotment exercised (%)1 32.7% 32.0% 36.6% 38.7% 17.3% 28.6% 32.5% 27.2%
% secondary shares 13.6% 12.3% 16.8% 14.7% 1.1% 7.4% 9.5% 6.6%
FO activity
Number of FOs 2,839 2,783 814 788 255 365 440 1,060
Money raised $462.6bn $457.8bn $133.5bn $119.8bn $40.6bn $95.2bn $104.6bn $240.5bn
1
4
3Q2 2020
7% 6% 2%
19% 23% 21%
47% 42% 46%
21% 24% 22%
5% 6% 9%
2018 2019 2020YTD
Below range Bottom of range In range Top of range Above range

PwC | Global IPO Watch Q2 2020
Leading transactions 2020YTD
6
Even with the uncertain global economic outlook due to COVID-19, the first half of 2020 has seen a steady stream of well priced +$1bn IPOs, seven of which took place in North America. Q2 2020 saw a number of large scale FOs from issuers in multiple regions across a range of sectors.
Top 10 largest IPOs 2020YTD
Note: IPOs are classified as ‘In Range’ if the IPO is priced in the middle 50% of the price range. The top and bottom 25% are classified as ‘Top of Range’ and ‘Bottom of Range’. Source: Dealogic, Bloomberg as of 30 June 2020.
Pricing date Issuer name Issuer country Sector Exchange Pricing Money raisedPerformance (% change)
1-day 1-month Current3-Jan-20 Beijing-Shanghai High Speed Railway Co Ltd Consumer Services Shanghai SE N/A $4.4bn 38.73 49.59 41.3929-May-20 JDE Peet's BV Consumer Goods Euronext Amsterdam In range $2.9bn 13.78 12.35 23.8715-Jun-20 Royalty Pharma plc Health Care NASDAQ Top of range $2.5bn 58.93 53.57 57.365-Feb-20 Central Retail Corp pcl - CRC Consumer Services Thailand SE In range $2.3bn -0.60 -44.05 -28.5728-Jan-20 BlackRock Health Sciences Trust II Financials NYSE In range $2.3bn 0.20 0.00 10.853-Jun-20 Warner Music Group Corp Consumer Services NASDAQ In range $1.9bn 20.48 17.40 20.365-Feb-20 PPD Inc Health Care NASDAQ Top of range $1.9bn 11.11 7.44 4.1530-Jun-20 Dun & Bradstreet Holdings Inc Technology NYSE Above range $1.7bn 15.23 N/A 15.823-Mar-20 GFL Environmental Inc Industrials TMX Below range $1.4bn -11.58 -30.84 -0.9530-Jan-20 Reynolds Consumer Products Inc Consumer Goods NASDAQ In range $1.4bn 9.81 10.96 28.15
Top 10 largest FOs 2020YTD
Pricing date Issuer name Issuer country Sector Exchange Deal typeMoney raised
Performance (% change)
1-day 1-month Current24-Jun-20 T-Mobile US Inc Telecommunications NASDAQ FO - Accelerated Bookbuild $15.9bn 5.27 N/A 1.48
12-May-20 BlackRock Inc Financials NYSE FO - Accelerated Bookbuild $13.3bn 15.67 25.49 31.56
11-Jun-20 Reliance Industries Ltd Oil & Gas BSE; NSE FO - Rights Offer $7.0bn 22.32 49.44 52.51
26-May-20 Sanofi S.A. Health Care NASDAQ FO - Accelerated Bookbuild $6.7bn 5.63 18.71 19.59
5-Feb-20 Petrobras Oil & Gas BM&FBOVESPA FO - Fully Marketed $5.2bn 3.29 -17.12 -39.85
26-Jun-20 PG&E Corp Utilities NYSE FO - Fully Marketed $4.0bn -3.89 N/A -4.63
11-Jun-20 JD.com Inc Consumer Services HKEX FO - Fully Marketed $3.9bn 3.54 N/A 6.99
2-Jun-20 Singapore Airlines Ltd Consumer Services Singapore SE FO - Rights Offer $3.8bn 43.67 28.33 24.00
7-May-20 Hindustan Unilever Ltd Consumer Goods BSE; NSE FO - Accelerated Bookbuild $3.4bn 9.80 9.74 17.49
5-Jun-20 NetEase Inc Technology HKEX FO - Fully Marketed $3.1bn 5.69 23.98 19.51

PwC | Global IPO Watch Q2 2020
IPO and FO activity per region
7
EMEA IPO activity remained subdued with one listing accounting for 42% of 2020 YTD proceeds in the region. In contrast EMEA FO activity was buoyant, 2020 YTD issuance was $22.6bn higher than H1 2019. Asia-Pacific saw a slow down in Q2 2020 IPO activity as compared to Q1 2020, whereas the Americas saw a resurgence.
Americas EMEA Asia-Pacific
FO m
oney
rais
ed &
# o
f dea
lsIP
O m
oney
rais
ed &
# o
f dea
ls
Source: Dealogic, Bloomberg as of 30 June 2020.
$30.8bn
$67.5bn$76.6bn $74.1bn
$40.7bn
149271 309 251
112
2016 2017 2018 2019 2020YTD
YTD: $46.1bn
$219.7bn $215.1bn$190.3bn
$216.3bn
$162.1bn
1,0721,240
1,048 1,127
692
2016 2017 2018 2019 2020YTD
$35.7bn
$55.4bn$47.4bn $53.3bn
$6.9bn
181300 238
12939
2016 2017 2018 2019 2020YTD
YTD: $15.4bn
$119.9bn
$189.9bn
$109.8bn $97.9bn$75.0bn
754946
759 740471
2016 2017 2018 2019 2020YTD
YTD: $52.4bn
$77.3bn$86.1bn $99.7bn
$71.7bn
$30.4bn
684
952
653 660
242
2016 2017 2018 2019 2020YTD
$214.8bn $216.8bn
$162.9bn$145.0bn
$99.0bn
1,368 1,3951,043 926
504
2016 2017 2018 2019 2020YTD
YTD: $59.2bnYTD: $107.0bn
YTD: 24.6bn
Q1 Q2 Q3 Q4 Q1 Q2 Q3 Q4 Q1 Q2 Q3 Q4
PwC | Global IPO Watch Q2 2020
Global IPO and FO activity per sector
8
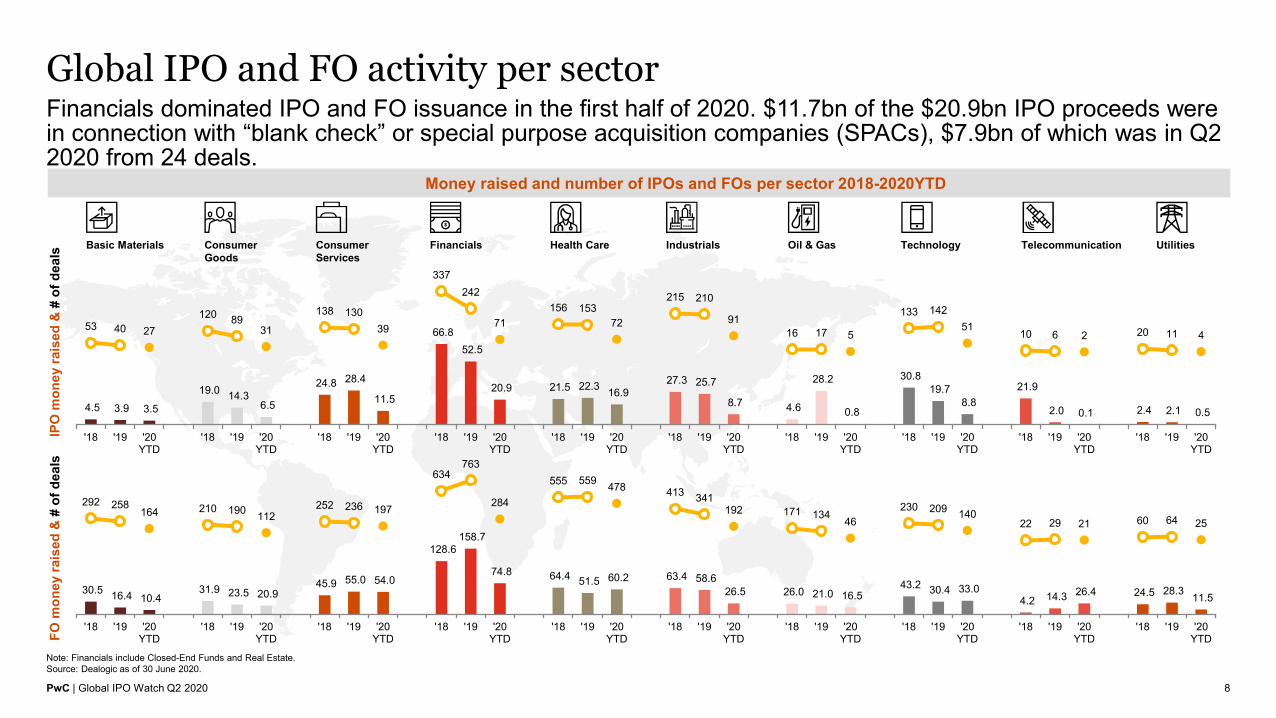
Financials dominated IPO and FO issuance in the first half of 2020. $11.7bn of the $20.9bn IPO proceeds were in connection with “blank check” or special purpose acquisition companies (SPACs), $7.9bn of which was in Q2 2020 from 24 deals.
Money raised and number of IPOs and FOs per sector 2018-2020YTD
Note: Financials include Closed-End Funds and Real Estate. Source: Dealogic as of 30 June 2020.
FO m
oney
rais
ed &
# o
f dea
lsIP
O m
oney
rais
ed &
# of
dea
ls
IndustrialsBasic Materials Health Care TechnologyConsumer Goods
Financials Oil & GasConsumer Services
Telecommunication Utilities
4.5 3.9 3.5
19.0 14.3 6.5
24.8 28.4
11.5
66.8 52.5
20.9 21.5 22.3 16.9 27.3 25.7
8.7 4.6
28.2
0.8
30.8 19.7
8.8 21.9
2.0 0.1 2.4 2.1 0.5
53 40 27120 89
31
138 13039
337242
71156 153
72
215 210
9116 17 5
133 14251
10 6 2 20 11 4
'18 '19 '20YTD
'18 '19 '20YTD
'18 '19 '20YTD
'18 '19 '20YTD
'18 '19 '20YTD
'18 '19 '20YTD
'18 '19 '20YTD
'18 '19 '20YTD
'18 '19 '20YTD
'18 '19 '20YTD
30.5 16.4 10.4 31.9 23.5 20.9
45.9 55.0 54.0
128.6 158.7
74.8 64.4 51.5 60.2 63.4 58.6 26.5 26.0 21.0 16.5
43.2 30.4 33.0 4.2 14.3 26.4 24.5 28.3 11.5
292 258164 210 190 112
252 236 197
634763
284
555 559 478 413 341192 171 134 46
230 209 14022 29 21 60 64 25
'18 '19 '20YTD
'18 '19 '20YTD
'18 '19 '20YTD
'18 '19 '20YTD
'18 '19 '20YTD
'18 '19 '20YTD
'18 '19 '20YTD
'18 '19 '20YTD
'18 '19 '20YTD
'18 '19 '20YTD

PwC | Global IPO Watch Q2 2020
Volatility versus IPO and FO activity
9
Market volatility remains elevated as the global pandemic continues to develop or resurface in all regions.Notwithstanding elevated volatility levels throughout the quarter, the IPO market began to see signs of recovery in June.
Money raised via IPOs and FOs versus volatility
Source: Dealogic, Bloomberg as of 30 June 2020.
Number of IPOs and FOs versus volatility
16.613.7
19.4 17.020.5
15.6 13.2 14.0 11.7 11.5 10.9 10.3
17.2 15.3 12.9
21.316.6 15.1 16.0 13.9
31.234.5
$0bn
$50bn
$100bn
$150bn
$200bn
$250bn
$300bn
Q1 Q2 Q3 Q4 Q1 Q2 Q3 Q4 Q1 Q2 Q3 Q4 Q1 Q2 Q3 Q4 Q1 Q2 Q3 Q4 Q1 Q2
2015 2016 2017 2018 2019 2020
Global money raised via IPOs Global money raised via FOs VIX (average per quarter)
16.613.7
19.417.0
20.515.6
13.2 14.011.7 11.5 10.9 10.3
17.2 15.312.9
21.316.6 15.1 16.0 13.9
31.234.5
-
200
400
600
800
1,000
1,200
Q1 Q2 Q3 Q4 Q1 Q2 Q3 Q4 Q1 Q2 Q3 Q4 Q1 Q2 Q3 Q4 Q1 Q2 Q3 Q4 Q1 Q2
2015 2016 2017 2018 2019 2020
Number of IPOs globally Number of FOs globally VIX (average per quarter)

PwC | Global IPO Watch Q2 2020
AmericasThe US IPO market continues to benefit from the broader market rebound in Q2 that has priced in a "V" shaped economic recovery. The re-opening of the IPO window unleashed a torrent of biotech and technology IPOs, as well as SPACs.
However, it is anticipated that PE backed companies from a broader cross section of the economy will expand the H2 pipeline given the strong pricing environment. Many companies will be attempting to price in advance of the November US presidential elections.
10
David Ethridge IPO Services Co-LeaderPwC US
Alan JonesIPO Services Co-LeaderPwC US

PwC | Global IPO Watch Q2 2020
Money raised via IPOs and FOs in the Americas
11
Q2 2020 saw the Mexican stock exchange’s first +$1bn IPO since Q3 2018 with infrastructure fund Fibra E -Promotora del Desarrollo de America Latina raising $1.1bn, one of only two Latin American IPOs in the quarter.
Money raised via IPOs and FOs in the Americas (10-year overview) Top countries 2020YTD
Note: Top countries have been selected based on money raised in 2020YTD. Source: Dealogic as of 30 June 2020.
% of total money raised
% of total money raised
United States, 91%
Canada, 4%Mexico, 3% Other, 2%
United States, 92%
Brazil, 5%Canada, 3%
$64.6bn $41.6bn $54.4bn $67.7bn $84.1bn $62.6bn $51.6bn $55.2bn $51.8bn
$119.6bn$7.4bn
$3.5bn$4.7bn
$7.7bn $5.9bn$1.7bn $2.9bn $2.1bn $6.2bn
$1.5bn
1,237
1,032
1,162 1,144 1,054 1,072
1,240
1,048 1,127
692
2011 2012 2013 2014 2015 2016 2017 2018 2019 2020 Q2North America - FO $bn Latin America - FO $bn North America - FO $bn (Quarter) Latin America - FO $bn (Quarter) Number of FOs
$19.5bn $27.4bn $23.7bn $27.0bn$16.4bn $7.5bn $17.4bn $19.3bn
$32.8bn $24.4bn
$3.9bn $3.8bn $7.2bn$0.8bn
$2.3bn$0.4bn $2.2bn
$3.8bn$2.9bn
$1.1bn
255 231
322 346
248
149
271 309
251
112
2011 2012 2013 2014 2015 2016 2017 2018 2019 2020 Q2North America - IPO $bn Latin America - IPO $bn North America - IPO $bn (Quarter) Latin America - IPO $bn (Quarter) Number of IPOs
Q1: $15.2bnQ2: $25.6bn
Q1: $41.0bnQ2: $121.1bn

PwC | Global IPO Watch Q2 2020
Overview of IPO and FO activity in the Americas
12
Even with uncertainty caused by the development of COVID-19 in the US, a resurgence in the US IPO market towards the end of the quarter contributed to 66 IPOs raising $25.6bn in Q2 2020.
IPO and FO activity in the Americas
IPO pricing dynamics3
1) Overallotment exercised (%) presents the percentage of IPOs in which the overallotment option has been exercised (either fully or partially).
Note: IPOs are classified as ‘In Range’ if the IPO is priced in the middle 50% of the price range. The top and bottom 25% are classified as ‘Top of Range’ and ‘Bottom of Range’. Source: Dealogic, Bloomberg as of 30 June 2020.
• Despite a slow start to the quarter, the IPO market gained momentum as the quarter progressed – 58% of IPOs took place in June 2020.
• Q2 2020 saw a continuation of sponsor-backed IPO activity, in marked contrast to EMEA and Asia-Pacific where there were no sponsor-backed IPOs.
• Money raised from FOs in Q2 2020 was more than double Q2 2019, an increase of $66.2bn. The number of transactions was up 35% as companies turned to equity markets for support.
• The proportion of IPOs pricing below the bottom of range has seen a notable reduction in 2020 YTD as compared to 2019 - IPOs pricing at the top of or above range has increased.
1
2
3
4
Indices4
2018 2019 Q2 2018 Q2 2019 Apr 2020 May 2020 Jun 2020 Q2 2020
IPO activity
Number of IPOs 309 251 89 89 12 16 38 66
% sponsor-backed 17.8% 15.1% 22.5% 19.1% 0.0% 18.8% 26.3% 19.7%
Money raised $76.6bn $74.1bn $23.0bn $35.6bn $3.8bn $4.9bn $16.8bn $25.6bn
% sponsor-backed 27.2% 24.8% 31.1% 28.1% 0.0% 17.9% 51.5% 37.3%
Advanced metrics
Free float % 36.8% 40.0% 35.5% 35.3% 64.7% 55.0% 38.9% 47.1%
Overallotment exercised (%)1 73.0% 74.8% 78.8% 80.0% 72.7% 43.8% 64.9% 60.9%
% secondary shares 5.9% 4.9% 7.5% 6.3% 0.0% 2.3% 6.0% 4.0%
FO activity
Number of FOs 1,048 1,127 291 320 72 175 186 433
Money raised $190.3bn $216.3bn $57.3bn $54.9bn $11.0bn $56.1bn $53.9bn $121.1bn
2
1
50
70
90
110
130
Jan 20 Feb 20 Mar 20 Apr 20 May 20 Jun 20
Inde
x re
base
d to
100
Dow Jones NASDAQ 100 S&P 500
Q2 2020
13% 11%5%
17% 18%12%
47% 47%50%
11% 9%13%
12% 15% 21%
2018 2019 2020YTD
Below range Bottom of range In range Top of range Above range

PwC | Global IPO Watch Q2 2020
Leading transactions 2020YTD in the Americas
13
Pharmaceutical royalties company, Royalty Pharma, priced at the top of range and traded up c.60% on its first day of trading – raising $2.5bn, this was the largest IPO in the Americas in 2020 YTD. T-Mobile undertook a $15.9bn FO in June, using the proceeds to repurchase stock from Softbank.
Top 10 largest IPOs 2020YTD in the Americas
Note: IPOs are classified as ‘In Range’ if the IPO is priced in the middle 50% of the price range. The top and bottom 25% are classified as ‘Top of Range’ and ‘Bottom of Range’. Source: Dealogic, Bloomberg as of 30 June 2020.
Pricing date Issuer name Issuer country Sector Exchange Pricing Money raisedPerformance (% change)
1-day 1-month Current15-Jun-20 Royalty Pharma plc Health Care NASDAQ Top of range $2.5bn 58.93 53.57 57.3628-Jan-20 BlackRock Health Sciences Trust II Financials NYSE In range $2.3bn 0.20 0.00 10.853-Jun-20 Warner Music Group Corp Consumer Services NASDAQ In range $1.9bn 20.48 17.40 20.365-Feb-20 PPD Inc Health Care NASDAQ Top of range $1.9bn 11.11 7.44 4.1530-Jun-20 Dun & Bradstreet Holdings Inc Technology NYSE Above range $1.7bn 15.23 N/A 15.82
3-Mar-20 GFL Environmental Inc Industrials TMX Below range $1.4bn -11.58 -30.84 -0.95
30-Jan-20 Reynolds Consumer Products Inc Consumer Goods NASDAQ In range $1.4bn 9.81 10.96 28.15
20-Apr-20 Fibra E - Promotora del Desarrollo de America Latina Financials Mexican SE N/A $1.1bn 0.00 0.00 0.00
3-Jun-20 ZoomInfo Technologies Inc Technology NASDAQ Above range $1.1bn 61.90 114.52 92.0526-May-20 Foley Trasimene Acquisition Corp Financials NYSE In range $1.0bn 1.80 5.60 6.00
Top 10 largest FOs 2020YTD in the Americas
Pricing date Issuer name Issuer country Sector Exchange Deal typeMoney raised
Performance (% change)1-day 1-month Current
24-Jun-20 T-Mobile US Inc Telecommunications NASDAQ FO - Accelerated Bookbuild $15.9bn 5.27 N/A 1.4812-May-20 BlackRock Inc Financials NYSE FO - Accelerated Bookbuild $13.3bn 15.67 25.49 31.5626-May-20 Sanofi S.A. Health Care NASDAQ FO - Accelerated Bookbuild $6.7bn 5.63 18.71 19.595-Feb-20 Petrobras Oil & Gas BM&FBOVESPA FO - Fully Marketed $5.2bn 3.29 -17.12 -39.8526-Jun-20 PG&E Corp Utilities NYSE FO - Fully Marketed $4.0bn -3.89 N/A -4.6314-Feb-20 Tesla Inc Consumer Goods NASDAQ FO - Accelerated Bookbuild $2.3bn 4.31 -28.73 95.1828-Apr-20 Southwest Airlines Co Consumer Services NYSE FO - Accelerated Bookbuild $2.3bn 8.67 14.21 14.5318-Jun-20 DraftKings Inc Consumer Services NASDAQ FO - Accelerated Bookbuild $1.8bn 5.00 N/A -26.257-May-20 Danaher Health Care NYSE FO - Accelerated Bookbuild $1.8bn -0.96 6.28 11.9120-May-20 CoStar Group Inc Financials NASDAQ FO - Accelerated Bookbuild $1.7bn -1.74 8.50 4.44

PwC | Global IPO Watch Q2 2020
IPO and FO activity per sector in the Americas
14
The Health Care sector has been prominent in both IPO and FO activity in the first half of the year, reflecting its defensive properties amidst the negative economic outlook.
Money raised and number of IPOs and FOs per sector 2018 – 2020YTD
Note: Financials include Closed-End Funds and Real Estate. Source: Dealogic as of 30 June 2020.
FO m
oney
rais
ed &
# o
f dea
lsIP
O m
oney
rais
ed &
# of
dea
ls
IndustrialsBasic Materials Health Care TechnologyConsumer Goods
Financials Oil & GasConsumer Services
Telecommunication Utilities
0.0 0.1 0.8 4.5 2.4 1.5
10.8 17.3
3.2
30.1 25.6
17.0 10.0
13.5 10.5 11.2
3.0 2.9 1.9 1.4 -
7.6 8.9 4.7
- 0.9 0.0 0.5 1.2 -
1 2 2 15 8 227 22 7
126 102
4981 71
37 18 9 6 8 4 030 29 9 0 1 1 3 3 0
'18 '19 '20YTD
'18 '19 '20YTD
'18 '19 '20YTD
'18 '19 '20YTD
'18 '19 '20YTD
'18 '19 '20YTD
'18 '19 '20YTD
'18 '19 '20YTD
'18 '19 '20YTD
'18 '19 '20YTD
6.5 3.0 2.8 10.3 10.8 9.5
26.0 27.8 21.6
43.6
62.3
35.0 40.3 36.1
42.9
15.2 22.8
5.2 14.6 13.3
6.6 12.9
18.1 14.0
0.6 1.3
17.0 20.2 20.8
7.4
87 80 60 45 58 3589 96 62
203263
89
364 369313
80 93 61 60 45 1082 88 50 5 4 2 33 31 10
'18 '19 '20YTD
'18 '19 '20YTD
'18 '19 '20YTD
'18 '19 '20YTD
'18 '19 '20YTD
'18 '19 '20YTD
'18 '19 '20YTD
'18 '19 '20YTD
'18 '19 '20YTD
'18 '19 '20YTD

PwC | Global IPO Watch Q2 2020
Top countries in terms of IPO activity in the Americas
15
There has been IPO activity across the Americas in the first half of 2020, albeit activity in Canada and Mexico was limited - the US continues to dominate the region.
IPO activity of top countries in the Americas 2016 – 2020YTD
Note: Top countries have been selected based on money raised in 2020YTD. Source: Dealogic as of 30 June 2020.
$26.1bn
$51.5bn$61.7bn
$67.3bn
$37.1bn
122
212247 225
101
2016 2017 2018 2019 2020YTD
$0.7bn $4.3bn $2.0bn $2.1bn $1.6bn
8
2922
153
2016 2017 2018 2019 2020YTD
$3.6bn $6.4bn $10.6bn$1.2bn $1.1bn
15 1831
4 1
2016 2017 2018 2019 2020YTD
$0.2bn$6.4bn $2.0bn $2.5bn $0.8bn
111
3 5 5
2016 2017 2018 2019 2020YTD

PwC | Global IPO Watch Q2 2020
Top countries in terms of FO activity in the Americas
16
Brazilian companies raised $8.6bn from 11 FOs in 2020 YTD, four of which raised +$500m. In contrast, Canadian companies raised $4.8bn from 102 FOs, equivalent to average transaction value of $50m.
FO activity of top countries in the Americas 2016 – 2020YTD
Note: Top countries have been selected based on money raised in 2020YTD. Source: Dealogic as of 30 June 2020.
$179.2bn $178.5bn $169.3bn $181.1bn$148.6bn
774
907
796870
578
2016 2017 2018 2019 2020YTD
$3.3bn$8.4bn
$2.5bn
$23.0bn
$8.6bn
1428
16
49
11
2016 2017 2018 2019 2020YTD
$33.8bn
$25.4bn
$15.1bn $14.2bn
$4.8bn
269284
227205
102
2016 2017 2018 2019 2020YTD
$2.1bn $1.3bn $3.0bn $0.4bn $0.0bn
713 10
2 1
2016 2017 2018 2019 2020YTD
PwC | Global IPO Watch Q2 2020
EMEADemand for EMEA equity deals has been exceptionally strong in Q2 as investors were looking to increase their exposure in a V-shaped turnaround from market lows in mid-March. Issuance activity was dominated by private placings through accelerated bookbuilds and reached levels last seen in 2017.For the remainder of the year we expect to see an increase in rights issues in EMEA as more companies will seek to repair their balance sheets or in anticipation of acquisitions. Market conditions, however, are likely to become more challenging as the year progresses. Uncertainties faced in the second half of the year include the course of the pandemic and the speed of economic recovery, geopolitical tensions, the US presidential elections and the end of the Brexit transition period in December 2020.
17
Mark HughesPartner, Capital MarketsPwC United Kingdom
Carsten StäckerPartner, Equity AdvisoryPwC Germany

PwC | Global IPO Watch Q2 2020
Money raised via IPOs and FOs in EMEA
18
In EMEA, the $2.9bn JDE Peet’s IPO saw the Netherlands secure first position in terms of 2020 YTD IPO proceeds. FO’s in H1 2020 rose significantly from the prior year, as companies responded to the pandemic.
Money raised via IPOs and FOs in EMEA (10-year overview) Top countries 2020YTD
Note: Top countries have been selected based on money raised in 2020YTD. Source: Dealogic as of 30 June 2020.
% of total money raised
% of total money raised
Netherlands, 42%
United Kingdom, 12%Saudi Arabia,
10%
Italy, 10%
Norway, 9%
Other, 17%
United Kingdom,
36%
Switzerland, 13%Germany,
10%
France, 7%
Sweden, 7%
Other, 28%
$22.1bn
$2.7bn $7.0bn
$33.9bn$18.7bn $13.2bn $15.0bn $10.9bn $13.0bn
$4.6bn
$1.0bn
$0.8bn$0.2bn
$1.8bn
$2.3bn$0.4bn $0.5bn
$2.3bn $2.2bn$0.0bn
167
101
182
279 269
181
300
238
129
39
2011 2012 2013 2014 2015 2016 2017 2018 2019 2020 Q2
Europe - IPO $bn Middle East & Africa - IPO $bn Europe - IPO $bn (Quarter) Middle East & Africa - IPO $bn (Quarter) Number of IPOs
$54.8bn$16.0bn
$62.5bn $67.9bn$44.0bn $39.0bn
$61.4bn$36.8bn $28.0bn $46.9bn
$5.7bn
$2.6bn
$1.3bn $4.2bn
$2.0bn $4.9bn$6.3bn
$3.7bn $1.2bn$1.2bn
628
521
637
737808
754
946
759 740
471
2011 2012 2013 2014 2015 2016 2017 2018 2019 2020 Q2
Europe - FO $bn Middle East & Africa - FO $bn Europe - FO $bn (Quarter) Middle East & Africa - FO $bn (Quarter) Number of FOs
Q1: $2.2bnQ2: $4.6bn
Q1: $26.9bnQ2: $48.1bn

PwC | Global IPO Watch Q2 2020
Overview of IPO and FO activity in EMEA
19
EMEA IPO activity remains scarce in Q2 2020 with just 16 companies able to execute an IPO in the quarter. The number of companies undertaking FOs was up on both Q2 2019 and Q1 2020.
IPO and FO activity in EMEA
IPO pricing dynamics
2
1) Overallotment exercised (%) presents the percentage of IPOs in which the overallotment option has been exercised (either fully or partially).
Note: IPOs are classified as ‘In Range’ if the IPO is priced in the middle 50% of the price range. The top and bottom 25% are classified as ‘Top of Range’ and ‘Bottom of Range’.
Source: Dealogic, Bloomberg as of 30 June 2020.
• Q2 2020 IPO proceeds were more than double Q1 2020, however, proceeds were 68% lower than Q2 2019 reflective of just 16 companies coming to market in the quarter.
• There were no sponsor-backed IPOs in the quarter.
• There was a steady flow of FO activity throughout the quarter. FO proceeds were up 65% as compared to Q2 2019 and 70% compared to the first quarter of the year.
• The majority of companies that were able to execute an IPO in the quarter priced in range.
• The DAX has bounced back more strongly than the FTSE100 (UK) and CAC 40 (France) since the low point in March 2020.
1
2
3
Indices
3
2018 2019 Q2 2018 Q2 2019 Apr 2020 May 2020 Jun 2020 Q2 2020IPO activityNumber of IPOs 238 129 83 47 0 6 10 16
% sponsor-backed 10.9% 14.7% 10.8% 19.1% 0.0% 0.0% 0.0% 0.0%
Money raised $47.4bn $53.3bn $12.1bn $14.5bn $0.0bn $3.2bn $1.4bn $4.6bn
% sponsor-backed 20.5% 23.9% 37.6% 44.1% 0.0% 0.0% 0.0% 0.0%
Advanced metricsFree float % 41.2% 38.1% 42.2% 41.3% 0.0% 23.5% 29.4% 27.1%
Overallotment exercised (%)1 25.7% 25.8% 28.4% 33.3% 0.0% 50.0% 20.0% 31.3%
% secondary shares 29.5% 34.3% 30.9% 42.3% 0.0% 46.5% 34.2% 38.8%
FO activity
Number of FOs 759 740 235 220 81 89 120 290
Money raised $109.8bn $97.9bn $40.4bn $29.2bn $10.5bn $20.2bn $17.4bn $48.1bn
1
60
70
80
90
100
110
Jan 20 Feb 20 Mar 20 Apr 20 May 20 Jun 20
Inde
x re
base
d to
100
CAC 40 DAX FTSE 100
4
4
8% 7% 3%
20% 25%12%
66% 61%74%
6% 6% 9%1% 2% 3%
2018 2019 2020YTD
Below range Bottom of range In range Top of range Above range
Q2 2020
5
5

PwC | Global IPO Watch Q2 2020
Leading transactions 2020YTD in EMEA
20
Filter and component manufacturer GVS S.P.A.s $0.6bn IPO priced at the top of range in June 2020. GVS has a diverse customer base with over 50% of revenue derived from the healthcare and lifesciences industry.
Top 10 largest IPOs 2020YTD in EMEA
Note: IPOs are classified as ‘In Range’ if the IPO is priced in the middle 50% of the price range. The top and bottom 25% are classified as ‘Top of Range’ and ‘Bottom of Range’. Source: Dealogic, Bloomberg as of 30 June 2020.
Pricing date Issuer name Issuer country Sector Exchange Pricing Money raisedPerformance (% change)
1-day 1-month Current29-May-20 JDE Peet's BV Consumer Goods Euronext Amsterdam In range $2.9bn 13.78 12.35 23.879-Mar-20 Dr Sulaiman Al Habib Medical Group Co Health Care Saudi SE Top of range $0.7bn 10.00 9.00 76.2016-Jun-20 GVS SpA Basic Materials Borsa Italiana Top of range $0.6bn 21.72 N/A 32.027-Feb-20 Calisen plc Industrials LSE In range $0.4bn 0.00 -13.13 -25.6912-May-20 Pexip Holding ASA Technology Euronext Oslo In range $0.2bn 38.89 39.33 35.40
25-Jun-20 Aker BioMarine AS Consumer Goods Euronext Oslo In range $0.2bn -13.68 N/A -11.70
12-Feb-20 Musti Group Oyj Consumer Services NASDAQ Helsinki Top of range $0.2bn 24.57 -14.29 89.7118-Jun-20 PharmaSGP Holding SE Health Care Deutsche Börse Bottom of range $0.1bn 9.52 N/A -3.4919-Feb-20 Nippon Active Value Fund plc Financials LSE In range $0.1bn 2.00 -1.50 -1.5017-Feb-20 BW Energy Ltd Oil & Gas Euronext Oslo Below range $0.1bn -1.02 -64.55 -25.16
Top 10 largest FOs 2020YTD in EMEA
Pricing date Issuer name Issuer country Sector Exchange Deal typeMoney raised
Performance (% change)
1-day 1-month Current27-May-20 Sika AG Industrials SIX Swiss Exchange FO - Accelerated Bookbuild $2.6bn -1.19 8.07 14.88
19-May-20 Compass Group plc Consumer Services LSE FO - Accelerated Bookbuild $2.4bn 11.37 15.02 7.46
3-Feb-20 SGS SA Industrials SIX Swiss Exchange FO - Accelerated Bookbuild $2.4bn 7.34 1.69 -2.19
31-Mar-20 Ams AG Technology SIX Swiss Exchange FO - Accelerated Bookbuild, Rights Offer $1.8bn -5.76 36.63 77.77
16-Jun-20 China Pacific Insurance (Group) Co Ltd Financials LSE FO - Fully Marketed $1.8bn 1.14 N/A 15.34
22-Jan-20 Prosus NV Technology Euronext Amsterdam FO - Accelerated Bookbuild $1.6bn 2.18 5.45 30.40
4-Feb-20 Worldline SA Industrials Euronext Paris FO - Accelerated Bookbuild $1.6bn 3.41 15.93 26.50
27-Jan-20 Iliad SA Telecommunications Euronext Paris FO - Guaranteed Preferential Allocation $1.5bn -3.88 11.63 46.83
10-Jun-20 Whitbread plc Consumer Services LSE FO - Accelerated Bookbuild, Rights Offer $1.4bn 66.73 44.27 49.73
16-Apr-20 Informa plc Consumer Services LSE FO - Accelerated Bookbuild $1.3bn 12.35 3.50 5.60

PwC | Global IPO Watch Q2 2020
IPO and FO activity per sector in EMEA
21
Heightened levels of FO activity in Consumer Services has continued in Q2 2020 as widespread lockdowns eroded company balance sheets - within the sector, hospitality businesses have raised over $5.0bn in 2020 YTD.
Money raised and number of IPOs and FOs per sector 2018 – 2020YTD
Note: Financials include Closed-End Funds and Real Estate. Source: Dealogic as of 30 June 2020.
FO m
oney
rais
ed &
# o
f dea
lsIP
O m
oney
rais
ed &
# of
dea
ls
IndustrialsBasic Materials Health Care TechnologyConsumer Goods
Financials Oil & GasConsumer Services
Telecommunication Utilities
1.6 0.1 0.6 7.5
1.1 3.4 3.2 5.6 0.2
16.8
6.1 0.5
6.8 1.0 1.0
7.1 9.4
0.6 0.6
25.7
0.1 2.1 3.1 0.4 0.3 1.1 0.0 1.4 0.1 0.0
5 2 122 12 7
22 231
88
287 17 14 6
4129
6 3 6 1
3010 8 3 2 1 7 3 1
'18 '19 '20YTD
'18 '19 '20YTD
'18 '19 '20YTD
'18 '19 '20YTD
'18 '19 '20YTD
'18 '19 '20YTD
'18 '19 '20YTD
'18 '19 '20YTD
'18 '19 '20YTD
'18 '19 '20YTD
9.4 5.0 3.7 8.0 4.9 3.8 12.5 8.9 16.0
35.6 34.1
13.3 12.4 8.4 7.7 18.3 19.2 14.8
5.1 3.3 1.3 4.4 5.5 9.9 2.4 5.5 3.0 1.6 3.2 1.5
40 37 28 56 50 3087 70 75
216 224
91 102 116 103 110 11464 71 50 20
57 56 41 9 8 11 11 15 8
'18 '19 '20YTD
'18 '19 '20YTD
'18 '19 '20YTD
'18 '19 '20YTD
'18 '19 '20YTD
'18 '19 '20YTD
'18 '19 '20YTD
'18 '19 '20YTD
'18 '19 '20YTD
'18 '19 '20YTD

PwC | Global IPO Watch Q2 2020
Top countries in terms of IPO activity in EMEA
22
Whilst there were five IPOs in 2020 YTD in the UK, the Netherlands leads in terms of IPO proceeds following the JDE Peet’s mega IPO.
IPO activity of top countries in EMEA 2016 – 2020YTD
Note: Top countries have been selected based on money raised in 2020YTD. Source: Dealogic as of 30 June 2020.
$3.2bn$0.8bn $2.2bn
$0.0bn$2.9bn
5 2 5 0 1
2016 2017 2018 2019 2020YTD
$7.6bn
$14.8bn$12.7bn
$7.5bn
$0.8bn
52
8068
275
2016 2017 2018 2019 2020YTD
$0.7bn $1.0bn $1.2bn
$26.6bn
$0.7bn
316 11 5 2
2016 2017 2018 2019 2020YTD
1.6
$6.2bn
$2.4bn $2.8bn$0.7bn
927 26 23
3
2016 2017 2018 2019 2020YTD
PwC | Global IPO Watch Q2 2020
Top countries in terms of FO activity in EMEA
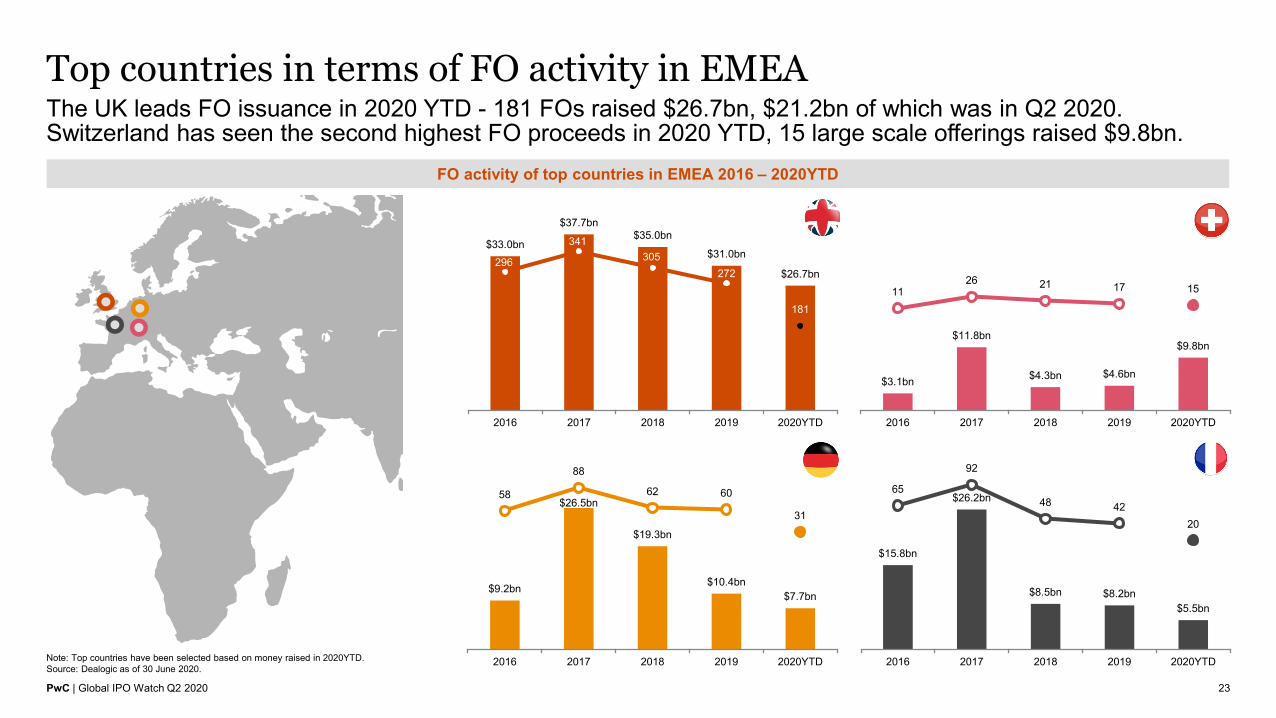
23
The UK leads FO issuance in 2020 YTD - 181 FOs raised $26.7bn, $21.2bn of which was in Q2 2020. Switzerland has seen the second highest FO proceeds in 2020 YTD, 15 large scale offerings raised $9.8bn.
FO activity of top countries in EMEA 2016 – 2020YTD
Note: Top countries have been selected based on money raised in 2020YTD. Source: Dealogic as of 30 June 2020.
$33.0bn
$37.7bn$35.0bn
$31.0bn
$26.7bn296
341305
272
181
2016 2017 2018 2019 2020YTD
$3.1bn
$11.8bn
$4.3bn $4.6bn
$9.8bn
1126 21 17 15
2016 2017 2018 2019 2020YTD
$9.2bn
$26.5bn
$19.3bn
$10.4bn$7.7bn
58
88
62 60
31
2016 2017 2018 2019 2020YTD
$15.8bn
$26.2bn
$8.5bn $8.2bn$5.5bn
65
92
48 4220
2016 2017 2018 2019 2020YTD
PwC | Global IPO Watch Q2 2020
Asia-PacificAsia-Pacific IPO activities launched a strong comeback with the China market dominating the bounce back accounting for 66% of total Asia-Pacific funds raised in the first half of 2020, on the back of strong economic recovery from COVID-19.Activity for the remainder of the year is expected to accelerate with more US listed Chinese issuers seeking secondary listing in Hong Kong and registration based IPO market reform in the China A-share market. In July 2020 Ant Group announced its long-awaited public offering with a dual listing in Shanghai and Hong Kong – this is expected to be one the largest IPOs of the year.
24
Kennedy LiuHead of Capital MarketsPwC Mainland China and Hong Kong
Geoffrey TangDirector, Capital MarketsPwC Hong Kong

PwC | Global IPO Watch Q2 2020
Money raised via IPOs and FOs in Asia-Pacific
25
China continued a strong start to the year with 73 IPOs raising $8.6bn in Q2 2020 (Q1 2020: 52 / $11.5bn).231 Australia FOs raised $21.7bn in the first half of 2020; in contrast, there were 8 IPOs on the Australian exchange.
Money raised via IPOs and FOs in Asia-Pacific (10-year overview) Top countries 2020YTD
Note: Top countries have been selected based on money raised in 2020YTD. Source: Dealogic as of 30 June 2020.
% of total money raised
% of total money raised
China, 66%Hong Kong,
14%
Thailand, 7%
India, 5%
South Korea, 3%
Other, 5%
Hong Kong, 26%
Australia, 22%India, 20%
China, 17%
Japan, 6%
Other, 9%
$35.2bn$14.3bn $16.3bn $10.3bn
$26.1bn$11.9bn $18.5bn $25.2bn
$14.7bn $12.1bn
$0.3bn
$0.2bn$2.3bn
$4.2bn
$2.4bn
$2.1bn$1.2bn
$1.9bn $1.3bn$0.0bn
620
397 363
542
668 684
952
653 660
242
2011 2012 2013 2014 2015 2016 2017 2018 2019 2020 Q2
Asia - IPO $bn Australasia - IPO $bn Asia - IPO $bn (Quarter) Australasia - IPO $bn (Quarter) Number of IPOs
$28.8bn $21.7bn $29.1bn $40.8bn$86.0bn
$46.4bn $37.9bn $31.1bn $28.8bn$54.5bn$9.1bn $4.9bn $4.1bn
$8.6bn
$9.0bn
$4.6bn $4.4bn $4.7bn $7.4bn
$18.5bn
1077978
1265 13251478
1368 1395
1043926
504
2011 2012 2013 2014 2015 2016 2017 2018 2019 2020 Q2
Asia - FO $bn Australasia - FO $bn Asia - FO $bn (Quarter) Australasia - FO $bn (Quarter) Number of FOs
Q1: $18.3bnQ2: $12.1bn
Q1: $26.0bnQ2: $73.0bn

PwC | Global IPO Watch Q2 2020
Overview of IPO and FO activity in Asia-Pacific
26
Whilst Asia-Pacific IPO activity levels and proceeds were lower than Q1 2020, the IPO market remained open with 104 IPOs raising $12.1bn in Q2 2020.
IPO and FO activity in Asia-Pacific
IPO pricing dynamics
2
1) Overallotment exercised (%) presents the percentage of IPOs in which the overallotment option has been exercised (either fully or partially).
Note: IPOs are classified as ‘In Range’ if the IPO is priced in the middle 50% of the price range. The top and bottom 25% are classified as ‘Top of Range’ and ‘Bottom of Range’.
Source: Dealogic, Bloomberg as of 30 June 2020.
• IPO activity continued throughout the quarter, however, the number of IPOs was 32% lower than Q2 2019 -proceeds were down 24%.
• The overallotment exercised in Q2 2020 was considerably lower than previous quarters – on average 5.8% were exercised.
• FO proceeds of $73.0bn was more than double Q2 2019, as 340 companies listed in Asia-Pacific undertook FOs in the quarter – an 26% increase on Q2 2019.
• The SSE Composite Index (China) has recovered relatively well compared to the Hang Seng (Hong Kong) and SENSEX (India) since the March low point.
1
2
3
Indices
3
2018 2019 Q2 2018 Q2 2019 Apr 2020 May 2020 Jun 2020 Q2 2020
IPO activity
Number of IPOs 653 660 153 154 41 27 36 104
% sponsor-backed 2.5% 1.8% 4.6% 3.2% 0.0% 0.0% 0.0% 0.0%
Money raised $99.7bn $71.7bn $27.1bn $16.0bn $4.5bn $3.5bn $4.1bn $12.1bn
% sponsor-backed 4.1% 7.1% 7.5% 6.6% 0.0% 0.0% 0.0% 0.0%
Advanced metrics
Free float % 27.5% 26.6% 25.3% 28.5% 21.4% 24.8% 21.4% 22.3%
Overallotment exercised (%)1 18.4% 18.0% 18.2% 18.1% 2.4% 14.8% 2.8% 5.8%
% secondary shares 11.5% 10.8% 14.4% 11.2% 1.5% 1.7% 6.4% 3.2%
FO activity
Number of FOs 1,043 926 291 251 102 103 135 340
Money raised $162.9bn $145.0bn $35.8bn $36.2bn $19.1bn $20.6bn $33.4bn $73.0bn
1
60
70
80
90
100
110
Jan 20 Feb 20 Mar 20 Apr 20 May 20 Jun 20
Inde
x R
ebas
ed to
100
Hang Seng SSE Composite SENSEX
4
4
3% 3% 0%
21% 24% 31%
41% 34% 35%
32% 37% 33%
3% 2% 0%
2018 2019 2020YTD
Below range Bottom of range In range Top of range Above range
Q2 2020

PwC | Global IPO Watch Q2 2020
Leading transactions 2020YTD in Asia-Pacific
27
The largest IPO of Q2 2020 was SK Biopharmaceuticals Co Ltd raising $0.8bn on the Korea Stock Exchange. Reliance Industries’ $7.0bn FO in June 2020 was India’s largest ever rights issue.
Top 10 largest IPOs 2020YTD in EMEA
Note: IPOs are classified as ‘In Range’ if the IPO is priced in the middle 50% of the price range. The top and bottom 25% are classified as ‘Top of Range’ and ‘Bottom of Range’. Source: Dealogic, Bloomberg as of 30 June 2020.
Pricing date Issuer name Issuer country Sector Exchange Pricing Money raisedPerformance (% change)
1-day 1-month Current3-Jan-20 Beijing-Shanghai High Speed Railway Co Ltd Consumer Services Shanghai SE N/A $4.4bn 38.73 49.59 41.395-Feb-20 Central Retail Corp pcl - CRC Consumer Services Thailand SE In range $2.3bn -0.60 -44.05 -28.576-Mar-20 SBI Cards & Payments Services Ltd Financials BSE; NSE Top of range $1.4bn -9.51 -33.16 -8.4319-Jun-20 SK Biopharmaceuticals Co Ltd Health Care Korea Exchange Top of range $0.8bn 159.18 N/A 261.2210-Feb-20 Beijing Roborock Technology Co Ltd Consumer Goods STAR Market N/A $0.6bn 84.46 29.53 59.7111-Feb-20 China Resources Microelectronics Ltd Technology STAR Market N/A $0.5bn 228.20 176.95 396.17
15-Jan-20 Gongniu Group Co Ltd Industrials Shanghai SE N/A $0.5bn 44.00 208.21 184.5119-Jun-20 Kangji Medical Holdings Ltd Health Care HKEX Top of range $0.5bn 98.85 N/A 131.99
28-Apr-20 Zhongtai Securities Co Ltd Financials Shanghai SE N/A $0.4bn 44.06 225.34 379.00
17-Apr-20 Akeso Inc Health Care HKEX Top of range $0.4bn 50.19 59.15 129.30
Top 10 largest FOs 2020YTD in EMEA
Pricing date Issuer name Issuer country Sector Exchange Deal typeMoney raised
Performance (% change)1-day 1-month Current
11-Jun-20 Reliance Industries Ltd Oil & Gas BSE; NSE FO - Rights Offer $7.0bn 22.32 49.44 52.5111-Jun-20 JD.com Inc Consumer Services HKEX FO - Fully Marketed $3.9bn 3.54 N/A 6.992-Jun-20 Singapore Airlines Ltd Consumer Services Singapore SE FO - Rights Offer $3.8bn 43.67 28.33 24.007-May-20 Hindustan Unilever Ltd Consumer Goods BSE; NSE FO - Accelerated Bookbuild $3.4bn 9.80 9.74 17.495-Jun-20 NetEase Inc Technology HKEX FO - Fully Marketed $3.1bn 5.69 23.98 19.5122-May-20 SoftBank Corp Telecommunications Tokyo SE FO - Bought Deal $2.9bn -0.08 4.39 7.209-Jan-20 Bharti Airtel Ltd Telecommunications BSE; NSE FO - Accelerated Bookbuild $2.0bn 2.74 21.26 32.4428-Apr-20 National Australia Bank Financials ASX FO - Accelerated Bookbuild $1.9bn 8.27 26.29 27.9223-Jan-20 ZTE Corp Technology Shenzhen SE FO - Cash Placing $1.7bn 27.01 75.24 48.3025-Apr-20 Bank of Nanjing Co Ltd Financials Shanghai SE FO - Cash Placing $1.6bn -1.57 0.52 5.77

PwC | Global IPO Watch Q2 2020
IPO and FO activity per sector in Asia-Pacific
28
Consumer Services 2020 YTD IPO proceeds exceed full year 2019, including $6.7bn raised from two transactions. There has been a notable drop off in IPO and FO activity in the Financials sector in 2020 YTD.
Money raised and number of IPOs and FOs per sector 2018 – 2020YTD
Note: Financials include Closed-End Funds and Real Estate. Source: Dealogic as of 30 June 2020.
FO m
oney
rais
ed &
# o
f dea
lsIP
O m
oney
rais
ed &
# of
dea
ls
IndustrialsBasic Materials Health Care TechnologyConsumer Goods
Financials Oil & GasConsumer Services
Telecommunication Utilities
2.9 3.7 2.0 7.0
10.8
1.6
10.9 5.5 8.1
19.9 20.9
3.4 4.7 7.7 5.4 8.9 13.3
5.2 2.2 1.1 0.7
21.1
7.7 3.7
21.6
0.1 - 0.4 0.8 0.5
48 36 2584 69
2289 85
31123 112
1558 68 29
156 17279
5 7 473 103
34 7 3 0 10 5 3
'18 '19 '20YTD
'18 '19 '20YTD
'18 '19 '20YTD
'18 '19 '20YTD
'18 '19 '20YTD
'18 '19 '20YTD
'18 '19 '20YTD
'18 '19 '20YTD
'18 '19 '20YTD
'18 '19 '20YTD
14.7 8.5 4.7 13.6 8.2 7.5 7.4
18.3 16.4
49.4 62.3
26.5 11.8 7.9 10.7
29.8 16.6
6.5 6.3 4.4 8.6 25.9
6.8 9.1 1.2 7.6 6.4 2.6 4.3 2.6
170 14279 109 83 47 76 70 60
216277
104 90 79 65
223134
67 43 41 1892 65 49
8 17 8 16 18 7
'18 '19 '20YTD
'18 '19 '20YTD
'18 '19 '20YTD
'18 '19 '20YTD
'18 '19 '20YTD
'18 '19 '20YTD
'18 '19 '20YTD
'18 '19 '20YTD
'18 '19 '20YTD
'18 '19 '20YTD

PwC | Global IPO Watch Q2 2020
Top countries in terms of IPO activity in Asia-Pacific
29
Over 80% of full year 2019 IPO proceeds have been raised in China in the first half of 2020. In contrast, 2020 YTD Hong Kong IPO proceeds are less than 20% of full year 2019.
IPO activity of top countries in Asia-Pacific 2016 – 2020YTD
Note: Top countries have been selected based on money raised in 2020YTD. Source: Dealogic as of 30 June 2020.
$4.0bn
$11.5bn
$5.3bn$3.0bn $1.4bn
28 45 43 23 1
2016 2017 2018 2019 2020YTD
$1.5bn $3.5bn $2.5bn $3.8bn $2.3bn
26 4217 28
2
2016 2017 2018 2019 2020YTD
$21.3bn
$14.3bn
$33.4bn $25.3bn
$4.3bn
112155
196154
56
2016 2017 2018 2019 2020YTD
$24.3bn
$31.6bn
$18.4bn
$24.5bn$20.1bn
252
411
96
196125
2016 2017 2018 2019 2020YTD

PwC | Global IPO Watch Q2 2020
Top countries in terms of FO activity in Asia-Pacific
30
FO activity remains buoyant across the major economies in Asia-Pacific. 93 companies listed in Hong Kong undertook FOs in the first half of 2020 raising $26.3bn, close to full year 2019 levels.
FO activity of top countries in Asia-Pacific 2016 – 2020YTD
Note: Top countries have been selected based on money raised in 2020YTD. Source: Dealogic as of 30 June 2020.
$20.2bn
$26.9bn$31.1bn $31.8bn
$26.3bn
246 270
164118
93
2016 2017 2018 2019 2020YTD
$17.5bn$21.5bn $21.7bn
$25.8bn$21.7bn
322370
329375
231
2016 2017 2018 2019 2020YTD
$5.6bn
$18.2bn
$9.4bn
$22.7bn$19.4bn
4285
54 6224
2016 2017 2018 2019 2020YTD
$140.0bn
$86.6bn
$49.2bn$28.5bn $16.5bn
456
281
140116
66
2016 2017 2018 2019 2020YTD

PwC | Global IPO Watch Q2 2020
• The Global IPO Watch analyses IPO and FO trends on a quarterly basis, both at a global and regional level.
• It is based on data extracted from Dealogic, whereby only transactions with a minimum of $5 million money raised have been included.
• Transaction proceeds include the overallotment option (if exercised).• The data excludes PIPOs and transactions on Over-The-Counter
exchanges.• In case IPOs or FOs take place on two or more exchanges, the full amount
of money raised is attributed to all exchanges. The same applies to countries and regions. This does not apply to two exchanges within the same country or two countries within the same region.
• Country indicates the company’s country of domicile.• Industry classification is based on the FTSE Russell Industry Classification
Benchmark.• Index performance is based on pricing data extracted from Bloomberg.
Basis of preparation
31
PwC | Global IPO Watch Q2 2020
Contacts
32
Ross Hunter David Ethridge
[email protected] [email protected]
Mark Hughes Alan Jones
[email protected] [email protected]
Nadja Picard Kennedy Liu
[email protected] [email protected]
Carsten Stäcker Geoffrey Tang

pwc.com
Thank you
©2020 PwC. All rights reserved. PwC refers to the US member firm or one of its subsidiaries or affiliates, and may sometimes refer to the PwC network. Each member firm is a separate legal entity. Please see www.pwc.com/structure for further details.