Embed Size (px)
Citation preview

Global IPO trends: Q2 2017Investor confidence is growing

ContentsGlobal IPO market 3Americas 7Asia-Pacific 11Europe, Middle East, India and Africa 21Appendix 29About this reportEY Global IPO Trends report is released every quarter and looks at the IPO markets, trends and outlook for the Americas, Asia-Pacific, Japan and EMEIA regions.
The report provides insights, facts and figures on the 2017 IPO market year-to-date and analyzes the implications for companies planning to go public in the short and medium term.
You will find this report at the EY Global IPO Center, where you can also subscribe for future editions.
All values are US$ unless otherwise noted.
Global IPO Trends: Q2 2017 | Page 3
Global IPO marketGlobal IPO market defies political uncertainties“Economic fundamentals are improving in the major developed economies and IPO pipelines are building. Activity is underpinned by rallies in many bull markets reaching all-time highs, while investor sentiment has brightened and global outlook is positive. With the positive momentum of the first half, 2017 is poised to surpass 2016 global IPO levels by both number and proceeds.”Dr. Martin SteinbachEY Global and EMEIA IPO Leader
Global IPO Trends: Q2 2017 | Page 4All values are US$ unless otherwise noted. | Q2 2017 and Q2 17 refer to the second quarter of 2017 and cover priced IPOs from 1 April to 17 June 2017 plus expected IPOs by end of June. YTD 2017 refer to the first six months of 2017 and cover priced IPOs from 1 January to 17 June 2017 plus expected IPOs by end of June.
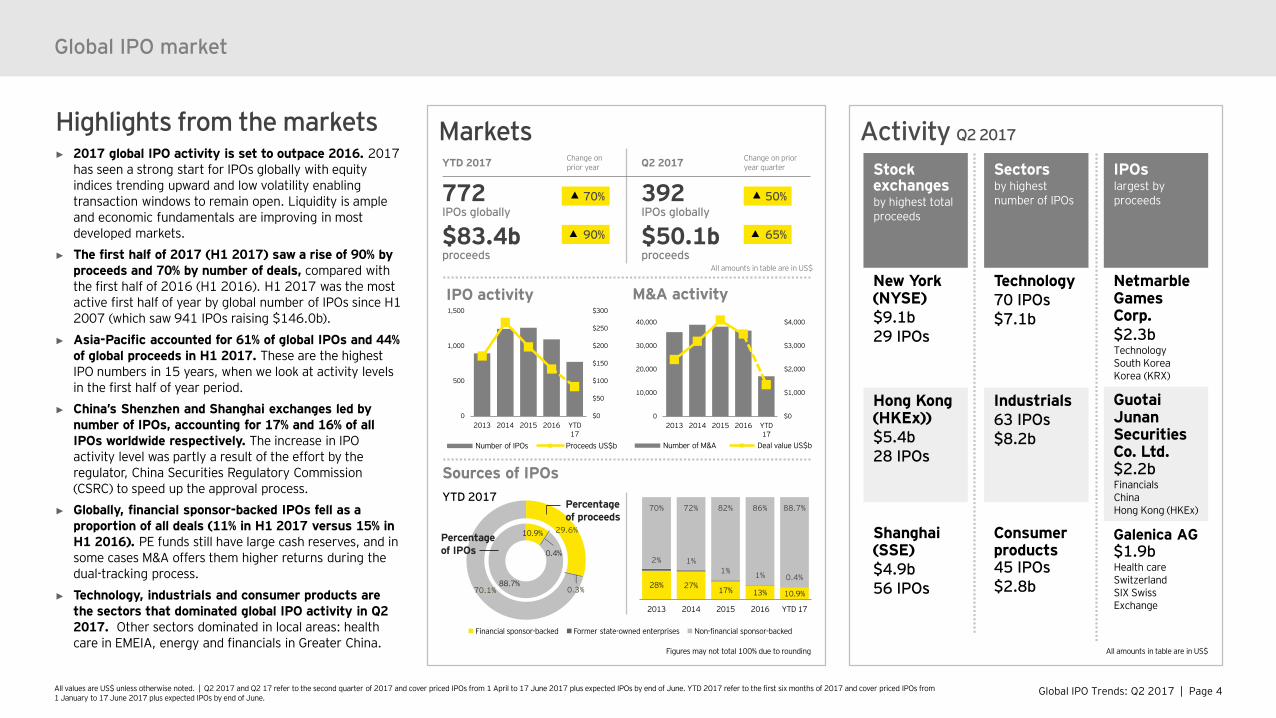
Markets Highlights from the markets► 2017 global IPO activity is set to outpace 2016. 2017
has seen a strong start for IPOs globally with equity indices trending upward and low volatility enabling transaction windows to remain open. Liquidity is ample and economic fundamentals are improving in most developed markets.
► The first half of 2017 (H1 2017) saw a rise of 90% by proceeds and 70% by number of deals, compared with the first half of 2016 (H1 2016). H1 2017 was the most active first half of year by global number of IPOs since H1 2007 (which saw 941 IPOs raising $146.0b).
► Asia-Pacific accounted for 61% of global IPOs and 44% of global proceeds in H1 2017. These are the highest IPO numbers in 15 years, when we look at activity levels in the first half of year period.
► China’s Shenzhen and Shanghai exchanges led by number of IPOs, accounting for 17% and 16% of all IPOs worldwide respectively. The increase in IPO activity level was partly a result of the effort by the regulator, China Securities Regulatory Commission (CSRC) to speed up the approval process.
► Globally, financial sponsor-backed IPOs fell as a proportion of all deals (11% in H1 2017 versus 15% in H1 2016). PE funds still have large cash reserves, and in some cases M&A offers them higher returns during the dual-tracking process.
► Technology, industrials and consumer products are the sectors that dominated global IPO activity in Q2 2017. Other sectors dominated in local areas: health care in EMEIA, energy and financials in Greater China.
Global IPO market
Activity Q2 2017
Stock exchangesby highest total proceeds
New York (NYSE)$9.1b29 IPOs
Hong Kong (HKEx))$5.4b28 IPOs
Shanghai (SSE)$4.9b56 IPOs
IPOslargest by proceeds
Netmarble Games Corp.$2.3bTechnologySouth KoreaKorea (KRX)
GuotaiJunanSecurities Co. Ltd.$2.2bFinancialsChinaHong Kong (HKEx)
Galenica AG $1.9bHealth care SwitzerlandSIX Swiss Exchange
Sectorsby highest number of IPOs
Technology70 IPOs$7.1b
Industrials63 IPOs$8.2b
Consumer products45 IPOs$2.8b
Sources of IPOsYTD 2017
All amounts in table are in US$
29.6%
0.3%70.1%
Percentage of proceeds
10.9%
0.4%
88.7%
Percentage of IPOs
Financial sponsor-backed Former state-owned enterprises Non-financial sponsor-backed
$0
$1,000
$2,000
$3,000
$4,000
0
10,000
20,000
30,000
40,000
2013 2014 2015 2016 YTD 17
M&A activity
Number of M&A Deal value US$b
28% 27% 17% 13% 10.9%
2% 1%1% 1% 0.4%
70% 72% 82% 86% 88.7%
2013 2014 2015 2016 YTD 17
$0
$50
$100
$150
$200
$250
$300
0
500
1,000
1,500
2013 2014 2015 2016 YTD 17
IPO activity
Number of IPOs Proceeds US$b
Figures may not total 100% due to rounding
YTD 2017 Change on prior year Q2 2017 Change on prior
year quarter
772IPOs globally
392IPOs globally
$83.4bproceeds
$50.1bproceeds
All amounts in table are in US$
50%
65%
70%
90%
Global IPO Trends: Q2 2017 | Page 5All values are US$ unless otherwise noted. | Q2 2017 and Q2 17 refer to the second quarter of 2017 and cover priced IPOs from 1 April to 17 June 2017 plus expected IPOs by end of June. YTD 2017 refer to the first six months of 2017 and cover priced IPOs from 1 January to 17 June 2017 plus expected IPOs by end of June.
Regional performance and trends
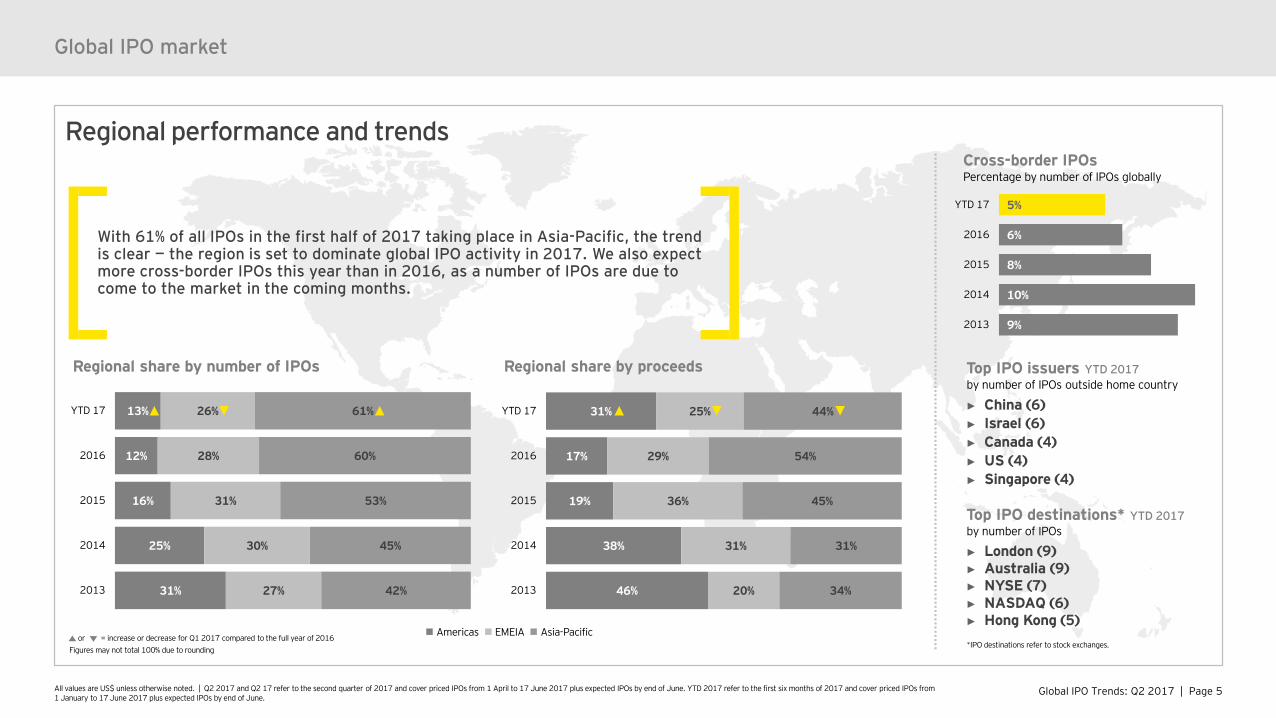
31%
25%
16%
12%
13%
27%
30%
31%
28%
26%
42%
45%
53%
60%
61%
2013
2014
2015
2016
YTD 17
Regional share by number of IPOs
46%
38%
19%
17%
31%
20%
31%
36%
29%
25%
34%
31%
45%
54%
44%
2013
2014
2015
2016
YTD 17
Regional share by proceeds
Global IPO market
With 61% of all IPOs in the first half of 2017 taking place in Asia-Pacific, the trend is clear — the region is set to dominate global IPO activity in 2017. We also expectmore cross-border IPOs this year than in 2016, as a number of IPOs are due to come to the market in the coming months.
Americas EMEIA Asia-Pacific
Top IPO issuers YTD 2017by number of IPOs outside home country
► China (6)► Israel (6)► Canada (4)► US (4)► Singapore (4)
Top IPO destinations* YTD 2017by number of IPOs
► London (9)► Australia (9)► NYSE (7)► NASDAQ (6)► Hong Kong (5)
or = increase or decrease for Q1 2017 compared to the full year of 2016Figures may not total 100% due to rounding
9%
10%
8%
6%
5%
2013
2014
2015
2016
YTD 17
Cross-border IPOs Percentage by number of IPOs globally
*IPO destinations refer to stock exchanges.
Global IPO Trends: Q2 2017 | Page 6All values are US$ unless otherwise noted. | Q2 2017 and Q2 17 refer to the second quarter of 2017 and cover priced IPOs from 1 April to 17 June 2017 plus expected IPOs by end of June. YTD 2017 refer to the first six months of 2017 and cover priced IPOs from 1 January to 17 June 2017 plus expected IPOs by end of June.
Outlook► The outlook for the second half of 2017 is robust as
equities continue to trade at all-time highs and markets stabilize.
► On the upside, with ample liquidity in emerging and developed markets, we are seeing a growing pipeline of candidates planning to list on major exchanges around the world, from a broad range of sectors.
► As elections across the UK and Europe are decided, political uncertainty is diminishing, strengthening investor sentiment. This should lead to a pick-up in IPO activity across EMEIA, led by India and the Nordic markets.
► Momentum will also continue to build in the Americas, driven by expectations of lower market volatility, rising indices and a healthy pipeline. However, uncertainty regarding the impact of President Trump’s international trade policy may make investors cautious.
► Cementing the trend since May 2016, Asia-Pacificwill continue to dominate global IPO activity, led by Greater China, South Korea and Australia with several big IPOs expected to hit the market later this year.
► Across markets, technology and energy are expected to be two of the most active sectors through the remainder of 2017, especially in the US and China. In particular, we anticipate that the successful IPO earlier this year of Snap Inc. will encourage more unicorns to come to the public markets, keen to capitalize on strong investor appetite.
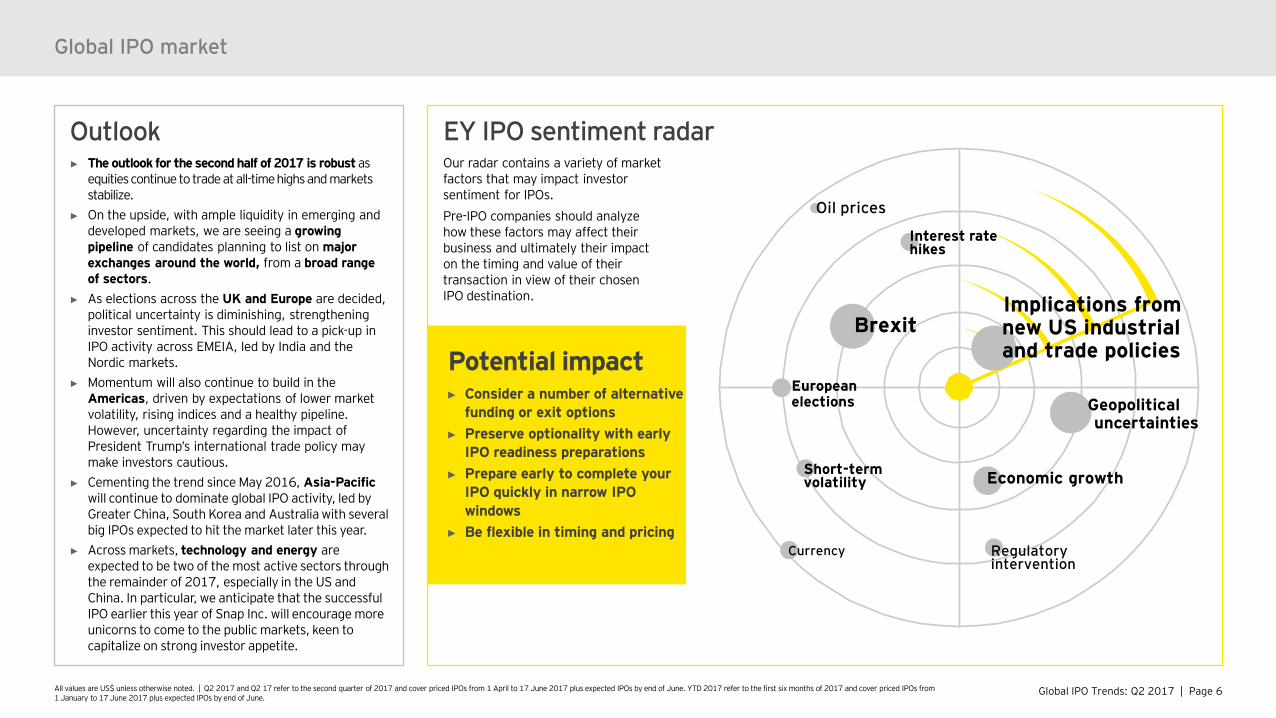
EY IPO sentiment radarOur radar contains a variety of market factors that may impact investor sentiment for IPOs.Pre-IPO companies should analyze how these factors may affect their business and ultimately their impact on the timing and value of their transaction in view of their chosen IPO destination.
Global IPO market
Brexit
Europeanelections Geopolitical
uncertainties
Oil prices
Short-term volatility
Interest ratehikes
Currency
Implications from new US industrial and trade policies
Economic growth
Regulatory intervention
Potential impact► Consider a number of alternative
funding or exit options► Preserve optionality with early
IPO readiness preparations► Prepare early to complete your
IPO quickly in narrow IPO windows
► Be flexible in timing and pricing
Global IPO Trends: Q2 2017 | Page 7
AmericasSurge in activity heralds healthy market ahead“The first half of 2017 has seen the Americas IPO market rebound strongly in activity both in terms of deal number and proceeds. Americas stock exchanges gain momentum with 8 of the top 20 global deals featured on Canadian, Mexican and US exchanges so far this year.”Jackie KelleyEY Americas IPO Markets Leader
Global IPO Trends: Q2 2017 | Page 8All values are US$ unless otherwise noted. | Q2 2017 and Q2 17 refer to the second quarter of 2017 and cover priced IPOs from 1 April to 17 June 2017 plus expected IPOs by end of June. YTD 2017 refer to the first six months of 2017 and cover priced IPOs from 1 January to 17 June 2017 plus expected IPOs by end of June.
Brazil‘s BOVESPA YTD 2017
US‘s NASDAQ and NYSE YTD 2017
Canada‘s Toronto Stock Exchange and TSX Venture Exchange YTD 2017
Mexico‘s Mexican Stock Exchange YTD 2017
Activity Q2 2017
Markets YTD 2017
AmericasAmericas
Change on prior year
99 IPOs
$25.8b proceeds
$117.1m median deal size
83%
259%
78%
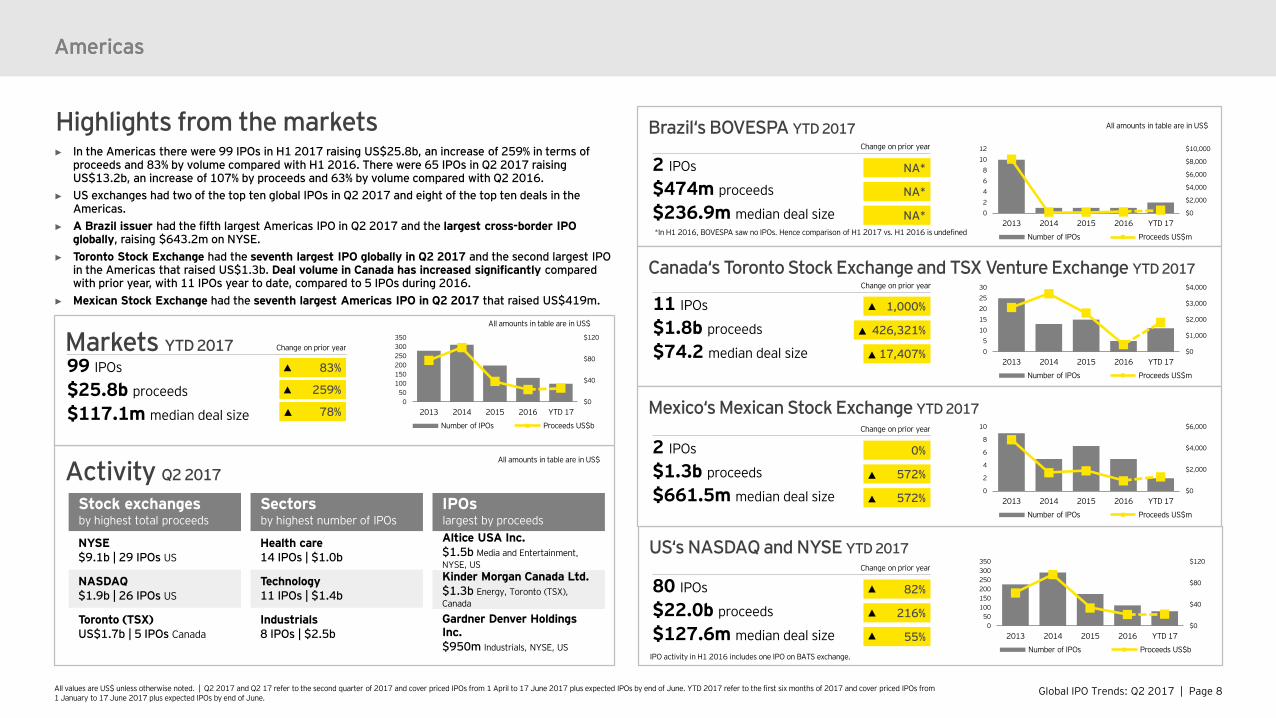
Highlights from the markets► In the Americas there were 99 IPOs in H1 2017 raising US$25.8b, an increase of 259% in terms of
proceeds and 83% by volume compared with H1 2016. There were 65 IPOs in Q2 2017 raising US$13.2b, an increase of 107% by proceeds and 63% by volume compared with Q2 2016.
► US exchanges had two of the top ten global IPOs in Q2 2017 and eight of the top ten deals in the Americas.
► A Brazil issuer had the fifth largest Americas IPO in Q2 2017 and the largest cross-border IPO globally, raising $643.2m on NYSE.
► Toronto Stock Exchange had the seventh largest IPO globally in Q2 2017 and the second largest IPO in the Americas that raised US$1.3b. Deal volume in Canada has increased significantly compared with prior year, with 11 IPOs year to date, compared to 5 IPOs during 2016.
► Mexican Stock Exchange had the seventh largest Americas IPO in Q2 2017 that raised US$419m.Change on prior year
11 IPOs
$1.8b proceeds
$74.2 median deal size
Change on prior year
2 IPOs
$1.3b proceeds
$661.5m median deal size
Change on prior year
2 IPOs
$474m proceeds
$236.9m median deal size
Change on prior year
80 IPOs
$22.0b proceeds
$127.6m median deal size
82%
216%
55%
All amounts in table are in US$
Stock exchanges by highest total proceeds
NYSE$9.1b | 29 IPOs US
NASDAQ$1.9b | 26 IPOs US
Toronto (TSX)US$1.7b | 5 IPOs Canada
Sectors by highest number of IPOs
Health care14 IPOs | $1.0b
Technology11 IPOs | $1.4b
Industrials8 IPOs | $2.5b
IPOslargest by proceedsAltice USA Inc.$1.5b Media and Entertainment, NYSE, USKinder Morgan Canada Ltd.$1.3b Energy, Toronto (TSX), Canada
Gardner Denver Holdings Inc.$950m Industrials, NYSE, US
All amounts in table are in US$
NA*
NA*
NA*
1,000%
426,321%
17,407%
0%
572%
572%
All amounts in table are in US$
*In H1 2016, BOVESPA saw no IPOs. Hence comparison of H1 2017 vs. H1 2016 is undefined
$0
$40
$80
$120
050
100150200250300350
2013 2014 2015 2016 YTD 17
Number of IPOs Proceeds US$b
$0
$40
$80
$120
050
100150200250300350
2013 2014 2015 2016 YTD 17
Number of IPOs Proceeds US$b
$0
$2,000
$4,000
$6,000
$8,000
$10,000
02468
1012
2013 2014 2015 2016 YTD 17
Number of IPOs Proceeds US$m
$0
$1,000
$2,000
$3,000
$4,000
05
1015202530
2013 2014 2015 2016 YTD 17
Number of IPOs Proceeds US$m
$0
$2,000
$4,000
$6,000
0
2
4
6
8
10
2013 2014 2015 2016 YTD 17
Number of IPOs Proceeds US$m
IPO activity in H1 2016 includes one IPO on BATS exchange.
Global IPO Trends: Q2 2017 | Page 9
Americas — US IPO market insightA positive outlook and robust pipeline“The sentiment is strong for the second half of 2017. More marquee company names have entered the filing process and first-day performances remain steady. This combination has been the catalyst for building a solid pipeline for the remainder of the year. While fiscal and policy regulation remains uncertain, the markets have been insulated to this and continue to experience low volatility. Market conditions remain ideal for companies looking to list and we expect they will in 2017.”Jackie KelleyEY Americas IPO Markets Leader
Global IPO Trends: Q2 2017 | Page 10All values are US$ unless otherwise noted. | Q2 2017 and Q2 17 refer to the second quarter of 2017 and cover priced IPOs from 1 April to 17 June 2017 plus expected IPOs by end of June. YTD 2017 refer to the first six months of 2017 and cover priced IPOs from 1 January to 17 June 2017 plus expected IPOs by end of June.
TrendsYTD 2017
Change on prior year
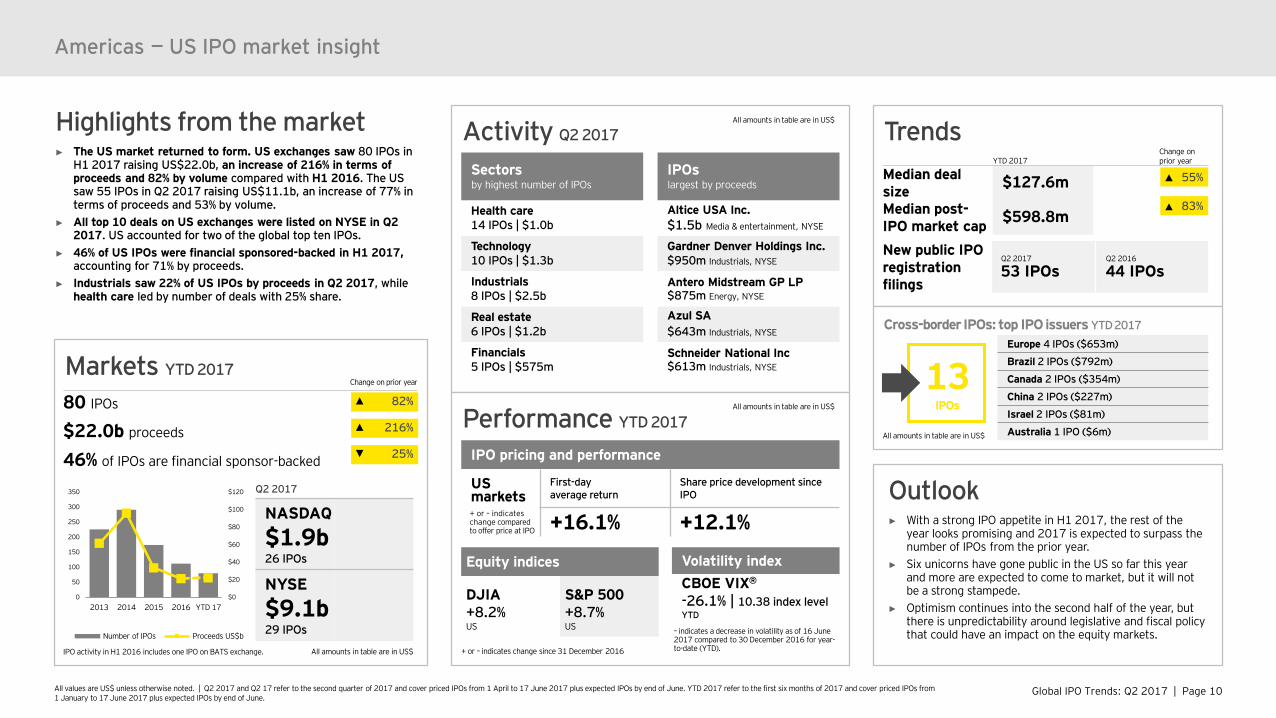
Median deal size $127.6m
Median post-IPO market cap $598.8m
Americas — US IPO market insight
Activity Q2 2017
Performance YTD 2017
IPO pricing and performance
US markets
First-day average return
Share price development since IPO
+16.1% +12.1%
Equity indices
DJIA+8.2%US
S&P 500+8.7%US
Volatility indexCBOE VIX®
-26.1% | 10.38 index levelYTD
Sectorsby highest number of IPOs
Health care14 IPOs | $1.0b
Technology10 IPOs | $1.3b
Industrials8 IPOs | $2.5b
Real estate6 IPOs | $1.2b
Financials5 IPOs | $575m
IPOslargest by proceeds
Altice USA Inc.$1.5b Media & entertainment, NYSE
Gardner Denver Holdings Inc.$950m Industrials, NYSE
Antero Midstream GP LP $875m Energy, NYSE
Azul SA$643m Industrials, NYSE
Schneider National Inc $613m Industrials, NYSE
All amounts in table are in US$
All amounts in table are in US$
New public IPO registration filings
Q2 2017
53 IPOsQ2 2016
44 IPOs
55%
83%
Cross-border IPOs: top IPO issuers YTD 2017
All amounts in table are in US$
13IPOs
Europe 4 IPOs ($653m)
Brazil 2 IPOs ($792m)
Canada 2 IPOs ($354m)
China 2 IPOs ($227m)
Israel 2 IPOs ($81m)
Australia 1 IPO ($6m)
Markets YTD 2017
All amounts in table are in US$
Q2 2017
NASDAQ
$1.9b26 IPOs
NYSE
$9.1b29 IPOs
Change on prior year
80 IPOs
$22.0b proceeds
46% of IPOs are financial sponsor-backed
82%
216%
25%
+ or – indicates change since 31 December 2016
– indicates a decrease in volatility as of 16 June 2017 compared to 30 December 2016 for year-to-date (YTD).
+ or – indicates change compared to offer price at IPO
Highlights from the market► The US market returned to form. US exchanges saw 80 IPOs in
H1 2017 raising US$22.0b, an increase of 216% in terms of proceeds and 82% by volume compared with H1 2016. The US saw 55 IPOs in Q2 2017 raising US$11.1b, an increase of 77% in terms of proceeds and 53% by volume.
► All top 10 deals on US exchanges were listed on NYSE in Q2 2017. US accounted for two of the global top ten IPOs.
► 46% of US IPOs were financial sponsored-backed in H1 2017, accounting for 71% by proceeds.
► Industrials saw 22% of US IPOs by proceeds in Q2 2017, while health care led by number of deals with 25% share.
$0
$20
$40
$60
$80
$100
$120
0
50
100
150
200
250
300
350
2013 2014 2015 2016 YTD 17
Number of IPOs Proceeds US$b
Outlook► With a strong IPO appetite in H1 2017, the rest of the
year looks promising and 2017 is expected to surpass the number of IPOs from the prior year.
► Six unicorns have gone public in the US so far this year and more are expected to come to market, but it will not be a strong stampede.
► Optimism continues into the second half of the year, but there is unpredictability around legislative and fiscal policy that could have an impact on the equity markets.
IPO activity in H1 2016 includes one IPO on BATS exchange.
Global IPO Trends: Q2 2017 | Page 11
Asia-PacificAsia-Pacific sees best first six months of activity since 2002“Asia-Pacific’s position as the leading center of IPO activity will remain unchallenged through the remainder of 2017. While Greater China continues to lead the way, other markets are seeing considerable activity. Australia ranked fourth among global stock exchanges by deal volume, while Korea made a significant contribution to total proceeds in H1 2017 with mega-IPOs from the technology and financial sectors.”Ringo ChoiEY Asia-Pacific IPO Leader
Global IPO Trends: Q2 2017 | Page 12All values are US$ unless otherwise noted. | Q2 2017 and Q2 17 refer to the second quarter of 2017 and cover priced IPOs from 1 April to 17 June 2017 plus expected IPOs by end of June. YTD 2017 refer to the first six months of 2017 and cover priced IPOs from 1 January to 17 June 2017 plus expected IPOs by end of June.
Markets Activity Q2 2017
Asia-Pacific
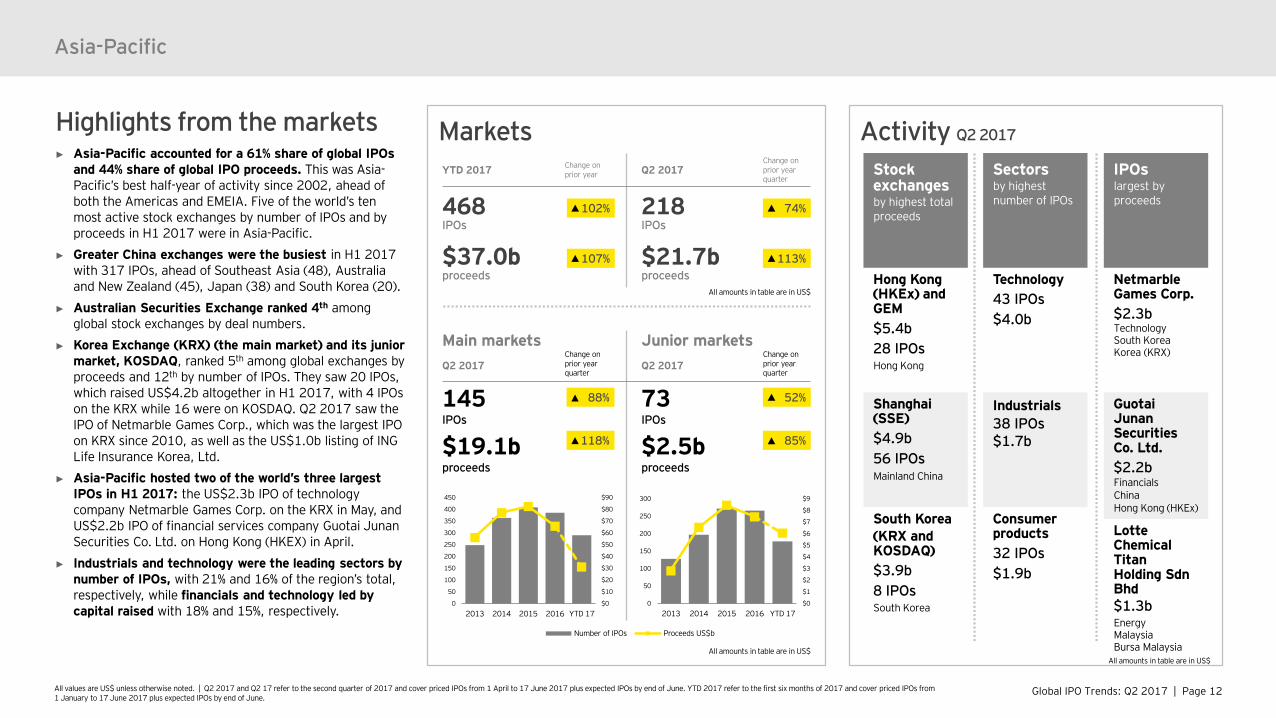
Highlights from the markets► Asia-Pacific accounted for a 61% share of global IPOs
and 44% share of global IPO proceeds. This was Asia-Pacific’s best half-year of activity since 2002, ahead of both the Americas and EMEIA. Five of the world’s ten most active stock exchanges by number of IPOs and by proceeds in H1 2017 were in Asia-Pacific.
► Greater China exchanges were the busiest in H1 2017 with 317 IPOs, ahead of Southeast Asia (48), Australia and New Zealand (45), Japan (38) and South Korea (20).
► Australian Securities Exchange ranked 4th among global stock exchanges by deal numbers.
► Korea Exchange (KRX) (the main market) and its junior market, KOSDAQ, ranked 5th among global exchanges by proceeds and 12th by number of IPOs. They saw 20 IPOs, which raised US$4.2b altogether in H1 2017, with 4 IPOs on the KRX while 16 were on KOSDAQ. Q2 2017 saw the IPO of Netmarble Games Corp., which was the largest IPO on KRX since 2010, as well as the US$1.0b listing of ING Life Insurance Korea, Ltd.
► Asia-Pacific hosted two of the world’s three largest IPOs in H1 2017: the US$2.3b IPO of technology company Netmarble Games Corp. on the KRX in May, and US$2.2b IPO of financial services company Guotai JunanSecurities Co. Ltd. on Hong Kong (HKEX) in April.
► Industrials and technology were the leading sectors by number of IPOs, with 21% and 16% of the region’s total, respectively, while financials and technology led by capital raised with 18% and 15%, respectively.
Stock exchangesby highest total proceeds
Hong Kong (HKEx) and GEM$5.4b28 IPOsHong Kong
Shanghai (SSE)$4.9b56 IPOsMainland China
South Korea (KRX and KOSDAQ)$3.9b8 IPOsSouth Korea
Sectorsby highest number of IPOs
Technology43 IPOs$4.0b
Industrials38 IPOs $1.7b
Consumer products32 IPOs$1.9b
IPOslargest by proceeds
NetmarbleGames Corp.$2.3bTechnologySouth KoreaKorea (KRX)
GuotaiJunanSecurities Co. Ltd.$2.2bFinancialsChinaHong Kong (HKEx)
LotteChemical Titan Holding SdnBhd$1.3bEnergyMalaysiaBursa Malaysia
Main markets Junior marketsQ2 2017
Change onprior year quarter
Q2 2017Change on prior year quarter
145IPOs
73IPOs
$19.1bproceeds
$2.5bproceeds
88%
118%
52%
85%
All amounts in table are in US$All amounts in table are in US$
$0
$1
$2
$3
$4
$5
$6
$7
$8
$9
0
50
100
150
200
250
300
2013 2014 2015 2016 YTD 17
Number of IPOs Proceeds US$b
$0
$10
$20
$30
$40
$50
$60
$70
$80
$90
0
50
100
150
200
250
300
350
400
450
2013 2014 2015 2016 YTD 17
YTD 2017 Change on prior year Q2 2017
Change on prior year quarter
468IPOs
218IPOs
$37.0bproceeds
$21.7bproceeds
113%107%
74%102%
All amounts in table are in US$
Global IPO Trends: Q2 2017 | Page 13All values are US$ unless otherwise noted. | Q2 2017 and Q2 17 refer to the second quarter of 2017 and cover priced IPOs from 1 April to 17 June 2017 plus expected IPOs by end of June. YTD 2017 refer to the first six months of 2017 and cover priced IPOs from 1 January to 17 June 2017 plus expected IPOs by end of June.
Trends
Sources of IPOs
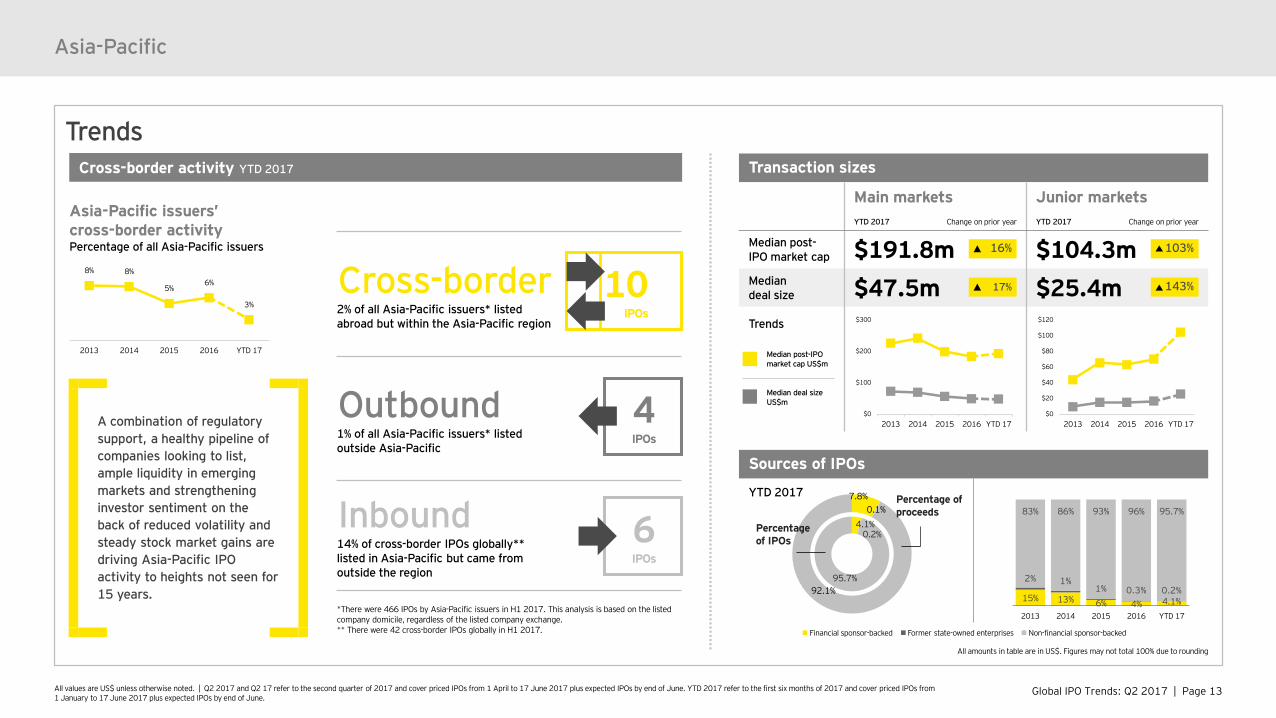
YTD 2017 7.8%0.1%
92.1%
Percentage of proceeds
4.1%0.2%
95.7%
Percentageof IPOs
Asia-Pacific
Cross-border 2% of all Asia-Pacific issuers* listed abroad but within the Asia-Pacific region
Outbound1% of all Asia-Pacific issuers* listed outside Asia-Pacific
Inbound14% of cross-border IPOs globally** listed in Asia-Pacific but came from outside the region
*There were 466 IPOs by Asia-Pacific issuers in H1 2017. This analysis is based on the listed company domicile, regardless of the listed company exchange.** There were 42 cross-border IPOs globally in H1 2017.
Cross-border activity YTD 2017
Asia-Pacific issuers’ cross-border activityPercentage of all Asia-Pacific issuers
A combination of regulatory support, a healthy pipeline of companies looking to list, ample liquidity in emerging markets and strengthening investor sentiment on the back of reduced volatility and steady stock market gains are driving Asia-Pacific IPO activity to heights not seen for 15 years.
6IPOs
4IPOs
Transaction sizes
Main markets Junior marketsYTD 2017 Change on prior year YTD 2017 Change on prior year
Median post-IPO market cap $191.8m $104.3mMedian deal size $47.5m $25.4mTrends
103%16%
143%17%
All amounts in table are in US$. Figures may not total 100% due to rounding
Financial sponsor-backed Former state-owned enterprises Non-financial sponsor-backed
10IPOs
15% 13% 6% 4% 4.1%
2% 1%1% 0.3% 0.2%
83% 86% 93% 96% 95.7%
2013 2014 2015 2016 YTD 17
8% 8%
5%6%
3%
2013 2014 2015 2016 YTD 17
$0
$100
$200
$300
2013 2014 2015 2016 YTD 17$0
$20
$40
$60
$80
$100
$120
2013 2014 2015 2016 YTD 17
Median post-IPO market cap US$m
Median deal size US$m
Global IPO Trends: Q2 2017 | Page 14All values are US$ unless otherwise noted. | Q2 2017 and Q2 17 refer to the second quarter of 2017 and cover priced IPOs from 1 April to 17 June 2017 plus expected IPOs by end of June. YTD 2017 refer to the first six months of 2017 and cover priced IPOs from 1 January to 17 June 2017 plus expected IPOs by end of June.
Asia-Pacific
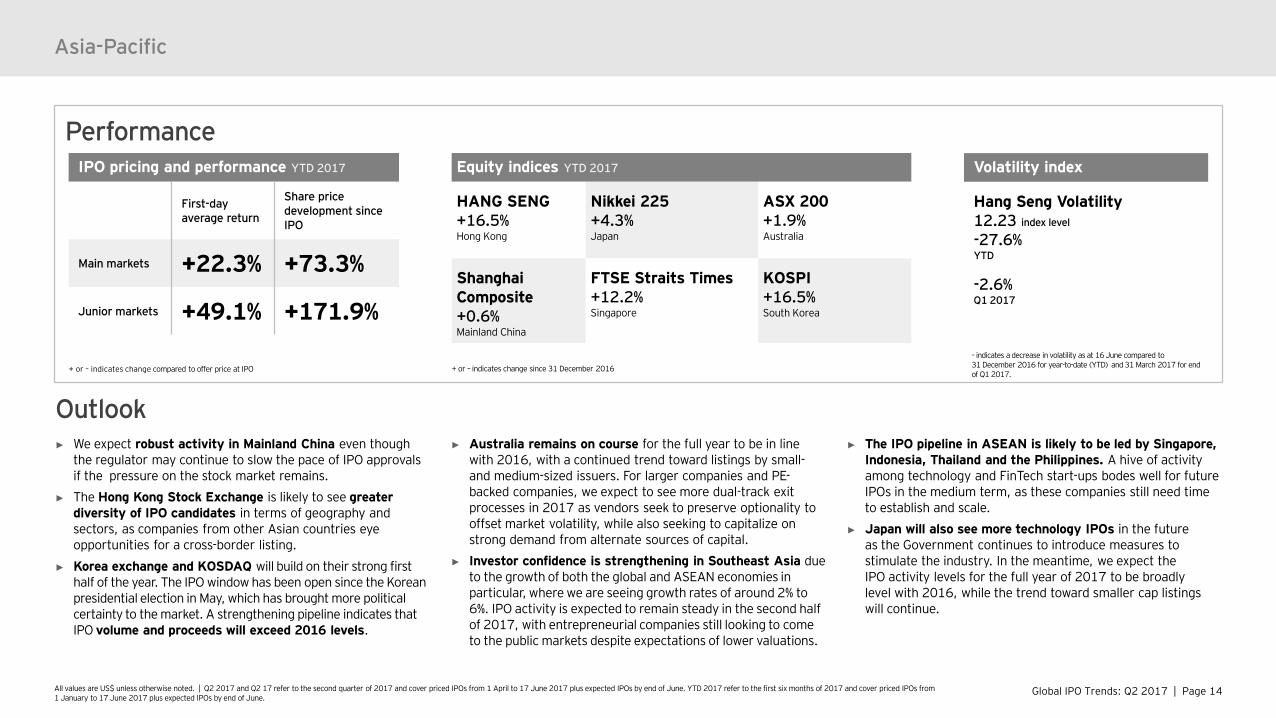
PerformanceEquity indices YTD 2017
HANG SENG+16.5%Hong Kong
Nikkei 225+4.3%Japan
ASX 200+1.9%Australia
Shanghai Composite+0.6%Mainland China
FTSE Straits Times+12.2%Singapore
KOSPI+16.5%South Korea
IPO pricing and performance YTD 2017
First-day average return
Share price development since IPO
Main markets +22.3% +73.3%
Junior markets +49.1% +171.9%
Volatility index
Hang Seng Volatility12.23 index level
-27.6%YTD
-2.6%Q1 2017
+ or – indicates change since 31 December 2016+ or – indicates change compared to offer price at IPO
– indicates a decrease in volatility as at 16 June compared to 31 December 2016 for year-to-date (YTD) and 31 March 2017 for end of Q1 2017.
► We expect robust activity in Mainland China even though the regulator may continue to slow the pace of IPO approvals if the pressure on the stock market remains.
► The Hong Kong Stock Exchange is likely to see greater diversity of IPO candidates in terms of geography and sectors, as companies from other Asian countries eye opportunities for a cross-border listing.
► Korea exchange and KOSDAQ will build on their strong first half of the year. The IPO window has been open since the Korean presidential election in May, which has brought more political certainty to the market. A strengthening pipeline indicates that IPO volume and proceeds will exceed 2016 levels.
► Australia remains on course for the full year to be in line with 2016, with a continued trend toward listings by small-and medium-sized issuers. For larger companies and PE-backed companies, we expect to see more dual-track exit processes in 2017 as vendors seek to preserve optionality to offset market volatility, while also seeking to capitalize on strong demand from alternate sources of capital.
► Investor confidence is strengthening in Southeast Asia due to the growth of both the global and ASEAN economies in particular, where we are seeing growth rates of around 2% to 6%. IPO activity is expected to remain steady in the second half of 2017, with entrepreneurial companies still looking to come to the public markets despite expectations of lower valuations.
► The IPO pipeline in ASEAN is likely to be led by Singapore, Indonesia, Thailand and the Philippines. A hive of activity among technology and FinTech start-ups bodes well for future IPOs in the medium term, as these companies still need time to establish and scale.
► Japan will also see more technology IPOs in the future as the Government continues to introduce measures to stimulate the industry. In the meantime, we expect the IPO activity levels for the full year of 2017 to be broadly level with 2016, while the trend toward smaller cap listings will continue.
Outlook
Global IPO Trends: Q2 2017 | Page 15
Asia-Pacific — Greater China market insight Greater China set to dominate, despite anticipated slowdown“Greater China was the world’s standout market in the first half of 2017 and this lead is expected to continue in the second half of 2017. The positive outlook is supported by a healthy pipeline of IPO-ready companies and an evolving regulatory landscape designed to attract new listings. However, activity level on Mainland exchanges may be affected if the Chinese regulator continues to slow the rate of approval of new listings in the coming months in a bid to alleviate stock market pressure.” Terence HoEY Greater China IPO Leader
Global IPO Trends: Q2 2017 | Page 16All values are US$ unless otherwise noted. | Q2 2017 and Q2 17 refer to the second quarter of 2017 and cover priced IPOs from 1 April to 17 June 2017 plus expected IPOs by end of June. YTD 2017 refer to the first six months of 2017 and cover priced IPOs from 1 January to 17 June 2017 plus expected IPOs by end of June.
Markets
Asia-Pacific — Greater China market insight
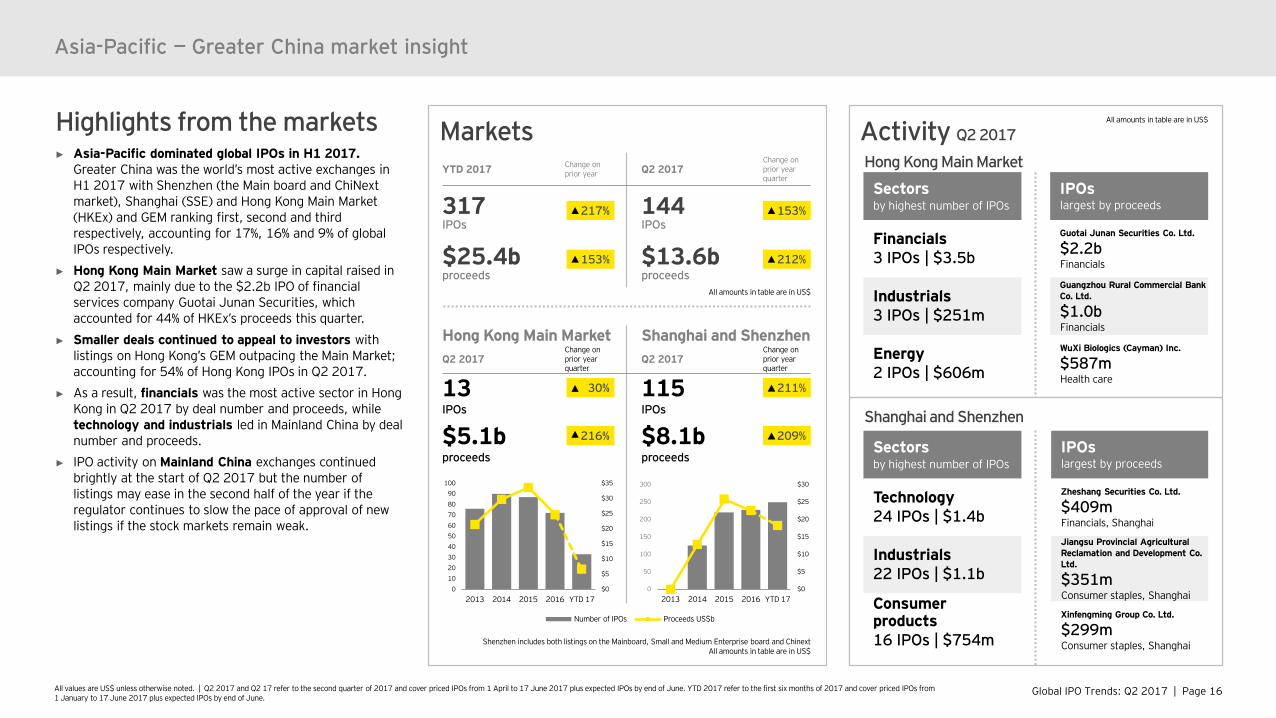
Highlights from the markets► Asia-Pacific dominated global IPOs in H1 2017.
Greater China was the world’s most active exchanges in H1 2017 with Shenzhen (the Main board and ChiNextmarket), Shanghai (SSE) and Hong Kong Main Market (HKEx) and GEM ranking first, second and third respectively, accounting for 17%, 16% and 9% of global IPOs respectively.
► Hong Kong Main Market saw a surge in capital raised in Q2 2017, mainly due to the $2.2b IPO of financial services company Guotai Junan Securities, which accounted for 44% of HKEx’s proceeds this quarter.
► Smaller deals continued to appeal to investors with listings on Hong Kong’s GEM outpacing the Main Market; accounting for 54% of Hong Kong IPOs in Q2 2017.
► As a result, financials was the most active sector in Hong Kong in Q2 2017 by deal number and proceeds, while technology and industrials led in Mainland China by deal number and proceeds.
► IPO activity on Mainland China exchanges continued brightly at the start of Q2 2017 but the number of listings may ease in the second half of the year if the regulator continues to slow the pace of approval of new listings if the stock markets remain weak. sentiment appetite sustained by steady stock market gains and strong valuations.
Activity Q2 2017
Hong Kong Main Market
Sectors by highest number of IPOs
Financials3 IPOs | $3.5b
Industrials3 IPOs | $251m
Energy2 IPOs | $606m
IPOslargest by proceeds
Guotai Junan Securities Co. Ltd.
$2.2bFinancials
Guangzhou Rural Commercial Bank Co. Ltd.
$1.0bFinancials
WuXi Biologics (Cayman) Inc.
$587mHealth care
Shanghai and Shenzhen
Sectors by highest number of IPOs
Technology24 IPOs | $1.4b
Industrials22 IPOs | $1.1b
Consumer products16 IPOs | $754m
IPOslargest by proceeds
Zheshang Securities Co. Ltd.
$409mFinancials, Shanghai
Jiangsu Provincial Agricultural Reclamation and Development Co. Ltd.
$351mConsumer staples, Shanghai
Xinfengming Group Co. Ltd.
$299mConsumer staples, Shanghai
All amounts in table are in US$
Hong Kong Main Market Shanghai and ShenzhenQ2 2017
Change on prior year quarter
Q2 2017Change on prior year quarter
13IPOs
115IPOs
$5.1bproceeds
$8.1bproceeds
30%
216%
211%
209%
Shenzhen includes both listings on the Mainboard, Small and Medium Enterprise board and ChinextAll amounts in table are in US$
All amounts in table are in US$
$0
$5
$10
$15
$20
$25
$30
0
50
100
150
200
250
300
2013 2014 2015 2016 YTD 17
Number of IPOs Proceeds US$b
$0
$5
$10
$15
$20
$25
$30
$35
0102030405060708090
100
2013 2014 2015 2016 YTD 17
YTD 2017 Change on prior year Q2 2017
Change on prior yearquarter
317IPOs
144IPOs
$25.4bproceeds
$13.6bproceeds
217%
153%
153%
212%
Global IPO Trends: Q2 2017 | Page 17All values are US$ unless otherwise noted. | Q2 2017 and Q2 17 refer to the second quarter of 2017 and cover priced IPOs from 1 April to 17 June 2017 plus expected IPOs by end of June. YTD 2017 refer to the first six months of 2017 and cover priced IPOs from 1 January to 17 June 2017 plus expected IPOs by end of June.
Trends
Sources of IPOs
YTD 20172.5%
97.5%
Percentage of proceeds
Asia-Pacific — Greater China market insight
Cross-border activity YTD 2017
Greater China issuers’ cross-border activityPercentage of all China issuers
YTD 2017
Leaving Greater China
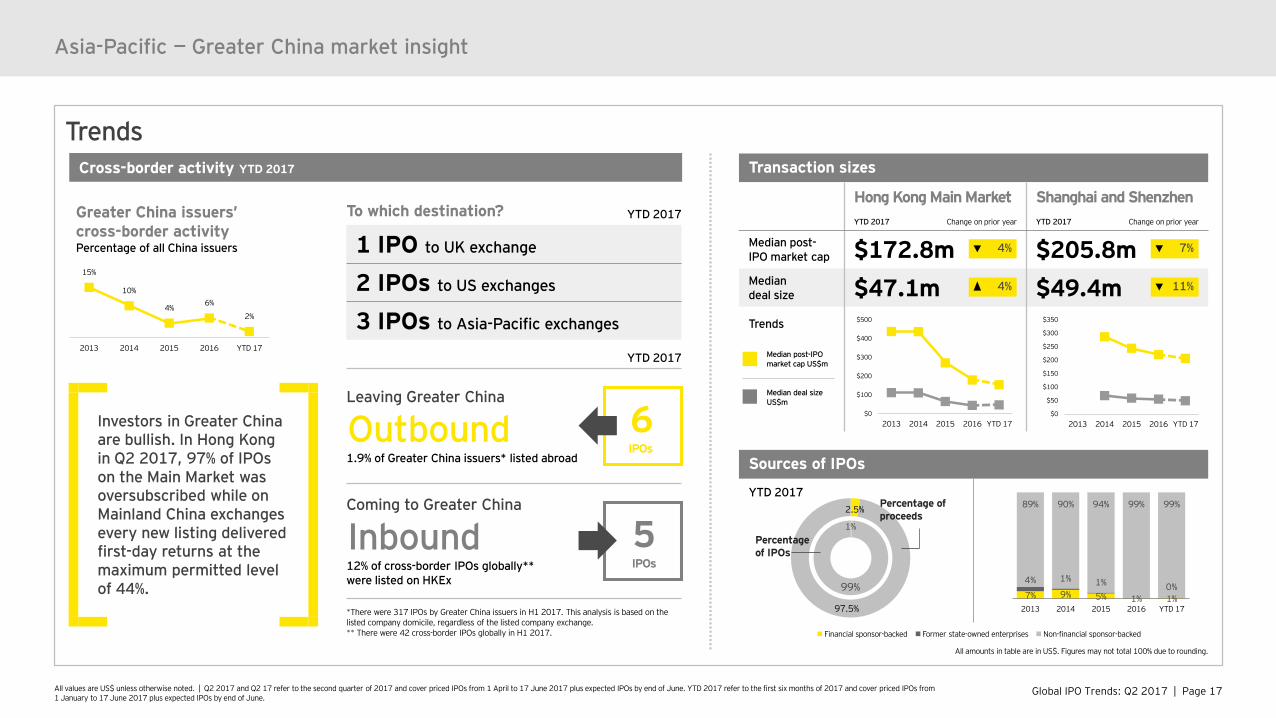
Outbound1.9% of Greater China issuers* listed abroad
Coming to Greater China
Inbound 12% of cross-border IPOs globally** were listed on HKEx
*There were 317 IPOs by Greater China issuers in H1 2017. This analysis is based on the listed company domicile, regardless of the listed company exchange.** There were 42 cross-border IPOs globally in H1 2017.
5IPOs
6IPOs
To which destination? YTD 2017
1 IPO to UK exchange
2 IPOs to US exchanges
3 IPOs to Asia-Pacific exchanges
Transaction sizes
Hong Kong Main Market Shanghai and ShenzhenYTD 2017 Change on prior year YTD 2017 Change on prior year
Median post-IPO market cap $172.8m $205.8mMedian deal size $47.1m $49.4mTrends
7%4%
11%
1%
99%
Percentage of IPOs
All amounts in table are in US$. Figures may not total 100% due to rounding.
4%
Investors in Greater China are bullish. In Hong Kong in Q2 2017, 97% of IPOs on the Main Market was oversubscribed while on Mainland China exchanges every new listing delivered first-day returns at the maximum permitted level of 44%.
Financial sponsor-backed Former state-owned enterprises Non-financial sponsor-backed
7% 9% 5% 1% 1%
4% 1% 1% 0%
89% 90% 94% 99% 99%
2013 2014 2015 2016 YTD 17
15%
10%
4% 6%
2%
2013 2014 2015 2016 YTD 17
$0
$100
$200
$300
$400
$500
2013 2014 2015 2016 YTD 17$0
$50
$100
$150
$200
$250
$300
$350
2013 2014 2015 2016 YTD 17
Median post-IPO market cap US$m
Median deal size US$m
Global IPO Trends: Q2 2017 | Page 18All values are US$ unless otherwise noted. | Q2 2017 and Q2 17 refer to the second quarter of 2017 and cover priced IPOs from 1 April to 17 June 2017 plus expected IPOs by end of June. YTD 2017 refer to the first six months of 2017 and cover priced IPOs from 1 January to 17 June 2017 plus expected IPOs by end of June.
Outlook
Asia-Pacific — Greater China market insight
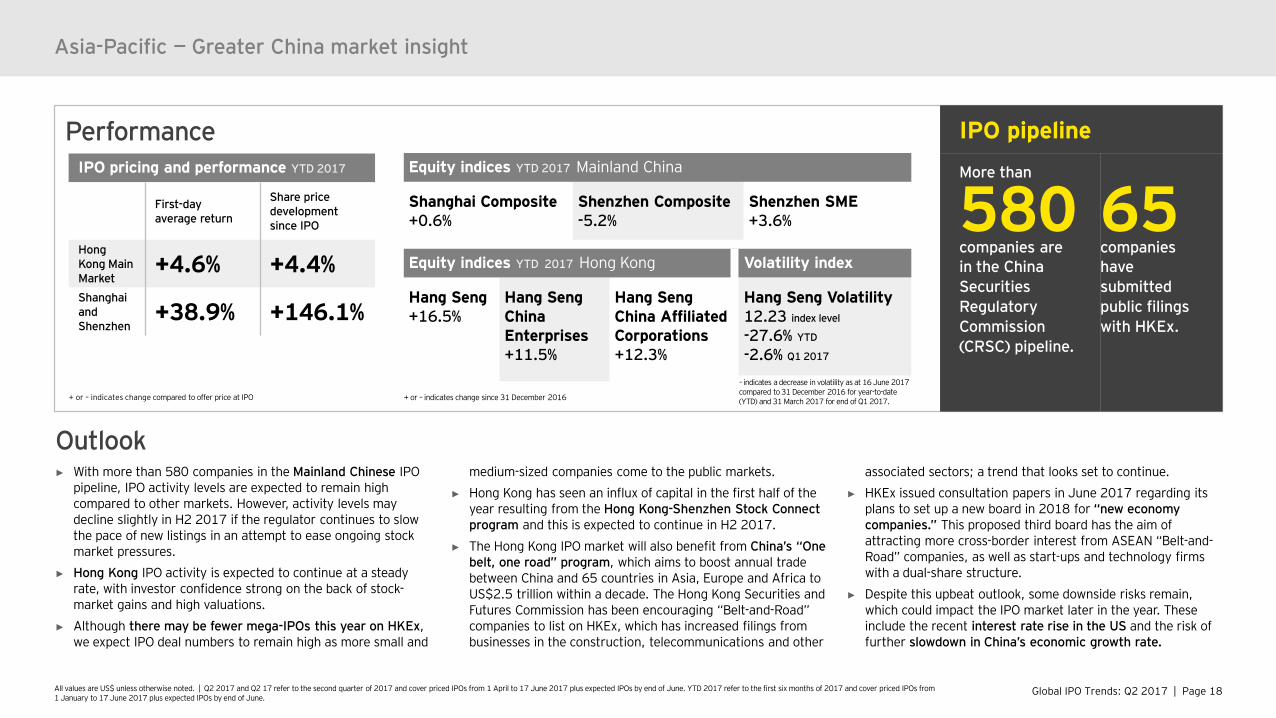
PerformanceEquity indices YTD 2017 Mainland China
Shanghai Composite+0.6%
Shenzhen Composite-5.2%
Shenzhen SME+3.6%
IPO pricing and performance YTD 2017
First-day average return
Share price development since IPO
Hong Kong Main Market
+4.6% +4.4%Shanghai and Shenzhen
+38.9% +146.1%
Equity indices YTD 2017 Hong Kong Volatility index
Hang Seng +16.5%
Hang Seng China Enterprises+11.5%
Hang Seng China Affiliated Corporations+12.3%
Hang Seng Volatility12.23 index level
-27.6% YTD
-2.6% Q1 2017
IPO pipelineMore than
580companies arein the China Securities Regulatory Commission (CRSC) pipeline.
More than
65companieshave submitted public filings with HKEx.
+ or – indicates change compared to offer price at IPO
– indicates a decrease in volatility as at 16 June 2017 compared to 31 December 2016 for year-to-date (YTD) and 31 March 2017 for end of Q1 2017. + or – indicates change since 31 December 2016
► With more than 580 companies in the Mainland Chinese IPO pipeline, IPO activity levels are expected to remain high compared to other markets. However, activity levels may decline slightly in H2 2017 if the regulator continues to slow the pace of new listings in an attempt to ease ongoing stock market pressures.
► Hong Kong IPO activity is expected to continue at a steady rate, with investor confidence strong on the back of stock-market gains and high valuations.
► Although there may be fewer mega-IPOs this year on HKEx, we expect IPO deal numbers to remain high as more small and
medium-sized companies come to the public markets.► Hong Kong has seen an influx of capital in the first half of the
year resulting from the Hong Kong-Shenzhen Stock Connect program and this is expected to continue in H2 2017.
► The Hong Kong IPO market will also benefit from China’s “One belt, one road” program, which aims to boost annual trade between China and 65 countries in Asia, Europe and Africa to US$2.5 trillion within a decade. The Hong Kong Securities and Futures Commission has been encouraging “Belt-and-Road” companies to list on HKEx, which has increased filings from businesses in the construction, telecommunications and other
associated sectors; a trend that looks set to continue.► HKEx issued consultation papers in June 2017 regarding its
plans to set up a new board in 2018 for “new economy companies.” This proposed third board has the aim of attracting more cross-border interest from ASEAN “Belt-and-Road” companies, as well as start-ups and technology firms with a dual-share structure.
► Despite this upbeat outlook, some downside risks remain, which could impact the IPO market later in the year. These include the recent interest rate rise in the US and the risk of further slowdown in China’s economic growth rate.
Global IPO Trends: Q2 2017 | Page 19
Asia-Pacific — Japan market insight Sun is rising on Japanese IPO market“Positive macroeconomic fundamentals are helping to keep Japanese investor sentiment buoyant, underpinned by anticipated policy changes under the Trump administration in the US and a sense of optimism around the upcoming Tokyo Olympics in 2020. As equity markets trade higher and the Japanese Government introduces more measures to stimulate technology investment, we expect a growing number of companies in this sector to come to the public markets to raise capital.” Shinichiro SuzukiEY Japan IPO Leader
Global IPO Trends: Q2 2017 | Page 20All values are US$ unless otherwise noted. | Q2 2017 and Q2 17 refer to the second quarter of 2017 and cover priced IPOs from 1 April to 17 June 2017 plus expected IPOs by end of June. YTD 2017 refer to the first six months of 2017 and cover priced IPOs from 1 January to 17 June 2017 plus expected IPOs by end of June.
Markets
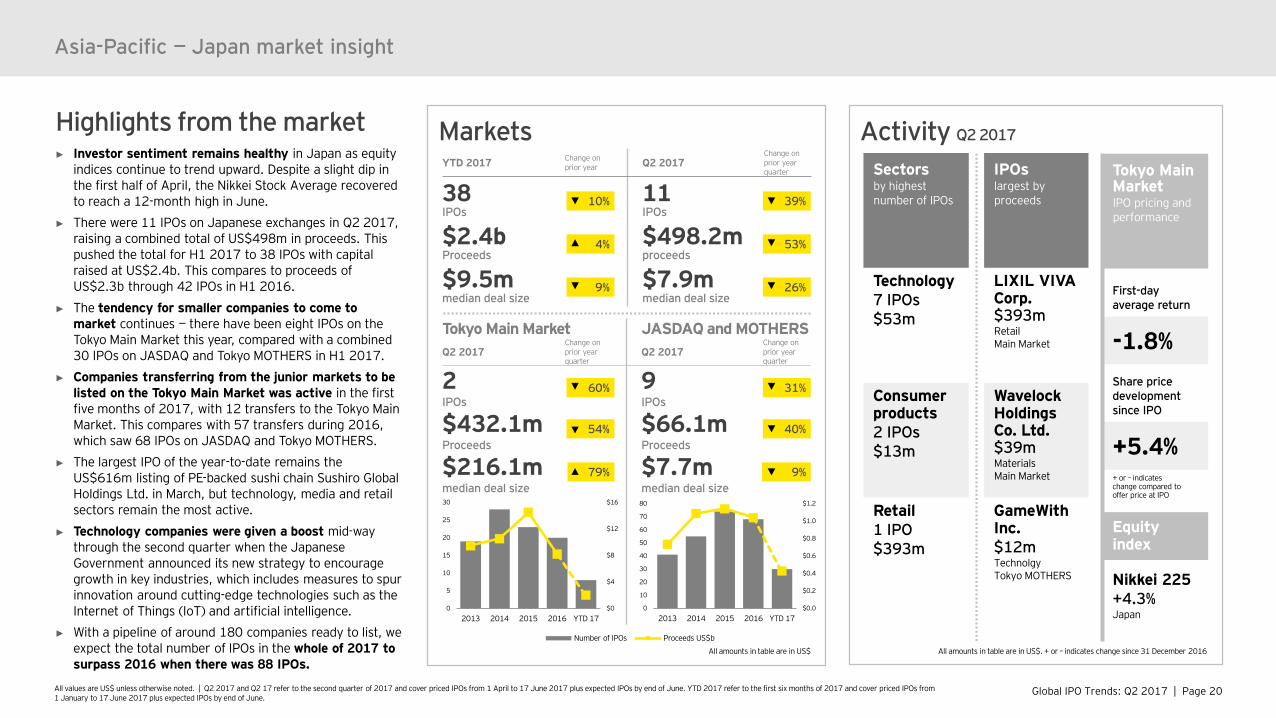
Tokyo Main Market JASDAQ and MOTHERSQ2 2017
Change on prior year quarter
Q2 2017Change on prior yearquarter
2IPOs
9IPOs
$432.1mProceeds
$66.1mProceeds
$216.1mmedian deal size
$7.7mmedian deal size
Activity Q2 2017
Asia-Pacific — Japan market insight
Sectorsby highest number of IPOs
Technology7 IPOs$53m
Consumer products2 IPOs$13m
Retail1 IPO$393m
IPOslargest by proceeds
LIXIL VIVA Corp.$393mRetailMain Market
Wavelock Holdings Co. Ltd.$39mMaterialsMain Market
GameWith Inc.$12mTechnolgyTokyo MOTHERS
Equity index
Nikkei 225+4.3%Japan
Tokyo Main MarketIPO pricing and performance
First-day average return
-1.8%Share price development since IPO
+5.4%
All amounts in table are in US$. + or – indicates change since 31 December 2016All amounts in table are in US$
Highlights from the market► Investor sentiment remains healthy in Japan as equity
indices continue to trend upward. Despite a slight dip in the first half of April, the Nikkei Stock Average recovered to reach a 12-month high in June.
► There were 11 IPOs on Japanese exchanges in Q2 2017, raising a combined total of US$498m in proceeds. This pushed the total for H1 2017 to 38 IPOs with capital raised at US$2.4b. This compares to proceeds of US$2.3b through 42 IPOs in H1 2016.
► The tendency for smaller companies to come to market continues — there have been eight IPOs on the Tokyo Main Market this year, compared with a combined 30 IPOs on JASDAQ and Tokyo MOTHERS in H1 2017.
► Companies transferring from the junior markets to be listed on the Tokyo Main Market was active in the first five months of 2017, with 12 transfers to the Tokyo Main Market. This compares with 57 transfers during 2016, which saw 68 IPOs on JASDAQ and Tokyo MOTHERS.
► The largest IPO of the year-to-date remains the US$616m listing of PE-backed sushi chain Sushiro Global Holdings Ltd. in March, but technology, media and retail sectors remain the most active.
► Technology companies were given a boost mid-way through the second quarter when the Japanese Government announced its new strategy to encourage growth in key industries, which includes measures to spur innovation around cutting-edge technologies such as the Internet of Things (IoT) and artificial intelligence.
► With a pipeline of around 180 companies ready to list, we expect the total number of IPOs in the whole of 2017 to surpass 2016 when there was 88 IPOs.
+ or – indicates change compared to offer price at IPO
$0.0
$0.2
$0.4
$0.6
$0.8
$1.0
$1.2
0
10
20
30
40
50
60
70
80
2013 2014 2015 2016 YTD 17
Number of IPOs Proceeds US$b
$0
$4
$8
$12
$16
0
5
10
15
20
25
30
2013 2014 2015 2016 YTD 17
54%
79%
40%
9%
YTD 2017 Change on prior year Q2 2017
Change on prior yearquarter
38IPOs
11IPOs
$2.4bProceeds
$498.2mproceeds
$9.5mmedian deal size
$7.9mmedian deal size
10%
4%
39%
53%
26%9%
60% 31%
Global IPO Trends: Q2 2017 | Page 21
Europe, Middle East, India and AfricaProspects are brightening but uncertainty remains“Despite geopolitical uncertainties in the first half of the year, activity in EMEIA is increasing, representing the second most active IPO market globally. Based on a very solid reporting season and momentum from the first half, prospects are brightening in many economies buoyed by accommodative monetary policy, soaring equity indices and low volatility, all of which encourage positive investor sentiment.”Dr. Martin SteinbachEY Global and EMEIA IPO Leader
Global IPO Trends: Q2 2017 | Page 22All values are US$ unless otherwise noted. | Q2 2017 and Q2 17 refer to the second quarter of 2017 and cover priced IPOs from 1 April to 17 June 2017 plus expected IPOs by end of June. YTD 2017 refer to the first six months of 2017 and cover priced IPOs from 1 January to 17 June 2017 plus expected IPOs by end of June.
Europe, Middle East, India and Africa
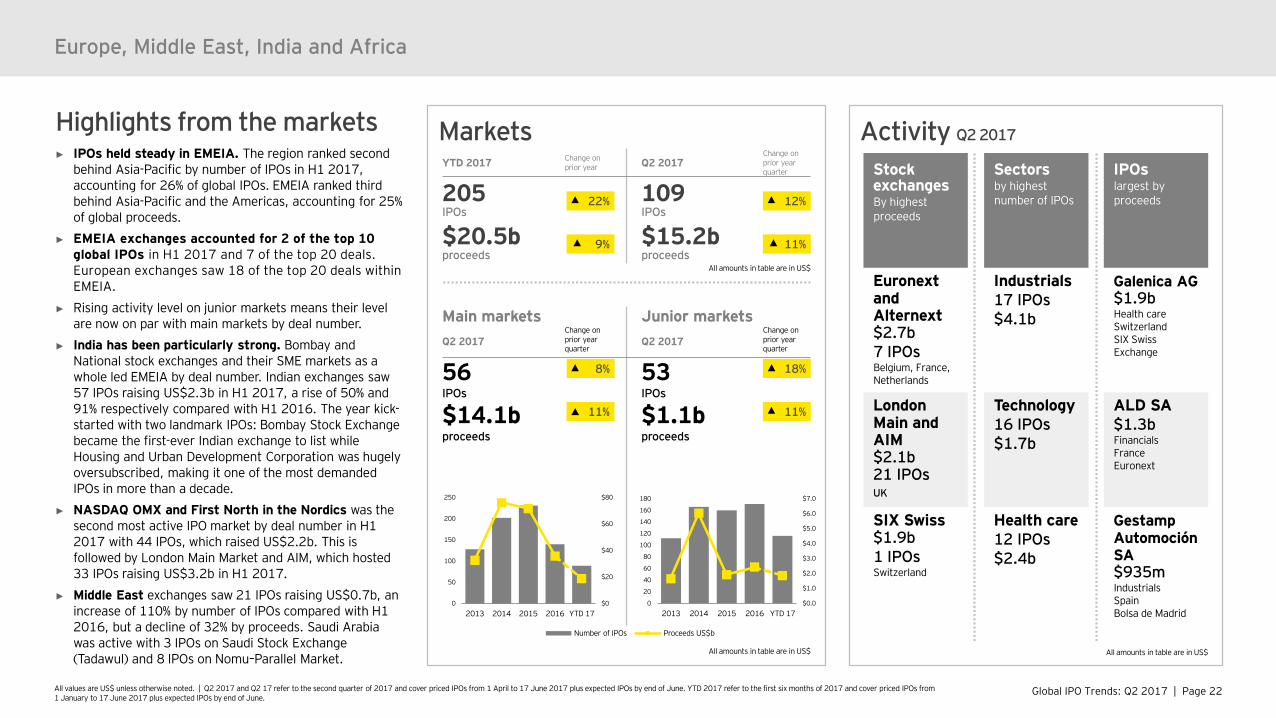
Highlights from the markets► IPOs held steady in EMEIA. The region ranked second
behind Asia-Pacific by number of IPOs in H1 2017, accounting for 26% of global IPOs. EMEIA ranked third behind Asia-Pacific and the Americas, accounting for 25% of global proceeds.
► EMEIA exchanges accounted for 2 of the top 10 global IPOs in H1 2017 and 7 of the top 20 deals. European exchanges saw 18 of the top 20 deals within EMEIA.
► Rising activity level on junior markets means their level are now on par with main markets by deal number.
► India has been particularly strong. Bombay and National stock exchanges and their SME markets as a whole led EMEIA by deal number. Indian exchanges saw 57 IPOs raising US$2.3b in H1 2017, a rise of 50% and 91% respectively compared with H1 2016. The year kick-started with two landmark IPOs: Bombay Stock Exchange became the first-ever Indian exchange to list while Housing and Urban Development Corporation was hugely oversubscribed, making it one of the most demanded IPOs in more than a decade.
► NASDAQ OMX and First North in the Nordics was the second most active IPO market by deal number in H1 2017 with 44 IPOs, which raised US$2.2b. This is followed by London Main Market and AIM, which hosted 33 IPOs raising US$3.2b in H1 2017.
► Middle East exchanges saw 21 IPOs raising US$0.7b, an increase of 110% by number of IPOs compared with H1 2016, but a decline of 32% by proceeds. Saudi Arabia was active with 3 IPOs on Saudi Stock Exchange (Tadawul) and 8 IPOs on Nomu–Parallel Market.
Activity Q2 2017
Stock exchangesBy highest proceeds
Euronext and Alternext$2.7b7 IPOsBelgium, France, Netherlands
London Main and AIM$2.1b21 IPOsUK
SIX Swiss $1.9b1 IPOsSwitzerland
IPOslargest byproceeds
Galenica AG$1.9bHealth careSwitzerlandSIX Swiss Exchange
ALD SA$1.3bFinancialsFranceEuronext
Gestamp Automoción SA$935mIndustrialsSpainBolsa de Madrid
Sectorsby highestnumber of IPOs
Industrials17 IPOs$4.1b
Technology16 IPOs$1.7b
Health care12 IPOs$2.4b
All amounts in table are in US$
Markets
Main markets Junior marketsQ2 2017
Change on prior year quarter
Q2 2017Change on prior year quarter
56IPOs
53IPOs
$14.1bproceeds
$1.1bproceeds
11%
All amounts in table are in US$
8% 18%
11%
All amounts in table are in US$
$0.0
$1.0
$2.0
$3.0
$4.0
$5.0
$6.0
$7.0
0
20
40
60
80
100
120
140
160
180
2013 2014 2015 2016 YTD 17
Number of IPOs Proceeds US$b
$0
$20
$40
$60
$80
0
50
100
150
200
250
2013 2014 2015 2016 YTD 17
YTD 2017 Change on prior year Q2 2017
Change on prior year quarter
205IPOs
109IPOs
$20.5bproceeds
$15.2bproceeds
22%
9%
12%
11%
Global IPO Trends: Q2 2017 | Page 23All values are US$ unless otherwise noted. | Q2 2017 and Q2 17 refer to the second quarter of 2017 and cover priced IPOs from 1 April to 17 June 2017 plus expected IPOs by end of June. YTD 2017 refer to the first six months of 2017 and cover priced IPOs from 1 January to 17 June 2017 plus expected IPOs by end of June.
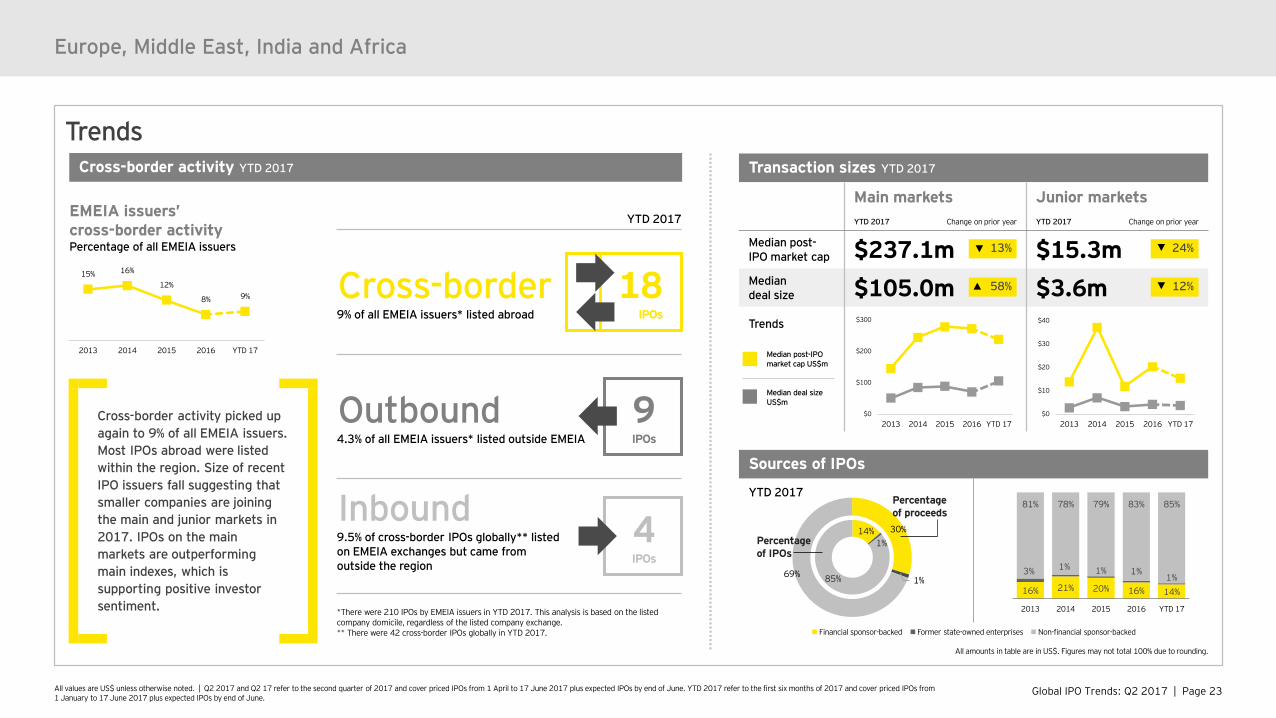
Trends
Sources of IPOs
YTD 2017
YTD 2017
Cross-border 9% of all EMEIA issuers* listed abroad
Outbound4.3% of all EMEIA issuers* listed outside EMEIA
Inbound9.5% of cross-border IPOs globally** listedon EMEIA exchanges but came fromoutside the region
*There were 210 IPOs by EMEIA issuers in YTD 2017. This analysis is based on the listed company domicile, regardless of the listed company exchange.** There were 42 cross-border IPOs globally in YTD 2017.
Europe, Middle East, India and Africa
Cross-border activity YTD 2017
EMEIA issuers’ cross-border activityPercentage of all EMEIA issuers
Cross-border activity picked up again to 9% of all EMEIA issuers. Most IPOs abroad were listed within the region. Size of recent IPO issuers fall suggesting that smaller companies are joining the main and junior markets in 2017. IPOs on the main markets are outperforming main indexes, which is supporting positive investor sentiment.
4IPOs
9IPOs
Transaction sizes YTD 2017
Main markets Junior marketsYTD 2017 Change on prior year YTD 2017 Change on prior year
Median post-IPO market cap $237.1m $15.3mMedian deal size $105.0m $3.6mTrends
13% 24%
12%
All amounts in table are in US$. Figures may not total 100% due to rounding.
30%
1%69%
Percentage of proceeds
14%1%
85%
Percentageof IPOs
18IPOs
Financial sponsor-backed Former state-owned enterprises Non-financial sponsor-backed
58%
16% 21% 20% 16% 14%
3% 1% 1% 1%1%
81% 78% 79% 83% 85%
2013 2014 2015 2016 YTD 17
15% 16%
12%
8% 9%
2013 2014 2015 2016 YTD 17
$0
$100
$200
$300
2013 2014 2015 2016 YTD 17$0
$10
$20
$30
$40
2013 2014 2015 2016 YTD 17
Median post-IPO market cap US$m
Median deal size US$m
Global IPO Trends: Q2 2017 | Page 24All values are US$ unless otherwise noted. | Q2 2017 and Q2 17 refer to the second quarter of 2017 and cover priced IPOs from 1 April to 17 June 2017 plus expected IPOs by end of June. YTD 2017 refer to the first six months of 2017 and cover priced IPOs from 1 January to 17 June 2017 plus expected IPOs by end of June.
Europe, Middle East, India and Africa
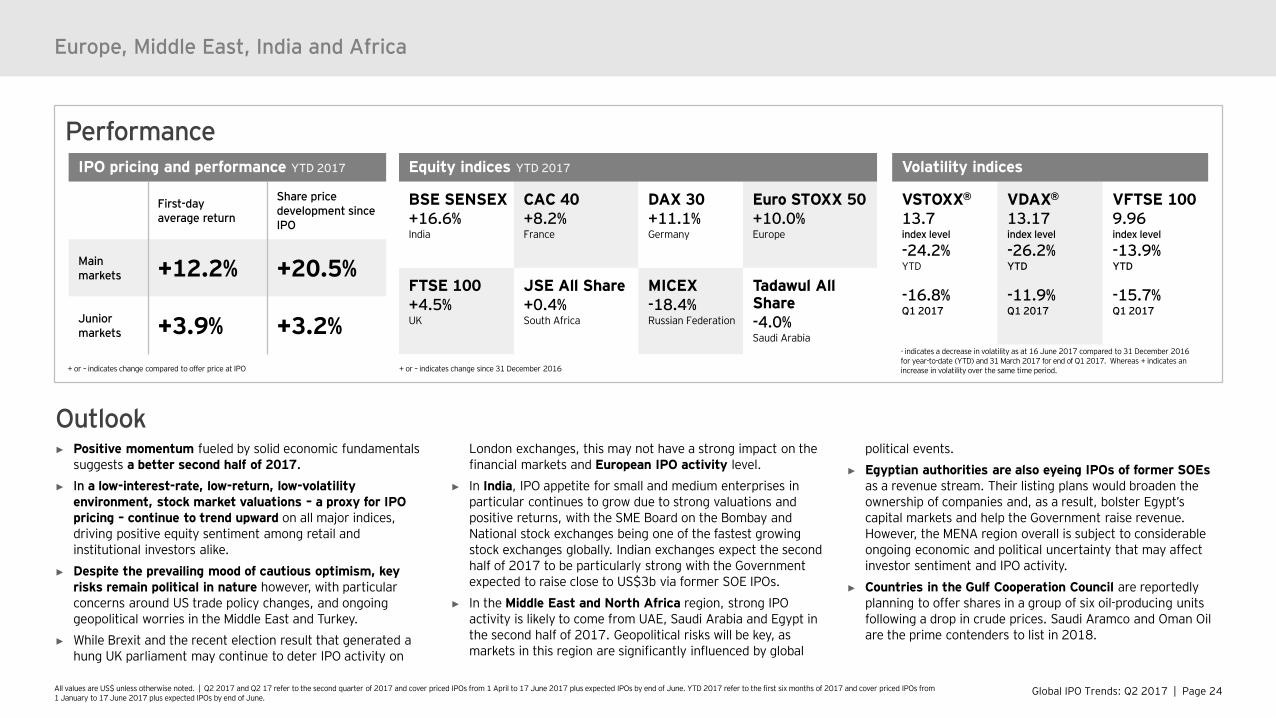
PerformanceEquity indices YTD 2017
BSE SENSEX+16.6%India
CAC 40+8.2%France
DAX 30+11.1%Germany
Euro STOXX 50+10.0%Europe
FTSE 100+4.5%UK
JSE All Share+0.4%South Africa
MICEX-18.4%Russian Federation
Tadawul All Share-4.0%Saudi Arabia
IPO pricing and performance YTD 2017
First-day average return
Share price development since IPO
Main markets +12.2% +20.5%
Junior markets +3.9% +3.2%
Volatility indices
VSTOXX®
13.7 index level
-24.2%YTD
-16.8%Q1 2017
VDAX®
13.17 index level
-26.2%YTD
-11.9%Q1 2017
VFTSE 100 9.96 index level
-13.9%YTD
-15.7%Q1 2017
+ or – indicates change since 31 December 2016
- - indicates a decrease in volatility as at 16 June 2017 compared to 31 December 2016 for year-to-date (YTD) and 31 March 2017 for end of Q1 2017. Whereas + indicates an increase in volatility over the same time period.+ or – indicates change compared to offer price at IPO
► Positive momentum fueled by solid economic fundamentals suggests a better second half of 2017.
► In a low-interest-rate, low-return, low-volatility environment, stock market valuations – a proxy for IPO pricing – continue to trend upward on all major indices, driving positive equity sentiment among retail and institutional investors alike.
► Despite the prevailing mood of cautious optimism, key risks remain political in nature however, with particular concerns around US trade policy changes, and ongoing geopolitical worries in the Middle East and Turkey.
► While Brexit and the recent election result that generated a hung UK parliament may continue to deter IPO activity on
London exchanges, this may not have a strong impact on the financial markets and European IPO activity level.
► In India, IPO appetite for small and medium enterprises in particular continues to grow due to strong valuations and positive returns, with the SME Board on the Bombay and National stock exchanges being one of the fastest growing stock exchanges globally. Indian exchanges expect the second half of 2017 to be particularly strong with the Government expected to raise close to US$3b via former SOE IPOs.
► In the Middle East and North Africa region, strong IPO activity is likely to come from UAE, Saudi Arabia and Egypt in the second half of 2017. Geopolitical risks will be key, as markets in this region are significantly influenced by global
political events.► Egyptian authorities are also eyeing IPOs of former SOEs
as a revenue stream. Their listing plans would broaden the ownership of companies and, as a result, bolster Egypt’s capital markets and help the Government raise revenue. However, the MENA region overall is subject to considerable ongoing economic and political uncertainty that may affect investor sentiment and IPO activity.
► Countries in the Gulf Cooperation Council are reportedly planning to offer shares in a group of six oil-producing units following a drop in crude prices. Saudi Aramco and Oman Oil are the prime contenders to list in 2018.
Outlook
Global IPO Trends: Q2 2017 | Page 25All values are US$ unless otherwise noted. | Q2 2017 and Q2 17 refer to the second quarter of 2017 and cover priced IPOs from 1 April to 17 June 2017 plus expected IPOs by end of June. YTD 2017 refer to the first six months of 2017 and cover priced IPOs from 1 January to 17 June 2017 plus expected IPOs by end of June.
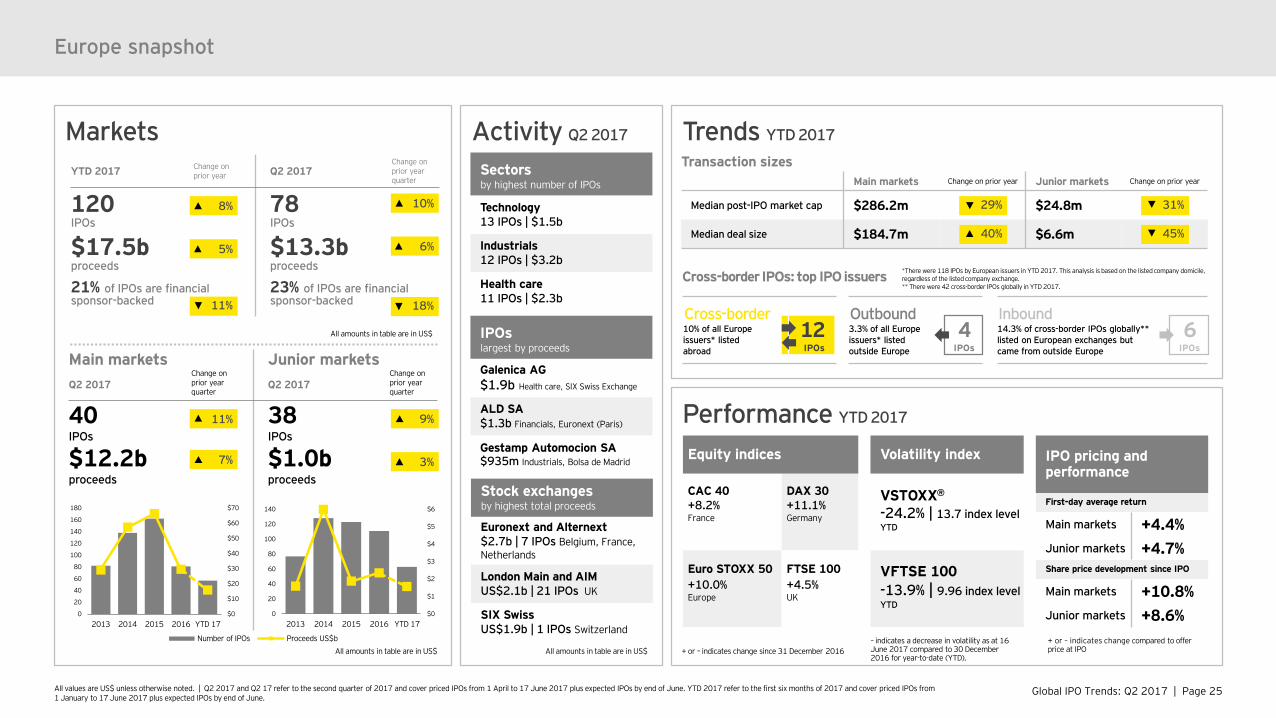
Markets Activity Q2 2017
Performance YTD 2017
Europe snapshot
Main markets Junior marketsQ2 2017
Change on prior year quarter
Q2 2017Change on prior year quarter
40IPOs
38IPOs
$12.2bproceeds
$1.0bproceeds
All amounts in table are in US$
7%
All amounts in table are in US$
11% 9%
YTD 2017 Change on prior year Q2 2017
Change on prior year quarter
120IPOs
78IPOs
$17.5bproceeds
$13.3bproceeds
21% of IPOs are financial sponsor-backed
23% of IPOs are financial sponsor-backed
8%
5%
10%
6%
3% IPO pricing and performance
First-day average return
Main markets +4.4%Junior markets +4.7%Share price development since IPO
Main markets +10.8%Junior markets +8.6%
Equity indices
CAC 40+8.2%France
DAX 30+11.1%Germany
Euro STOXX 50+10.0%Europe
FTSE 100+4.5%UK
Volatility index
VSTOXX®
-24.2% | 13.7 index levelYTD
VFTSE 100 -13.9% | 9.96 index levelYTD
Sectorsby highest number of IPOs
Technology13 IPOs | $1.5b
Industrials12 IPOs | $3.2b
Health care11 IPOs | $2.3b
All amounts in table are in US$ + or – indicates change since 31 December 2016– indicates a decrease in volatility as at 16 June 2017 compared to 30 December 2016 for year-to-date (YTD).
+ or – indicates change compared to offer price at IPO
11% 18%
IPOslargest by proceeds
Galenica AG$1.9b Health care, SIX Swiss Exchange
ALD SA$1.3b Financials, Euronext (Paris)
Gestamp Automocion SA $935m Industrials, Bolsa de Madrid
Stock exchanges by highest total proceeds
Euronext and Alternext$2.7b | 7 IPOs Belgium, France, Netherlands
London Main and AIMUS$2.1b | 21 IPOs UK
SIX Swiss US$1.9b | 1 IPOs Switzerland
Trends YTD 2017
Transaction sizesMain markets Change on prior year Junior markets Change on prior year
Median post-IPO market cap $286.2m $24.8m
Median deal size $184.7m $6.6m
29%
40%
31%
45%
$0
$1
$2
$3
$4
$5
$6
0
20
40
60
80
100
120
140
2013 2014 2015 2016 YTD 17
Number of IPOs Proceeds US$b
$0
$10
$20
$30
$40
$50
$60
$70
0
20
40
60
80
100
120
140
160
180
2013 2014 2015 2016 YTD 17
Cross-border IPOs: top IPO issuers
Cross-border 10% of all Europe issuers* listed abroad
12IPOs
Outbound3.3% of all Europe issuers* listed outside Europe
4IPOs
Inbound14.3% of cross-border IPOs globally** listed on European exchanges but came from outside Europe
6IPOs
*There were 118 IPOs by European issuers in YTD 2017. This analysis is based on the listed company domicile, regardless of the listed company exchange.** There were 42 cross-border IPOs globally in YTD 2017.
Global IPO Trends: Q2 2017 | Page 26
EMEIA — UK IPO market insightFragile investor confidence set back by surprise election result“In the second quarter, we started to see increased investor confidence and a rise in the volume of IPOs, largely driven by expectations that the UK general election in June would enhance political stability and confirm the country’s Brexit strategy. The surprise result instead delivered a hung parliament, causing the pound to drop and diminishing investor confidence. Unless a majority government can be formed that can deliver clarity over the proposed EU exit strategy, continued political uncertainty is likely to dampen the appetite for larger deals, with the focus remaining on small to mid-cap listings.”Scott McCubbinEY UK and Ireland IPO Leader
Global IPO Trends: Q2 2017 | Page 27All values are US$ unless otherwise noted. | Q2 2017 and Q2 17 refer to the second quarter of 2017 and cover priced IPOs from 1 April to 17 June 2017 plus expected IPOs by end of June. YTD 2017 refer to the first six months of 2017 and cover priced IPOs from 1 January to 17 June 2017 plus expected IPOs by end of June.
EMEIA — UK IPO market insight
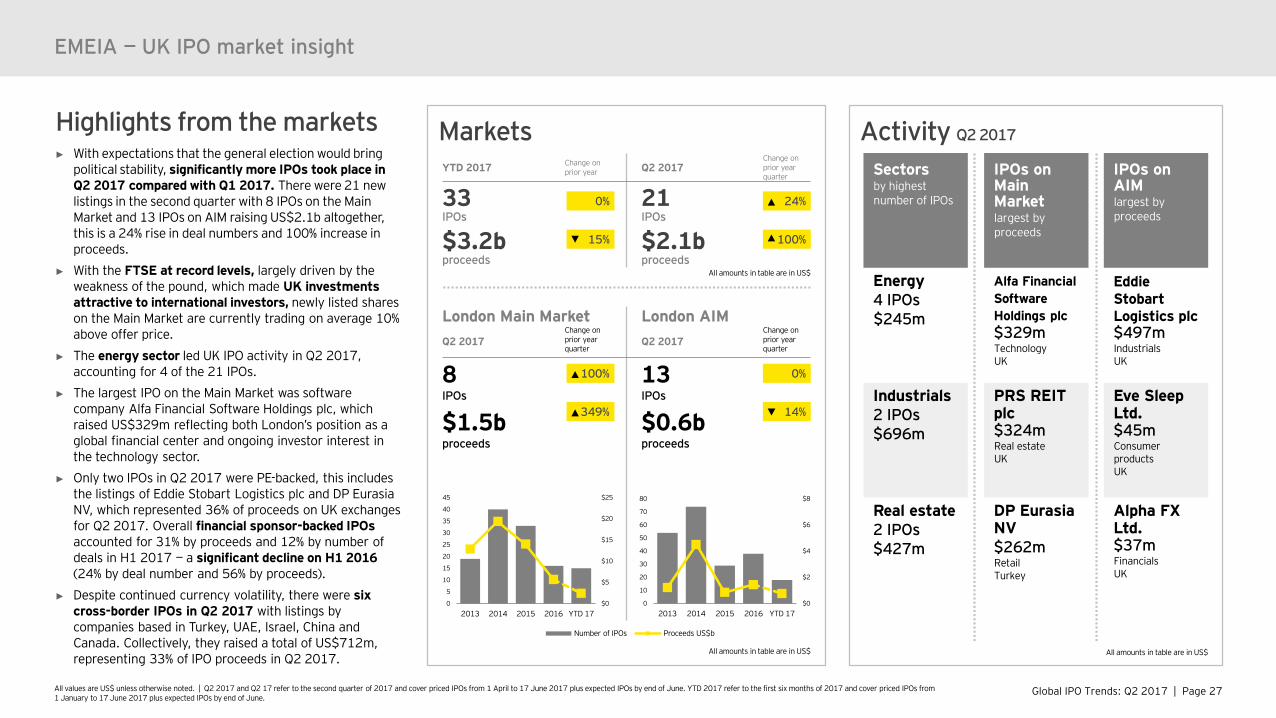
Highlights from the markets► With expectations that the general election would bring
political stability, significantly more IPOs took place in Q2 2017 compared with Q1 2017. There were 21 new listings in the second quarter with 8 IPOs on the Main Market and 13 IPOs on AIM raising US$2.1b altogether, this is a 24% rise in deal numbers and 100% increase in proceeds.
► With the FTSE at record levels, largely driven by the weakness of the pound, which made UK investments attractive to international investors, newly listed shares on the Main Market are currently trading on average 10% above offer price.
► The energy sector led UK IPO activity in Q2 2017, accounting for 4 of the 21 IPOs.
► The largest IPO on the Main Market was software company Alfa Financial Software Holdings plc, which raised US$329m reflecting both London’s position as a global financial center and ongoing investor interest in the technology sector.
► Only two IPOs in Q2 2017 were PE-backed, this includes the listings of Eddie Stobart Logistics plc and DP Eurasia NV, which represented 36% of proceeds on UK exchanges for Q2 2017. Overall financial sponsor-backed IPOs accounted for 31% by proceeds and 12% by number of deals in H1 2017 — a significant decline on H1 2016 (24% by deal number and 56% by proceeds).
► Despite continued currency volatility, there were six cross-border IPOs in Q2 2017 with listings by companies based in Turkey, UAE, Israel, China and Canada. Collectively, they raised a total of US$712m, representing 33% of IPO proceeds in Q2 2017.
Activity Q2 2017
Sectorsby highest number of IPOs
Energy 4 IPOs$245m
Industrials2 IPOs$696m
Real estate2 IPOs$427m
IPOs on AIMlargest by proceeds
Eddie Stobart Logistics plc$497mIndustrialsUK
Eve Sleep Ltd.$45mConsumer productsUK
Alpha FX Ltd.$37mFinancialsUK
IPOs on Main Marketlargest by proceeds
Alfa Financial Software Holdings plc $329mTechnologyUK
PRS REIT plc$324mReal estateUK
DP Eurasia NV$262mRetailTurkey
All amounts in table are in US$
Markets
London Main Market London AIMQ2 2017
Change on prior yearquarter
Q2 2017Change on prior year quarter
8IPOs
13IPOs
$1.5bproceeds
$0.6bproceeds
100%
349%
0%
14%
All amounts in table are in US$
All amounts in table are in US$
$0
$2
$4
$6
$8
0
10
20
30
40
50
60
70
80
2013 2014 2015 2016 YTD 17
Number of IPOs Proceeds US$b
$0
$5
$10
$15
$20
$25
0
5
10
15
20
25
30
35
40
45
2013 2014 2015 2016 YTD 17
YTD 2017 Change on prior year Q2 2017
Change on prior yearquarter
33IPOs
21IPOs
$3.2bproceeds
$2.1bproceeds
0%
15%
24%
100%
Global IPO Trends: Q2 2017 | Page 28All values are US$ unless otherwise noted. | Q2 2017 and Q2 17 refer to the second quarter of 2017 and cover priced IPOs from 1 April to 17 June 2017 plus expected IPOs by end of June. YTD 2017 refer to the first six months of 2017 and cover priced IPOs from 1 January to 17 June 2017 plus expected IPOs by end of June.
Trends
Sources of IPOs
YTD 2017
31%
69%
Percentage of proceeds
12%
88%
Percentage of IPOs
EMEIA — UK IPO market insight
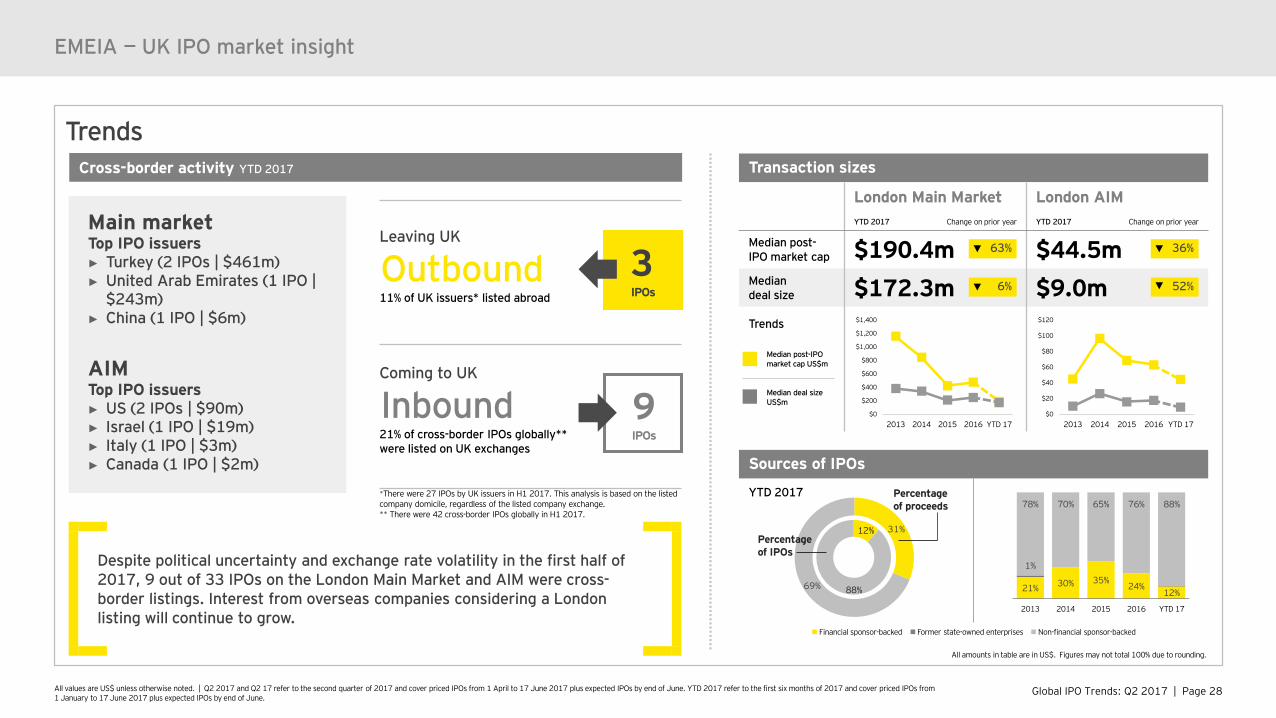
Leaving UK
Outbound11% of UK issuers* listed abroad
Coming to UK
Inbound 21% of cross-border IPOs globally**were listed on UK exchanges
*There were 27 IPOs by UK issuers in H1 2017. This analysis is based on the listed company domicile, regardless of the listed company exchange.** There were 42 cross-border IPOs globally in H1 2017.
Cross-border activity YTD 2017
Main marketTop IPO issuers► Turkey (2 IPOs | $461m)► United Arab Emirates (1 IPO |
$243m)► China (1 IPO | $6m)
AIMTop IPO issuers► US (2 IPOs | $90m)► Israel (1 IPO | $19m)► Italy (1 IPO | $3m)► Canada (1 IPO | $2m)
9IPOs
3IPOs
Transaction sizes
London Main Market London AIMYTD 2017 Change on prior year YTD 2017 Change on prior year
Median post-IPO market cap $190.4m $44.5mMedian deal size $172.3m $9.0mTrends
36%
Median post-IPO market cap US$m
Median deal size US$m
All amounts in table are in US$. Figures may not total 100% due to rounding.
63%
6% 52%
Financial sponsor-backed Former state-owned enterprises Non-financial sponsor-backed
Despite political uncertainty and exchange rate volatility in the first half of 2017, 9 out of 33 IPOs on the London Main Market and AIM were cross-border listings. Interest from overseas companies considering a London listing will continue to grow.
21% 30% 35%24%
12%
1%
78% 70% 65% 76% 88%
2013 2014 2015 2016 YTD 17
$0
$200
$400
$600
$800
$1,000
$1,200
$1,400
2013 2014 2015 2016 YTD 17$0
$20
$40
$60
$80
$100
$120
2013 2014 2015 2016 YTD 17
Global IPO Trends: Q2 2017 | Page 29All values are US$ unless otherwise noted. | Q2 2017 and Q2 17 refer to the second quarter of 2017 and cover priced IPOs from 1 April to 17 June 2017 plus expected IPOs by end of June. YTD 2017 refer to the first six months of 2017 and cover priced IPOs from 1 January to 17 June 2017 plus expected IPOs by end of June.
EMEIA — UK IPO market insight
PerformanceEquity indices YTD 2017
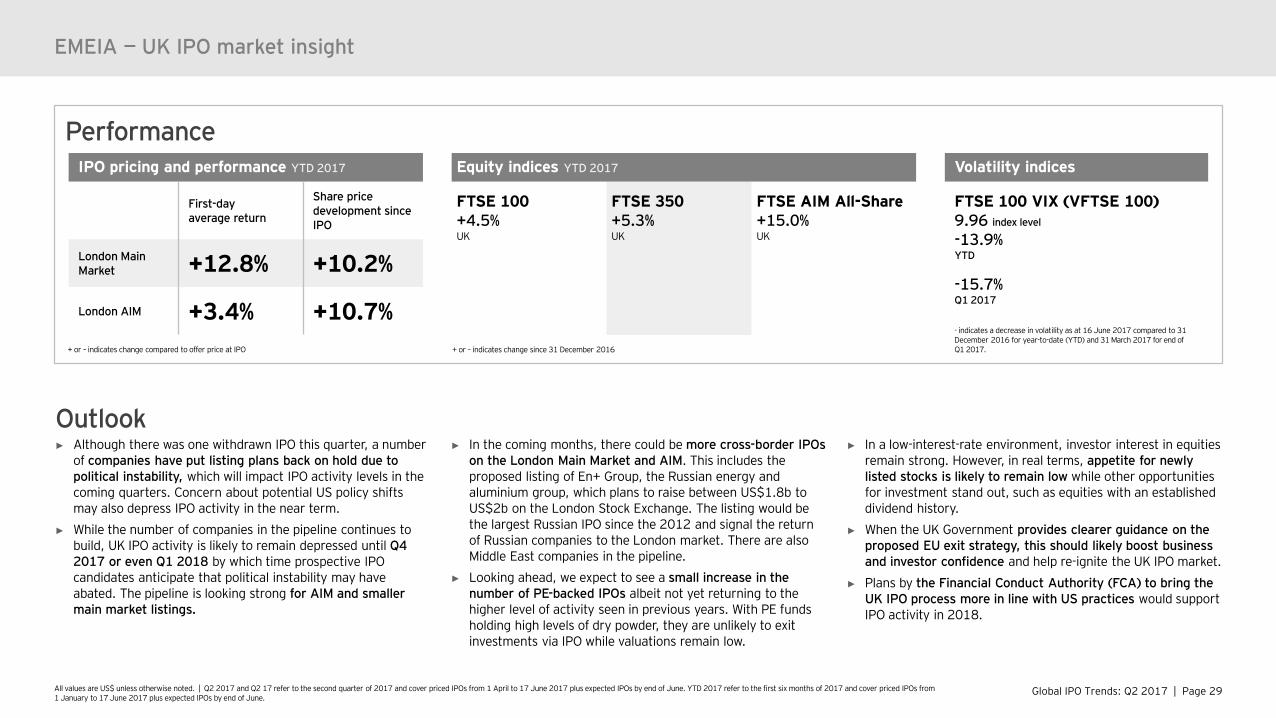
FTSE 100+4.5%UK
FTSE 350+5.3%UK
FTSE AIM All-Share+15.0%UK
IPO pricing and performance YTD 2017
First-day average return
Share price development since IPO
London Main Market +12.8% +10.2%
London AIM +3.4% +10.7%
Volatility indices
FTSE 100 VIX (VFTSE 100)9.96 index level
-13.9%YTD
-15.7%Q1 2017
+ or – indicates change since 31 December 2016+ or – indicates change compared to offer price at IPO
- indicates a decrease in volatility as at 16 June 2017 compared to 31 December 2016 for year-to-date (YTD) and 31 March 2017 for end of Q1 2017.
► Although there was one withdrawn IPO this quarter, a number of companies have put listing plans back on hold due to political instability, which will impact IPO activity levels in the coming quarters. Concern about potential US policy shifts may also depress IPO activity in the near term.
► While the number of companies in the pipeline continues to build, UK IPO activity is likely to remain depressed until Q4 2017 or even Q1 2018 by which time prospective IPO candidates anticipate that political instability may have abated. The pipeline is looking strong for AIM and smaller main market listings.
► In the coming months, there could be more cross-border IPOs on the London Main Market and AIM. This includes the proposed listing of En+ Group, the Russian energy and aluminium group, which plans to raise between US$1.8b to US$2b on the London Stock Exchange. The listing would be the largest Russian IPO since the 2012 and signal the return of Russian companies to the London market. There are also Middle East companies in the pipeline.
► Looking ahead, we expect to see a small increase in the number of PE-backed IPOs albeit not yet returning to the higher level of activity seen in previous years. With PE funds holding high levels of dry powder, they are unlikely to exit investments via IPO while valuations remain low.
► In a low-interest-rate environment, investor interest in equities remain strong. However, in real terms, appetite for newly listed stocks is likely to remain low while other opportunities for investment stand out, such as equities with an established dividend history.
► When the UK Government provides clearer guidance on the proposed EU exit strategy, this should likely boost business and investor confidence and help re-ignite the UK IPO market.
► Plans by the Financial Conduct Authority (FCA) to bring the UK IPO process more in line with US practices would support IPO activity in 2018.
Outlook

AppendixAreas and regional IPO markets facts and figures
Definitions
Global IPO Trends: Q2 2017 | Page 31**Data based on domicile of the exchange, regardless of the listed company domicile. Euronext includes Euronext (Amsterdam, Paris, Brussels and Lisbon); Shenzhen (SZSE) includes the Main Board, SME Board and ChiNext.
Appendix
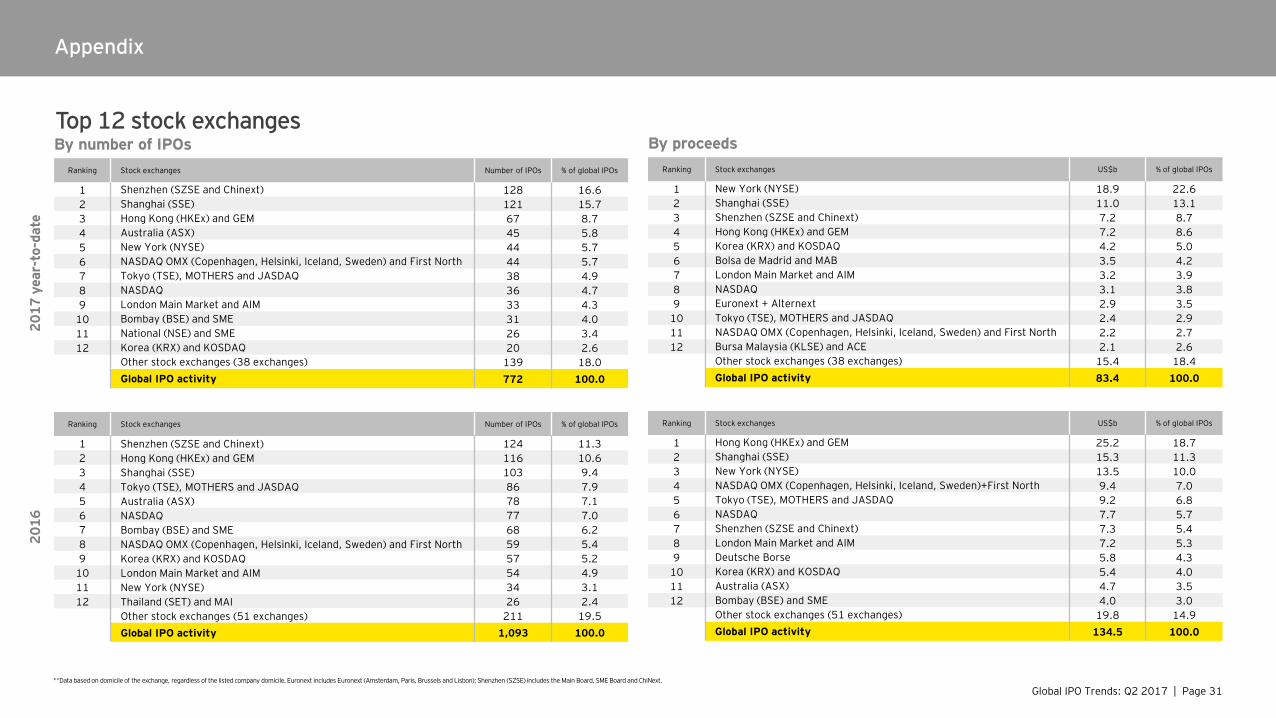
Top 12 stock exchangesBy number of IPOs
2017
yea
r-to
-dat
e
Ranking Stock exchanges Number of IPOs % of global IPOs
1 Shenzhen (SZSE and Chinext) 128 16.62 Shanghai (SSE) 121 15.73 Hong Kong (HKEx) and GEM 67 8.74 Australia (ASX) 45 5.85 New York (NYSE) 44 5.76 NASDAQ OMX (Copenhagen, Helsinki, Iceland, Sweden) and First North 44 5.77 Tokyo (TSE), MOTHERS and JASDAQ 38 4.98 NASDAQ 36 4.79 London Main Market and AIM 33 4.3
10 Bombay (BSE) and SME 31 4.011 National (NSE) and SME 26 3.412 Korea (KRX) and KOSDAQ 20 2.6
Other stock exchanges (38 exchanges) 139 18.0Global IPO activity 772 100.0
2016
Ranking Stock exchanges Number of IPOs % of global IPOs
1 Shenzhen (SZSE and Chinext) 124 11.32 Hong Kong (HKEx) and GEM 116 10.63 Shanghai (SSE) 103 9.44 Tokyo (TSE), MOTHERS and JASDAQ 86 7.95 Australia (ASX) 78 7.16 NASDAQ 77 7.07 Bombay (BSE) and SME 68 6.28 NASDAQ OMX (Copenhagen, Helsinki, Iceland, Sweden) and First North 59 5.49 Korea (KRX) and KOSDAQ 57 5.2
10 London Main Market and AIM 54 4.911 New York (NYSE) 34 3.112 Thailand (SET) and MAI 26 2.4
Other stock exchanges (51 exchanges) 211 19.5Global IPO activity 1,093 100.0
By proceedsRanking Stock exchanges US$b % of global IPOs
1 New York (NYSE) 18.9 22.62 Shanghai (SSE) 11.0 13.13 Shenzhen (SZSE and Chinext) 7.2 8.74 Hong Kong (HKEx) and GEM 7.2 8.65 Korea (KRX) and KOSDAQ 4.2 5.06 Bolsa de Madrid and MAB 3.5 4.27 London Main Market and AIM 3.2 3.98 NASDAQ 3.1 3.89 Euronext + Alternext 2.9 3.5
10 Tokyo (TSE), MOTHERS and JASDAQ 2.4 2.911 NASDAQ OMX (Copenhagen, Helsinki, Iceland, Sweden) and First North 2.2 2.712 Bursa Malaysia (KLSE) and ACE 2.1 2.6
Other stock exchanges (38 exchanges) 15.4 18.4Global IPO activity 83.4 100.0
Ranking Stock exchanges US$b % of global IPOs
1 Hong Kong (HKEx) and GEM 25.2 18.72 Shanghai (SSE) 15.3 11.33 New York (NYSE) 13.5 10.04 NASDAQ OMX (Copenhagen, Helsinki, Iceland, Sweden)+First North 9.4 7.05 Tokyo (TSE), MOTHERS and JASDAQ 9.2 6.86 NASDAQ 7.7 5.77 Shenzhen (SZSE and Chinext) 7.3 5.48 London Main Market and AIM 7.2 5.39 Deutsche Borse 5.8 4.3
10 Korea (KRX) and KOSDAQ 5.4 4.011 Australia (ASX) 4.7 3.512 Bombay (BSE) and SME 4.0 3.0
Other stock exchanges (51 exchanges) 19.8 14.9Global IPO activity 134.5 100.0
Global IPO Trends: Q2 2017 | Page 32**Data based on domicile of the exchange, regardless of the listed company domicile. Euronext includes Euronext (Amsterdam, Paris, Brussels and Lisbon); Shenzhen (SZSE) includes the Main Board, SME Board and ChiNext.
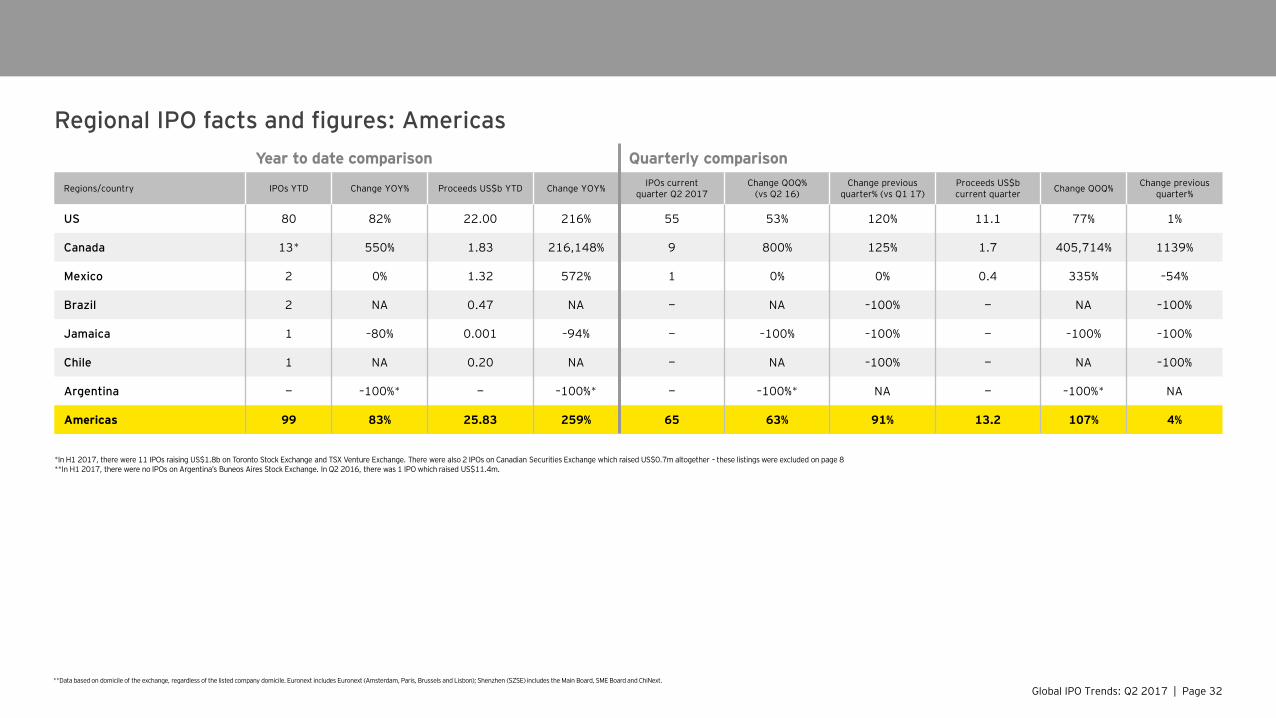
Regional IPO facts and figures: AmericasYear to date comparison Quarterly comparison
Regions/country IPOs YTD Change YOY% Proceeds US$b YTD Change YOY% IPOs currentquarter Q2 2017
Change QOQ% (vs Q2 16)
Change previous quarter% (vs Q1 17)
Proceeds US$bcurrent quarter Change QOQ% Change previous
quarter%
US 80 82% 22.00 216% 55 53% 120% 11.1 77% 1%
Canada 13* 550% 1.83 216,148% 9 800% 125% 1.7 405,714% 1139%
Mexico 2 0% 1.32 572% 1 0% 0% 0.4 335% –54%
Brazil 2 NA 0.47 NA — NA –100% — NA –100%
Jamaica 1 –80% 0.001 –94% — –100% –100% — –100% –100%
Chile 1 NA 0.20 NA — NA –100% — NA –100%
Argentina — –100%* — –100%* — –100%* NA — –100%* NA
Americas 99 83% 25.83 259% 65 63% 91% 13.2 107% 4%
*In H1 2017, there were 11 IPOs raising US$1.8b on Toronto Stock Exchange and TSX Venture Exchange. There were also 2 IPOs on Canadian Securities Exchange which raised US$0.7m altogether – these listings were excluded on page 8**In H1 2017, there were no IPOs on Argentina’s Buneos Aires Stock Exchange. In Q2 2016, there was 1 IPO which raised US$11.4m.
Global IPO Trends: Q2 2017 | Page 33**Data based on domicile of the exchange, regardless of the listed company domicile. Euronext includes Euronext (Amsterdam, Paris, Brussels and Lisbon); Shenzhen (SZSE) includes the Main Board, SME Board and ChiNext.
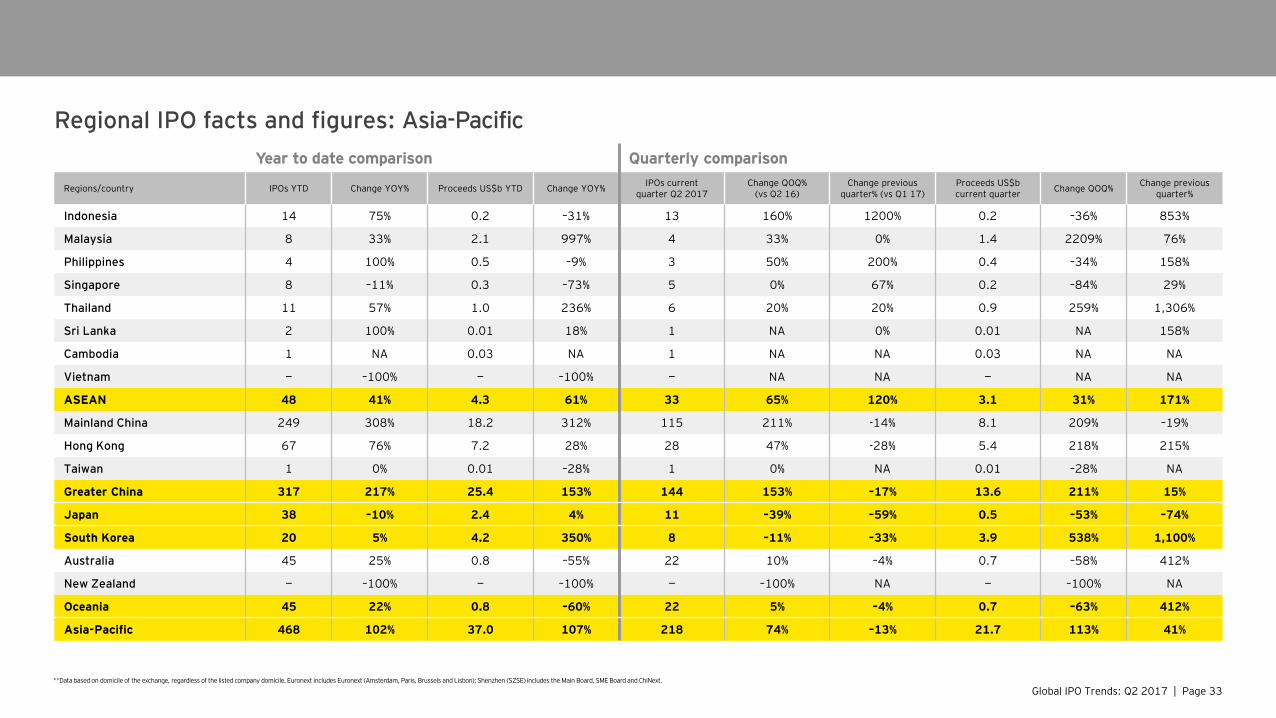
Regional IPO facts and figures: Asia-PacificYear to date comparison Quarterly comparison
Regions/country IPOs YTD Change YOY% Proceeds US$b YTD Change YOY% IPOs currentquarter Q2 2017
Change QOQ% (vs Q2 16)
Change previous quarter% (vs Q1 17)
Proceeds US$bcurrent quarter Change QOQ% Change previous
quarter%
Indonesia 14 75% 0.2 –31% 13 160% 1200% 0.2 –36% 853%
Malaysia 8 33% 2.1 997% 4 33% 0% 1.4 2209% 76%
Philippines 4 100% 0.5 –9% 3 50% 200% 0.4 –34% 158%
Singapore 8 –11% 0.3 –73% 5 0% 67% 0.2 –84% 29%
Thailand 11 57% 1.0 236% 6 20% 20% 0.9 259% 1,306%
Sri Lanka 2 100% 0.01 18% 1 NA 0% 0.01 NA 158%
Cambodia 1 NA 0.03 NA 1 NA NA 0.03 NA NA
Vietnam — –100% — –100% — NA NA — NA NA
ASEAN 48 41% 4.3 61% 33 65% 120% 3.1 31% 171%
Mainland China 249 308% 18.2 312% 115 211% -14% 8.1 209% –19%
Hong Kong 67 76% 7.2 28% 28 47% -28% 5.4 218% 215%
Taiwan 1 0% 0.01 –28% 1 0% NA 0.01 –28% NA
Greater China 317 217% 25.4 153% 144 153% –17% 13.6 211% 15%
Japan 38 –10% 2.4 4% 11 –39% –59% 0.5 –53% –74%
South Korea 20 5% 4.2 350% 8 –11% –33% 3.9 538% 1,100%
Australia 45 25% 0.8 –55% 22 10% –4% 0.7 –58% 412%
New Zealand — –100% — –100% — –100% NA — –100% NA
Oceania 45 22% 0.8 –60% 22 5% –4% 0.7 –63% 412%
Asia-Pacific 468 102% 37.0 107% 218 74% –13% 21.7 113% 41%
Global IPO Trends: Q2 2017 | Page 34**Data based on domicile of the exchange, regardless of the listed company domicile. Euronext includes Euronext (Amsterdam, Paris, Brussels and Lisbon); Shenzhen (SZSE) includes the Main Board, SME Board and ChiNext.
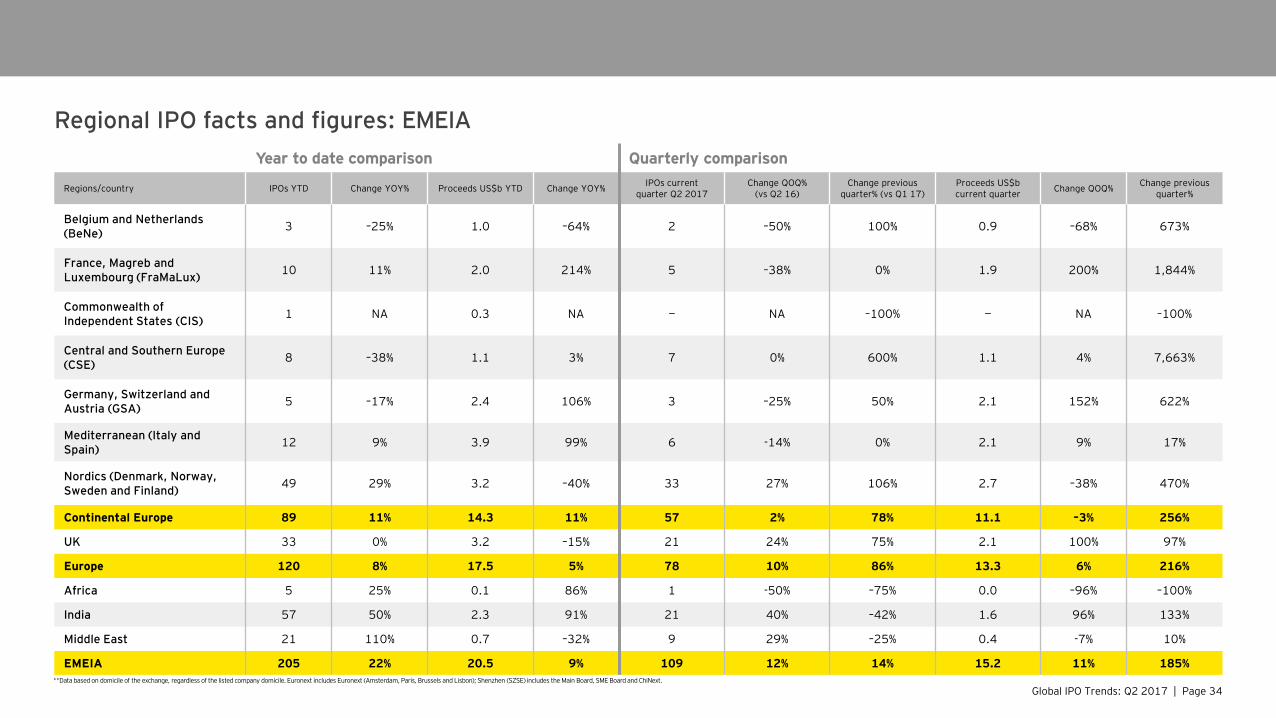
Regional IPO facts and figures: EMEIAYear to date comparison Quarterly comparison
Regions/country IPOs YTD Change YOY% Proceeds US$b YTD Change YOY% IPOs currentquarter Q2 2017
Change QOQ% (vs Q2 16)
Change previous quarter% (vs Q1 17)
Proceeds US$bcurrent quarter Change QOQ% Change previous
quarter%
Belgium and Netherlands (BeNe) 3 –25% 1.0 –64% 2 –50% 100% 0.9 –68% 673%
France, Magreb and Luxembourg (FraMaLux) 10 11% 2.0 214% 5 –38% 0% 1.9 200% 1,844%
Commonwealth of Independent States (CIS) 1 NA 0.3 NA — NA –100% — NA –100%
Central and Southern Europe (CSE) 8 –38% 1.1 3% 7 0% 600% 1.1 4% 7,663%
Germany, Switzerland and Austria (GSA) 5 –17% 2.4 106% 3 –25% 50% 2.1 152% 622%
Mediterranean (Italy and Spain) 12 9% 3.9 99% 6 -14% 0% 2.1 9% 17%
Nordics (Denmark, Norway, Sweden and Finland) 49 29% 3.2 –40% 33 27% 106% 2.7 –38% 470%
Continental Europe 89 11% 14.3 11% 57 2% 78% 11.1 –3% 256%
UK 33 0% 3.2 –15% 21 24% 75% 2.1 100% 97%
Europe 120 8% 17.5 5% 78 10% 86% 13.3 6% 216%
Africa 5 25% 0.1 86% 1 -50% –75% 0.0 –96% –100%
India 57 50% 2.3 91% 21 40% –42% 1.6 96% 133%
Middle East 21 110% 0.7 –32% 9 29% –25% 0.4 -7% 10%
EMEIA 205 22% 20.5 9% 109 12% 14% 15.2 11% 185%
Global IPO Trends: Q2 2017 | Page 35**Data based on domicile of the exchange, regardless of the listed company domicile. Euronext includes Euronext (Amsterdam, Paris, Brussels and Lisbon); Shenzhen (SZSE) includes the Main Board, SME Board and ChiNext.
Appendix
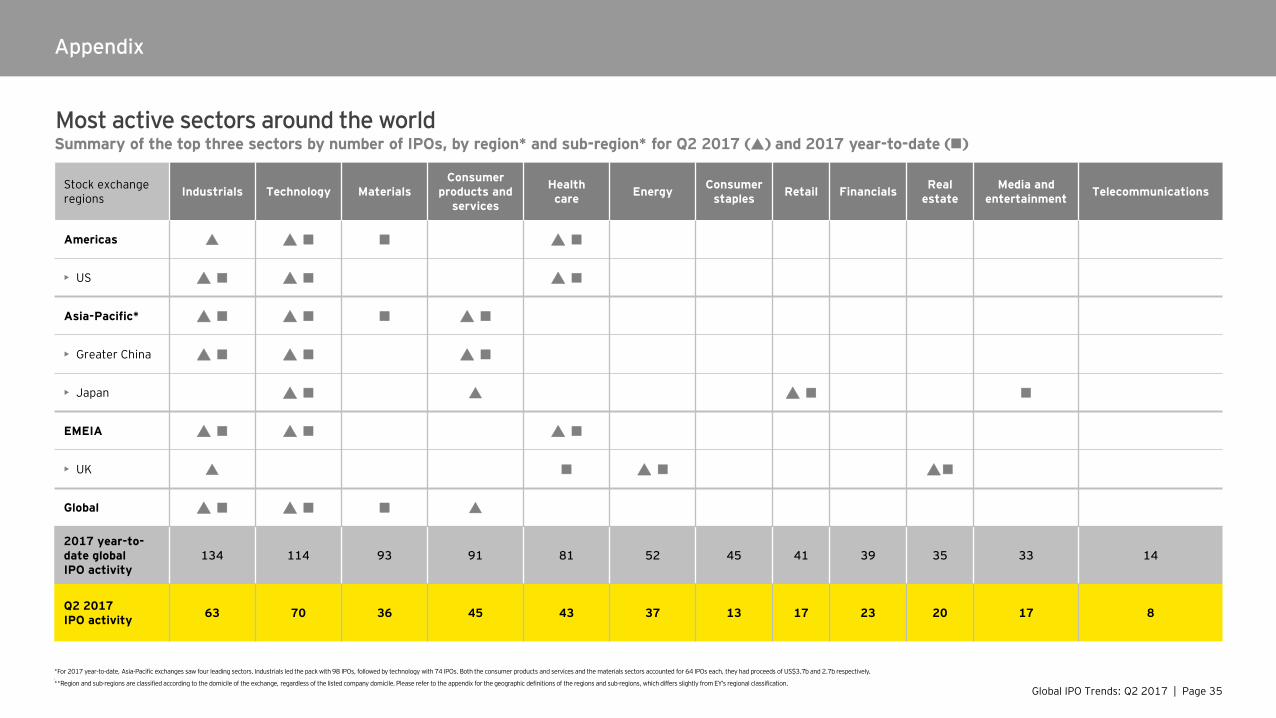
Most active sectors around the worldSummary of the top three sectors by number of IPOs, by region* and sub-region* for Q2 2017 () and 2017 year-to-date ()
Stock exchange regions Industrials Technology Materials
Consumer products and
services
Health care Energy Consumer
staples Retail Financials Real estate
Media and entertainment Telecommunications
Americas
• US
Asia-Pacific*
• Greater China
• Japan
EMEIA
• UK
Global
2017 year-to-date global IPO activity
134 114 93 91 81 52 45 41 39 35 33 14
Q2 2017 IPO activity 63 70 36 45 43 37 13 17 23 20 17 8
*For 2017 year-to-date, Asia-Pacific exchanges saw four leading sectors. Industrials led the pack with 98 IPOs, followed by technology with 74 IPOs. Both the consumer products and services and the materials sectors accounted for 64 IPOs each, they had proceeds of US$3.7b and 2.7b respectively.
**Region and sub-regions are classified according to the domicile of the exchange, regardless of the listed company domicile. Please refer to the appendix for the geographic definitions of the regions and sub-regions, which differs slightly from EY’s regional classification.
Global IPO Trends: Q2 2017 | Page 36
Definitions
Methodology• The data presented in the Global IPO Trends: Q2 2017 report and press release
is from Dealogic and EY. Q2 2017 (i.e., April-June) is based on priced IPOs as of 16 June 2017 and expected IPOs in June. YTD 2017 or H1 2017 (January—June) is based on priced IPOs from 1 January to 16 June 2017 and expected IPOs in June. Data is up to 17 June 2017, 6 a.m. UK time. All data contained in this document is sourced to Dealogic and EY unless otherwise noted.
• For the purposes of these reports and press releases, we focus only on IPOs of operating companies and define an IPO as a company's first offering of equity to the public.
• This report includes only those IPOs for which Dealogic and EY offer data regarding the issue date (the day the offer is priced and allocations are subsequently made), trading date (the date on which the security first trades) and proceeds (funds raised, including any over-allotment sold). Postponed IPOs, or those which have not yet been priced, are therefore excluded. Over-the-counter (OTC) listings are also excluded.
• In an attempt to exclude non-operating company IPOs such as trusts, funds and special purpose acquisition companies (SPACs), companies with the following Standard Industrial Classification (SIC) codes are excluded:• 6091: Financial companies that conduct trust, fiduciary and
custody activities• 6371: Asset management companies such as health and welfare funds,
pension funds and their third-party administration as well as other financial vehicles
• 6722: Companies that are open-end investment funds• 6726: Companies that are other financial vehicles• 6732: Companies that are grant-making foundations• 6733: Asset management companies that deal with trusts, estates and
agency accounts• 6799: Special purpose acquisition companies (SPACs)
• In our analysis, unless stated otherwise, IPOs are attributed to the domicile of the company undertaking an IPO. The primary exchange on which they are listed is as defined by Dealogic and EY research.
• A cross-border (or foreign) listing is where the stock exchange nation of the company is different from the company's domicile (i.e., issuer's nation).
• For IPO listings on HKEx; SSE; SZE; Japan’s Tokyo Stock Exchange (TSE); TSE MOTHERS; Korea's KRX and KOSDAQ; Thailand's SET and MAI; Indonesia IDX; WSE; NewConnect; TSX and TSX-V exchanges, we use their first trading date in place of issue date.
Markets definitions• Many stock exchanges have set up main markets and junior markets:
• Main markets are where medium and large IPOs (by proceeds) are usually listed and traded. Junior markets are where small-cap companies or smaller IPOs are listed or traded. Stock exchanges without junior markets are classified as main markets.
• Junior markets include Americas: Toronto Venture Exchange and Canadian National Stock Exchange; Asia-Pacific: Malaysia ACE Market, Bombay SME, Hong Kong Growth Enterprise Market, Japan JASDAQ, Japan MOTHERS, Korea KOSDAQ, Thailand’s Market for Alternative Investment, National SME, Shenzhen ChiNext, Singapore Catalist, Tokyo Stock Exchange MOTHERS Index; EMEIA: Alternext, London Alternative Investment Market, Germany's Frankfurt SCALE (formerly Entry Standard), Spain's Mercado Alternativo Bursatil, NASDAQ OMX First North, Warsaw New Connect, Johannesburg Alternative Market, Nomu – Parallel Market.
• Emerging markets or rapid-growth markets include issuers from Argentina, Armenia, Bangladesh, Bolivia, Brazil, Bulgaria, Chile, Colombia, Croatia, Cyprus, Egypt, Ethiopia, Greater China, Hungary, India, Indonesia, Ireland, Israel, Kenya, Kuwait, Kazakhstan, Laos, Lithuania, Malaysia, Mauritius, Mexico, Namibia, Pakistan, Peru, Philippines, Poland, Qatar, Russian Federation, Saudi Arabia, Sierra Leone, Singapore, Slovenia, South Africa, South Korea, Sri Lanka, Tanzania, Thailand, Tunisia, Turkey, Ukraine, United Arab Emirates, Vietnam and Zambia.
• Developed markets include issuers from Australia, Austria, Belgium, Bermuda, Canada, Denmark, Finland, France, Germany, Greece, Guernsey, Isle of Man, Italy, Japan, Jersey, Luxembourg, Netherlands, New Zealand, Norway, Portugal, Spain, Sweden, Switzerland, the United Kingdom and the United States.
Geographic definitions• Africa includes Algeria, Botswana, Egypt, Ghana, Kenya, Madagascar, Malawi,
Morocco, Namibia, Rwanda, South Africa, Tanzania, Tunisia, Uganda, Zambia and Zimbabwe.
• Americas includes North America and Argentina, Bermuda, Brazil, Chile, Colombia, Jamaica, Mexico and Peru.
• Asia includes Bangladesh, Greater China, Indonesia, Japan, Laos, Malaysia, Philippines, Singapore, South Korea, Sri Lanka, Thailand and Vietnam.
• Asia-Pacific includes Asia (as stated above) plus Australia, New Zealand, Fiji and Papua New Guinea.
• Central and South America includes Argentina, Bermuda, Brazil, Chile, Colombia, Ecuador, Jamaica, Mexico, Peru and Puerto Rico.
• EMEIA includes Armenia, Austria, Belgium, Bulgaria, Croatia, Cyprus, Czech Republic, Denmark, Estonia, Finland, France, Germany, Greece, Hungary, Iceland, India, Ireland, Isle of Man, Italy, Kazakhstan, Luxembourg, Lithuania, Netherlands, Norway, Pakistan, Poland, Portugal, Russian Federation, Spain, Sweden, Switzerland, Turkey, Ukraine and United Kingdom plus the Middle East and Africa countries listed below.
• Greater China includes Mainland China, Hong Kong, Macau and Taiwan.• Middle East includes Bahrain, Iran, Israel, Jordan, Kuwait, Oman, Qatar,
Saudi Arabia, Syria, United Arab Emirates and Yemen.• North America consists of the United States and Canada.
Glossary• Financial sponsor-backed IPOs refer to IPOs that have private equity,
venture capital investors or both.• First-day average returns is the median of issuers’ offer price versus the
closing price at their first trade date.• Median deal size refers to the median IPO proceeds.• Post-IPO market cap is the market value of the company after its IPO
is completed.• Proceeds refers to total fund raised by the issuer company and selling
shareholders. This is the total deal size.• QOQ refers to quarter-on-quarter. This refers to the comparison of IPO activity
on Q2 2017 with Q2 2016 for this current report.• Share price development since IPO is the median current returns, which is the
year-to-date returns as at 16 June 2017 versus offer price. This should be compared with equity indices performance that is also measured YTD.
• State-owned enterprise (SOE) privatizations refers to former state-owned entities that have completed their IPO listings to become public companies.
• YOY refers to year-on-year. This refers to the comparison of IPO activity for the first six months of 2017 with the first six months of 2016 for this current report.
• YTD stands for year-to-date. This refers to priced IPOs from 1 January to 16 June 2017 plus expected IPOs by end of June.
EY | Assurance | Tax | Transactions | AdvisoryAbout EY EY is a global leader in assurance, tax, transaction and advisory services. The insights and quality services we deliver help build trust and confidence in the capital markets and in economies the world over. We develop outstanding leaders who team to deliver on our promises to all of our stakeholders. In so doing, we play a critical role in building a better working world for our people, for our clients and for our communities.
EY refers to the global organization, and may refer to one or more, of the member firms of Ernst & Young Global Limited, each of which is a separate legal entity. Ernst & Young Global Limited, a UK company limited by guarantee, does not provide services to clients. For more information about our organization, please visit ey.com.
About EY’s Strategic Growth Markets NetworkEY’s worldwide Growth Markets is dedicated to serving the changing needs of high-growth companies. For more than 30 years, we’ve helped many of the world’s most dynamic and ambitious companies grow into market leaders. Whether working with international, mid-cap companies or early stage, venture backed businesses, our professionals draw upon their extensive experience, insight and global resources to help your business accelerate growth. ey.com/acceleratinggrowth
About EY’s Initial Public Offering ServicesEY is a leader in helping companies go public worldwide. With decades of experience, our global network is dedicated to serving market leaders and helping businesses evaluate the pros and cons of an initial public offering (IPO). We demystify the process by offering IPO readiness assessments, IPO preparation, project management and execution services, all of which help prepare you for life in the public spotlight. Our Global IPO Center of Excellence is a virtual hub, which provides access to our IPO knowledge, tools, thought leadership and contacts from around the world in one easy-to-use source.ey.com/ipocenter
© 2017 EYGM Limited. All Rights Reserved.
1706-2338516
EYG no. 03969-173Gbl
ED NoneThis material has been prepared for general information purposes only and is not intended to be relied upon as accounting, tax or other professional advice. Please refer to your advisors for specific advice.
ContactsDr. Martin SteinbachEY Global and EMEIA IPO [email protected]
Jackie KelleyEY Americas IPO Markets [email protected]
Ringo ChoiEY Asia-Pacific IPO [email protected]
Terence HoEY Greater China IPO [email protected]
Shinichiro SuzukiEY Japan IPO [email protected]
Scott McCubbinEY UK and Ireland IPO [email protected]
Find out more about future IPO prospectsFor more information on global IPO performance by quarter and year, and how the IPO market looks set to develop for the next 12 months, visit the EY Global IPO website:ey.com/ipocenter