Embed Size (px)
Citation preview

Copyright © 2017 IQVIA. All rights reserved.
Prepared for CIB
28th February 2018
Patrick Bervelt, Sales Director
Patrick Van Dooren, Services Director
Global, European and
Belgian pharmaceutical
market trends

1
Agenda
Patrick Van Dooren, Principal, Director Commercial & Technology Services IQVIA
Patrick Bervelt, Sales Director, Sales, BEL & LUX, IQVIA
Global and European pharmaceutical market trends
Belgian pharmaceutical market trends

2© IQVIA 2017. All rights reserved.

3© IQVIA 2017. All rights reserved.

4© IQVIA 2017. All rights reserved.

5© IQVIA 2017. All rights reserved.
6© IQVIA 2017. All rights reserved.

Table of
Contents
7
+ Global and European pharmaceutical market trends
+ Belgian pharmaceutical market trends

Global and European pharmaceutical market trends

9
1.072 1.109
1.135 1.166
1.221
1.287
1.361
0%
2%
4%
6%
8%
10%
12%
14%
0
200
400
600
800
1.000
1.200
1.400
2015 (a) 2016 (a) 2017 (f) 2018 (f) 2019 (f) 2020 (f) 2021 (f)
An
nu
al g
row
th
Sa
les (
$U
S b
n)
Global sales Global growth US growth Europe growth
IQVIA Health Market Prognosis Q3 2017
Global sales are expected to return to more vigorous growth led by the US market
+4.2%
Forecasted annual
growth 2016-2021
+4.4%
+3.6%

10IQVIA Health Market Prognosis Q3 2017
In Europe, Belgium market growth is expected to trail that of the rest of the region
+3.6%
Forecasted annual
growth 2016-2021
+2.4%
214 224
232 241
249 258
267
0%
2%
4%
6%
8%
10%
0
50
100
150
200
250
300
2015 (a) 2016 (a) 2017 (f) 2018 (f) 2019 (f) 2020 (f) 2021 (f)
An
nu
al g
row
th
Sa
les (
US
$ b
n)
Europe sales Europe growth Belgium growth

11IQVIA Health Market Prognosis Q3 2017
Globally, the greatest contribution to sales will come from North America but emerging markets play a significant role
Contribution to Global Sales by Region
(2016-2021)
+4.4% +3.5% +8.2% +3.7% +5.5% +4.1% -0.1%

12
Developed and pharmerging markets CAGR 2016-2021
US 4.4%
EU5 2.8%
Germany 3.4%
France 1.8%
Italy 3.0%
Spain 2.4%
UK 3.9%
China 6.3%
Brazil 6.9%
Russia 8.2%
India 9.2%
Developed 3.4%
At par with region CAGR
Lower than region CAGR
Higher than region CAGR
Pharmerging 7.0%
Developed Markets
CAGR 2016-2021Pharmerging Markets
CAGR 2016-2021
IQVIA Health Market Prognosis Q3 2017
Belgium 2.4%
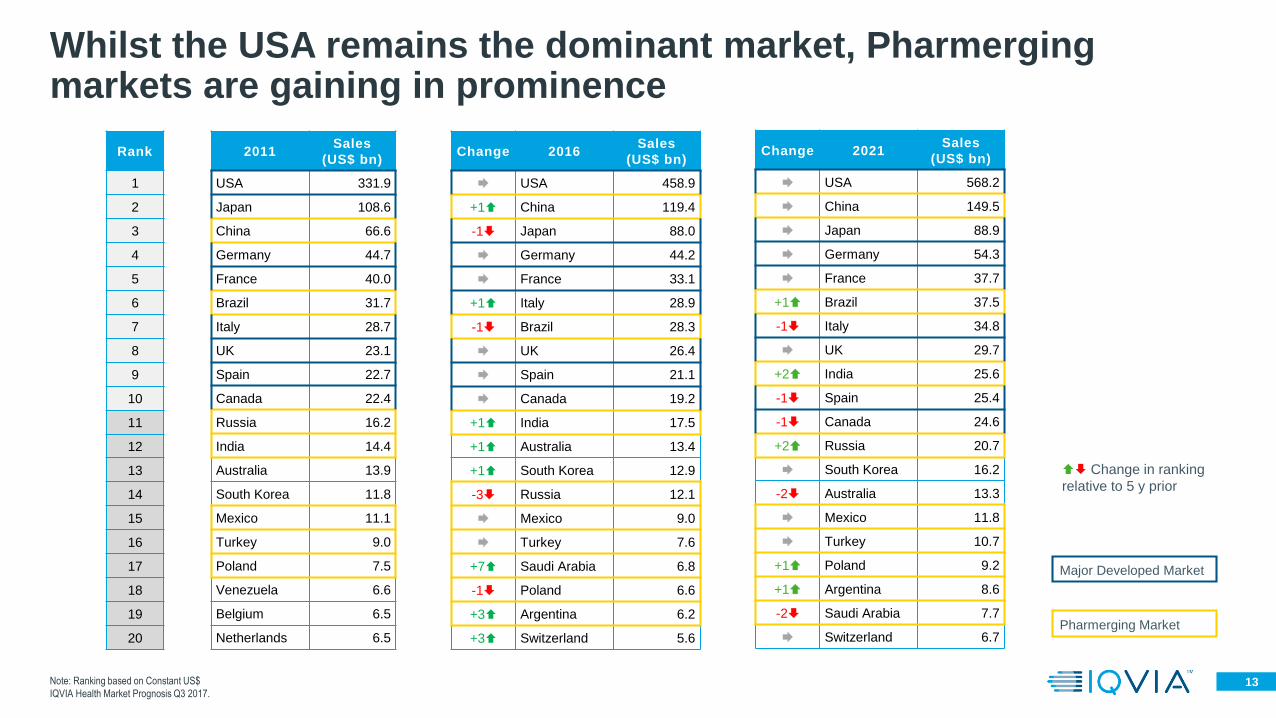
13Note: Ranking based on Constant US$
IQVIA Health Market Prognosis Q3 2017.
Whilst the USA remains the dominant market, Pharmerging markets are gaining in prominence
Rank
1
2
3
4
5
6
7
8
9
10
11
12
13
14
15
16
17
18
19
20
2011Sales
(US$ bn)
USA 331.9
Japan 108.6
China 66.6
Germany 44.7
France 40.0
Brazil 31.7
Italy 28.7
UK 23.1
Spain 22.7
Canada 22.4
Russia 16.2
India 14.4
Australia 13.9
South Korea 11.8
Mexico 11.1
Turkey 9.0
Poland 7.5
Venezuela 6.6
Belgium 6.5
Netherlands 6.5
Change 2021Sales
(US$ bn)
USA 568.2
China 149.5
Japan 88.9
Germany 54.3
France 37.7
+1 Brazil 37.5
-1 Italy 34.8
UK 29.7
+2 India 25.6
-1 Spain 25.4
-1 Canada 24.6
+2 Russia 20.7
South Korea 16.2
-2 Australia 13.3
Mexico 11.8
Turkey 10.7
+1 Poland 9.2
+1 Argentina 8.6
-2 Saudi Arabia 7.7
Switzerland 6.7
Change 2016Sales
(US$ bn)
USA 458.9
+1 China 119.4
-1 Japan 88.0
Germany 44.2
France 33.1
+1 Italy 28.9
-1 Brazil 28.3
UK 26.4
Spain 21.1
Canada 19.2
+1 India 17.5
+1 Australia 13.4
+1 South Korea 12.9
-3 Russia 12.1
Mexico 9.0
Turkey 7.6
+7 Saudi Arabia 6.8
-1 Poland 6.6
+3 Argentina 6.2
+3 Switzerland 5.6
Major Developed Market
Pharmerging Market
Change in ranking
relative to 5 y prior

14
Pharmerging market growth is fueled by spending on products other than the original from the inventors or marketers of a medicine
69%
14%
12%
5%
Developed MarketsSpending 2021
22%
42%
14%
22%
Pharmerging MarketsSpending 2021
3-6%Original Brands
Non-Original Brands
Unbranded
Other Products
13-16%
1-4%
0-3%
4-7%Original Brands
Non-Original Brands
Unbranded
Other Products
7-10%
8-11%
5-8%
Forecasted annual growth
2016-2021
Forecasted annual growth
2016-2021
IQVIA Global Outlook 2021

15
By 2021, these are projected to make up close to half of medicine spending
Specialty medicines have come to account for a third of medicine spending globally
Source: IQVIA MIDAS
77% 67%
23%
33%
2012 2017
US
$ (
Bn
)
Global Sales (MNF US$ (Bn); MAT11/2012-11/2017)
Traditional Specialty
$921bn
$1,361bn
+0.9%
CAGR
+11.1%
CAGR
16
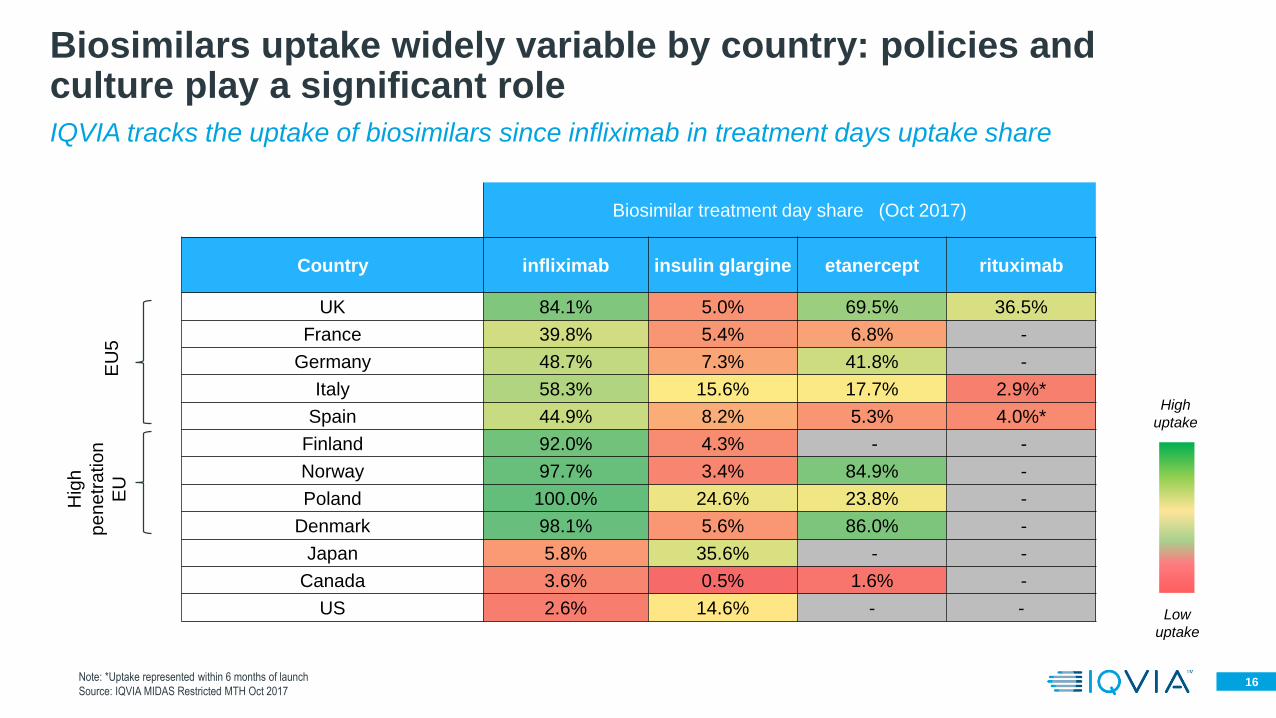
IQVIA tracks the uptake of biosimilars since infliximab in treatment days uptake share
Biosimilars uptake widely variable by country: policies and culture play a significant role
EU
5
Hig
h
pe
ne
tra
tio
n
EU
High
uptake
Low
uptake
Biosimilar treatment day share (Oct 2017)
Country infliximab insulin glargine etanercept rituximab
UK 84.1% 5.0% 69.5% 36.5%
France 39.8% 5.4% 6.8% -
Germany 48.7% 7.3% 41.8% -
Italy 58.3% 15.6% 17.7% 2.9%*
Spain 44.9% 8.2% 5.3% 4.0%*
Finland 92.0% 4.3% - -
Norway 97.7% 3.4% 84.9% -
Poland 100.0% 24.6% 23.8% -
Denmark 98.1% 5.6% 86.0% -
Japan 5.8% 35.6% - -
Canada 3.6% 0.5% 1.6% -
US 2.6% 14.6% - -
Note: *Uptake represented within 6 months of launch
Source: IQVIA MIDAS Restricted MTH Oct 2017

17
$22bn
$24bn
$25bn
$27bn
$28bn
$30bn
$34bn
$37bn
$38bn
$43bn
$46bn
$64bn
$69bn
$92bn
$103bn
Lipid regulators
Viral hepatitis
Other cardiovasculars
Nervous system disorders
Multiple sclerosis
Antivirals
Mental Health
Anticoagulants
Antibacterials
Antihypertensives
Respiratory Agents
Pain
Autoimmune Diseases
Antidiabetics
Oncologics
Source: IQVIA MIDAS
By therapy area, oncology and antidiabetics products dominate the global market
Top 15 Therapy area ranked by sales
(Global sales, $US bn MAT 11/2017) 5 year CAGR
-9%
27%
2%
5%
13%
9%
-6%
6%
-2%
-6%
2%
1%
18%
11%
9%

18IQVIA Market Analytics and ReSearch
The current drug pipeline reflects this emphasis on oncology
336
262281
158 18959 144 102 110 84
0
2000
4000
6000
8000
10000
Num
be
r o
f M
ole
cu
les in D
eve
lop
me
nt
Top 10 Therapy Areas by Molecule Count
Discovery Clinical Phase 1 Clinical Phase 2 Clinical Phase 3 Clinical

19
Budget caps and pharma
payback schemes
Portugal and Italy reviewing payback
mechanisms for budget overspend
French HCV spending cap
UK PPRS scheme
Increasing emphasis on drug cost-
value
NHS England Cancer Drugs Fund being
included under NICE QALY assessment
NICE QALY threshold being reviewed
French and Italian MoH reviewing current drug
reimbursement systems
Post launch payer led RWE scrutiny
France NOAC re-assessment based in part on
own RWE
Italy and France Avastin reimbursement for
use in AMD
Infliximab switching NOR-SWITCH
Recent changes in spending control mechanisms in Europe
Price negotiation collaboration and net price
transparency
Netherlands and Belgium announced pilot collaborative
Price negotiation for orphan drugs
Greek and Portuguese health ministers call
for increasing payer collaboratives
Controlling
costs
IQVIA Global outlook 2021

Belgian pharmaceutical market trends

21
Recent measures impacting the Belgium market
2015 - Signature of the Pact of the Future
2016 - Agreement to boost uptake of biosimilars
- Introduction of patent cliff system for
medicines in cat A, B, C, Cs,and Cx
- Reduction of the security margine
- Application of patent cliff
- Implementation of the “180 + 1” measure
- Variable Care
- Hospital Networks
- BeNeLuxA – inititaitive to facilitate
information sharing and streamline Health
Technology Assessments
2017
…
Source: Market Prognosis 2016-2021 Belgium, Pharma.be, EMA, Pharmaexec.com

22Source: IQVIA MIDAS
The hospital channel has made the strongest contribution to Belgian pharmaceutical market growth
Total Pharmaceutical Market €5.056m
Total Pharmaceutical market – Belgium
(MNF Euro value; MAT November 2017)
Delta Absolute growth €306m 1yr growth+6.5% 5yr CAGR 2.3%
Hospital €1.951m
Retail €3.106m
+€271m abs value
16.1% 1y growth
7.6% 5y CAGR
+€37m abs value
1.2% 1y growth
-0.3% 5y CAGR
39%
61%
Rx sales €2.642m
1.3% 1y growth
Non Rx €463m
0.4% 1y growth
85%15%
23
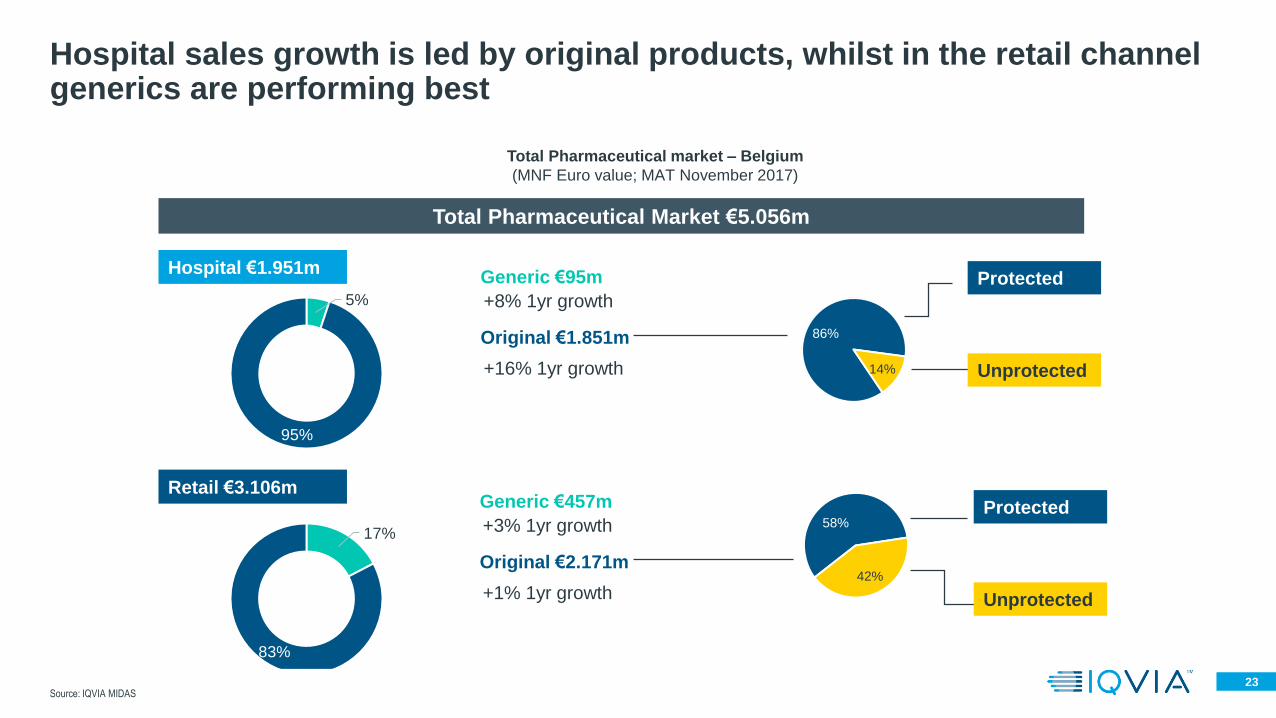
Hospital sales growth is led by original products, whilst in the retail channel generics are performing best
Total Pharmaceutical Market €5.056m
Total Pharmaceutical market – Belgium
(MNF Euro value; MAT November 2017)
Hospital €1.951m
Retail €3.106m
Generic €95m5%
95%
Original €1.851m
+8% 1yr growth
+16% 1yr growth
17%
83%
Generic €457m
Original €2.171m
+3% 1yr growth
+1% 1yr growth
86%
14%
58%
42%
Protected
Unprotected
Protected
Unprotected
Source: IQVIA MIDAS

24
302,108
206,346
168,351
140,267
137,739
67,609
52,633
51,377
51,027
35,621
Immunosuppressants (L04)
Antithrombotics (B01)
Antihistamines and COPD products(R03)
Antidiabetics (A10)
Systematic antivirals (J05)
Urologicals (G04)
Antiinflammatory and antirheumaticproducts (M01)
Antiepileptics (N03)
Vaccines (J07)
Endocrine therapy (L02)
167,919
157,049
146,632
123,995
98,973
98,810
98,021
76,749
59,786
53,505
Psycholeptics (N05)
Lipid modifying agents (C10)
Analgesics (N02)
Renin-Angiotensin agents (C09)
Other nervous system drugs(N07)
Drugs for acid-related disorders(A02)
Psychoanaleptics (N06)
Sex hormones and modulators ofthe genital system (G03)
Systematic antibacterals (J01)
Cough medications (R05)
Top 10 ATC2 classes in values with growing and declining – Retail
(MNF Euro Value (thousands); MAT November 2017)
In retail, immunotherapy and haematology are the best performing categories, whilst angiotensin products have seen the greatest decline
+11,5%
+10,8%
+2,4%
+4,9%
+6,0%
+1,4%
+5,0%
+5,4%
+4,3%
+6,5%
-0,2%
-3,5%
-1,8%
-9,5%
-0,6%
-8,9%
-3,7%
-0,7%
-3,0%
-1,2%
Retail
Source: IQVIA Retail Audit

25
Top 20 companies performances and growth – Retail
(MNF Euro Value (thousands) ; MAT December 2017)
The top 20 companies account for 66% of the market share and display variable performances over the last year
217,638
177,794
138,494
129,142
125,178
122,612
122,058
119,120
108,263
106,863
104,746
94,793
70,441
68,382
62,253
61,450
56,383
48,138
47,362
46,928
EUROGENERICS
PFIZER
ASTRAZENECA
ABBVIE
NOVARTIS PHARMA
GLAXOSMITHKL.PHARM
MSD BELGIUM
SANDOZ
BAYER PHARMACEUTIC
BRISTOL-M. SQUIBB
SANOFI BELGIUM
JANSSEN-CILAG
BOEHRINGER INGEL.
TAKEDA BELGIUM
GILEAD SCIENCES
TEVA PHARM.BELGIUM
J&J CONS.
VIIV HEALTHCARE
NOVO-NORDISK
LILLY
Source: IQVIA Retail Audit
+2
-3
-1
+5
+1
+1
-1
+1
-1
+1
-1
+1
-1
+1
3,2%
-1,6%
12,7%
2,9%
-5,7%
9,4%
-19,6%
3,2%
4,0%
1,1%
9,7%
-6,1%
7,4%
-3,3%
3,6%
-0,5%
7,9%
-7,5%
-4,5%
-0,5%
Retail

26
Together, the top 10 retail companies are declining while smallercompanies are doing relatively better
17%26%
44%
66%
78%
91%99%
0%
10%
20%
30%
40%
50%
60%
70%
80%
90%
100%
Top 3 Top 5 Top 10 Top 20 Top 30 Top 50 Top 100
-4%
-2%
-0,1%
-0,1%
0,2%
-0,1%
0.2%
Top manufacturers ranking according to revenues – Retail
(in Mio absolute sales and sales growth in MNF Value; MAT December 2017)
Source: IQVIA Retail Audit
Retail

27
Top 10 ATC2 classes in values with growing and declining – Hospital
(MNF Euro Value (thousands); MAT November 2017)
On the hospital market, Antineoplastic drugs lead in sales and growth, adding €138m additional sales for the period
580,166
186,538
107,430
85,710
73,844
71,579
70,168
64,566
63,913
61,488
Antineoplastic agents (L01)
Immunosuppressants (L04)
Systematic antivirals (J05)
Antihemorrhagics (B02)
Ophthalmologicals (S01)
Immunoglobulins (J06)
Antianemics (B03)
Other nervous system drugs (N07)
Imaging diagnostics (T01)
Systematic antibacterials (J01)
+31,3%
+8,7%
+10,4%
+8,2%
+1,7%
+28,9%
+18,9%
+22,9%
+5,9%
+10,1%
34,187
20,932
18,187
17,542
14,822
11,807
11,329
9,034
8,252
8,130
Immunostimulants (L03)
Systematic antimycotics (J02)
Analgesics (N02)
Psycholeptics (N05)
Antiinflammatory andantirheumatic products (M01)
Bone disease drugs (M05)
Antiparkinson drugs (N04)
Antiemetics and antinauseants(A04)
Systematic corticosteroids (H02)
Pituitary and hypothalamichormones and analogues (H01)
-9,6%
-3,8%
-11,2%
-2,5%
-5,3%
-3,4%
-5,0%
-3,1%
-7,4%
-14,2%
Source: IQVIA Hospital Audit
Hospital

28
• Top 20 hospital companies sales and growth
(MNF Euro Values (thousands) ; MAT December 2017)
Source: IQVIA Hospital Audit
The leaders on the hospital market remain consistent compared to last period
25,560
26,775
27,385
29,006
36,203
41,951
42,212
46,899
48,394
55,291
57,709
64,003
71,429
82,850
87,742
102,494
130,372
132,254
150,529
203,359
SHIRE
ASTRAZENECA
NOVO-NORDISK
PFIZER PFE BELGIUM
ASTELLAS
CSL BEHRING
BAXTER
ABBVIE
TAKEDA BELGIUM
FRESENIUS KABI
BAYER PHARMACEUTICALS
GILEAD SCIENCES
SANOFI BELGIUM
CELGENE
AMGEN
JANSSEN-CILAG
MSD BELGIUM
BMS
NOVARTIS PHARMA
ROCHE 1%
12%
21%
136%
14%
7%
19%
3%
35%
22%
7%
52%
-15%
7%
-0,4%
11%
30%
61%
22%
9%
+5
-1
+5
+2
-2
+3
-1
-1
-1
+2
-2
Hospital
-1
-1
+1
+4
-3

29
For 15 out of the 20 top manufacturers serving hospitals, more than 80% of the total sales are made in 2 categories only
0% 10% 20% 30% 40% 50% 60% 70% 80% 90% 100%
SHIRE PHARMACEUT.
ASTRAZENECA
NOVO-NORDISK
PFIZER PFE BELGIUM
ASTELLAS
CSL BEHRING
BAXTER
ABBVIE
TAKEDA BELGIUM
FRESENIUS KABI
BAYER PHARMACEUTICALS
GILEAD SCIENCES
SANOFI BELGIUM
CELGENE
AMGEN
JANSSEN-CILAG
MSD BELGIUM
BRISTOL-M. SQUIBB
NOVARTIS PHARMA
ROCHE
ATC Share for Top 20 Manufacturers(by MNF Euro Values; MAT December 2017)
Antineoplastic & Immuno Anti-infectives Haemato Digestive & Metabolic Nervous Syst. Hospital Solutions Others
Hospital
Source: IQVIA Hospital Audit

30
For 12 out of the 20 top manufacturers serving hospitals, around 80% of the total sales are made in 1 category only
0% 10% 20% 30% 40% 50% 60% 70% 80% 90% 100%
SHIRE PHARMACEUT.
ASTRAZENECA
NOVO-NORDISK
PFIZER PFE BELGIUM
ASTELLAS
CSL BEHRING
BAXTER
ABBVIE
TAKEDA BELGIUM
FRESENIUS KABI
BAYER PHARMACEUTICALS
GILEAD SCIENCES
SANOFI BELGIUM
CELGENE
AMGEN
JANSSEN-CILAG
MSD BELGIUM
BRISTOL-M. SQUIBB
NOVARTIS PHARMA
ROCHE
ATC Share for Top 20 Manufacturers(by MNF Euro Values; MAT December 2017)
Antineoplastic & Immuno Anti-infectives Haemato Digestive & Metabolic Nervous Syst. Hospital Solutions Others
Hospital
Source: IQVIA Hospital Audit

31
For 12 out of the 20 top manufacturers serving hospitals, around 80% of the total sales are made in 1 category only
0% 10% 20% 30% 40% 50% 60% 70% 80% 90% 100%
SHIRE PHARMACEUT.
ASTRAZENECA
NOVO-NORDISK
PFIZER PFE BELGIUM
ASTELLAS
CSL BEHRING
BAXTER
ABBVIE
TAKEDA BELGIUM
FRESENIUS KABI
BAYER PHARMACEUTICALS
GILEAD SCIENCES
SANOFI BELGIUM
CELGENE
AMGEN
JANSSEN-CILAG
MSD BELGIUM
BRISTOL-M. SQUIBB
NOVARTIS PHARMA
ROCHE
ATC Share for Top 20 Manufacturers(by MNF Euro Values; MAT December 2017)
Antineoplastic & Immuno Anti-infectives Haemato Digestive & Metabolic Nervous Syst. Hospital Solutions Others
Hospital
Source: IQVIA Hospital Audit

32Source: IQVIA Xponent
General practitioners remain the main player on the market but specialists contributed more to growth
60% 59%
40%41%
0
500
1.000
1.500
2.000
2.500
3.000
3.500
MAT December 2016 MAT December 2017
Rx S
ale
s (
€m
)
Primary and Secondary Care Evolution
(MNF Euro; MAT December 2016 and 2017)
General Practitioners Specialists
43% 43%
57%57%
0
500
1.000
1.500
2.000
2.500
3.000
3.500
MAT December 2016 MAT December 2017
Rx S
ale
s (
€m
)
Geographic Distribution of Sales
(MNF Euro; MAT December 2016 and 2017)
South North
Retail

33
607
338
249186
13899
6333 9 1
35%
20%
14%
11%8%
6%4%
2%0,05% 0%
0%
5%
10%
15%
20%
25%
30%
35%
40%
45%
50%
0
100
200
300
400
500
600
700
D1 D2 D3 D4 D5 D6 D7 D8 D9 D10
Ma
rket sh
are
Pre
scrip
tio
n v
alu
e (
mill
ion
s)
Amongst the General Practitioners, 4,305 of them are responsiblefor almost 70% of the market share
Decile analysis
(Active GPs and Occupational GP prescription value (millions) ; MAT December 2017)
14,358 Physicians
Prescription
Source: IQVIA Xponent

34
607
338
249186
13899
6333 9 10
100
200
300
400
500
600
700
D1 D2 D3 D4 D5 D6 D7 D8 D9 D10
Pre
scrip
tio
n v
alu
e (
mill
ion
s)
Amongst the General Practitioners, 4,305 of them are responsiblefor almost 70% of the market share
Decile analysis
(Active GPs and Occupational GP prescription value (millions) ; MAT December 2017)
14,358 Physicians
Prescription
Source: IQVIA Xponent

35Source: IQVIA Xponent
607
338
249186
13899
6333 9 1
35%
20%
14%
11%8%
6%4%
2%0,05% 0%
0%
5%
10%
15%
20%
25%
30%
35%
40%
45%
50%
0
100
200
300
400
500
600
700
D1 D2 D3 D4 D5 D6 D7 D8 D9 D10
Ma
rket sh
are
Pre
scrip
tio
n v
alu
e (
mill
ion
s)
Amongst the General Practitioners, 4,305 of them are responsiblefor almost 70% of the market share
Decile analysis
(Active GPs and Occupational GP prescription value (millions) ; MAT December 2017)
14,358 Physicians
Prescription
423 236 173 130 96 69 44 23 7 1AVERAGE prescription
value per doctor per year (in
thousands euro)

36
In the future, the pressure of visits from patients on the younger generationof GPs will increase
Source: IQVIA Doctor Universe 2018
11%
8%
7%
9% 9%10%
18%
17%
8%
26-30 31-35 36-40 41-45 46-50 51-55 56-60 61-65 66-70
% A
ctive
GP
s p
er
age
ra
nge
Age range
Active GPs age range profile53%

37Source: IQVIA Consumer Health Services
The Consumer Health market grew by 1.5% in the past year, driven by the performance of the patient care category
Total Consumer Health Market €1,973m
Consumer Health market – Belgium
(PUB Euro value; MAT December 2017)
Delta Absolute growth €29m 1yr growth (+1.5%) 5yr growth (+1.9%)
OTC €1,327m
PEC €353m
PAC + NTR €293m
0.8% 1y growth
1.5% 5y CAGR
0.3% 1y growth
2.9% 5y CAGR
6.1% 1y growth
2.7% 5y CAGR
67%
18%
15%
Registered €817m
-0.9% 1y growth
70% free sales 30% Rx sales
Non registered €510m
+3.7% 1y growth
83% free sales 17% Rx sales
Consumer
HealthConsumer Health

38Source: IQVIA Consumer Health Services
Most of the biggest Consumer Health classes are OTC but are experiencing mixed performances
269
242
192
187
118
88
87
81
62
62
02 PAIN RELIEF
01 COUGH COLD/OTH RESP REMS
04 VIT/MINERALS/NUTRIT.SUPPL
03 DIGESTIVE/OTH INTEST REMS
82 BEAUTY PRODUCT FOR WOMEN
06 SKIN TREATMENT
10 CIRCULATORY PRODUCTS
83 UNISEX BEAUTY PRODUCTS
35 BABY FOODS
07 EYE CARE
Top 10 Consumer Health Classes
(PUB Euro (millions); MAT December 2018)
-1%
-2%
2%
4%
-1%
-2%
-3%
2%
3%
1%
Growth vs
MAT/12/2017
Consumer Health

39Source: IQVIA Consumer Health Services
Johnson & Johnson retains its leadership in Belgium Consumer Health but the top 10 have overall seen negative performance
-1%
7%
3%
13%
0%
5%
3%
6%
-1%
-3%
-2%
4%
-3%
-7%
-5%
-6%
-4%
-3%
-4%
1%
Growth since last MAT
Market growth
1.5%0 10 20 30 40 50 60 70 80 90 100
VICHY
NESTLE BELGILUX
LOUIS WIDMER
METAGENICS
QUALIPHAR
LA ROCHE POSAY
EUROGENERICS
TILMAN
NUTRICIA
MELISANA
MEDA PHARMA
SMB LABORATOIRE
MERCK CONS.HLTH
TAKEDA BELGIUM
RECKITT BENCKISER
SANOFI CHC
BRISTOL-M. SQUIBB
OMEGA PHARMA
GLAXOSMITHKL.CHLT
J&J CONS.
€m
Top 20 Consumer Health Companies Ranked by Sales(PUB Prices €m, MAT December 2017)
OTC PEC NTR PAC
90.0
80.6
71.2
67.9
64.8
59.1
59.0
56.2
47.2
47.2
45.4
44.0
38.5
38.5
38.3
38.2
33.7
30.6
29.2
27.0
-1
+1
+2
-1
-1
+3
-3
-1
+1
Consumer Health

40Source: IQVIA Consumer Health Services
Market growth is principally coming from smaller players
-1.8%
-3.0%
-3.0%
-1.0%
-0.5%
+0.4%
+0.9%
+1.5%
0%
10%
20%
30%
40%
50%
60%
70%
80%
90%
100%
Top 3 (>€70m) Top 5 (>€60m) Top 10 (>€45m) Top 20 (>€25m) Top 30 (>€15m) Top 50 (>€9m) Top 100 (>€3.75m) All (1147)
Co
ntr
ibu
tio
n t
o t
ota
l mar
ket
Top manufacturers ranking according to Consumer Health revenues(PUB value; MAT December 2017)
Consumer Health


![VESA Holes 4 - M8 116 - LG Electronics · 2020. 1. 30. · [75xs2e dimension] - applied model: 75xs2e - unit: mm 116 11.8 11.8 11.8 11.8 1675.2 953.6 600 400 vesa holes 4 - m8 600](https://img.pdfslide.us/doc/110x75/60afd7d1a1ba645bf236e933/vesa-holes-4-m8-116-lg-electronics-2020-1-30-75xs2e-dimension-applied.jpg)