Embed Size (px)
Citation preview
Important disclosures appear at the end of this document.
Global EconomicsPaper No. 68
Evaluating Monetary Policy in Euroland and the United States
� For Euroland, Taylor Rule Works Best
� But It Fails for the US Due to Structural Change and the Importance of Equities
� Goldman Sachs Financial Conditions Index Is the Preferred Tool for the US
� Both Measures Imply Monetary Policy Stability in 2002 and Tighter Policy in 2003
William Dudley
Jan Hatzius Thomas Mayer
David Walton
February 22, 2002
Goldman, Sachs & Co. Global Economics Research Paper No. 68
Evaluating Monetary Policy in Euroland and the United States February 22, 2002
In New York +1(212) 902 6807 In London +44 20 7774 1160
William Dudley, M.D. & Chief US Economist Jim O’Neill, M.D. & Head of Global Economic Research
Paulo Leme, M.D. & Director of Emerging Markets Economic Research David Walton, M.D. & Chief European Economist
Alberto Ades, M.D. & Director of Emerging Markets Bond & Currency Research Andrew Bevan, M.D. & Director of International Bond Economic Research
Jan Hatzius, V.P. & Senior Economist Erik Nielsen, Director of New European Markets Economic Research
Edward McKelvey, V.P. & Senior Economist Ben Broadbent, E.D. & Senior European Economist
John Youngdahl, V.P. & Senior Economist Kevin Edgeley, E.D. & Senior Technical Analyst
Federico Kaune, V.P. & Senior Economist Stephen Potter, E.D. & Senior Global Economist
Marcel Kasumovich, V.P. & International Economist Fabio Scacciavillani, E.D. & Senior European Economist
Rumi Masih, V.P. & International Economist Al Breach, E.D. & International Economist
Daniel Tenengauzer, V.P. & International Economist Linda Britten, E.D. & Global Economics Mgr, Support & Systems
Jesús Viejo, V.P. & International Economist Michael Buchanan, E.D. & International Economist
Demian Reidel, V.P. & Emerging Markets Debt Strategist (FI Research) Francesco Garzarelli, E.D. & International Economist
Melisse Dornier, V.P. & US Economics Mgr, Admin & Support Stephen Hull, E.D. & International Economist
Pablo Morra, Associate Economist Philippa Knight, E.D. & European Economics Mgr, Admin & Support
Richard Crump, Research Assistant Sandra Lawson, E.D. & International Economist
Lesya Karpa, Research Assistant Binit Patel, E.D. & International Economist
Humberto Medina, Research Assistant Javier Pérez de Azpillaga, E.D. & European Economist
Malachy Meechan, Research Assistant Carlos Teixeira, E.D. & International Economist
Jens J Nordvig-Rasmussen, Associate Economist
In Toronto +1(416) 343 8793 Thomas Stolper, Associate Economist
Mark Chandler, V.P. & Senior Economist Kevin Daly, Research Assistant
Jason Daw, Research Assistant Fiona Lake, Research Assistant
Ines Lopes, Research Assistant
In Hong Kong +852 2978 1941 Victoria Malpass, Research Assistant
Sun Bae Kim, M.D. & Director of Asia Pacific Economic Research Roopa Purushothaman, Research Assistant
Fred Hu, M.D. & Head of Greater China Economics & Strategy AnnMarie Terry, Research Assistant
John Anderson, V.P. & Senior International Economist
Dominic Wilson, V.P. & International Economist
Dick Li, Associate Economist In Paris +33(1) 4212 1343
Enoch Fung, Research Assistant Nicolas Sobczak, E.D. & Senior European Economist
Rita Ng, Research Assistant
In Tokyo +81(3) 3589 8911 In Frankfurt +49(69) 7532 1200
Tetsufumi Yamakawa, M.D. & Director of Japan Economic Research Thomas Mayer, M.D. & Director of Euroland Economic Research
Takuji Okubo, V.P. & International Economist Eva Frede, Research Assistant
Yuriko Tanaka, V.P. & Associate Economist Dirk Schumacher, Research Assistant
Tomohiro Ohta, Associate Economist
Ayako Sano, Research Assistant
In Singapore +65 228 8478
Adam Le Mesurier, V.P. & Senior International Economist
Goldman Sachs Research personnel may be contacted by electronic mail through the Internet at [email protected]
Goldman Sachs Economic Research Group
Goldman, Sachs & Co. Global Economics Research Paper No. 68
1 Evaluating Monetary Policy in Euroland and the United States
February 22, 2002
Summary
1. In Euroland, we use a Taylor Rule framework (a formula for calculating the short-term rate set by a central bank) to predict the behavior of the European Central Bank (ECB). Although the ECB’s track record is still short, our Euroland Taylor Rule has done a good job predicting shifts in official rates.
2. Our Euroland Taylor Rule currently indicates that official rates are unlikely to change this year. However,
in 2003, a gradual increase towards a cyclically neutral rate of 3¾% appears likely. 3. The main risk to this view is that the ECB could cut rates again this spring. This could take place if the
ECB were to place a higher weight on the output gap and less weight on headline inflation. If this were to occur, we would anticipate that the small cut would be reversed later this year.
4. For the United States, we have not been able to develop a Taylor Rule that does a good job predicting the
Federal Open Market Committee’s behavior. This reflects three important differences from Europe: (1) The US economy has been less stable structurally; (2) the transmission of monetary policy to the real economy is more affected by developments in financial markets in the United States; and (3) Federal Reserve officials respond to the economic environment in a more anticipatory and preemptive manner.
5. As a result, we have deemphasized the use of an explicit monetary policy reaction function in the United
States. Instead, we have developed a financial conditions framework to assess the impact of monetary policy on the real economy. From changes in financial conditions, we then infer likely shifts in US monetary policy.
6. This decision has stood us in good stead. The Goldman Sachs Financial Conditions Index (GSFCI) did not
shift sharply to a more accommodative stance in 2001, despite 475 basis points of easing by the FOMC. In 2001, this made us more pessimistic about the growth outlook and caused us to anticipate much more monetary easing than implied by a Taylor Rule.
7. The fact that the GSFCI has only eased slightly over the past year is an important reason why we anticipate
only a moderate economic recovery in 2002. Our GSFCI framework strongly suggests that the FOMC will not tighten monetary policy until 2003.
8. The main risk to our view is a surprise from the US equity market. If the equity market were to rise
sharply, then financial conditions would become more accommodative. This would tend to boost economic activity and could lead to an earlier tightening of monetary policy. Conversely, a further sharp decline in equity prices would tighten financial conditions and could open the door for further easing of monetary policy.
9. Our US portfolio strategy group anticipates that the US stock market will recover this year. In that case,
financial conditions should become progressively easier, setting the stage for stronger growth and significant Fed tightening in 2003.

Goldman, Sachs & Co. Global Economics Research Paper No. 68
2 Evaluating Monetary Policy in Euroland and the United States
February 22, 2002
A fundamental question facing investors in financial markets is how do central banks behave? In answering this question, the Goldman Sachs Economic Research Group uses different techniques in Europe versus the United States. These differences do not reflect different economic ideologies, but instead mainly reflect two factors: 1. Differences in the structural stability of the two economies. 2. Differences in the central banks’ objectives and in their conduct of
monetary policy. For Euroland, we find that the economic structure has been relatively stable and that the European Central Bank (ECB) responds in a relatively predictable way to changes in the outlook for economic growth and inflation. As a consequence, we have been able to develop a Taylor Rule—a monetary policy framework—for Euroland that does a good job predicting the ECB’s behavior. Our calculated Taylor rates currently point to unchanged official rates this year, and a gradual increase toward a cyclically neutral level of 3¾% in the course of the next year. However, another small rate cut by the ECB in coming months should not be excluded. Our calculations also show that there would be room for such a cut if the ECB continued to place a high weight on the development of the output gap and ignored headline inflation, as it did in the period following September 11. Another small cut in the near term would be taken back later this year if the economy recovers as expected. For the US, we have not been able to develop a Taylor Rule that does a good job predicting the Federal Reserve Board’s behavior. This reflects three factors that are generally present in the US but not in Europe: 1. The US economy has been less stable structurally. Thus, it has been
harder to assess the size of the output gap and the federal funds rate deemed consistent with a neutral monetary policy regime. These are necessary tasks if one is to use the Taylor Rule to forecast monetary policy.
2. The transmission of monetary policy to the real economy is much
more dependent on developments in financial markets in the US compared with Europe. This reflects the importance of the equity market as a component of household wealth and the fact that the US financial markets are dominated by the capital markets, which tend to be anticipatory.
3. Federal Reserve officials respond to shifts in the economic
environment in a more anticipatory and preemptive fashion. Partially, this reflects higher-quality data. But it also reflects a more proactive monetary policy stance. As a result, monetary policy changes implemented by the Federal Reserve tend to be larger and more abrupt than what would be predicted by a Taylor Rule framework.
As a consequence, we have moved away from trying to develop an explicit monetary policy reaction function for the Federal Reserve. Instead, we have focused on developing a financial conditions framework
Evaluating Monetary Policy in Euroland and the United States
We have been able to develop a Taylor Rule for Euroland that does a good job predicting the ECB’s behavior.
Our calculated Taylor rates currently point to unchanged official rates this year, and a gradual increase toward a cyclically neutral level of 3¾% in the course of the next year.
For the US, we have not been able to develop a Taylor Rule that does a good job predicting the Federal Reserve Board’s behavior. As a consequence, we have focused on developing a financial conditions framework.

Goldman, Sachs & Co. Global Economics Research Paper No. 68
3 Evaluating Monetary Policy in Euroland and the United States
February 22, 2002
to assess the effective stance of monetary policy. From that, we then deduce likely shifts in Fed behavior. The Goldman Sachs Financial Conditions Index (GSFCI) currently implies that the monetary policy impulse is considerably less powerful than commonly believed. After all, despite 475 basis points of easing in 2001, the GSFCI is only about ½ point easier. This is a very small change in financial conditions given the magnitude of Fed easing. This is one reason why we anticipate only a moderate economic recovery in 2002. As a result, we foresee no downturn in the unemployment rate and further disinflation in 2002. Thus, our GSFCI framework suggests that the Federal Open Market Committee (FOMC) will be very slow to tighten monetary policy. In fact, we do not expect that Fed officials will begin to tighten monetary policy until sometime in 2003. As observers and forecasters of central bank behavior, we recognize that there are no mechanical relationships that can be employed to predict interest rates. Forecasting interest rates necessarily requires a great deal of judgment. Nevertheless, we believe there are techniques that help to capture the essence of monetary policy decisions. The appropriate use of these techniques varies from country to country. In this paper we focus primarily on the tools we find most useful in evaluating monetary policy in Europe and the United States. There are two main techniques we use—a Taylor Rule in Europe and a financial conditions index in the United States (see boxes on page 5 and page 15, respectively, for a detailed discussion of how the Euroland Taylor Rule and the GSFCI are constructed and calculated). The Taylor Rule reflects the idea that the best way to keep inflation stable is to keep the economy broadly at trend output.1 The rule calls for changes in interest rates to penalize deviations in output from trend and deviations in inflation from target. To make the Taylor Rule operational, it is necessary to form judgments about the neutral level of real interest rates and the size of the output gap. The strength of the central bank’s response to deviations in output from trend and inflation from target can be determined empirically. The Goldman Sachs Financial Conditions Index is a weighted average of US real short-term interest rates, real long-term corporate bond yields, the real trade-weighted dollar index, and the ratio of equity market capitalization to nominal GDP. The weights are based upon the Federal Reserve Board’s model of the US economy, FRB/US, and are proportional to the estimated effects of shocks to each variable on real GDP growth with a one-year horizon. The GSFCI is a simple summary statistic that captures the effectiveness of monetary policy by taking account of the structure of the US financial system and the importance of this in the transmission mechanism. In using the GSFCI to reach conclusions about monetary policy, one must make judgments about the appropriate level of financial conditions needed to achieve the Federal Reserve’s objectives for employment and inflation. Why do we favor the Taylor Rule in Europe and the financial conditions approach in the US? In Euroland, we use the Taylor Rule to analyze and
1 The Taylor Rule was developed by John B. Taylor, the current Under Secretary
of the Treasury for International Affairs.
Our GSFCI framework suggests that the Federal Open Market Committee will be very slow to tighten monetary policy.
Forecasting Interest Rates
There are two main techniques we use—a Taylor Rule in Europe and a financial conditions index in the United States.
Goldman, Sachs & Co. Global Economics Research Paper No. 68
4 Evaluating Monetary Policy in Euroland and the United States
February 22, 2002
forecast the interest rate policy of the ECB. The ECB’s monetary policy strategy falls neither in the camp of monetary targeting nor in that of pure inflation targeting. Nevertheless, the ECB attaches a great deal of importance to keeping inflation stable, and it subscribes to the view that output should grow reasonably closely to the economy’s potential. This naturally fits with a Taylor Rule framework. Although the ECB’s track record is still short, the Taylor formula has explained well the ECB’s interest rate decisions taken in 1999-2001. A monetary or financial conditions index would have given misleading signals for monetary policy given that the depreciation of the euro has been driven mainly by real factors and that the role of the stock market in the Euroland economy is rather limited. The superiority of a financial conditions indicator in the US reflects the structure of the financial system and changes in the performance of the economy. It best captures how changes in the federal funds rate affect the economy via the transmission channels of monetary policy. Because the capital markets dominate the US financial system, money supply rules work particularly poorly. Because the structure of the economy has been changing relatively rapidly, a rule-based Fed reaction function such as the Taylor Rule or the real federal funds rate does not work well in the United States. Monetary policy can be analyzed from two perspectives: first, from the perspective of the economy. There, we attempt to trace the effects of monetary policy on real economic activity and inflation. The tools we employ in this area include VAR models, leading indicators, and special inflation (e.g., P-Star) models. Second, monetary policy can be analyzed from the perspective of the central bank. Here, we try to analyze and forecast how past and future economic developments influence interest rate policy. In other words, we want to estimate a central bank reaction function and use it to forecast central bank behavior. Over the last few years, we have come to appreciate the Taylor Rule as a reaction function for the ECB. The ECB’s monetary policy approach is different than either monetary or inflation targeting. Money growth plays an important role, but it is no target. Moreover, pursuit of the ECB’s primary goal of price stability—defined as an increase of the harmonized price level in Euroland by less than 2% over the medium term—is different from inflation targeting in at least two respects. First, it lacks a precise definition of the lowest acceptable inflation rate. Second, it leaves open the time horizon for the achievement of this goal. Against this background, neither deviations of money growth from a target nor of inflation from a central bank forecast can be used to infer the ECB’s reactions to economic developments. But the Taylor Rule offers a solution. The attractiveness of the Taylor Rule is that it is general enough to be able to describe the behavior of central banks following a wide range of monetary policy strategies. Hence, it may not be surprising that the ECB’s interest rate policy—like the Bundesbank’s before—has exhibited a pattern consistent with the Taylor Rule. Again, as with the Bundesbank in the past, the finding that the ECB’s behavior can be explained with the rather simple Taylor formula seems to contradict the bank’s own description of its strategy. In its October 2001 Monthly Report, for
Although the ECB’s track record is still short, the Taylor formula has explained well the ECB’s interest rate decisions taken in 1999-2001.
Euroland: A Taylor Rule Approach
The attractiveness of the Taylor Rule is that it is general enough to be able to describe the behavior of central banks following a wide range of monetary policy strategies.
Goldman, Sachs & Co. Global Economics Research Paper No. 68
5 Evaluating Monetary Policy in Euroland and the United States
February 22, 2002
instance, the ECB explicitly warned that “a genuine understanding of the ECB’s monetary policy approach cannot be gained from these policy rules. Such understanding is more likely to be promoted over time if the ECB’s monetary policy is assessed on the basis of the systematic framework that the ECB has itself provided through the announcement of its monetary policy strategy.” However, if we associate the ECB’s “systematic framework” with the “full model” of the banks’ policy reaction function, we can interpret the Taylor formula as a sensible reduced form of this model. Past experience suggests that this reduced form is so robust that it can accommodate a fairly wide range of “full models.” Given the complexity of the “full models” and central bankers’ aversion to complete disclosure, we view the Taylor rule therefore as a useful “workhorse” in analyzing and forecasting ECB interest rate policy. The original Taylor rule for interest rates gives equal weight to the inflation and output gaps. The choice of these parameter values reflects the normative character of the rule and its original application to the US Federal Reserve (which is supposed to ensure both low inflation and adequate growth). When the Taylor formula is used to explain the behavior of another central bank, it seems more appropriate to determine these weights empirically. Unfortunately, the ECB’s track record is still relatively short, encompassing only 12 quarters of data ranging from the first quarter of 1999 to the fourth quarter of 2001. Nevertheless, we tried to obtain ballpark numbers of these weights by regressing 3-month money-market rates on a constant, the difference between actual harmonized inflation and the expected inflation rate of 1.5%, and our measure of the output gap for the period 1999Q1-2001Q4. The regression results—which were surprisingly good given the short estimation period—suggested a weight of 0.38 for the inflation gap and 0.62 for the output gap. This may be surprising to those who have criticized the ECB for not paying sufficient attention to developments of the real economy. Our admittedly tentative estimates suggest that the ECB gives more weight in their decisions to real developments than to
A Taylor Rule for Euroland
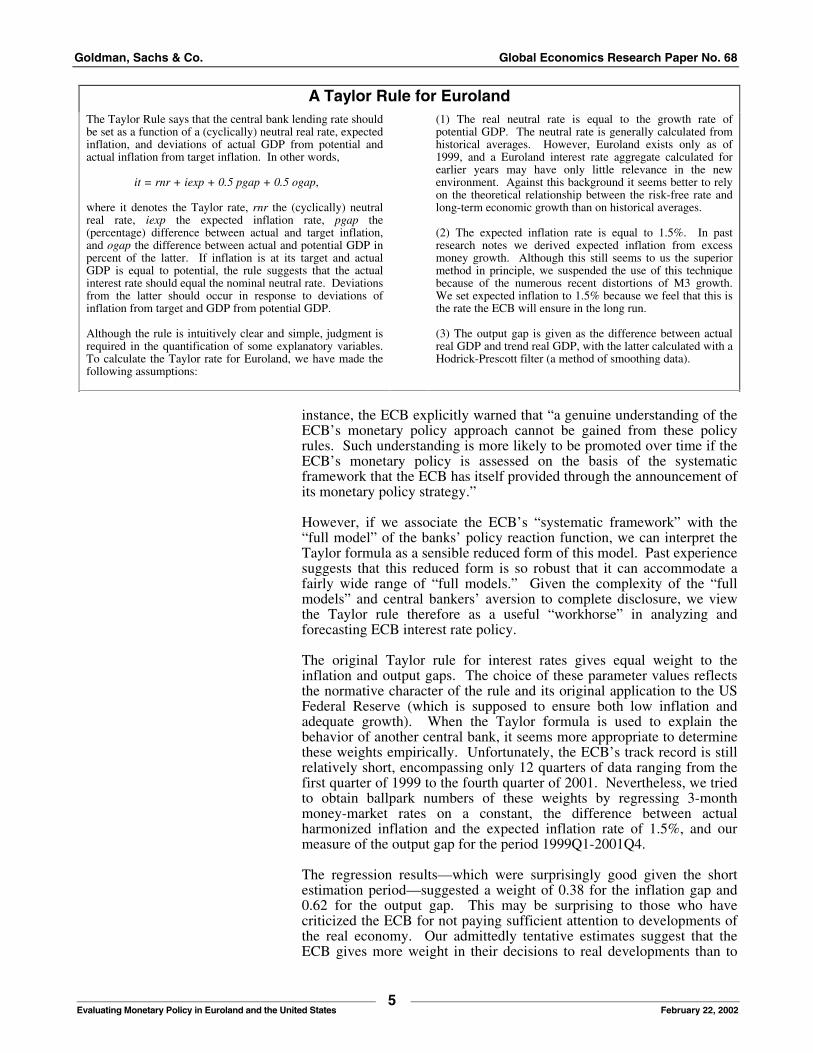
The Taylor Rule says that the central bank lending rate should be set as a function of a (cyclically) neutral real rate, expected inflation, and deviations of actual GDP from potential and actual inflation from target inflation. In other words, it = rnr + iexp + 0.5 pgap + 0.5 ogap, where it denotes the Taylor rate, rnr the (cyclically) neutral real rate, iexp the expected inflation rate, pgap the (percentage) difference between actual and target inflation, and ogap the difference between actual and potential GDP in percent of the latter. If inflation is at its target and actual GDP is equal to potential, the rule suggests that the actual interest rate should equal the nominal neutral rate. Deviations from the latter should occur in response to deviations of inflation from target and GDP from potential GDP. Although the rule is intuitively clear and simple, judgment is required in the quantification of some explanatory variables. To calculate the Taylor rate for Euroland, we have made the following assumptions:
(1) The real neutral rate is equal to the growth rate of potential GDP. The neutral rate is generally calculated from historical averages. However, Euroland exists only as of 1999, and a Euroland interest rate aggregate calculated for earlier years may have only little relevance in the new environment. Against this background it seems better to rely on the theoretical relationship between the risk-free rate and long-term economic growth than on historical averages. (2) The expected inflation rate is equal to 1.5%. In past research notes we derived expected inflation from excess money growth. Although this still seems to us the superior method in principle, we suspended the use of this technique because of the numerous recent distortions of M3 growth. We set expected inflation to 1.5% because we feel that this is the rate the ECB will ensure in the long run. (3) The output gap is given as the difference between actual real GDP and trend real GDP, with the latter calculated with a Hodrick-Prescott filter (a method of smoothing data).
Goldman, Sachs & Co. Global Economics Research Paper No. 68
6 Evaluating Monetary Policy in Euroland and the United States
February 22, 2002
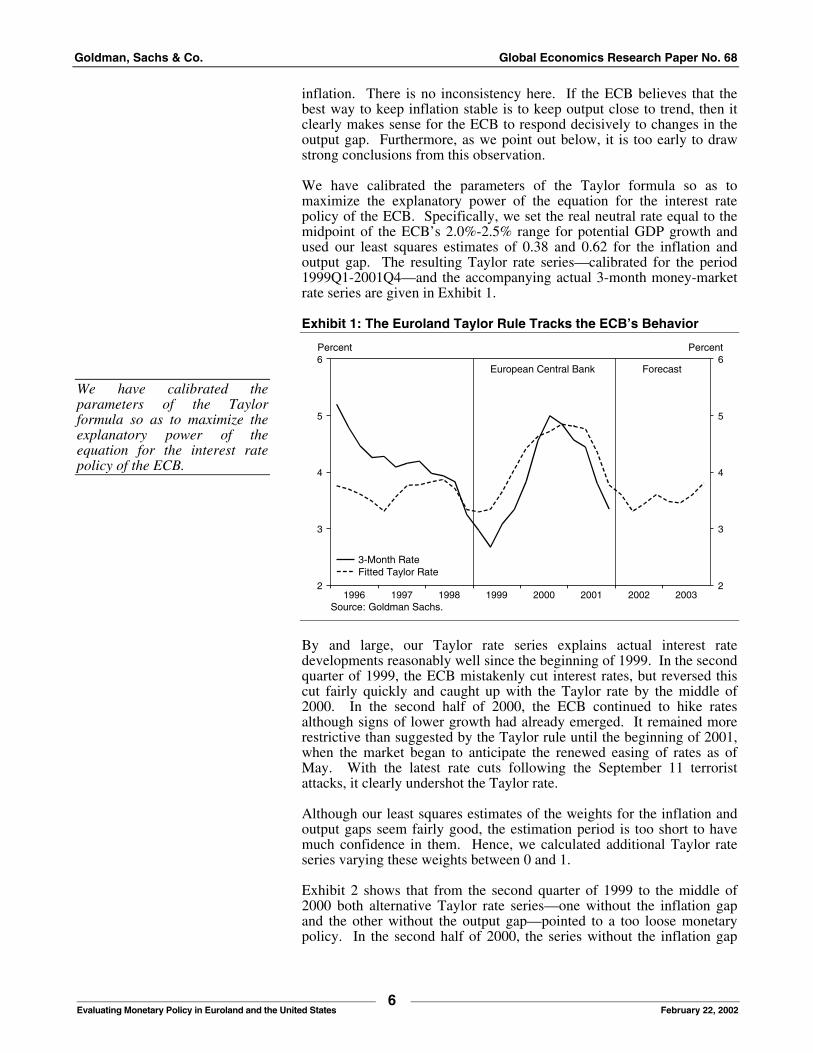
inflation. There is no inconsistency here. If the ECB believes that the best way to keep inflation stable is to keep output close to trend, then it clearly makes sense for the ECB to respond decisively to changes in the output gap. Furthermore, as we point out below, it is too early to draw strong conclusions from this observation. We have calibrated the parameters of the Taylor formula so as to maximize the explanatory power of the equation for the interest rate policy of the ECB. Specifically, we set the real neutral rate equal to the midpoint of the ECB’s 2.0%-2.5% range for potential GDP growth and used our least squares estimates of 0.38 and 0.62 for the inflation and output gap. The resulting Taylor rate series—calibrated for the period 1999Q1-2001Q4—and the accompanying actual 3-month money-market rate series are given in Exhibit 1. Exhibit 1: The Euroland Taylor Rule Tracks the ECB’s Behavior
20032002200120001999199819971996
6
5
4
3
2
6
5
4
3
2
Percent Percent
Source: Goldman Sachs.
European Central Bank Forecast
3-Month RateFitted Taylor Rate
By and large, our Taylor rate series explains actual interest rate developments reasonably well since the beginning of 1999. In the second quarter of 1999, the ECB mistakenly cut interest rates, but reversed this cut fairly quickly and caught up with the Taylor rate by the middle of 2000. In the second half of 2000, the ECB continued to hike rates although signs of lower growth had already emerged. It remained more restrictive than suggested by the Taylor rule until the beginning of 2001, when the market began to anticipate the renewed easing of rates as of May. With the latest rate cuts following the September 11 terrorist attacks, it clearly undershot the Taylor rate. Although our least squares estimates of the weights for the inflation and output gaps seem fairly good, the estimation period is too short to have much confidence in them. Hence, we calculated additional Taylor rate series varying these weights between 0 and 1. Exhibit 2 shows that from the second quarter of 1999 to the middle of 2000 both alternative Taylor rate series—one without the inflation gap and the other without the output gap—pointed to a too loose monetary policy. In the second half of 2000, the series without the inflation gap
We have calibrated the parameters of the Taylor formula so as to maximize the explanatory power of the equation for the interest rate policy of the ECB.
Goldman, Sachs & Co. Global Economics Research Paper No. 68
7 Evaluating Monetary Policy in Euroland and the United States
February 22, 2002
Exhibit 2: The Output Gap Receives More Weight
20032002200120001999199819971996
6
5
4
3
2
1
6
5
4
3
2
1
Percent Percent
Source: Goldman Sachs.
European Central Bank Forecast
3-Month RateFitted Taylor RateWithout Inflation GapWithout Output Gap
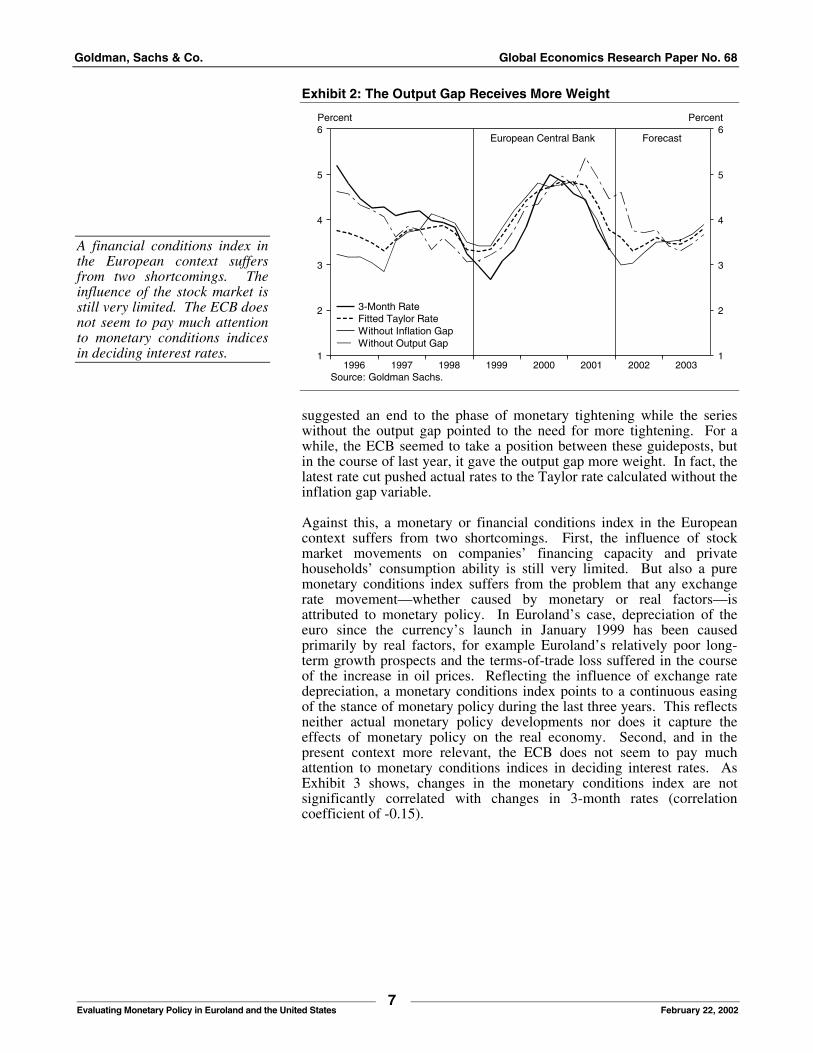
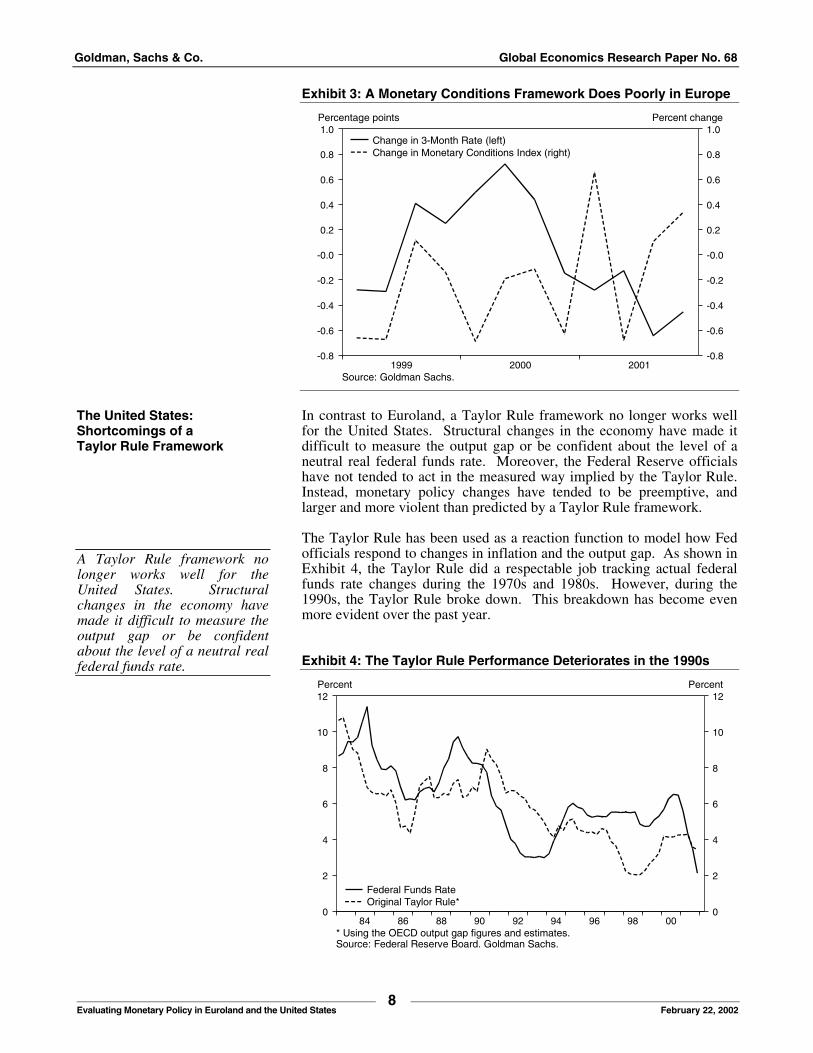
suggested an end to the phase of monetary tightening while the series without the output gap pointed to the need for more tightening. For a while, the ECB seemed to take a position between these guideposts, but in the course of last year, it gave the output gap more weight. In fact, the latest rate cut pushed actual rates to the Taylor rate calculated without the inflation gap variable. Against this, a monetary or financial conditions index in the European context suffers from two shortcomings. First, the influence of stock market movements on companies’ financing capacity and private households’ consumption ability is still very limited. But also a pure monetary conditions index suffers from the problem that any exchange rate movement—whether caused by monetary or real factors—is attributed to monetary policy. In Euroland’s case, depreciation of the euro since the currency’s launch in January 1999 has been caused primarily by real factors, for example Euroland’s relatively poor long-term growth prospects and the terms-of-trade loss suffered in the course of the increase in oil prices. Reflecting the influence of exchange rate depreciation, a monetary conditions index points to a continuous easing of the stance of monetary policy during the last three years. This reflects neither actual monetary policy developments nor does it capture the effects of monetary policy on the real economy. Second, and in the present context more relevant, the ECB does not seem to pay much attention to monetary conditions indices in deciding interest rates. As Exhibit 3 shows, changes in the monetary conditions index are not significantly correlated with changes in 3-month rates (correlation coefficient of -0.15).
A financial conditions index in the European context suffers from two shortcomings. The influence of the stock market is still very limited. The ECB does not seem to pay much attention to monetary conditions indices in deciding interest rates.
Goldman, Sachs & Co. Global Economics Research Paper No. 68
8 Evaluating Monetary Policy in Euroland and the United States
February 22, 2002
Exhibit 3: A Monetary Conditions Framework Does Poorly in Europe
200120001999
1.0
0.8
0.6
0.4
0.2
-0.0
-0.2
-0.4
-0.6
-0.8
1.0
0.8
0.6
0.4
0.2
-0.0
-0.2
-0.4
-0.6
-0.8
Percentage points Percent change
Source: Goldman Sachs.
Change in 3-Month Rate (left)Change in Monetary Conditions Index (right)
In contrast to Euroland, a Taylor Rule framework no longer works well for the United States. Structural changes in the economy have made it difficult to measure the output gap or be confident about the level of a neutral real federal funds rate. Moreover, the Federal Reserve officials have not tended to act in the measured way implied by the Taylor Rule. Instead, monetary policy changes have tended to be preemptive, and larger and more violent than predicted by a Taylor Rule framework. The Taylor Rule has been used as a reaction function to model how Fed officials respond to changes in inflation and the output gap. As shown in Exhibit 4, the Taylor Rule did a respectable job tracking actual federal funds rate changes during the 1970s and 1980s. However, during the 1990s, the Taylor Rule broke down. This breakdown has become even more evident over the past year. Exhibit 4: The Taylor Rule Performance Deteriorates in the 1990s
009896949290888684
12
10
8
6
4
2
0
12
10
8
6
4
2
0
Percent Percent
* Using the OECD output gap figures and estimates.Source: Federal Reserve Board. Goldman Sachs.
Federal Funds RateOriginal Taylor Rule*
The United States: Shortcomings of a Taylor Rule Framework
A Taylor Rule framework no longer works well for the United States. Structural changes in the economy have made it difficult to measure the output gap or be confident about the level of a neutral real federal funds rate.
Goldman, Sachs & Co. Global Economics Research Paper No. 68
9 Evaluating Monetary Policy in Euroland and the United States
February 22, 2002
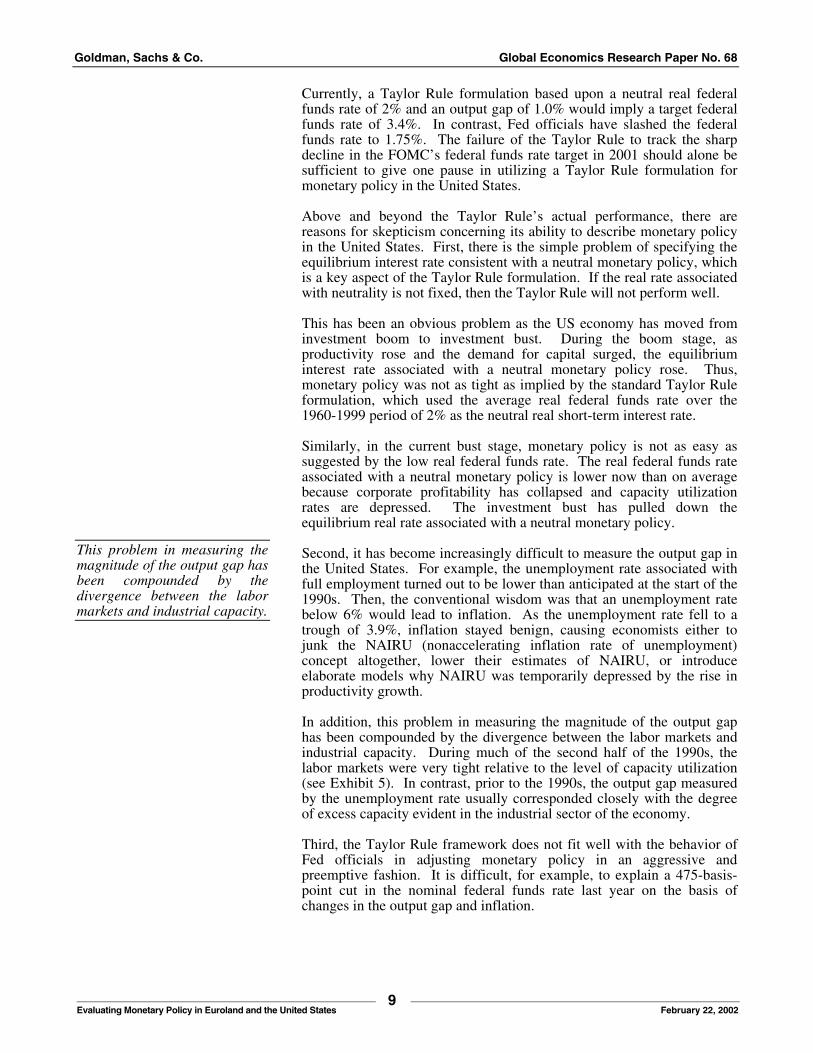
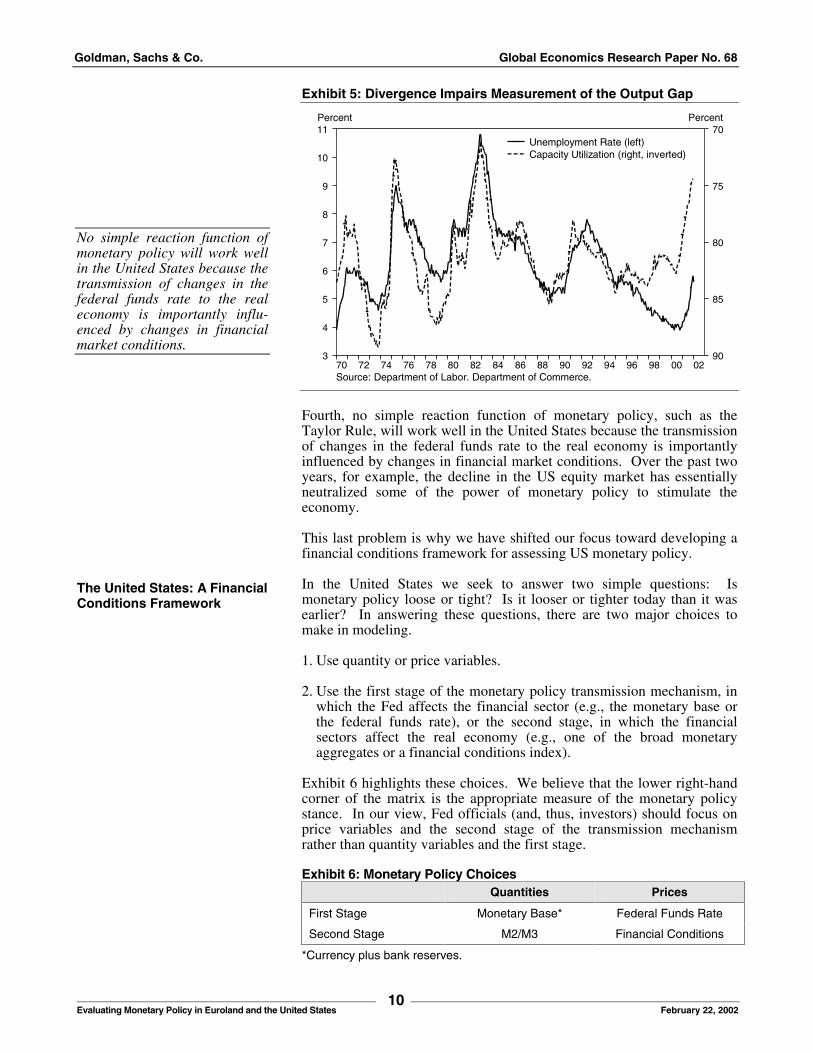
Currently, a Taylor Rule formulation based upon a neutral real federal funds rate of 2% and an output gap of 1.0% would imply a target federal funds rate of 3.4%. In contrast, Fed officials have slashed the federal funds rate to 1.75%. The failure of the Taylor Rule to track the sharp decline in the FOMC’s federal funds rate target in 2001 should alone be sufficient to give one pause in utilizing a Taylor Rule formulation for monetary policy in the United States. Above and beyond the Taylor Rule’s actual performance, there are reasons for skepticism concerning its ability to describe monetary policy in the United States. First, there is the simple problem of specifying the equilibrium interest rate consistent with a neutral monetary policy, which is a key aspect of the Taylor Rule formulation. If the real rate associated with neutrality is not fixed, then the Taylor Rule will not perform well. This has been an obvious problem as the US economy has moved from investment boom to investment bust. During the boom stage, as productivity rose and the demand for capital surged, the equilibrium interest rate associated with a neutral monetary policy rose. Thus, monetary policy was not as tight as implied by the standard Taylor Rule formulation, which used the average real federal funds rate over the 1960-1999 period of 2% as the neutral real short-term interest rate. Similarly, in the current bust stage, monetary policy is not as easy as suggested by the low real federal funds rate. The real federal funds rate associated with a neutral monetary policy is lower now than on average because corporate profitability has collapsed and capacity utilization rates are depressed. The investment bust has pulled down the equilibrium real rate associated with a neutral monetary policy. Second, it has become increasingly difficult to measure the output gap in the United States. For example, the unemployment rate associated with full employment turned out to be lower than anticipated at the start of the 1990s. Then, the conventional wisdom was that an unemployment rate below 6% would lead to inflation. As the unemployment rate fell to a trough of 3.9%, inflation stayed benign, causing economists either to junk the NAIRU (nonaccelerating inflation rate of unemployment) concept altogether, lower their estimates of NAIRU, or introduce elaborate models why NAIRU was temporarily depressed by the rise in productivity growth. In addition, this problem in measuring the magnitude of the output gap has been compounded by the divergence between the labor markets and industrial capacity. During much of the second half of the 1990s, the labor markets were very tight relative to the level of capacity utilization (see Exhibit 5). In contrast, prior to the 1990s, the output gap measured by the unemployment rate usually corresponded closely with the degree of excess capacity evident in the industrial sector of the economy. Third, the Taylor Rule framework does not fit well with the behavior of Fed officials in adjusting monetary policy in an aggressive and preemptive fashion. It is difficult, for example, to explain a 475-basis-point cut in the nominal federal funds rate last year on the basis of changes in the output gap and inflation.
This problem in measuring the magnitude of the output gap has been compounded by the divergence between the labor markets and industrial capacity.
Goldman, Sachs & Co. Global Economics Research Paper No. 68
10 Evaluating Monetary Policy in Euroland and the United States
February 22, 2002
Exhibit 5: Divergence Impairs Measurement of the Output Gap
0200989694929088868482807876747270
11
10
9
8
7
6
5
4
3 90
85
80
75
70Percent Percent
Source: Department of Labor. Department of Commerce.
Unemployment Rate (left)Capacity Utilization (right, inverted)
Fourth, no simple reaction function of monetary policy, such as the Taylor Rule, will work well in the United States because the transmission of changes in the federal funds rate to the real economy is importantly influenced by changes in financial market conditions. Over the past two years, for example, the decline in the US equity market has essentially neutralized some of the power of monetary policy to stimulate the economy. This last problem is why we have shifted our focus toward developing a financial conditions framework for assessing US monetary policy. In the United States we seek to answer two simple questions: Is monetary policy loose or tight? Is it looser or tighter today than it was earlier? In answering these questions, there are two major choices to make in modeling. 1. Use quantity or price variables. 2. Use the first stage of the monetary policy transmission mechanism, in
which the Fed affects the financial sector (e.g., the monetary base or the federal funds rate), or the second stage, in which the financial sectors affect the real economy (e.g., one of the broad monetary aggregates or a financial conditions index).
Exhibit 6 highlights these choices. We believe that the lower right-hand corner of the matrix is the appropriate measure of the monetary policy stance. In our view, Fed officials (and, thus, investors) should focus on price variables and the second stage of the transmission mechanism rather than quantity variables and the first stage. Exhibit 6: Monetary Policy Choices
Quantities Prices
First Stage Monetary Base* Federal Funds Rate
Second Stage M2/M3 Financial Conditions
*Currency plus bank reserves.
No simple reaction function of monetary policy will work well in the United States because the transmission of changes in the federal funds rate to the real economy is importantly influ-enced by changes in financial market conditions.
The United States: A Financial Conditions Framework
Goldman, Sachs & Co. Global Economics Research Paper No. 68
11 Evaluating Monetary Policy in Euroland and the United States
February 22, 2002
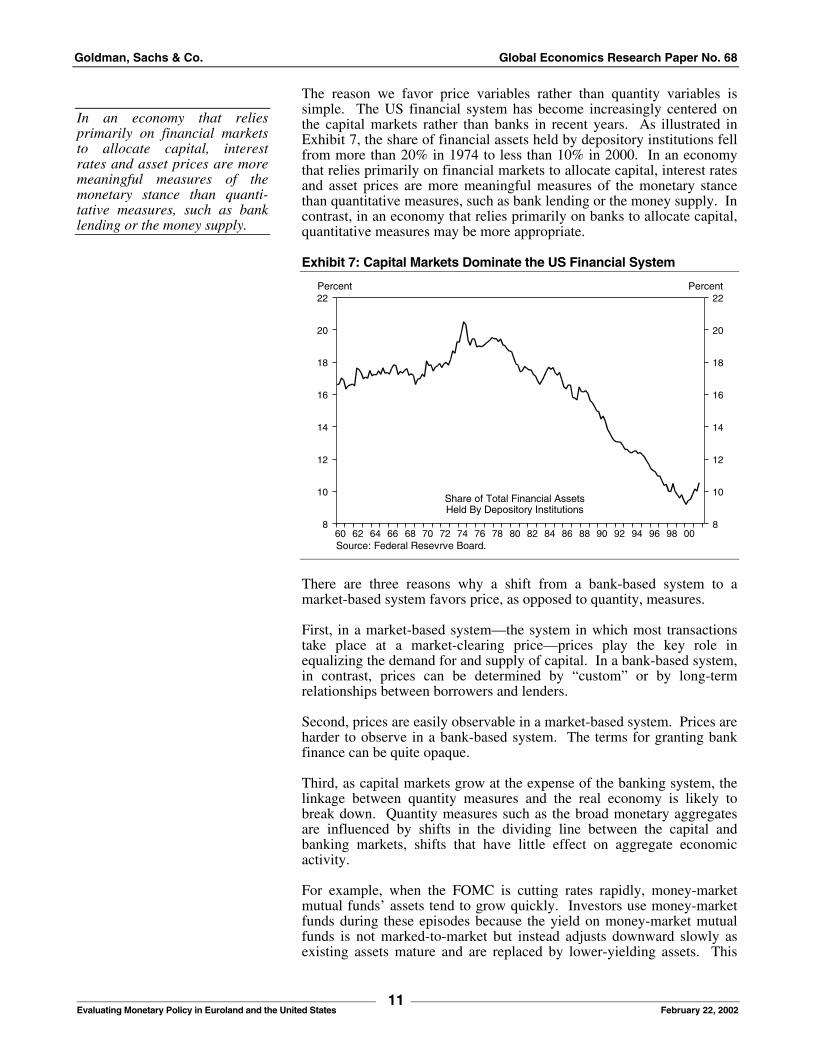
The reason we favor price variables rather than quantity variables is simple. The US financial system has become increasingly centered on the capital markets rather than banks in recent years. As illustrated in Exhibit 7, the share of financial assets held by depository institutions fell from more than 20% in 1974 to less than 10% in 2000. In an economy that relies primarily on financial markets to allocate capital, interest rates and asset prices are more meaningful measures of the monetary stance than quantitative measures, such as bank lending or the money supply. In contrast, in an economy that relies primarily on banks to allocate capital, quantitative measures may be more appropriate. Exhibit 7: Capital Markets Dominate the US Financial System
009896949290888684828078767472706866646260
22
20
18
16
14
12
10
8
22
20
18
16
14
12
10
8
Percent Percent
Source: Federal Resevrve Board.
Share of Total Financial AssetsHeld By Depository Institutions
There are three reasons why a shift from a bank-based system to a market-based system favors price, as opposed to quantity, measures. First, in a market-based system—the system in which most transactions take place at a market-clearing price—prices play the key role in equalizing the demand for and supply of capital. In a bank-based system, in contrast, prices can be determined by “custom” or by long-term relationships between borrowers and lenders. Second, prices are easily observable in a market-based system. Prices are harder to observe in a bank-based system. The terms for granting bank finance can be quite opaque. Third, as capital markets grow at the expense of the banking system, the linkage between quantity measures and the real economy is likely to break down. Quantity measures such as the broad monetary aggregates are influenced by shifts in the dividing line between the capital and banking markets, shifts that have little effect on aggregate economic activity. For example, when the FOMC is cutting rates rapidly, money-market mutual funds’ assets tend to grow quickly. Investors use money-market funds during these episodes because the yield on money-market mutual funds is not marked-to-market but instead adjusts downward slowly as existing assets mature and are replaced by lower-yielding assets. This
In an economy that relies primarily on financial markets to allocate capital, interest rates and asset prices are more meaningful measures of the monetary stance than quanti-tative measures, such as bank lending or the money supply.

Goldman, Sachs & Co. Global Economics Research Paper No. 68
12 Evaluating Monetary Policy in Euroland and the United States
February 22, 2002
tends to boost the growth rate of the broad monetary aggregates, which include money-market mutual funds as a kind of money, but do not count direct investments such as in commercial paper or Treasury securities. This reintermediation artificially boosts money growth without having any meaningful influence on credit growth or credit availability. Thus, the uptick in money supply growth has no implications for economic activity or monetary policy. Empirically, the case against quantity variables is borne out by the gradual breakdown in the linkage between quantity variables and nominal GDP growth. As shown in Exhibit 8, the linkage between M2 and GDP has become much looser over the past decade. Over the past year, it seems to have disappeared altogether. M2 has been growing rapidly even as nominal GDP growth has fallen. The distortion caused by money-market mutual fund assets has been a major factor behind this breakdown. Exhibit 8: Linkage Between Broad Money and GDP Breaks Down
00989694929088868482807876747270
12
8
4
0
-4
-8
12
10
8
6
4
2
0
-2
-4
Percent Percent change, year ago
Note: Line indicates start of 2001 recession.Source: Department of Commerce. Federal Reserve Board. NBER.
Real M2 Growth (left)Real GDP Growth (right)
Once one has decided to focus on price variables, the question remains whether one should focus on the first stage of the transmission process—the real federal funds rate—or the second stage—some sort of financial conditions index. In the end, this is really a question about which approach provides the most information on the likely impact of monetary policy on the real economy. If the real federal funds rate target were perfectly correlated with a financial conditions index, then the latter would be redundant. Moreover, if the federal funds rate had a systematic leading relationship to financial conditions, then focusing on the funds rate would provide more timely information about the stance of monetary policy. Otherwise, however, we believe a financial conditions index should be allowed to supplant or at least supplement the first-stage measure. Both theoretically and empirically, a strong case can be made for a financial conditions index. On the theoretical side, its first advantage is that changes in the federal funds rate are only important if these changes are likely to affect the real economy. If the change does not affect market interest rates, exchanges rates, or equity prices, then why should
The linkage between M2 and GDP has become much looser over the past decade.
Changes in the federal funds rate are only important if these changes are likely to affect the real economy.

Goldman, Sachs & Co. Global Economics Research Paper No. 68
13 Evaluating Monetary Policy in Euroland and the United States
February 22, 2002
we care? After all, no one in the nonfinancial sectors of the economy borrows at the federal funds rate. A second advantage of a financial conditions index—especially important in recent years—is that it will tend to be more robust than other measures in its ability to accommodate structural changes in the economy and still provide a reliable signal about the stance of monetary policy. For example, consider a situation in which faster productivity growth leads to higher equity prices and this, in turn, raises the equilibrium real interest rate consistent with a neutral monetary policy. In this case, the real federal funds rate relative to its historical average becomes unsuitable as a measure of the stance of monetary policy. After all, a rise in the federal funds rate may not indicate that monetary policy has really become tighter. In contrast, as long as the rise in productivity growth does not affect the sensitivity of demand to interest rates and equity prices, a financial conditions index will remain useful. The rise in equity prices will ease financial conditions. If that pushes real GDP growth above its now higher sustainable rate, then this implies that monetary policy will need to be tightened. A third advantage of a financial conditions index is that it is a more timely indicator of changes in the effective stance of monetary policy when financial markets act in an anticipatory manner. As we shall see, this has been the case in recent years. The GSFCI is a weighted average of real short-term interest rates, real long-term corporate bond yields, the real trade-weighted dollar index, and the ratio of equity market capitalization to nominal GDP (see box on page 15). The weights are based on the Federal Reserve Board’s model of the US economy, FRB/US, and are proportional to the estimated effects of shocks to each variable on real GDP growth, with a one-year horizon. It is important to note that the GSFCI is not designed as a leading indicator of future growth. If it were, the weights would depend on the simple correlation of each variable with future growth, rather than the estimated effects on future growth. This distinction may seem esoteric, but it is important in practice. The best example is the trade-weighted dollar. Few would deny that, by itself, a stronger dollar dents short-run growth prospects because it hurts US competitiveness, and this is indeed what FRB/US shows. However, a stronger dollar is not only a potential cause of weaker growth, but also a potential result of greater market confidence in US growth prospects. Therefore, the simple correlation between the dollar and future GDP growth could, in principle, be positive or negative. In practice, it tends to be close to zero, as the two effects approximately offset each other. Empirically, the performance of the GSFCI supports the theoretical arguments in the previous section. First, the correlation between the real federal funds rate and financial conditions as proxied by the GSFCI has broken down over the past decade (see Exhibit 9). This breakdown was particularly in evidence in 2001, when the GSFCI was little changed despite a sharp decline in the real federal funds rate. Until 1994, the correlation coefficient was 0.87. Since then, the correlation coefficient has fallen to -0.25.
The advantage of a financial conditions index—especially important in recent years—is that it will tend to be more robust than other measures in its ability to accommodate structural changes in the economy and still provide a reliable signal about the stance of monetary policy.
The GSFCI’s Empirical Performance
The correlation between the real federal funds rate and financial conditions as proxied by the GSFCI has broken down over the past decade.
Goldman, Sachs & Co. Global Economics Research Paper No. 68
14 Evaluating Monetary Policy in Euroland and the United States
February 22, 2002
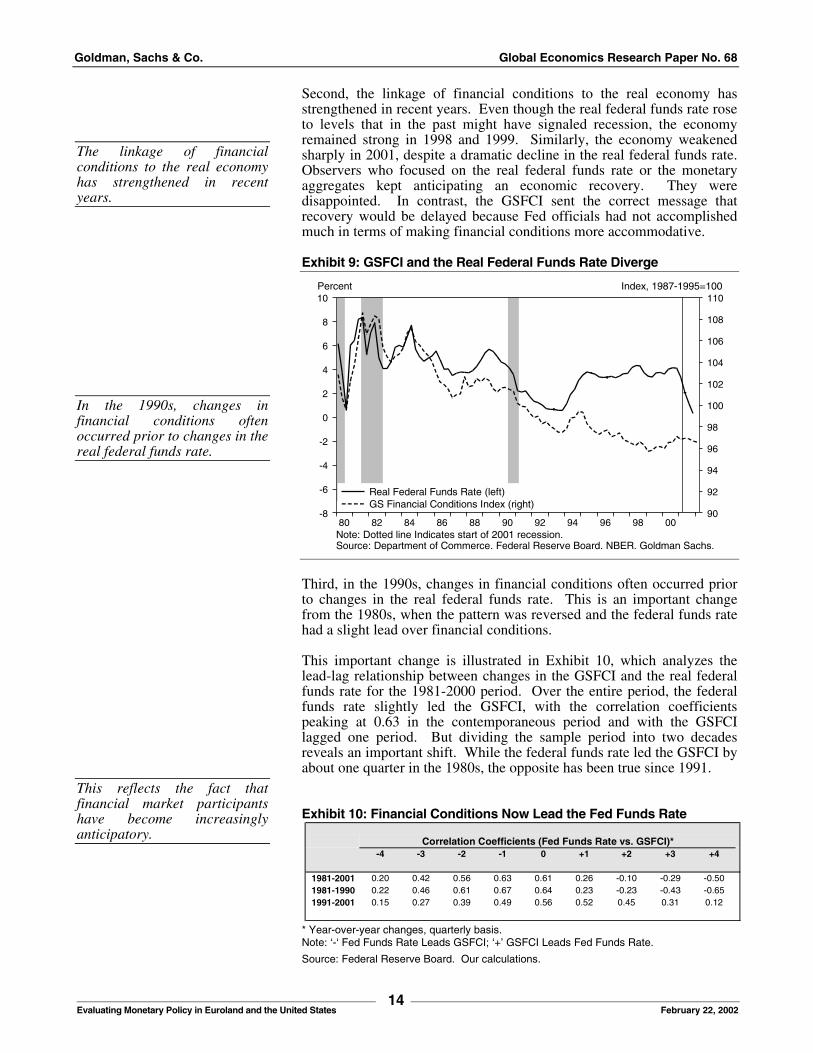
Second, the linkage of financial conditions to the real economy has strengthened in recent years. Even though the real federal funds rate rose to levels that in the past might have signaled recession, the economy remained strong in 1998 and 1999. Similarly, the economy weakened sharply in 2001, despite a dramatic decline in the real federal funds rate. Observers who focused on the real federal funds rate or the monetary aggregates kept anticipating an economic recovery. They were disappointed. In contrast, the GSFCI sent the correct message that recovery would be delayed because Fed officials had not accomplished much in terms of making financial conditions more accommodative. Exhibit 9: GSFCI and the Real Federal Funds Rate Diverge
0098969492908886848280
10
8
6
4
2
0
-2
-4
-6
-8
110
108
106
104
102
100
98
96
94
92
90
Percent Index, 1987-1995=100
Note: Dotted line Indicates start of 2001 recession.Source: Department of Commerce. Federal Reserve Board. NBER. Goldman Sachs.
Real Federal Funds Rate (left)GS Financial Conditions Index (right)
Third, in the 1990s, changes in financial conditions often occurred prior to changes in the real federal funds rate. This is an important change from the 1980s, when the pattern was reversed and the federal funds rate had a slight lead over financial conditions. This important change is illustrated in Exhibit 10, which analyzes the lead-lag relationship between changes in the GSFCI and the real federal funds rate for the 1981-2000 period. Over the entire period, the federal funds rate slightly led the GSFCI, with the correlation coefficients peaking at 0.63 in the contemporaneous period and with the GSFCI lagged one period. But dividing the sample period into two decades reveals an important shift. While the federal funds rate led the GSFCI by about one quarter in the 1980s, the opposite has been true since 1991. Exhibit 10: Financial Conditions Now Lead the Fed Funds Rate
* Year-over-year changes, quarterly basis. Note: ‘-‘ Fed Funds Rate Leads GSFCI; ‘+’ GSFCI Leads Fed Funds Rate.
Source: Federal Reserve Board. Our calculations.
The linkage of financial conditions to the real economy has strengthened in recent years.
In the 1990s, changes in financial conditions often occurred prior to changes in the real federal funds rate.
This reflects the fact that financial market participants have become increasingly anticipatory.
-4 -3 -2 -1 0 +1 +2 +3 +4
1981-2001 0.20 0.42 0.56 0.63 0.61 0.26 -0.10 -0.29 -0.501981-1990 0.22 0.46 0.61 0.67 0.64 0.23 -0.23 -0.43 -0.651991-2001 0.15 0.27 0.39 0.49 0.56 0.52 0.45 0.31 0.12
Correlation Coefficients (Fed Funds Rate vs. GSFCI)*
Goldman, Sachs & Co. Global Economics Research Paper No. 68
15 Evaluating Monetary Policy in Euroland and the United States
February 22, 2002
This development reflects the fact that financial market participants have become increasingly anticipatory. Financial conditions now move on the expectations of changes in monetary policy. The actual reduction in the federal funds rate target does not have much impact on financial conditions unless it is unanticipated. Thus, the actual federal funds rate has become less useful as a forward-looking indicator. The easing of monetary policy between July 1995 and January 1996 is a good example of the new regime. Financial conditions began to ease in early 1995, about six months before the Fed’s first rate cut. Thus, the GSFCI was a better indicator for anticipating the reacceleration of economic activity in early 1996. One key test of the GSFCI or any other financial conditions index is whether it outperforms other indicators in measuring the impact of monetary policy on the real economy. Indeed, the GSFCI has been superior to both the real federal funds rate and the broad monetary aggregate over the past ten years. This is shown in our econometric “horse race,” which uses each indicator, with a lag of at least three quarters, to predict real GDP growth. As shown in Exhibit 11, we find that in the 1990s, the GSFCI clearly has pulled ahead. Not only is the adjusted R-squared respectable given the volatility in quarterly GDP growth numbers, but also the coefficient estimates are sensible, with both the level and the change in the level showing negative coefficients. By contrast, neither the real funds rate nor real broad money growth helps predict real GDP.
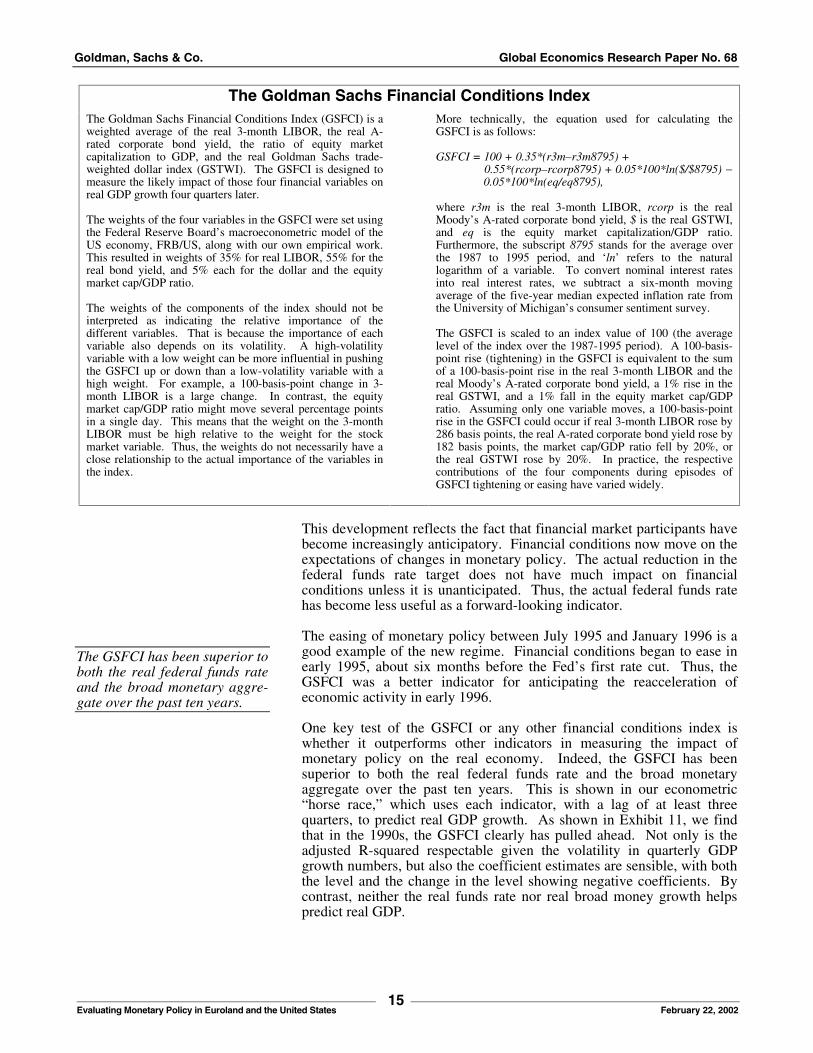
The Goldman Sachs Financial Conditions Index
The Goldman Sachs Financial Conditions Index (GSFCI) is a weighted average of the real 3-month LIBOR, the real A-rated corporate bond yield, the ratio of equity market capitalization to GDP, and the real Goldman Sachs trade-weighted dollar index (GSTWI). The GSFCI is designed to measure the likely impact of those four financial variables on real GDP growth four quarters later. The weights of the four variables in the GSFCI were set using the Federal Reserve Board’s macroeconometric model of the US economy, FRB/US, along with our own empirical work. This resulted in weights of 35% for real LIBOR, 55% for the real bond yield, and 5% each for the dollar and the equity market cap/GDP ratio. The weights of the components of the index should not be interpreted as indicating the relative importance of the different variables. That is because the importance of each variable also depends on its volatility. A high-volatility variable with a low weight can be more influential in pushing the GSFCI up or down than a low-volatility variable with a high weight. For example, a 100-basis-point change in 3-month LIBOR is a large change. In contrast, the equity market cap/GDP ratio might move several percentage points in a single day. This means that the weight on the 3-month LIBOR must be high relative to the weight for the stock market variable. Thus, the weights do not necessarily have a close relationship to the actual importance of the variables in the index.
More technically, the equation used for calculating the GSFCI is as follows: GSFCI = 100 + 0.35*(r3m–r3m8795) + 0.55*(rcorp–rcorp8795) + 0.05*100*ln($/$8795) −
0.05*100*ln(eq/eq8795), where r3m is the real 3-month LIBOR, rcorp is the real Moody’s A-rated corporate bond yield, $ is the real GSTWI, and eq is the equity market capitalization/GDP ratio. Furthermore, the subscript 8795 stands for the average over the 1987 to 1995 period, and ‘ln’ refers to the natural logarithm of a variable. To convert nominal interest rates into real interest rates, we subtract a six-month moving average of the five-year median expected inflation rate from the University of Michigan’s consumer sentiment survey. The GSFCI is scaled to an index value of 100 (the average level of the index over the 1987-1995 period). A 100-basis-point rise (tightening) in the GSFCI is equivalent to the sum of a 100-basis-point rise in the real 3-month LIBOR and the real Moody’s A-rated corporate bond yield, a 1% rise in the real GSTWI, and a 1% fall in the equity market cap/GDP ratio. Assuming only one variable moves, a 100-basis-point rise in the GSFCI could occur if real 3-month LIBOR rose by 286 basis points, the real A-rated corporate bond yield rose by 182 basis points, the market cap/GDP ratio fell by 20%, or the real GSTWI rose by 20%. In practice, the respective contributions of the four components during episodes of GSFCI tightening or easing have varied widely.
The GSFCI has been superior to both the real federal funds rate and the broad monetary aggre- gate over the past ten years.

Goldman, Sachs & Co. Global Economics Research Paper No. 68
16 Evaluating Monetary Policy in Euroland and the United States
February 22, 2002
Exhibit 11: The GSFCI Wins the Horse Race 1980 to 1989 1990 to 2001
GSFCI Real Fed
Funds Real M2
GSFCI
Real Fed Funds
Real M2
GSFCI (-3) 0.24
(1.0)
-- -- -0.51*
(2.8)
-- --
GSFCI (-3) –
GSFCI (-6)
-0.84*
(3.4)
-- -- -0.88
(2.1)
-- --
Real FF (-3) -- 0.07*
(2.8)
-- -- 0.01
(0.8)
--
Real FF (-3) –
Real FF (-6)
-- -0.03
(1.3)
-- -- -0.01
(0.8)
--
Real M2 (-3) -- -- 0.59*
(2.7)
-- -- 0.00
(0.1)
Real M3 (-3) –
Real M3 (-6)
-- -- 0.01
(0.0)
-- -- 0.04
(0.6)
Fiscal policy 0.44
(0.6)
0.51
(0.7)
0.38
(0.5)
0.63
(1.2)
1.00
(1.7)
0.88
(1.4)
Adj. R2 0.21 0.14 0.16 0.20 0.00 0.00
Durbin-Watson 1.58 1.79 1.56 1.61 1.30 1.30
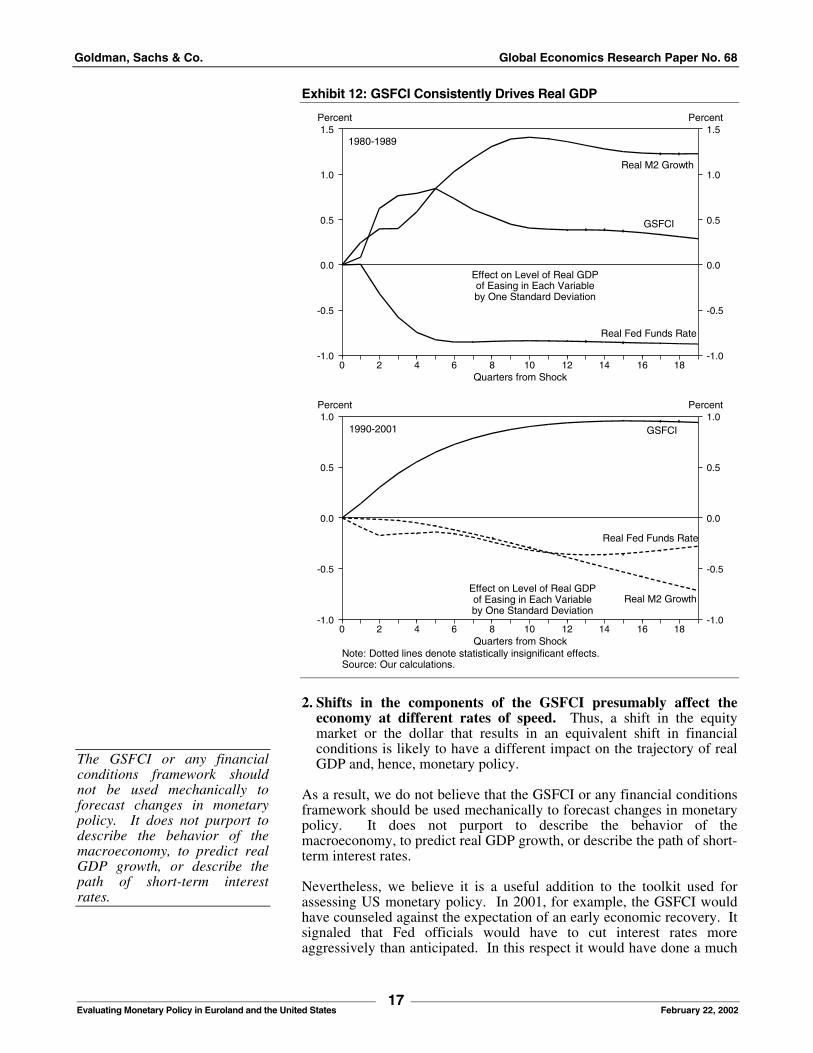
Note: T-statistics are in parentheses. An asterisk indicates statistical signifi- cance at the 5% level. Source: Goldman Sachs. Our calculations. A similar conclusion follows from simple vector-autoregressive models that relate real GDP to each of the three monetary policy indicators for the period since 1990. As shown in Exhibit 12, shocks to the GSFCI have a significant impact on future GDP. The impact of a one-standard-deviation shock to the GSFCI on the level of real GDP peaks at about 1% after three years. In contrast, shocks to neither the real federal funds rate nor real broad money growth have a significant impact on real GDP, and the point estimates actually go the wrong way. Neither of the two empirical exercises above should be viewed as a conclusive analysis of the causes of real GDP growth. However, both support the idea that a financial conditions framework is not only an appropriate one in the abstract, but also that it is possible to build a simple index, using only a few variables, that does a reasonable job incorporating how changes in monetary policy affect the real economy through their impact on private sector interest rates, the dollar, and the level of equity prices. In contrast, the empirical results show that more traditional indicators of the monetary policy stance have been essentially uncorrelated with future economic activity, which casts some doubt on their usefulness. Although we note that the GSFCI wins the empirical horse race, this does not mean it is without difficulties in assessing monetary policy. In particular, we would highlight two shortcomings: 1. It is difficult to judge the appropriate level of the GSFCI at any
point in time. In particular, it is unclear whether it is changes in the index or the level of the index that is most important in assessing the impact of monetary policy on the real economy.
Goldman, Sachs & Co. Global Economics Research Paper No. 68
17 Evaluating Monetary Policy in Euroland and the United States
February 22, 2002
Exhibit 12: GSFCI Consistently Drives Real GDP
181614121086420
1.5
1.0
0.5
0.0
-0.5
-1.0
1.5
1.0
0.5
0.0
-0.5
-1.0
Quarters from Shock
Percent Percent
Effect on Level of Real GDPof Easing in Each Variableby One Standard Deviation
GSFCI
Real M2 Growth
Real Fed Funds Rate
1980-1989
181614121086420
1.0
0.5
0.0
-0.5
-1.0
1.0
0.5
0.0
-0.5
-1.0
Quarters from Shock
Percent Percent
Note: Dotted lines denote statistically insignificant effects.Source: Our calculations.
Effect on Level of Real GDPof Easing in Each Variableby One Standard Deviation
GSFCI
Real M2 Growth
Real Fed Funds Rate
1990-2001
2. Shifts in the components of the GSFCI presumably affect the
economy at different rates of speed. Thus, a shift in the equity market or the dollar that results in an equivalent shift in financial conditions is likely to have a different impact on the trajectory of real GDP and, hence, monetary policy.
As a result, we do not believe that the GSFCI or any financial conditions framework should be used mechanically to forecast changes in monetary policy. It does not purport to describe the behavior of the macroeconomy, to predict real GDP growth, or describe the path of short-term interest rates. Nevertheless, we believe it is a useful addition to the toolkit used for assessing US monetary policy. In 2001, for example, the GSFCI would have counseled against the expectation of an early economic recovery. It signaled that Fed officials would have to cut interest rates more aggressively than anticipated. In this respect it would have done a much
The GSFCI or any financial conditions framework should not be used mechanically to forecast changes in monetary policy. It does not purport to describe the behavior of the macroeconomy, to predict real GDP growth, or describe the path of short-term interest rates.
Goldman, Sachs & Co. Global Economics Research Paper No. 68
18 Evaluating Monetary Policy in Euroland and the United States
February 22, 2002
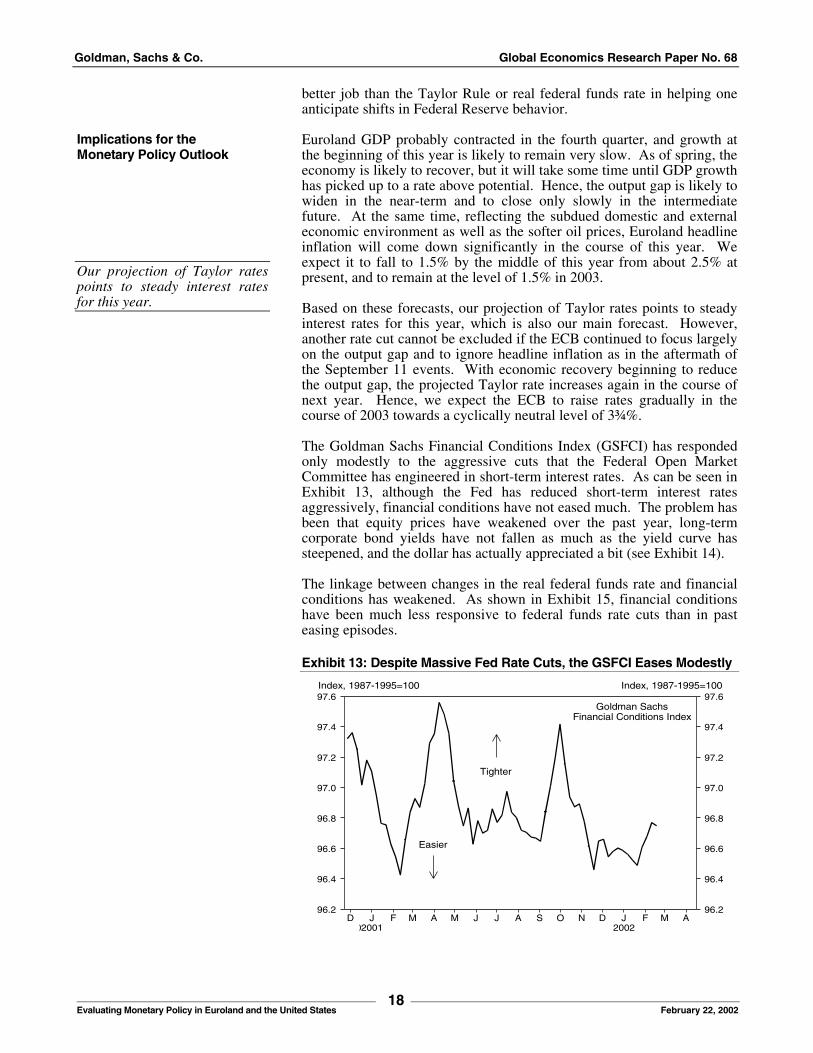
better job than the Taylor Rule or real federal funds rate in helping one anticipate shifts in Federal Reserve behavior. Euroland GDP probably contracted in the fourth quarter, and growth at the beginning of this year is likely to remain very slow. As of spring, the economy is likely to recover, but it will take some time until GDP growth has picked up to a rate above potential. Hence, the output gap is likely to widen in the near-term and to close only slowly in the intermediate future. At the same time, reflecting the subdued domestic and external economic environment as well as the softer oil prices, Euroland headline inflation will come down significantly in the course of this year. We expect it to fall to 1.5% by the middle of this year from about 2.5% at present, and to remain at the level of 1.5% in 2003. Based on these forecasts, our projection of Taylor rates points to steady interest rates for this year, which is also our main forecast. However, another rate cut cannot be excluded if the ECB continued to focus largely on the output gap and to ignore headline inflation as in the aftermath of the September 11 events. With economic recovery beginning to reduce the output gap, the projected Taylor rate increases again in the course of next year. Hence, we expect the ECB to raise rates gradually in the course of 2003 towards a cyclically neutral level of 3¾%. The Goldman Sachs Financial Conditions Index (GSFCI) has responded only modestly to the aggressive cuts that the Federal Open Market Committee has engineered in short-term interest rates. As can be seen in Exhibit 13, although the Fed has reduced short-term interest rates aggressively, financial conditions have not eased much. The problem has been that equity prices have weakened over the past year, long-term corporate bond yields have not fallen as much as the yield curve has steepened, and the dollar has actually appreciated a bit (see Exhibit 14). The linkage between changes in the real federal funds rate and financial conditions has weakened. As shown in Exhibit 15, financial conditions have been much less responsive to federal funds rate cuts than in past easing episodes. Exhibit 13: Despite Massive Fed Rate Cuts, the GSFCI Eases Modestly
AMFJDNOSAJJMAMFJD200220012000
97.6
97.4
97.2
97.0
96.8
96.6
96.4
96.2
97.6
97.4
97.2
97.0
96.8
96.6
96.4
96.2
Index, 1987-1995=100 Index, 1987-1995=100
Goldman SachsFinancial Conditions Index
Tighter
Easier
Implications for the Monetary Policy Outlook
Our projection of Taylor rates points to steady interest rates for this year.

Goldman, Sachs & Co. Global Economics Research Paper No. 68
19 Evaluating Monetary Policy in Euroland and the United States
February 22, 2002
Exhibit 14: The Equity, Bond, and Currency Markets All Play a Role
AMFJDNOSAJJMAMFJD200220012000
2.0
1.5
1.0
0.5
0.0
-0.5
-1.0
-1.5
-2.0
2.0
1.5
1.0
0.5
0.0
-0.5
-1.0
-1.5
-2.0
Index points Index points
Source: Goldman Sachs.
Contribution to Change in GSFCI
StockMarket
Dollar
LongRate
ShortRate
Exhibit 15: Monetary Policy Much Less Powerful than Usual
20011995-961990-921984-86
7
6
5
4
3
2
1
0
7
6
5
4
3
2
1
0
Easing Episode
Percentage points Index points
Source: Federal Reserve Board. Goldman Sachs.
Decline in:
Fed Funds Rate (left)GSFCI (right)
In our view this has three major implications. First, it underscores the usefulness of a financial conditions framework for the United States. If the linkage between the real federal funds rate and the GSFCI were predictable and reliable, then there would be no need for a financial conditions framework. It is precisely during episodes like 2001, in which there was a large divergence between the two measures, that a financial conditions framework proves its value. It tells one not to anticipate a strong recovery because Fed officials have not yet accomplished much in terms of making monetary policy effective in stimulating economic activity. Second, it suggests that both the real and nominal federal funds rates are likely to remain depressed for an extended period. Put simply, financial conditions as measured by the GSFCI imply that the recovery is not
Financial conditions as measured by the GSFCI imply that the recovery is not likely to be particularly powerful. Thus, there should be little need for Fed officials to tighten monetary policy significantly this year.

Goldman, Sachs & Co. Global Economics Research Paper No. 68
20 Evaluating Monetary Policy in Euroland and the United States
February 22, 2002
likely to be particularly powerful. Thus, there should be little need for Fed officials to tighten monetary policy significantly this year.2 This result should not be surprising. During the boom, real interest rates needed to be high to temper the pace of economic activity. During the bust phase, which we are still in, interest rates need to be low to allow an orderly pace of adjustment in the financial imbalances created earlier. William Dudley Thomas Mayer Jan Hatzius David Walton February 22, 2002
2 Of course, this assumes that financial conditions do not become substantially
easier due to a rise in stock prices, a fall in the dollar, or a sharp decline in corporate bond yields, or that fiscal policy does not shift sharply further in a stimulative direction. If financial conditions shift or other factors outside the purview of the monetary authority change the outlook for growth, this also needs to be taken into consideration. The GSFCI is not meant to be a single variable, black-box model for the pace of economic activity in the US economy.
Goldman, Sachs & Co. Global Economics Research Paper No. 68
Global Economics Papers Paper No. Title Date Author
67 Russia: Reason to Believe 01-Feb-02 Al Breach
66 Building Better Global Economic BRICs 30-Nov-01 Jim O’Neill Paulo Leme David Walton Stephen Potter Binit Patel
65 Transatlantic Differences in Merger Policy: Not Such a Big Deal 26-Oct-01 David Walton
64 The Next Wave of EU Enlargement: Opportunities in Convergence 18-Oct-01 Erik F. Nielsen Jens J. Nordvig-Rasmussen
63 Japan NPL Disposal: Opening a Pandora’s Box? 10-Oct-01 Tetsufumi Yamakawa Takuji Okubo Gavyn Davies
62 US Investment Boom Goes Bust 30-May-01 William Dudley, Jan Hatzius
61 Das Kapital: Capital Markets Are Transforming China 18-May-01 Frederick Z. Hu
60 Rising Recession Probabilities in America and Japan 20-Mar-01 Gavyn Davies
59 The George W. Bush Administration: Policies, Priorities, and Personnel 13-Dec-00 William Dudley, Ed McKelvey, Joan Woodward, John Youngdahl
58 South Africa: Inflation Target: Well Within Reach 9-Nov-00 Rumi Masih Carlos Teixeira
57 Germany’s Economic Revival: The Role of Capital Markets 6-Oct-00 Thomas Mayer
56 Bush versus Gore: A Budget Referendum 6-Oct-00 William Dudley, Edward McKelvey, Joan Woodward, John Youngdahl
55 Consequences of an ANZAC Currency Union 04-Oct-00 Dominic Wilson
54 Russia: An Anatomy of Adolescent Capital ism 03-Oct-00 Al Breach
53 Oil Still Has the Power to Shock 20-Sep-00 Gavyn Davies, Steve Strongin
52 Mexico: Prospects and Challenges for the Fox Administration 16-Aug-00 Paulo Leme, Alain Féler, Jesús Viejo
51 Bush versus Gore: A Budget Referendum 03-Aug-00 William Dudley, Ed McKelvey, Joan Woodward John Youngdahl
50 Australian Productivity: Catching a “New Economy” Wave 24-Jul-00 Dominic Wilson
49 Is the Internet Better Than Electricity? 20-Jul-00 Martin Brookes, Zaki Wahhaj
48 Implications of a Disappearing Treasury Debt Market 10-Jul-00 John Youngdahl, Brad Stone, Hayley Boesky
47 Asset Prices and the Conduct of Monetary Policy in the “New” UK Economy 10-Jul-00 Ben Broadbent, David Walton
New York Goldman, Sachs & Co. One NY Plaza, 47th Floor New York, New York 10004 Tel: (1) 212-902-1000 Fax: (1) 212-346-3115 London Goldman Sachs International Peterborough Court 133 Fleet Street London, EC4A 2BB, England Tel: (44) 207-774-1000 Fax: (44) 207-774-1181 Paris Goldman Sachs Paris Inc. et Cie. 2, rue de Thann 75017 - Paris, France Tel: (33) 1 4212-1341 Fax: (33) 1 4212-1499 Hong Kong Goldman Sachs (Asia) L.L.C. Cheung Kong Center, 68th Floor 2 Queen’s Road Central Hong Kong Tel: (852) 2978-0300 Fax: (852) 2978-0479
Frankfurt Goldman, Sachs & Co. oHG MesseTurm D-60308 Frankfurt am Main, Germany Tel: (49) 69-7532-1000 Fax: (49) 69-7532-2800 Tokyo Goldman Sachs (Japan) Ltd. ARK Mori Building, 10th Floor 12-32, Akasaka 1-chome Minato-ku, Tokyo 107, Japan Tel: (81) 3-3589-7000 Fax: (81) 3-3587-9263 Singapore Goldman Sachs (Singapore) Pte. 1 Raffles Place, #07-01 South Lobby Singapore 039393 Tel: (65) 228-8128 Fax: (65) 228-8474 Korea Goldman, Sachs & Co. Dong Ah Life Insurance Building 33 Da-Dong, Chung-Ku Seoul, South Korea Tel: (822) 3788-1000 Fax: (822) 3788-1001
Goldman Sachs Global Research Centers
©2002 Goldman, Sachs & Co. All rights reserved.
This report is not to be construed as an offer to sell or the solicitation of an offer to buy any security in any jurisdiction where such an offer or solicitation would be illegal. We are not soliciting any action based upon this material. This material is for the general information of clients of Goldman Sachs. It does not take into account the particular investment objectives, financial situation or needs of individual clients. Before acting on any advice or recommendation in this material, a client should consider whether it is suitable for their particular circumstances and, if necessary, seek professional advice. Certain transactions, including those involving futures, options, and high yield securities, give rise to substantial risk and are not suitable for all investors. The material is based upon information that we consider reliable, but we do not represent that it is accurate or complete, and it should not be relied upon as such. Opinions expressed are our current opinions as of the date appearing on this material only. While we endeavor to update on a reasonable basis the information discussed in this material, there may be regulatory, compliance, or other reasons that prevent us from doing so. We and our affiliates, officers, directors, and employees, including persons involved in the preparation or issuance of this material may, from time to time, have long or short positions in, and buy or sell, the securities, or derivatives (including options) thereof, of companies mentioned herein. No part of this material may be (i) copied, photocopied or duplicated in any form by any means or (ii) redistributed without Goldman, Sachs & Co.'s prior written consent.
This material has been issued by Goldman, Sachs & Co. and/or one of its affiliates and has been approved by Goldman Sachs International, which is regulated by The Financial Services Authority, in connection with its distribution in the United Kingdom and by Goldman Sachs Canada in connection with its distribution in Canada. This material is distributed in Hong Kong by Goldman Sachs (Asia) L.L.C., in Korea by Goldman Sachs (Asia) L.L.C., Seoul Branch, in Japan by Goldman Sachs (Japan) Ltd., in Australia by Goldman Sachs Australia Pty Limited (ACN 092 589 770), and in Singapore through Goldman Sachs (Singapore) Pte. This material is not for distribution in the United Kingdom to private customers, as that term is defined under the rules of The Securities and Futures Authority; and any investments, including any convertible bonds or derivatives, mentioned in this material will not be made available by us to any such private customer. Goldman Sachs International and its non-U.S. affiliates may, to the extent permitted under applicable law, have acted upon or used this research, to the extent it relates to non-U.S. issuers, prior to or immediately following its publication. Foreign-currency-denominated securities are subject to fluctuations in exchange rates that could have an adverse effect on the value or price of, or income derived from, the investment. In addition, investors in securities such as ADRs, the values of which are influenced by foreign currencies, effectively assume currency risk. NR (Not Rated) The Investment Rating and Target Price, if any, have been suspended temporarily. Such suspension is in compliance with applicable regulation(s) and/or Goldman Sachs policies in circumstances where Goldman Sachs is acting in an advisory capacity in a merger or strategic transaction involving this company and in certain other circumstances.
Further information on any of the securities men-tioned in this material may be obtained upon request, and for this purpose persons in Italy should contact Goldman Sachs S.I.M. S.p.A. in Milan, or at its London branch office at 133 Fleet Street, persons in Hong Kong should contact Goldman Sachs (Asia) L.L.C. at 2 Queen’s Road Central, and persons in Australia should contact Goldman Sachs Australia Pty Limited. Unless governing law permits otherwise, you must contact a Goldman Sachs entity in your home jurisdiction if you want to use our services in effecting a transaction in the securities mentioned in this material.