Embed Size (px)
Citation preview

Global Economic Outlook3rd Quarter 2017
Global Economic Outlook
Introduction | 2By Ira KalishIn this issue, our team of global economists exam-ines the issues and economic trends in the United States, China, Eurozone, India, Japan, United Kingdom, Russia, and Turkey, along with a special article on the rising sentiment against globalization.
United States: With the policy status quo, 2017 looks a lot like prior years | 6By Patricia BuckleyHealthy employment growth and moderate in-creases in GDP continue to define the US economy, even as the composition of the labor force evolves. But domestic demand is only part of the growth equation.
China: Slowly stabilizing | 14By Ira KalishChina’s economy appears to be stabilizing gradually, boosted by rising industrial production and higher foreign currency reserves. However, questions loom large over its market status and sovereign risk rat-ing.
Eurozone: Summer-blue skies for the economy | 18By Alexander BörschWith the economy recovering faster than antici-pated, fears of a fragmentation of the Eurozone seem to have temporarily eased. However, political uncertainty is far from over—much depends on the outcome of the Brexit negotiations and elections in Austria and Italy.
India: Wiggling through demonetization and GST | 22By Rumki MajumdarIndia’s economic growth has slowed down, and demonetization is only partly to blame. While the near-term economic outlook remains mired in uncertainty as India transitions to a new sales tax regime, the government’s ability to take on difficult reforms bodes well for the long term.
Japan: An accelerating economy, though not quite at breakneck speed | 30By Ira Kalish The Japanese economy appears to accelerating more robustly, with low unemployment, strong ex-port growth, and positive monetary policy possibly contributing. Of course, a declining population is still a concern.
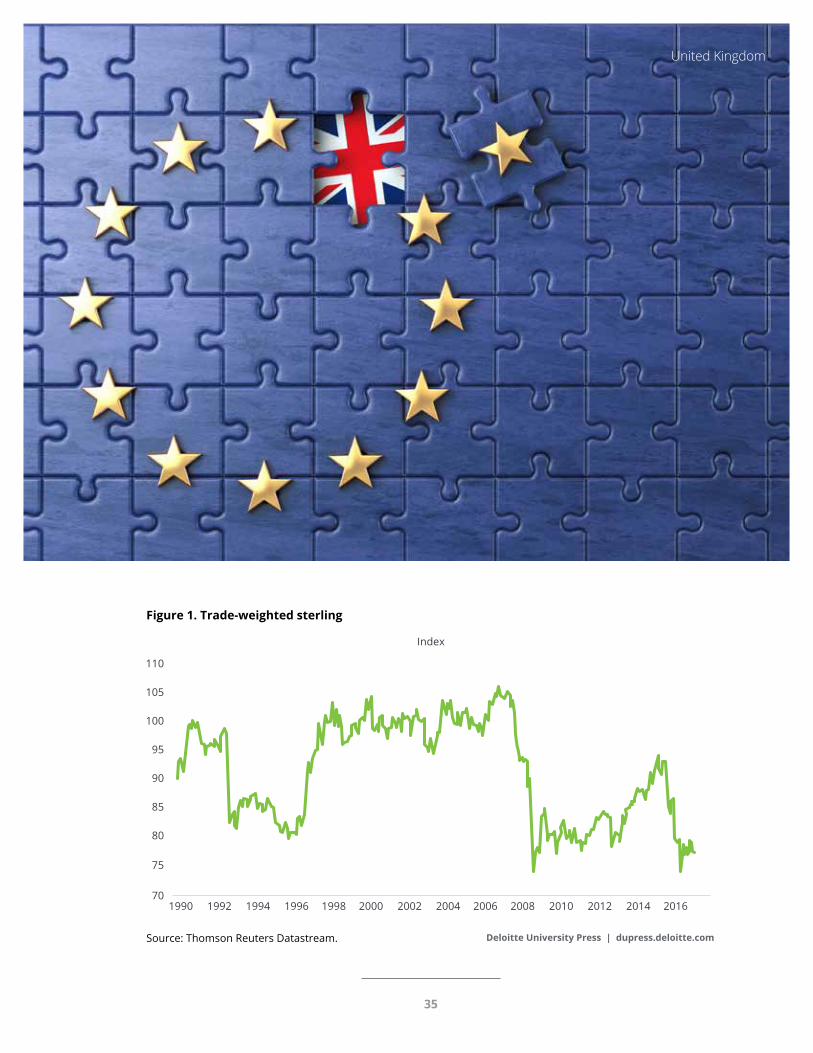
United Kingdom: Growth cools amid growing political uncertainty | 34By Ian Stewart Uncertainty looms large over the United Kingdom, as a hung parliament in the recent general election has compounded Brexit-related concerns. Economic growth is likely to be impacted as consumers, already grappling with rising inflation, clamp down on spending.
Global Economic Outlook
CONTENTS
II
Russia: Back to growth, but economic diversification remains a challenge | 38By Lester GunnionAlthough Russia’s economy seems to be on the path to recovery, growth in 2017 is unlikely to be robust. The longer-term growth outlook will, in large part, be determined by the success of its import substitu-tion strategy and ability to make headway into new markets amid Western sanctions.
Turkey: Uncertainty giving way to growth | 46By Akrur BaruaBuoyed by two consecutive quarters of growth and a more stable political environment, things seem to be looking up for Turkey. Concerns, however, remain about a weak currency, higher inflation, and feeble investment.
Special topic: Why reversing globalization may not be a good idea | 52By Rumki MajumdarAfter the 2008 global financial crisis, global leaders pledged to avoid protectionist measures in order to speed up economic recovery and boost growth. However, protectionism has been rising since. Is a retreat from globalization possible? If not, what is the way forward?
Economic indices | 64
Additional resources | 67
About the authors | 68
Contact information | 69
Illustrations by Stephanie Dalton Cowan
Contents
III
Global Economic Outlook
IntroductionBy Ira Kalish
AT a time when the global economy appears to be accelerating, the two leading econo-mies of the English-speaking world are not
participating. The UK economy is evidently slowing, while the US economy simply continues to grow at a modest pace—albeit in the context of full employ-ment. Likewise, the Chinese economy is also stabi-lizing at a moderate rate of growth. Meanwhile, the Eurozone and Japan show signs of acceleration, as do many of the major emerging economies such as Turkey and Russia, both of which are discussed in this report. One exception is India, which shows signs of slowing. Yet the overall trend is positive. Indeed, the central banks of most of the major de-veloped economies are either starting to normalize monetary policy or are thinking about it. Perhaps the most significant threat to the health of the global economy is the specter of protectionism. In this edi-tion of Deloitte’s Global Economic Outlook, all of these countries and issues are examined.
We begin with Patricia Buckley’s discussion of the US economy. She notes the demographic con-straints on growth, not only influencing the supply side of the economy but also hurting the growth of domestic demand. Weakness in exports, emanat-ing from a strong US dollar, has also suppressed growth. Patricia expects, however, that the dollar will not rise any further and may decline, possibly leading to an improvement in exports. Finally, she says that significant uncertainty about the future of
policy means that it is fruitless to speculate on the potential impact of policy changes.
Next, I examine the economic situation in China. There economic growth has stabilized, while foreign currency reserves have started to rebound as capital controls have helped to stabilize the currency. How-ever, the rising volume of debt has created a greater perception of risk, leading to the downgrading of the country’s sovereign debt. Meanwhile, the possi-bility that China could obtain market-economy sta-tus threatens to boost trade tensions between China and the United States.
In his article on the Eurozone, Alexander Börsch notes that the region has hit a sweet spot, with ac-celerating economic growth, rising employment, and diminishing political risk following favorable election results in France and elsewhere. However, he also notes that other risks remain, including up-coming elections in Italy and Austria, as well as the potential fallout from the Brexit process. By country, Alexander says that Spain’s situation is “dynamic,” Germany’s is “rosy,” and the recoveries in France and Italy are “moderate, but gaining momentum.”
India is the subject of our next article by Rumki Majumdar. She notes that there were signs of slow-ing economic activity even before the controversial demonetization. Although she says that there may be some short-term negative effects from the imple-
2
mentation of the goods and services tax (GST), over the long term, it could generate faster economic growth. She says that “the new tax regime is expect-ed to improve the ease of doing business,” thereby boosting growth.
In our next article, I look at the economic situation in Japan. The economy is accelerating, as evidenced by a variety of economic indicators. Moreover, the International Monetary Fund now says that the economic policy mix in recent years has been a suc-cess. Plus, despite the shelving of the Trans-Pacific Partnership, the government is actively seeking op-portunities to expand trade, having just reached an agreement with the European Union to ease trade barriers. On the other hand, onerous demographics continue to suppress growth and create budgetary challenges.
Ian Stewart then offers his take on the British econ-omy. He discusses how the sharp drop in the British pound following the Brexit referendum has boost-ed inflation and suppressed consumer spending growth. Moreover, uncertainty following the recent election means that the Brexit process will likely render a hard exit. On the other hand, Ian says that there are some mitigating factors that should help the British economy. A cheaper pound and an accel-erating global economy are likely to boost exports, inflationary pressures could ultimately ease once
Global Economic Outlook
Published quarterly by Deloitte Research
Editor-in-chiefDr. Ira Kalish
Managing editorAditi Rao
Contributors Akrur Barua Dr. Alexander BörschDr. Patricia BuckleyLester GunnionDr. Rumki MajumdarIan Stewart
Editorial address350 South Grand Street Los Angeles, CA 90013 Tel: +1 213 688 4765 [email protected]
Introduction
3
Global Economic Outlook
the currency impact tapers off, and fiscal and mon-etary stimulus could helpfully increase.
Next, Lester Gunnion examines the Russian econo-my. He discusses the rebound in growth. In addition, he looks at the Russian government’s policy of im-port substitution, meant to boost domestic produc-tion in the non-energy sector. While it might have short-term benefits, it is fraught with risk. Lester notes that “import substitution leads to the transfer of resources from efficient sectors of the economy that function competitively without protectionism to inefficient protected sectors of the economy.” Lester also discusses Russia’s difficulty in obtaining funding from the West given the sanctions regime, and its decision to pivot to China.
In our next article, Akrur Barua discusses the turn-around in Turkey’s economy. He says that this is driven by more political certainty, fiscal stimulus, stronger demand for Turkish exports, a return of tourists, and strong household spending. On the other hand, he notes that investment remains weak,
thereby boding poorly for future gains in productiv-ity. He also discusses the risks Turkey faces due to inflation and a large current account deficit.
Finally, in our last article, Rumki Majumdar exam-ines the slowdown in the growth of trade and the rising sentiment against trade liberalization. She reviews the recent evolution of trade policy in major economies and the behavior of trade between ma-jor countries. And, although she notes the costs of globalization, she says that a move away from glo-balization carries greater costs and few benefits. She discusses how policy ought to involve further trade liberalization along with a greater effort to address the concerns of those sidelined by globalization.
Dr. Ira Kalish Chief global economist of Deloitte Touche Tohmatsu Limited
4

Introduction
Global Economic Outlook
UNITED STATES
With the policy status quo, 2017 looks a lot like prior yearsBy Patricia Buckley
Introduction Growth in the first half of 2017 is currently esti-mated to be 1.0 percent, just below the average rate of growth seen over the last five years (2.2 per-cent).1 Concurrently, the labor market continues to strengthen, with the average pace of job growth over the first six months of 2017 only slightly lower than last year’s pace (on average 180,000 jobs per month in 2017 compared with 187,000 for all of 2016) and the unemployment rate hovering at very low lev-els (4.4 percent in June).2 Even one of the areas of greatest concern, the labor force participation rate, has stabilized.
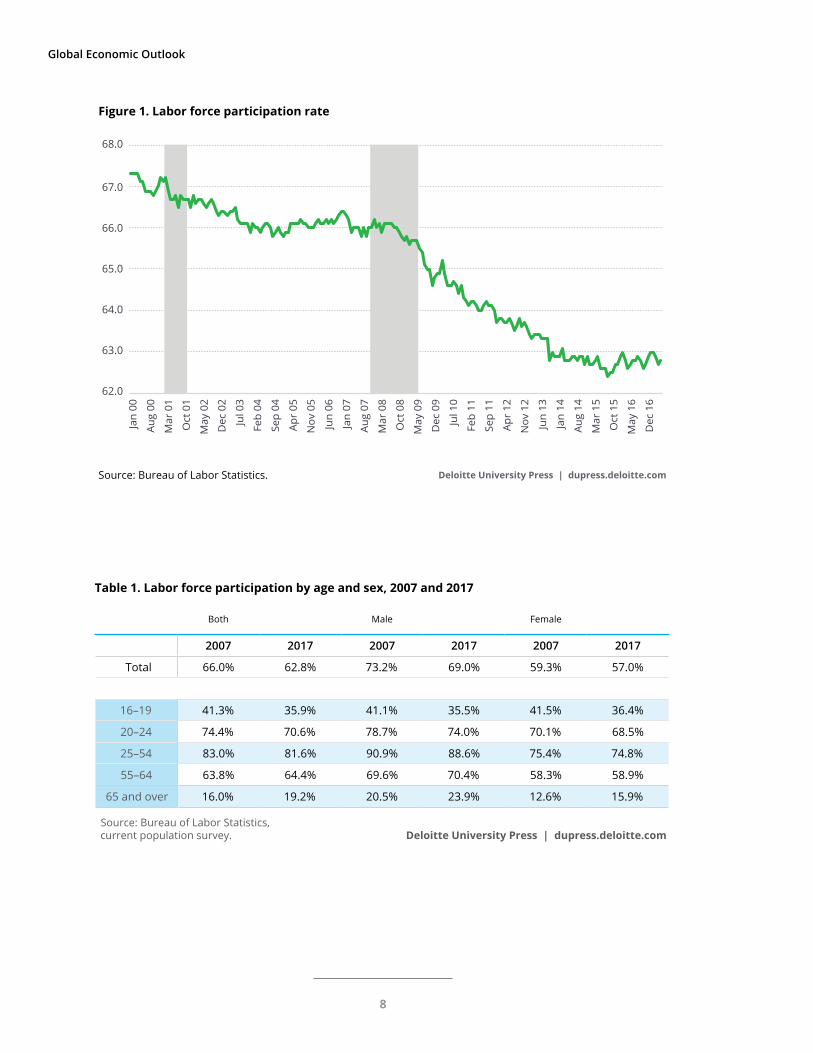
As the recession began in December 2007, the labor force participation rate began a decline that contin-ued long after the official conclusion of the recession in June 2009 (figure 1). However, after reaching a low of 62.4 percent in September 2015—a rate not seen in almost 40 years—the labor force participa-tion rate rose slightly and has averaged 62.7 percent over the last 24 months. While a decline from ap-proximately 66 percent before the recession to just under 63 percent currently may not appear on the surface to be that large, each 0.1 percentage point change to the labor force participation rate repre-sents around 250,000 potential workers, given the current size of the population.3
6

United States
Even one of the areas of greatest concern, the labor force participation rate, has stabilized.
7
Global Economic Outlook
Deloitte University Press | dupress.deloitte.comSource: Bureau of Labor Statistics.
Jan
00
Aug
00
Mar
01
Oct
01
May
02
Dec
02
Jul 0
3
Feb
04
Sep
04
Apr
05
Nov
05
Jun
06
Jan
07
Aug
07
Mar
08
Oct
08
May
09
Dec
09
Jul 1
0
Feb
11
Sep
11
Apr
12
Nov
12
Jun
13
Jan
14
Aug
14
Mar
15
Oct
15
May
16
Dec
16
62.0
63.0
64.0
65.0
66.0
67.0
68.0
Figure 1. Labor force participation rate
Table 1. Labor force participation by age and sex, 2007 and 2017
Both Male Female
2007 2017 2007 2017 2007 2017
Total 66.0% 62.8% 73.2% 69.0% 59.3% 57.0%
16–19 41.3% 35.9% 41.1% 35.5% 41.5% 36.4%
20–24 74.4% 70.6% 78.7% 74.0% 70.1% 68.5%
25–54 83.0% 81.6% 90.9% 88.6% 75.4% 74.8%
55–64 63.8% 64.4% 69.6% 70.4% 58.3% 58.9%
65 and over 16.0% 19.2% 20.5% 23.9% 12.6% 15.9%
Source: Bureau of Labor Statistics, current population survey. Deloitte University Press | dupress.deloitte.com
8
United States
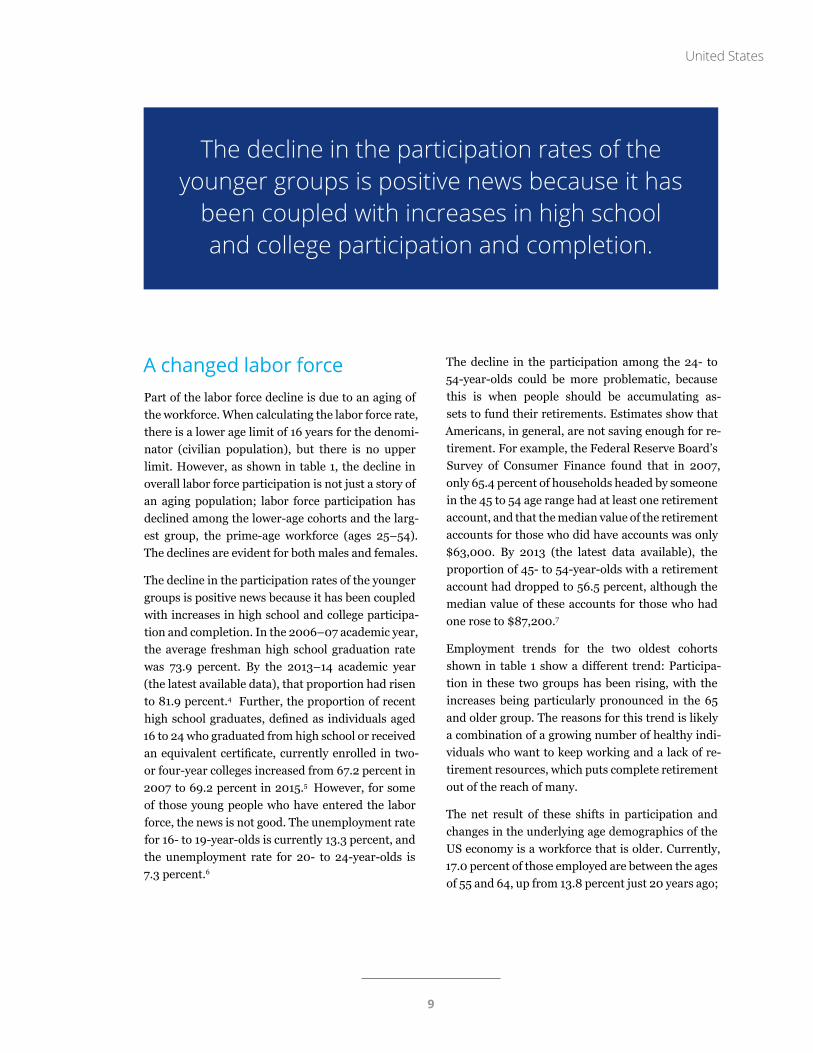
The decline in the participation rates of the younger groups is positive news because it has
been coupled with increases in high school and college participation and completion.
A changed labor forcePart of the labor force decline is due to an aging of the workforce. When calculating the labor force rate, there is a lower age limit of 16 years for the denomi-nator (civilian population), but there is no upper limit. However, as shown in table 1, the decline in overall labor force participation is not just a story of an aging population; labor force participation has declined among the lower-age cohorts and the larg-est group, the prime-age workforce (ages 25–54). The declines are evident for both males and females.
The decline in the participation rates of the younger groups is positive news because it has been coupled with increases in high school and college participa-tion and completion. In the 2006–07 academic year, the average freshman high school graduation rate was 73.9 percent. By the 2013–14 academic year (the latest available data), that proportion had risen to 81.9 percent.4 Further, the proportion of recent high school graduates, defined as individuals aged 16 to 24 who graduated from high school or received an equivalent certificate, currently enrolled in two- or four-year colleges increased from 67.2 percent in 2007 to 69.2 percent in 2015.5 However, for some of those young people who have entered the labor force, the news is not good. The unemployment rate for 16- to 19-year-olds is currently 13.3 percent, and the unemployment rate for 20- to 24-year-olds is 7.3 percent.6
The decline in the participation among the 24- to 54-year-olds could be more problematic, because this is when people should be accumulating as-sets to fund their retirements. Estimates show that Americans, in general, are not saving enough for re-tirement. For example, the Federal Reserve Board’s Survey of Consumer Finance found that in 2007, only 65.4 percent of households headed by someone in the 45 to 54 age range had at least one retirement account, and that the median value of the retirement accounts for those who did have accounts was only $63,000. By 2013 (the latest data available), the proportion of 45- to 54-year-olds with a retirement account had dropped to 56.5 percent, although the median value of these accounts for those who had one rose to $87,200.7
Employment trends for the two oldest cohorts shown in table 1 show a different trend: Participa-tion in these two groups has been rising, with the increases being particularly pronounced in the 65 and older group. The reasons for this trend is likely a combination of a growing number of healthy indi-viduals who want to keep working and a lack of re-tirement resources, which puts complete retirement out of the reach of many.
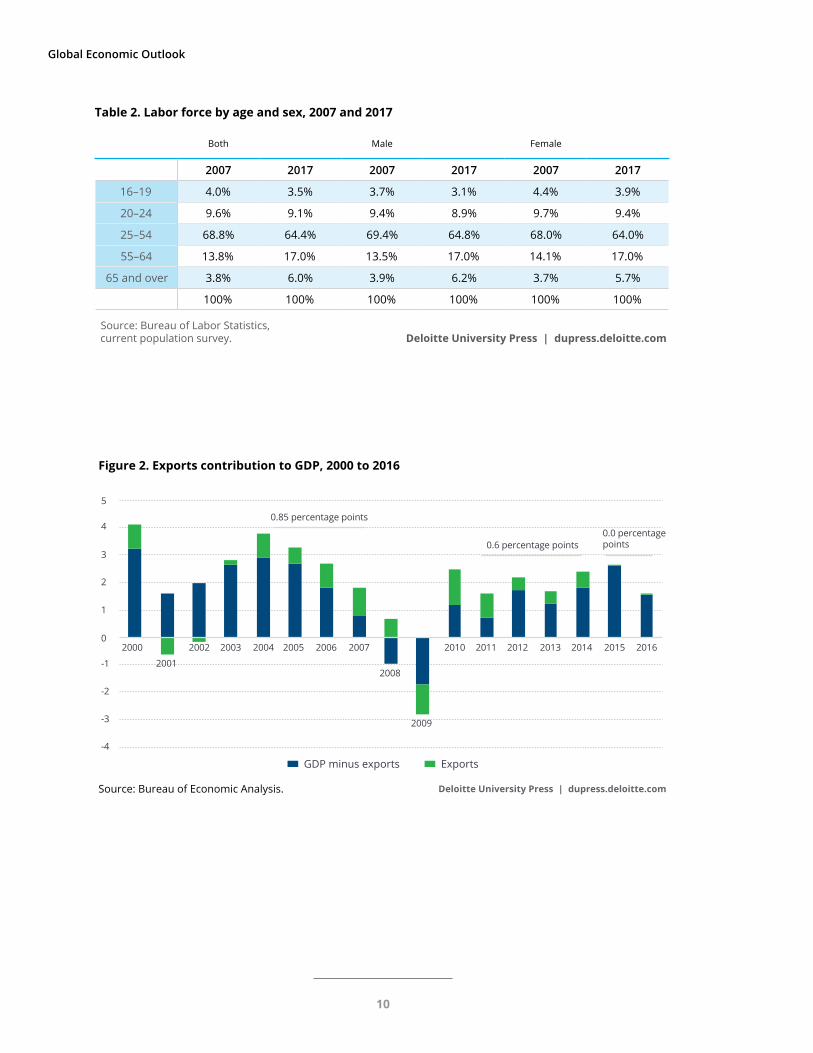
The net result of these shifts in participation and changes in the underlying age demographics of the US economy is a workforce that is older. Currently, 17.0 percent of those employed are between the ages of 55 and 64, up from 13.8 percent just 20 years ago;
9
Global Economic Outlook
Table 2. Labor force by age and sex, 2007 and 2017
Both Male Female
2007 2017 2007 2017 2007 2017
16–19 4.0% 3.5% 3.7% 3.1% 4.4% 3.9%
20–24 9.6% 9.1% 9.4% 8.9% 9.7% 9.4%
25–54 68.8% 64.4% 69.4% 64.8% 68.0% 64.0%
55–64 13.8% 17.0% 13.5% 17.0% 14.1% 17.0%
65 and over 3.8% 6.0% 3.9% 6.2% 3.7% 5.7%
100% 100% 100% 100% 100% 100%
Source: Bureau of Labor Statistics, current population survey. Deloitte University Press | dupress.deloitte.com
Deloitte University Press | dupress.deloitte.comSource: Bureau of Economic Analysis.
GDP minus exports Exports
2000
2001
2002 2003 2004 2005 2006
0.85 percentage points
0.6 percentage points0.0 percentagepoints
2007
2008
2009
2010 2011 2012 2013 2014 2015 20160
-1
1
2
3
4
5
-2
-3
-4
Figure 2. Exports contribution to GDP, 2000 to 2016
10
United States
Deloitte University Press | dupress.deloitte.com
Source: International Monetary Fund, World Economic Outlook database, April 2017.
2000
2001
2002
2003
2004
2005
2006
2007
2008
2009
2010
2011
2012
2013
2014
2015
2016
2017
2018
Actual Estimated
Percentage change
0
-1
1
2
3
4
5
6
Figure 3. World GDP growth
and 6.0 percent are age 65 and older, up from 3.8 percent over the same period (table 2). These differ-ences are similar across the sexes and are projected to increase in the future.8
Missing growth factor: ExportsAn outcome of the lower labor force participation of the 25- to 54-year-old cohort, in particular, is likely to be slower growth in personal consumption expenditure. The extra investment that the younger two groups are making in education will provide some offset, but an aging population with reduced retirement income expectations will definitely cre-ate a headwind going forward. So where might the United States look for growth? One possibility is exports.
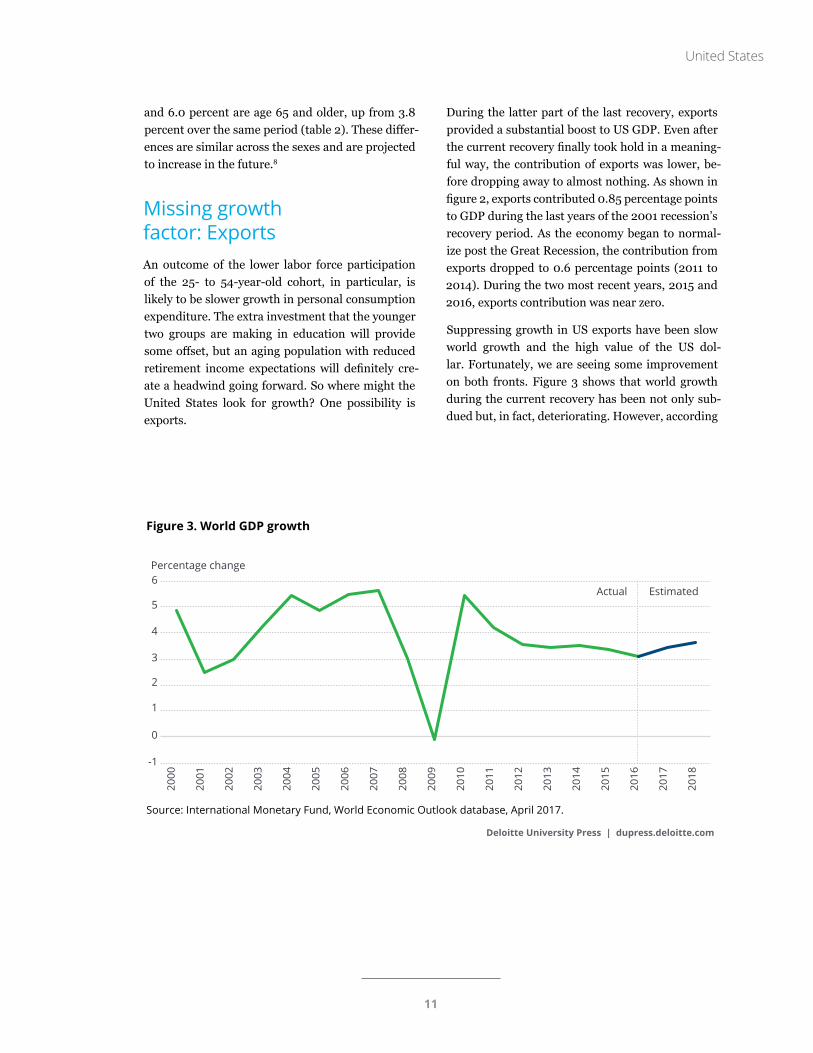
During the latter part of the last recovery, exports provided a substantial boost to US GDP. Even after the current recovery finally took hold in a meaning-ful way, the contribution of exports was lower, be-fore dropping away to almost nothing. As shown in figure 2, exports contributed 0.85 percentage points to GDP during the last years of the 2001 recession’s recovery period. As the economy began to normal-ize post the Great Recession, the contribution from exports dropped to 0.6 percentage points (2011 to 2014). During the two most recent years, 2015 and 2016, exports contribution was near zero.
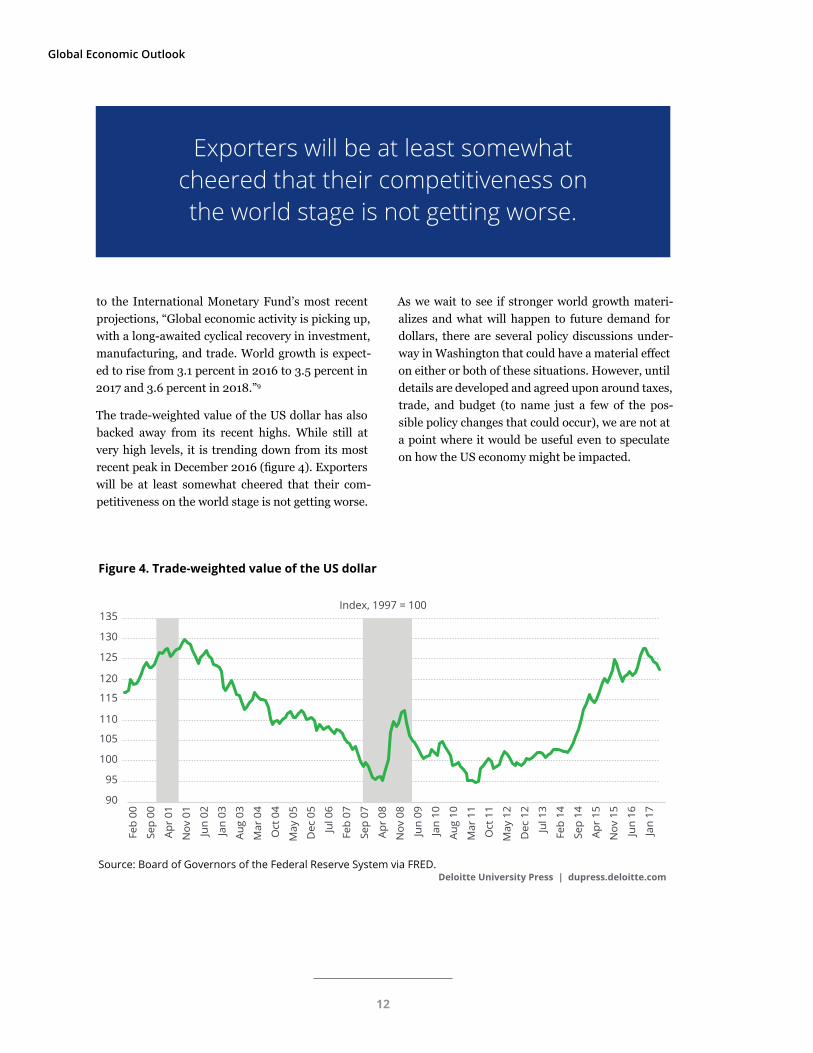
Suppressing growth in US exports have been slow world growth and the high value of the US dol-lar. Fortunately, we are seeing some improvement on both fronts. Figure 3 shows that world growth during the current recovery has been not only sub-dued but, in fact, deteriorating. However, according
11
Global Economic Outlook
Exporters will be at least somewhat cheered that their competitiveness on the world stage is not getting worse.
to the International Monetary Fund’s most recent projections, “Global economic activity is picking up, with a long-awaited cyclical recovery in investment, manufacturing, and trade. World growth is expect-ed to rise from 3.1 percent in 2016 to 3.5 percent in 2017 and 3.6 percent in 2018.”9
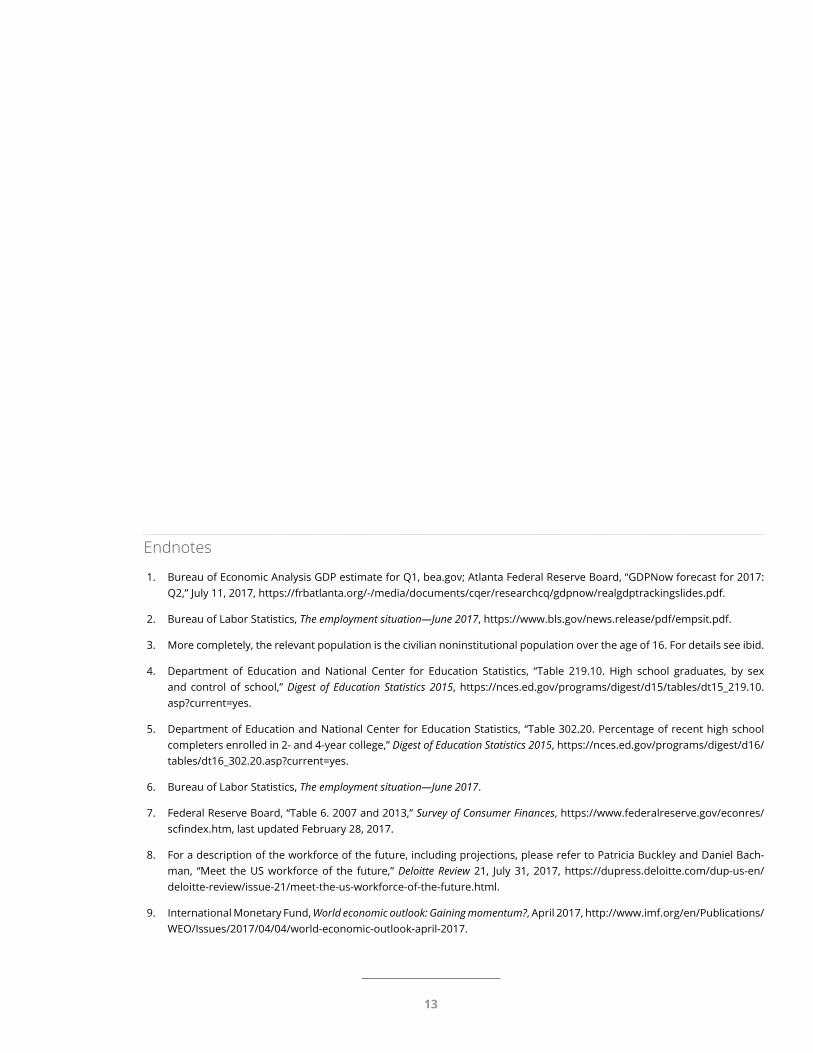
The trade-weighted value of the US dollar has also backed away from its recent highs. While still at very high levels, it is trending down from its most recent peak in December 2016 (figure 4). Exporters will be at least somewhat cheered that their com-petitiveness on the world stage is not getting worse.
As we wait to see if stronger world growth materi-alizes and what will happen to future demand for dollars, there are several policy discussions under-way in Washington that could have a material effect on either or both of these situations. However, until details are developed and agreed upon around taxes, trade, and budget (to name just a few of the pos-sible policy changes that could occur), we are not at a point where it would be useful even to speculate on how the US economy might be impacted.
Deloitte University Press | dupress.deloitte.comSource: Board of Governors of the Federal Reserve System via FRED.
Feb
00
Sep
00
Apr
01
Nov
01
Jun
02
Jan
03
Aug
03
Mar
04
Oct
04
May
05
Dec
05
Jul 0
6
Feb
07
Sep
07
Apr
08
Nov
08
Jun
09
Jan
10
Aug
10
Mar
11
Oct
11
May
12
Dec
12
Jul 1
3
Feb
14
Sep
14
Apr
15
Nov
15
Jun
16
Jan
17
90
95
100
105
110
115
120
125
130
135Index, 1997 = 100
Figure 4. Trade-weighted value of the US dollar
12
Endnotes
1. Bureau of Economic Analysis GDP estimate for Q1, bea.gov; Atlanta Federal Reserve Board, “GDPNow forecast for 2017: Q2,” July 11, 2017, https://frbatlanta.org/-/media/documents/cqer/researchcq/gdpnow/realgdptrackingslides.pdf.
2. Bureau of Labor Statistics, The employment situation—June 2017, https://www.bls.gov/news.release/pdf/empsit.pdf.
3. More completely, the relevant population is the civilian noninstitutional population over the age of 16. For details see ibid.
4. Department of Education and National Center for Education Statistics, “Table 219.10. High school graduates, by sex and control of school,” Digest of Education Statistics 2015, https://nces.ed.gov/programs/digest/d15/tables/dt15_219.10.asp?current=yes.
5. Department of Education and National Center for Education Statistics, “Table 302.20. Percentage of recent high school completers enrolled in 2- and 4-year college,” Digest of Education Statistics 2015, https://nces.ed.gov/programs/digest/d16/tables/dt16_302.20.asp?current=yes.
6. Bureau of Labor Statistics, The employment situation—June 2017.
7. Federal Reserve Board, “Table 6. 2007 and 2013,” Survey of Consumer Finances, https://www.federalreserve.gov/econres/scfindex.htm, last updated February 28, 2017.
8. For a description of the workforce of the future, including projections, please refer to Patricia Buckley and Daniel Bach-man, “Meet the US workforce of the future,” Deloitte Review 21, July 31, 2017, https://dupress.deloitte.com/dup-us-en/deloitte-review/issue-21/meet-the-us-workforce-of-the-future.html.
9. International Monetary Fund, World economic outlook: Gaining momentum?, April 2017, http://www.imf.org/en/Publications/WEO/Issues/2017/04/04/world-economic-outlook-april-2017.
13
Global Economic Outlook
CHINA
Slowly stabilizing By Ira Kalish
Stable growthThe latest economic indicators from China reveal an economy that appears to be stabilizing at a moder-ate rate of economic growth.1 Here are some details:
• Fixed asset investment in the first five months of 2017 was up 8.6 percent from a year earlier, roughly similar to the past year. Prior to 2016, fixed asset investment was growing at a much more rapid pace. In the most recent five months, foreign-funded in-vestment declined 1.3 percent from a year earlier, while domest ic - funded investment was up 9.4 percent. Gov-e r n m e n t - f u n d e d investment fell 10.2 percent from a year earlier.
• Industrial produc-tion in China was up 6.5 percent in May versus a year earlier, the same rate of growth as in the previous month. Output by manufacturers was up 6.9 percent. This is a pretty strong rate of growth and is not consistent with the relatively weak purchasing managers’ indices (PMIs) for the Chinese manu-
facturing sector, published recently. The PMI for May indicated declining activity, while the PMI for June indicated growth, but just barely.
• Chinese retail sales were up 10.7 percent in May versus a year earlier, roughly in line with that re-ported in the past year.
• The value of outstanding loans in China in-creased by 12.9 percent in May versus a year earlier. This was actually a relatively slow rate of growth compared with that of the past several
years. The volume of new credit, both in and out of the banking sys-tem, grew more slowly in May than in recent months. Evidently, there is a deceleration in the growth of credit, reflecting the govern-ment’s concern about a potentially excessive rate of credit expansion in recent years. This, in
turn, is reflected in the slowdown in the growth of the broad money supply. In May, the broad money supply was up 9.6 percent from a year earlier. Moreover, in recent months there was barely any growth at all. Clearly, the central bank has tightened monetary policy in an effort
The pattern in re-cent years has been
alternate tighten-ing and easing of monetary policy.
14

China
15
Global Economic Outlook
to stem the rise in credit. The pattern in recent years, however, has been alternate tightening and easing of monetary policy. The tightening took place when the central bank was concerned about debt, while the easing took place when the central bank was concerned about growth.
• Producer prices were up 5.5 percent in June ver-sus a year earlier. Consumer prices were up only 1.5 percent. Thus consumer-facing businesses likely saw a decline in profit margins. More im-portantly, the low level of consumer price infla-tion suggests that the central bank has plenty of wiggle room should it need to stimulate the economy. The bigger risk for the central bank is that the easing of monetary policy is likely to stimulate more credit market activity, at a time when many analysts are concerned about the high level of debt in the Chinese economy.
• In the first five months of this year, foreign di-rect investment (FDI) into China fell 0.7 per-cent from the same period a year earlier. In May alone, FDI was down 3.7 percent from a year ear-lier. Outbound FDI, which had increased faster than inbound FDI in 2016, has fallen sharply in the first five months of 2017. This partly re-flects government capital controls intended to stifle outflows of capital, which had been putting downward pressure on the currency. Indeed in April, nonfinancial outbound FDI from China was down 71.0 percent from a year earlier. In the long run, this will not be helpful for the global-ization of Chinese companies.
Rising reservesChina’s foreign currency reserves have increased for the fifth consecutive month. In June, reserves rose to their highest level since October, although the increases in the past several months have been very modest. Still, this is a big change from what transpired from early 2014 until early 2017. During that period, reserves declined by about $1 trillion, reflecting the fact that there was a sizable outflow of capital from China, which put downward pressure on the value of the currency. In order to prevent a sharp depreciation of the currency, the central bank massively sold reserves. However, in the past
year, the government imposed new capital controls, meant to prevent outflows of capital. This has evi-dently worked: The currency stabilized, and the cen-tral bank was able to purchase new reserves without worrying about a declining currency. Yet imposing capital controls means postponing the time when China’s capital markets become more fully inte-grated into the global economy. China’s leadership had wanted to move the country’s currency toward being convertible, for it to be seen as an important global currency for trade and wealth preservation. As long as capital controls remain in place, and as long as investors rightly fear the possibility of more controls, the currency will not become a major glob-al player.
Is China’s market status set to change?The chief trade negotiator for the Donald Trump ad-ministration, Robert Lighthizer, has warned against a potential decision by the World Trade Organiza-tion (WTO) to label China a market economy.2 Such a decision would make it more difficult for other countries to seek damages from China based on un-fair trade practices. The decision would presumably be based on the determination that most product prices in China are based on market conditions and that government interference in markets is minimal. China has been lobbying for such a change, but the United States strongly disagrees. Lighthizer said, “I have made it very clear that a bad decision with re-spect to the non-market economy status of China would be cataclysmic for the WTO.” This was inter-preted as a suggestion that the United States might exit the WTO. Although Trump has eased public pressure on China with respect to trade follow-ing his meeting with China’s President Xi Jinping, Lighthizer says that serious issues between the two countries remain. He noted that the US trade defi-cit with China “still hasn’t come down.” Of course it would be unrealistic to expect it to decline in just a few months. Moreover, a bilateral trade imbalance between two countries is not necessarily of econom-ic significance. Nor does a trade deficit reflect trade rules. Rather, it is arithmetically due to a country investing more than it saves.
16
Sovereign risk ratingRatings agency Moody’s has downgraded some of China’s sovereign debt, the first such action in al-most 30 years.3 Moody’s pointed to slower econom-ic growth and rising debt as a potentially dangerous combination that could increase the probability of default. The agency said that “the downgrade reflects Moody’s expectation that China’s financial strength will erode somewhat over the coming years, with economy-wide debt continuing to rise as potential growth slows.” However, the Chinese government took umbrage at this action, saying “Moody’s views that China’s nonfinancial debt will rise rapidly and the government would continue to maintain growth via stimulus measures are exaggerating difficulties facing the Chinese economy, and underestimating the Chinese government’s ability to deepen supply-side structural reform and appropriately expand ag-gregate demand.” Moody’s, however, acknowledged that China is engaged in a reform process. Still, it said that “while ongoing progress on reforms is like-ly to transform the economy and financial system over time, it is not likely to prevent a further mate-rial rise in economy-wide debt, and the consequent increase in contingent liabilities for the govern-ment.” Moody’s also said that, because of continued outflows of capital and the resulting depreciation
in the currency, the Chinese central bank will be constrained in its ability to provide easier monetary policy. Indeed if, to stem outflows, the central bank were to tighten monetary policy, it could exacerbate difficulties in servicing debts.
Following the announcement of the downgrade, the Chinese currency briefly fell in value before re-bounding. Likewise, yields on Chinese government bonds initially rose before falling back. The muted reaction to the ratings change reflects the fact that domestic investors in China rarely pay much at-tention to foreign ratings, as most sovereign debt in China is sold to domestic investors. In addition, Moody’s conclusions about the risk from rising debt hardly represents new information for investors. The problem of debt has been well publicized. No-tably, the problem is not central government debt, which remains at a modest level of less than 40 per-cent of GDP. Rather, Moody’s is concerned about the off-budget special purpose vehicles established by local governments to provide funding for infra-structure investment. Moody’s is also concerned about the rising debt of state-owned enterprises, which are seen as quasi-sovereign and potentially creating a liability for the government. Neverthe-less, many observers have expressed concern about China’s debts, which could remain a key issue for China in the coming years.
Endnotes
1. Unless specified otherwise, all data have been taken from National Bureau of Statistics of China, “Consumer prices for May 2017,” http://www.stats.gov.cn/english/.
2. Shawn Donnan, “Trump trade tsar warns against China ‘market economy’ status,” Financial Times, June 22, 2017, https://www.ft.com/content/4d6ba03e-56b0-11e7-9fed-c19e2700005f?mhq5j=e1.
3. Moody’s Investors Service, “Moody’s downgrades China’s rating to A1 from Aa3 and changes outlook to stable from negative,” May 24, 2017, https://www.moodys.com/research/Moodys-downgrades-Chinas-rating-to-A1-from-Aa3-and-changes--PR_366139.
Moody’s pointed to slower economic growth and rising debt as a potentially dangerous combina-tion that could increase the probability of default.
China
17
Global Economic Outlook
EUROZONE
Summer-blue skies for the economyBy Alexander Börsch
IntroductionSpring and summer 2017 brought good news for the Eurozone. Tensions in the political risk landscape have decreased, and populist parties underper-formed in relation to expectations in the key Euro-zone countries of the Netherlands and France. In particular, the election of a decidedly pro-EU presi-dent in France has eased fears about a fragmenta-tion of the Eurozone.
At the same time and partly as a consequence, the recovery is developing stronger than many analysts believed only a few months ago. Growth forecasts were revised upward, and employment increased by 1.2 million in the last two quarters. Nevertheless, political risks are here to stay. Forthcoming elec-tions in Austria and potentially in Italy will be a new
test of Europe’s political stability. Meanwhile, the Brexit negotiations that started on June 19 will be a source of uncertainty as long as a clear direction is not discernable.
Characteristics of the recoveryThe recovery in the Eurozone has been ongoing since 2013 but has remained feeble until 2016. Since then, the pace has picked up, especially since last winter. GDP growth in the first quarter increased to 0.6 percent, more than double the US growth in the same period.
From a country perspective, Spain is experiencing the most dynamic recovery among the major Euro-
Spain is experiencing the most dynamic recov-ery among the major Eurozone countries.
18

Eurozone
19
Global Economic Outlook
zone countries. After growing at slightly more than 3 percent in 2015 and 2016, growth accelerated slightly in the first quarter of 2017. Currently, the main drivers of growth are private demand and cor-porate investments; exports were the main driver in the early phases of the recovery. Unemployment has fallen from 25.0 percent to a still-high 18.0 percent. The booming tourism industry, which has recorded more than 20 million tourists over the last six years, has played a substantial role in the improved labor market outlook, as has the export industry.1
The economic situation in Germany continues to be rosy. The Ifo economic climate index reached its highest value in 26 years in June, while the unem-ployment rate was the lowest during the same period. The economy grew 0.6 percent in the first quarter of 2017, and analysts expect a similar growth rate for the second quarter. The recovery in Germany has been driven especially by private consumption in the wake of low energy prices, a tight labor market, a booming real estate sector, and increasing dispos-able income. Growth contributions from exports have been modest due to rising imports, and corpo-rate investments have developed very weakly. Sup-ported by an improvement in industrial sentiment
since the beginning of the year, capacity utilization in the German industry has now markedly moved past its long-term average and is currently at a nine-year high, suggesting a need for new investment.2
The pace of economic recovery in Italy and France has been moderate so far, but it is gaining momen-tum. While both countries grew at around 0.2 per-cent quarterly between 2014 and 2016, the growth rate in the first three months of 2017 amounted to 0.4 percent. Unemployment in France fell from 10.5 to 9.5 percent in the last two years, and in Italy from 13.0 percent to 11.1 percent. The Italian economy is held back by problems in the banking sector, which are curbing credit growth.3
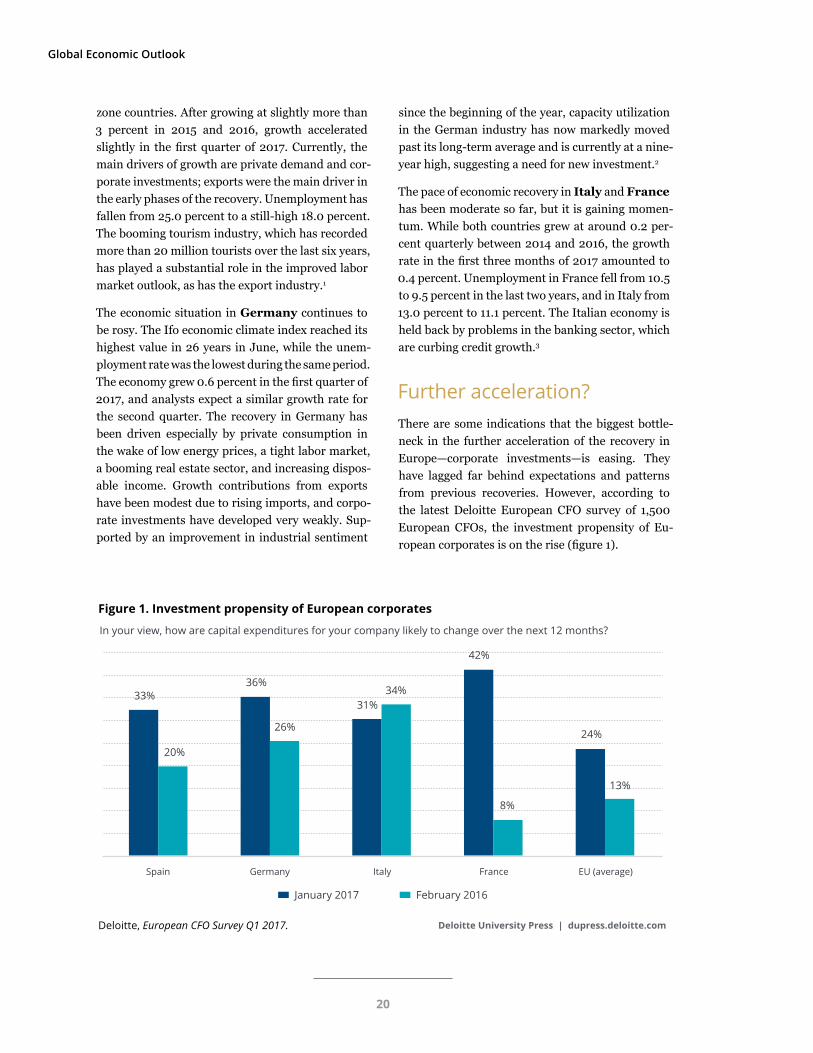
Further acceleration?There are some indications that the biggest bottle-neck in the further acceleration of the recovery in Europe—corporate investments—is easing. They have lagged far behind expectations and patterns from previous recoveries. However, according to the latest Deloitte European CFO survey of 1,500 European CFOs, the investment propensity of Eu-ropean corporates is on the rise (figure 1).
Deloitte University Press | dupress.deloitte.comDeloitte, European CFO Survey Q1 2017.
In your view, how are capital expenditures for your company likely to change over the next 12 months?
33%36%
34%
8%
13%
42%
24%
31%
20%
26%
January 2017 February 2016
Spain Germany Italy France EU (average)
Figure 1. Investment propensity of European corporates
20
Overall investment propensity in Europe has almost doubled since last autumn, with a notable jump among French corporates and significant increases in Germany and Spain. Italy recorded a slight de-cline, but investment intentions remained at a com-paratively high level.
This suggests that the recovery stands increasing-ly on solid ground, becoming broader-based and opening up the possibility that the Eurozone could turn into a pretty robust growth environment.
Political risks: Next roundThe next test of the Eurozone’s stability and the reach of populist parties will be in autumn. Snap elections will take place in Austria in mid-October after the governing coalition of Social Democrats and the conservative People’s Party collapsed. Snap elections in Italy are a possibility but not certain. The next regular voting is set to take place in spring 2018. Earlier, elections in autumn seemed almost certain but hinge on a new electoral law that was not passed at the very last minute in June.
In both countries, populist parties have a fair chance of becoming part of the new government. The Austrian right-wing Freedom Party was nar-rowly defeated in the presidential elections last au-
tumn and is, according to current polls, the second-strongest party. While polls in Italy are in flux and the populist Five Star Movement suffered defeat in recent municipal elections, it is neck and neck with the governing Democratic Party.
Meanwhile, the Brexit negotiations have finally started, while the official two-year negotiation pe-riod had already begun in late March when the Unit-ed Kingdom submitted its letter of intent to leave the European Union. Until the end of the year, the focus will be on the divorce modalities.
Three topics need to be resolved in the first nego-tiation phase from the perspective of the European Union, before future relationship modalities can be dealt with: the rights of EU citizens residing in the United Kingdom and vice versa, the border between the Republic of Ireland and Northern Ireland, and the financial obligations of the United Kingdom. The last point, especially, provides ample room for conflict and disagreement, and holds the biggest risk that no consensus can be reached.
The political uncertainties surrounding Brexit and the rise of populist parties will undoubtedly shape economic growth prospects in the medium term. In the short run, the recovery in the Eurozone is very likely to continue, given that it stands on a more solid footing.
Eurozone
The next test of the Eurozone’s stability and the reach of populist parties will be in autumn.
Endnotes
1. CESifo Group Munich, “Ifo economic forecast for 2017/2018: Germany’s economy is strong and stable,” June 20, 2017, http://www.cesifo-group.de/ifoHome/facts/Forecasts/Ifo-Economic-Forecast/Archiv/ifo-Prognose-20-06-2017.html.
2. KfW Research, “Germany’s economy in 2017/2018: Like a long-distance runner,” May 23, 2017, https://www.kfw.de/KfW-Group/Service/Download-Center/Research-(EN)/KfW-business-cycle-compass/.
3. CESifo Group Munich, “Ifo economic forecast for 2017/2018.”
21
Global Economic Outlook
INDIA
Wiggling through demonetization and GST By Rumki Majumdar
IntroductionIndia’s economic growth seems to be losing steam, as the economy posted weaker-than-expected growth in the fourth quarter of FY 2016–17. According to the latest data on economic activity, GDP grew at an annual rate of 7.1 percent, almost 1.0 percent lower than the previous fiscal year.1 While one might as-sume that there is nothing surprising about the slowdown and that demonetization is to be blamed for the economy’s poor performance, a deeper dive shows that the economy had started slowing even before demonetization was announced. Post de-monetization, the slowdown further intensified, specifically in the fourth quarter of FY 2016–17 as the economy struggled to cope with the cash crunch.
Even as the impact of demonetization gradually phases out, the outlook remains mired in uncer-tainty for the next few quarters because of the fiscal tightening at the center, the base effect of agricul-tural growth, stressed assets in the banking sector, and global risks emanating from rising protection-ism. In addition, there are concerns that growth and inflation might be impacted in the coming quarters as the economy transitions to a new national sales tax regime—the goods and sales tax (GST) that went live on July 1, 2017.
That raises questions about the sustainability of the strong economic performance India has been boast-ing about. Will these impact the long-term growth outlook and optimism about India?
Growth slowly lost steam through FY 2016GDP growth fell from an annual rate of 8.0 per-cent in FY 2015–16 to 7.6 percent in the first half of FY 2016–17. It might seem a marginal decline, but much of this growth was masked by very strong agriculture and government spending in the period prior to demonetization. Growth net of these two sectors depicts a very different picture.
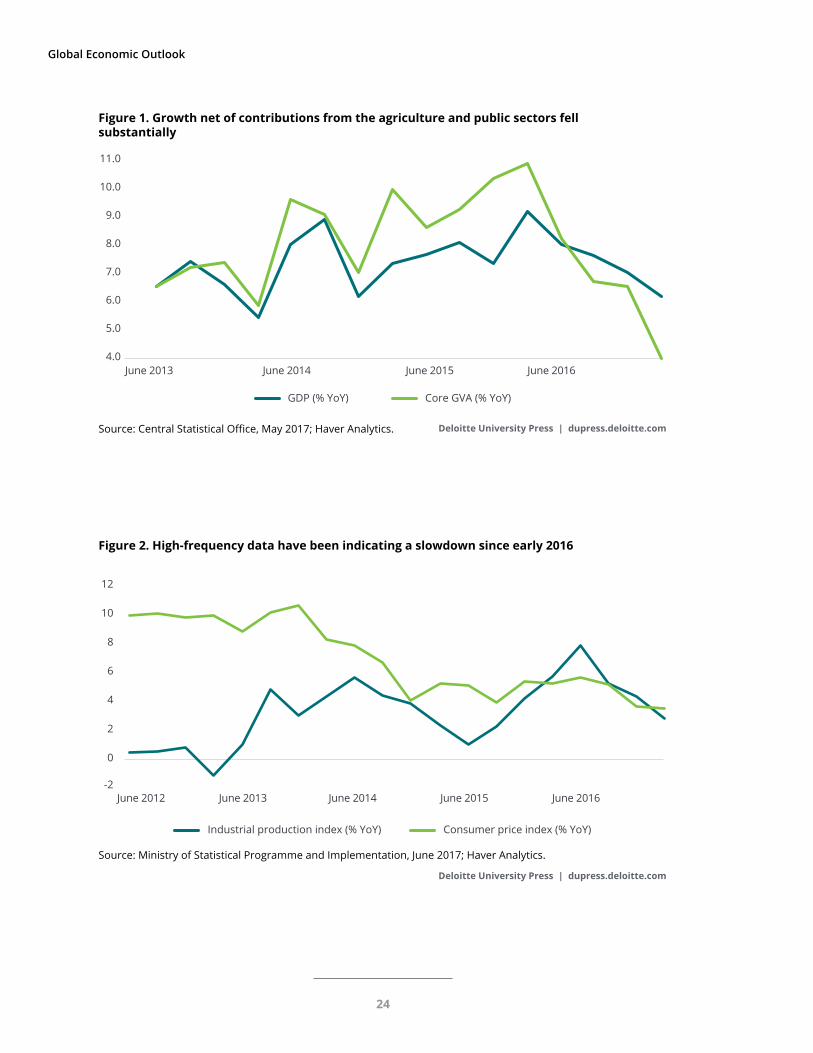
Gross value added (GVA) growth on the supply side net of contributions from the agriculture and public sectors (referred to as core GVA) fell from 9.8 per-cent in FY 2015–16 to 8.1 percent and 6.6 percent in the first two quarters of FY 2016–17, respectively. In other words, growth was evidently slowing even be-fore demonetization. The slowdown further intensi-fied in the second half of FY 2016–17, and core GVA grew 3.9 percent in Q4 FY 2016–17—the lowest growth rate recorded since 2009 (figure 1). While one may attribute the poor economic performance in the second half of the year to demonetization, it is
22

India
While one might assume that demonetization is to be blamed for the economy’s poor performance, a deeper dive shows that the economy had started
slowing even before demonetization was announced.
23
Global Economic Outlook
Deloitte University Press | dupress.deloitte.com
Source: Ministry of Statistical Programme and Implementation, June 2017; Haver Analytics.
Industrial production index (% YoY) Consumer price index (% YoY)
June 2012 June 2013 June 2014 June 2015 June 2016
0
2
-2
4
6
8
10
12
Figure 2. High-frequency data have been indicating a slowdown since early 2016
Deloitte University Press | dupress.deloitte.comSource: Central Statistical Office, May 2017; Haver Analytics.
GDP (% YoY) Core GVA (% YoY)
June 2013 June 2014 June 2015 June 20164.0
5.0
6.0
7.0
8.0
9.0
10.0
11.0
Figure 1. Growth net of contributions from the agriculture and public sectors fell substantially
24
difficult to discern how much of the slowdown was exclusively because of it.
What is noticeable from the latest data release is that finally there is some parallel between the GDP growth story and the narrative from the past year’s high-frequency economic activity. The new indus-trial production series had been signaling a slow-down in economic activity since early 2016. On the other hand, low inflation suggested that weaker (rural) demand and a negative output gap (the ac-tual output being lower than the potential output), among other factors, were likely resulting in a poor pricing power in the economy (figure 2). However, this slowdown was not apparent from the GDP data until the latest numbers were released in May.
Looking forward, a pickup in demand will likely depend on the impact of fiscal consolidation, re-moval of infrastructure bottlenecks, and the pace of revival of private investment and the banking sector. It might take some time for demand to im-prove as the impact of demonetization on consumer spending and investment wears off completely. The implementation of the GST might impact activity as businesses cope with the new tax structure. There are upside risks to inflation as food and commod-ity prices are expected to remain low. However, only the inflation data in the coming quarters can reveal a clearer picture.
The landmark tax reform
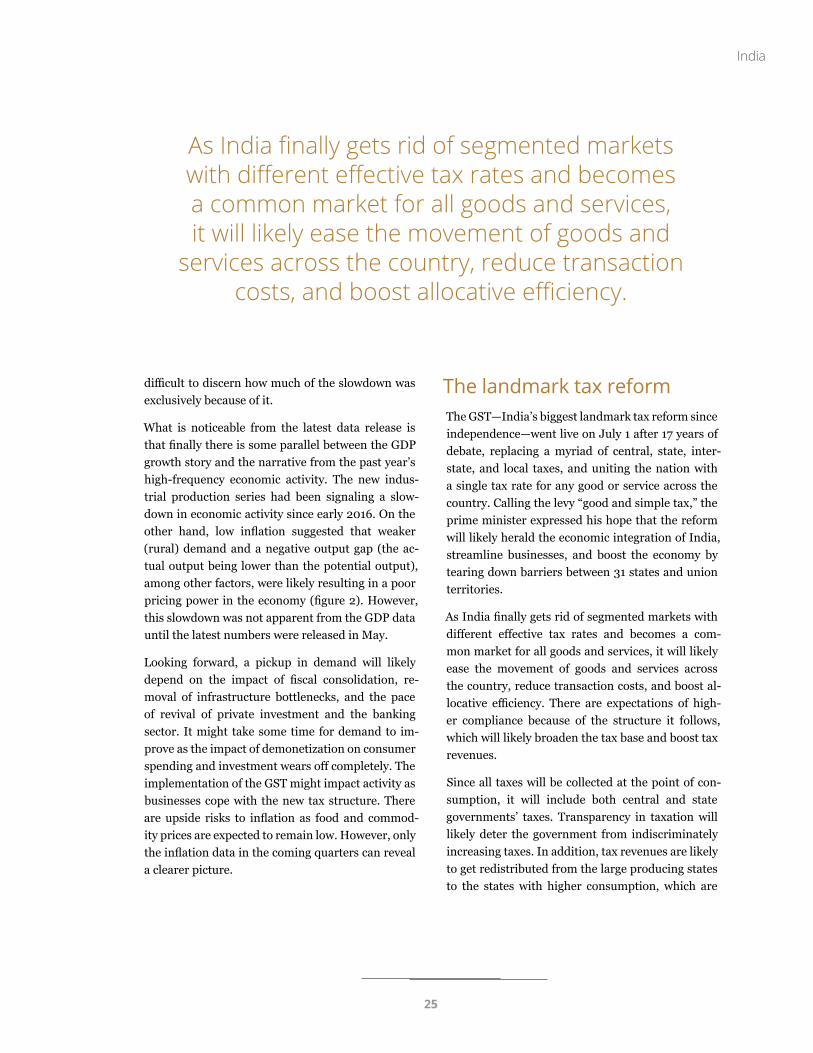
The GST—India’s biggest landmark tax reform since independence—went live on July 1 after 17 years of debate, replacing a myriad of central, state, inter-state, and local taxes, and uniting the nation with a single tax rate for any good or service across the country. Calling the levy “good and simple tax,” the prime minister expressed his hope that the reform will likely herald the economic integration of India, streamline businesses, and boost the economy by tearing down barriers between 31 states and union territories.
As India finally gets rid of segmented markets with different effective tax rates and becomes a com-mon market for all goods and services, it will likely ease the movement of goods and services across the country, reduce transaction costs, and boost al-locative efficiency. There are expectations of high-er compliance because of the structure it follows, which will likely broaden the tax base and boost tax revenues.
Since all taxes will be collected at the point of con-sumption, it will include both central and state governments’ taxes. Transparency in taxation will likely deter the government from indiscriminately increasing taxes. In addition, tax revenues are likely to get redistributed from the large producing states to the states with higher consumption, which are
India
As India finally gets rid of segmented markets with different effective tax rates and becomes a common market for all goods and services, it will likely ease the movement of goods and
services across the country, reduce transaction costs, and boost allocative efficiency.
25
Global Economic Outlook
also the states with higher population and low per capita income, and which therefore are expected to benefit from such a redistribution of taxes.
That said, when a change of this magnitude is un-dertaken, there are bound to be some teething troubles and difficulties in the initial stages. Al-though large-scale businesses are ready for the new tax regime, medium- to small-scale industries are likely to take time to adjust to the new structure. The transition to the GST system may disrupt some businesses’ production plans, and require them to reduce existing inventory and modify their supply chain based on the assessment of tax savings and in-ventory management costs. This could impact eco-nomic activity temporarily as the economy adjusts to a new normal.
The impact of this transition to a national sales tax on inflation and growth remains uncertain. First, it was hoped that the new tax structure would be sim-ple, with a maximum of three tax rates as had been recommended by the Arvind Subramanian commit-tee. However, the current GST has a five-rate struc-ture, plus a potential tax on luxury and “sin” goods.2
This might result in potential disputes over the clas-sification of goods and lead to corruption, thereby reducing ease of monitoring, increasing tax authori-ties’ discretion, and partially offsetting the compli-ance and efficiency gains of a simpler structure.
Products of mass consumption have been exempted, while those consumed by the rich are charged at a higher percentage, which might not impact inflation significantly. However, the average burden of tax on
26
India
Deloitte University Press | dupress.deloitte.comSource: The Reserve Bank of India.
FPI (USD million) FDI (USD million, left axis)
Jan 2016 Jul 2016 Jan 2017
0
2,000
4,000
6,000
8,000
10,000
-8,000
-6,000
-4,000
-2,000
3,000
4,000
5,000
6,000
7,000
0
1,000
2,000
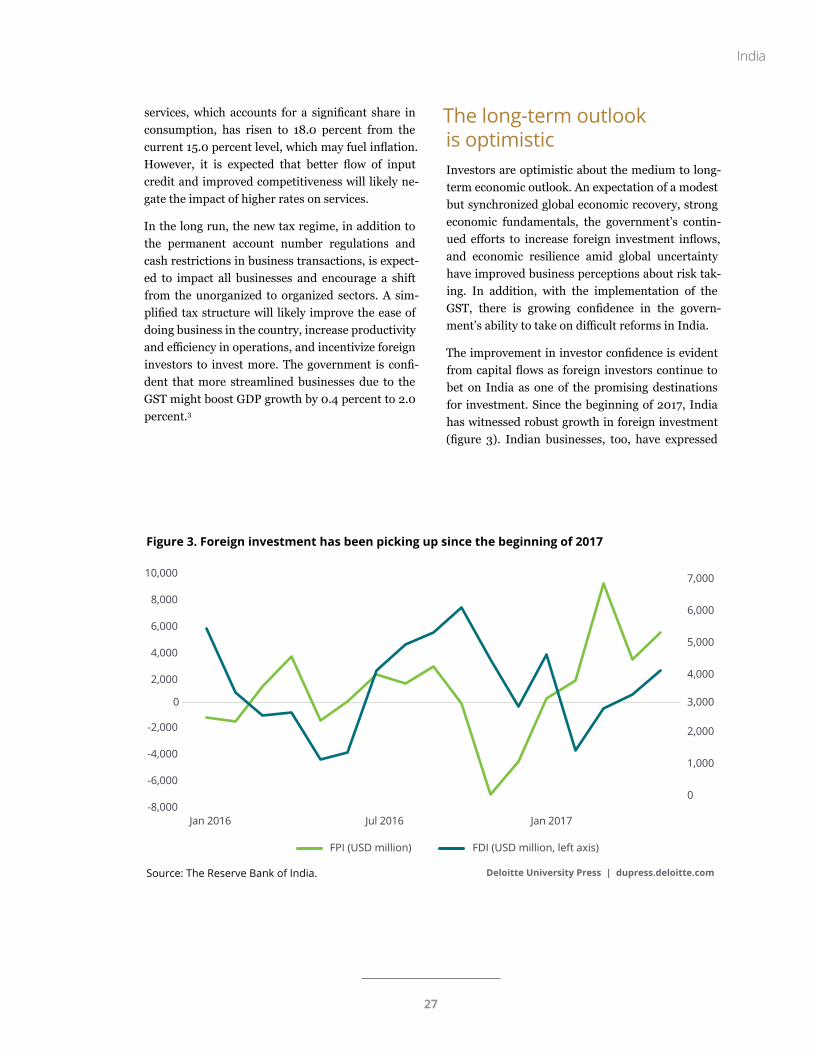
Figure 3. Foreign investment has been picking up since the beginning of 2017
services, which accounts for a significant share in consumption, has risen to 18.0 percent from the current 15.0 percent level, which may fuel inflation. However, it is expected that better flow of input credit and improved competitiveness will likely ne-gate the impact of higher rates on services.
In the long run, the new tax regime, in addition to the permanent account number regulations and cash restrictions in business transactions, is expect-ed to impact all businesses and encourage a shift from the unorganized to organized sectors. A sim-plified tax structure will likely improve the ease of doing business in the country, increase productivity and efficiency in operations, and incentivize foreign investors to invest more. The government is confi-dent that more streamlined businesses due to the GST might boost GDP growth by 0.4 percent to 2.0 percent.3
The long-term outlook is optimistic
Investors are optimistic about the medium to long-term economic outlook. An expectation of a modest but synchronized global economic recovery, strong economic fundamentals, the government’s contin-ued efforts to increase foreign investment inflows, and economic resilience amid global uncertainty have improved business perceptions about risk tak-ing. In addition, with the implementation of the GST, there is growing confidence in the govern-ment’s ability to take on difficult reforms in India.
The improvement in investor confidence is evident from capital flows as foreign investors continue to bet on India as one of the promising destinations for investment. Since the beginning of 2017, India has witnessed robust growth in foreign investment (figure 3). Indian businesses, too, have expressed
27
Global Economic Outlook
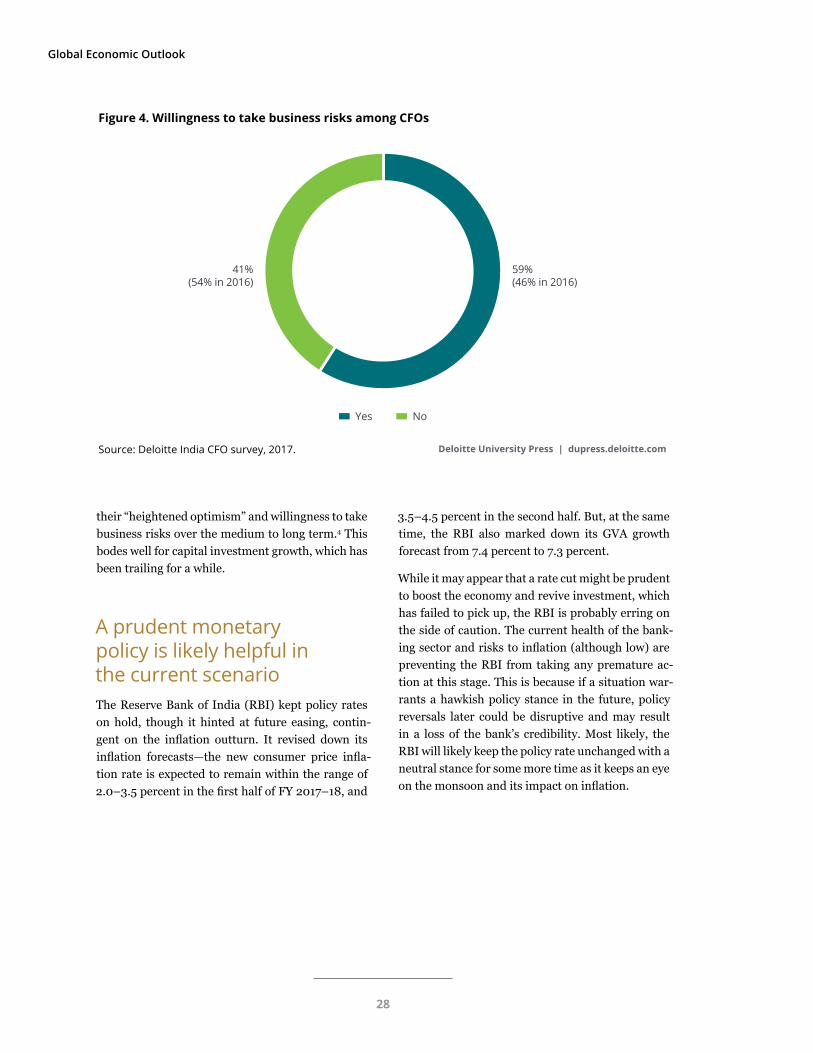
their “heightened optimism” and willingness to take business risks over the medium to long term.4 This bodes well for capital investment growth, which has been trailing for a while.
A prudent monetary policy is likely helpful in the current scenario
The Reserve Bank of India (RBI) kept policy rates on hold, though it hinted at future easing, contin-gent on the inflation outturn. It revised down its inflation forecasts—the new consumer price infla-tion rate is expected to remain within the range of 2.0–3.5 percent in the first half of FY 2017–18, and
3.5–4.5 percent in the second half. But, at the same time, the RBI also marked down its GVA growth forecast from 7.4 percent to 7.3 percent.
While it may appear that a rate cut might be prudent to boost the economy and revive investment, which has failed to pick up, the RBI is probably erring on the side of caution. The current health of the bank-ing sector and risks to inflation (although low) are preventing the RBI from taking any premature ac-tion at this stage. This is because if a situation war-rants a hawkish policy stance in the future, policy reversals later could be disruptive and may result in a loss of the bank’s credibility. Most likely, the RBI will likely keep the policy rate unchanged with a neutral stance for some more time as it keeps an eye on the monsoon and its impact on inflation.
Deloitte University Press | dupress.deloitte.comSource: Deloitte India CFO survey, 2017.
41%(54% in 2016)
59%(46% in 2016)
Yes No
Figure 4. Willingness to take business risks among CFOs
28

Endnotes
1. Growth rates are measured in year-over-year terms throughout this document, unless otherwise specified.
2. Sin goods include tobacco, paan masala, and aerated drinks, as well as luxury vehicles.
3. “GST comes into force after 17 years of debate,” Economic Times, July 1, 2017, http://economictimes.indiatimes.com/article-show/59394169.cms?utm_source=contentofinterest&utm_medium=text&utm_campaign=cppst.
4. Deloitte’s CFO survey for India was conducted earlier this year.
India
29
Global Economic Outlook
JAPAN
An accelerating economy, though not quite at breakneck speed By Ira Kalish
ReboundWhile it would be an exaggeration to say that Ja-pan’s economy is on fire, it is safe to say that it is doing unusually well. The Japanese economy ap-pears to be turning a corner, accelerating to a more robust rate of expansion. Of course, given its declin-ing population, it cannot be expected that Japan will ever again return to breakneck growth. Still, on a per capita basis, it is doing well. There are a number of indicators that point to progress:
• Industrial production was up 6.8 percent in May versus a year earlier, the fastest rate of growth since 2014. Moreover, the overall level of output is now the highest since 2008. The strength of industrial output has been driven by strong de-mand for Japanese exports. This is one of the several indicators that the economy is finally stabilizing at a decent rate of growth. Still, head-winds remain, including poor demographics, in-adequate Japanese fiscal and regulatory policies, and potential US protectionist policies.1
• Japanese exports grew strongly in May, although more slowly than some analysts had expected.
Exports were up 14.9 percent versus a year earli-er. In particular, exports were up 23.9 percent to China, 22.9 percent to South Korea, and 12.7 per-cent to North America. The strength of exports reflects the impact of a weak Japanese yen as well as accelerating global demand. Meanwhile, imports grew faster at 17.8 percent, reflecting an improvement in domestic demand as well as strong growth by manufacturers that needed components for their exportable products.
• Retail sales in Japan grew 2.0 percent in May from a year earlier. This follows exceptionally strong growth in April, the fastest rate of growth in two years. Moreover, strong growth two years ago was artificially inflated by the rise in the national sales tax. Excluding that episode, re-tail sales are now rising at the fastest pace since 2012. The strength of retail sales is due to strong growth of spending at department stores and supermarkets. On the other hand, overall house-hold spending grew modestly in May, up 0.7 percent from a year earlier. This was likely due to weakness in the growth of household income. In real (inflation-adjusted) terms, household
30

The Japanese economy appears to be turning a corner, accelerating to a more robust rate of expansion.
Japan
31
Global Economic Outlook
spending was actually down from a year earlier. Thus the consumer sector of the Japanese econ-omy remains uncertain.
• Japan’s labor market appears to be strong. The unemployment rate rose to 3.1 percent in May after hovering around 2.8 percent in the pre-vious two months. Still, this is a relatively low rate. Unemployment has been falling rapidly and steadily since it peaked at 5.5 percent dur-ing the global recession of 2009. Moreover, the tightness of the market is indicated by the fact that the ratio of job openings to job applicants is now 1.49, almost the highest level since 1974. This suggests a significant shortage of labor.
The tightness in the labor market is not only due to strong demand for work-ers, but also reflects a declin-ing supply of workers. The working-age population is declining by about 700,000 people each year. Normally, one would expect that such a situation would generate considerable wage pressure, thereby boosting inflation. This is not happening, and it is not entirely clear why not.
Several explanations have been offered. First, an ex-tended period of low infla-tion has trained businesses to offer modest pay increases. Old habits die hard. Second, many workers prefer to stay with one employer for a lifetime. As such, they are relatively immune to offers of higher pay from other employers. Third, some employers may prefer to invest in labor-sav-ing technology rather than boost wages, especially if the available pool of labor lacks the skills needed. Fourth, there is an increasing number of women entering the workforce, thus removing some of the pressure on wages. Finally, the job market appears to be tightest in Tokyo, where the ratio of jobs to applicants for full-time work is now especially high. It is rather low in other parts of the country. This suggests a bifurcated job market in Japan.
Monetary policyJapan’s central bank has lately left monetary pol-icy unchanged, reflecting its confidence that the economy is on a favorable path of faster growth and higher inflation—even though core inflation remains at zero. The policy remains highly accom-modative. Meanwhile, the International Monetary Fund (IMF) feels that the policy has been a success. It says that Japan has done enough to boost growth and inflation, and that the current policy of “Abe-nomics” is a “success” and should be continued.2
Recall that Abenomics refers to the policies un-dertaken by Prime Minister Shinzo Abe since he came to power. These include aggressive monetary
policy, fiscal stimulus, and deregulatory reform. Only the monetary policy part of Abenomics has been imple-mented in a significant way. However, the government is likely to engage in more fiscal stimulus in the com-ing year. As for deregulation, the government hoped to use the Trans-Pacific Part-nership (TPP), a free-trade agreement between Japan, the United States, and 10 other Pacific Rim nations, as a political cover for en-gaging in politically difficult reforms. Unfortunately for Abe, US President Donald
Trump cancelled the TPP on his first day in office, despite Abe’s efforts to convince Trump otherwise.
Although the IMF expressed confidence in the cur-rent policy mix, it warned that the government ought not to allow a 2.0-percentage-point increase in the national sales tax, now scheduled to take place in 2019. The last time there was such an in-crease, it caused a temporary setback to economic activity. The IMF suggested that future increases take place more gradually.3 The government is keen to enact a tax increase in order to offset the rising cost of pensions associated with an aging population.
Japan’s govern-ment is eager to be
involved in trade liberalization, partly
to gain more fa-vorable access to foreign markets.
32
DemographicsJapan’s population is declining. In 2016, the indig-enous population fell by 308,000, a record drop. This was partly offset by a 149,000 increase in the foreign resident population—an increase of 7.0 percent. The native-born population is falling be-cause of a very low birth rate, which is not suffi-cient to offset the death rate. Meanwhile, the popu-lation continues to age, with a sharp decline in the working-age population partly offset by a rise in the elderly population.
This situation is creating a number of challenges for Japan. A declining working-age population means slower economic growth, which reduces Japan’s footprint in the global economy. It also means per-sistent excess capacity, which contributes to very low inflation. A combination of low growth and zero inflation has contributed to a very high debt/GDP ratio for the government. The decline in the ratio of workers to retirees means a higher cost of caring for the elderly. This is why the government is keen to ultimately boost the national sales tax, in order to fund pensions and health care for the el-derly. Finally, the population continues to shift to-ward big cities. Tokyo’s population is rising, while that of many small towns is being quickly depleted.
What is the solution? First, more immigration would help—this is evidently taking place, but far more slowly than in most other developed econo-mies. This is a difficult political issue in Japan, one about which politicians barely speak. Second, an increase in the rate of female labor force participa-tion would help, and indeed the government has taken actions to encourage more women to work. Japan’s female participation rate is similar to that of the United States but far lower than that in West-
ern Europe. Finally, faster productivity growth would help. However, this will require more busi-ness investment in new technologies, which might be encouraged if the government relaxes anti-com-petitive regulations in various industries. Freer trade would help as well.
TradeJapan’s government is eager to be involved in trade liberalization, partly to gain more favorable access to foreign markets. Japan and the European Union have just reached an agreement on a free-trade deal, which was announced at the G20 Summit held in July. The deal will eliminate tariffs on 99.0 percent of goods traded between the two economic giants. Companies in each region will have access to public sector procurement in the other region. The deal will mean that European farmers gain ac-cess to the Japanese market, while Japanese auto-makers gain greater access to the EU market. This is hugely significant because the European Union and Japan are two of the four biggest economic players in the world—the others being the United States and China. This comes only months after the United States withdrew from the TPP.
Such agreements will require the dismantling of non-tariff barriers such as onerous regulations. Abe hopes that the requirement to end such barriers will provide his government the political cover needed to implement difficult reforms, including liberaliza-tion of domestic markets. He had hoped that the TPP might provide such an opportunity. The new deal between the European Union and Japan is a way for both sides to sidestep the United States, which increasingly is turning inward in terms of economic relations with the rest of the world.
Japan
Endnotes
1. All statistics in this article are sourced from Statistics Japan, http://www.stat.go.jp/english/, unless otherwise stated.
2. IMF, “Japan: Staff concluding statement of the 2017 Article IV Mission,” June 19, 2017, https://www.imf.org/en/News/Articles/2017/06/19/MS061917-Japan-Staff-Concluding-Statement-of-2017-Article-IV-Mission.
3. Ibid.
33
Global Economic Outlook
UNITED KINGDOM
Growth cools amid growing political uncertaintyBy Ian Stewart
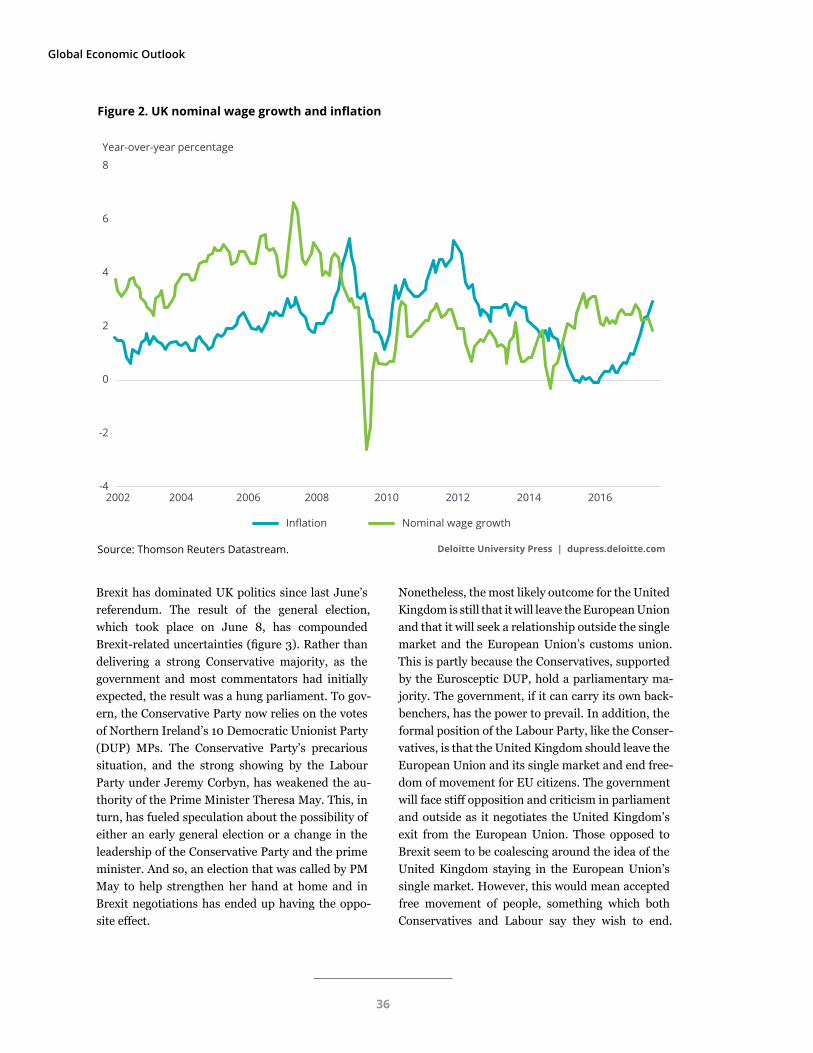
In a world where growth is generally accelerating, and at a marginally faster-than-expected rate, activ-ity in the United Kingdom is softening. The sharp devaluation of the sterling that occurred after the EU referendum in June 2016 has fed through to in-flation and is now squeezing spending power (figure 1). In the first quarter of 2017, the economy grew by just 0.2 percent over the previous quarter, down from 0.7 percent in the final quarter of 2016.1 Hav-ing outperformed activity in the euro area in 2016, the United Kingdom is likely to be overtaken by it in 2017 as the euro area recovery strengthens.
The consumer is, as in most rich economies, the en-gine of growth, and, in the United Kingdom’s case, accounts for about two-thirds of GDP. Consumer activity, which remained resilient in the face of the Brexit vote last year, has softened in recent months
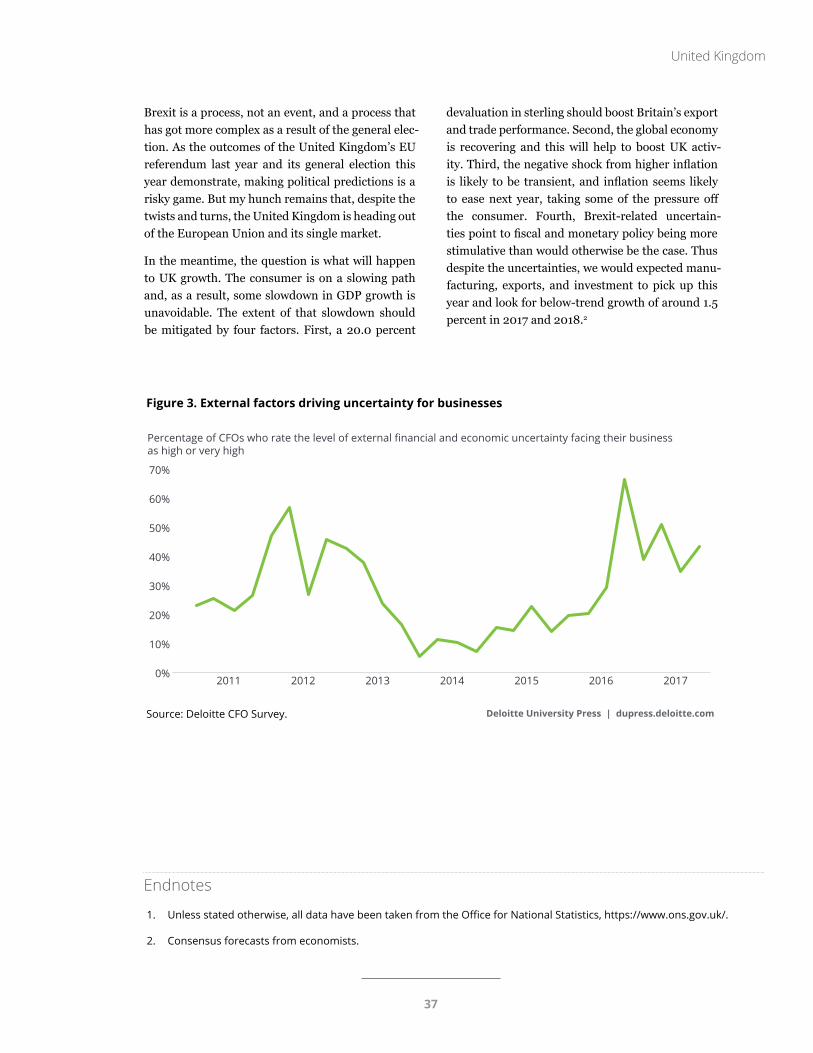
as rising inflation, which reached a four-year high of 2.9 percent in June, has eaten into spending power. With average earnings growing at around 2.0 percent, consumers are facing a decline in their spending power (figure 2). The ability of consum-ers to either borrow or save less to help bolster spending is constrained. After a period of rapid growth in consumer credit, driven particularly by car finance, banks are cutting back on credit lend-ing. Meanwhile the savings ratio—the proportion of disposable income that is saved—has dropped to 1.7 percent, the lowest level in 55 years. While the infla-tion shock shows few signs of becoming embedded, and nominal wage growth remains weak, the prog-nosis is for inflation pressures to ease through next year. But the big picture is of a period of subdued, below-trend growth in consumer spending in 2017 and 2018.
Having outperformed activity in the euro area in 2016, the United Kingdom is likely to be overtaken
by it in 2017 as the euro area recovery strengthens.
34
United Kingdom
Deloitte University Press | dupress.deloitte.comSource: Thomson Reuters Datastream.
1990 1992 1994 1996 1998 2000 2002 2004 2006 2008 2010 2012 2014 201670
75
80
85
90
95
100
105
110
Index
Figure 1. Trade-weighted sterling
35
Global Economic Outlook
Brexit has dominated UK politics since last June’s referendum. The result of the general election, which took place on June 8, has compounded Brexit-related uncertainties (figure 3). Rather than delivering a strong Conservative majority, as the government and most commentators had initially expected, the result was a hung parliament. To gov-ern, the Conservative Party now relies on the votes of Northern Ireland’s 10 Democratic Unionist Party (DUP) MPs. The Conservative Party’s precarious situation, and the strong showing by the Labour Party under Jeremy Corbyn, has weakened the au-thority of the Prime Minister Theresa May. This, in turn, has fueled speculation about the possibility of either an early general election or a change in the leadership of the Conservative Party and the prime minister. And so, an election that was called by PM May to help strengthen her hand at home and in Brexit negotiations has ended up having the oppo-site effect.
Nonetheless, the most likely outcome for the United Kingdom is still that it will leave the European Union and that it will seek a relationship outside the single market and the European Union’s customs union. This is partly because the Conservatives, supported by the Eurosceptic DUP, hold a parliamentary ma-jority. The government, if it can carry its own back-benchers, has the power to prevail. In addition, the formal position of the Labour Party, like the Conser-vatives, is that the United Kingdom should leave the European Union and its single market and end free-dom of movement for EU citizens. The government will face stiff opposition and criticism in parliament and outside as it negotiates the United Kingdom’s exit from the European Union. Those opposed to Brexit seem to be coalescing around the idea of the United Kingdom staying in the European Union’s single market. However, this would mean accepted free movement of people, something which both Conservatives and Labour say they wish to end.
Deloitte University Press | dupress.deloitte.comSource: Thomson Reuters Datastream.
2002 2004 2006 2008 2010 2012 2014 2016
Inflation Nominal wage growth
-4
-2
0
2
4
6
8
Year-over-year percentage
Figure 2. UK nominal wage growth and inflation
36
Deloitte University Press | dupress.deloitte.comSource: Deloitte CFO Survey.
0%2011 2012 2013 2014
Percentage of CFOs who rate the level of external financial and economic uncertainty facing their business as high or very high
2015 2016 2017
10%
20%
30%
40%
50%
60%
70%
Figure 3. External factors driving uncertainty for businesses
Endnotes
1. Unless stated otherwise, all data have been taken from the Office for National Statistics, https://www.ons.gov.uk/.
2. Consensus forecasts from economists.
United Kingdom
Brexit is a process, not an event, and a process that has got more complex as a result of the general elec-tion. As the outcomes of the United Kingdom’s EU referendum last year and its general election this year demonstrate, making political predictions is a risky game. But my hunch remains that, despite the twists and turns, the United Kingdom is heading out of the European Union and its single market.
In the meantime, the question is what will happen to UK growth. The consumer is on a slowing path and, as a result, some slowdown in GDP growth is unavoidable. The extent of that slowdown should be mitigated by four factors. First, a 20.0 percent
devaluation in sterling should boost Britain’s export and trade performance. Second, the global economy is recovering and this will help to boost UK activ-ity. Third, the negative shock from higher inflation is likely to be transient, and inflation seems likely to ease next year, taking some of the pressure off the consumer. Fourth, Brexit-related uncertain-ties point to fiscal and monetary policy being more stimulative than would otherwise be the case. Thus despite the uncertainties, we would expected manu-facturing, exports, and investment to pick up this year and look for below-trend growth of around 1.5 percent in 2017 and 2018.2
37
Global Economic Outlook
RUSSIA
Back to growth, but economic diversification remains a challengeBy Lester Gunnion
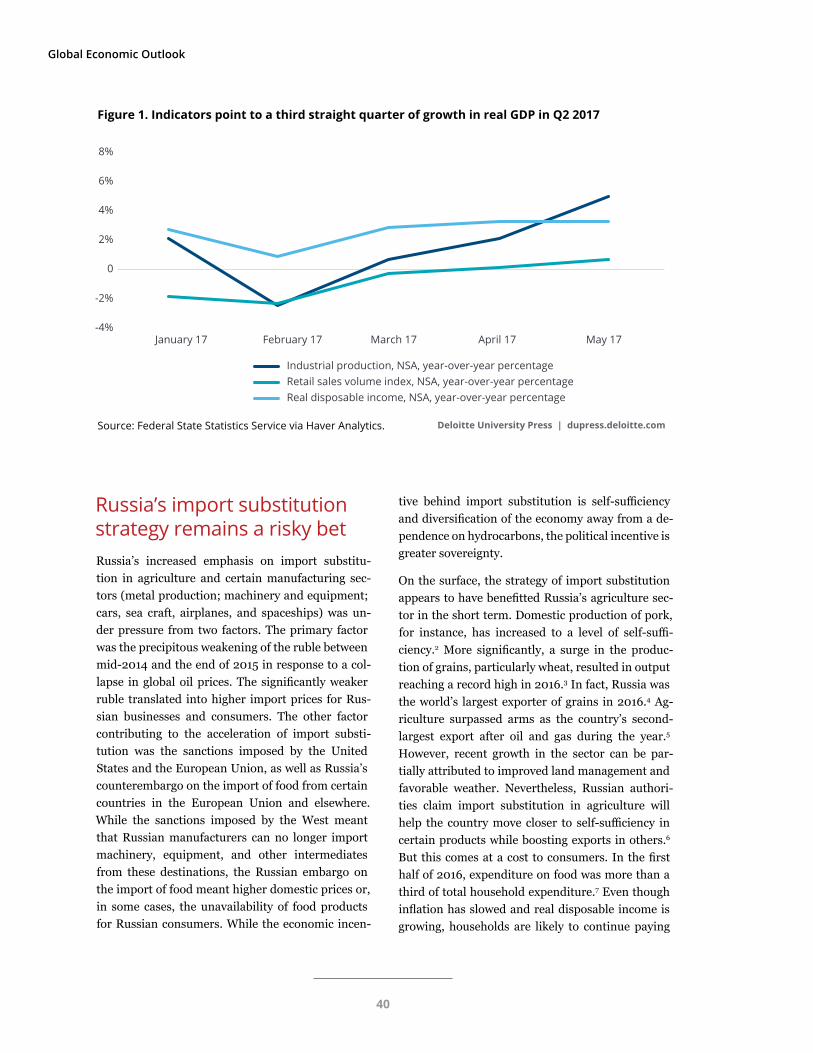
IntroductionThe Russian economy continues to recover. Indi-cators point to a third straight quarter of growth in real GDP in Q2 2017. Industrial production, af-ter dipping in February relative to a year ago, has grown each month through May; real retail sales, after having declined every month relative to a year ago for more than two years, edged up in April and accelerated in May; and real disposable income growth has gathered pace (figure 1).1 A third quar-ter of year-over-year growth is likely to put Russia firmly in the black and set the stage for quicker an-nual growth in 2017.
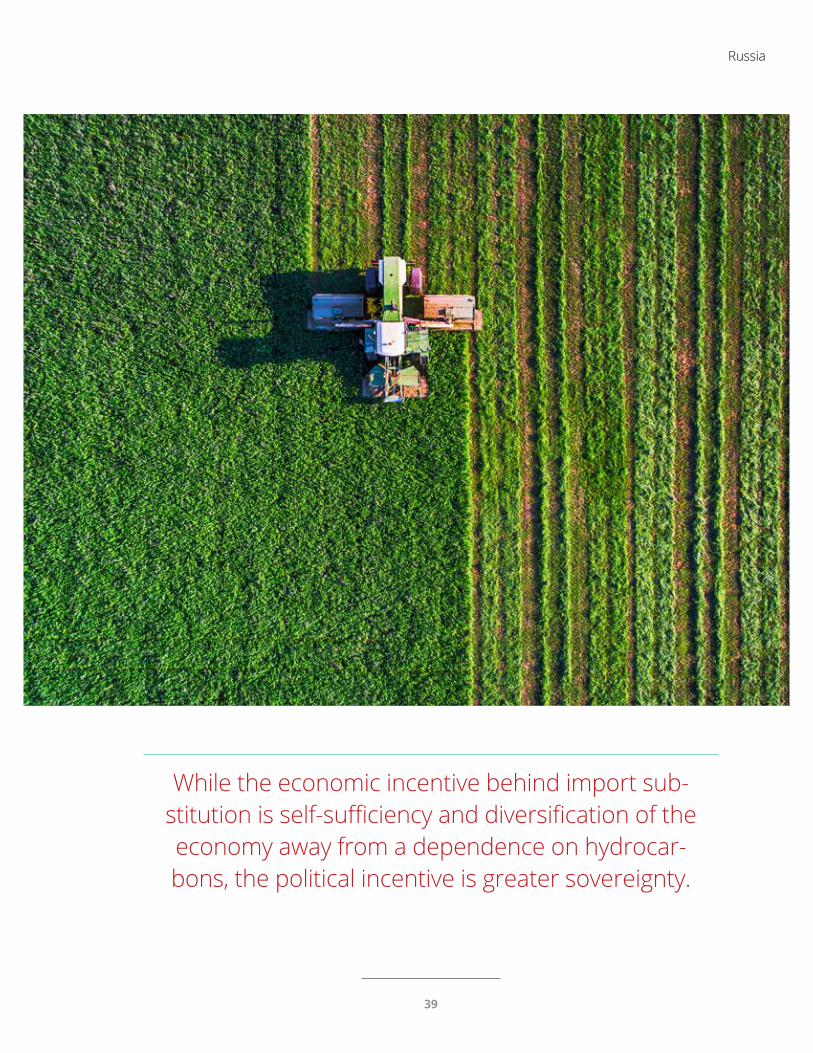
During the last couple of years, one of the policy strategies that Russia accelerated through a combi-nation of a weak Russian ruble, Western sanctions, and a self-imposed embargo on food imports was import substitution. The strategy aims to build self-
sufficiency and diversify the domestic economy by providing purchase and subsidy assistance to cer-tain sectors in order to boost nonhydrocarbon ex-ports. While import substitution appears to have shown short-term benefits in the agriculture sector, its benefits in the manufacturing sector and on the economy as a whole are yet to be proven. The major determinants of the long-term success of this strat-egy, apart from the calculated selection of which sectors to target, are the level of investment in those sectors and Russia’s ability to access and compete in new markets. A pivot toward the east is evident as Russia receives increased funding from China. However, Chinese investment in Russia remains closely tied to energy requirements, and Russia’s ac-cess to new export markets has not yet materialized. Furthermore, with policy loosening likely to slow, oil prices likely to remain weak, and Western sanc-tions likely to remain in place through the medium term, growth in 2017 is unlikely to be robust.
38
Russia
While the economic incentive behind import sub-stitution is self-sufficiency and diversification of the economy away from a dependence on hydrocar-bons, the political incentive is greater sovereignty.
39
Global Economic Outlook
Russia’s import substitution strategy remains a risky betRussia’s increased emphasis on import substitu-tion in agriculture and certain manufacturing sec-tors (metal production; machinery and equipment; cars, sea craft, airplanes, and spaceships) was un-der pressure from two factors. The primary factor was the precipitous weakening of the ruble between mid-2014 and the end of 2015 in response to a col-lapse in global oil prices. The significantly weaker ruble translated into higher import prices for Rus-sian businesses and consumers. The other factor contributing to the acceleration of import substi-tution was the sanctions imposed by the United States and the European Union, as well as Russia’s counterembargo on the import of food from certain countries in the European Union and elsewhere. While the sanctions imposed by the West meant that Russian manufacturers can no longer import machinery, equipment, and other intermediates from these destinations, the Russian embargo on the import of food meant higher domestic prices or, in some cases, the unavailability of food products for Russian consumers. While the economic incen-
tive behind import substitution is self-sufficiency and diversification of the economy away from a de-pendence on hydrocarbons, the political incentive is greater sovereignty.
On the surface, the strategy of import substitution appears to have benefitted Russia’s agriculture sec-tor in the short term. Domestic production of pork, for instance, has increased to a level of self-suffi-ciency.2 More significantly, a surge in the produc-tion of grains, particularly wheat, resulted in output reaching a record high in 2016.3 In fact, Russia was the world’s largest exporter of grains in 2016.4 Ag-riculture surpassed arms as the country’s second-largest export after oil and gas during the year.5 However, recent growth in the sector can be par-tially attributed to improved land management and favorable weather. Nevertheless, Russian authori-ties claim import substitution in agriculture will help the country move closer to self-sufficiency in certain products while boosting exports in others.6 But this comes at a cost to consumers. In the first half of 2016, expenditure on food was more than a third of total household expenditure.7 Even though inflation has slowed and real disposable income is growing, households are likely to continue paying
Deloitte University Press | dupress.deloitte.comSource: Federal State Statistics Service via Haver Analytics.
Industrial production, NSA, year-over-year percentageRetail sales volume index, NSA, year-over-year percentageReal disposable income, NSA, year-over-year percentage
January 17 February 17 March 17 April 17 May 17
0
2%
4%
6%
-4%
-2%
8%
Figure 1. Indicators point to a third straight quarter of growth in real GDP in Q2 2017
40
Deloitte University Press | dupress.deloitte.comSource: Federal State Statistics Service via Haver Analytics.
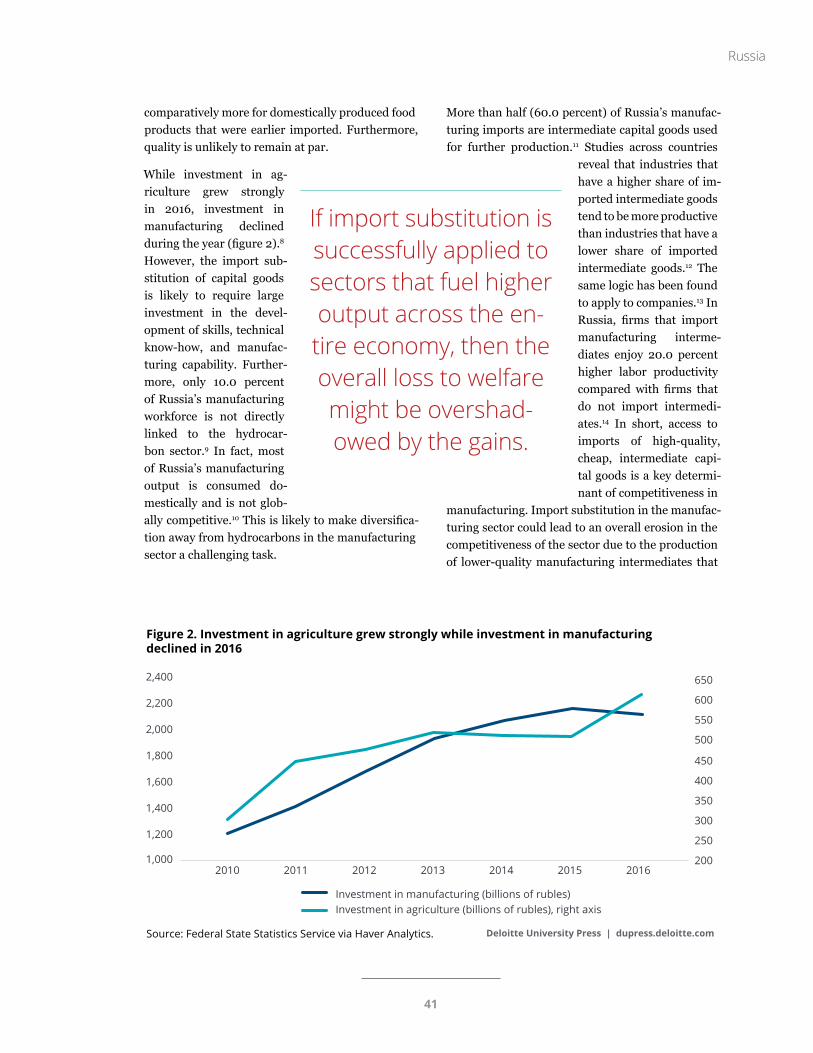
Investment in manufacturing (billions of rubles)Investment in agriculture (billions of rubles), right axis
2010 2011 2012 2013 2014 2015 20161,000 200
250
300
350
400
450
500
550
600
650
1,200
1,400
1,600
1,800
2,000
2,200
2,400
Figure 2. Investment in agriculture grew strongly while investment in manufacturing declined in 2016
comparatively more for domestically produced food products that were earlier imported. Furthermore, quality is unlikely to remain at par.
While investment in ag-riculture grew strongly in 2016, investment in manufacturing declined during the year (figure 2).8 However, the import sub-stitution of capital goods is likely to require large investment in the devel-opment of skills, technical know-how, and manufac-turing capability. Further-more, only 10.0 percent of Russia’s manufacturing workforce is not directly linked to the hydrocar-bon sector.9 In fact, most of Russia’s manufacturing output is consumed do-mestically and is not glob-ally competitive.10 This is likely to make diversifica-tion away from hydrocarbons in the manufacturing sector a challenging task.
More than half (60.0 percent) of Russia’s manufac-turing imports are intermediate capital goods used for further production.11 Studies across countries
reveal that industries that have a higher share of im-ported intermediate goods tend to be more productive than industries that have a lower share of imported intermediate goods.12 The same logic has been found to apply to companies.13 In Russia, firms that import manufacturing interme-diates enjoy 20.0 percent higher labor productivity compared with firms that do not import intermedi-ates.14 In short, access to imports of high-quality, cheap, intermediate capi-tal goods is a key determi-nant of competitiveness in
manufacturing. Import substitution in the manufac-turing sector could lead to an overall erosion in the competitiveness of the sector due to the production of lower-quality manufacturing intermediates that
If import substitution is successfully applied to sectors that fuel higher output across the en-tire economy, then the overall loss to welfare might be overshad-owed by the gains.
Russia
41
Global Economic Outlook
Deloitte University Press | dupress.deloitte.com
Source: The Central Bank of the Russian Federation, "External sector statistics, direct investment."
2010 2011 2012 2013 2014 2015 20160
10.0
20.0
30.0
40.0
50.0
60.0
70.0
80.0
Net inflow of FDI into mining and quarrying of fuel/energy materials ($ billion)Net inflow of FDI ($ billion)
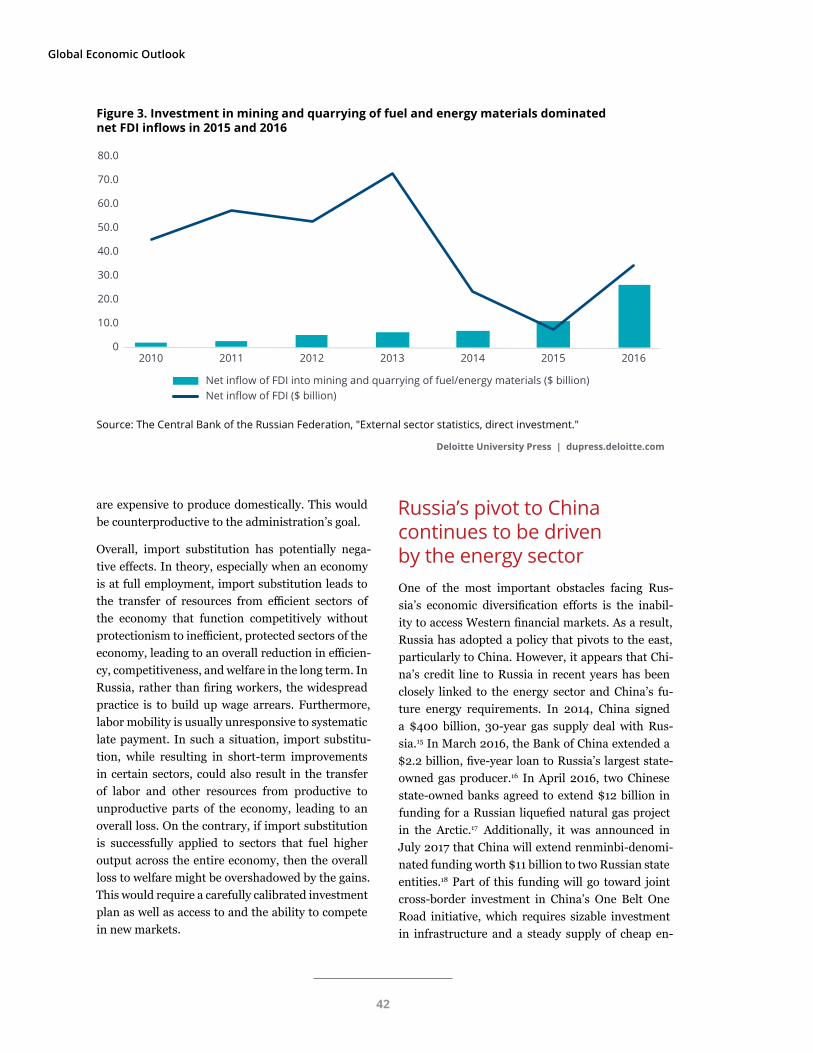
Figure 3. Investment in mining and quarrying of fuel and energy materials dominated net FDI inflows in 2015 and 2016
are expensive to produce domestically. This would be counterproductive to the administration’s goal.
Overall, import substitution has potentially nega-tive effects. In theory, especially when an economy is at full employment, import substitution leads to the transfer of resources from efficient sectors of the economy that function competitively without protectionism to inefficient, protected sectors of the economy, leading to an overall reduction in efficien-cy, competitiveness, and welfare in the long term. In Russia, rather than firing workers, the widespread practice is to build up wage arrears. Furthermore, labor mobility is usually unresponsive to systematic late payment. In such a situation, import substitu-tion, while resulting in short-term improvements in certain sectors, could also result in the transfer of labor and other resources from productive to unproductive parts of the economy, leading to an overall loss. On the contrary, if import substitution is successfully applied to sectors that fuel higher output across the entire economy, then the overall loss to welfare might be overshadowed by the gains. This would require a carefully calibrated investment plan as well as access to and the ability to compete in new markets.
Russia’s pivot to China continues to be driven by the energy sectorOne of the most important obstacles facing Rus-sia’s economic diversification efforts is the inabil-ity to access Western financial markets. As a result, Russia has adopted a policy that pivots to the east, particularly to China. However, it appears that Chi-na’s credit line to Russia in recent years has been closely linked to the energy sector and China’s fu-ture energy requirements. In 2014, China signed a $400 billion, 30-year gas supply deal with Rus-sia.15 In March 2016, the Bank of China extended a $2.2 billion, five-year loan to Russia’s largest state-owned gas producer.16 In April 2016, two Chinese state-owned banks agreed to extend $12 billion in funding for a Russian liquefied natural gas project in the Arctic.17 Additionally, it was announced in July 2017 that China will extend renminbi-denomi-nated funding worth $11 billion to two Russian state entities.18 Part of this funding will go toward joint cross-border investment in China’s One Belt One Road initiative, which requires sizable investment in infrastructure and a steady supply of cheap en-
42
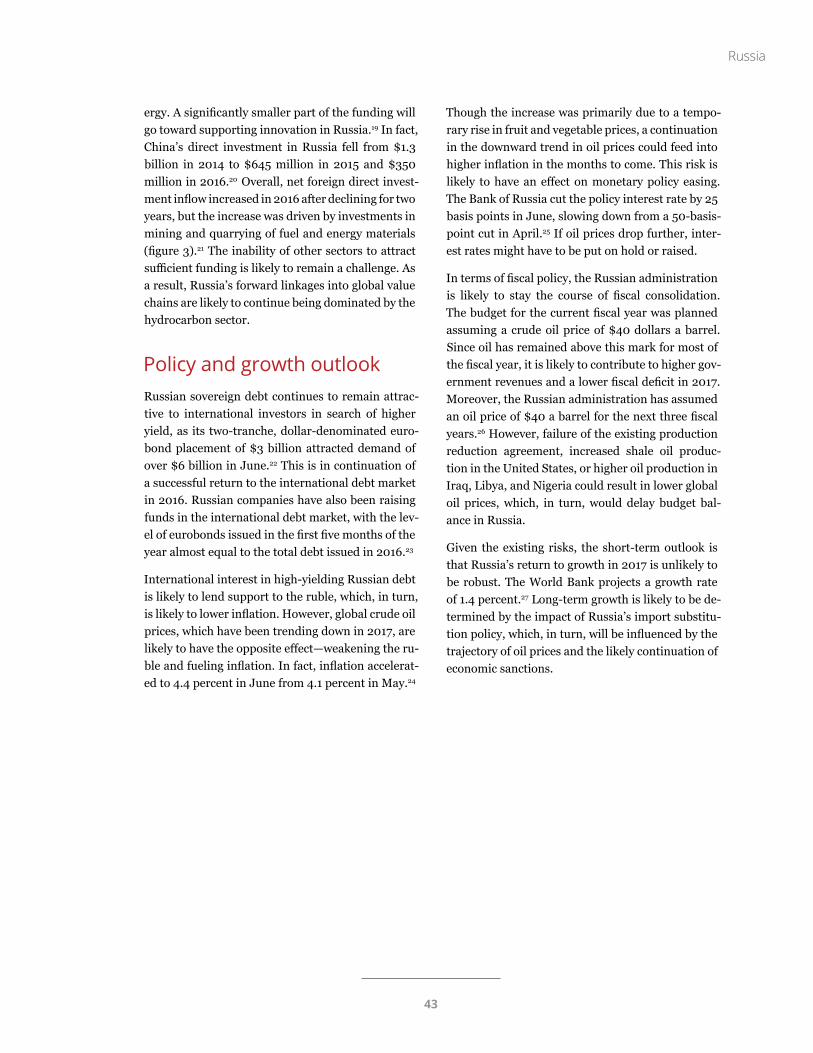
Russia
ergy. A significantly smaller part of the funding will go toward supporting innovation in Russia.19 In fact, China’s direct investment in Russia fell from $1.3 billion in 2014 to $645 million in 2015 and $350 million in 2016.20 Overall, net foreign direct invest-ment inflow increased in 2016 after declining for two years, but the increase was driven by investments in mining and quarrying of fuel and energy materials (figure 3).21 The inability of other sectors to attract sufficient funding is likely to remain a challenge. As a result, Russia’s forward linkages into global value chains are likely to continue being dominated by the hydrocarbon sector.
Policy and growth outlookRussian sovereign debt continues to remain attrac-tive to international investors in search of higher yield, as its two-tranche, dollar-denominated euro-bond placement of $3 billion attracted demand of over $6 billion in June.22 This is in continuation of a successful return to the international debt market in 2016. Russian companies have also been raising funds in the international debt market, with the lev-el of eurobonds issued in the first five months of the year almost equal to the total debt issued in 2016.23
International interest in high-yielding Russian debt is likely to lend support to the ruble, which, in turn, is likely to lower inflation. However, global crude oil prices, which have been trending down in 2017, are likely to have the opposite effect—weakening the ru-ble and fueling inflation. In fact, inflation accelerat-ed to 4.4 percent in June from 4.1 percent in May.24
Though the increase was primarily due to a tempo-rary rise in fruit and vegetable prices, a continuation in the downward trend in oil prices could feed into higher inflation in the months to come. This risk is likely to have an effect on monetary policy easing. The Bank of Russia cut the policy interest rate by 25 basis points in June, slowing down from a 50-basis-point cut in April.25 If oil prices drop further, inter-est rates might have to be put on hold or raised.
In terms of fiscal policy, the Russian administration is likely to stay the course of fiscal consolidation. The budget for the current fiscal year was planned assuming a crude oil price of $40 dollars a barrel. Since oil has remained above this mark for most of the fiscal year, it is likely to contribute to higher gov-ernment revenues and a lower fiscal deficit in 2017. Moreover, the Russian administration has assumed an oil price of $40 a barrel for the next three fiscal years.26 However, failure of the existing production reduction agreement, increased shale oil produc-tion in the United States, or higher oil production in Iraq, Libya, and Nigeria could result in lower global oil prices, which, in turn, would delay budget bal-ance in Russia.
Given the existing risks, the short-term outlook is that Russia’s return to growth in 2017 is unlikely to be robust. The World Bank projects a growth rate of 1.4 percent.27 Long-term growth is likely to be de-termined by the impact of Russia’s import substitu-tion policy, which, in turn, will be influenced by the trajectory of oil prices and the likely continuation of economic sanctions.
43
Global Economic Outlook
Endnotes
1. Federal State Statistics Service via Haver Analytics, accessed July 7, 2017.
2. Zoya Sheftalovich and Christian Oliver, “Russia’s boom (farming) economy,” Politico, November 8, 2016, http://www.politico.eu/article/russias-boom-farming-economy/.
3. Neil Buckley, “Russian agriculture sector flourishes amid sanctions,” Financial Times, April 19, 2017, https://www.ft.com/content/422a8252-2443-11e7-8691-d5f7e0cd0a16?mhq5j=e2.
4. Ibid.
5. Ibid.
6. TASS Russian News Agency, “Russia to shift from import substitution to export expan-sion strategy in agriculture,” April 7, 2017, http://tass.com/economy/940096.
7. Sheftalovich and Oliver, “Russia’s boom (farming) economy.”
8. Federal State Statistics Service via Haver Analytics, accessed July 7, 2017.
9. European Bank for Reconstruction and Development, Diversifying Russia, December 13, 2012, http://www.ebrd.com/news/publications/special-reports/diversifying-russia.html.
10. Richard Connolly and Philip Hanson, “Import substitution and economic sover-eignty in Russia,” Chatham House, June 9, 2016, https://www.chathamhouse.org/publication/import-substitution-and-economic-sovereignty-russia.
11. Natalya Volchkova and Natalia Turdyeva, “The economics of Russian import substitution,” Free Network Policy Brief, December 2016, http://freepolicybriefs.org/wp-content/uploads/2016/12/FREEPolicyBriefs_Dec4.pdf.
12. Robert C. Feenstra, James R. Markusen, and William Zeile, “Accounting for growth with new inputs: Theory and evidence,” American Economic Review 82, no. 2 (1992): pp. 415–21, http://www.jstor.org/stable/2117437.
13. Ling Feng, Zhiyuan Li, and Deborah L. Swenson, “The connection between imported in-termediate inputs and exports: Evidence from Chinese firms,” National Bureau of Economic Research, July 2012, http://www.nber.org/papers/w18260.pdf.
14. N. Volchkova and N. Turdyeva, “Microeconomics of Russian import substitution,” Jour-nal of the New Economic Association 32, no. 4 (2016): pp. 140–146, http://econpapers.repec.org/article/neajournl/y_3a2016_3ai_3a32_3ap_3a140-146.htm.
15. Lucy Hornby, Jamil Anderlini, and Guy Chazan, “China and Russia sign $400bn gas deal,” Financial Times, May 22, 2014, https://www.ft.com/content/d9a8b800-e09a-11e3-9534-00144feabdc0?mhq5j=e2.
16. James Marson and Andrey Ostroukh, “Gazprom secures $2.17 billion loan from Bank of China,” Wall Street Journal, March 3, 2016, http://www.wsj.com/articles/gazprom-secures-2-17-billion-loan-from-bank-of-china-1457017070.
17. Jack Farchy, “Chinese lend $12bn for gas plant in Russian Arctic,” Financial Times, April 30, 2016, https://www.ft.com/content/4ca8886e-0e14-11e6-ad80-67655613c2d6.
18. Max Seddon and Kathrin Hille, “China and Russia strike $11bn funding deal,” Financial Times, July 4, 2017, https://www.ft.com/content/323f8254-60d2-11e7-8814-0ac7eb84e5f1.
19. Ibid.
20. Central Bank of the Russian Federation, “External sector statistics, direct invest-ment,” https://www.cbr.ru/Eng/statistics/?PrtId=svs, accessed July 7, 2017.
21. Ibid.
44
Russia
22. Max Seddon and Kate Allen, “Russia defies oil slide and sanctions with bond sale,” Financial Times, June 21, 2017, https://www.ft.com/content/e8cec0ec-55c0-11e7-9fed-c19e2700005f.
23. Max Seddon, “Russian debt surge snapped up by overseas investors,” Financial Times, June 19, 2017, https://www.ft.com/content/529809fe-51e6-11e7-a1f2-db19572361bb.
24. Federal State Statistics Service via Haver Analytics, accessed July 7, 2017.
25. Max Seddon, “Russian central bank cuts rates to 9%,” Financial Times, June 16, 2017, https://www.ft.com/content/aea833e6-6efb-3ba1-9031-0603bf394c2a?mhq5j=e2.
26. Olga Tanas, “Russia sticks to conservative $40 oil forecast for 2018 budget,” Bloomberg, June 29, 2017, https://www.bloomberg.com/news/articles/2017-06-29/russia-sticks-to-conservative-40-oil-forecast-for-2018-budget.
27. World Bank Group, “From recession to recovery,” May 2017, http://pubdocs.worldbank.org/en/383241495487103815/RER-37-May26-FINAL-with-summary.pdf.
45
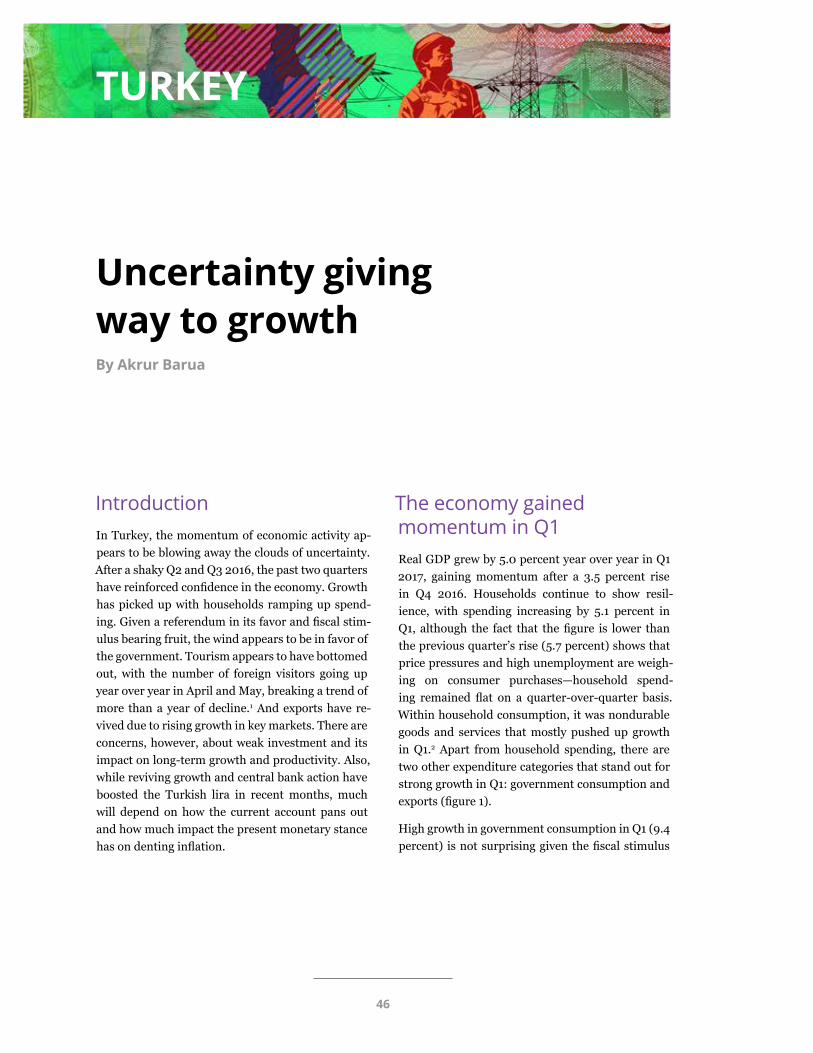
Global Economic Outlook
TURKEY
Uncertainty giving way to growth By Akrur Barua
IntroductionIn Turkey, the momentum of economic activity ap-pears to be blowing away the clouds of uncertainty. After a shaky Q2 and Q3 2016, the past two quarters have reinforced confidence in the economy. Growth has picked up with households ramping up spend-ing. Given a referendum in its favor and fiscal stim-ulus bearing fruit, the wind appears to be in favor of the government. Tourism appears to have bottomed out, with the number of foreign visitors going up year over year in April and May, breaking a trend of more than a year of decline.1 And exports have re-vived due to rising growth in key markets. There are concerns, however, about weak investment and its impact on long-term growth and productivity. Also, while reviving growth and central bank action have boosted the Turkish lira in recent months, much will depend on how the current account pans out and how much impact the present monetary stance has on denting inflation.
The economy gained momentum in Q1Real GDP grew by 5.0 percent year over year in Q1 2017, gaining momentum after a 3.5 percent rise in Q4 2016. Households continue to show resil-ience, with spending increasing by 5.1 percent in Q1, although the fact that the figure is lower than the previous quarter’s rise (5.7 percent) shows that price pressures and high unemployment are weigh-ing on consumer purchases—household spend-ing remained flat on a quarter-over-quarter basis. Within household consumption, it was nondurable goods and services that mostly pushed up growth in Q1.2 Apart from household spending, there are two other expenditure categories that stand out for strong growth in Q1: government consumption and exports (figure 1).
High growth in government consumption in Q1 (9.4 percent) is not surprising given the fiscal stimulus
46
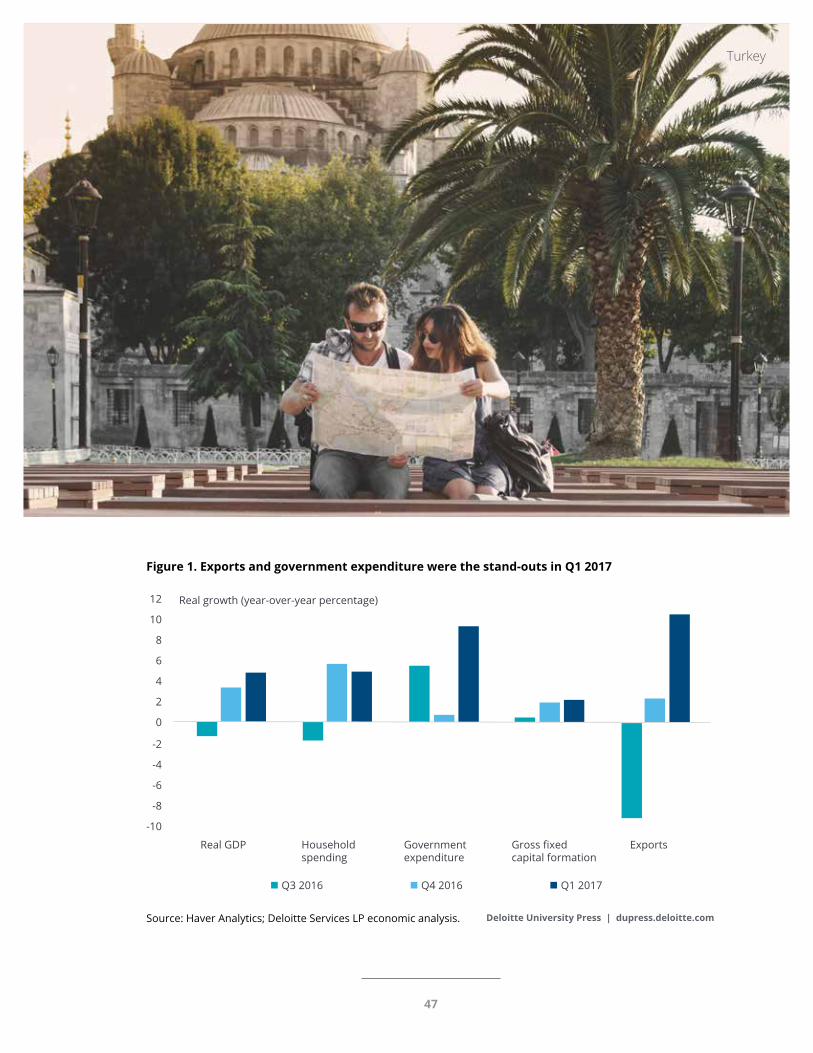
Turkey
Deloitte University Press | dupress.deloitte.comSource: Haver Analytics; Deloitte Services LP economic analysis.
Real GDP Householdspending
Governmentexpenditure
Gross fixedcapital formation
Exports
0
-2
-4
-6
-8
-10
2
4
6
8
10
12 Real growth (year-over-year percentage)
Q3 2016 Q4 2016 Q1 2017
Figure 1. Exports and government expenditure were the stand-outs in Q1 2017
47
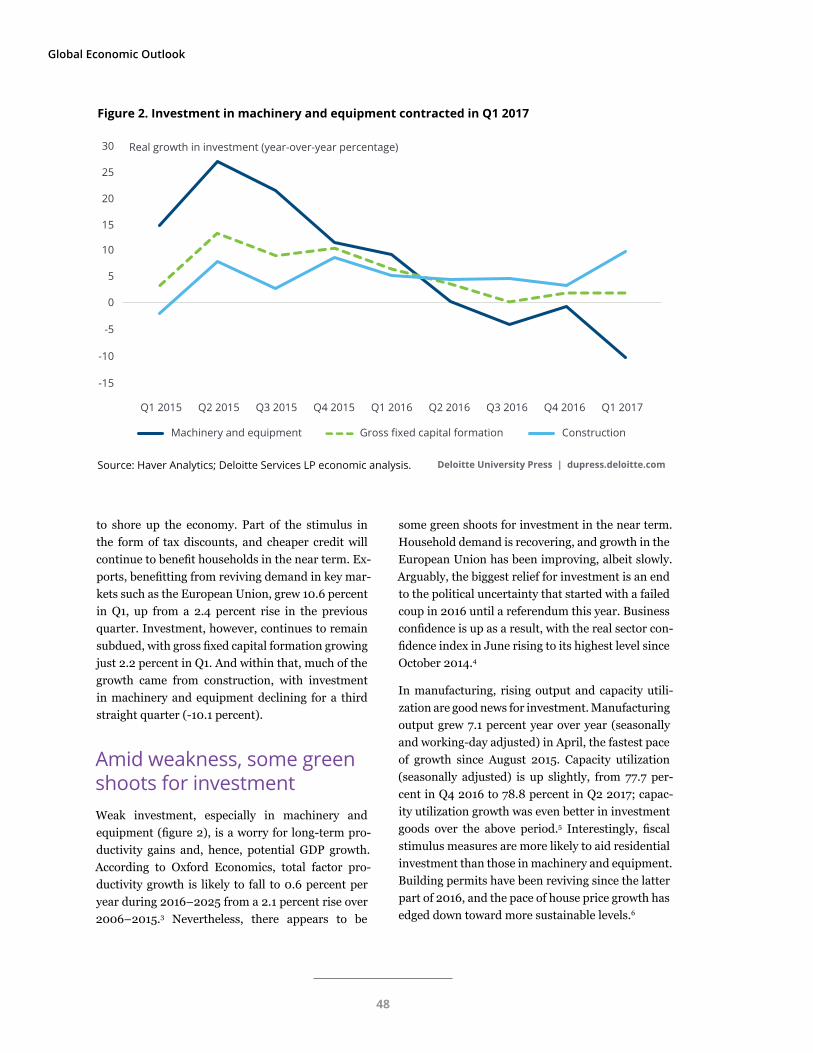
Global Economic Outlook
Machinery and equipment Gross fixed capital formation Construction
Deloitte University Press | dupress.deloitte.comSource: Haver Analytics; Deloitte Services LP economic analysis.
Q1 2015 Q2 2015 Q3 2015 Q4 2015 Q1 2016 Q2 2016 Q3 2016 Q4 2016 Q1 2017
0
-5
-10
-15
5
10
15
20
25
30 Real growth in investment (year-over-year percentage)
Figure 2. Investment in machinery and equipment contracted in Q1 2017
to shore up the economy. Part of the stimulus in the form of tax discounts, and cheaper credit will continue to benefit households in the near term. Ex-ports, benefitting from reviving demand in key mar-kets such as the European Union, grew 10.6 percent in Q1, up from a 2.4 percent rise in the previous quarter. Investment, however, continues to remain subdued, with gross fixed capital formation growing just 2.2 percent in Q1. And within that, much of the growth came from construction, with investment in machinery and equipment declining for a third straight quarter (-10.1 percent).
Amid weakness, some green shoots for investmentWeak investment, especially in machinery and equipment (figure 2), is a worry for long-term pro-ductivity gains and, hence, potential GDP growth. According to Oxford Economics, total factor pro-ductivity growth is likely to fall to 0.6 percent per year during 2016–2025 from a 2.1 percent rise over 2006–2015.3 Nevertheless, there appears to be
some green shoots for investment in the near term. Household demand is recovering, and growth in the European Union has been improving, albeit slowly. Arguably, the biggest relief for investment is an end to the political uncertainty that started with a failed coup in 2016 until a referendum this year. Business confidence is up as a result, with the real sector con-fidence index in June rising to its highest level since October 2014.4
In manufacturing, rising output and capacity utili-zation are good news for investment. Manufacturing output grew 7.1 percent year over year (seasonally and working-day adjusted) in April, the fastest pace of growth since August 2015. Capacity utilization (seasonally adjusted) is up slightly, from 77.7 per-cent in Q4 2016 to 78.8 percent in Q2 2017; capac-ity utilization growth was even better in investment goods over the above period.5 Interestingly, fiscal stimulus measures are more likely to aid residential investment than those in machinery and equipment. Building permits have been reviving since the latter part of 2016, and the pace of house price growth has edged down toward more sustainable levels.6
48
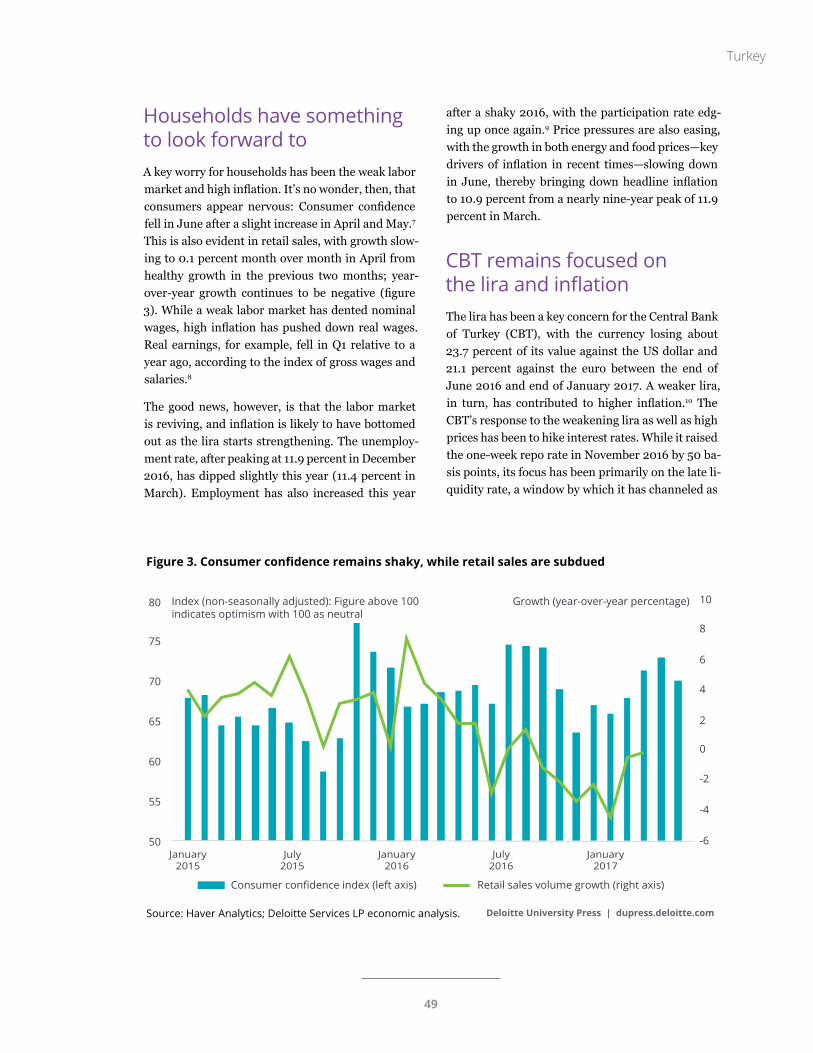
Turkey
Deloitte University Press | dupress.deloitte.comSource: Haver Analytics; Deloitte Services LP economic analysis.
Retail sales volume growth (right axis)Consumer confidence index (left axis)
January2015
July2015
January2016
July2016
January2017
50 -6
-4
-2
0
2
4
6
8
10
55
60
65
70
75
80 Index (non-seasonally adjusted): Figure above 100indicates optimism with 100 as neutral
Growth (year-over-year percentage)
Figure 3. Consumer confidence remains shaky, while retail sales are subdued
Households have something to look forward toA key worry for households has been the weak labor market and high inflation. It’s no wonder, then, that consumers appear nervous: Consumer confidence fell in June after a slight increase in April and May.7
This is also evident in retail sales, with growth slow-ing to 0.1 percent month over month in April from healthy growth in the previous two months; year-over-year growth continues to be negative (figure 3). While a weak labor market has dented nominal wages, high inflation has pushed down real wages. Real earnings, for example, fell in Q1 relative to a year ago, according to the index of gross wages and salaries.8
The good news, however, is that the labor market is reviving, and inflation is likely to have bottomed out as the lira starts strengthening. The unemploy-ment rate, after peaking at 11.9 percent in December 2016, has dipped slightly this year (11.4 percent in March). Employment has also increased this year
after a shaky 2016, with the participation rate edg-ing up once again.9 Price pressures are also easing, with the growth in both energy and food prices—key drivers of inflation in recent times—slowing down in June, thereby bringing down headline inflation to 10.9 percent from a nearly nine-year peak of 11.9 percent in March.
CBT remains focused on the lira and inflationThe lira has been a key concern for the Central Bank of Turkey (CBT), with the currency losing about 23.7 percent of its value against the US dollar and 21.1 percent against the euro between the end of June 2016 and end of January 2017. A weaker lira, in turn, has contributed to higher inflation.10 The CBT’s response to the weakening lira as well as high prices has been to hike interest rates. While it raised the one-week repo rate in November 2016 by 50 ba-sis points, its focus has been primarily on the late li-quidity rate, a window by which it has channeled as
49
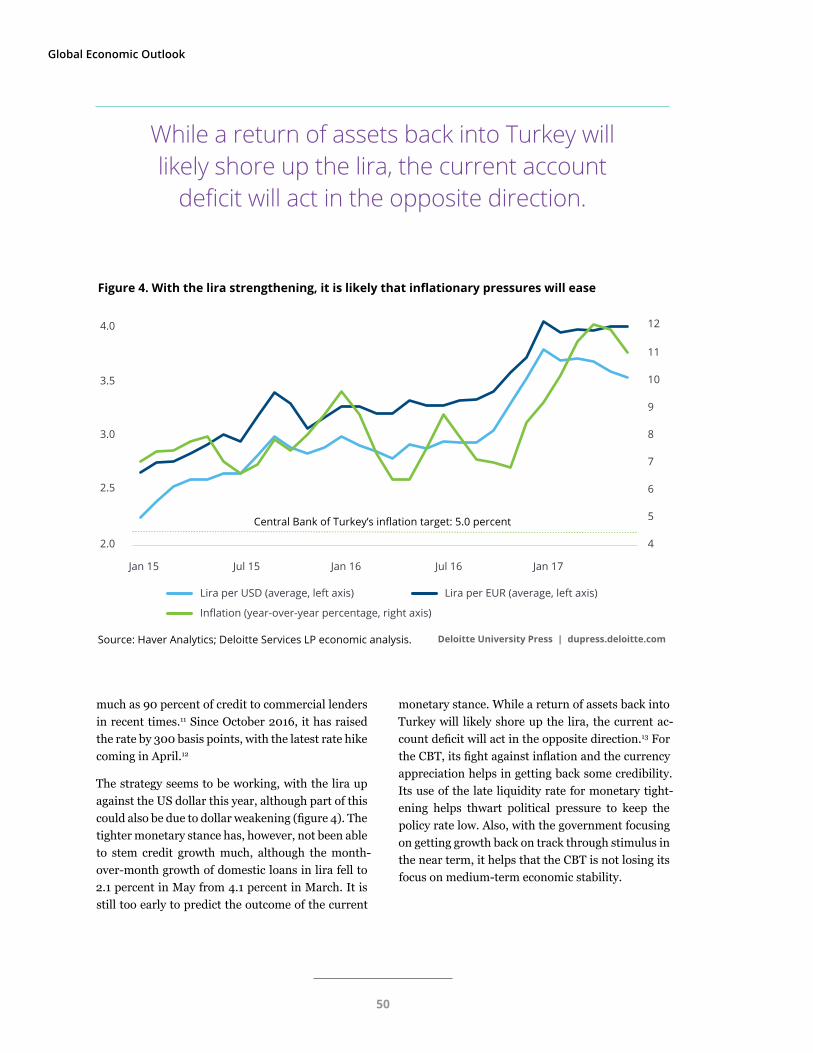
Global Economic Outlook
Deloitte University Press | dupress.deloitte.comSource: Haver Analytics; Deloitte Services LP economic analysis.
Lira per USD (average, left axis)
Inflation (year-over-year percentage, right axis)
Lira per EUR (average, left axis)
Central Bank of Turkey’s inflation target: 5.0 percent
2.0
Jan 15 Jul 15 Jan 16 Jul 16 Jan 17
4
5
6
7
8
9
10
11
12
2.5
3.0
3.5
4.0
Figure 4. With the lira strengthening, it is likely that inflationary pressures will ease
much as 90 percent of credit to commercial lenders in recent times.11 Since October 2016, it has raised the rate by 300 basis points, with the latest rate hike coming in April.12
The strategy seems to be working, with the lira up against the US dollar this year, although part of this could also be due to dollar weakening (figure 4). The tighter monetary stance has, however, not been able to stem credit growth much, although the month-over-month growth of domestic loans in lira fell to 2.1 percent in May from 4.1 percent in March. It is still too early to predict the outcome of the current
monetary stance. While a return of assets back into Turkey will likely shore up the lira, the current ac-count deficit will act in the opposite direction.13 For the CBT, its fight against inflation and the currency appreciation helps in getting back some credibility. Its use of the late liquidity rate for monetary tight-ening helps thwart political pressure to keep the policy rate low. Also, with the government focusing on getting growth back on track through stimulus in the near term, it helps that the CBT is not losing its focus on medium-term economic stability.
While a return of assets back into Turkey will likely shore up the lira, the current account
deficit will act in the opposite direction.
50
Turkey
Endnotes
1. Haver Analytics, July 2017.
2. Ibid.
3. Oxford Economics, “Country economic forecast: Turkey,” June 2016.
4. Central Bank of Turkey, Business Tendency Survey, sourced via Haver Analytics, July 2017.
5. Central Bank of Turkey, “Capacity utilization rate: Manufacturing,” sourced via Haver Analytics, July 2017.
6. Haver Analytics, July 2017.
7. Central Bank of Turkey, Consumer Tendency Survey.
8. Turkey Statistical Institute, “Indexes of gross wages and salaries,” sourced via Haver Analytics, July 2017.
9. Turkey Statistical Institute, Monthly Labor Force Survey, sourced via Haver Analytics, July 2017.
10. Haver Analytics, July 2017.
11. Onur Ant, “Turkey unexpectedly raises a key rate, citing inflation risk,” Bloomberg, April 26, 2017, https://www.bloomberg.com/news/articles/2017-04-26/turkey-central-bank-raises-late-liquidity-rate-to-12-25-per-cent; Mehreen Khan, “Turkey keeps rates on hold in June,” Financial Times, June 15, 2017, https://www.ft.com/content/a5de2a53-603d-31c7-9848-201ddead4f23?mhq5j=e2; Haver Analytics, July 2017.
12. Ibid.
13. Haver Analytics, July 2017.
51
Global Economic Outlook
SPECIAL TOPIC
Why reversing globalization may not be a good idea By Rumki Majumdar
IntroductionThroughout history, countries have used a range of protectionist measures to limit imports or promote exports. While many economic arguments favor free trade and trade liberalization, protectionism is still widely practiced by almost all countries for any or all of the following reasons: to protect their strategic and infant industries, deter competition that is perceived as unfair, safeguard jobs in certain industries or for specific workers, protect the envi-ronment, and political reasons. What has changed over the years is that industrialized nations have gradually moved toward using different deterrents to trade, such as non-tariff barriers, instead of re-sorting to more direct protectionist methods, such as imposing tariffs.
After the 2008 global financial crisis, G201 leaders signed a pledge in November 2008 to avoid pro-tectionist measures in order to speed up economic recovery and boost growth through increased trade. Ironically, protectionism has witnessed a worrisome rise since then. Several countries, including the G20 countries, were reported as increasing trade-restric-tive measures.2 Slow global growth post the 2008
financial crisis, together with this rising protection-ism, has impacted global trade volume, which has been declining since 2011 and was in negative terri-tory for two years up to Q4 2016.3 In addition, there are rising anti-globalization sentiment and support for populist parties in some Western industrial na-tions, even as mainstream policy makers of Western industrial nations are co-opting policies to restrict free movements in goods, services, and resources—factors that have been held responsible for rising in-come inequality and marginalization of labor. The year 2016 witnessed the traditional champions of open government and free trade—the United States and United Kingdom—appeasing populists, while China staunchly defended globalization.4
The unpredictable direction of the global economy and the lack of clarity around governments’ (es-pecially the US and UK governments’) actions on monetary, fiscal, and trade policies have increased downside risks to trade growth. In addition, there are fears that the vulnerability of emerging nations to volatile capital flows, which are a result of policy uncertainties in the West, may impact the former’s domestic currency, inflation, and dollar-denomi-
52

Special topic
The year 2016 witnessed the
traditional champions of
open government and free trade—the United States and the United
Kingdom—appeasing populists,
while China staunchly defended
globalization.
53
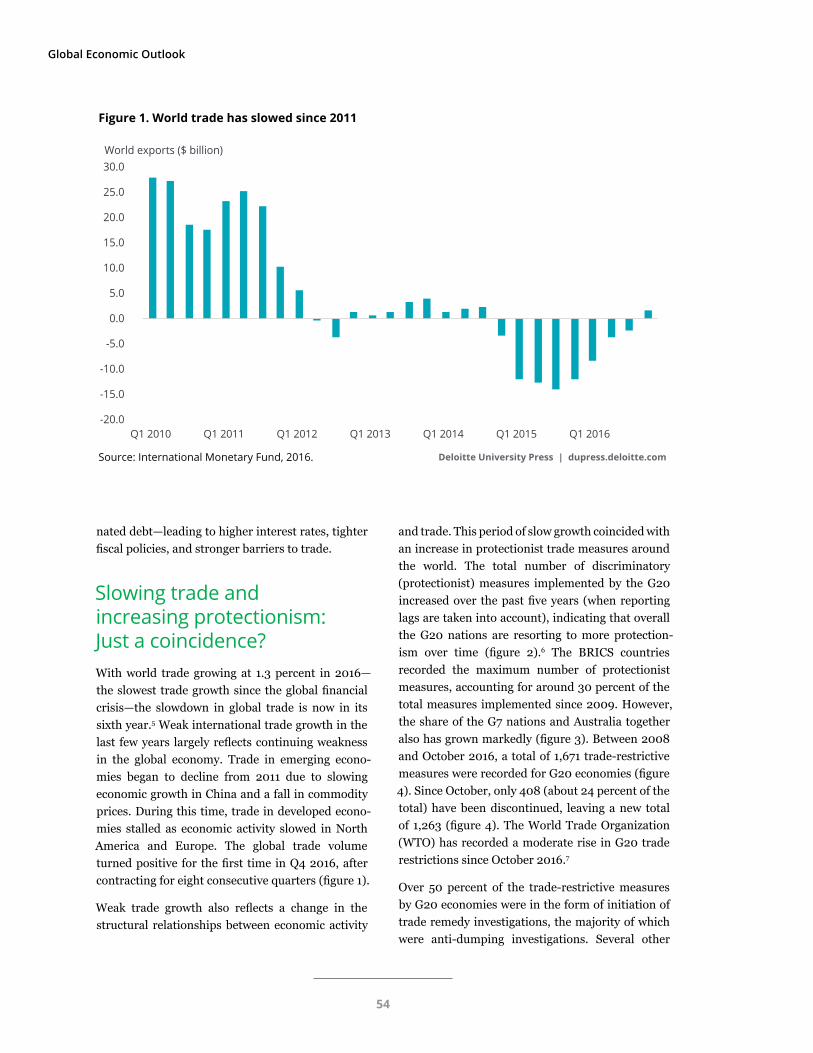
Global Economic Outlook
nated debt—leading to higher interest rates, tighter fiscal policies, and stronger barriers to trade.
Slowing trade and increasing protectionism: Just a coincidence? With world trade growing at 1.3 percent in 2016—the slowest trade growth since the global financial crisis—the slowdown in global trade is now in its sixth year.5 Weak international trade growth in the last few years largely reflects continuing weakness in the global economy. Trade in emerging econo-mies began to decline from 2011 due to slowing economic growth in China and a fall in commodity prices. During this time, trade in developed econo-mies stalled as economic activity slowed in North America and Europe. The global trade volume turned positive for the first time in Q4 2016, after contracting for eight consecutive quarters (figure 1).
Weak trade growth also reflects a change in the structural relationships between economic activity
and trade. This period of slow growth coincided with an increase in protectionist trade measures around the world. The total number of discriminatory (protectionist) measures implemented by the G20 increased over the past five years (when reporting lags are taken into account), indicating that overall the G20 nations are resorting to more protection-ism over time (figure 2).6 The BRICS countries recorded the maximum number of protectionist measures, accounting for around 30 percent of the total measures implemented since 2009. However, the share of the G7 nations and Australia together also has grown markedly (figure 3). Between 2008 and October 2016, a total of 1,671 trade-restrictive measures were recorded for G20 economies (figure 4). Since October, only 408 (about 24 percent of the total) have been discontinued, leaving a new total of 1,263 (figure 4). The World Trade Organization (WTO) has recorded a moderate rise in G20 trade restrictions since October 2016.7
Over 50 percent of the trade-restrictive measures by G20 economies were in the form of initiation of trade remedy investigations, the majority of which were anti-dumping investigations. Several other
Deloitte University Press | dupress.deloitte.comSource: International Monetary Fund, 2016.
Q1 2010 Q1 2011 Q1 2012 Q1 2013 Q1 2014 Q1 2015 Q1 2016-20.0
-15.0
-10.0
-5.0
0.0
5.0
10.0
15.0
20.0
25.0
30.0World exports ($ billion)
Figure 1. World trade has slowed since 2011
54
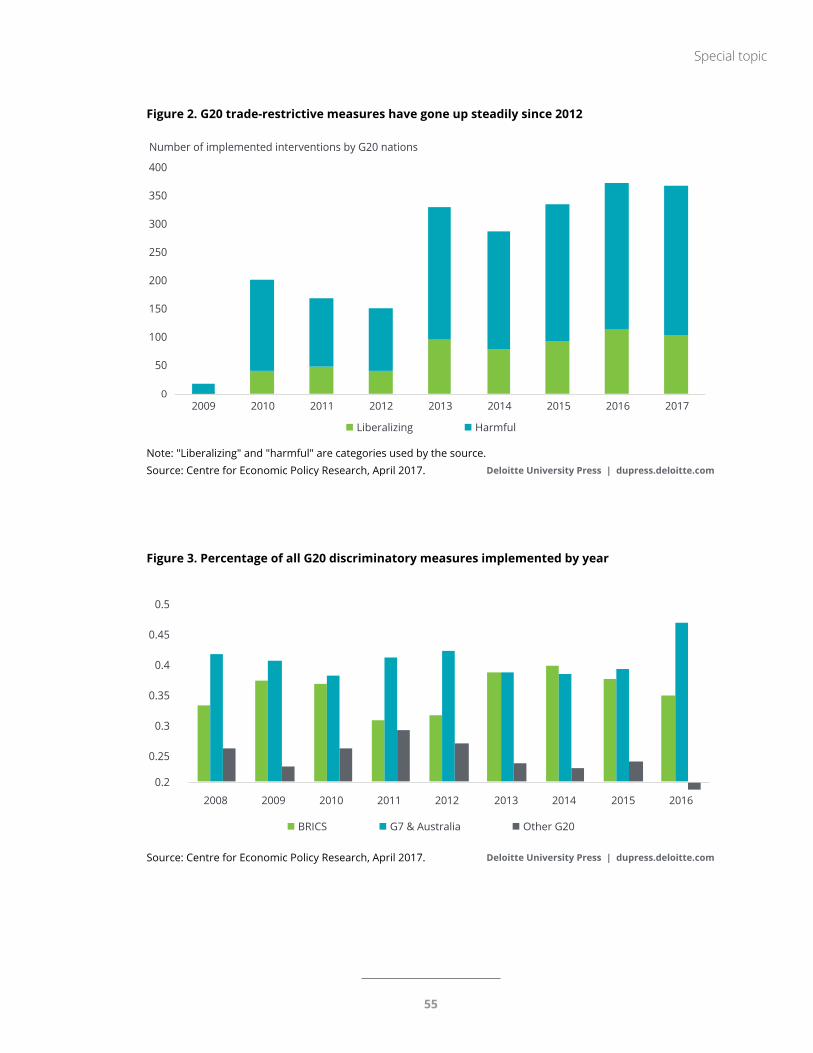
Special topic
Deloitte University Press | dupress.deloitte.com
Note: "Liberalizing" and "harmful" are categories used by the source.Source: Centre for Economic Policy Research, April 2017.
2009 2010 2011 2012 2013 2014 2015 2016 2017
Liberalizing Harmful
0
50
100
150
200
250
300
350
400
Number of implemented interventions by G20 nations
Figure 2. G20 trade-restrictive measures have gone up steadily since 2012
Deloitte University Press | dupress.deloitte.comSource: Centre for Economic Policy Research, April 2017.
20092008 2010 2011 2012 2013 2014 2015 2016
BRICS G7 & Australia Other G20
0.2
0.25
0.3
0.35
0.4
0.45
0.5
Figure 3. Percentage of all G20 discriminatory measures implemented by year
55
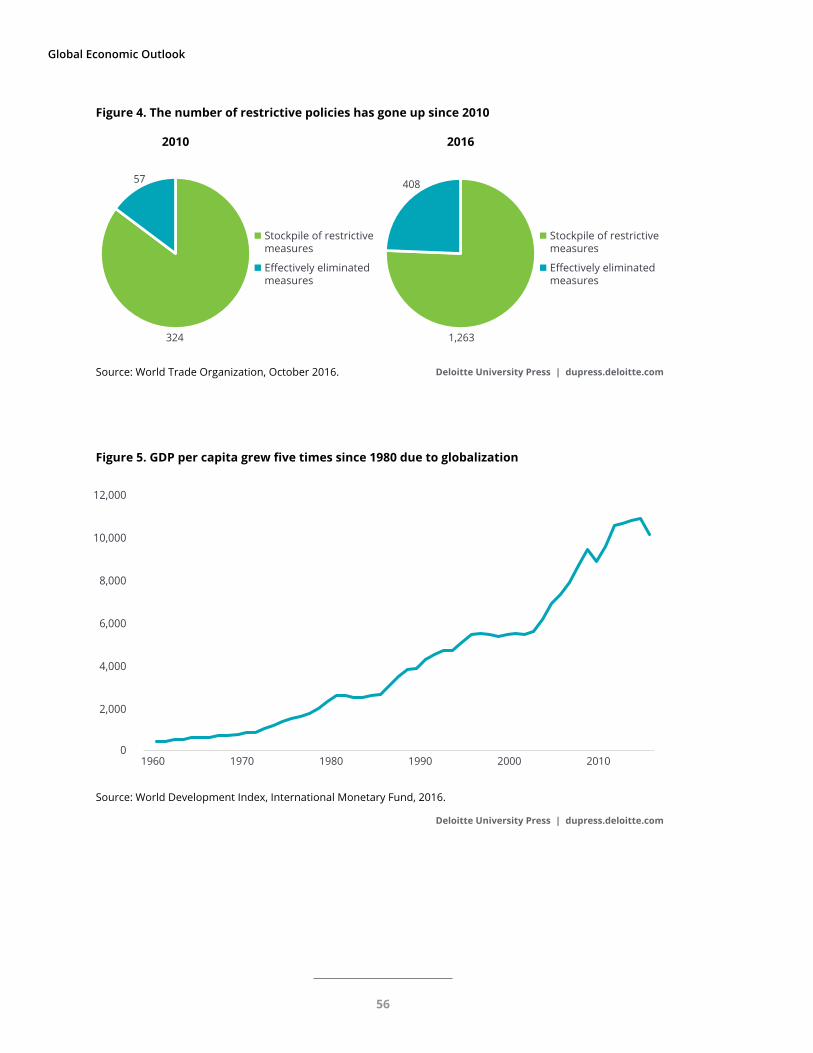
Global Economic Outlook
Deloitte University Press | dupress.deloitte.comSource: World Trade Organization, October 2016.
Stockpile of restrictive measures
Effectively eliminated measures
Stockpile of restrictive measures
Effectively eliminated measures
2010
57
324
408
1,263
2016
Figure 4. The number of restrictive policies has gone up since 2010
Deloitte University Press | dupress.deloitte.com
Source: World Development Index, International Monetary Fund, 2016.
1960 1970 1980 1990 2000 2010
2,000
0
4,000
6,000
8,000
10,000
12,000
Figure 5. GDP per capita grew five times since 1980 due to globalization
56
Special topic
distortive measures were also imposed, such as gov-ernment support for sectors such as infrastructure, agriculture, and export-specific activities.
A halt in the globalization trajectoryGlobalization has a long history, dating back to the trade routes developed in Asia and Egypt, which gradually integrated economies spread across con-tinents. As the global marketplace expanded, the process evolved, resulting in rapid trade expansion, technology growth, and financial liberalization.
However, it was not until the second half of the 20th century that globalization picked up pace; outward-oriented policies made economic performance more dynamic and brought greater prosperity, improving living standards for countries that were able to in-tegrate with the global marketplace. The global per capita GDP increased almost fivefold over the past three-and-a-half decades (figure 5).8 Along with na-tions becoming more prosperous, businesses and employment also became more global and integrat-ed, facilitated by modern electronic communication and technology.
THE NEGATIVES OF GLOBALIZATION
However, a lit candle also casts a shadow. Amid prosperity and opportunities, globalization has also created a widening gap between the world’s haves
and have-nots. Rising income inequality has cre-ated profound changes in the workforce and soci-ety, leading to asymmetric access to knowledge and skills, and shrinking welfare safety nets have re-sulted in economic insecurity and social deprivation among those left behind in this whole globalization gala. In addition, globalization has interconnected global risks arising from volatile capital movements and social, economic, and environmental degrada-tion created by poverty and inequality, leaving low-income nations vulnerable to shocks.
Consequently, people belonging to the less secure strata of society—those who feel they are losing their jobs to immigrants or foreign competitors, have been unemployed for a long time, are at the low end of the wage spectrum or are witnessing in-come stagnation, and are living on shrinking social benefits—are now raising their voice against the changes brought about by globalization. The anxi-ety about immigration and trade is now translating into rising support for populism in several nations, including in the West, leading to policy uncertainty. Even mainstream politicians are directing their pol-icies toward more restrictive immigration and im-ports. The rising clamor for protectionism around the world, together with slowing growth in trade, is impacting global business sentiment, investments, and, thereby, growth.
The questions that everyone is asking are, how big a threat are these sentiments to globalization and its impact on growth, and are we already seeing a reversal of the globalization process?
Rising income inequality has created profound changes in the workforce and society, leading to asymmetric access to knowledge and skills, and
shrinking welfare safety nets have resulted in economic insecurity and social deprivation among those left behind in this whole globalization gala.
57
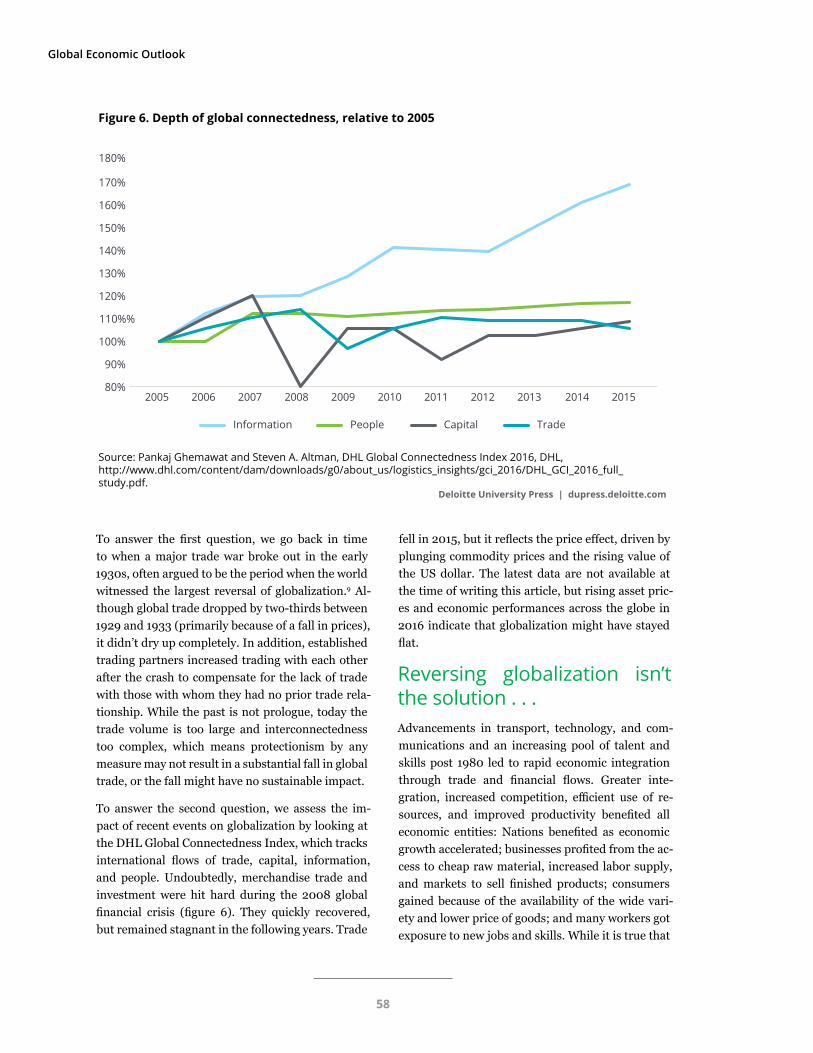
Global Economic Outlook
Deloitte University Press | dupress.deloitte.com
Source: Pankaj Ghemawat and Steven A. Altman, DHL Global Connectedness Index 2016, DHL, http://www.dhl.com/content/dam/downloads/g0/about_us/logistics_insights/gci_2016/DHL_GCI_2016_full_study.pdf.
Information People Capital Trade
2005 2006 2007 2008 2009 2010 2011 2012 2013 2014 201580%
90%
100%
110%%
120%
130%
140%
150%
160%
170%
180%
Figure 6. Depth of global connectedness, relative to 2005
To answer the first question, we go back in time to when a major trade war broke out in the early 1930s, often argued to be the period when the world witnessed the largest reversal of globalization.9 Al-though global trade dropped by two-thirds between 1929 and 1933 (primarily because of a fall in prices), it didn’t dry up completely. In addition, established trading partners increased trading with each other after the crash to compensate for the lack of trade with those with whom they had no prior trade rela-tionship. While the past is not prologue, today the trade volume is too large and interconnectedness too complex, which means protectionism by any measure may not result in a substantial fall in global trade, or the fall might have no sustainable impact.
To answer the second question, we assess the im-pact of recent events on globalization by looking at the DHL Global Connectedness Index, which tracks international flows of trade, capital, information, and people. Undoubtedly, merchandise trade and investment were hit hard during the 2008 global financial crisis (figure 6). They quickly recovered, but remained stagnant in the following years. Trade
fell in 2015, but it reflects the price effect, driven by plunging commodity prices and the rising value of the US dollar. The latest data are not available at the time of writing this article, but rising asset pric-es and economic performances across the globe in 2016 indicate that globalization might have stayed flat.
Reversing globalization isn’t the solution . . .Advancements in transport, technology, and com-munications and an increasing pool of talent and skills post 1980 led to rapid economic integration through trade and financial flows. Greater inte-gration, increased competition, efficient use of re-sources, and improved productivity benefited all economic entities: Nations benefited as economic growth accelerated; businesses profited from the ac-cess to cheap raw material, increased labor supply, and markets to sell finished products; consumers gained because of the availability of the wide vari-ety and lower price of goods; and many workers got exposure to new jobs and skills. While it is true that
58
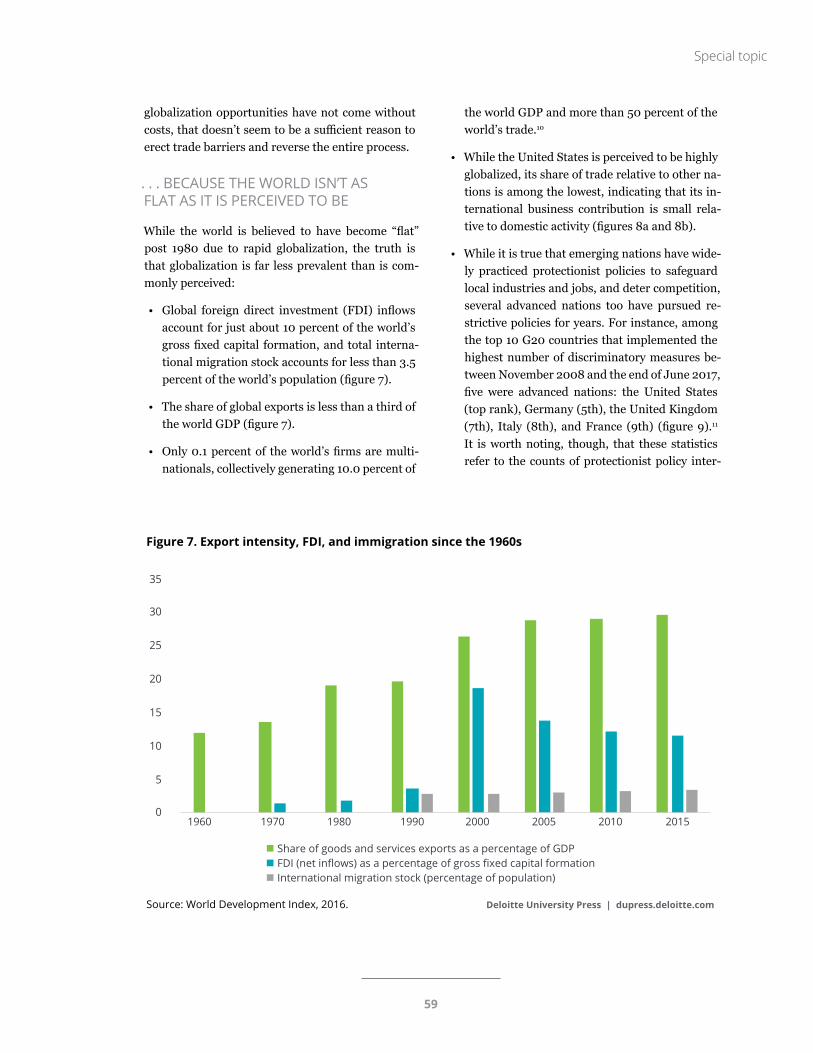
Special topic
Deloitte University Press | dupress.deloitte.comSource: World Development Index, 2016.
1960 1970 1980 1990 2000 2005 2010 20150
5
10
15
20
25
30
35
Share of goods and services exports as a percentage of GDP
International migration stock (percentage of population)FDI (net inflows) as a percentage of gross fixed capital formation
Figure 7. Export intensity, FDI, and immigration since the 1960s
globalization opportunities have not come without costs, that doesn’t seem to be a sufficient reason to erect trade barriers and reverse the entire process.
. . . BECAUSE THE WORLD ISN’T AS FLAT AS IT IS PERCEIVED TO BE
While the world is believed to have become “flat” post 1980 due to rapid globalization, the truth is that globalization is far less prevalent than is com-monly perceived:
• Global foreign direct investment (FDI) inflows account for just about 10 percent of the world’s gross fixed capital formation, and total interna-tional migration stock accounts for less than 3.5 percent of the world’s population (figure 7).
• The share of global exports is less than a third of the world GDP (figure 7).
• Only 0.1 percent of the world’s firms are multi-nationals, collectively generating 10.0 percent of
the world GDP and more than 50 percent of the world’s trade.10
• While the United States is perceived to be highly globalized, its share of trade relative to other na-tions is among the lowest, indicating that its in-ternational business contribution is small rela-tive to domestic activity (figures 8a and 8b).
• While it is true that emerging nations have wide-ly practiced protectionist policies to safeguard local industries and jobs, and deter competition, several advanced nations too have pursued re-strictive policies for years. For instance, among the top 10 G20 countries that implemented the highest number of discriminatory measures be-tween November 2008 and the end of June 2017, five were advanced nations: the United States (top rank), Germany (5th), the United Kingdom (7th), Italy (8th), and France (9th) (figure 9).11 It is worth noting, though, that these statistics refer to the counts of protectionist policy inter-
59
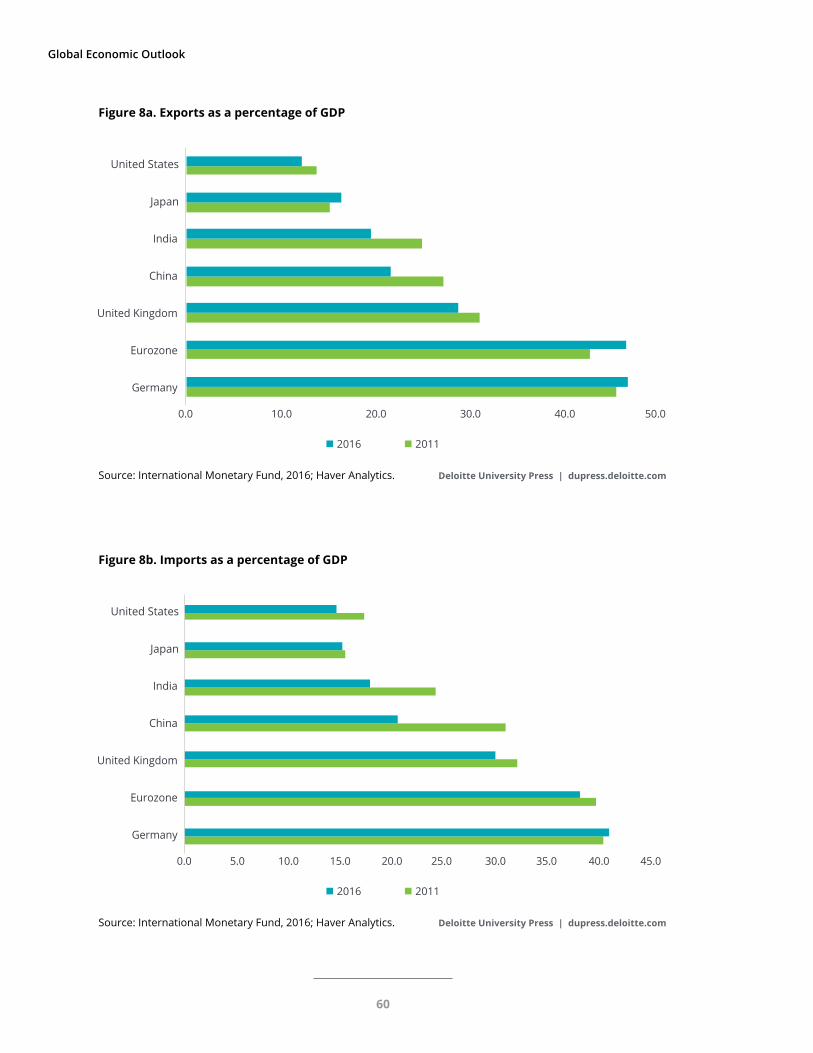
Global Economic Outlook
Deloitte University Press | dupress.deloitte.comSource: International Monetary Fund, 2016; Haver Analytics.
0.0 10.0 20.0 30.0 40.0 50.0
Germany
Eurozone
United Kingdom
China
India
Japan
United States
2016 2011
Figure 8a. Exports as a percentage of GDP
Deloitte University Press | dupress.deloitte.comSource: International Monetary Fund, 2016; Haver Analytics.
0.0 5.0 10.0 15.0 20.0 25.0 30.0 35.0 40.0 45.0
2016 2011
Germany
Eurozone
United Kingdom
China
India
Japan
United States
Figure 8b. Imports as a percentage of GDP
60
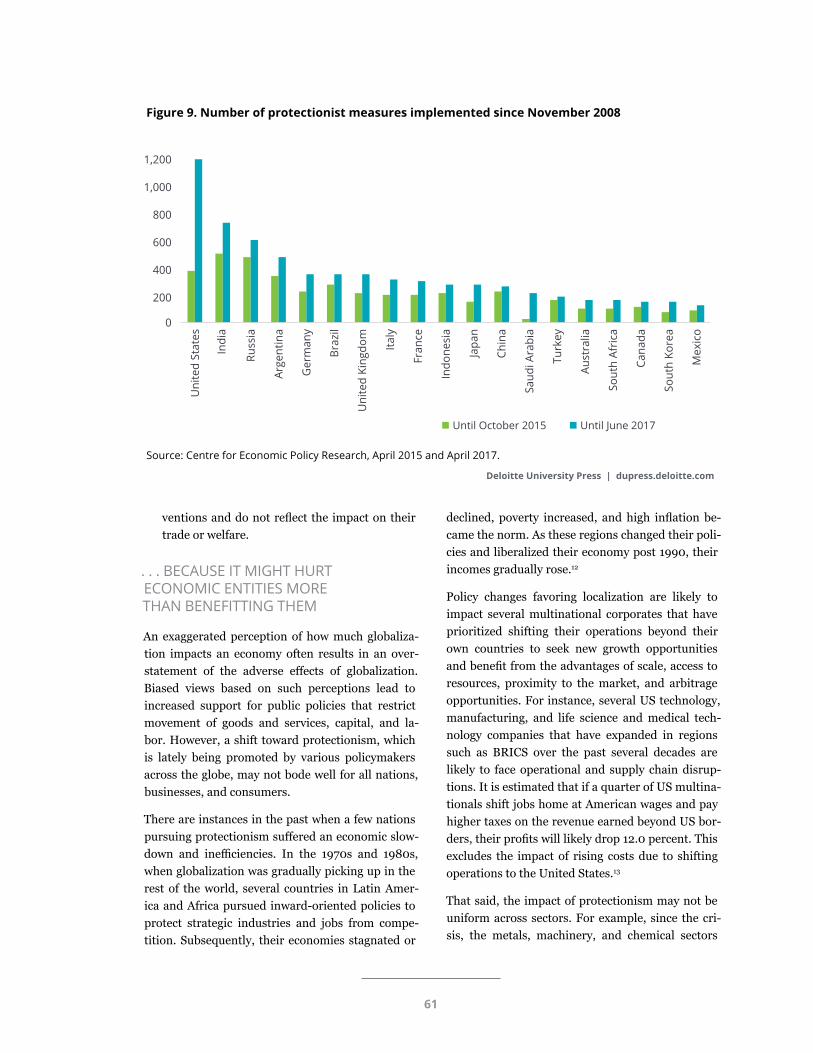
ventions and do not reflect the impact on their trade or welfare.
. . . BECAUSE IT MIGHT HURT ECONOMIC ENTITIES MORE THAN BENEFITTING THEM
An exaggerated perception of how much globaliza-tion impacts an economy often results in an over-statement of the adverse effects of globalization. Biased views based on such perceptions lead to increased support for public policies that restrict movement of goods and services, capital, and la-bor. However, a shift toward protectionism, which is lately being promoted by various policymakers across the globe, may not bode well for all nations, businesses, and consumers.
There are instances in the past when a few nations pursuing protectionism suffered an economic slow-down and inefficiencies. In the 1970s and 1980s, when globalization was gradually picking up in the rest of the world, several countries in Latin Amer-ica and Africa pursued inward-oriented policies to protect strategic industries and jobs from compe-tition. Subsequently, their economies stagnated or
declined, poverty increased, and high inflation be-came the norm. As these regions changed their poli-cies and liberalized their economy post 1990, their incomes gradually rose.12
Policy changes favoring localization are likely to impact several multinational corporates that have prioritized shifting their operations beyond their own countries to seek new growth opportunities and benefit from the advantages of scale, access to resources, proximity to the market, and arbitrage opportunities. For instance, several US technology, manufacturing, and life science and medical tech-nology companies that have expanded in regions such as BRICS over the past several decades are likely to face operational and supply chain disrup-tions. It is estimated that if a quarter of US multina-tionals shift jobs home at American wages and pay higher taxes on the revenue earned beyond US bor-ders, their profits will likely drop 12.0 percent. This excludes the impact of rising costs due to shifting operations to the United States.13
That said, the impact of protectionism may not be uniform across sectors. For example, since the cri-sis, the metals, machinery, and chemical sectors
Deloitte University Press | dupress.deloitte.com
Source: Centre for Economic Policy Research, April 2015 and April 2017.
Uni
ted
Stat
es
Indi
a
Russ
ia
Arge
ntin
a
Ger
man
y
Braz
il
Uni
ted
King
dom
Italy
Fran
ce
Indo
nesi
a
Japa
n
Chin
a
Saud
i Ara
bia
Turk
ey
Aust
ralia
Sout
h Af
rica
Cana
da
Sout
h Ko
rea
Mex
ico
0
200
400
600
800
1,000
1,200
Until October 2015 Until June 2017
Figure 9. Number of protectionist measures implemented since November 2008
61
Global Economic Outlook
have been affected the most (7 out of the top 10 most affected sectors), with their commercial inter-ests hit more than 750 times. The other sectors that were affected the most by G20 protectionism were the transport equipment and agricultural product sectors. Together, these sectors account for more than a quarter of global trade.14 These are also sec-tors that employ low-skilled labor and have strong external linkages. Often, disruptions result in cost cutting via layoffs or rising product prices for which consumers have to bear the costs.
Turning the tide toward awareness and targeted policies will be the keyThe US presidential election, the 2016 UK referen-dum on the membership of the European Union, and Italy’s referendum for structural and constitutional reforms signal rising economic and cultural anxiety among those with stagnant incomes, less education, and low job opportunities. A part of the problem is that the benefits of globalization go largely unrecog-nized, primarily because policymakers have failed to highlight them, while adverse effects have been overstated. For example, globalization has been blamed for trends that are largely due to technologi-cal innovation and automation. Roughly 80 percent of manufacturing jobs have been lost due to innova-tion, automation, and new technologies.15
Instead of appeasing populism, policymakers have to address the real cost of globalization and pro-mote inclusion. Targeted domestic policies, such as improving education, funding more job training and social programs, and providing better social safety nets may help in addressing the anxiety of displaced workers and dislocated communities, and enable them to get back on their feet.
Better coordination between international and do-mestic policies is essential, and will likely warrant a uniform assistance program for labor upskilling, adjustments in capacity building in terms of capital investment and labor reforms, and the reduction of red tape. The B20 Germany task force has several recommendations for the G20 countries to ensure that the benefits of globalization are more inclusive:
1. “Strengthen an open and inclusive trading system . . . underpinned by transparency and robust adjustment assistance programs, resis-tance to protectionism in all forms, and a strong, nondiscriminatory rules-based global trading system.”
2. “Make use of digital trade potential . . . by accelerating capacity building, encouraging im-plementation of interoperable and nondiscrimi-natory e-commerce-related policies, and calling for a WTO negotiation mandate on digital trade.”
3. “Foster investment facilitation . . . [by es-tablishing] a reliable legal environment, [en-hancing] sustainable investment facilitation, and [identifying] the benefits and drawbacks of a multilateral investment framework.”16
Today, no person, business, or nation is an island, but all are part of a massive, complicated intercon-nected system, thanks to globalization. The phe-nomenon that started several hundreds of years ago has resulted in greater interdependence and integration among nations. With freer movement of resources, increased trade and technology trans-fer, spread of knowledge, and cultural exchange, nations have seen unparalleled economic growth. Going backward and undoing globalization may im-pose more costs than reap benefits and thus may not be a prudent way forward.
An exaggerated perception of how much globalization impacts an economy often results
in an overstatement of the adverse effects of globalization.
62
Endnotes
1. The G20 countries comprise Argentina, Australia, Brazil, Canada, China, France, Germany, India, Indonesia, Italy, Japan, Mexico, Russia, Saudi Arabia, South Africa, South Korea, Turkey, United Kingdom, United States, and European Union.
2. WTO OMC, OECD, and UNCTAD, Reports on G20 trade and investment measures, June 30, 2017, https://www.oecd.org/daf/inv/investment-policy/17th-Report-on-G20-Trade-and-Investment-Measures.pdf.
3. International Monetary Fund, 2016.
4. Stephen Fidler, Te-Ping Chen, and Lingling Wei, “China’s Xi Jinping seizes role as leader on globalization,” Wall Street Journal, January 17, 2017, https://www.wsj.com/articles/chinas-xi-jinping-defends-globalization-1484654899.
5. WTO OMC, OECD, and UNCTAD, Reports on G20 trade and investment measures.
6. Simon J. Evenett and Johannes Fritz, “Will awe trump rules?,” Global Trade Alert, CEPR Press, 2017, http://www.globaltradealert.org/reports/42.
7. WTO OMC, OECD, and UNCTAD, Reports on G20 trade and investment measures.
8. International Monetary Fund, Globalization: Threat or opportunity?, April 12, 2000, https://www.imf.org/external/np/exr/ib/2000/041200to.htm.
9. Pankaj Ghemawat, “Globalization in the age of Trump,” Harvard Business Review, July 2017, https://hbr.org/2017/07/globalization-in-the-age-of-trump.
10. Ibid.
11. It may be noted that G20 members differ markedly in terms of the num-ber of documented discriminatory policy interventions.
12. International Monetary Fund, Globalization: Threat or opportunity?
13. “The retreat of the global company,” Economist, January 28, 2017.
14. Evenett and Fritz, “Will awe trump rules?”
15. World Trade Organization, “Trade recovery expected in 2017 and 2018, amid policy uncer-tainty,” April 12, 2017, https://www.wto.org/english/news_e/pres17_e/pr791_e.htm.
16. B20 Taskforce, Creating benefits for all: Driving inclusive growth through trade and investment, 2017, https://www.b20germany.org/fileadmin/user_upload/documents/B20/B20_Trade___Investment_Final_Policy_Paper.pdf.
Acknowledgements
The author would like to thank the following Deloitte professionals for their contributions to this research project: Dr. Ira Kalish, managing director and chief global economist, DTTL; Dr. Patricia Buckley, man-aging director, Research and Eminence, Deloitte Services LP; and David Gruner, senior manager, DTTL.
63
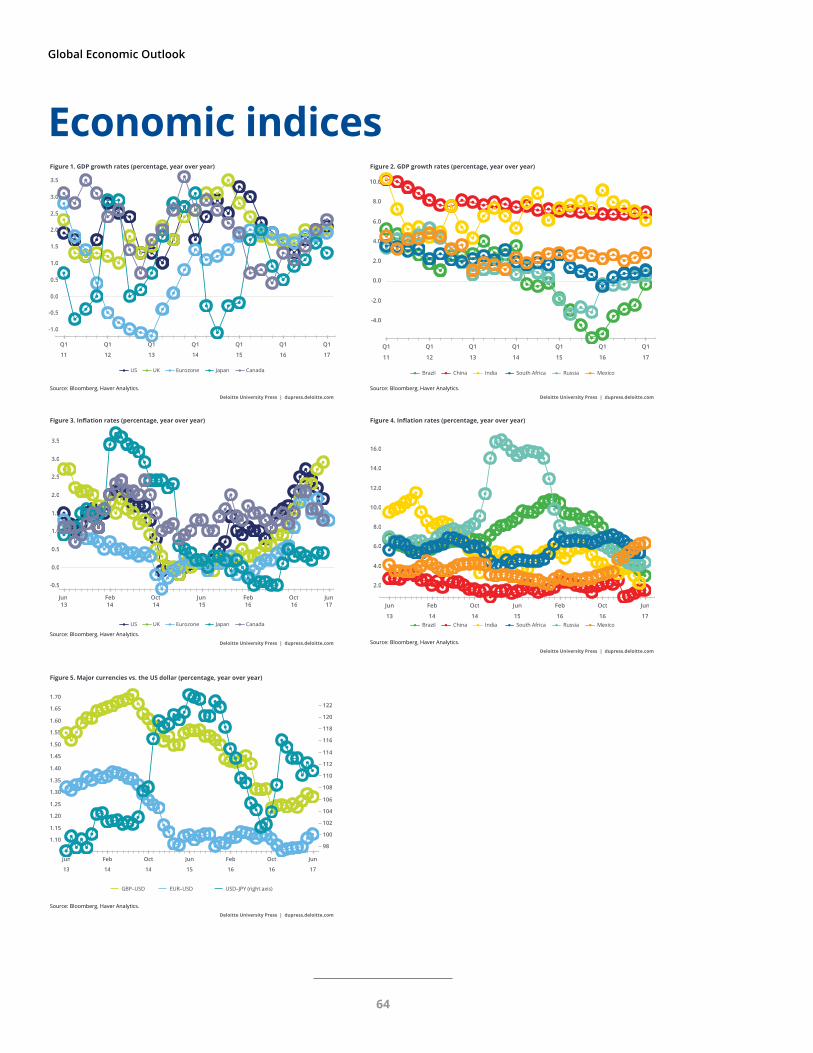
Global Economic Outlook
Deloitte University Press | dupress.deloitte.com
Source: Bloomberg, Haver Analytics.
US UK Eurozone Japan Canada
Figure 1. GDP growth rates (percentage, year over year)
Q1
11
Q1
12
Q1
13
Q1
14
Q1
15
Q1
16
Q1
17
-1.0
-0.5
0.0
0.5
1.0
1.5
2.0
2.5
3.0
3.5
Deloitte University Press | dupress.deloitte.com
Source: Bloomberg, Haver Analytics.
Brazil China India South Africa Russia Mexico
Figure 2. GDP growth rates (percentage, year over year)
Q1
11
Q1
12
Q1
13
Q1
14
Q1
15
Q1
16
Q1
17
-4.0
-2.0
0.0
2.0
4.0
6.0
8.0
10.0
Deloitte University Press | dupress.deloitte.com
Source: Bloomberg, Haver Analytics.
GBP–USD EUR–USD USD–JPY (right axis)
Figure 5. Major currencies vs. the US dollar (percentage, year over year)
Jun
13
Feb
14
Oct
14
Jun
15
Feb
16
Oct
16
Jun
17
1.10
1.15
1.20
1.25
1.30
1.35
1.40
1.45
1.50
1.55
1.60
1.65
1.70
98
100
102
104
106
108
110
112
114
116
118
120
122
Deloitte University Press | dupress.deloitte.com
Source: Bloomberg, Haver Analytics.
US UK Eurozone Japan Canada
Figure 3. Inflation rates (percentage, year over year)
Jun13
Feb14
Oct14
Oct16
Jun15
Feb16
Jun17
-0.5
0.0
0.5
1.0
1.5
2.0
2.5
3.0
3.5
Deloitte University Press | dupress.deloitte.com
Source: Bloomberg, Haver Analytics.
Brazil China India South Africa Russia Mexico
Figure 4. Inflation rates (percentage, year over year)
Jun
13
Feb
14
Oct
14
Jun
15
Feb
16
Oct
16
Jun
17
2.0
4.0
6.0
8.0
10.0
12.0
14.0
16.0
Economic indices
64
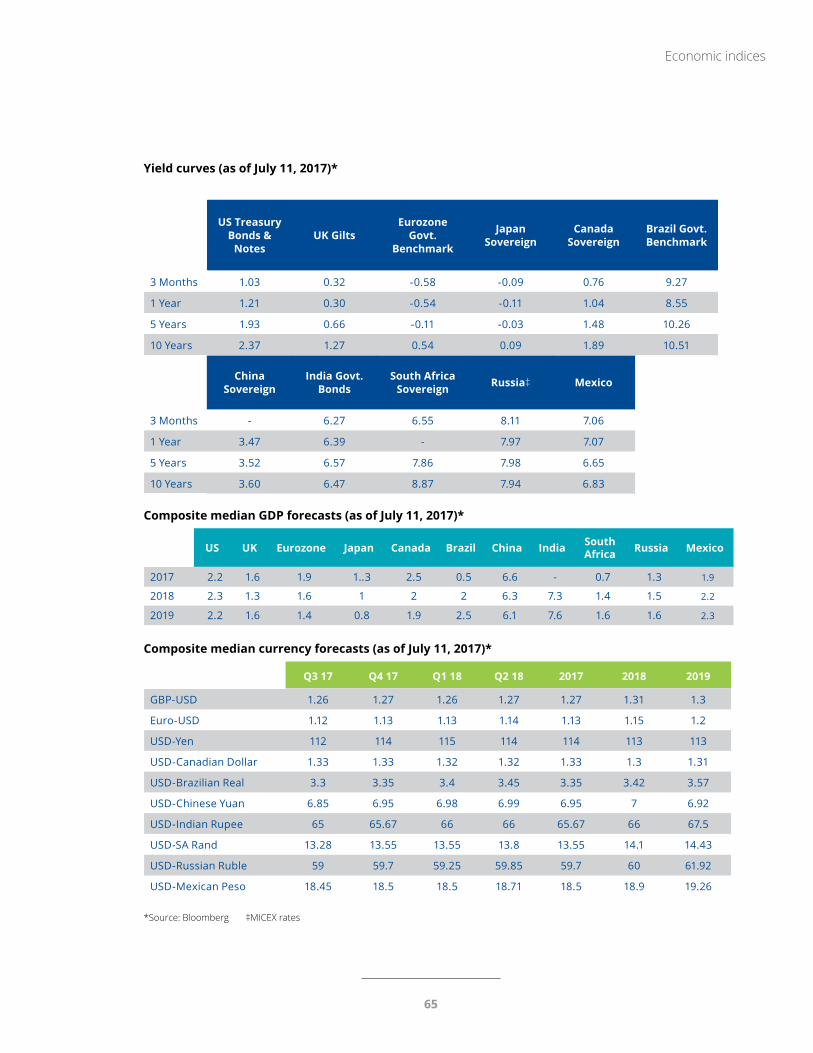
Yield curves (as of July 11, 2017)*
US Treasury Bonds &
NotesUK Gilts
Eurozone Govt.
Benchmark
Japan Sovereign
Canada Sovereign
Brazil Govt. Benchmark
3 Months 1.03 0.32 -0.58 -0.09 0.76 9.27
1 Year 1.21 0.30 -0.54 -0.11 1.04 8.55
5 Years 1.93 0.66 -0.11 -0.03 1.48 10.26
10 Years 2.37 1.27 0.54 0.09 1.89 10.51
China Sovereign
India Govt. Bonds
South Africa Sovereign Russia‡ Mexico
3 Months - 6.27 6.55 8.11 7.06
1 Year 3.47 6.39 - 7.97 7.07
5 Years 3.52 6.57 7.86 7.98 6.65
10 Years 3.60 6.47 8.87 7.94 6.83 Composite median GDP forecasts (as of July 11, 2017)*
US UK Eurozone Japan Canada Brazil China India SouthAfrica Russia Mexico
2017 2.2 1.6 1.9 1..3 2.5 0.5 6.6 - 0.7 1.3 1.9
2018 2.3 1.3 1.6 1 2 2 6.3 7.3 1.4 1.5 2.2
2019 2.2 1.6 1.4 0.8 1.9 2.5 6.1 7.6 1.6 1.6 2.3
Composite median currency forecasts (as of July 11, 2017)*
Q3 17 Q4 17 Q1 18 Q2 18 2017 2018 2019
GBP-USD 1.26 1.27 1.26 1.27 1.27 1.31 1.3
Euro-USD 1.12 1.13 1.13 1.14 1.13 1.15 1.2
USD-Yen 112 114 115 114 114 113 113
USD-Canadian Dollar 1.33 1.33 1.32 1.32 1.33 1.3 1.31
USD-Brazilian Real 3.3 3.35 3.4 3.45 3.35 3.42 3.57
USD-Chinese Yuan 6.85 6.95 6.98 6.99 6.95 7 6.92
USD-Indian Rupee 65 65.67 66 66 65.67 66 67.5
USD-SA Rand 13.28 13.55 13.55 13.8 13.55 14.1 14.43
USD-Russian Ruble 59 59.7 59.25 59.85 59.7 60 61.92
USD-Mexican Peso 18.45 18.5 18.5 18.71 18.5 18.9 19.26
*Source: Bloomberg ‡MICEX rates
Economic indices
65
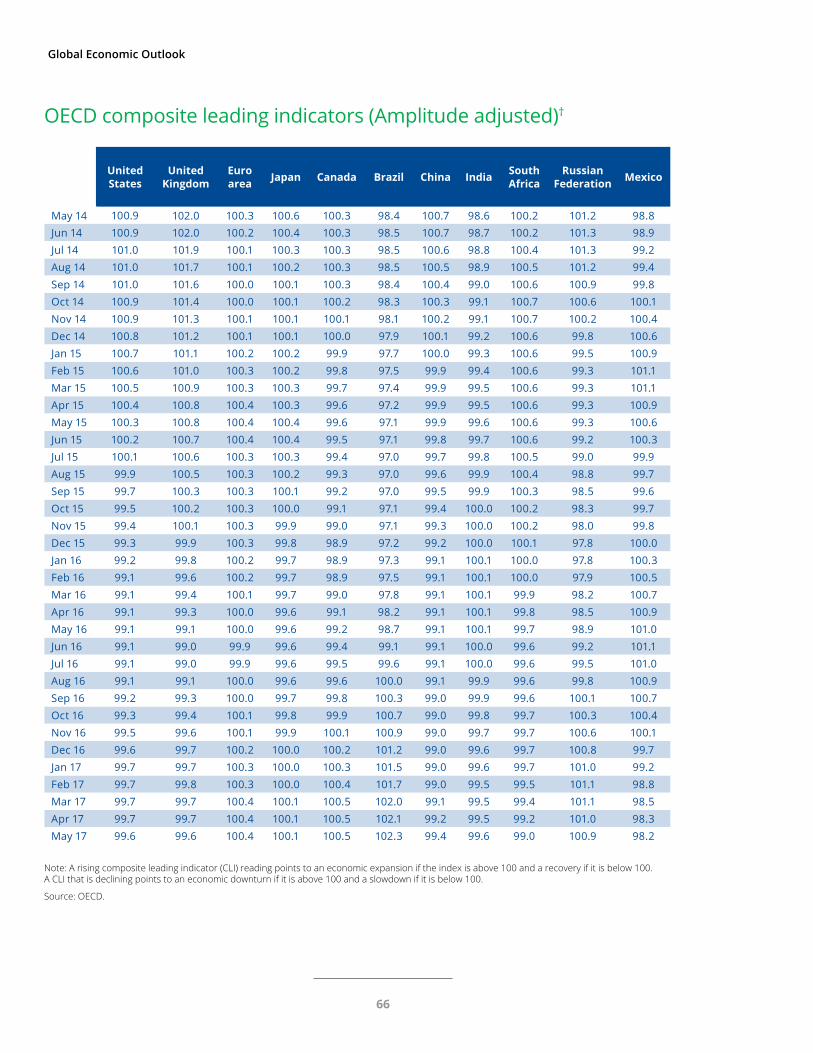
Global Economic Outlook
OECD composite leading indicators (Amplitude adjusted)†
UnitedStates
United Kingdom
Euroarea Japan Canada Brazil China India South
AfricaRussian
Federation Mexico
May 14 100.9 102.0 100.3 100.6 100.3 98.4 100.7 98.6 100.2 101.2 98.8Jun 14 100.9 102.0 100.2 100.4 100.3 98.5 100.7 98.7 100.2 101.3 98.9Jul 14 101.0 101.9 100.1 100.3 100.3 98.5 100.6 98.8 100.4 101.3 99.2Aug 14 101.0 101.7 100.1 100.2 100.3 98.5 100.5 98.9 100.5 101.2 99.4Sep 14 101.0 101.6 100.0 100.1 100.3 98.4 100.4 99.0 100.6 100.9 99.8Oct 14 100.9 101.4 100.0 100.1 100.2 98.3 100.3 99.1 100.7 100.6 100.1Nov 14 100.9 101.3 100.1 100.1 100.1 98.1 100.2 99.1 100.7 100.2 100.4Dec 14 100.8 101.2 100.1 100.1 100.0 97.9 100.1 99.2 100.6 99.8 100.6Jan 15 100.7 101.1 100.2 100.2 99.9 97.7 100.0 99.3 100.6 99.5 100.9Feb 15 100.6 101.0 100.3 100.2 99.8 97.5 99.9 99.4 100.6 99.3 101.1Mar 15 100.5 100.9 100.3 100.3 99.7 97.4 99.9 99.5 100.6 99.3 101.1Apr 15 100.4 100.8 100.4 100.3 99.6 97.2 99.9 99.5 100.6 99.3 100.9May 15 100.3 100.8 100.4 100.4 99.6 97.1 99.9 99.6 100.6 99.3 100.6Jun 15 100.2 100.7 100.4 100.4 99.5 97.1 99.8 99.7 100.6 99.2 100.3Jul 15 100.1 100.6 100.3 100.3 99.4 97.0 99.7 99.8 100.5 99.0 99.9Aug 15 99.9 100.5 100.3 100.2 99.3 97.0 99.6 99.9 100.4 98.8 99.7Sep 15 99.7 100.3 100.3 100.1 99.2 97.0 99.5 99.9 100.3 98.5 99.6Oct 15 99.5 100.2 100.3 100.0 99.1 97.1 99.4 100.0 100.2 98.3 99.7Nov 15 99.4 100.1 100.3 99.9 99.0 97.1 99.3 100.0 100.2 98.0 99.8Dec 15 99.3 99.9 100.3 99.8 98.9 97.2 99.2 100.0 100.1 97.8 100.0Jan 16 99.2 99.8 100.2 99.7 98.9 97.3 99.1 100.1 100.0 97.8 100.3Feb 16 99.1 99.6 100.2 99.7 98.9 97.5 99.1 100.1 100.0 97.9 100.5Mar 16 99.1 99.4 100.1 99.7 99.0 97.8 99.1 100.1 99.9 98.2 100.7Apr 16 99.1 99.3 100.0 99.6 99.1 98.2 99.1 100.1 99.8 98.5 100.9May 16 99.1 99.1 100.0 99.6 99.2 98.7 99.1 100.1 99.7 98.9 101.0Jun 16 99.1 99.0 99.9 99.6 99.4 99.1 99.1 100.0 99.6 99.2 101.1Jul 16 99.1 99.0 99.9 99.6 99.5 99.6 99.1 100.0 99.6 99.5 101.0Aug 16 99.1 99.1 100.0 99.6 99.6 100.0 99.1 99.9 99.6 99.8 100.9Sep 16 99.2 99.3 100.0 99.7 99.8 100.3 99.0 99.9 99.6 100.1 100.7Oct 16 99.3 99.4 100.1 99.8 99.9 100.7 99.0 99.8 99.7 100.3 100.4Nov 16 99.5 99.6 100.1 99.9 100.1 100.9 99.0 99.7 99.7 100.6 100.1Dec 16 99.6 99.7 100.2 100.0 100.2 101.2 99.0 99.6 99.7 100.8 99.7Jan 17 99.7 99.7 100.3 100.0 100.3 101.5 99.0 99.6 99.7 101.0 99.2Feb 17 99.7 99.8 100.3 100.0 100.4 101.7 99.0 99.5 99.5 101.1 98.8Mar 17 99.7 99.7 100.4 100.1 100.5 102.0 99.1 99.5 99.4 101.1 98.5Apr 17 99.7 99.7 100.4 100.1 100.5 102.1 99.2 99.5 99.2 101.0 98.3May 17 99.6 99.6 100.4 100.1 100.5 102.3 99.4 99.6 99.0 100.9 98.2
Note: A rising composite leading indicator (CLI) reading points to an economic expansion if the index is above 100 and a recovery if it is below 100. A CLI that is declining points to an economic downturn if it is above 100 and a slowdown if it is below 100.
Source: OECD.
66
Deloitte Research thought leadership
Asia Pacific Economic Outlook, Q3 2017: Australia, Indonesia, Singapore, and South Korea
United States Economic Forecast, Q2 2017
Issues by the Numbers, July 2017: Income inequality in the United States: What do we know and what does it mean?
Please visit www.deloitte.com/research for the latest Deloitte Research thought leadership or contact Deloitte Services LP at: [email protected].
For more information about Deloitte Research, please contact John Shumadine, Director, Deloitte Research, part of Deloitte Services LP, at +1.703.251.1800 or via e-mail at [email protected].
Additional resources
67

Global Economic Outlook
Ian Stewart is chief economist, Deloitte UK.
Dr. Ira Kalish is chief global economist of Deloitte Touche Tohmatsu Limited.
Dr. Alexander Börsch is director of research, Deloitte Germany, Deloitte & Touche GmbH.
Dr. Patricia Buckley is director of Economic Policy and Analysis at Deloitte Research, Deloitte Services LP.
Dr. Rumki Majumdar is a macroeconomist and a manager at Deloitte Research, Deloitte Services LP.
Lester Gunnion is an economist and a senior analyst at Deloitte Research, Deloitte Services LP.
Akrur Barua is an economist and a manager at Deloitte Research, Deloitte Services LP.
About the authors
68

Global Economics TeamDr. Daniel BachmanDeloitte ResearchDeloitte Services LPUSATel: +1.202.220.2053E-mail: [email protected]
Akrur BaruaDeloitte Research Deloitte Services LP IndiaTel: +1.678.299.9766E-mail: [email protected]
Dr. Alexander Börsch Deloitte ResearchGermanyTel: +49.(0)89.29036.8689E-mail: [email protected]
Dr. Patricia Buckley Deloitte ResearchDeloitte Services LPUSATel: +1.517.814.6508E-mail: [email protected]
Lester Gunnion Deloitte Research Deloitte Services LPIndiaTel: +1.615.718.8559 E-mail: [email protected]
Dr. Ira KalishDeloitte Touche Tohmatsu LimitedUSATel: +1.213.688.4765E-mail: [email protected]
Dr. Rumki MajumdarDeloitte Research Deloitte Services LPIndiaTel: +1.470.434.4090E-mail: [email protected]
Aditi RaoDeloitte ResearchDeloitte Services LPIndiaTel: +1.470.434.3941E-mail: [email protected]
Ian Stewart Deloitte ResearchDeloitte & Touche LLPUKTel: +44.20.7007.9386E-mail: [email protected]
Global Industry LeadersConsumer and Industrial ProductsTim HanleyDeloitte Services LPUSATel: +1.414.688.2052E-mail: [email protected]
Energy & ResourcesRajeev ChopraDeloitte Touche Tohmatsu LimitedUKTel: +44.7775.785350E-mail: [email protected]
Financial ServicesBob ContriDeloitte Services LPUSATel: +1.917.327.0828E-mail: [email protected]
Life Sciences & Health CareGreg RehDeloitte Consulting LLPUSATel: +1.215.680.8913E-mail: [email protected]
Public SectorMike TurleyDeloitte Touche Tohmatsu LimitedUKTel: +1.44.7711.137213E-mail: [email protected]
Telecommunications, Media & TechnologyPaul SallomiDeloitte Tax LLPUSATel: +1.408.704.4100E-mail: [email protected]
US Industry LeadersFinancial ServicesKenny SmithDeloitte Consulting LLPTel +1.415.783.6148Email: [email protected]
Consumer & Industrial ProductsSeema PajulaDeloitte & Touche LLPTel: +1.312.486.1662E-mail: [email protected]
Life Sciences & Health CareBill CopelandDeloitte Consulting LLPTel: +1.215.446.3440E-mail: [email protected]
Energy & ResourcesJohn EnglandDeloitte & Touche LLPUSATel: +1.713.982.2556E-mail: [email protected]
Public Sector (Federal)Daniel HelfrichDeloitte Consulting LLPTel: +1.571.882.8308E-mail: [email protected]
Public Sector (State)Mark PriceDeloitte Consulting LLPTel: +1.617.585.5984E-mail: [email protected]
Telecommunications, Media & TechnologySandra ShiraiDeloitte Consulting LLPTel: +1.415.783.5515E-mail: [email protected]
Contact information
69

Global Economic Outlook
70

About Deloitte University Press Deloitte University Press publishes original articles, reports and periodicals that provide insights for businesses, the public sector and NGOs. Our goal is to draw upon research and experience from throughout our professional services organization, and that of coauthors in academia and business, to advance the conversation on a broad spectrum of topics of interest to executives and government leaders.
Deloitte University Press is an imprint of Deloitte Development LLC.
About this publication This publication contains general information only, and none of Deloitte Touche Tohmatsu Limited, its member firms, or its and their affiliates are, by means of this publication, rendering accounting, business, financial, investment, legal, tax, or other professional advice or services. This publication is not a substitute for such professional advice or services, nor should it be used as a basis for any decision or action that may affect your finances or your business. Before making any decision or taking any action that may affect your finances or your business, you should consult a qualified professional adviser.
None of Deloitte Touche Tohmatsu Limited, its member firms, or its and their respective affiliates shall be responsible for any loss whatsoever sustained by any person who relies on this publication.
About Deloitte Deloitte refers to one or more of Deloitte Touche Tohmatsu Limited, a UK private company limited by guarantee, and its network of member firms, each of which is a legally separate and independent entity. Please see www.deloitte.com/about for a detailed description of the legal structure of Deloitte Touche Tohmatsu Limited and its member firms. Please see www.deloitte.com/us/about for a detailed description of the legal structure of Deloitte LLP and its subsidiaries. Certain services may not be available to attest clients under the rules and regulations of public accounting.
Copyright © 2017 Deloitte Development LLC. All rights reserved. Member of Deloitte Touche Tohmatsu Limited
Follow @DU_Press
Sign up for Deloitte University Press updates at DUPress.com.