Embed Size (px)
Citation preview

Globalization InstituteFederal Reserve Bank of Dallas
GLOBAL ECONOMIC CONDITIONS
Updated May 2020

Table of Contents1. Indicators of Real Activity
Chart 1. Global GDP GrowthChart 2. OECD Industrial ProductionChart 3. Global Purchasing Managers Index Chart 4. Unemployment in Major Advanced EconomiesChart 5. Unemployment in OECD EconomiesChart 6. Volume of World Merchandise TradeChart 7. Volume of World Merchandise TradeChart 8. Baltic Dry Index
2. Inflation IndicatorsChart 9. Commodity PricesChart 10. Inflation in OECD Economies (CPI)Chart 11. Global Inflation (Headline CPI)Chart 12. Inflation in Major Advanced Economies (Headline CPI)Chart 13. Inflation in Major Emerging Economies (Headline CPI)
3. Money and Capital MarketsChart 14. Money Market SpreadsChart 15. 10-Year Government Bond Yields in Major Advanced EconomiesChart 16. Stock Market Indexes in Major Advanced EconomiesChart 17. Stock Market Indexes in Major Emerging Economies
4. Public FinancesChart 18. General Government Net Lending/Borrowing in Major Advanced EconomiesChart 19. General Government Net Lending/Borrowing in Major Emerging EconomiesChart 20. General Government Gross Debt in Major Advanced Economies
Economies
5. Monetary PolicyChart 22. Central Bank Policy Rates in Major Advanced
EconomiesChart 23. Central Bank Policy Rates in Major Emerging
EconomiesChart 24. Money Supply Growth in Major Advanced EconomiesChart 25. Money Supply Growth in Major Emerging Economies
6. U.S. External AccountsChart 26. U.S. Terms of TradeChart 27. U.S. Nominal Trade Balance, Customs ValueChart 28. U.S. Current Account BalanceChart 29. Nominal Value of the U.S. DollarChart 30. Real Value of the U.S. Dollar
7. Current AnalysisChart 31. Global Current Account BalancesChart 32. Bond Spreads for Select Euro Area EconomiesChart 33. Select Economies’ Banking Exposure to Peripheral Euro-Area Sovereign DebtChart 34. Sovereign Debt Repayment Schedule for Select Euro-Area Economies
Indicators of Real Activity
Globalization InstituteFederal Reserve Bank of Dallas

Sources: National Statistical Offices, International Monetary Fund; Haver Analytics Globalization Institute
Federal Reserve Bank of Dallas
-8
-6
-4
-2
0
2
4
6
8
10
12
2000 2002 2004 2006 2008 2010 2012 2014 2016 2018 2020
Chart 1. Global GDP Growth
World (2019 Q4 = 3.1)
Advanced Economies (ex. U.S.) (2019 Q4 = 0.9)
Emerging Economies (2019 Q4 = 4.6)
U.S. (2019 Q4 = 2.3)
Percent, Year/Year
NOTE: The advanced economies (ex. U.S.) aggregate includes the Euro Area, Japan, the U.K., Canada, Australia, South Korea, Switzerland and Sweden. The emerging economies aggregate includes China, Brazil, Russia, India, Mexico, Indonesia, Turkey, Argentina, South Africa and Colombia. The world aggregate includes these countries, which make up approximately 80 percent of world GDP computed using purchasing power parity (PPP)-adjusted GDP weights.

Sources: OECD; Haver Analytics Globalization Institute
Federal Reserve Bank of Dallas
80
85
90
95
100
105
110
115
120
2000 2002 2004 2006 2008 2010 2012 2014 2016 2018 2020
Index, 2005 = 100
Chart 2. OECD Industrial Production
NOTE: Countries included in the industrial production index are all members of the Organization for Economic Cooperation and Development, or OECD (Australia, Austria, Belgium, Canada, Chile, Czech Republic, Denmark, Estonia, Finland, France, Germany, Greece, Hungary, Iceland, Ireland, Israel, Italy, Japan, South Korea, Luxembourg, Mexico, Netherlands, New Zealand, Norway, Poland, Portugal, Slovak Republic, Slovenia, Spain, Sweden, Switzerland, Turkey, United Kingdom and United States).
Last Observation: Jan = 113.2

Globalization InstituteFederal Reserve Bank of DallasSources: JPMorgan; Bloomberg
35
40
45
50
55
60
2016 2017 2018 2019 2020
Index
Chart 3. Global Purchasing Managers Index
Manufacturing (Apr = 39.8)Services (Mar = 37.0)Composite (Mar = 39.4)
NOTE: This index measures purchasing managers' perspectives of current business conditions. An index value greater than 50 indicates economic expansion from the previous month, while a value below 50 indicates contraction.
Sources: National Statistical Offices, EUROSTAT; Haver Analytics Globalization Institute
Federal Reserve Bank of Dallas
0
2
4
6
8
10
12
14
2000 2002 2004 2006 2008 2010 2012 2014 2016 2018 2020
Percent
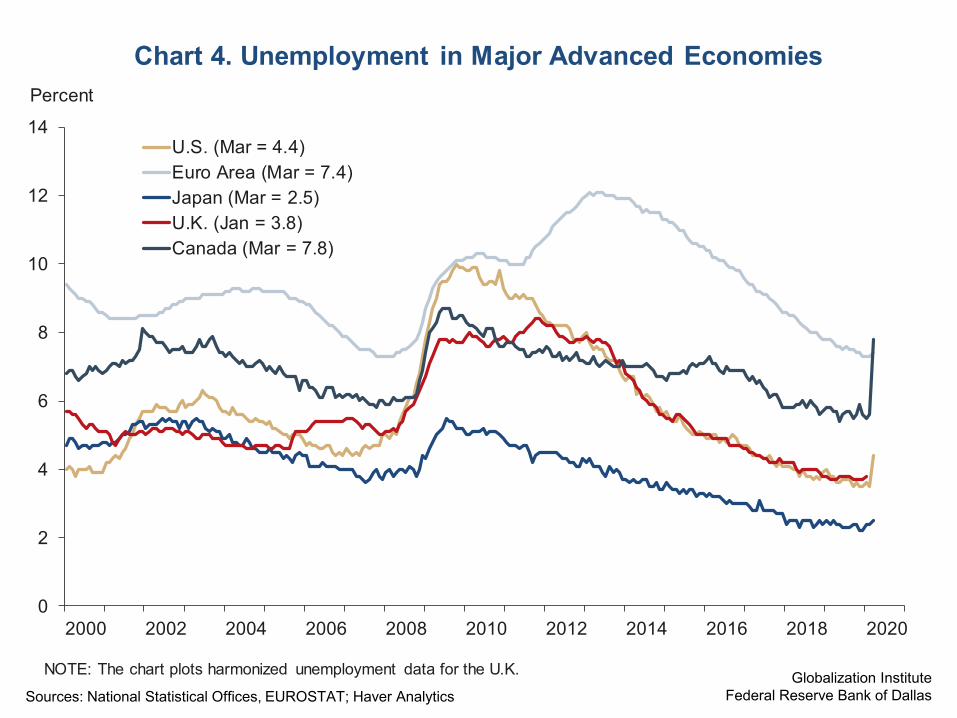
U.S. (Mar = 4.4)Euro Area (Mar = 7.4)Japan (Mar = 2.5)U.K. (Jan = 3.8)Canada (Mar = 7.8)
Chart 4. Unemployment in Major Advanced Economies
NOTE: The chart plots harmonized unemployment data for the U.K.

Sources: OECD; Haver Analytics Globalization Institute
Federal Reserve Bank of Dallas
0
1
2
3
4
5
6
7
8
9
2000 2002 2004 2006 2008 2010 2012 2014 2016 2018 2020
Percent
Chart 5. Unemployment in OECD Economies
Last Observation: Feb = 5.1

Sources: Netherlands Bureau for Economic Policy Analysis; Haver AnalyticsGlobalization Institute
Federal Reserve Bank of Dallas
40
60
80
100
120
140
160
180
200
1991 1993 1995 1997 1999 2001 2003 2005 2007 2009 2011 2013 2015 2017 2019
Chart 6. Volume of World Merchandise TradeIndex, 2000 = 100
NOTE: This series includes data from 23 industrialized and 60 emerging market economies and covers approximately 97 percent of total world trade. Trade volume is calculated as the arithmetic average of world export volumes and world import volumes.
Last Observation: Feb = 179.8
Sources: Netherlands Bureau for Economic Policy Analysis; Haver AnalyticsGlobalization Institute
Federal Reserve Bank of Dallas
0
40
80
120
160
200
240
280
320
'00 '02 '04 '06 '08 '10 '12 '14 '16 '18 '20
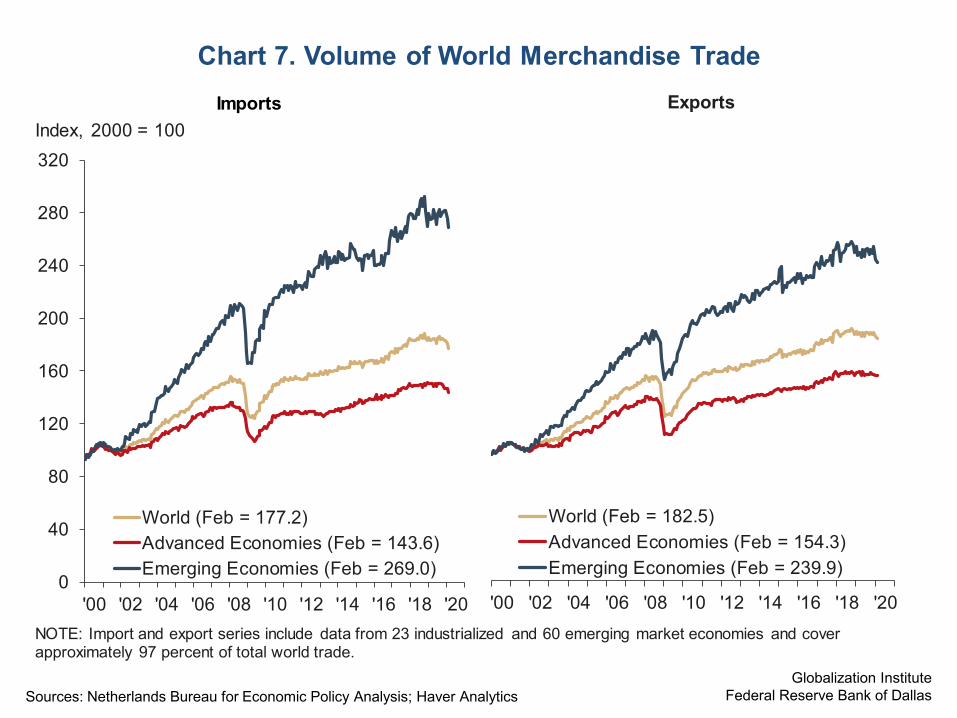
Chart 7. Volume of World Merchandise Trade
World (Feb = 177.2)Advanced Economies (Feb = 143.6)Emerging Economies (Feb = 269.0)
'00 '02 '04 '06 '08 '10 '12 '14 '16 '18 '20
World (Feb = 182.5)Advanced Economies (Feb = 154.3)Emerging Economies (Feb = 239.9)
Index, 2000 = 100
NOTE: Import and export series include data from 23 industrialized and 60 emerging market economies and cover approximately 97 percent of total world trade.
Imports Exports

Sources: Baltic Exchange; BloombergGlobalization Institute
Federal Reserve Bank of Dallas
0
2,000
4,000
6,000
8,000
10,000
12,000
14,000
2001 2003 2005 2007 2009 2011 2013 2015 2017 2019
Chart 8. Baltic Dry IndexIndex, 01/04/1985 = 1,000
NOTE: The Baltic Dry Index is a maritime shipping index that measures charter rates for shipping dry bulk commodities such as coal, grain and iron ore.
Last Observation: May 06 = 465

Inflation Indicators
Globalization InstituteFederal Reserve Bank of Dallas

Sources: Goldman Sachs; Haver Analytics Globalization Institute
Federal Reserve Bank of Dallas
0
50
100
150
200
250
300
350
2007 2008 2009 2010 2011 2012 2013 2014 2015 2016 2017 2018 2019 2020
Chart 9. Commodity Prices
Precious Metals (May 05 = 246.0)Agriculture and Livestock (May 05 = 97.3)Energy (May 05 = 46.1)Industrial Metals (May 05 = 61.7)
Index, Jan. 2007 = 100
Sources: OECD; Haver Analytics Globalization Institute
Federal Reserve Bank of Dallas
-1
0
1
2
3
4
5
6
2000 2002 2004 2006 2008 2010 2012 2014 2016 2018 2020
Percent, Year/Year
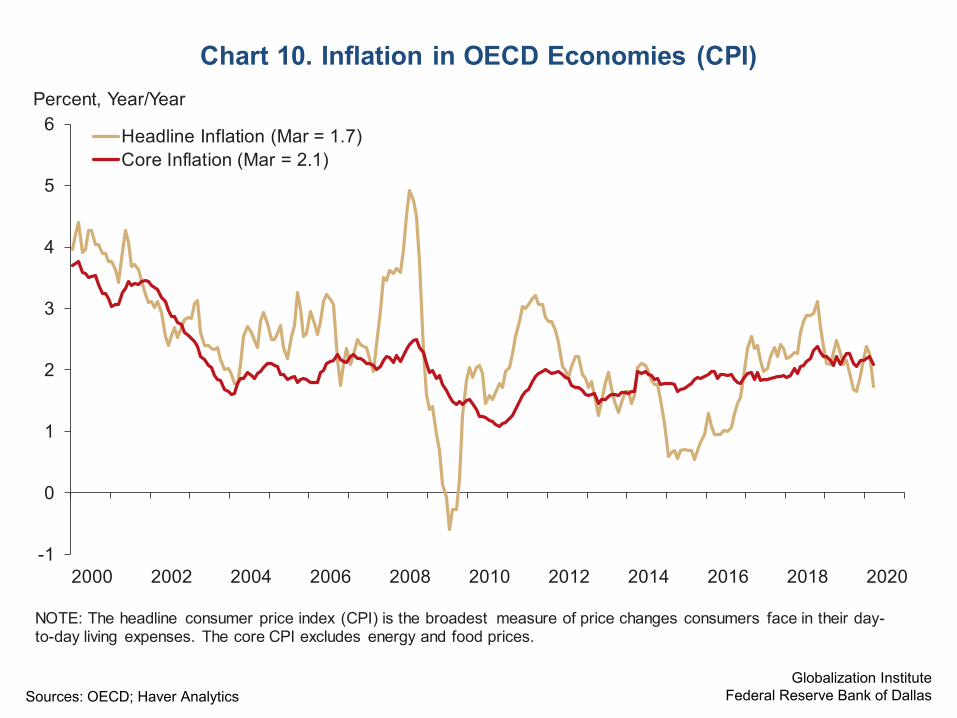
Chart 10. Inflation in OECD Economies (CPI)
Headline Inflation (Mar = 1.7)Core Inflation (Mar = 2.1)
NOTE: The headline consumer price index (CPI) is the broadest measure of price changes consumers face in their day-to-day living expenses. The core CPI excludes energy and food prices.

Sources: International Monetary Fund; Haver Analytics Globalization Institute
Federal Reserve Bank of Dallas
-2
0
2
4
6
8
10
12
2000 2002 2004 2006 2008 2010 2012 2014 2016 2018 2020
Percent, Year/Year
Chart 11. Global Inflation (Headline CPI)
World (Dec = 4.9)Advanced Economies (Dec = 1.6)Emerging Economies (Dec = 6.9)

Sources: National Statistical Offices, European Central Bank; Haver Analytics Globalization Institute
Federal Reserve Bank of Dallas
-6
-4
-2
0
2
4
6
2000 2002 2004 2006 2008 2010 2012 2014 2016 2018 2020
Chart 12. Inflation in Major Advanced Economies (Headline CPI)
U.S. (Mar = 1.5)Euro Area (Apr = 0.4)Japan (Mar = 0.4)U.K. (Mar = 1.5)Canada (Mar = 0.8)
Percent, Year/Year

Sources: National Statistical Offices; Haver Analytics Globalization Institute
Federal Reserve Bank of Dallas
-5
0
5
10
15
20
25
30
35
2000 2002 2004 2006 2008 2010 2012 2014 2016 2018 2020
Percent, Year/Year
Chart 13. Inflation in Major Emerging Economies (Headline CPI)
Brazil (Mar = 3.3)Russia (Mar = 2.5)India (Mar = 5.5)Indonesia (Apr = 2.7)China (Mar = 4.3)South Africa (Mar = 4.1)

Money and Capital Markets
Globalization InstituteFederal Reserve Bank of Dallas

Sources: Bloomberg, Haver Analytics Globalization Institute
Federal Reserve Bank of Dallas
-50
0
50
100
150
200
250
300
350
400
2007 2008 2009 2010 2011 2012 2013 2014 2015 2016 2017 2018 2019 2020
Chart 14. Money Market Spreads
U.S. Dollar (May 05 = 43.4)Euro (May 05 = 18.2)Japanese Yen (May 05 = 4.3)U.K. Pound Sterling (May 05 = 40)
Basis Points
NOTE: The chart plots the spread, or difference, between 3-month interbank offered rates (Libor for the dollar, yen and pound sterling; Euribor for the euro) and the overnight index swap rate for each currency.

Sources: Financial Times, Reuters, Bank of Canada; Haver Analytics Globalization Institute
Federal Reserve Bank of Dallas
-2
-1
0
1
2
3
4
5
6
2007 2008 2009 2010 2011 2012 2013 2014 2015 2016 2017 2018 2019 2020
Chart 15. 10-Year Government Bond Yieldsin Major Advanced Economies
U.S. (Dec 02 = 1.8)Euro Area (May 05 = -0.6)Japan (Dec 30 = 0.0)U.K. (Dec 30 = 0.7)Canada (May 05 = 0.6)
Percent

Sources: Financial Times, Wall Street Journal; Haver Analytics Globalization Institute
Federal Reserve Bank of Dallas
0
50
100
150
200
250
2007 2008 2009 2010 2011 2012 2013 2014 2015 2016 2017 2018 2019 2020
Chart 16. Stock Market Indexes in Major Advanced Economies
U.S. (May 05 = 192)Euro Area (May 05 = 70)Japan (May 01 = 114)U.K. (May 05 = 94)Canada (May 05 = 119)
Index, Jan. 2007 = 100
NOTE: Stock market indexes are the Dow Jones Industrial Average Index for the U.S, the EURO STOXX 50 Price Index for the Euro Area, the Nikkei 225 Average Index for Japan, the FTSE 100 Index for the U.K. and the S&P/TSX Composite Index

Sources: Financial Times, Wall Street Journal; Haver Analytics Globalization Institute
Federal Reserve Bank of Dallas
0
50
100
150
200
250
300
350
400
2007 2008 2009 2010 2011 2012 2013 2014 2015 2016 2017 2018 2019 2020
Chart 17. Stock Market Indexesin Major Emerging EconomiesBrazil (May 05 = 189) Russia (May 05 = 63)India (May 06 = 234) Indonesia (May 06 = 259)China (May 06 = 101) South Africa (May 05 = 203)
Index, Jan. 2007 = 100
NOTE: Stock market indexes are the Bovespa Index for Brazil, the RTS Index for Russia, the Bombay SENSEX for India, the Jakarta Composite for Indonesia, the New Shanghai Stock Exchange Composite Index for China and the Johannesburg Stock Exchange Top 40 Index for South Africa.

Public Finances
Globalization InstituteFederal Reserve Bank of Dallas

Globalization InstituteFederal Reserve Bank of DallasSources: International Monetary Fund; Haver Analytics
-14
-12
-10
-8
-6
-4
-2
0
2
4
2000 2002 2004 2006 2008 2010 2012 2014 2016 2018 2020
Chart 18. General Government Net Lending/Borrowing
U.S. (2019 = -5.8)Euro Area (2019 = -0.7)Japan (2019 = -2.8)U.K. (2019 = -2.1)Canada (2019 = -0.4)
Percent of GDP
NOTES: Data for 2019 are estimates; data for 2018 are estimates for all except U.K.

Globalization InstituteFederal Reserve Bank of DallasSources: International Monetary Fund; Haver Analytics
-12-10
-8-6-4-20
2000 2003 2006 2009 2012 2015 2018
Percent of GDP
-8
-4
0
4
8
12
2000 2003 2006 2009 2012 2015 2018
Percent of GDP
-12-10
-8-6-4-20
2000 2003 2006 2009 2012 2015 2018
Percent of GDP
-3
-2
-1
0
1
2000 2003 2006 2009 2012 2015 2018
Percent of GDP
Chart 19a. General Government Net Lending/Borrowing
NOTES: Data for 2019 are estimates; data for Russia in 2018 is an estimate.
Brazil (2019 = -6.0) Russia (2019 = 1.9)
India (2019 = -7.4) Indonesia (2019 = -2.2)

Globalization InstituteFederal Reserve Bank of DallasSources: International Monetary Fund; Haver Analytics
-7-6-5-4-3-2-101
2000 2003 2006 2009 2012 2015 2018
Percent of GDP
-8
-6
-4
-2
0
2
2000 2003 2006 2009 2012 2015 2018
Percent of GDP
Chart 19b. General Government Net Lending/Borrowing
NOTE: Data for 2019 are estimates; data for South Africa in 2018 is an estimate.
South Africa (2019 = -6.3)China (2019 = -6.4)
0
50
100
150
200
250
0
20
40
60
80
100
120
2000 2002 2004 2006 2008 2010 2012 2014 2016 2018 2020
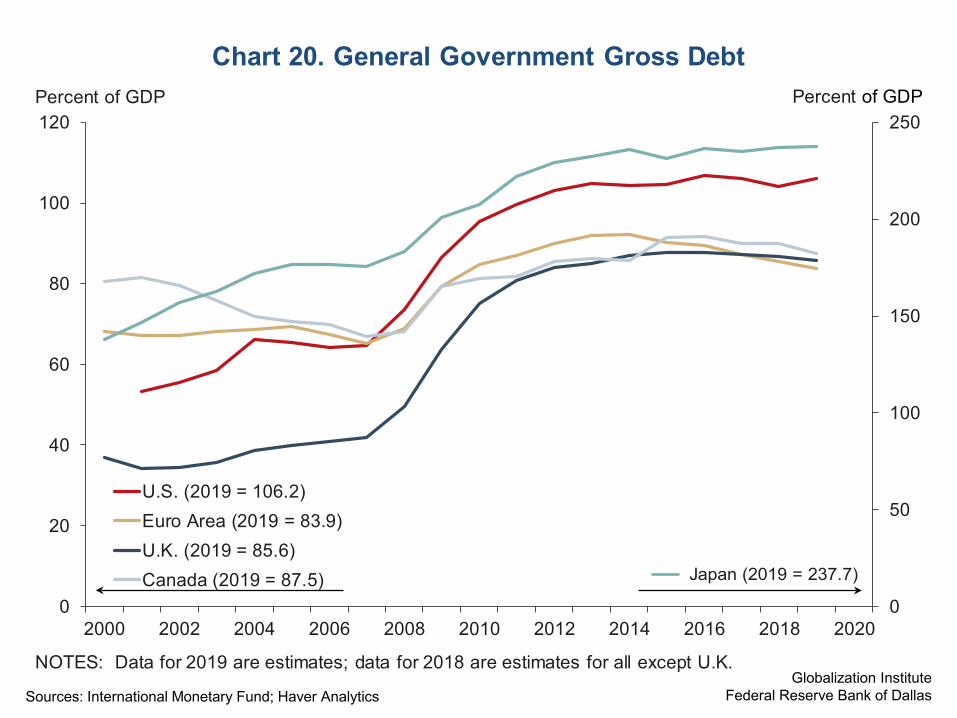
Chart 20. General Government Gross Debt
U.S. (2019 = 106.2)Euro Area (2019 = 83.9)U.K. (2019 = 85.6)Canada (2019 = 87.5)
NOTES: Data for 2019 are estimates; data for 2018 are estimates for all except U.K.
Percent of GDP Percent of GDP
Japan (2019 = 237.7)
Sources: International Monetary Fund; Haver Analytics Globalization Institute
Federal Reserve Bank of Dallas

Globalization InstituteFederal Reserve Bank of DallasSources: International Monetary Fund; Haver Analytics
556065707580859095
2000 2003 2006 2009 2012 2015 2018
Percent of GDP
Chart 21a. General Government Gross Debt
0102030405060
2000 2003 2006 2009 2012 2015 2018
Percent of GDP
55
65
75
85
2000 2003 2006 2009 2012 2015 2018
Percent of GDP
NOTES: Data for 2019 are estimates; data for Russia in 2018 is an estimate.
0
20
40
60
80
100
2000 2003 2006 2009 2012 2015 2018
Percent of GDP
Brazil (2019 = 91.6) Russia (2019 = 16.5)
India (2019 = 69.0) Indonesia (2019 = 30.3)

Globalization InstituteFederal Reserve Bank of DallasSources: International Monetary Fund; Haver Analytics
202530354045505560
2000 2003 2006 2009 2012 2015 2018
Percent of GDP
Chart 21b. General Government Gross Debt
253035404550556065
2000 2003 2006 2009 2012 2015 2018
Percent of GDP
NOTES: Data for 2019 are estimates; data for South Africa in 2018 is an estimate.
China (2019 = 55.6) South Africa (2019 = 59.9)

Monetary Policy
Globalization InstituteFederal Reserve Bank of Dallas

Sources: National Central Banks; Haver Analytics Globalization Institute
Federal Reserve Bank of Dallas
-1
0
1
2
3
4
5
6
7
2005 2006 2007 2008 2009 2010 2011 2012 2013 2014 2015 2016 2017 2018 2019 2020
Chart 22. Central Bank Policy Rates in Major Advanced Economies
U.S. (May 05 = 0.125)
Euro Area (May 06 = 0.00)
Japan (May 06 = -0.10)
U.K. (May 06 = 0.10)
Canada (May 06 = 0.25)
Percent
NOTES: The chart plots the federal funds rate for the U.S., the main refinancing operation rate for the Euro Area, the base rate for the U.K., the overnight target rate for Canada and the uncollateralized overnight call rate for Japan applied until April 3, 2013, before the main operating policy target changed to expanding the monetary base. On February 16, 2016, the Bank of Japan (BoJ) adopted negative interest rates applied to excess reserves that financial institutions hold at the BoJ. The Bank also introduced an interest rate target of around 0 percent for its 10-year government bond yields in September 2016.

Bank of Indonesia Rate (Aug 2016 = 6.50)
Repo Rate (May 06 = 4.40)
Bank of Russia Key Rate (May 06 = 5.50)
Sources: National Central Banks; Haver Analytics Globalization Institute
Federal Reserve Bank of Dallas
Brazil Russia
India Indonesia
Overnight SELIC Target Rate (May 06 = 3.75)
Reverse Repo Rate (May 06 = 3.75)
7-Day Reverse Repo Rate (May 06 = 4.50)
05
10152025
2005 2007 2009 2011 2013 2015 2017 2019
Percent
Chart 23a. Central Bank Policy Rates in Major EmergingEconomies
05
10152025
2005 2007 2009 2011 2013 2015 2017 2019
Percent
02468
10
2005 2007 2009 2011 2013 2015 2017 2019
Percent
02468
101214
2005 2007 2009 2011 2013 2015 2017 2019
Percent
NOTE: The Reserve Bank of India utilizes the repo rate to inject liquidity into the monetary system and the reverse repo rate to remove liquidity. On August 19, 2016, the Bank of Indonesia changed its policy rate from the BI rate to the 7-day reverse repo rate.

Average Repo Rate (May 06 = 4.25)
Sources: National Central Banks; Haver Analytics Globalization Institute
Federal Reserve Bank of Dallas
China South Africa
1-Year Lending Rate (Nov 21 = 4.15)
1-Year Deposit Rate (May 06 = 1.50)0
2
4
6
8
10
2005 2007 2009 2011 2013 2015 2017 2019
Percent
02468
101214
2005 2007 2009 2011 2013 2015 2017 2019
Percent
Chart 23b. Central Bank Policy Rates in Major EmergingEconomies

Sources: National Central Banks; Haver Analytics Globalization Institute
Federal Reserve Bank of Dallas
-10
-5
0
5
10
15
20
2005 2006 2007 2008 2009 2010 2011 2012 2013 2014 2015 2016 2017 2018 2019 2020
Chart 24. Money Supply Growth in Major Advanced Economies
U.S. (Mar = 13.7)Euro Area (Mar = 7.5)Japan (Mar = 3.3)U.K. (Mar = 8.1)Canada (Mar = 8.9)
Percent, Year/Year
NOTE: The chart plots MZM in the U.S, M2 in the Euro Area, Japan and Canada and M4 in the U.K.

Sources: National Central Banks; Haver Analytics Globalization Institute
Federal Reserve Bank of Dallas
-30
-20
-10
0
10
20
30
40
50
60
70
2005 2006 2007 2008 2009 2010 2011 2012 2013 2014 2015 2016 2017 2018 2019 2020
Chart 25. Money Supply Growth in Major Emerging Economies
Brazil (Mar = 12.4)Russia (Mar = 13.4)India (Mar = 10.6)Indonesia (Mar = 12.1)China (Mar = 10.1)South Africa (Mar = 10.9)
Percent, Year/Year
NOTE: The chart plots M2 for each country.

U.S. External Accounts
Globalization InstituteFederal Reserve Bank of Dallas

Sources: U.S. Bureau of Labor Statistics; Haver Analytics Globalization Institute
Federal Reserve Bank of Dallas
80
85
90
95
100
105
110
115
120
125
1990 1992 1994 1996 1998 2000 2002 2004 2006 2008 2010 2012 2014 2016 2018 2020
Chart 26. U.S. Terms of Trade
Terms of Trade (Mar = 102.5)
Terms of Trade (Excluding Oil) (Mar = 88.8)
Index, Jan. 1990 = 100
NOTE: U.S. terms of trade are calculated as the import price index/export price index.

Sources: Census Bureau; Haver Analytics Globalization Institute
Federal Reserve Bank of Dallas
-90
-80
-70
-60
-50
-40
-30
-20
-10
0
2000 2002 2004 2006 2008 2010 2012 2014 2016 2018 2020
Chart 27. U.S. Nominal Trade Balance, Customs Value
Bil. U.S. Dollars
NOTE: The chart plots the nominal trade balance in goods.
Last Observation: Mar = -64.4

Sources: U.S. Bureau of Economic Analysis; Haver Analytics Globalization Institute
Federal Reserve Bank of Dallas
-7
-6
-5
-4
-3
-2
-1
0
2000 2002 2004 2006 2008 2010 2012 2014 2016 2018 2020
Chart 28. U.S. Current Account BalancePercent of GDP
NOTE: All values are nominal.
Last Observation: 2019 Q4 = -2.0

Sources: Federal Reserve Board; Haver Analytics Globalization Institute
Federal Reserve Bank of Dallas
50
60
70
80
90
100
110
120
130
140
2000 2002 2004 2006 2008 2010 2012 2014 2016 2018 2020
Chart 29. Nominal Value of the U.S. Dollar
Nominal Exchange Value of the U.S. Dollar (Apr = 117.4)U.S. Dollar vs. Major Currencies (Apr = 99.3)U.S. Dollar vs. Other Important Trading Partners (Apr = 145.5)
Index, Jan. 2000 = 100
NOTE: Countries or regions whose currencies are included in the major currencies index are the Euro Area, Canada, Japan, United Kingdom, Switzerland, Australia and Sweden. Countries included in the other important trading partners index are Mexico, China, Taiwan, Korea, Singapore, Hong Kong, Malaysia, Brazil, Thailand, Philippines, Indonesia, India, Israel, Saudi Arabia, Russia, Argentina, Venezuela, Chile and Colombia. An increase in each index represents an appreciation of the U.S. dollar and a decrease represents a depreciation.

Sources: Federal Reserve Board; Haver Analytics Globalization Institute
Federal Reserve Bank of Dallas
60
70
80
90
100
110
120
2000 2002 2004 2006 2008 2010 2012 2014 2016 2018 2020
Chart 30. Real Value of the U.S. Dollar
Real Exchange Value of the U.S. Dollar (Apr = 109.9)U.S.Dollar vs. Major Currencies (Apr = 112.3)U.S.Dollar vs. Other Important Trading Partners (Apr = 109.6)
Index, Jan. 2000 = 100
NOTE: Countries or regions whose currencies are included in the major currencies index are the Euro Area, Canada, Japan, United Kingdom, Switzerland, Australia and Sweden. Countries included in the other important trading partners index are Mexico, China, Taiwan, Korea, Singapore, Hong Kong, Malaysia, Brazil, Thailand, Philippines, Indonesia, India, Israel, Saudi Arabia, Russia, Argentina, Venezuela, Chile and Colombia. An increase in each index represents an appreciation of the U.S. dollar and a decrease represents a depreciation.

Current Analysis
Globalization InstituteFederal Reserve Bank of Dallas

Sources: International Monetary Fund; Haver Analytics Globalization Institute
Federal Reserve Bank of Dallas
-1500
-1000
-500
0
500
1000
1500
1990 1992 1994 1996 1998 2000 2002 2004 2006 2008 2010 2012 2014 2016 2018 2020
Chart 31. Global Current Account Balances
Bil. U.S. Dollars
U.S.
China
Japan
Others
Oil Exporters
Germany
NOTE: Oil exporting countries are Algeria, Indonesia, Iran, Iraq, Kuwait, Libya, Nigeria, Oman, Qatar, Saudi Arabia, United Arab Emirates and Venezuela. The remaining countries not already listed for which there is data comprise "Others". Striped columns denote forecasts.
Sources: Reuters; Haver Analytics Globalization Institute
Federal Reserve Bank of Dallas
0
500
1000
1500
2000
2500
3000
3500
4000
2007 2008 2009 2010 2011 2012 2013 2014 2015 2016 2017 2018 2019 2020
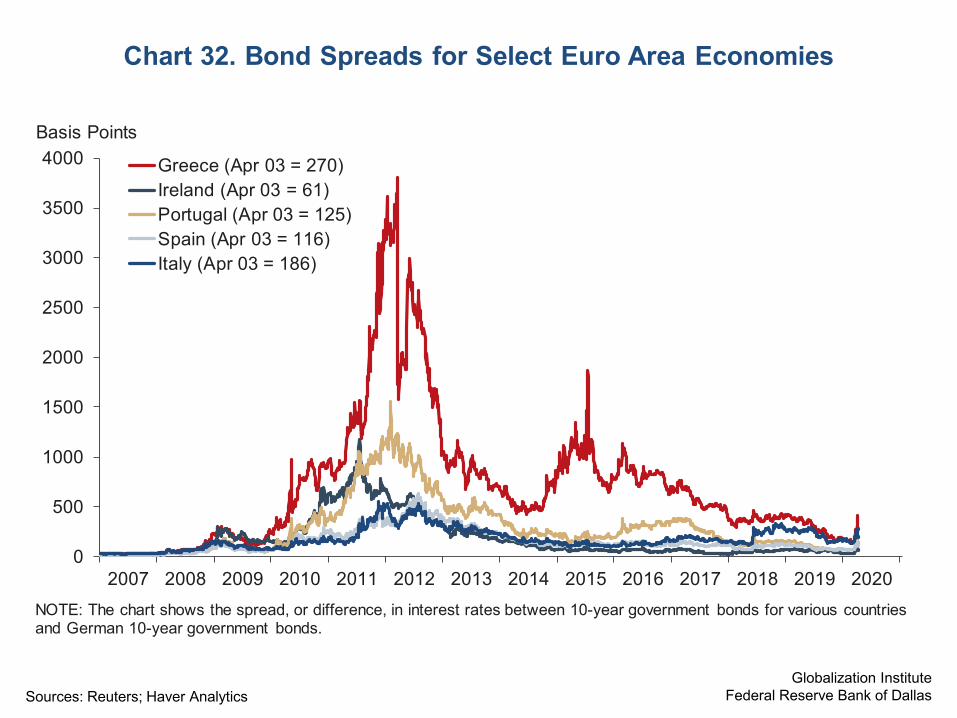
Chart 32. Bond Spreads for Select Euro Area Economies
Greece (Apr 03 = 270)Ireland (Apr 03 = 61)Portugal (Apr 03 = 125)Spain (Apr 03 = 116)Italy (Apr 03 = 186)
Basis Points
NOTE: The chart shows the spread, or difference, in interest rates between 10-year government bonds for various countries and German 10-year government bonds.

Globalization InstituteFederal Reserve Bank of DallasSources: Bank for International Settlements, International Monetary Fund; Haver Analytics
0
5
10
15
20
France U.K. Germany Belgium IrelandSwitzerland Spain Austria Italy U.S. Japan Sweden Canada
Chart 33. Select Economies' Banking Exposure to Peripheral Euro-Area Sovereign Debt
GreeceIrelandPortugalSpainItaly
Percent of GDP
NOTES: The chart plots the claims that banks in each country have, as a share of its 2018 GDP, on sovereign debt in Greece, Ireland, Portugal, Spain and Italy. All GDP values are based on International Monetary Fund estimates. All values are nominal.
Q3 2019

Globalization InstituteFederal Reserve Bank of DallasSources: Bloomberg, International Monetary Fund; Haver Analytics
13
17
12
14
11
8
11
67 8
9
13
10
8
11
3
2
42 3
8
34 5
4
0
5
10
15
20
2020 2021 2022 2023 2024
GreeceIrelandPortugalSpainItaly
Percent of GDP
Chart 34. Sovereign Debt Repayment Schedulefor Select Euro-Area Economies
NOTES: Repayment amounts include both principal and accrued interest. All GDP values are projections from the International Monetary Fund. All values are nominal.