Embed Size (px)
Citation preview

1
Global Change Teaching Unit: Thinking as a Scientist – Acid Rain By Naomi Ojala Unit Overview: This unit is constructed for an eighth grade general science class. This unit addresses the causes and effects of acid rain and investigates the possible relationship between the pH and the amount of precipitation. This is a technology rich and interdisciplinary unit plan which introduces students to reputable web resources pertaining to acid rain and acid rain research. Students are challenged to develop and use critical thinking skills while completing the lessons and activities. This unit can be incorporated into the curriculum while studying global change or as an extension to planning an investigation. Alternative methods for implementing this lesson are provided and suggestions are provided for classrooms with limited access to computers. It is suggested to start each lesson with a question and answer session about the previous lesson. Classroom discourse is encouraged throughout the unit. An answer key and rubric are provided at the end of this unit plan. A portfolio of the unit activities and final reflection will be assessed. The teacher may find it beneficial to collect lessons daily so they are easily accessed when the students are ready to assemble their portfolios. References Lesson #1: EPA, Acid Rain Students’ Site, http://www.epa.gov/acidrain/site_students/index.html USGS, What is acid rain? [Online] Available http://pubs.usgs.gov/gip/acidrain/2.html , July 21, 1997 Almanac of Policy Issues, Adapted from "Acid Rain", Environmental Protection Agency, What is Acid Rain and What Causes It?, [Online] Available http://www.policyalmanac.org/environment/archive/acid_rain.shtml , August 6, 2002 Lesson #2:
Thompson, Don, Associated Press Writer, Pollution shifting rain patterns in Sierra, worldwide, [Online] Available http://healthandenergy.com/pollution_shifts_rainfall.htm , Health and Energy Company, June 10, 2004
San Diego Earth Times, Air pollution can prevent rainfall, provided by American Association for the Advancement of Science, [Online] Available http://www.sdearthtimes.com/et0400/et0400s8.html , April 2000
Rosenfeld, Daniel, Suppression of Rain and Snow by Urban and Industrial Air Pollution, [Online] Available, http://earth.huji.ac.il/data/pics/Science_Smoke.pdf , www.sciencemag.org SCIENCE VOL 287 March 10, 2000 Lesson #3 GLOBE online at http://www.globe.gov/, Investigate the Earth System using GLOBE data and visualization tools [Online] Available, http://viz.globe.gov/viz-bin/show.cgi?l=en&b=g&rg=n&enc=00&nav=1&page=gallery-activity.ht

2
Lesson #4 National Atmospheric Deposition Program (NRSP-3). 2006. NADP Program Office, Illinois State Water Survey, 2204 Griffith Dr., Champaign, IL 61820 [Online] Available, http://nadp.sws.uiuc.edu/ Lesson #5 United States Environmental Protection Agency, Clean Air Status and Trends Network (CASTNET), [Online] Available http://www.epa.gov/castnet//deposition.html Learning Objectives: Cognitive - Students will be able to: • Reflect on prior knowledge to solve problems. (knowledge and comprehension) • Use collaborative effort to investigate a real world problem. (application) • Use technology to explore and create texts. (application and synthesis) • Construct and use scientific knowledge to interpret data. (knowledge and synthesis) • Recognize reputable sources of scientific information. (analysis) • Recognize the diversity of the scientific community. (analysis) • Use collaborative effort to analyze data. (analysis) • Construct and interpret graphs and charts. (application and evaluation) • Access online resources using web addresses, links and Google search engine.
(application) • Give examples of causes of acid deposition. (comprehension) • Describe chemical components of acid deposition and lists its effects. (knowledge) • Recognize acidic compounds when given the pH. (analysis) • Explain effects of acid deposition on ecosystems. (comprehension) • Explain effects of acid deposition on the hydrosphere and geosphere. (comprehension) • Compute: mean, median, mode and range using data from graph. (application) • Formulate conclusion based on mathematical data. ( synthesis) • Read scientific information and utilizes information to answer questions. (knowledge and
application) • Identify the location of hometown using US map. (knowledge) • Determine direction of pollution track drift based on magnetic North. (application) • Formulate conclusion based on given data. (application) • Compile data and infer from their investigative results. (synthesis and evaluation) • Prepare individual portfolios of lessons as well as a collaborative final paper summarizing
the unit. (comprehension and evaluation) Affective – Students will: • Cooperate with others during collaborative activities. (responding) • Offer suggestions and opinions of investigative process and results. (valuing) • Form judgments about most reasonable solution to the problem. (organizing) • Communicate findings. (internalizing) Psychomotor - Students will: • Manipulate computer to make tables, charts and graphs. (manipulating) • Describe what they have learned in a final paper. (communicating) • Create a final report and portfolio. (creating)

3
Michigan Content Benchmarks SCIENCE Constructing New Scientific Knowledge (C) I.1 All students will ask questions that help them learn about the world: 1. Generate scientific questions about the world based on observation. Key concepts: Scientific questions can be answered by gathering and analyzing evidence about the world. Real-world contexts: Any in the sections on Using Scientific Knowledge. All students will design and conduct investigations using appropriate methodology and technology: 3. Use tools and equipment appropriate to scientific investigations. Tools: various data collection tools suitable for this level, including computers. Real-world contexts: Any suggested in Using Scientific Knowledge benchmarks for which students would design and/or conduct investigations. All students will learn from books and other sources of information: 5. Use sources of information in support of scientific investigations. Tools: Periodicals, reference books, trade books, web sites, computer software; forms for presenting scientific information, such as figures, tables, graphs. See R-II.1 m.1 (evaluate strengths/weaknesses of claims). Real-world contexts: Libraries, projects where research is needed. Reflecting on Scientific Knowledge (R) II.1 All students will analyze claims for their scientific merit and explain how scientists decide what constitutes scientific knowledge: 1. Evaluate the strengths and weaknesses of claims, arguments, or data. Key concepts: Aspects of arguments such as data, evidence, sampling, alternate explanation, conclusion; inference, observation. Real-world contexts: Deciding between alternate explanations or plans for solving problems; evaluating advertising claims or cases made by interest groups; evaluating sources of references. 2. Describe limitations in personal knowledge. Key concepts: Recognizing degrees of confidence in ideas or knowledge from different sources, evaluating dates and sources of references. Real-world contexts: Any in the sections on Using Scientific Knowledge. All students will show how science is related to other ways of knowing: 3. Show how common themes of science, mathematics, and technology apply in real-world contexts. Thematic ideas: Systems-subsystems, feedback models, mathematical constancy, scale, conservation, structure, unction, adaptation. Real-world contexts: Any in the sections on Using Scientific Knowledge. All students will show how science and technology affect our society: 4. Describe the advantages and risks of new technologies. Key concepts: Risk, benefit, side effect, advantage, disadvantage. Real-world contexts: Technological systems for manufacturing, transportation, energy distribution, housing, edicine (such as cloning, genetic engineering). 5. Develop an awareness of and sensitivity to the natural world. Key concepts: Appreciation of the balance of nature and the effects organisms have on each other, including the effects humans have on the natural world. Real-world contexts: Any in the sections on Using Scientific Knowledge appropriate to middle school. All students will show how people of diverse cultures have contributed to and influenced developments in science: 6. Recognize the contributions made in science by cultures and individuals of diverse backgrounds. Key concepts: Cultural contributions to science, contributions made by people of diverse backgrounds.

4
Real-world contexts: Biographies of minority and female scientists; histories of cultural contributions to science. Evolution (LE) III.4 All students will compare ways that living organisms are adapted (suited) to survive and reproduce in their environments and explain how species change through time: 2. Explain how new traits might become established in a population and how species become extinct. Key concepts: Environmental change, variation in populations, reproductive success. Real-world contexts: Examples of inheritable and non-inheritable variations, such as white-eyed fruit fly or scars; examples of variations due to new gene combinations, such as hybrid organisms. All students will analyze how humans and the environment interact: 6. Describe ways in which humans alter the environment. Key concepts: Agriculture, land use, renewable and non-renewable resource development, resource use, solid waste, toxic waste. Biodiversity. See EG-V.1m.5, EH-V.2 m.3, EAW-V.3 m.4. Real-world contexts: Human activities, such as farming, pollution from manufacturing and other sources, hunting, habitat destruction, land development, reforestation, species reintroduction. Changes in Matter (PCM) IV.2 All students will explain how changes in matter are related to changes in energy and how living things and human technology change matter and transform energy. 4. Describe common energy transformations in everyday situations. Key concepts: Forms of energy, including mechanical, heat, sound, light, electrical, magnetic, chemical, food nergy. See PME-IV.1 m.5 (electricity in circuits), PCM-IV.2 m.1 (energy in changes of state). Total amount of energy remains constant in all transformations. Real-world contexts: Motors, generators, power plants, light bulbs, appliances, cars, radios, TV’s, walking, playing a musical instrument, cooking food, batteries, body heat, photosynthesis (see LO-III.2 m.3, LEC-III.5 m.2). Geosphere (EG) V.1 All students will describe and explain how the earth’s features change over time: 3. Explain how rocks are broken down, how soil is formed and how surface features change. Key concepts: Chemical and mechanical weathering; erosion by glaciers, water, wind and downslope movement; decomposition, humus. Real-world contexts: Regions in Michigan where erosion by wind, water, or glaciers may have occurred, such as river valleys, gullies, shoreline of Great Lakes; chemical weathering from acid rain, formation of caves, caverns and sink holes; physical weathering, frost action such as potholes and cracks in sidewalks; plant roots by bacteria, fungi, worms, rodents, other animals. Hydrosphere (EH) V.2 All students will describe the characteristics of water and demonstrate where water is found on earth: 1. Use maps of the earth to locate water in its various forms and describe conditions under which they exist. Key concepts: Liquid water forms—lakes, rivers, oceans, springs. Frozen water forms—continental glacier, valley glacier, snow on mountains, polar cap. Gaseous water in atmosphere. Tools: Relief and elevation maps; satellite images Real-world contexts: Local lakes, rivers, streams, ponds, springs; examples of frozen water, including snow, laciers, icebergs, polar regions, frozen Great Lakes shorelines. All students will describe how water moves: 2. Describe how surface water in Michigan reaches the ocean and returns. Key concepts: Water path—run-off, creeks, streams, wetlands, rivers, Great Lakes. Sources—snow melt, rain fall. Gravity. Water cycle—see EAW-V.3 m.3. (See EH-V.2 m.3 about groundwater.) Real-world contexts: Maps showing streams, lakes, rivers, oceans; examples of motions of rivers and lakes; investigations of rivers and lake temperatures; saltiness of ocean. All students will analyze the interaction of human activities with the hydrosphere: 4. Describe the origins of pollution in the hydrosphere.

5
Key concepts: Sources of pollution—sewage, household dumping, industrial wastes, agricultural run-off. See EG-V.1 m.5, LEC-III.5 m.6. Real-world contexts: Examples of polluted water; examples of occasions when water supply is restricted, such as during droughts. All students will investigate and describe what makes up weather and how it changes from day to day, from season to season and over long periods of time: 1. Explain patterns of changing weather and how they are measured. Key concepts: Weather patterns—cold front, warm front, stationary front, air mass, humidity. Tools: Thermometer, rain gauge, wind direction indicator, anemometer, weather maps, satellite weather images. Real-world contexts: Sudden temperature and cloud formation changes; records, charts, and graphs of weather changes over periods of days; lake effect snow. All students will explain what causes different kinds of weather: 2. Describe the composition and characteristics of the atmosphere. Key concepts: Composition—air, molecules, gas, water vapor, dust particles, ozone. Characteristics— air pressure and temperature changes with altitude, humidity. Real-world contexts: Examples of characteristics of the atmosphere, including pressurized cabins in airplanes, demonstrations of air pressure; examples of air-borne particulates, such as smoke, dust, pollen, bacteria; effects of humidity, such as condensation, dew on surfaces, comfort level of humans. 3. Explain the behavior of water in the atmosphere. Key concepts: Water cycle—evaporation, water vapor, warm air rises, cooling, condensation, clouds. Precipitation—rain, snow, hail, sleet, freezing rain. Relative humidity, dew point, fog. See PCM-IV.2 m.1 (changes of state), EH-V.2 m.2 (water on the earth’s surface). Real-world contexts: Aspects of the water cycle in weather, including clouds, fog, precipitation, evaporating puddles, flooding, droughts. All students will analyze the relationships between human activities and the atmosphere: 4. Describe health effects of polluted air. Key concepts: Effects—breathing difficulties, irritated eyes. Sources—car exhaust, industrial emissions. Acid rain. Real-world contexts: Locations and times where air quality is poor; local sources of potential air pollution; ozone warnings. SOCIAL STUDIES II. Geographic Perspective Content Standard 2: All students will describe, compare, and explain the locations and characteristics of ecosystems, resources, human adaptation, environmental impact, and the interrelationships among them. (Human/Environment Interaction) 4. Explain how humans modify the environment and describe some of the possible consequences of those modifications. 5. Describe the consequences of human/environment interactions in several different types of environment. Content Standard 5: All students will describe and explain the causes, consequences, and geographic context of major global issues and events. (Global Issues and Events) 1. Describe how social and scientific changes in regions may have global consequences. V. Inquiry Content Standard 1: All students will acquire information from books, maps, newspapers, data sets and other sources, organize and present the information in maps, graphs, charts and timelines, interpret the meaning and significance of information, and use a variety of electronic technologies to assist in accessing and managing information. (Information Processing) 1. Locate and interpret information about the natural environments and cultures of countries using a variety of primary and secondary sources and electronic technologies, including computers and telecommunications where appropriate. 2. Use traditional and electronic means to organize social science information and to make maps, graphs, and tables.

6
VI. Public Discourse and Decision Making Content Standard 2: All students will engage their peers in constructive conversation about matters of public concern by clarifying issues, considering opposing views, applying democratic values, anticipating consequences, and working toward making decisions. (Group Discussion) 1. Engage each other in conversations which attempt to clarify and resolve national and international policy issues. Content Standard 3: All students will compose coherent written essays that express a position on a public issue and justify the position with reasoned arguments. (Persuasive Writing) 1. Compose essays expressing decisions on national and international policy issues. VII. Citizen Involvement Content Standard 1: All students will consider the effects of an individual’s actions on other people, how one acts in accordance with the rule of law, and how one acts in a virtuous and ethically responsible way as a member of society. (Responsible Personal Conduct 2. Engage in activities intended to contribute to solving a national or international problem they have studied. MATHEMATICS II. Geometry and Measurement Content Standard 2: Students identify locations of objects, identify location relative to other objects, and describe the effects of transformations (e.g., sliding, flipping, turning, enlarging, reducing) on an object. (Position) 2. Locate and describe objects in terms of their orientation and relative position, including coincident, collinear, arallel, perpendicular; differentiate between fixed (e.g., N- S- E- W) and relative (e.g., right-left) orientations; recognize and describe examples of bilateral and rotational symmetry. III. Data Analysis and Statistics Content Standard 1: Students collect and explore data, organize data into a useful form, and develop skill in representing and reading data displayed in different formats. (Collection, Organization and Presentation of Data) 1. Collect and explore data through observation, measurement, surveys, sampling techniques and simulations. 2. Organize data using tables, charts, graphs, spreadsheets and data bases. 3. Present data using a variety of appropriate representations and explain why one representation is preferred over another or how a particular representation may bias the presentation. 4. Identify what data are needed to answer a particular question or solve a given problem, and design and implement strategies to obtain, organize and present those data. Content Standard 2: Students examine data and describe characteristics of a distribution, relate data to the situation from which they arose, and use data to answer questions convincingly and persuasively. Description and Interpretation) 1. Critically read data from tables, charts or graphs and explain the source of the data and what the data represent. 3. Draw, explain and justify conclusions based on data. 4. Critically question the sources of data; the techniques used to collect, organize and present data; the inferences drawn from the data; and the possible sources of bias in the data or their presentation. 5. Formulate questions and problems and gather and interpret data to answer those questions.

7
Content Standard 3: Students draw defensible inferences about unknown outcomes, make predictions, and identify the degree of confidence they have in their predictions. (Inference and Prediction) 3. Formulate and communicate arguments and conclusions based on data and evaluate their arguments and those of others. 4. Make predictions and decisions based on data, including interpolations and extrapolations. IV. Number Sense and Numeration Content Standard 3: Students investigate relationships such as equality, inequality, inverses, factors and multiples, and represent and compare very large and very small numbers. (Number Relationships) 1. Compare and order integers and rational numbers using relations of equality and inequality. ENGLISH LANGUAGE ARTS MEANING AND COMMUNICATION Content Standard 1: All students will read and comprehend general and technical material. 1. Use reading for multiple purposes, such as enjoyment, clarifying information, and learning complex procedures. 3. Employ multiple strategies to construct meaning, such as generating questions, studying vocabulary, analyzing mood and tone, recognizing how authors use information, generalizing ideas, matching form to content, and developing reference skills. 5. Respond to a variety of oral, visual, written, and electronic texts by making connections to their personal lives and the lives of others. Content Standard 2: All students will demonstrate the ability to write clear and grammatically correct sentences, paragraphs, and compositions. 1. Write fluently for multiple purposes to produce compositions, such as personal narratives, persuasive essays, lab reports, and poetry. Content Standard 3: All students will focus on meaning and communication as they listen, speak, view, read, and write in personal, social, occupational, and civic contexts. 1. Integrate listening, viewing, speaking, reading, and writing skills for multiple purposes and in varied contexts. An example is using all the language arts to prepare and present a unit project on career exploration. 2. Begin to implement strategies to regulate effects of variables of the communication process. An example is selecting a format for the message to influence the receiver’s response. 8. Express their responses and make connections between oral, visual, written, and electronic texts and their own lives. DEPTH OF UNDERSTANDING Content Standard 9: All students will demonstrate understanding of the complexity of enduring issues and recurring problems by making connections and generating themes within and across texts. 1. Explore and reflect on universal themes and substantive issues from oral, visual, and written texts. Examples include coming of age, rights and responsibilities, group and individual roles, conflict and cooperation, creativity, and resourcefulness. 2. Synthesize content from multiple texts representing varied perspectives in order to formulate principles and generalizations. 3. Develop a thesis using key concepts, supporting evidence, and logical argument.

8
IDEAS IN ACTION Content Standard 10: All students will apply knowledge, ideas, and issues drawn from texts to their lives and the lives of others. 1. Analyze themes and central ideas in literature and other texts in relation to issues in their own lives. 2. Perform the daily functions of a literate individual. Examples include acquiring information from multiple sources and then evaluating, organizing, and communicating it in various contexts. 3. Use oral, written, and visual texts to identify and research issues of importance that confront adolescents, their community, their nation, and the world. Examples include using research findings to organize and create texts to persuade others to take a particular position or to alter their course of action with regard to a particular school/ community issue or problem. INQUIRY AND RESEARCH Content Standard 11: All students will define and investigate important issues and problems using a variety of resources, including technology, to explore and create texts. 1. Generate questions about important issues that affect them or topics about which they are curious; narrow the questions to a clear focus; and create a thesis or a hypothesis. 2. Explain and use resources that are most appropriate and readily available for investigating a particular question or topic. Examples include knowledgeable people, field trips, tables of contents, indexes, glossaries, icons/headings, hypertext, storage addresses, CDROM/laser disks, electronic mail, and library catalogue databases. 3. Organize, analyze, and synthesize information to draw conclusions and implications based on their investigation of an issue or problem.

9
Lesson #1: What is Acid Rain? Rationale: Students will engage in using online resources to investigate acid rain. They will visit several internet sites to discover what causes acid rain, the chemical characteristics of acid rain and the effects of acid rain on the environment. Materials needed:
• Access to computers. (The teacher will need to reserve the computer lab in advance. If the teacher can project his/her computer screen there is a very good animated presentation on the site at: http://www.epa.gov/acidrain/site_students/acid_anim.html If computer access is not available, the teacher may print out information from the sites in advance and pass copies out to the students. ).
• EPA Acid Rain Crossword Puzzle for each student • Copy of Lesson #1 discussion questions for each student
Activity: 1) Write the site addresses on the board and have the students log-in to the EPA’s Acid Rain Students Site and begin to explore the site. Students may work in groups of two or three to explore the site; however each student must turn in their own worksheets. (5 min) EPA, Acid Rain Students’ Site, http://www.epa.gov/acidrain/site_students/index.html 2) After everyone has accessed the site, allow the students to explore the site for about five minutes before handing out the crossword puzzles. There are five different links on the acid rain site that they will need to explore in order to complete the puzzle. (5 min) 3) Allow the students to discuss their answers in their groups and complete the puzzle. (10 min) 4) Have the students log in to the USGS site and explore the information on the web page. (5 min) USGS, What is acid rain? [Online] Available http://pubs.usgs.gov/gip/acidrain/2.html , July 21, 1997 5) Have the students log in to the policyalmanac.org site and explore the information on the web page. (5 min) Almanac of Policy Issues, Adapted from "Acid Rain", Environmental Protection Agency, What is Acid Rain and What Causes It?, [Online] Available http://www.policyalmanac.org/environment/archive/acid_rain.shtml, August 6, 2002 6) Pass out the Lesson #1 Discussion Questions and have the students use what they have learned from the last two sites to answer the discussion questions. Encourage discourse among students as a class. (10 min)

10
PRINTER FRIENDLY VERSION
DIRECTIONS Read each clue below. Then find the number in the puzzle that corresponds to each clue. To assist you, there is a list of possible answers to each clue below the puzzle. Now it is time to see how many clues you can get correct! ACROSS 3. A solution is ______ when it has a
pH higher than 7.0. 5. When power plants burn ______,
they release sulfur dioxide and nitrogen oxides into the air.
7. Wet ___________ refers to acidic rain, fog, and snow.
9. ______ deposition can be wet or dry.
11. _________ energy comes from the heat stored in the earth.
13. A ________ removes sulfur dioxide from the gases leaving the smokestack of a power plant.
DOWN 1. The government gives an
__________ to a power plant, letting it release a set amount of sulfur dioxide.
2. One way that people can help prevent acid rain is by joining a ________, in which individuals share rides to their destination andreduce the number of cars polluting the air.
4. By turning off the lights when you leave a room, you are practicing energy ________.
6. An ________ consists of plants and animals and the environment in which they live.
POSSIBLE ANSWERS:
ACID ALLOWANCE BASIC CARPOOL COAL CONSERVATION DEPOSITION
ECOSYSTEM GEOTHERMAL NUTRIENTS SCRUBBER SUN WATER
8. Acid rain dissolves and washes
away important ________ found in the soil that are necessary for the healthy growth of plants.
10. Hydroelectricity is produced from the energy of running _______.
12. Solar energy is energy that comes from the ___.

11
PRINTER FRIENDLY VERSION
DIRECTIONS Read each clue below. Then find the number in the puzzle that corresponds to each clue. To assist you, there is a list of possible answers to each clue below the puzzle. Now it is time to see how many clues you can get correct! ACROSS 3. A solution is ______ when it has a
pH higher than 7.0. 5. When power plants burn ______,
they release sulfur dioxide and nitrogen oxides into the air.
7. Wet ___________ refers to acidic rain, fog, and snow.
9. ______ deposition can be wet or dry.
11. _________ energy comes from theheat stored in the earth.
13. A ________ removes sulfur dioxide from the gases leaving the smokestack of a power plant.
DOWN 1. The government gives an
__________ to a power plant, letting it release a set amount of sulfur dioxide.
2. One way that people can help prevent acid rain is by joining a ________, in which individuals share rides to their destination and reduce the number of cars polluting the air.
4. By turning off the lights when you leave a room, you are practicing energy ________.
6. An ________ consists of plants and animals and the environment in which they live.
POSSIBLE ANSWERS:
ACID ALLOWANCE BASIC CARPOOL COAL CONSERVATION DEPOSITION
ECOSYSTEM GEOTHERMAL NUTRIENTS SCRUBBER SUN WATER
8. Acid rain dissolves and washes
away important ________ found inthe soil that are necessary for the healthy growth of plants.
10. Hydroelectricity is produced from the energy of running _______.
12. Solar energy is energy that comes from the ___.

12
Name______________________ Date______________
Lesson #1: Acid Rain Discussion Questions
1) Acid rain is also referred to as acid precipitation or acid deposition. There are two classifications of acid rain. What are they and what does each refer to?
i. ii.
2) What chemical compounds do scientists measure to determine the amount of acid rain in a particular location? 3) There is a pH distribution map of the United States on the USGS website. Look at the map.
What is the pH where we live? Is it more or less acidic than the average pH of Washington D.C.? Explain: 4) Refer to the map. Is the pH of acid rain where you live more or less acidic than “clean” rain? Explain: 5) Which area had the cleanest rain in 1992? 6) List 4 different things in our ecosystems that acid rain can damage: i.
ii. iii. iv.
7) Choose one item from your list above and explain how damage to that one item can alter an ecosystem and affect other living things in the environment.

13
Lesson #2: Is Acid Rain Linked to Suppression of Rainfall? Rationale: Students will engage in using online resources to investigate acid rain and the relationship between acid rain and the amount of rainfall. They will visit several internet sites to discover what types of scientific research and data are used as evidence to support the theory. Materials needed:
• Access to computers. (The teacher will need to reserve the computer lab in advance. If computer access is not available, the teacher may print out information from the sites in advance and pass copies out to the students.)
• Copy of Lesson #2 discussion questions for each student Activity: 1) Write the three site addresses on the board and have the students log-in to Reading #1 on the Health and Energy Company site and begin to explore the site. Students may work in groups of two or three to explore the site; however each student must turn in their own worksheets. (5 min)
SITE/READING #1
Thompson, Don, Associated Press Writer, Pollution shifting rain patterns in Sierra, worldwide, [Online] Available http://healthandenergy.com/pollution_shifts_rainfall.htm , Health and Energy Company, June 10, 2004
SITE/READING #2
San Diego Earth Times, Air pollution can prevent rainfall, provided by American Association for the Advancement of Science, [Online] Available http://www.sdearthtimes.com/et0400/et0400s8.html , April 2000
SITE/READING #3
Rosenfeld, Daniel, Suppression of Rain and Snow by Urban and Industrial Air Pollution, [Online] Available, http://earth.huji.ac.il/data/pics/Science_Smoke.pdf , www.sciencemag.org SCIENCE VOL 287 March 10, 2000 2) Hand out the Lesson # 2 Activity Worksheet and instruct the students to visit the websites and complete the worksheet. Encourage discourse among students as a class. (25 min)

14
Lesson #2 Activity Worksheet
Name______________________ Date______________ SITE/READING #1 1) Dr. Ramanathan has a diverse background. Open the Google search engine and type in his full name. Find his biography and click on the link. What is his home country? Did Dr. Ramanathan decide to become an atmospheric scientist at an early age? What did he first study in college? 2) List several of the causes which Dr. Ramanathan attributes to altering rainfall patterns: Which cause can be said to be the major contributor to shifting rainfall patterns? SITE/READING #2 3) Which nationality is Dr. Rosenfeld? Use the Google search engine to find out where he is from. 4) Dr. Rosenfeld talks about “pollution tracks” caused by power plants, lead smelters and oil refineries. Why does Dr. Rosenfeld think that the pollution tracks are suppressing rainfall in some areas? SITE/READING #3 5) Study the satellite images A, B and C. If the top of the page is north, what direction are the pollution tracks moving in: Image A? Image B? Image C? 6) If you were planning an investigation about suppressed rainfall, which article about Dr. Rosenfeld’s studies would you refer to for data and information? Explain:

15
Lesson #3: GLOBE Acid Rain Datasets and Graphing Rationale: The students are introduced to the GLOBE site. The students are able to utilize data compiled by other students and use the graphing features on the GLOBE site to analyze the data. Materials needed:
• Access to computers. (The teacher will need to reserve the computer lab in advance. If the teacher can project his/her computer screen, he/she may want to move through the graphing activity, coaching the students through the process. If computer access is not available, the teacher may copy the GLOBE Graphs provided and the students may use them to complete their worksheets.)
• Copy of GLOBE Graphing Exercise for each student. (There are online graphing instructions at this site http://viz.globe.gov/viz-bin/show.cgi?l=en&b=g&rg=n&enc=00&nav=1&page=gallery-activity.ht . I have included an abbreviated version which may be easier for the students and may be used as a handout. The teacher may opt to use a different data reporting location (school). The location (school) in the exercise was chosen because of the quantity of data available for that location.)
• Copy of GLOBE Graphing Exercise Worksheet for each student Activity 1) Pass out the Globe Graphing Exercise to each student and instruct them to follow the steps carefully. You will want to assign the students a date to explore: either June 1988 or October 1999. Students may work in groups of two or three to explore the site; however each student must turn in their own worksheets. (10 min) 2) Have the students let you know as they complete their graphing exercise so you can verify their graph is correct. At this point you may pass out the GLOBE Graphing Exercise Worksheet. You may wish to have them print their own graphs or you may pass out copies of the GLOBE graphs already constructed and included with this lesson (RECOMMENDED). Questions #9 and #10 are best answered by comparing graphs.(remainder of class period) 3) Encourage discourse among students as a class as they work through the worksheet.

16
GLOBE Graphing Exercise Lesson #3
We will explore some data taken by school kids in Michigan. Please follow the instructions slowly – taking care to follow the steps in the proper order.
1) Login to www.globe.gov 2) Click on Enter the GLOBE Site 3) On the left column, under GLOBE DATA click on Maps and Graphs 4) Look in the section ‘Visualization of school and reference data’ and click on GLOBE Graphs 5) Under ‘SCHOOL LOCATION: Country Search’ scroll to locate US – United States of America*. Select and click the button below that says ‘State/Province Search’ 6) Under ‘SCHOOL LOCATION: State/Province Search’ scroll to locate US MI – Michigan. Select and click the ‘GO’ button on the right 7) Put a check in the box next to Pierce Middle School, Waterford, MI and in the box above which is labeled ‘Choose items from the table, select the desired action and press "Go".’ Use the arrow to find and select ‘Make a Graph’ and click the ‘GO’ button 8) You will see a graph with temperature data for Pierce Middle School. In the ‘Graph Data and Display Data’ section, you want to do two things. First, under ‘Dates’ - leave the beginning date as is but change your through date to Jan. 1, 2001 by using the drop down arrows. Second, under ‘Datasets’ – scroll to find the RAINFALL (LIQUID PRECIPITATION) section. Hold your control key down and select ‘–Rainfall’ and ‘-Rainfall pH’. Click the ‘Redraw’ button below. 9) You now have a graph ☺ Your teacher will now assign you your date to explore and interpret. In order for you to maximize the graph to your assigned month, you will need to highlight that area of the graph. Highlighting the area will result in “zooming” the area larger to make it more readable. You may need to “zoom” in 3 or 4 times to display only the month you will interpret. 10) Print your graph and attach it to your worksheet. Refer to your graph to answer the following set of questions.

17
GLOBE Graphing Exercise WORKSHEET
Name________________________ Date________________________
Assigned Month and Year _________________
1) Can you tell from the graph if there was a period during the month when data was not collected? Explain: If yes – what were the dates? 2) How many days during the month was data collected and reported for rainfall? 3) How many days during the month were reported to have a measurable amount of rainfall? 4) How many days during the month were the “pH of rainfall” analyzed and reported? 5) Explain the correlation between your answers of questions #3 and #4. 6) List the date(s) along with the measurement(s) of the greatest amount of rainfall for the month. 7) List the dates(s) and readings for the lowest pH reading during the month. 8) Using the data from the graph for pH, what is the mean, median, mode and range of the data? Show your work ☺

18
Mean = Median = Mode = Range = 9) From the data provided for the month, what can you tell about a relationship between rainfall amount and the pH of rainfall? 10) What kind of additional information would be useful in order to make any conclusions about the relationship between the amount of rainfall and the pH of rainfall?

19
GLOBE Graphs* Lesson #3 JUNE 1998
OCTOBER 1999

20
Lesson #4: NADP Data and Graphing Rationale: The students are introduced to the NADP site. The students are able to utilize long-term data compiled for wet deposition and use an Excel spreadsheet to graph and analyze the data. One of the goals of this exercise is for the students to realize the availability and accessibility of useful data and what conclusions may or may not be made using certain data. Materials needed:
• Access to computers. (The teacher will need to reserve the computer lab in advance. If the teacher can project his/her computer screen, he/she may want to move through the graphing activity, coaching the students through the process The teacher may download data from the NADP site in advance and have electronic files available to the students - RECOMMENDED. I have included sets of data that were extracted from the NADP site and graphs of that data. Data includes; Date, pH, rainfall in mm for 1983 and 2005 (current))
• Copy of NADP Data and Graphing Exercise for each student • Copy of NADP Data and Graphing Exercise WORKSHEET for each student
Activity: 1) Pass out the NADP Data and Graphing Exercise to each student and instruct them to follow the steps carefully. Students may work in groups of two or three to explore the site; however each student must turn in their own worksheets. (15 min) 2) When the students complete 1-9, you may provide them with an electronic copy of the data included with this lesson. It will easily “copy and paste” from Word into an Excel spreadsheet. (10 min) 3) The students are now ready to complete steps 10-20 to make their charts. You may wish to have them print their own graphs or you may pass out copies of the graphs already constructed and included with this lesson. 4) Hand out the NADP Data and Graphing Exercise WORKSHEET as the students complete their charts. (20 min) 5) Encourage discourse among students as a class as they work through the worksheet.

21
NADP Data and Graphing Exercise Lesson #4 1) Login to the NADP site at http://nadp.sws.uiuc.edu/ 2) Click on the Data Access link. You will see a map of the United States. 3) Click on the site located in the Keweenaw. You will see the map which includes all of the sites in Michigan. 4) Click on M199 – Chassell. You will now be on the Chassell Monitoring Location M199 page. 5) Click on the Weekly Data Link. You will see a table for Weekly Samples for Site:199/Chassell. 6) Use drop down arrows to select 1983 as the starting year and 2006 for the ending year. - Choose HTML Table - To the right, choose Education: K-12 - Under description type: “School assignment” - Click the Get Data button - Wait for data to load 7) Click on ‘Edit’ in the menu bar of your browser window (upper left). Click ‘Select All’. Click ‘Edit’ again then click ‘Copy’. 8) Go down to the lower left-hand corner of your window and click on the ‘start’ button. Hover over the ‘All Programs’ button, find Microsoft Excel and click on it. This will open a book in Excel. 9) Click on cell A1. Click on ‘Edit’ in the menu bar of Excel and click ‘Paste’. In a moment you will have all of the Chassell data on your own Excel spreadsheet ☺ Save your spreadsheet for reference. Making a chart: 10) Using the electronic data provided by your teacher: Click and drag to highlight all 3 columns of the data for 1983 (including the date column). 11) Click the chart button in the toolbar. The chart wizard will appear. 12) Click the “Custom Types” tab and choose “Lines on 2 Axes”. Click “Next”. 13) Choose series in columns. Click “Next”. 14) For “Value Y Axis” check “major”. Click “Next”. 15) For “Titles: Chart Title:” Type “Rainfall and pH - 1983 Chassell, MI - NADP data” For “value (y) axis:”, type “pH”. For “second value (y) axis:” type “rainfall (mm)”. Click “Next”.

22
16) Under the “gridlines” tab, check “major” which is next to “value y axis”. Click “Next”. 17) Check “show legend”. Check “bottom”. 18) Choose to “place chart as a new sheet” and click “Finish”. Now you have a graph for the 1983 data ☺ If you need to go back and change anything that may not look correct, right click an empty area on the chart and choose “Chart Options” from the menu. 19) You may want to right click the x-axis and look under the “scale” tab, put a “5” in the box labeled “Number of categories between tick-mark labels”. 20) Now go back to step #10 and make a chart for the 2005 data following the same procedure. In step #15, title your chart “Rainfall and pH - 2005 Chassell, MI - NADP data” 21) Print out both of your charts. Use the charts to answer the questions on the NADP Data and Graphing Exercise WORKSHEET. Attach your charts to your completed worksheet.
23
NADP data 1983
2/22/1983 4.29 3.81 3/1/1983 6.26 4.06 3/8/1983 4.38 15.49 3/15/1983 4.94 39.88 3/22/1983 4.77 13.46 3/29/1983 4.97 1.27 4/5/1983 3.8 1.78 4/12/1983 4.49 20.32 4/19/1983 4.25 36.07 5/3/1983 6.45 1.78 5/17/1983 4.74 1.27 5/24/1983 4.6 37.08 5/31/1983 4.42 55.37 6/7/1983 4.51 17.02 6/14/1983 5.31 3.3 6/21/1983 4.68 22.61 6/28/1983 4.54 35.56 8/9/1983 4.97 19.05 8/16/1983 4.5 34.04 8/23/1983 5.81 24.89 8/30/1983 5.24 31.75 9/6/1983 4.43 67.31 9/13/1983 5.63 24.13 9/20/1983 4.73 36.32 9/27/1983 5.87 2.03 10/4/1983 5.57 22.1 10/11/1983 4.74 12.45 10/18/1983 4.89 81.28 10/25/1983 6.08 0.51 11/1/1983 5.32 0.76 11/8/1983 4.73 0.76 11/15/1983 5.01 17.78 11/22/1983 4.51 33.02 12/13/1983 4.92 24.38 12/20/1983 5.11 33.02 12/27/1983 4.99 24.38
NADP data 2005
1/4/2005 4.67 35.31 1/11/2005 4.65 4.32 1/18/2005 4.17 33.02 1/25/2005 4.87 23.62 2/8/2005 5.43 6.35 2/15/2005 4.76 7.87 2/22/2005 4.68 17.53 3/1/2005 5.17 19.81 3/15/2005 4.85 10.67 3/22/2005 4.53 0.76 3/29/2005 4.79 0.51 4/5/2005 5.87 42.42 4/12/2005 6.51 16.51 4/26/2005 5.41 3.05 5/3/2005 5.05 2.29 5/10/2005 6.51 26.67 5/17/2005 4.9 26.16 5/24/2005 5.15 19.81 5/31/2005 4.99 4.83 6/7/2005 4.92 11.18 6/14/2005 4.82 33.27 6/21/2005 4.86 18.03 6/28/2005 5.39 36.32 7/5/2005 4.72 17.78 7/19/2005 6.04 6.35 7/26/2005 4.87 5.08 8/2/2005 6.5 7.62 8/9/2005 5.33 5.08 8/16/2005 5.07 2.54 8/23/2005 5.13 6.86 8/30/2005 4.71 1.02 9/6/2005 5.16 0.76 9/13/2005 4.98 26.16 9/20/2005 4.84 15.24 9/27/2005 6.17 28.96 10/4/2005 5.48 27.18 11/8/2005 4.88 5.59 11/15/2005 5.78 21.84 11/29/2005 4.63 29.72 12/6/2005 4.82 35.56 12/13/2005 4.81 9.65 12/20/2005 4.44 20.07 12/27/2005 4.44 3.3 1/3/2006 4.43 21.08 1/10/2006 4.74 12.19 1/17/2006 4.95 5.84

24
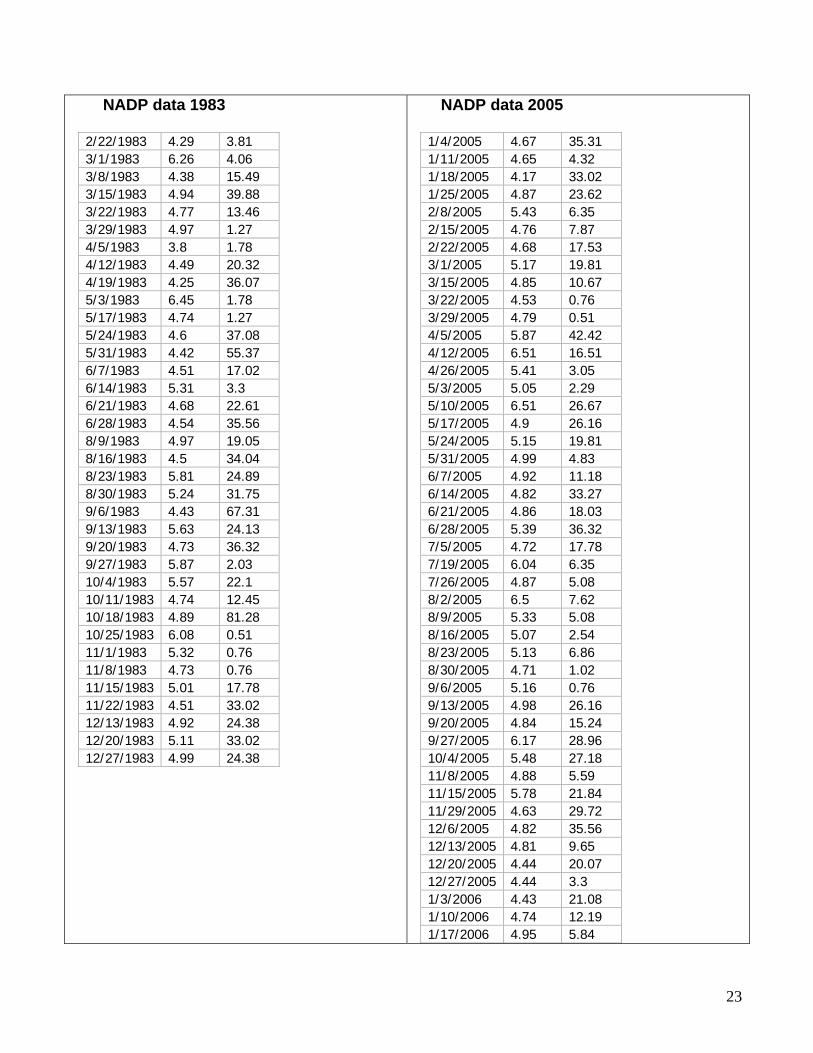
LESSON # 4 Charts
Rainfall and pH - 1983 Chassell, MI - NADP data
01234567
2/22/1
983
3/29/1
983
5/17/1
983
6/21/1
983
8/30/1
983
10/4/
1983
11/8/
1983
12/27
/1983
pH
0102030405060708090
rain
fall
(mm
)
pH rainfall (mm)
Rainfall and pH - 2005 Chassell, MI - NADP data
01234567
1/4/20
05
2/15/2
005
3/29/2
005
5/10/2
005
6/14/2
005
7/26/2
005
8/30/2
005
10/4/
2005
12/13
/2005
1/17/2
006
pH
051015202530354045
rain
fall
(mm
)
pH rainfall (mm)

25
NADP Data and Graphing Exercise WORKSHEET Lesson #4
Name________________________ Date________________________
1) In Lesson #1 you learned about the two classifications of acid rain. NADP is monitoring data for which one? 2) Can we make any conclusions about the relationship between the pH of rainfall and amount of rainfall knowing that we are only looking at data for one classification? Why or why not? 3) List the 8 chemical components being measured in the NADP data you initially copy and pasted into Excel. 4) Can you make any generalizations about similarities or differences in the data from comparing the chart for 1983 to the chart for 2005? What do you notice that is similar? What do you notice that is different? 5) You could add the rainfall for each year and figure the average pH of the rainfall for each year, and then compare annual changes in data. Explain another way to use any of the data on the NADP site to show a relationship between the pH of rainfall and the amount of rainfall.

26
Lesson #5: Touring CASTNET Rationale: The students are introduced to the CASTNET site. The students are able to utilize long-term data compiled for dry deposition and use an Excel spreadsheet to graph and analyze the data. One of the goals of this exercise is for the students to realize the availability and accessibility of useful data and what conclusions may or may not be made using certain data. Materials needed:
• Access to computers. (The teacher will need to reserve the computer lab in advance. If the teacher can project his/her computer screen, he/she may want to move through the activity, coaching the students through the process The teacher may download charts from the CASTNET site in advance and have handouts available to the students)
• Copy of Touring the CASTNET Website Activity for each student • Copy of Final Reflection Assignment for each student • Copy of unit scoring rubric for each student
Activity: 1) Pass out the Touring the CASTNET Website Activity to each student and instruct them to follow the steps carefully. Students may work in groups of two or three to explore the site; however each student must turn in their own worksheets. (5 min) 2) The students may login and follow the steps to explore the CASTNET site. 3) Have the students check with you when they retrieve the data for Perkinstown so you can verify they have the correct data to answer the questions on the worksheet. (20 min) 4) Encourage discourse among students as a class as they work through the worksheet. 5) Pass out the rubric and explain the portfolio requirements. (10 min) 6) Pass out the final reflection requirements and explain. The teacher may want to schedule a day in the computer lab for writing the final reflections. Communicate a due date - one or two weeks. (10 min)

27
Name________________________ Date________________________
Lesson #5: Touring the CASTNET Website Activity
To begin, login to http://www.epa.gov/castnet//deposition.html . 1) What is the percentage of dry deposition in total acid deposition? 2) List 5 chemical components that are measured as dry deposition:
i.
ii.
iii.
iv.
v.
3) CASTNET states that the most accurate description of the overall process is not acid rain but more appropriately, the process should be called acid ____________________. 4) Click on “Site Information” on the left of the screen. Scroll down the page until you find “WI”. Click on “PRK134” Perkinstown. Click on the pie chart for Nitrogen. Make note of the total amount of dry deposition. Do the same for Sulfur. Add the percentages for both charts together. Does the total amount of dry deposition from the two charts for Perkinstown fall within the percentage range from question #2? (Hint: EACH chart totals 100%). Show your work. 5) Click on the “Trends in total nitrogen deposition” bar chart. What kind of generalizations can you make about trends of nitrogen deposition by looking at the chart? Explain your answer. 6) Click on the “Trends in total sulfur deposition” bar chart. What kind of generalizations can you make about trends of sulfur deposition by looking at the chart? Explain your answer. 10) So far you have learned about various studies being done about acid deposition and data sources like GLOBE, NADP and CASTNET. Make a list (on the back of this page) of other factors that need to be taken into consideration before any conclusions can be made about a relationship between acid deposition and suppressed rainfall.

28
RUBRIC
Name________________________________ Date________________ Assessment Scale: 1-Inadequate in meeting requirements of the task 2-Minimal in meeting requirements of the task 3-Adequate in meeting requirements of the task 4-Superior in meeting requirements of the task
Criteria Evaluation Points Lesson #1 What is Acid Rain? Crossword Puzzle 1 2 3 4 Lesson #1 Discussion Questions 1 2 3 4 Participation in team activity and discussions 1 2 3 4 Lesson #2 Is Acid Rain Linked to Suppression of Rainfall? Lesson #2 Activity Worksheet 1 2 3 4 Participation in team activity and discussions 1 2 3 4 Lesson #3 GLOBE Acid Rain Datasets and Graphing GLOBE Graphing Exercise WORKSHEET 1 2 3 4 Graphs complete and correct 1 2 3 4 Participation in team activity and discussions 1 2 3 4 Lesson #4 NADP Data and Graphing Exercise NADP Data and Graphing Exercise WORKSHEET 1 2 3 4 Charts complete and correct 1 2 3 4 Participation in team activity and discussions 1 2 3 4 Lesson #5 Touring CASTNET Touring the CASTNET Website Activity 1 2 3 4 Participation in team activity and discussions 1 2 3 4 Final Reflection Length – 5 paragraphs 1 2 3 4 Thoughts coherently written 1 2 3 4 Topic applicable to unit 1 2 3 4 Contains introduction, body, conclusion 1 2 3 4 Addresses action to be taken 1 2 3 4 Individual Unit Portfolio Lesson #1 Crossword and worksheet included 1 2 3 4 Lesson #2 Worksheet included 1 2 3 4 Lesson #3 Worksheet and graphs included 1 2 3 4 Lesson #4 Worksheet and charts included 1 2 3 4 Lesson #5 Worksheet included 1 2 3 4 Final reflection 1 2 3 4 TOTAL POINTS /96
29
Final Reflection
Write a final reflection that includes a summary of your acid deposition investigations, including:
♦ Definitions ♦ Websites you visited ♦ What you learned while completing the activities ♦ What you learned about scientific data and analysis. ♦ What questions you now have.
The last part of your reflection should address what kind of action you would like to take regarding acid deposition. For example: finding more information, writing a letter to a government or industry official, or writing a letter to a scholar or researcher, or explain something you can do personally. Think of the: who, what, where, how and why? Explain well. Requirements: 2 pages, double spaced, 12 pt Arial font, turn in as part of your portfolio. Your refection should be well thought-out and organized.

30
Answer Key: “Thinking Like a Scientist” Unit Lesson #1 1) wet deposition – acidic rain, fog, snow dry deposition – acidic gasses and particles 2) SO2 , NOx 3) pH in Houghton, MI 4.5 – 4.7 less acidic than the average pH of Washington DC 4.2 - 4.4 4) clean rain is 5.6, Houghton is more acidic 5) No areas on the US map had clean rain. Mountain and pacific states had 5.3 6) acidification of lakes & streams, damage of trees, damage sensitive soils, plants and animals may not survive, ecosystems may not be repairable 7) look for validity in explanation and critical thinking. Example: Organisms that fish feed on may die out leaving no food for the fish, so the fish can’t survive. Lesson #2 1) India No not until he came to the US in 1970 BS in engineering 2) Air pollution, soot, smog, ash, car exhaust Exploding population worldwide 3) He is from Israel 4) Pollution particles are too small for moisture to condense into droplets large enough to fall as rain 5) Image A – SW Image B – SW Image C – E 6) “Suppression of Rain and Snow by Urban and Industrial Air Pollution” It is a scientific publication based on valid data collection and analysis. Lesson #3 June 1998 1) Yes, June 11, points not plotted for that date-break in line 2) 25 3) 10 4) 7 5) There needs to be measurable rainfall in order to measure wet deposition 6) June 22nd, 52mm 7) June 10 &11, pH 4.5 8) 4.9, 5.0, 5.0, 4.5-5 9) The average pH for Oct. 1999 was .3 higher than the average pH for June 1998 The rainfall scale is different on each graph. More than double rainfall in June 1998 than in Oct. 1999. The pH occurring most often in both graphs is 5.0, but the rainfall in June 1998 was over double the amount of rainfall in Oct. 1999 Accept critically thought out responses 10) measurements and analysis of dry deposition, weather patterns, comparison of annual data, comparison of month-to-month data through the years, more data (long term) Accept critically thought out responses October 1999 1) Yes, October 19, points not plotted for that date-break in line 2) 30

31
3) 8 (not including Nov.1) 4) 7 (not including Nov.1) 5) There needs to be measurable rainfall in order to measure wet deposition 6) Oct. 4th, 15mm 7) Oct. 4, 10, 13, 14, 18, 25, pH 5.0 8) 5.2, 5.0, 5.0, 5.0-6.0 9) The average pH for Oct. 1999 was .3 higher than the average pH for June 1998 The rainfall scale is different on each graph. More than double rainfall in June 1998 than Oct. 1999. The pH occurring most often in both graphs is 5.0, but the rainfall in June 1998 was over double the amount of rainfall in Oct. 1999 Accept critically thought out responses 10) measurements and analysis of dry deposition, weather patterns, comparison of annual data, comparison of month-to-month data through the years, more data (long term) Accept critically thought out responses Lesson #4 1) Wet deposition 2) No, There are other factors to take into consideration such as weather patterns and dry deposition analysis. Others factors include: forest fires, volcanic activity, changes in industial, pwer and vehicle emissions. 3) Ca, Mg, K, Na, NH4, NO3, CL, SO4 4) There are more differences than similarities. Accept critically thought out responses Similarities: not any obvious similarities from observation of chart, may find Accept critically thought out responses similarities by figuring mean, median, mode, range Differences: 2005 had a longer period of low rainfall than any period during 1983 (July-Sept.), 1983 had more dips in rainfall amount with lower readings (6 in 1983 and 2 in 2005), Highest week of rainfall in 1983 had 80mm compared to highest week in 2005 of 44mm. Lowest pH in 1983 was 3.9 compared to the lowest week in 2005 which was 4.1 Accept critically thought out responses 5) Accept critically thought out responses Lesson #5 2) 20%-60% 3) SO4, NO3, HNO3, SO2, NH4 4) deposition 7) No, the dry deposition in Perkinstown is lower than the 20%-60% of the range estimated by CASTNET (4.32+9.67+1.72+16.65+6.18) / 200 = 19% 8) Highest total N deposition 2000 Lowest total N deposition 1998 N deposition in1989-90 similar to 2003 Shows most variation in wet deposition, not much change in dry 9) Highest total S deposition 1992 Lowest total S deposition 2003 Shows most variation in wet deposition, not much change in dry 10) Can we find pre-1983 data? During periods of high deposition: What were the weather patterns like? Were there catastrophic global events like forest fires, volcanic eruptions, droughts? Were large amounts of coal being burned? Was there an increase in industrial emissions? What does it look like on a global scale? Accept critically thought out responses