Embed Size (px)
DESCRIPTION
Global Benchmark Report 2014
Citation preview

Including themes on global investment fl ows and Africa
The conditions for doing business in the global economy are con-stantly changing – presenting new challenges and opportunities.
For the tenth consecutive year, the Global Benchmark Report 2014 examines how the global challenge is met in the OECD countries. The assessment is based on 87 benchmarks across fi ve pillars com-prising Level of globalisation, Productivity and innovation, Qualifi ed labour, Public economy and Costs. Together these pillars constitute the foundation for creating open and prosperous nations capable of creating and sustaining growth and balance. The report highlights strengths and weaknesses of each OECD country in facing interna-tional competition, providing a picture of each country’s ability to de-velop attrac tive business environments and utilise opportunities pre-sented by globalisation.
For further information on the Global Benchmark Report see di.dk/gbr. The website provides a unique opportunity to download a PDF-version of the report where you can read more about how the in-dividual benchmarks are prepared and why they are relevant in inter-national competition. All graphs and fi gures are available for down-load intended for your own presentations and analyses.
DI – Confederation of Danish Industry H.C. Andersens Boulevard 18 1787 Copenhagen V Phone 3377 3377 [email protected] di.dk
GLO
BA
L BEN
CH
MA
RK
REP
OR
TR
eady for globalisation?D
I AN
ALY
SIS
DI ANALYSIS
Ready for globalisation?
GLOBALBENCHMARKREPORT
Ready for globalisation?

Global benchmark report 2014
READY FORGLOBALISATION

2 GLOBAL BENCHMARK REPORT 2014
Published by the Confederation of Danish Industry
Edited by Kathrine Klitskov, Mathias Secher, Marie Gad, Michael Meineche, Nanna Bøgesvang Olesen and Mads Dal Jørgensen
Printed by Zeuner Grafisk as
ISSN: 1901-6948
1000.3.14

3GLOBAL BENCHMARK REPORT 2014 – FOREWORD
FOREWORD
Businesses across the EU are beginning to see signs that a badly needed confidence is returning to the economy as an indication that the European economy could return to moderate growth in 2014. But the situation remains fragile. In order for Europe to emerge stronger from the financial crisis and restore long-term growth, we need to do much more to strengthen the fundamental determinants of competitiveness. We need a reduction of financial, trade and labour market imbalances in all the European countries in order to build a strong foundation for future growth. And we must be much better at combining national and European reforms so they become mutually reinforc-ing. A continued focus on fiscal consolidation and growth enhancing structural reforms is key to improving Europe’s international competitiveness, growth and employment prospects.
With its rich data and insightful assessments, DI’s Global Benchmark Report provides a useful overview of the national policies that ultimately determine Europe’s overall competitiveness. It can help each and every European member state to identify its strengths and weaknesses in facing international competition.
BUSINESSEUROPE strongly supports this continued effort to provide facts and figures for a fruitful dialogue on best practices. The DI Global Benchmark Report comple-ments our own annual European Reform Barometer. We hope both publications can inform and inspire policymakers to work on the difficult task of designing and imple-menting policies that will support businesses in their efforts to make the best of the op-portunities presented by global markets and help return the EU economy to stronger growth and full employment.
March 2014
Markus J. BeyrerDirector General, BUSINESSEUROPE

4 GLOBAL BENCHMARK REPORT 2014

5GLOBAL BENCHMARK REPORT 2014 – PREFACE
PREFACE
Economic recovery in the wake of the financial crisis is slow and uneven. Forecasts predict some acceleration of growth in 2014 and 2015, though still hesitant. However, we have yet to realise these expectations. In the current context, governments must avoid complacen-cy in preparing nations for the future economic landscape. Clear and credible strategies are needed to make the growth path irreversible and sustainable. These strategies require a strong commitment to long overdue structural reforms. It is DI’s intention that policy-makers and business leaders can make use of the Global Benchmark Report to identify strengths and weaknesses of their nations and apply these insights in the pursuit of creat-ing open and prosperous nations capable of creating and sustaining growing economies in balanced societies.
The Global Benchmark Report 2014 is the tenth in a series of reports presenting DI’s annu-al assessment of how the global challenge is met in the OECD member states. Across five pillars comprising level of globalisation, productivity and innovation, qualified labour, public economy and costs, each nation is benchmarked on the basis of 87 indicators that support the common aspiration for growth and prosperity. The report provides a snapshot of each country’s ability to develop attractive business environments and seize opportunities pre-sented by globalisation.
The conditions for doing business in the global economy are constantly changing – pre-senting new challenges and opportunities. Therefore, the two theme chapters of the Global Benchmark Report address how to make the most of these challenges and opportunities. The first theme chapter focuses on the struggle to attract foreign direct investment, an issue of growing concern in several OECD member states. Globalisation has increased foreign direct investment flows and new, viable destinations for investment have emerged putting pressure on the business and investment climates in several OECD countries. Foreign di-rect investment introduces new technologies and offers something unique in terms of inno-vation and productivity. It is vital to continually improve conditions that attract and retain foreign companies.
The second theme chapter highlights opportunities of tapping into the vast and growing African market and emphasises the major development results that can be achieved from combining aid and trade promotion.
March 2014
Karsten DybvadCEO, Confederation of Danish Industry (DI)

6 GLOBAL BENCHMARK REPORT 2014

7GLOBAL BENCHMARK REPORT 2014 – CONTENT
CONTENT
9 Performance in the global arena
18 Benchmarking
20 Level of globalisation
30 Productivity and innovation
46 Qualified labour
62 Public economy
70 Costs
78 Theme chapters
80 New trends in global investment flows
96 Africa: Open for business
123 Methodology,definitionsandsources
127 Descriptionofsources
131 Summaryofbenchmarks
137 Index to benchmarks

GROWTH
Seizingopportunitiespresentedbyglobalisation
Developinghighproductivityandinnovation
Havingaccesstoqualifiedandmotivatedlabour
Sustainingabalancedandefficientpublicsector
Maintaining a competitive cost level
Pilla
rs

9GLOBAL BENCHMARK REPORT 2014 – PERFORMANCE IN THE GLOBAL ARENA
For the tenth consecutive year, the Global Benchmark Report examines how the global challenge is met in the OECD member states. The report highlights strengths and weaknesses of each OECD member state in facing international competition and gives a picture of each country’s ability to develop attractive business environ-ments and utilise the opportunities presented by globalisation. The Global Bench-mark Report is an annually recurring publication intended as a benchmarking tool for business leaders and policymakers to identify obstacles and opportunities pre-sented in the global business arena.
This year, the report also includes two chapters on “New trends in global invest-ment flows” and "Africa: Open for business". The first theme chapter focuses on the struggle of attracting companies and their investment, an issue of growing con-cern in several OECD member states. Foreign investment introduces new technolo-gies and offers something unique in terms of innovation and productivity. The sec-ond chapter highlights opportunities of tapping into the vast and growing African market and emphasizes the major development results that can be achieved from combining aid and trade promotion.
International benchmarkingThe report compares the performance of 33 OECD member states and their busi-ness environments. When possible, data from Brazil, Russia, India and China is included. The report is based upon five fundamental pillars of competitiveness. To-gether these five pillars constitute the foundation for creating open and prosperous nations capable of creating and sustaining growing economies in balanced socie-ties. Thus, the comparison is based on 87 benchmarks divided into Level of globali-sation, Productivity and innovation, Qualified labour, Public economy and Costs.
PERFORMANCE IN THE GLOBAL ARENA
87 benchmarks
Productivityandinnovation
Qualifiedlabour
Public economy
CostsLevel of globalisation

10 GLOBAL BENCHMARK REPORT 2014 – PERFORMANCE IN THE GLOBAL ARENA
An agenda for growthOptimism is carefully returning to the global economy creating a slow recovery in business confidence and economic activity. However, the recovery remains precar-ious. Macroeconomic policies are under acute pressure in several OECD countries that still face many challenges including low growth, high fiscal deficits, high debt and high unemployment. For the OECD member states, success across the five pil-lars that form the basis of this report is a prerequisite for future growth and pros-perity.
Again, Chile excels as the OECD country with the highest average GDP growth in the period 2009-2013. The Eurozone has been especially challenged by economic decline over the past five years. Among the BRIC nations, China and India have re-corded remarkable growth in spite of the global crisis.
-6 -4 -2 0 2 4 6 8 10
RussiaBrazilIndia
China
GreeceSlovenia
ItalyPortugal
SpainIrelandIceland
HungaryFinland
NetherlandsDenmark
Czech RepublicUnited Kingdom
FranceBelgium
JapanAustriaEstonia
GermanyNorway
Slovak RepublicSwitzerland
United StatesSwedenCanada
New ZealandMexico
AustraliaPoland
South KoreaIsrael
TurkeyChile
GDP growth, 2009-2013 (average)
Per cent
OECDEUROZONE
SourceOECD Economic Outlook No. 94 and DI calculations
Behind the benchmark

11GLOBAL BENCHMARK REPORT 2014 – PERFORMANCE IN THE GLOBAL ARENA
The most prosperous members of the OECD continue to be Norway, United States and Switzerland. The Norwegian first place ranking is mainly due to the country's major oil production. Despite high growth for several years, the BRIC countries still have low per capita GDP.
0 10,000 20,000 30,000 40,000 50,000 60,000
IndiaChinaBrazil
Russia
TurkeyMexico
ChileHungary
PolandEstonia
PortugalGreece
Slovak RepublicCzech Republic
SloveniaItaly
SpainNew ZealandSouth Korea
IsraelFrance
FinlandJapan
United KingdomDenmark
BelgiumGermany
IcelandSwedenIreland
NetherlandsAustria
AustraliaCanada
SwitzerlandUnited States
Norway
GDP per capita, Purchasing power parity, 2013
USD
Source IMF, World Economic Outlook October 2013
OECDEUROZONE
Behind the benchmark

12 GLOBAL BENCHMARK REPORT 2014 – PERFORMANCE IN THE GLOBAL ARENA
Competitiveness index of the Global Benchmark Report 2014Based on a competitiveness index, the Global Benchmark Report provides an over-view of how the OECD countries are ranked in terms of competitiveness – and not only within the single pillars. This comprehensive index captures results from benchmarks divided across the five pillars of national competitiveness.
Switzerland tops the competitiveness index yet again Yet again, Switzerland wins the title as the most competitive OECD member state based on the benchmarks in the Global Benchmark Report. Sweden and South Ko-rea take the runner-up positions. Greece and Italy are placed at the bottom as the least competitive OECD member states.
0 5 10 15 20 25 30
ItalyGreeceMexicoTurkey
SloveniaFrance
SpainHungaryPortugalBelgium
Slovak RepublicPolandJapan
Czech RepublicAustriaIcelandNorway
IsraelGermany
New ZealandDenmark
FinlandUnited Kingdom
NetherlandsUnited States
EstoniaAustralia
ChileCanadaIreland
SwedenSouth KoreaSwitzerland
1 (1) 2 (2) 2 (3) 4 (8) 5 (4) 6 (7) 7 (5) 8 (13) 8 (9) 10 (6) 10 (15) 12 (12) 13 (10) 14 (17) 15 (11) 16 (19) 16 (18) 18 (14) 19 (16) 19 (21) 21 (20) 21 (23) 23 (22) 24 (26) 25 (24) 26 (28) 27 (24) 28 (30) 29 (28) 29 (27) 31 (31) 32 (32) 33 (33)
* All pillars have equal weights
Note The numbers in the brackets indicate the countries’ ranks in the competitiveness index for 2013. The coloured circle specifies if the country has either improved, worsened or kept its position.
Competitiveness index of the Global Benchmark Report, 2014Average rank of OECD countries across all five pillars* in the Global Benchmark Report
The overall average ranks of countries (1-33)

13GLOBAL BENCHMARK REPORT 2014 – PERFORMANCE IN THE GLOBAL ARENA
1. Level of globalisationSeveral OECD member states are still struggling with weak domestic demand. Im-proved access to major international export markets can help countries tap into global economic growth. The process of globalisation cultivates interaction be-tween countries and increases international sales. In this first pillar, a nation's level of globalisation is determined by the degree of global market involvement in terms of exports, foreign direct investment, global mindset among citizens and business-es, and the extent of cultural openness, to mention a few. The members of the OECD should strive to seize the opportunities offered by globalisation in order to create future growth. Ireland has the position as the OECD country with the highest Level of globalisa-tion. The Irish lead is based on several top rankings including the largest share of exports relative to GDP, highest freedom to trade internationally, efficient customs authorities, highest cultural openness, and a population with the most positive at-titude towards globalisation. Chile ranks second.
2.ProductivityandinnovationThe stage of development varies across the OECD, and so does the specific need for development in productivity and innovation. The most advanced countries strongly rely on the design and development of cutting-edge innovations in order to maintain their competitive advantage. Countries less advanced can still reap ben-efits from adopting existing technologies. This pillar measures a nation's level of productivity and innovation by addressing labour productivity, investment activity, the institutional environment and infrastructure. The goal is for each OECD country to develop high productivity and product quality.
Switzerland excels with the highest levels of Productivity and innovation. The coun-try has particularly strong university/industry research collaboration and is leading in both patent applications and innovation performance. Switzerland has been suc-cessful in attracting several businesses in sectors with high patent activity. Finally, Switzerland has the most widespread use of fixed broadband subscriptions and is one of the most energy efficient countries in the OECD. Sweden is the runner-up.
3.QualifiedlabourA well-educated workforce contributes significantly to a nation's economic value creation through productivity and business innovation. It is therefore of paramount importance that the business conditions of society support education and R&D and that businesses have access to employees with the desired competences. In this pillar, the availability of qualified labour in the OECD member states is determined by measuring investment in education, levels of educational attainment, business conditions provided by society, and labour market participation.
Canada tops the Qualified labour pillar with a highly educated population and strong focus on tertiary education. Furthermore, Canadian senior managers assess that the country's legislation on equal opportunities supports economic growth. Switzerland and South Korea together rank second with a series of solid perfor-mances.
Ireland no. 1 in Level of globalisation
Switzerland no. 1 in Productivity and innovation
Canada no. 1 in Qualified labour

14 GLOBAL BENCHMARK REPORT 2014 – PERFORMANCE IN THE GLOBAL ARENA
4.PubliceconomyAmong other lessons, the financial crisis and the following European debt crisis have taught the world the importance of monitoring the health of a country's pub-lic sector. A country's economic robustness is dependent not only on a strong and thriving private sector but also an efficient and balanced public sector. Therefore, among other indicators, this fourth pillar assesses budget balance, public debt, public expenditure, and corruption levels.
Switzerland excels as the OECD member with the best average ranking in Public economy. The country has the lowest public expenditure as a proportion of GDP. Additionally, Switzerland is one of the only OECD member states with a structural surplus on its public budgets, and the Swiss public sector is among the smallest in OECD. South Korea is the runner-up.
5. Costs The final pillar of the Global Benchmark Report is Costs. The competitiveness of businesses in a global economy depends on whether productivity and the quality of the product offset the costs of production. Production costs and taxes are therefore important indicators of competitiveness. In this pillar, the level of costs in the OECD countries is determined by benchmarks that measure taxes, consumer prices and compensation costs. Maintaining a competitive cost level is the fifth and final com-ponent of creating growth.
Switzerland is the most competitive country in terms of Costs. This rank is earned as a result of low marginal tax rates for especially medium wage earners and low inflation. Furthermore, Swiss businesses have easy access to capital markets, and this minimises financial costs and helps to stimulate economic growth. Chile holds second place.
Switzerland no. 1 in Public economy
Switzerland no. 1 in Costs

15GLOBAL BENCHMARK REPORT 2014 – PERFORMANCE IN THE GLOBAL ARENA
NewtrendsinglobalinvestmentflowsFor the first time ever, in 2012 less foreign direct investment (FDI) went to OECD member states than to the world’s other countries. The distinct shift is a natu-ral consequence of the fact that, for many years, an increasing proportion of the world’s FDI has sidestepped the OECD. Most of the capital, however, still comes from the OECD, and as a result, many OECD countries have developed a gap be-tween their outward and inward FDI with outbound FDI increasingly exceeding in-bound FDI.
The trend is particularly evident in EU-15, where the gap has nearly tripled in the past decade and currently constitutes 15 per cent of the countries’ overall GDP. Al-though many countries have experienced this development, the scope varies great-ly as well as the underlying reasons for the development of the investment gap. The situation is particularly problematic for countries experiencing a declining in-flow since FDI can raise both employment and productivity wherever it occurs. It is therefore important for all countries to be able to attract FDI.
In general, the pattern of the global FDI flows indicates that several affluent OECD member states have difficulties attracting and maintaining businesses and jobs. However, it is possible to reverse the trend and increase a country’s attractiveness as a FDI destination. This involves reducing administrative burdens, better interac-tion between private and public investment, and enhanced direct financial incen-tives to invest.
Many OECD member states have developed a gap in FDI
TheFDIgaphasgrownsignificantlyinEU-15EU-15 outward FDI stock less inward FDI stock
0
2
4
6
8
10
12
14
16
18
20122011201020092008200720062005200420032002
Per cent of GDP
Source OECD and DI

16 GLOBAL BENCHMARK REPORT 2014 – PERFORMANCE IN THE GLOBAL ARENA
Per cent0 1 2 3 4 5 6
G7*
Central and Eastern Europe
Middle East
Asia
Africa
Sub-Saharan Africa
AfricawillbeworldchampionineconomicgrowthinthenextfiveyearsExpected average annual GDP growth, 2013-2018
* G7 are Canada, France, Germany, Italy, Japan, UK and USA.
Note Africa includes Northern Africa
SourceIMF, World Economic Outlook, Database, October 2013
Africa:OpenforbusinessOver the past decade, Africa has developed from being an extremely poor conti-nent with dark prospects for the future to becoming the region with the highest growth rates in the world. This provides a potential for European companies, but also affects Europe’s involvement as an aid donor and trade partner for Africa.
The high African growth rates are thanks to a strong increase in inward foreign di-rect investment and major demand for African raw materials from growth countries such as China, India and Turkey.
Contributing directly to the growth and attracting FDI, the African consumer has become a significant player. African consumers demand a wealth of new products and services and often pay for them through their mobile telephones. This gener-ates business opportunities that many companies have gradually spotted.
Business conditions have also improved significantly in the African countries. Some countries are even competing to implement most business-friendly reforms in or-der to be attractive for FDI. It is, however, important to realise that there are major differences across the continent. Not all countries have been able to achieve sky-high growth rates, and a group of African countries are still dominating the bottom of all kinds of ranking from corruption to education.
Some European countries have had strong trade relations with Africa over many years, and the EU is still Africa’s greatest trading partner. There are, however, major differences as to how much the individual countries trade with Africa, and it is par-ticularly the EU-15 member states that have high trade with Africa while the new member states are lagging behind.
At the same time, several donor countries and African partner countries have spotted the advantages of co-thinking aid and trade cooperation and in this way achieved synergic effects between public development aid and private investment. Historically, as Africa’s largest donor, the EU has placed the highest priority on oth-
Potential for European companies in Africa

17GLOBAL BENCHMARK REPORT 2014 – PERFORMANCE IN THE GLOBAL ARENA
er types of aid that aid with focus on job creation and growth. There are signs, however, that in future the EU will place greater emphasis on industrialisation and private sector development with focus on job creation. The chapter ends with a number of recommendations for how the development aid can be structured so that it harmonises most efficiently with the activities of businesses with a view to optimising both development and business effects.


GLOBAL BENCHMARK REPORT 2014 – XXXX
Global Benchmark Report

GLOBAL BENCHMARK REPORT 2014 – XXX
The average ranks of countries in the Level of globalisation pillar
Level of globalisation1.00Average ranks of countries
1 (1) 2 (2) 3 (3) 4 (5) 5 (4) 6 (7) 7 (6) 8 (8) 9 (10) 10 (12) 11 (14) 11 (9) 13 (11) 14 (13) 15 (18) 16 (16) 17 (15) 18 (21) 19 (19) 19 (20) 21 (23) 22 (17) 23 (29) 23 (22) 25 (26) 26 (27) 27 (24) 28 (25) 29 (28) 30 (30) 31 (31) 32 (32) 33 (33)
0 5 10 15 20 25 30
GreeceItaly
JapanFrance
SloveniaSpain
PolandSlovak Republic
TurkeyNorway
Czech RepublicIcelandMexico
PortugalFinland
New ZealandCanada
United StatesHungary
GermanySouth Korea
DenmarkAustria
AustraliaBelgium
United KingdomIsrael
EstoniaNetherlands
SwedenSwitzerland
ChileIreland
Ireland tops the list in terms of average ranking in the benchmarks for Level of globalisation.

GLOBAL BENCHMARK REPORT 2014 – LEVEL OF GLOBALISATION 21
Several OECD countries are still struggling with weak domestic demand. Improved access to major international export markets can help countries tap into global economic growth. The process of globalisation cultivates in-teraction between countries and increases international sales. In order to take advantage of the many new opportunities presented by globalisation, great demands are placed on the global outlook of citizens, companies and policy makers. A positive attitude towards globalisation and openness to-wards foreign ideas and cultures are prerequisites for success.
LEVEL OF GLOBALISATION
The top three countries in Level of globalisation, Ireland, Chile and Switzerland, have retained the same positions as last year.
Ireland is the OECD country with the highest rank in Level of globalisation. The Irish lead is based on several top rankings including the largest share of exports relative to GDP, highest degree of freedom to trade internationally, efficient customs authorities, highest degree of cultural openness and a population with the most positive attitude towards globalisation.
Chile is second with a series of solid performances. The country has the most positive image abroad and excels in terms of both attracting foreign investments and investing abroad.
Switzerland ranks third. The country has the highest share of upmarket exports to EU15, Swiss senior managers have the highest degree of international experience and, additionally, Switzerland is a major investor abroad.

GLOBAL BENCHMARK REPORT 2014 – LEVEL OF GLOBALISATION22
Per cent of GDP
Exports as a percentage of GDP, 20131.02OECD EUROZONE
0 20 40 60 80 100 120
United StatesJapan
AustraliaTurkeyFrance
New ZealandGreece
CanadaItaly
United KingdomMexico
IsraelSpain
NorwayFinland
PortugalSwedenPoland
GermanySwitzerland
DenmarkSouth Korea
AustriaIceland
SloveniaCzech Republic
BelgiumNetherlands
EstoniaHungary
Slovak RepublicIreland
Average annual real growth in per cent
Growth in exports, 2009-2013 (average)1.01OECDEUROZONE
-4 -2 0 2 4 6 8 10
BrazilIndia
China
GreeceFinlandNorway
JapanDenmark
CanadaItaly
SloveniaSwedenAustria
BelgiumFrance
United KingdomSwitzerland
IrelandIsrael
NetherlandsNew Zealand
GermanyHungaryPortugal
United StatesSpain
IcelandCzech Republic
AustraliaPolandMexicoTurkey
Slovak RepublicSouth Korea
Estonia
A country’s export percentage indi-cates to which degree the country participates in the international divi-sion of labour. Small countries typ-ically have a higher export percent-age than large countries because the domestic market is too small to support a highly specialised pro-duction.
Ireland continues to be the coun-try with the largest export as a per-centage of GDP. Ireland is followed by the Slovak Republic and Hun-gary. Ireland has been able to attract international companies that sell a large proportion of their production outside the Irish domestic market.
Export growth is an expression of how successful countries are at converting international business opportunities into increased sales. As a consequence of the financial crisis, many countries have experi-enced major export setbacks, and this decline is only slowly recuper-ated.
Estonia, South Korea and the Slovak Republic top this benchmark.
SourceOECD Economic Outlook No. 94 and DI calculations
Note Exports should be viewed in relation to total production, but in international compar-isons it is often most practical to use GDP (production adjusted for product taxes and consumption in production).
Source OECD Economic Outlook No. 94 and DI calculations
Behind the benchmark
Behind the benchmark

GLOBAL BENCHMARK REPORT 2014 – LEVEL OF GLOBALISATION 23
Per cent of total exports of goods to EU15
Upmarket exports to EU15, 2008-2012 (average)1.04OECDEUROZONE
0 10 20 30 40 50 60 70 80 90
RussiaChinaBrazilIndia
NorwayChile
IcelandPoland
SpainTurkey
FinlandFranceGreece
SloveniaBelgiumPortugal
ItalyNetherlands
GermanySlovak RepublicCzech Republic
HungaryNew Zealand
United KingdomEstonia
South KoreaSwedenMexicoAustria
DenmarkCanada
AustraliaIsrael
United StatesIrelandJapan
Switzerland
Export index divided by market index
Export performance, 2009-2013 (average)1.03OECDEUROZONE
-0.4 -0.2 0.0 0.2 0.4 0.6 0.8 1.0
BrazilRussiaChinaIndia
JapanBelgiumFinlandNorwayCanada
ItalyFranceGreece
AustraliaNew Zealand
AustriaDenmark
ChileNetherlands
United KingdomSwedenIreland
United StatesSlovenia
SpainSwitzerland
Czech RepublicGermany
South KoreaPortugal
MexicoTurkey
HungaryEstoniaIceland
Slovak RepublicIsrael
Poland
Companies in high-cost countries often focus on upmarket products which, due to their quality, design or service concept, are able to earn a higher price than corresponding products from other countries.
85 per cent of Swiss exports to the EU15 are upmarket products, and this again earns Switzerland a clear first place, with Japan and Ireland taking the two following rankings.
Note Upmarket exports are defined as exported products that achieve a price at least 15 per cent higher than the average price for the product in the EU15 states.
Source Eurostat and DI calculations
Export performance indicates whether a country’s exports increase more or less than the general import growth on the export markets.
Positive values indicate that market shares are won abroad while nega-tive values mean loss of market shares. If exports are parallel with imports on the export markets, the country’s export performance will equal zero.
Poland is the top scorer this year with exports in the period 2009-2013 that have developed signifi-cantly faster than the imports of its export markets.
India and China stand out among the BRIC countries. For several years, they have both won market shares to a much higher degree than all the OECD countries.
Source OECD Economic Outlook No. 94 and DI calculations
Behind the benchmark
Behind the benchmark

GLOBAL BENCHMARK REPORT 2014 – LEVEL OF GLOBALISATION24
Foreign direct investment holdings as a percentage of GDP, 20121.06OECD EUROZONE
0 50 100 150 200 250
ChinaIndia (2009)
RussiaBrazil
Japan (2011)South Korea
GreeceItaly
GermanyTurkey
United States (2011)Mexico
Israel (2011)Slovenia
Canada (2011)Finland (2010)
NorwayAustralia
AustriaFrance
Spain (2011)Poland
DenmarkNew Zealand
United KingdomPortugal
Slovak RepublicCzech Republic
SwedenNetherlands
ChileHungaryEstoniaIceland
SwitzerlandIreland
Belgium
Per cent of GDP
Per cent of total exports of goods
Exports to emerging markets (non-OECD countries), 20121.05OECDEUROZONE
0 10 20 30 40 50 60 70
NorwayIrelandMexico
CanadaSlovak RepublicCzech Republic
IcelandNetherlands
BelgiumDenmark
AustriaSwedenPoland
PortugalHungary
SpainGermany
SwitzerlandUnited Kingdom
FranceSlovenia
Italy (2011)Finland
IsraelUnited States
EstoniaGreece
New ZealandChile
TurkeyAustralia
JapanSouth Korea Several markets outside the OECD,
including the BRIC markets, have a high export potential due to the size of their populations, increasing middle classes and economic growth potential. A positive development is closely linked to the ability to reach these markets.
South Korea, Japan and Australia are once again at the top. This should be viewed in the light of their proximity to high-growth markets in Asia, particularly China.
Globalisation is characterised by in-creasing investment across nation-al borders. This development should be viewed in the light of a wish to strengthen ties with foreign custom-ers and benefit from favourable pro-duction conditions in other parts of the world.
The holdings of foreign direct invest-ment indicate the attractiveness of a country’s general business conditions such as taxes, access to raw materi-als, wages and level of education.
Belgium is the OECD country where FDI holdings take up the greatest share of the economy. Ireland and Switzerland come next.
Note Data only includes goods exports.
Source OECD.Stat and DI calculations
SourceUNCTAD
Behind the benchmark
Behind the benchmark

GLOBAL BENCHMARK REPORT 2014 – LEVEL OF GLOBALISATION 25
Foreign direct investments, inflow 2008-2012 (average)OECD EUROZONE
0 5 10 15 20
ChinaIndia
BrazilRussia
JapanDenmark
ItalyFinlandGreece
GermanySouth Korea
SloveniaNetherlands
FranceUnited StatesNew Zealand
AustriaTurkeyMexico
SpainSlovak Republic
CanadaPortugal
PolandUnited KingdomCzech Republic
SwedenSwitzerland
NorwayAustralia
IsraelIceland
HungaryEstonia
ChileIreland
Belgium
Per cent of GDP
1.08
Direct investment holdings abroad as a percentage of GDP, 2012OECD EUROZONE
0 50 100 150 200 250
ChinaIndia
BrazilRussia
TurkeySlovak RepublicCzech Republic
New ZealandMexicoPoland
South KoreaGreece
SloveniaJapan
EstoniaAustraliaHungary
ItalyIsrael
United StatesPortugal
ChileCanadaNorway
GermanySpain
AustriaFinlandFrance
DenmarkUnited Kingdom
IcelandSweden
NetherlandsIreland
SwitzerlandBelgium
Per cent of GDP
1.07
Direct investment abroad is an indi-cation that the country is an active participant in the international divi-sion of labour. It can also, however, be an indication that businesses prefer to invest in countries other than their own.
Belgium takes the lead regarding investment abroad.
SourceUNCTAD
The ability to attract foreign invest-ment is central for domestic compa-nies in a globalised world economy and vital for economic growth in society. A high investment flow indi-cates that foreign investors antici-pate a major growth potential.
Belgium has clearly recorded the highest average inflow of FDI in the past 5 years corresponding to almost 18 per cent of GDP. Ireland and Chile take the following two places.
SourceUNCTAD
Behind the benchmark
Behind the benchmark

GLOBAL BENCHMARK REPORT 2014 – LEVEL OF GLOBALISATION26
Direct investment holding in emerging markets, 2012OECDEUROZONE
0 20 40 60 80 100
IcelandFinlandSweden
FranceBelgium
Germany (2011)Netherlands
DenmarkNew Zealand
Slovak RepublicCzech Republic
ItalySpain
United KingdomPortugal
PolandIreland
Australia (2011)Canada
Israel (2011)United States
SwitzerlandAustriaNorway
JapanTurkey
HungaryKorea
GreeceEstonia
ChileSlovenia
Mexico (2011)
Per cent of total investments
1.10
Foreign direct investments, outflow 2008-2012 (average)OECD EUROZONE
-10 -5 0 5 10 15
BrazilIndia
ChinaRussia
IcelandNew Zealand
TurkeyGreece
SloveniaSlovak RepublicCzech Republic
PolandPortugal
MexicoAustralia
JapanItaly
SpainUnited States
EstoniaIsrael
GermanyDenmark
South KoreaFinland
HungaryFrance
CanadaUnited Kingdom
AustriaNorway
NetherlandsSweden
ChileIreland
SwitzerlandBelgium
Per cent of GDP
1.09
Outflow of direct investment is a sign that a country is an active participant in the international division of labour and aims to take part in growth found outside of the country. It can, however, also be a sign that companies prefer to invest abroad rather than in their own country.
Belgium has the largest outflow of direct investment followed by Switzerland and Ireland.
Source UNCTAD
An increasing share of direct invest-ments takes place in markets out-side the OECD. Such investments can be explained by low production costs, but another important goal is to get hold of a share of the high growth in several of these markets.
Mexico has the greatest share of its direct investment holding in emerg-ing markets. Slovenia and Chile are runners-up.
Note Emerging markets are markets outside the OECD.
Source OECD.Stat and DI calculations
Behind the benchmark
Behind the benchmark

GLOBAL BENCHMARK REPORT 2014 – LEVEL OF GLOBALISATION 27
Index 0 -10
Efficient customs authorities, 20131.12OECD
0 1 2 3 4 5 6 7 8 9 10
BrazilRussia
IndiaChina
PolandSlovak Republic
GreeceMexico
ItalyTurkey
HungaryIceland
PortugalIsrael
Czech RepublicSpain
FranceSouth Korea
JapanSloveniaEstonia
ChileUnited States
CanadaBelgium
SwitzerlandAustralia
United KingdomGermany
NetherlandsAustria
DenmarkNorway
New ZealandFinlandIreland
Sweden
EUROZONE
Index 0 -10
Freedom to trade internationally, 20111.11OECD
0 1 2 3 4 5 6 7 8 9 10
RussiaIndia
ChinaBrazil
IcelandMexicoJapan
SwitzerlandTurkey
NorwayPoland
SloveniaGreece
South KoreaCanada
AustraliaUnited States
Czech RepublicHungary
ItalySpain
AustriaGermany
IsraelFrance
SwedenSlovak Republic
PortugalBelgium
ChileDenmark
EstoniaFinland
NetherlandsNew Zealand
United KingdomIreland
EUROZONE
Cato’s index for international free-dom of trade measures the degree to which general business conditions in the country support internation-alisation and the export and import activities of companies. The index focuses on aspects such as cus-toms barriers and other trade bar-riers, as well as barriers to foreign investment.
Freedom to trade creates a broader sales potential for companies. In addition, the freedom to trade con-tributes to stimulating competitive-ness due to the presence of foreign goods and services.
Ireland takes first place closely fol-lowed by the United Kingdom and New Zealand.
Note High values indicate few barriers for international trade and FDI.
Source Cato Institute, Economic Freedom of the World, 2013
Efficient customs authorities ensure smooth trade across national borders and are a vital
precondition for international business activities. In a period of increasing digitalisation and growing numbers of IT-based reporting systems, it is important that these work optimally and do not constitute a barrier for imports and exports.
Sweden has conquered the top rank followed by Ireland and Finland.
Note High values indicate that local senior managers find the country’s customs author-ities efficient.
Source IMD World Competitiveness Yearbook 2013 (survey, scale 0-10)
Behind the benchmark
Behind the benchmark

GLOBAL BENCHMARK REPORT 2014 – LEVEL OF GLOBALISATION28
Index 0 -10
Cultural openness, 20131.14OECD
0 1 2 3 4 5 6 7 8 9 10
RussiaIndia
BrazilChina
SloveniaFrance
HungaryJapan
EstoniaSlovak Republic
South KoreaCzech Republic
GreeceFinland
ItalyIceland
GermanyNorway
SwitzerlandSpain
AustriaTurkeyMexicoPoland
United StatesBelgium
DenmarkUnited Kingdom
New ZealandChile
PortugalAustralia
CanadaNetherlands
IsraelSwedenIreland
EUROZONE
Index 0 -10
Attitudes toward globalisation, 20131.13OECD
0 1 2 3 4 5 6 7 8 9 10
RussiaBrazilChinaIndia
HungaryFrancePoland
SloveniaSpain
GreeceAustria
Slovak RepublicBelgium
New ZealandCzech Republic
EstoniaItaly
PortugalUnited States
JapanUnited Kingdom
CanadaIceland
GermanySwitzerland
NorwaySouth Korea
FinlandMexicoTurkey
AustraliaNetherlands
ChileDenmark
IsraelSwedenIreland
EUROZONE
A positive attitude to globalisation in society helps to promote the ability of businesses to benefit from the opportunities of globalisation and continuously adapt to the changes needed in international competition.
Ireland, Sweden and Israel hold the top 3 positions in that order.
Note This benchmark indicates the degree to which local senior managers assess that there is a positive attitude to globalisation in society.
Source IMD World Competitiveness Yearbook 2013 (survey, scale 0-10)
Globalisation gives companies access to new partners across the globe. Therefore, adaptation and accept-ance of foreign ideas and cultures are important in order to take an active part in globalisation and exploit its benefits. This applies for instance to the ability to attract foreign invest-ment and highly skilled workers.
Ireland is once again in first place.
China, Brazil and India have a high degree of openness – at a level with the best OECD countries.
Note This benchmark indicates the degree to which local senior managers assess that society is open to foreign ideas.
SourceIMD World Competitiveness Yearbook 2013 (survey, scale 0-10)
Behind the benchmark
Behind the benchmark

GLOBAL BENCHMARK REPORT 2014 – LEVEL OF GLOBALISATION 29
Index 0 -10
Image abroad, 20131.16OECD
0 1 2 3 4 5 6 7 8 9 10
RussiaIndia
ChinaBrazil
HungaryGreecePoland
PortugalSpain
FranceMexico
ItalySloveniaBelgium
IsraelSlovak RepublicCzech Republic
IcelandTurkey
EstoniaUnited Kingdom
NorwayFinland
JapanUnited States
DenmarkNetherlands
New ZealandIreland
AustraliaAustriaCanada
SwitzerlandSouth Korea
SwedenGermany
Chile
EUROZONE
Index 0 -10
International experience for senior managers, 20131.15OECD
0 1 2 3 4 5 6 7 8 9 10
RussiaChinaIndia
Brazil
JapanSpain
SloveniaPortugalEstoniaIceland
ItalySlovak Republic
New ZealandSouth Korea
FranceAustralia
Czech RepublicNorwayGreece
CanadaTurkey
United StatesChile
United KingdomHungary
IsraelDenmark
AustriaMexicoFinland
BelgiumGermany
IrelandNetherlands
PolandSweden
Switzerland
EUROZONE
A high degree of international expe-rience of senior managers is vital when strategic decisions have to be made on global issues, and when employees across national borders have to be managed as efficiently as possible.
Switzerland is still number one in this benchmark. The country is headquarters of many global corpo-rations and organisations, and is characterised by an attractive business environment, including a favourable tax system for highly educated people.
Note A high value indicates that senior managers generally have major international experience.
Source IMD World Competitiveness Yearbook 2013 (survey, scale 0-10)
A positive image abroad can help to promote exports and international relations and contribute to attracting investment to the country. A coun-try's image abroad is affected by many different factors including sports performances, tourist attractions, major events, business strengths and the international commitment of the country.
Chile, Germany and Sweden top the benchmark this year.
Note This benchmark shows to which degree local senior managers assess that the image abroad of their country helps to promote international business developments.
Source IMD World Competitiveness Yearbook 2013 (survey, scale 0-10)
Behind the benchmark
Behind the benchmark

GLOBAL BENCHMARK REPORT 2014 – PRODUCTIVITY AND INNOVATION30
The average ranks of countries in the Productivity and innovation pillar
Productivity and innovation2.00
0 5 10 15 20 25 30
GreeceMexico
ItalySlovak Republic
HungaryPoland
SloveniaChile
Czech RepublicSpain
PortugalIsrael
EstoniaFranceAustria
New ZealandBelgium
JapanNorway
South KoreaGermany
IcelandUnited Kingdom
CanadaIreland
AustraliaDenmark
FinlandUnited States
NetherlandsSweden
Switzerland
Average ranks of countries
1 (1) 2 (2) 3 (3) 3 (5) 5 (9) 6 (6) 7 (4) 8 (10) 9 (8) 10 (11) 11 (7) 12 (12) 13 (13) 14 (14) 15 (17) 16 (16) 17 (19) 18 (15) 19 (18) 20 (20) 21 (21) 22 (22) 23 (23) 24 (24) 25 (25) 25 (26) 27 (27) 28 (27) 29 (29) 30 (29) 31 (31) 32 (32) 33 (33)
Turkey
Switzerland is most successful in terms of average ranking in benchmarks for Productivity and innovation.

GLOBAL BENCHMARK REPORT 2014 – PRODUCTIVITY AND INNOVATION 31
PRODUCTIVITY AND INNOVATION
The level of development varies across the OECD, and so does the specific need for development in the areas of productivity and innovation. The most advanced countries are strongly reliant on the design and development of cutting-edge innovations in order to maintain their competitive advantage. Countries less advanced can still reap benefits from adopting existing tech-nologies. Developing a country's level of productivity and innovation in-cludes prioritizing investment in research and development, taking out pat-ents and facilitating entrepreneurship.
Switzerland excels as the country with the highest levels of Productivity and innova-tion. The country has particularly strong university/industry research collaboration and is leading in both patent applications and innovation performance. Switzerland has been successful in attracting businesses in sectors with high patent activity. Final-ly, Switzerland has the most widespread use of fixed broadband subscriptions and is one of the most energy efficient countries in the OECD.
Sweden is the runner-up in Productivity and innovation, and good rankings include high patent activity including European patent applications and triadic patent fami-lies. The country also has a high level of innovation performance.
The Netherlands earns third place as a result of the high quality of infrastructure, effi-cient supply of electricity, and a large number of fixed broadband subscribers.

GLOBAL BENCHMARK REPORT 2014 – PRODUCTIVITY AND INNOVATION32
Per cent of GDP
Public sector investments as percentage of GDP, 20112.02OECD
0 1 2 3 4 5 6
Russia (2009)
Austria
Greece
Germany
Belgium
Israel
Iceland
Italy
Denmark
Switzerland
Slovak Republic
Finland
Ireland
Portugal
Spain
France
Hungary
Norway
Japan
Netherlands
Sweden
Slovenia
Czech Republic
Estonia
South Korea
Poland
EUROZONE
Per cent
Investments as a percentage of GDP, 20132.01OECDEUROZONE
0 10 20 30 40 50
BrazilRussia
IndiaChina
IrelandGreeceIceland
United KingdomPortugal
NetherlandsSloveniaHungary
DenmarkItaly
GermanySpain
Slovak RepublicIsrael
SwedenFinland
United StatesFranceTurkeyPoland
New ZealandJapan
SwitzerlandBelgium
AustriaCzech Republic
MexicoCanada
ChileNorway
South KoreaEstonia
Australia Investment is an important driving force behind productivity gains and growth. Many factors are involved in the level of investment in the various countries, including economic devel-opment, access to financing and gen-eral business conditions.
Investment in new equipment, means of transport, buildings and informa-tion technology makes production more efficient. Investment in research and innovation supports the develop-ment of new products while invest-ment in infrastructure and energy sup-ply provides more efficient conditions for businesses.
Australia takes the lead with invest-ments corresponding to almost a third of the country's GDP. Far ahead of both the OECD countries and the oth-er BRIC countries, China has an im-pressive investment share of almost 50 per cent of GDP.
Note Investment covers private sector invest-ment, public sector investment and housing investment.
SourceIMF, World Economic Outlook October 2013
Public sector investment can contribute to enhancing growth in the private sector. Investment in infrastructure and information tech-nology, for example, may contribute to increased mobility, flexibility and productivity.
Poland, South Korea and Estonia have the highest proportions of public investment in relation to GDP among the OECD countries.
Comparisons of public sector invest-ment across countries are influ-enced by the fact that some coun-tries have developed the public sector at a much earlier stage than others, and currently do not need investment at the same scale. Furthermore, the definition of public investment differs among the coun-tries suggesting cautious interpreta-tion of the figure.
Source IMF, World Economic Outlook October 2013
Behind the benchmark
Behind the benchmark

GLOBAL BENCHMARK REPORT 2014 – PRODUCTIVITY AND INNOVATION 33
Average annual growth in GDP per working hour in per cent
Growth in labour productivity, 2009-2013 (average)2.04OECD
-3 -2 -1 0 1 2 3 4
Brazil
GreeceSlovenia
United KingdomNetherlands
IsraelCzech Republic
HungarySwitzerland
ItalyFinland
BelgiumTurkey
GermanyAustriaFrance
NorwayChile
CanadaSwedenPortugal
DenmarkIcelandMexico
United StatesAustralia
New ZealandSlovak Republic
JapanSpain
EstoniaSouth Korea
IrelandPoland
EUROZONE
USD per working hour (PPP)
Labour productivity, 20132.03OECD
0 10 20 30 40 50 60 70 80
Brazil
ChileMexicoTurkey
EstoniaHungary
PolandPortugal
Czech RepublicSouth Korea
GreeceSlovak Republic
IsraelSlovenia
New ZealandItaly
FinlandJapanSpain
SwitzerlandIcelandCanada
United KingdomDenmark
AustriaSweden
AustraliaIreland
GermanyFrance
NetherlandsBelgium
United StatesNorway
EUROZONE
Wealth creation in a society is close-ly connected with labour produc-tivity.
Norway tops the list with the highest productivity per working hour. Norway’s considerable production per working hour is particularly ascribed to oil and therefore less a reflection of labour productivity on the Norwegian mainland. The United States, Belgium and the Netherlands are runners-up with labour productivity significant-ly above the OECD average. This shows that these countries are capable of generating high pros-perity per working hour.
Countries with a low level of produc-tivity will often develop faster than countries with a high productivity lev-el because the aforementioned coun-tries can more easily improve their productivity through imports of mod-ern capital equipment and reorgani-sation of their production structure.
Poland, Ireland and South Korea win the three top ranks and, according-ly, have recorded the highest average growth in labour productivity over the past five years.
Source The Conference Board Total Economy Database, January 2014
SourceThe Conference Board Total Economy Database, January 2014
Behind the benchmark
Behind the benchmark
GLOBAL BENCHMARK REPORT 2014 – PRODUCTIVITY AND INNOVATION34
Per cent of GDP
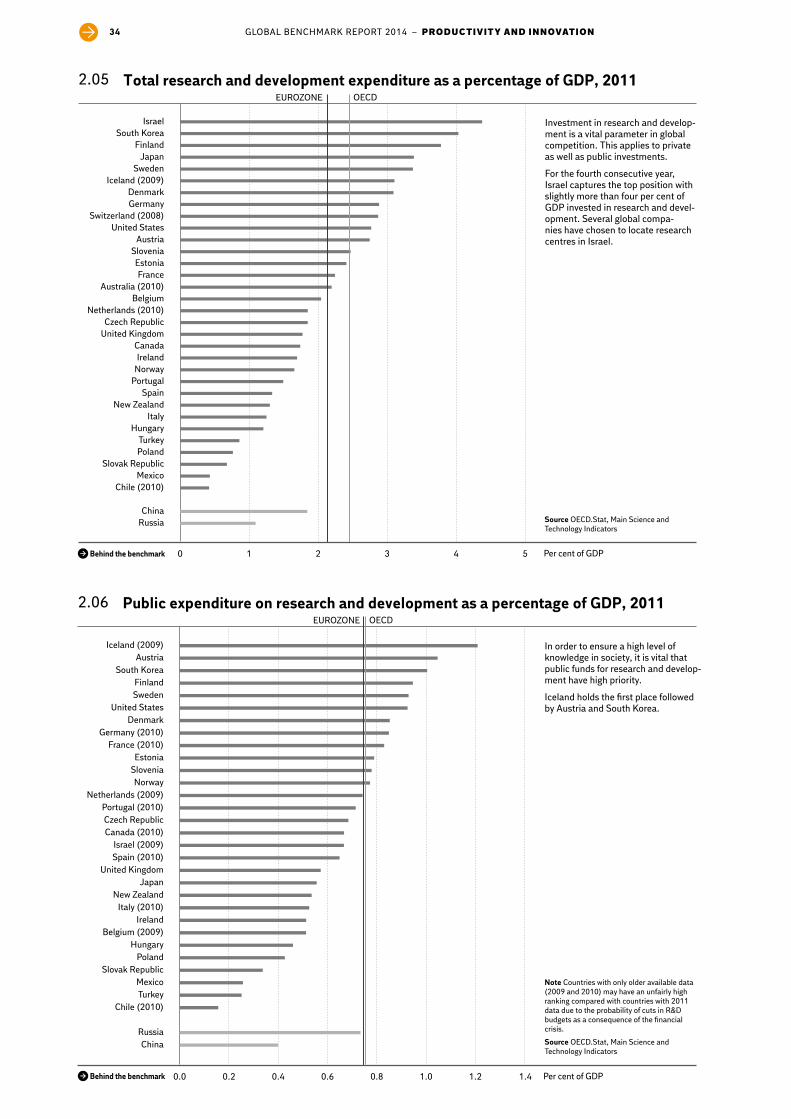
Public expenditure on research and development as a percentage of GDP, 20112.06OECD
0.0 0.2 0.4 0.6 0.8 1.0 1.2 1.4
ChinaRussia
Chile (2010)TurkeyMexico
Slovak RepublicPoland
HungaryBelgium (2009)
IrelandItaly (2010)
New ZealandJapan
United KingdomSpain (2010)Israel (2009)
Canada (2010)Czech Republic
Portugal (2010)Netherlands (2009)
NorwaySloveniaEstonia
France (2010)Germany (2010)
DenmarkUnited States
SwedenFinland
South KoreaAustria
Iceland (2009)
EUROZONE
Per cent of GDP
Total research and development expenditure as a percentage of GDP, 20112.05OECD
0 1 2 3 4 5
RussiaChina
Chile (2010)Mexico
Slovak RepublicPolandTurkey
HungaryItaly
New ZealandSpain
PortugalNorwayIreland
CanadaUnited KingdomCzech Republic
Netherlands (2010)Belgium
Australia (2010)France
EstoniaSlovenia
AustriaUnited States
Switzerland (2008)GermanyDenmark
Iceland (2009)Sweden
JapanFinland
South KoreaIsrael
EUROZONE
Investment in research and develop-ment is a vital parameter in global competition. This applies to private as well as public investments.
For the fourth consecutive year, Israel captures the top position with slightly more than four per cent of GDP invested in research and devel-opment. Several global compa-nies have chosen to locate research centres in Israel.
SourceOECD.Stat, Main Science and Technology Indicators
In order to ensure a high level of knowledge in society, it is vital that public funds for research and develop-ment have high priority.
Iceland holds the first place followed by Austria and South Korea.
Note Countries with only older available data (2009 and 2010) may have an unfairly high ranking compared with countries with 2011 data due to the probability of cuts in R&D budgets as a consequence of the financial crisis.
Source OECD.Stat, Main Science and Technology Indicators
Behind the benchmark
Behind the benchmark

GLOBAL BENCHMARK REPORT 2014 – PRODUCTIVITY AND INNOVATION 35
Index 1-7
University/industry research collaboration, 2012-2013 (average)2.08OECD
1 2 3 4 5 6 7
RussiaBrazilIndia
China
GreeceSlovak Republic
PolandItaly
SloveniaTurkeySpain
MexicoHungary
ChileEstonia
Czech RepublicFrance
PortugalSouth Korea
IcelandAustria
DenmarkNew Zealand
CanadaJapan
AustraliaNorwayIreland
NetherlandsSweden
GermanyIsrael
BelgiumUnited Kingdom
United StatesFinland
Switzerland
EUROZONE
Index 1-7
Quality of scientific research institutions, 2012-2013 (average)2.07OECD
1 2 3 4 5 6 7
RussiaBrazilChinaIndia
GrækenlandSlovak Republic
TurkeyPolandMexico
ChileItaly
SpainSlovenia
IcelandCzech Republic
EstoniaSouth Korea
AustriaNorway
HungaryPortugal
New ZealandDenmark
CanadaSwedenIrelandFrance
FinlandJapan
AustraliaNetherlands
GermanyUnited States
BelgiumUnited Kingdom
SwitzerlandIsrael
EUROZONE
High quality in scientific institutions is central to a high level of research and makes it easier to attract foreign students and scientists as well as foreign investment in R&D.
Israel has the top rank this year. Israel’s position has to do with its massive investment in R&D in recent years.
Note High index values indicate that senior managers in the country assess that the local scientific research institutions are among the best in the world in their specific field.
Source WEF 2013-2014, survey
Strong research collaboration be-tween universities and industry is essential in order to guarantee rel-evant research for both businesses and society. It is also an important path for the transfer of new knowl-edge between businesses and uni-versities.
Switzerland takes the rank as num-ber one followed by Finland and the United States.
According to senior managers, these countries have the best research col-laboration between universities and industry.
Note High index values indicate that senior managers in the country assess that research collaboration between universities and industry is widespread.
Source WEF 2013-2014, survey
Behind the benchmark
Behind the benchmark

GLOBAL BENCHMARK REPORT 2014 – PRODUCTIVITY AND INNOVATION36
Patents per million inhabitants
Triadic patent families, 20112.10OECD
0 10 20 30 40 50 60 70 80 90 100 110
IndiaBrazil
RussiaChina
MexicoTurkeyPoland
ChileGreece
Slovak RepublicPortugal
Czech RepublicEstonia
HungarySlovenia
SpainIceland
New ZealandAustralia
ItalyCanadaIreland
NorwayUnited Kingdom
BelgiumFrance
South KoreaAustria
IsraelUnited States
DenmarkNetherlands
FinlandGermany
SwedenSwitzerland
Japan
EUROZONE
Applications per million inhabitants
European patent applications, 20122.09OECD
0 100 200 300 400 500 600 700 800 900
IndiaBrazil
RussiaChina
MexicoChile
TurkeySlovak Republic
GreecePortugal
PolandHungary
Czech RepublicNew Zealand
EstoniaSpain
AustraliaSlovenia
ItalyCanada
United KingdomNorway
United StatesSouth Korea
IrelandIsrael
IcelandFrance
BelgiumJapan
AustriaDenmark
NetherlandsGermany
FinlandSweden
Switzerland
EUROZONE
The number of European patent applications is an indicator of the degree to which companies in the country perceive the European coun-tries as key markets for their innova-tive products and processes.
Similar to previous years, Switzerland is in a superior position ahead of all other OECD countries with the high-est number of patent applications per million inhabitants. Switzerland has attracted many businesses in the most patent-active sectors, includ-ing the pharmaceutical industry. The appeal is mainly due to the combina-tion of low tax rates, researcher pro-grammes, corporate law, infrastruc-ture and location.
Note A European patent is achieved through application to the European Patent Office (EPO). Following submission of application, the patents must be designated in the indi-vidual country at the national patent author-ities. The figures here only indicate submis-sion of applications to EPO and do not say which EU member states were designated afterwards.
Source European Patent Office, IMF, and DI calculations
A triadic patent is a patent that is taken out at the same time in the United States, Japan and the EU. The triadic patents are taken out to ensure broad international protec-tion in three of the world’s major markets.
It should be noted that global com-panies increasingly also take out patents in one or several BRIC coun-tries and in other emerging markets.
Similar to preceding years, Japan, Switzerland and Sweden top the list of this type of patent. One of the reasons is that all three countries are knowledge societies with focus on sectors with frequent patenting such as the IT and telecom indus-try, the pharmaceutical industry and high technology in general.
Source OECD.Stat, IMF World Economic Outlook October 2013 and DI calculations
Behind the benchmark
Behind the benchmark

GLOBAL BENCHMARK REPORT 2014 – PRODUCTIVITY AND INNOVATION 37
Per cent
Growth expectations among entrepreneurs, 20122.12OECD
0 10 20 30 40 50
BrazilChina
Russia
SpainAustriaGreece
SwitzerlandSweden
ItalyNorway
NetherlandsFinlandMexico
BelgiumIsrael
SloveniaFrance
GermanyPortugal
PolandUnited States
United KingdomDenmark
IrelandHungary
Slovak RepublicJapan
Iceland (2010)South Korea
EstoniaCzech Republic (2011)
Chile (2011)Australia (2011)
Turkey
EUROZONE
Index 0-1
Innovation performance, 20122.11OECD
0.0 0.1 0.2 0.3 0.4 0.5 0.6 0.7 0.8 0.9
Turkey
Poland
Hungary
Slovak Republic
Greece
Czech Republic
Portugal
Spain
Italy
Norway
Estonia
Slovenia
France
Ireland
Austria
United Kingdom
Iceland
Belgium
Netherlands
Finland
Denmark
Germany
Sweden
Switzerland
EUROZONE
In a world of tough international competition, the continual innova-tion and development of products, processes and services are a precon-dition for creating growth and pros-perity in society.
The European Innovation Scoreboard tracks 25 socio-economic and company-specific factors that are central to the ability of compa-nies to be innovative. These factors include number of patents, innova-tion expenditure and the launch of new products and services by small companies.
Switzerland takes the innovation prize again this year.
Source European Innovation Scoreboard, Summary Innovation Index 2012
The most important job creation takes place among small and, in particular, newly established busi-nesses. It is vital that entrepreneurs are able to grow and develop their enterprises. The entrepreneurs’ own expectations for their growth are an indication of their future situation. Since growth expectations often work as a mental benchmark for the individual entrepreneur, there is often close correlation between expectations and reality.
Turkey holds first place with the highest growth expectations among the country's entrepreneurs.
Note The share of entrepreneurs who expect to take on at least five new employees in the next five years. Entrepreneurs are defined as people in the 18-64 age group who are either in the process of starting a business or are actually operating a newly established firm (maximum 3.5 years old). This data was also included in the Global Benchmark Report 2013. Additional information is provided in the section on methodology.
SourceGEM 2013
Behind the benchmark
Behind the benchmark

GLOBAL BENCHMARK REPORT 2014 – PRODUCTIVITY AND INNOVATION38
Per cent
Framework conditions for entrepreneurship, 20132.14OECD
0 10 20 30 40 50 60 70 80 90 100
BrazilIndia
ChinaRussia
SpainCzech Republic
AustriaJapan
GermanySlovak Republic
SwitzerlandPolandMexico
ItalyTurkey
ChileUnited Kingdom
GreeceIsrael
United StatesSouth Korea
EstoniaNorwayIcelandFrance
HungarySweden
DenmarkIrelandFinland
NetherlandsBelgiumSloveniaPortugalAustralia
CanadaNew Zealand
EUROZONE
Per cent
Entrepreneurial activity, 20122.13OECD
0 5 10 15 20 25
RussiaChinaBrazil
JapanItaly
FranceBelgium
GermanyDenmarkSlovenia
SpainSwitzerland
FinlandIreland
SwedenGreece
IsraelSouth Korea
NorwayCzech Republic (2011)
PortugalUnited Kingdom
HungaryPolandAustria
Slovak RepublicNetherlands
Australia (2011)Iceland (2010)
TurkeyUnited States
EstoniaChile
EUROZONE
In order to support the establish-ment of new businesses it is impor-tant that the structures and legis-lation of society provide good conditions for entrepreneurship.
Again this year, New Zealand wins most points and gets the maximum score (100 per cent). Canada and Australia are close to 100 per cent in second and third place.
Note This benchmark is an indicator of the scope of procedures, time and costs required for a small or medium-sized enterprise to get started and to function formally. New Zealand has the best business conditions for entrepre-neurship and is therefore assigned a score of 100 per cent. The other countries are bench-marked in relation to New Zealand.
Source World Bank, Doing Business 2014
Entrepreneurial activity is an impor-tant precondition for economic growth.
Chile ranks highest on the list again this year followed by Estonia and the United States as the countries with the greatest share of new entrepre-neurs in the OECD.
It is normal to distinguish between entrepreneurship driven by neces-sity and entrepreneurship driven by opportunity. Countries such as Chile and Estonia with a relatively low level of prosperity typically have a large share of entrepreneurs driven by necessity.
Note The share of the population in the 18-64 age group which is either in the process of starting a business or is actually operating a newly established firm (maximum 3.5 years old). This data was also included in the Global Benchmark Report 2013. Additional infor-mation is provided in the section on meth-odology.
Source GEM 2013
Behind the benchmark
Behind the benchmark

GLOBAL BENCHMARK REPORT 2014 – PRODUCTIVITY AND INNOVATION 39
Per cent of GDP
Venture capital investments as a percentage of GDP, 2009-2012 (average)2.16
0.00 0.05 0.10 0.15 0.20 0.25 0.30 0.35 0.40 0.45
Poland
Greece
Czech Republic
Italy
Spain
Austria
Portugal
Germany
Netherlands
France
United Kingdom
Hungary
Belgium
Ireland
Norway
Finland
Sweden
Switzerland
Denmark
EUROZONE
Years
Average time to complete the procedure of closing a business, 20132.15OECD
0 1 2 3 4 5
IndiaBrazil
RussiaChina
Slovak RepublicGreeceTurkey
ChileSwitzerland
PolandEstonia
Czech RepublicSweden
SloveniaPortugal
IsraelHungary
FranceMexico
ItalyUnited States
SpainSouth Korea
New ZealandGermany
NetherlandsAustria
United KingdomIceland
DenmarkAustralia
NorwayFinland
BelgiumCanada
JapanIreland
EUROZONE
Entrepreneurs who start a new business after bankruptcy or clo-sure grow faster than other newly established businesses. This is why it should be easy to close the old business and get started again with a new one after bankruptcy.
In Ireland it takes less than six months to close a business and once again this puts Ireland in the top position in this indicator.
It is important to create a come-again-culture in society in order to encourage entrepreneurs to start again after a bankruptcy or closure.
The procedures of closing a busi-ness generally take longer in the BRIC countries. Particularly in India where it takes more than four years, on average, to complete the closing of a business.
Access to risk capital is essential for entrepreneurs in order to realise their ideas and start their own busi-ness. Venture capital is particularly important for entrepreneurs for whom return on investment lies rela-tively far into the future.
These enterprises are often based on technology and knowledge that it takes a long time to develop, but which, on the other hand, are vital for productivity. Therefore, access to venture capital is not only important for the individual entrepreneur, but also for the general improvement of productivity in society.
This year, Denmark is the country with the best access to risk capital as seen as an average over the period 2009-2012.
Note The estimated time it takes to handle a bankruptcy case and close/reorganise a bank-rupt company from presumed information about the company.
Source World Bank, Doing Business 2014
Note Data shows the level of seed and early stage investments.
Source Eurostat and DI calculations
Behind the benchmark
Behind the benchmark

GLOBAL BENCHMARK REPORT 2014 – PRODUCTIVITY AND INNOVATION40
Index 0-10
Mentality of society supporting competitiveness, 20132.18OECD
0 1 2 3 4 5 6 7 8 9 10
RussiaBrazilChinaIndia
HungarySpain
PolandSlovenia
FranceItaly
PortugalCzech RepublicSlovak Republic
GreeceAustria
BelgiumJapan
MexicoTurkey
DenmarkIceland
South KoreaNorwayFinlandEstonia
NetherlandsUnited Kingdom
New ZealandGermany
ChileAustralia
CanadaSwedenIreland
IsraelSwitzerland
United States
EUROZONE
Share of enterprises with 10 or more employees, per cent
Gazelle enterprises, 20102.17
ManufacturingService
0.0 0.2 0.4 0.6 0.8 1.0 1.2
United States
Denmark*
Spain
Italy
New Zealand
Sweden
Slovenia (2009)
Hungary
Portugal
Israel
Canada (2009)
France
Estonia (2009)
Czech Republic
Strong competitiveness contributes to increasing the incentive to qualify further and achieve good results both individually and at company-level.
For the tenth consecutive year, the United States is the country assessed to have the most compet-itive mentality. American society is permeated by a strong compet-itive mentality that is cultivated already in the educational system with tracking and privileges for the best pupils. This continues onto the labour market where schemes such as “the employee of the month” help to promote competition among the employees of a company.
Gazelles are the subset of high-growth enterprises up to five years old with average annualised growth greater than 20 per cent over a three-year period and at least 10 employees.
Gazelles are an indication of how favourable the environment in which the enterprises operate is. Countries such as the Czech Republic and Esto-nia have a very low starting point, and therefore it is relatively easy for them to achieve a higher proportion of gazelles.
Note This indicator shows to which degree senior managers in the country assess the mentality of society to support competition.
Source IMD World Competitiveness Yearbook 2013 (survey, scale 0-10)
* Data for Denmark is gleaned from Statistics Denmark and is based on market sectors while the OECD has cate-gorised data according to service and manufacturing. Data therefore is not directly comparable, but gives an indi-cation of levels. The ranking is based on manufacturing enterprises.
Source OECD, Entrepreneurship at a Glance, 2013 and Statistics Denmark
Behind the benchmark
Behind the benchmark

GLOBAL BENCHMARK REPORT 2014 – PRODUCTIVITY AND INNOVATION 41
Broadband subscribers per 100 inhabitants
Fixed broadband subscribers, 20122.20OECD
0 5 10 15 20 25 30 35 40 45
TurkeyMexico
ChileSlovak Republic
PolandCzech Republic
HungaryItaly
PortugalIrelandGreece
SloveniaEstonia
SpainIsrael
AustriaAustralia
JapanNew Zealand
United StatesFinlandSwedenCanada
BelgiumGermany
United KingdomIcelandNorwayFrance
South KoreaDenmark
NetherlandsSwitzerland
EUROZONE
Index 0-10
Flexibility and adaptability, 20132.19OECD
0 1 2 3 4 5 6 7 8 9 10
RussiaChinaIndia
Brazil
SlovenienFrance
HungarySpainJapan
AustriaGermany
Czech RepublicChile
BelgiumFinland
ItalyNorwayGreece
Slovak RepublicEstonia
NetherlandsUnited Kingdom
South KoreaAustraliaPortugal
MexicoSwitzerland
CanadaNew Zealand
DenmarkIceland
United StatesSweden
TurkeyPoland
IsraelIreland
EUROZONE
Changing market conditions are companions of globalisation. This means that businesses must be flexible and adaptable if they are to succeed in global competition.
Ireland tops the list this year as the country with the greatest flexibility and adaptability.
Brazilian and Indian flexibility and adaptability are assessed to be over the level of the average performance in both the OECD countries and the Eurozone.
Note This benchmark shows to which degree senior managers in the country assess that the local population displays flexibility and adaptability in the face of challenge.
Source IMD World Competitiveness Yearbook 2013 (survey, scale 0-10)
The number of fixed broadband connections is an indicator of the degree to which the individual cit-izen has access to a good and fast Internet connection.
IT and high-speed connections in both the private and public sector help boost productivity and enhance international competitiveness. The spread of high-speed Internet in sparsely populated areas can reduce gaps between different parts of a country and enhance economic development.
In order to ensure this, the EU has prioritised the rollout of the extremely fast next-generation access network. The European Commission’s 2020-target aims at speeds of 30 megabit per second for all and 100 megabit per second for more than half of all households.
Switzerland, the Netherlands and Denmark take the top three posi-tions.
SourceOECD Broadband Statistics, 2012
Behind the benchmark
Behind the benchmark

GLOBAL BENCHMARK REPORT 2014 – PRODUCTIVITY AND INNOVATION42
Index 0-10
Economic freedom, 20112.22OECD
0 1 2 3 4 5 6 7 8 9
RussiaIndia
ChinaBrazil
SloveniaMexicoGreece
ItalyTurkeyPoland
Czech RepublicIsrael
PortugalBelgiumIcelandFrance
Slovak RepublicSouth Korea
JapanSpain
NorwayNetherlands
SwedenHungary
AustriaIreland
GermanyUnited States
EstoniaDenmark
United KingdomChile
AustraliaCanadaFinland
SwitzerlandNew Zealand
EUROZONE
Percentage of enterprises that have received orders online in the past year
E-commerce, 20122.21
0 5 10 15 20 25 30 35 40
Italy
Greece
Turkey (2010)
Poland
Hungary
France
Estonia
Austria
Slovak Republic
Spain
Slovenia
Portugal
Finland
United Kingdom
Netherlands
Germany
Ireland
Belgium
Czech Republic
Denmark
Sweden
Norway
Iceland
EUROZONE
E-commerce is a central element in modern, digital society. It minimises sales costs and makes everyday life easier for companies as well as for citizens. Online sales make it eas-ier to sell products across large dis-tances and across national borders. The share of companies that sell products online is therefore an indi-cator of the degree of digitalisation in a country, and suggests the com-petitiveness of the private sector.
Iceland tops the chart this year with 35 per cent of its companies selling products online.
Only 14.5 per cent of Internet users in the EU purchased products online from another EU member state in 2012.
Note Financial sector is not included. Enterprises with ten employees or more selling at least 1 per cent of turnover online
SourceEurostat
Economic freedom promotes dyna-mism and growth in society and creates the basis for an efficient use of the country’s resources.
Cato's index for economic freedom measures a number of socio-eco-nomic provisions that support the initiative, entrepreneurship and freedom of individuals.
For the fifth consecutive year, New Zealand takes top rank as the best provider of economic freedom. New Zealand excels with a well-func-tioning legal system, good access to capital and a low level of govern-ment regulation. Switzerland and Finland are followers-up.
Note High values indicate high economic freedom.
SourceCato Institute, Economic Freedom of the World 2013
Behind the benchmark
Behind the benchmark

GLOBAL BENCHMARK REPORT 2014 – PRODUCTIVITY AND INNOVATION 43
Index 1-7
Quality of infrastructure, 2012-2013 (average)2.24OECD
1 2 3 4 5 6 7
BrazilRussia
IndiaChina
PolandSlovak Republic
HungaryMexicoGreece
IsraelItaly
EstoniaSlovenia
TurkeyChile
Czech RepublicNorway
AustraliaIreland
New ZealandDenmark
AustriaPortugal
United KingdomSwedenCanada
United StatesBelgiumIceland*
South KoreaJapanSpain
GermanySwitzerland
FranceFinland
Netherlands
EUROZONE
Index 1-7
Burden of government regulation, 2012-2013 (average)2.23OECD
1 2 3 4 5 6 7
BrazilRussia
IndiaChina
ItalyGreece
HungarySlovak Republic
SloveniaCzech Republic
BelgiumPoland
PortugalFrance
AustraliaSpain
MexicoIsrael
DenmarkSouth Korea
AustriaJapan
United StatesTurkey
NorwayGermany
CanadaUnited Kingdom
IcelandIreland
NetherlandsChile
SwedenSwitzerland
New ZealandEstoniaFinland
EUROZONE
A reduction of the administrative bur-dens of industry presents a major potential for releasing resources and promoting competitiveness.
During the recession, governments around the world have become more aware of the benefits of rule simplifi-cation and have launched ambitious goals.
Finland, Estonia and New Zealand are assessed to have the least administra-tive hardship for industry. Among the BRIC countries, Brazil has the most widespread red tape.
Note High values indicate that senior managers in the country perceive that the government imposes major administrative burdens on businesses.
Source WEF 2013-2014, survey
High mobility is important for the competitiveness of a country. Good quality infrastructure increases pro-ductivity and attracts international investment. Well-developed infra-structure reduces the effects of large distances between regions, integrates the national market, and connects it to other countries and regions at low cost. A well-in-tegrated infrastructure network is a prerequisite for the access of less-developed municipalities to core economic activities, and can thereby contribute to reducing eco-nomic inequalities across commu-nities and stimulating economic growth.
The Netherlands takes the top posi-tion followed by Finland and France.
* Iceland is without assessment of railway infrastructure since there is less than 50 kilometres of railway in the country.
Note High values indicate that senior managers perceive the infrastructure of the country as well-functioning compared with international standards. In this benchmark, the quality of a country’s infrastructure is determined on the basis of an average of assessments of road, rail, maritime and avia-tion infrastructures.
Source WEF 2013-2014, survey
Behind the benchmark
Behind the benchmark

GLOBAL BENCHMARK REPORT 2014 – PRODUCTIVITY AND INNOVATION44
Million TOE relative to GDP (PPP, bn. 2005 USD)
Energy intensity, 20112.25OECD
0.0 0.1 0.2 0.3 0.4 0.5 0.6
RussiaChinaIndia
Brazil
IcelandEstoniaFinlandCanada
South KoreaUnited States
Czech RepublicNew Zealand
BelgiumSweden
Slovak RepublicPoland
SloveniaHungaryAustralia
MexicoFrance
ChileNorway
NetherlandsJapanTurkey
IsraelGreece
GermanyAustria
SpainPortugal
ItalyDenmark
United KingdomSwitzerland
Ireland
EUROZONE
Index 1-7
Quality of electricity supply, 2012-2013 (average)2.26OECD
1 2 3 4 5 6 7
IndiaRussiaBrazilChina
MexicoTurkey
EstoniaChile
GreecePoland
HungaryIsrael
South KoreaItaly
JapanNew Zealand
GermanySlovak Republic
United StatesAustraliaSlovenia
SpainPortugalBelgium
Czech RepublicIreland
CanadaSwedenNorwayFrance
United KingdomIceland
DenmarkFinlandAustria
NetherlandsSwitzerland
EUROZONE
In order to operate a business effi-ciently, energy supply should be reliable, stable and sustainable at affordable prices. Therefore, an effi-cient supply of electricity will help increase productivity and facilitate the production process in a country.
High quality of electricity supply is part of a well-developed infrastruc-ture. A well-integrated infrastruc-ture is also a precondition for the access of less developed munic-ipalities to core economic activ-ities, and thereby contributes to reducing economic inequalities across communities and stimulate economic growth.
Switzerland is assessed to have to highest quality of electricity supply in the OECD. However, it should be noted that the average quality is high and several countries have an assessment close to that of Switzerland.
Note High values indicate that senior managers perceive the quality of electricity supply of the country as high compared with international standards.
Source WEF 2013-2014, survey
Energy intensity is a benchmark of the amount of energy used for socie-ty’s production. Here it is calculated as million tons of oil equivalents rel-ative to GDP. Low energy intensity means that only little energy is used in production, indicating high energy efficiency.
For the fifth consecutive year, Ireland tops the chart as the most energy effi-cient country along with Switzerland.
Data goes back to 2011 when many countries were badly affected by the recession and therefore reported decreasing production, including decreasing energy-intensive produc-tion.
The variety of energy intensities can be partly explained by the industrial structure of the countries. Countries with much heavy industry have higher energy intensity than countries with a large proportion of service companies.
Note Calculated as total primary energy supply (million tons of oil equivalents) per billion GDP units (PPP) in fixed USD 2005-prices.
SourceIEA, Key World Energy Statistics 2013
Behind the benchmark
Behind the benchmark

GLOBAL BENCHMARK REPORT 2014 – PRODUCTIVITY AND INNOVATION 45

GLOBAL BENCHMARK REPORT 2014 – QUALIFIED LABOUR46
The average ranks of countries in the Qualified labour pillar
Qualified labour3.00
0 5 10 15 20 25 30
1 (1)2 (3) 2 (2)4 (5)5 (14)6 (6)6 (9)8 (4)9 (7)10 (13)11 (8)12 (10)13 (10) 14 (10)15 (17)16 (16)17 (15)18 (19) 19 (18)20 (22)21 (21) 22 (20)23 (24) 24 (23)25 (25) 26 (26)27 (27)28 (28)29 (31)30 (30)31 (32)32 (33) 33 (29) Slovak Republic
ItalyTurkey
HungaryGreece
SloveniaPortugal
MexicoSpain
Czech RepublicPoland
BelgiumFrance
IsraelGermany
ChileIcelandAustriaEstonia
NetherlandsDenmark
JapanSwedenNorway
United StatesNew Zealand
IrelandFinland
United KingdomAustralia
SwitzerlandSouth Korea
Canada
Average ranks of countries
Canada tops the list in terms of average ranking in the benchmarks for Qualified labour.

GLOBAL BENCHMARK REPORT 2014 – QUALIFIED LABOUR 47
QUALIFIED LABOUR
A well-educated workforce contributes significantly to a nation's economic value creation through productivity and business innovation. Accordingly, it is very important that business conditions in society support education and R&D, and businesses have access to employees with the required competences. To ensure these conditions, it is necessary to place high priority on education and create an attractive labour market.
Canada tops the Qualified labour pillar with a highly educated population and strong focus on tertiary education. To a major degree, Canadian senior managers also assess that the country's legislation on equal opportunities supports economic growth.
Switzerland and South Korea share second place this year. Switzerland has a high la-bour market participation rate. Swiss workers have high motivation and work satisfac-tion, an attractive business environment for foreign highly skilled labour, and the larg-est number of completed PhDs in science and engineering.
South Korea's rank is mainly due to a low unemployment rate and a number of strong rankings in education including expenditure on educational institutions, basic compe-tences among 15-year-olds, and share of 25 to 34-year-olds with upper secondary and tertiary education.

GLOBAL BENCHMARK REPORT 2014 – QUALIFIED LABOUR48
Per cent
Labour market participation rate for 55 to 64-year-olds, 20123.02OECD
0 10 20 30 40 50 60 70 80 90
RussiaBrazil (2011)India (2010)
China (2010)
TurkeySloveniaHungaryBelgium
PolandGreece
ItalyAustriaFrance
Slovak RepublicCzech Republic
PortugalSpain
IrelandMexico
United KingdomNetherlands
FinlandAustralia
CanadaDenmark
United StatesSouth Korea
ChileEstonia
GermanyIsrael
JapanNorway
SwitzerlandNew Zealand
SwedenIceland
EUROZONE
Per cent
Labour market participation rate, 20123.01OECD
0 10 20 30 40 50 60 70 80 90
India (2010)Brazil (2011)
RussiaChina (2010)
TurkeyHungary
MexicoItaly
ChileSouth Korea
PolandBelgium
GreeceIreland
Slovak RepublicSlovenia
FranceIsrael
Czech RepublicUnited States
JapanPortugalEstonia
SpainFinlandAustria
AustraliaUnited Kingdom
GermanyNew Zealand
CanadaNorway
DenmarkNetherlands
SwedenSwitzerland
Iceland
EUROZONE
The labour market participation rate is the share of the population of working age (between 15 and 64) that is active in the labour market. A high participation rate means that many participate in the labour mar-ket and accordingly contribute to the growth and prosperity of society. This figure, however, should be com-pared with the account of annual working hours that is presented in benchmark 3.04.
Iceland captures the top position yet again in front of Switzerland and Sweden.
Source OECD, Labour Force Statistics 2013 and DI calculations
In many countries, people between 55 and 64 have a lower participation rate than the rest of the population of working age. In light of the demo-graphic challenge that most coun-tries are facing, it is, however, impor-tant to retain the older workers in the labour market as long as possible.
Similar to the general labour market participation rate, Iceland tops the chart of labour market participation for people in the 55-64 age group.
Source OECD, Labour Force Statistics 2013 and DI calculations
Behind the benchmark
Behind the benchmark
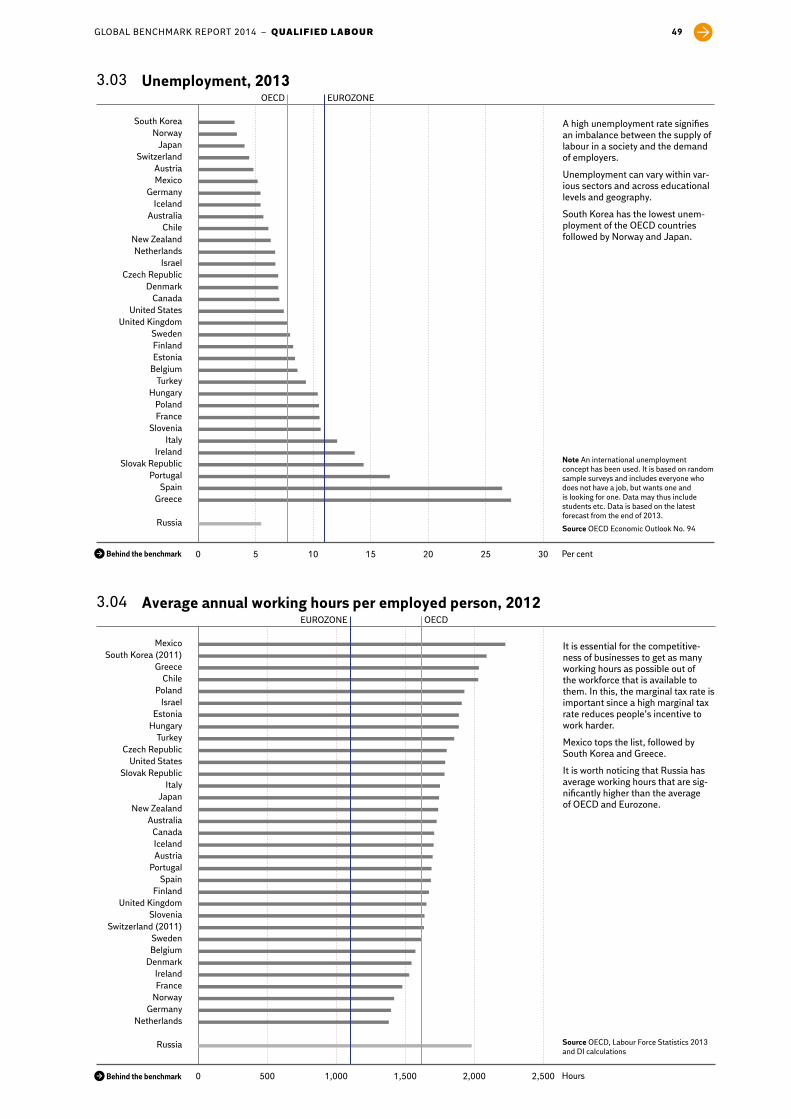
GLOBAL BENCHMARK REPORT 2014 – QUALIFIED LABOUR 49
Hours
Average annual working hours per employed person, 20123.04OECD
0 500 1,000 1,500 2,000 2,500
Russia
NetherlandsGermany
NorwayFranceIreland
DenmarkBelgiumSweden
Switzerland (2011)Slovenia
United KingdomFinland
SpainPortugal
AustriaIcelandCanada
AustraliaNew Zealand
JapanItaly
Slovak RepublicUnited States
Czech RepublicTurkey
HungaryEstonia
IsraelPoland
ChileGreece
South Korea (2011)Mexico
EUROZONE
Per cent
Unemployment, 20133.03OECD
0 5 10 15 20 25 30
Russia
GreeceSpain
PortugalSlovak Republic
IrelandItaly
SloveniaFrancePoland
HungaryTurkey
BelgiumEstoniaFinlandSweden
United KingdomUnited States
CanadaDenmark
Czech RepublicIsrael
NetherlandsNew Zealand
ChileAustralia
IcelandGermany
MexicoAustria
SwitzerlandJapan
NorwaySouth Korea
EUROZONE
A high unemployment rate signifies an imbalance between the supply of labour in a society and the demand of employers.
Unemployment can vary within var-ious sectors and across educational levels and geography.
South Korea has the lowest unem-ployment of the OECD countries followed by Norway and Japan.
Note An international unemployment concept has been used. It is based on random sample surveys and includes everyone who does not have a job, but wants one and is looking for one. Data may thus include students etc. Data is based on the latest forecast from the end of 2013.
Source OECD Economic Outlook No. 94
It is essential for the competitive-ness of businesses to get as many working hours as possible out of the workforce that is available to them. In this, the marginal tax rate is important since a high marginal tax rate reduces people’s incentive to work harder.
Mexico tops the list, followed by South Korea and Greece.
It is worth noticing that Russia has average working hours that are sig-nificantly higher than the average of OECD and Eurozone.
Source OECD, Labour Force Statistics 2013 and DI calculations
Behind the benchmark
Behind the benchmark

GLOBAL BENCHMARK REPORT 2014 – QUALIFIED LABOUR50
Index 0-10
Labour regulations, 20133.06OECD
0 1 2 3 4 5 6 7 8 9 10
BrazilIndia
RussiaChina
SloveniaBelgium
Slovak RepublicItaly
FranceAustralia
SpainFinland
Czech RepublicPortugal
GermanySwedenAustriaMexico
NetherlandsJapan
PolandSouth Korea
NorwayGreeceTurkey
ChileIsrael
New ZealandUnited States
HungaryIreland
United KingdomCanadaEstonia
SwitzerlandDenmark
Iceland
EUROZONE
Per cent
Share of employees with tertiary education in the private sector 20123.05
0 5 10 15 20 25 30 35 40
Italy
Portugal
Slovak Republic
Czech Republic
Austria
Hungary
Greece
Poland
Slovenia
Denmark
Germany
Iceland
Netherlands
Sweden
Norway
France
Estonia
Spain
United Kingdom
Finland
Belgium
Ireland
EUROZONE
The share of highly qualified people in the private sector is an indicator of the extent to which companies utilise labour educated at the country’s universities.
The share of highly qualified workers also reflects to which degree com-panies are based on research, devel-opment and innovation with a view to creating new products that can be sold domestically and abroad. Furthermore, a large proportion of highly educated labour in the private sector can contribute to increasing the country’s productivity.
Ireland tops the list with more than a third of highly qualified people work-ing in the private sector.
Source The Danish Ministry of Business and Growth, Report on Growth and Competitiveness 2013
A low degree of labour market reg-ulation means that businesses can quickly adjust to changing market conditions. This gives flexibility and enhances competitiveness.
Iceland tops the list and Denmark is the runner-up.
In Southern Europe and in several BRIC countries, labour market reg-ulation is considered a major chal-lenge.
Note High values indicate that senior managers assess that the labour market regulations in the country are a barrier to the operation of their business. The indicator tracks labour market regulations in general including regulation of employment, layoffs and minimum wages.
Source IMD World Competitiveness Yearbook 2013 (survey, scale 0-10)
Behind the benchmark
Behind the benchmark

GLOBAL BENCHMARK REPORT 2014 – QUALIFIED LABOUR 51
Index 0-10
Employee motivation, 20133.08OECD
0 1 2 3 4 5 6 7 8 9 10
RussiaIndia
BrazilChina
SpainSlovenia
PolandPortugal
GreeceHungary
ItalyFrance
Slovak RepublicSouth Korea
EstoniaCzech Republic
ChileAustralia
United KingdomBelgium
TurkeyMexico
New ZealandCanada
United StatesIsrael
FinlandNetherlands
IcelandGermany
SwedenNorway
JapanAustriaIreland
SwitzerlandDenmark
EUROZONE
Per cent of employees with less than one year's employment in the same job
Job mobility, 20123.07OECD
0 5 10 15 20 25 30 35 40
Brazil (2009
GreeceSlovak Republic
ItalyCzech Republic
PortugalSlovenia
PolandBelgium
IrelandHungary
GermanyFrance
SpainNetherlands
United KingdomAustria
SwitzerlandNorwayEstoniaFinlandCanadaSweden
DenmarkIcelandMexico
AustraliaTurkey
South KoreaChile
EUROZONE
Motivation and work satisfaction contribute to increasing produc-tivity, reducing sickness absen-teeism and, generally, creating dedicated employees. A good occu-pational environment with exciting and challenging tasks can also help to attract employees with highly sought-after qualifications.
For a couple of years, Switzerland and Denmark have taken turns topping the benchmark. They have exchanged places again this year with Denmark taking the lead.
Note High values indicate that senior managers in the country find the motiva-tion among the employees of the company to be high.
Source IMD World Competitiveness Yearbook 2013 (survey, scale 0-10)
Job mobility is vital for growth in society since a flexible and mobile labour market encourages work-ers to move according to the need for labour. High job mobility is an expression of a dynamic labour mar-ket that can solve the challenges of a constantly changing labour market.
Some of the job mobility can be referred to the continuous creation of new jobs and closing down of oth-ers. Job mobility helps to promote productivity since less productive jobs are closed down during such a process. High job mobility improves the chances of people, who lose their job, to be quickly employed by another company in need of labour.
Chile is the OECD country with the highest job mobility.
Source OECD.Stat and DI calculations
Behind the benchmark
Behind the benchmark
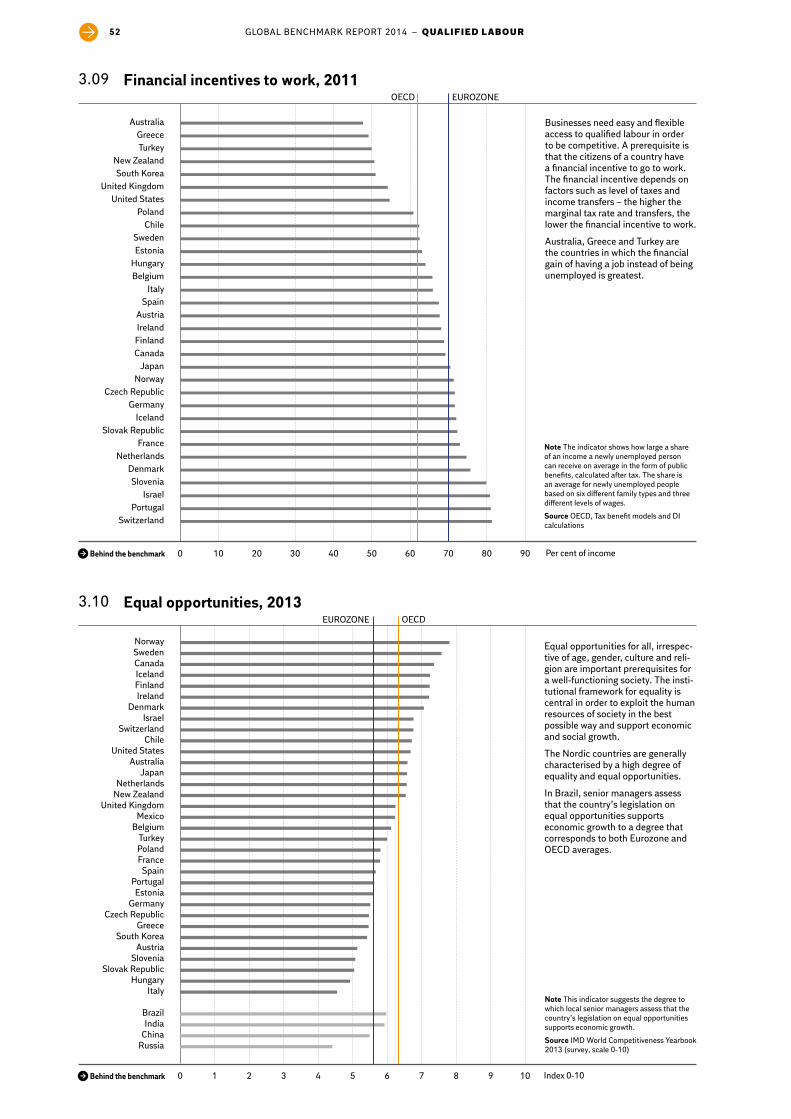
GLOBAL BENCHMARK REPORT 2014 – QUALIFIED LABOUR52
Index 0-10
Equal opportunities, 20133.10OECD
0 1 2 3 4 5 6 7 8 9 10
RussiaChinaIndia
Brazil
ItalyHungary
Slovak RepublicSlovenia
AustriaSouth Korea
GreeceCzech Republic
GermanyEstonia
PortugalSpain
FrancePolandTurkey
BelgiumMexico
United KingdomNew ZealandNetherlands
JapanAustralia
United StatesChile
SwitzerlandIsrael
DenmarkIrelandFinlandIcelandCanadaSwedenNorway
EUROZONE
Per cent of income
Financial incentives to work, 20113.09OECD
0 10 20 30 40 50 60 70 80 90
SwitzerlandPortugal
IsraelSlovenia
DenmarkNetherlands
FranceSlovak Republic
IcelandGermany
Czech RepublicNorway
JapanCanadaFinlandIrelandAustria
SpainItaly
BelgiumHungaryEstoniaSweden
ChilePoland
United StatesUnited Kingdom
South KoreaNew Zealand
TurkeyGreece
Australia
EUROZONE
Businesses need easy and flexible access to qualified labour in order to be competitive. A prerequisite is that the citizens of a country have a financial incentive to go to work. The financial incentive depends on factors such as level of taxes and income transfers – the higher the marginal tax rate and transfers, the lower the financial incentive to work.
Australia, Greece and Turkey are the countries in which the financial gain of having a job instead of being unemployed is greatest.
Note The indicator shows how large a share of an income a newly unemployed person can receive on average in the form of public benefits, calculated after tax. The share is an average for newly unemployed people based on six different family types and three different levels of wages.
Source OECD, Tax benefit models and DI calculations
Equal opportunities for all, irrespec-tive of age, gender, culture and reli-gion are important prerequisites for a well-functioning society. The insti-tutional framework for equality is central in order to exploit the human resources of society in the best possible way and support economic and social growth.
The Nordic countries are generally characterised by a high degree of equality and equal opportunities.
In Brazil, senior managers assess that the country’s legislation on equal opportunities supports economic growth to a degree that corresponds to both Eurozone and OECD averages.
Note This indicator suggests the degree to which local senior managers assess that the country’s legislation on equal opportunities supports economic growth.
Source IMD World Competitiveness Yearbook 2013 (survey, scale 0-10)
Behind the benchmark
Behind the benchmark
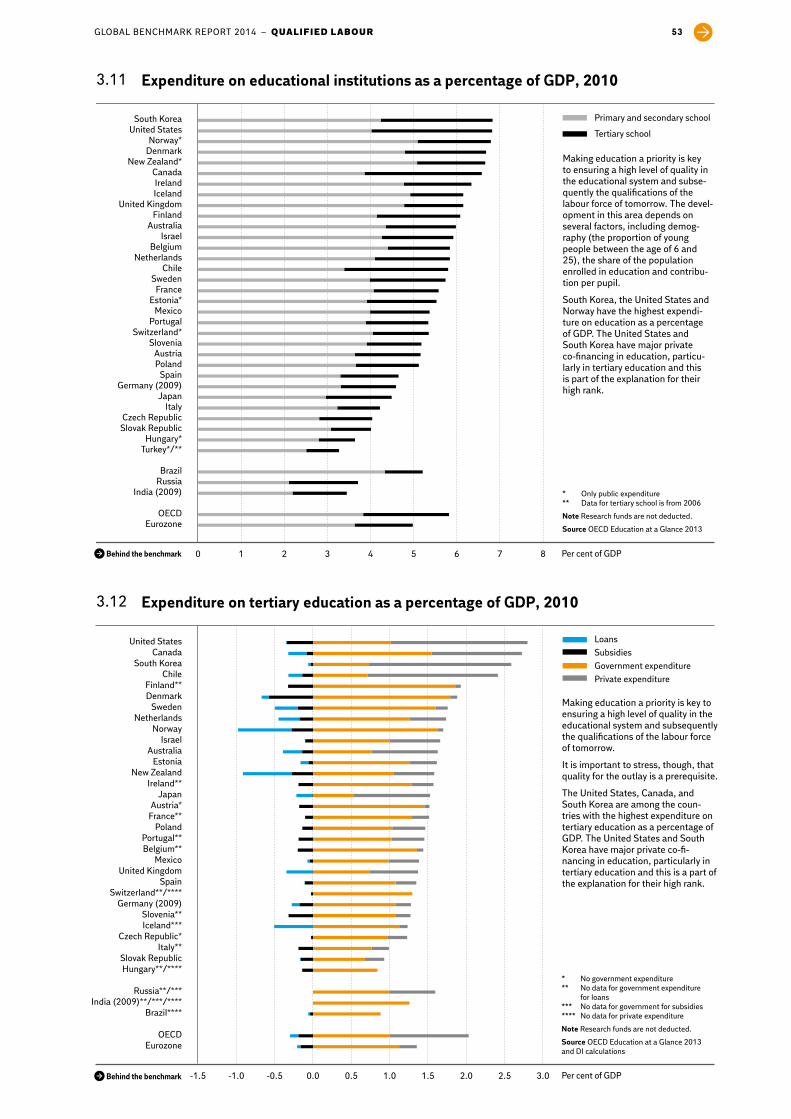
GLOBAL BENCHMARK REPORT 2014 – QUALIFIED LABOUR 53
Per cent of GDP
Expenditure on tertiary education as a percentage of GDP, 20103.12
LoansSubsidiesGovernment expenditurePrivate expenditure
-1.5 -1.0 -0.5 0.0 0.5 1.0 1.5 2.0 2.5 3.0
EurozoneOECD
Brazil****India (2009)**/***/****
Russia**/***
Hungary**/****Slovak Republic
Italy**Czech Republic*
Iceland***Slovenia**
Germany (2009)Switzerland**/****
SpainUnited Kingdom
MexicoBelgium**Portugal**
PolandFrance**Austria*
JapanIreland**
New ZealandEstonia
AustraliaIsrael
NorwayNetherlands
SwedenDenmarkFinland**
ChileSouth Korea
CanadaUnited States
Per cent of GDP
Expenditure on educational institutions as a percentage of GDP, 20103.11
Primary and secondary school
Tertiary school
0 1 2 3 4 5 6 7 8
EurozoneOECD
India (2009)RussiaBrazil
Turkey*/**Hungary*
Slovak RepublicCzech Republic
ItalyJapan
Germany (2009)Spain
PolandAustria
SloveniaSwitzerland*
PortugalMexico
Estonia*France
SwedenChile
NetherlandsBelgium
IsraelAustralia
FinlandUnited Kingdom
IcelandIreland
CanadaNew Zealand*
DenmarkNorway*
United StatesSouth Korea
Making education a priority is key to ensuring a high level of quality in the educational system and subse-quently the qualifications of the labour force of tomorrow. The devel-opment in this area depends on several factors, including demog-raphy (the proportion of young people between the age of 6 and 25), the share of the population enrolled in education and contribu-tion per pupil.
South Korea, the United States and Norway have the highest expendi-ture on education as a percentage of GDP. The United States and South Korea have major private co-financing in education, particu-larly in tertiary education and this is part of the explanation for their high rank.
Making education a priority is key to ensuring a high level of quality in the educational system and subsequently the qualifications of the labour force of tomorrow.
It is important to stress, though, that quality for the outlay is a prerequisite.
The United States, Canada, and South Korea are among the coun-tries with the highest expenditure on tertiary education as a percentage of GDP. The United States and South Korea have major private co-fi-nancing in education, particularly in tertiary education and this is a part of the explanation for their high rank.
* Only public expenditure ** Data for tertiary school is from 2006
Note Research funds are not deducted.
Source OECD Education at a Glance 2013
* No government expenditure** No data for government expenditure for loans *** No data for government for subsidies**** No data for private expenditure
Note Research funds are not deducted.
Source OECD Education at a Glance 2013 and DI calculations
Behind the benchmark
Behind the benchmark

GLOBAL BENCHMARK REPORT 2014 – QUALIFIED LABOUR54
PISA score
OECD Pisa study, Reading skills, 20123.14OECD
350 400 450 500 550 600
BrazilRussia
China (Shanghai)
MexicoChile
Slovak RepublicTurkeyGreece
SloveniaIceland
SwedenIsrael
PortugalSpain
HungaryAustria
ItalyCzech Republic
DenmarkUnited States
United KingdomNorwayFrance
GermanySwitzerland
BelgiumNetherlands
AustraliaNew Zealand
EstoniaPoland
CanadaIrelandFinland
South KoreaJapan
EUROZONE
Hours
Intended instruction time in public institutions per year for 7 to 14-year-olds (average), 2011
3.13OECD
400 500 600 700 800 900 1,000 1,100
Russia
EstoniaFinlandPoland
South KoreaCzech Republic
SloveniaSweden
HungaryGreece
NorwayGermany
Slovak RepublicJapan
DenmarkAustriaTurkey
IcelandBelgium
IrelandCanada
PortugalMexico
ItalySpain
NetherlandsIsrael
FranceAustralia
Chile
EUROZONE
Primary schooling is an important contributor in providing pupils with basic competences needed for their continuing education, such as read-ing and mathematical skills. The planned instruction time for pupils in the 7-14 age group is an indicator of the level of education in the coun-try, and of the degree to which fund-ing for education is spent on instruc-tion time. A high level of instruction time helps to increase the level of competence.
Chile tops the chart with most instruction time for this age group. The country has gone through a comprehensive reform of its school system with all-day school having replaced half-day school.
Note Average of planned annual lessons for 7 to 14-year-olds.
Source OECD Education at a Glance 2013 and DI calculations
Every three years, the OECD’s Pro-gramme for International Student Assessment (PISA) assesses the qualifications of 15-year-olds in reading, mathematics and science. Mastering these basic competences is important in order to continue in the educational system.
This benchmark shows the result for reading skills.
The Japanese teenagers have achieved the highest score followed by South Korea and Finland. China’s Shanghai region impresses by passing all OECD countries in reading skills.
Source OECD PISA 2012
Behind the benchmark
Behind the benchmark

GLOBAL BENCHMARK REPORT 2014 – QUALIFIED LABOUR 55
PISA score
OECD Pisa study, Scientific qualifications, 20123.16
350 400 450 500 550 600
BrazilRussia
China (Shanghai)
MexicoChile
TurkeyGreece
IsraelSlovak Republic
IcelandSwedenPortugal
ItalyHungaryNorway
SpainUnited States
DenmarkFrance
BelgiumAustria
Czech RepublicUnited Kingdom
SloveniaSwitzerland
New ZealandAustralia
IrelandNetherlands
GermanyCanadaPoland
South KoreaEstoniaFinland
Japan
OECD EUROZONE
PISA score
OECD Pisa study, Mathematical qualifications, 20123.15
350 400 450 500 550 600 650
BrazilRussia
China (Shanghai)
MexicoChile
TurkeyGreece
IsraelHungarySweden
United StatesSlovak Republic
SpainItaly
PortugalNorwayIceland
United KingdomFrance
Czech RepublicNew Zealand
DenmarkSlovenia
IrelandAustralia
AustriaGermanyBelgium
PolandCanadaFinlandEstonia
NetherlandsSwitzerland
JapanSouth Korea
OECD EUROZONE
Every three years, the OECD’s Pro-gramme for International Student Assessment (PISA) assesses the qualifications of 15-year-olds in reading, mathematics and science. Mastering these basic competences is important in order to continue in the educational system.
This benchmark shows the result for mathematical qualifications.
In this benchmark, the South Korean teenagers have achieved the highest score followed by Japan and Switzerland. South Korea is known for its high priority on education.
China’s Shanghai region also impresses in mathematics by pass-ing all OECD countries.
SourceOECD PISA 2012
Every three years, the OECD’s Pro-gramme for International Student Assessment (PISA) assesses the qualifications of 15-year-olds in reading, mathematics and science. Mastering these basic competences is important in order to continue in the educational system.
This benchmark shows the result for scientific qualifications.
Japan takes the top position, ahead of Finland and Estonia. Once again, the young people from China’s Shanghai region pass all OECD countries.
SourceOECD PISA 2012
Behind the benchmark
Behind the benchmark

GLOBAL BENCHMARK REPORT 2014 – QUALIFIED LABOUR56
Per cent
Share of 25 to 34-year-olds with tertiary education*, 20113.18
0 10 20 30 40 50 60 70
China (2010)Brazil
Russia
TurkeyItaly
AustriaMexico
Czech RepublicSlovak Republic
PortugalGermanyHungary
GreeceSlovenia
DenmarkEstonia
SpainPolandIcelandFinland
NetherlandsSwitzerland
ChileBelgiumSweden
FranceUnited States
AustraliaIsrael
New ZealandNorway
United KingdomIreland
CanadaJapan
South Korea
OECDEUROZONE
Per cent
Share of 25 to 34-year-olds with upper secondary education, 20113.17
0 20 40 60 80 100
BrazilRussia
TurkeyMexico
PortugalSpain
ItalyIcelandGreece
DenmarkNew ZealandNetherlands
BelgiumFrance
NorwayUnited Kingdom
AustraliaIrelandEstonia
GermanyHungary
ChileAustria
United StatesSwitzerland
IsraelFinlandSwedenCanada
SloveniaPoland
Slovak RepublicCzech Republic
South Korea
OECDEUROZONE
A high level of education is a prereq-uisite for competitiveness in a globalised world. This is why it is important that, as a minimum, a very large proportion of the popula-tion have upper secondary educa-tion.
South Korea wins first place. Nearly 98 per cent of the population have completed upper secondary educa-tion.
Note It is difficult to compare across countries for this benchmark. The OECD partially uses random sampling, and therefore the ranking is not comparable with last year’s chart.
Source OECD Education at a Glance 2013
Since education plays a still more important role in the globalised world, a well-educated workforce is crucial for a country’s ability to compete in the global marketplace.
For the fourth consecutive year, South Korea wins this category ahead of Japan and thus underlines its strong position in education.
* Tertiary education includes long-cycle, medium-cycle and short-cycle higher education.
Note It is difficult to compare across countries for this benchmark. The OECD partially uses random sampling, and therefore the ranking is not comparable with last year’s chart.
Source OECD Education at a Glance 2013
Behind the benchmark
Behind the benchmark

GLOBAL BENCHMARK REPORT 2014 – QUALIFIED LABOUR 57
Per cent
Share of graduates by subject, 20113.20
Engineering, manufacturing and constructionLife sciences, physical sciences, math/statistics and computingHealth and WelfareSocial sciences, business, law and servicesHumanities, art and educationNot known/unspecified
0 10 20 30 40 50 60 70 80 90 100
OECDEurozone
BrazilRussia
NetherlandsUnited States
Iceland (2010)NorwayPoland
AustraliaChile
New ZealandIsrael
HungaryTurkey
DenmarkCanada
Slovak RepublicIreland
SwitzerlandItaly
BelgiumUnited Kingdom
SloveniaSwedenPortugal
Czech RepublicMexicoJapanSpain
EstoniaAustria
France (2009)FinlandGreece
GermanySouth Korea
Percentage of students who are 25 or younger at completion of tertiary education
Age by completion of tertiary education, 20113.19
0 10 20 30 40 50 60 70 80 90
Sweden
Finland
Switzerland
Germany
Austria
Denmark
Slovenia
Norway
Italy
Poland
Portugal
Czech Republic
Hungary
Spain
United Kingdom
Slovak Republic
Estonia
Turkey
Netherlands
Belgium
EUROZONE
Fast completion of tertiary educa-tion helps to ensure a large work-force, high tax income and low government expenditure. This is particularly important at a time when the workforce in many European countries will be dimin-ishing in coming years due to an ageing population.
Belgium, the Netherlands and Turkey continue to top the list as the countries in which most young people have completed tertiary education when they are 25 years old.
Note Includes first completed tertiary education (including bachelor degrees) but excludes certain short-cycle educational programmes.
Source Danish Ministry of Business and Growth, Report on growth and competitive-ness 2013
In the context of shrinking national budgets and economic downturn, it is important that countries invest in the fields of education that are needed in the labour market. As a consequence of the increasing demand for labour with educa-tion in science and engineering, a large share of graduates with a background in these subjects is crucial for a country’s international competitiveness. Access to compe-tent science graduates is central for companies choosing to establish in a globalised world.
South Korea has the largest share of scientific and engineering graduates followed by Germany and Greece. Graduates with these competences are particularly attractive to many companies.
Note Data includes medium-cycle and long-cycle higher education.
SourceOECD.Stat and DI calculations
Behind the benchmark
Behind the benchmark

GLOBAL BENCHMARK REPORT 2014 – QUALIFIED LABOUR58
Per cent of all students
Share of foreign students at tertiary education institutions, 20113.22OECD
0 5 10 15 20 25 30
BrazilChina
Russia
TurkeyChileIsrael
PolandSouth Korea
SloveniaItaly
EstoniaJapan
Slovak RepublicHungary
GreeceFinland
SpainPortugal
IcelandNorway
NetherlandsCzech Republic
GermanySwedenBelgium
DenmarkIrelandFrance
CanadaAustria
United KingdomAustralia
SwitzerlandNew Zealand
EUROZONE
USD (net present value)
Personal gain on further education, 20093.21OECD
0 50,000 100,000 150,000 200,000 250,000 300,000
New Zealand
Denmark
Sweden
Greece
Norway
Germany
Belgium
Italy (2008)
Estonia
Netherlands (2008)
Japan (2007)
Finland
Israel
Australia
France
Spain
Canada
South Korea
Austria
Hungary
United Kingdom
Portugal
Slovak Republic
Poland (2008)
Slovenia
Czech Republic
Ireland
United States
EUROZONE
The personal gain in completing higher education in the form of higher income plays a major role in convincing young people to take further education.
The United States is in the forefront followed by Ireland and the Czech Republic.
Note Average personal net present value for men and women completing tertiary educa-tion.
SourceOECD Education at a Glance 2013 and DI calculations
The share of foreign students in tertiary education is an expression of the degree to which universities take part in international knowl-edge-sharing and have the ability to attract students from other coun-tries.
In general, it is easier for English-speaking countries to attract inter-national students. New Zealand, Australia and the United Kingdom are among the leading four in this benchmark. New Zealand and Australia have massively targeted education as a source of income.
This year Switzerland comes in second. The country has one of the highest percentages of interna-tional faculty staff per capita in the world, partly due to the fact that 40 per cent of the country’s PhD candi-dates, who count as faculty, are non-Swiss.
Source OECD Education at a Glance 2013
Behind the benchmark
Behind the benchmark

GLOBAL BENCHMARK REPORT 2014 – QUALIFIED LABOUR 59
Completed PhDs in 2011 in science and engineering per 1,000 inhabitants in the age between 25 and 34
Completed PhDs in science and engineering, 20113.24
0.0 0.2 0.4 0.6 0.8 1.0 1.2 1.4 1.6
Turkey
Hungary
Poland (2009)
Japan
Greece
Iceland (2010)
Portugal
United States
Estonia
Spain
Italy
Netherlands
Belgium
Slovenia
Czech Republic
Norway
Sweden
Austria
Finland
Ireland
Denmark
France (2010)
United Kingdom
Germany
Switzerland
EUROZONEOECD
Index 0-10
Attractive business environment for foreign highly skilled people, 20133.23OECD
0 1 2 3 4 5 6 7 8 9 10
RussiaIndia
ChinaBrazil
SloveniaGreeceIceland
ItalySlovak Republic
HungaryPortugal
JapanSpain
FinlandEstonia
IsraelFrance
Czech RepublicDenmark
South KoreaTurkey
SwedenBelgium
GermanyMexicoPoland
New ZealandAustria
ChileNorwayIreland
NetherlandsCanada
United KingdomAustralia
United StatesSwitzerland
EUROZONE
In step with the tendency in many countries that more elderly people retire from the labour market than there are young people to enter it, the financing of public expenditure becomes an increasing challenge.
In order to cope with this challenge, the ability to attract and retain non-national labour becomes an important factor. With their unique knowledge, highly skilled non-na-tionals contribute to increasing productivity in businesses, enhanced competitiveness and increased growth.
Once again, Switzerland wins the category as the country that seems most attractive to highly quali-fied foreign labour, followed by the United States and Australia.
Note Low values indicate that the country’s senior managers find the business environ-ment for non-national professionals poor.
Source IMD World Competitiveness Yearbook 2013 (survey, scale 0-10)
Education of competent researchers is an essential competitive param-eter in order to attract and retain private investment in R&D. It also strengthens the competitiveness of businesses generally and is a precon-dition for strong public research. In particular, this applies to researchers in science and engineering.
Switzerland has yet again taken the top spot with a significant lead over the rest of the OECD countries.
SourceEurostat and DI calculations
Behind the benchmark
Behind the benchmark
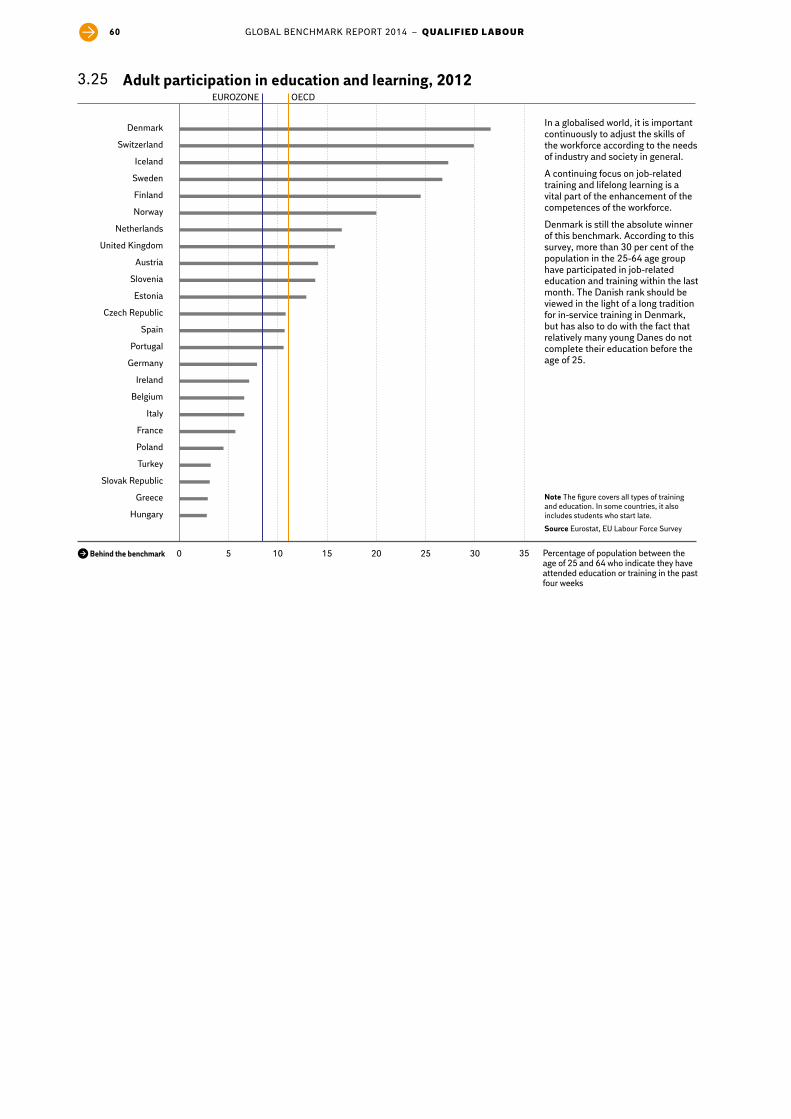
GLOBAL BENCHMARK REPORT 2014 – QUALIFIED LABOUR60
Percentage of population between the age of 25 and 64 who indicate they have attended education or training in the past four weeks
Adult participation in education and learning, 20123.25OECD
0 5 10 15 20 25 30 35
Hungary
Greece
Slovak Republic
Turkey
Poland
France
Italy
Belgium
Ireland
Germany
Portugal
Spain
Czech Republic
Estonia
Slovenia
Austria
United Kingdom
Netherlands
Norway
Finland
Sweden
Iceland
Switzerland
Denmark
EUROZONE
In a globalised world, it is important continuously to adjust the skills of the workforce according to the needs of industry and society in general.
A continuing focus on job-related training and lifelong learning is a vital part of the enhancement of the competences of the workforce.
Denmark is still the absolute winner of this benchmark. According to this survey, more than 30 per cent of the population in the 25-64 age group have participated in job-related education and training within the last month. The Danish rank should be viewed in the light of a long tradition for in-service training in Denmark, but has also to do with the fact that relatively many young Danes do not complete their education before the age of 25.
Note The figure covers all types of training and education. In some countries, it also includes students who start late.
SourceEurostat, EU Labour Force Survey
Behind the benchmark

GLOBAL BENCHMARK REPORT 2014 – QUALIFIED LABOUR 61

GLOBAL BENCHMARK REPORT 2014 – PUBLIC ECONOMY62
The average ranks of countries in thePublic economy pillar
Public economy4.00
0 5 10 15 20 25 30
BelgiumGreece
SpainPortugal
ItalyJapan
MexicoIrelandFrance
United KingdomTurkey
United StatesIsrael
SloveniaHungary
AustriaNetherlands
CanadaPolandIceland
GermanyCzech RepublicSlovak Republic
DenmarkAustraliaSweden
New ZealandNorway
ChileFinlandEstonia
South KoreaSwitzerland
Average ranks of countries
1 (1) 2 (2) 3 (3) 4 (6) 5 (7) 6 (4) 7 (9) 8 (8)9 (5) 10 (10) 11 (11) 12 (12) 13 (13) 14 (14) 15 (16) 16 (18) 17 (19) 18 (15) 19 (20) 20 (17) 21 (23) 22 (22) 23 (21) 24 (24)25 (28) 25 (32) 27 (27) 28 (26) 29 (29) 30 (24) 31 (30) 32 (31) 33 (33)
Switzerland is most successful in terms of average ranking in the benchmarks for Public economy.

GLOBAL BENCHMARK REPORT 2014 – PUBLIC ECONOMY 63
PUBLIC ECONOMY
Among other lessons, the financial crisis and the following European debt crisis have taught the world how important it is to monitor the health of a country's public sector. A country's economic robustness is dependent not only on a strong and prosperous private sector but also on an efficient and balanced public sector. Among other factors, the fourth pillar assesses budget balance, public debt, public expenditure, and corruption levels.
Switzerland excels as the OECD country with the best average ranking in Public econ-omy. The country has the lowest public expenditure as a share of GDP. Additionally, Switzerland is one of few OECD countries with a structural surplus on its public budg-ets and the Swiss public sector is among the smallest in the OECD.
South Korea ranks second with the largest structural surplus on its public budgets. Furthermore, South Korea places the highest priority on investing government funds in areas most likely to generate future growth, such as education and R&D.
Estonia is in third place. The country has the lowest public gross debt as a percentage of GDP as well as frequent use of the Internet for communication between the public and private sectors.

GLOBAL BENCHMARK REPORT 2014 – PUBLIC ECONOMY64
Per cent of GDP
Public primary expenditure as a percentage of GDP, 20114.02OECD
0 10 20 30 40 50 60 70
Russia (2008)
Denmark
Finland
France
Sweden
Belgium
Slovenia
Austria
Netherlands
Hungary
Portugal
Italy
United Kingdom
Greece
Ireland
Spain
Norway
Germany
Iceland
Czech Republic
Poland
Japan
Israel
Estonia
Slovak Republic
Turkey
Switzerland
South Korea
EUROZONE
Per cent of GDP
Public spending as a percentage of GDP, 20124.01OECD
0 5 10 15 20 25 30
RussiaChina
DenmarkNetherlands
SwedenIcelandFinland
BelgiumFrance
IsraelUnited Kingdom
CanadaNorway
SloveniaCzech Republic
JapanHungary
SpainItaly
New ZealandGermany
EstoniaAustria
AustraliaPortugal
IrelandPolandGreece
Slovak RepublicSouth Korea
United StatesTurkey
ChileMexico
Switzerland
EUROZONE
Public spending covers a range of different services, which are central in supporting the business commu-nity, for example childcare, educa-tion and research. But the public sector is financed by taxes that decrease wealth in society, and at the same time the public and private sectors are competing for the same workers.
Switzerland, Mexico and Chile have the lowest public spending as a percentage of GDP.
There is some uncertainty linked to comparability across countries.
Source OECD.Stat
Public primary expenditure is expenditure excluding interest payment on public debt and is therefore an indication of the size of the public sector. Since the public sector is financed by taxes that reduce the prosperity of society, there is an upper limit for the size of the public sector if the country wishes to be a dynamic business community.
South Korea, Switzerland and Turkey have the lowest public primary expenditure among the OECD countries (measured as a percentage of GDP).
There is some uncertainty linked to comparability across countries. This uncertainty is mainly due to differences in the degree to which social transfers are disbursed in net or gross values – i.e. whether they are taxed or not.
Source OECD.Stat and DI calculations
Behind the benchmark
Behind the benchmark

GLOBAL BENCHMARK REPORT 2014 – PUBLIC ECONOMY 65
Per cent of GDP
Public gross debt as a percentage of GDP, 20134.04OECD
0 40 80 120 160 200 240
JapanGreece
ItalyPortugal
IrelandIcelandFrance
United KingdomBelgium
United StatesSpain
CanadaHungary
AustriaNetherlands
GermanySlovenia
IsraelFinlandPoland
Slovak RepublicDenmark
Czech RepublicSweden
SwitzerlandNew ZealandSouth Korea
AustraliaNorwayEstonia
EUROZONE
Per cent of GDP
Structural budget balance, 20134.03OECD
-10 -8 -6 -4 -2 0 2
India*Brazil*China*
Russia*
JapanUnited Kingdom
United StatesPolandIreland
SpainCanadaFrance
AustraliaPortugalHungaryBelgiumIceland
Czech RepublicNetherlands
AustriaFinland
New ZealandNorway
DenmarkSweden
GermanySwitzerland
ItalyGreece
South Korea
EUROZONE
Public deficits and public borrowing affect the growth potential of busi-nesses, including demand and access to financing. Furthermore, public deficits contribute to creating uncertainty regarding the future, and this often has negative conse-quences for the investment level of businesses.
South Korea, Greece, Italy, Switzerland and Germany were the only OECD countries with structural surpluses on their public budgets in 2013.
* Data from IMF.
Note The structural budget balance shows the public budget balance adjusted for the cyclical situation and special temporary factors (such as temporary high/low public income from stock or non-recurring income/expenses).
SourceOECD Economic Outlook No. 94 and IMF World Economic Outlook October 2013
The size of the public debt is signif-icant for the government’s freedom of economic action. A country with high debt is burdened with signifi-cant interest payments. Public gross debt primarily covers the liabilities of the public sector.
Estonia, Norway and Australia had the lowest public gross debt in 2013.
Note Public financial gross debt.
Source OECD Economic Outlook No. 94
Behind the benchmark
Behind the benchmark

GLOBAL BENCHMARK REPORT 2014 – PUBLIC ECONOMY66
Per cent
Growth expenditures as percentage of primary expenses, 20114.06
0 5 10 15 20 25 30 35 40
Eurozone
OECD
Italy
Austria
Germany
Ireland
Belgium
Hungary
France
Israel
Finland
Japan
Denmark
Portugal
Spain
Czech Republic
Netherlands
Sweden
Slovenia
Iceland
Norway
Switzerland
Poland
South KoreaEducation and state education grantsInvestmentResearch and development
Per cent of GDP
Public net debt as a percentage of GDP, 20134.05OECD
-200 -160 -120 -80 -40 0 40 80 120 160 200
Japan
Greece
Italy
Portugal
Ireland
Belgium
United States
United Kingdom
France
Spain
Hungary
Iceland
Austria
Germany
Netherlands
Canada
Poland
Slovak Republic
Slovenia
Czech Republic
Australia
Denmark
New Zealand
Switzerland
Sweden
Estonia
South Korea
Finland
Norway
EUROZONE
Public net debt comprises all finan-cial assets and liabilities in the public sector. The size of public debt is a determining factor in a state’s ability to act economically. A country with high debt is burdened with sizeable interest payments.
Norway has comprehensive public net wealth and yet again takes a clear top position in the benchmark for net debt.
Note Public financial net debt.
SourceOECD Economic Outlook No. 94
It may support the growth of the private sector if the government prioritises its expenditure so that a larger share of it goes to areas that represent a genuine investment in the future.
Expenditure for education, R&D and public investment, in particular, can be viewed as supporting growth.
South Korea, Poland and Switzerland take the top three ranks in terms of the share of primary public expenditure that supports growth.
Note This benchmark is combined of 2.02 (Public sector investment as a percentage of GDP), 2.06 (Public expenditure on research and development as a percentage of GDP), 3.11 (Expenditure on education as a percentage of GDP) including state education grants and 4.02 (Public primary expenditure as a percentage of GDP)
Source OECD.stat and DI calculations
Behind the benchmark
Behind the benchmark

GLOBAL BENCHMARK REPORT 2014 – PUBLIC ECONOMY 67
Government purchases of goods and services as percentage of total government expenditure
Government purchase of goods and services*, 20124.08
0 10 20 30 40 50 60
Belgium
Greece
France
Portugal
Ireland
Norway
Austria
Spain
Italy
Slovenia
Denmark
Poland
Switzerland
Slovak Republic
Sweden
Germany
Estonia
Czech Republic
Hungary
Netherlands
Iceland
Finland
United Kingdom
EUROZONE OECD
Share of GDP (per mille)
Government-funded research, development and demonstration in energy technologies, 20124.07OECD
0.0 0.2 0.4 0.6 0.8 1.0 1.2 1.4
Turkey (2009)
Greece (2011)
New Zealand
Ireland (2011)
United Kingdom
Spain (2010)
Czech Republic (2010)
Portugal
Italy (2011)
Netherlands (2011)
Germany
Slovak Republic
Australia
Sweden
Switzerland
Austria (2011)
United States (2011)
South Korea (2011)
Denmark
France (2011)
Norway
Japan (2011)
Canada
Hungary
Finland (2011)
EUROZONE
To a certain extent, government purchases of goods and services can be seen as an indicator of public use of private suppliers. In addition to purchases of IT equipment, means of transport, furniture etc. the public sector also buys a long list of services from private businesses.
The public sector’s use of private suppliers helps to ensure that the assignments are carried out in the most efficient way. At the same time, government use of private suppliers supports the development of the private service sector.
The three top ranks are taken by the United Kingdom, Finland and Iceland.
* Public spending does not necessarily cover the same activities in all countries. The indi-cator also includes public purchases of goods and services from other public institutions.
SourceEurostat and DI calculations
Demand for modern energy tech-nology is increasing across the globe. Public investment in the development of energy technology is a precondition for realising the market potential.
Finland and Hungary are the coun-tries to undertake most public investment in this area. Both coun-tries actively support research, development and demonstration in energy efficiency and renewa-ble energy. Finland also spends a smaller part of the funding on nuclear power.
Source IEA, OECD.Stat, energiforskning.dk and DI calculations
Behind the benchmark
Behind the benchmark

GLOBAL BENCHMARK REPORT 2014 – PUBLIC ECONOMY68
Index 0-10
Bribery and corruption, 20134.10
0 1 2 3 4 5 6 7 8
RussiaIndia
ChinaBrazil
MexicoGreece
ItalySlovak RepublicCzech Republic
TurkeyHungary
South KoreaSlovenia
SpainPoland
IsraelPortugalEstoniaAustriaFrance
ChileIreland
United StatesJapan
BelgiumUnited Kingdom
IcelandGermany
CanadaAustralia
NetherlandsSwitzerland
NorwaySwedenFinland
New ZealandDenmark
OECD EUROZONE
Percentage of enterprises that use the Internet for interaction with public authorities
E-government usage by enterprises, 20134.09
0 10 20 30 40 50 60 70 80 90 100
Turkey
Spain
Germany
Hungary
Greece
Italy
Belgium
Poland
Netherlands
United Kingdom
Slovak Republic
Portugal
Austria
Slovenia
Norway
Czech Republic
Sweden
Ireland
Estonia
Denmark
France
Iceland
Finland
EUROZONE OECD
Bribery and corruption prevent the growth and development of compa-nies and create insecurity regarding their business opportunities.
Scoring the lowest level of bribery and corruption, Denmark and New Zealand share first place. Generally, the bottom places have not changed significantly for several years. This confirms the notion that the fight against corruption is a lengthy process that requires changes of both the institutional framework and the mentality of the population.
Corruption and bribery are wide-spread in many growth markets including the BRIC countries.
Note High values indicate that bribery and corruption are widespread.
SourceTransparency International, Corruption Perceptions Index 2013
Usage of the Internet for commu-nication and reporting between the public and private sectors leads to considerable resource savings for both parties. In a competitive soci-ety, it is important that government e-services are available and user friendly, and that they are used by businesses.
Companies in Finland are the most frequent users of e-government.
Source Eurostat
Behind the benchmark
Behind the benchmark

GLOBAL BENCHMARK REPORT 2014 – PUBLIC ECONOMY 69

GLOBAL BENCHMARK REPORT 2014 – COSTS70
The average ranks of countries in the Costs pillar
Costs5.00
0 5 10 15 20 25
ItalyFinlandNorway
DenmarkBelgium
New ZealandAustria
NetherlandsIcelandFrance
AustraliaHungary
GermanyMexico
United KingdomSlovenia
GreeceSweden
IsraelEstonia
PortugalTurkey
South KoreaSpainJapan
United StatesCzech Republic
CanadaSlovak Republic
IrelandPoland
ChileSwitzerland
Average ranks of countries
1 (1) 2 (2) 3 (13) 4 (4) 5 (3) 6 (5) 7 (7) 8 (9) 9 (10) 10 (6) 11 (8) 12 (11) 13 (15) 14 (26) 15 (16) 16 (21) 17 (12) 18 (20) 18 (19) 20 (28) 21 (14) 22 (24) 23 (22) 23 (24) 25 (22) 26 (16) 27 (18) 28 (29) 29 (31) 30 (32) 31 (27) 32 (30) 32 (33)
Switzerland tops the list of average ranking in the benchmarks for Costs.

GLOBAL BENCHMARK REPORT 2014 – COSTS 71
COSTS
The competitiveness of businesses in a global economy depends on whether productivity and the quality of the product offset the costs of production. Production costs and taxes are therefore important indicators of competi-tiveness. Maintaining a competitive cost level includes competitive income and corporate tax levels, competitive labour costs and fair access to capital markets.
In spite of high labour costs, Switzerland is the most competitive country in terms of costs. This rank is earned as a result of low marginal tax rates, particularly for medi-um wage earners, and low inflation. Furthermore, Swiss businesses have easy access to capital markets, which minimises financial costs and helps to stimulate economic growth.
Chile holds second place in Costs primarily due to a low tax burden.
Poland is number three. The country is favoured by a highly competitive nominal cor-porate tax rate, easy access to capital markets and the lowest hourly compensation costs in manufacturing.

GLOBAL BENCHMARK REPORT 2014 – COSTS72
Per cent
Marginal tax rate for medium wage earners*, including indirect taxes, 20125.02
0 10 20 30 40 50 60 70 80
EurozoneOECD
BelgiumAustria
GermanyFrance
FinlandHungaryNorway
ItalyNetherlands
SloveniaGreece
SwedenCzech Republic
PortugalSpain
DenmarkEstonia
Slovak RepublicIcelandTurkey
United KingdomIrelandPoland
CanadaIsrael
United StatesAustralia
New ZealandJapan
South KoreaSwitzerland
MexicoChile Direct marginal tax
Indirect taxes
Per cent of GDP
Total tax revenue as a percentage of GDP, 20125.01OECD
0 5 10 15 20 25 30 35 40 45 50
DenmarkFrance
BelgiumItaly
SwedenFinlandAustriaNorway
HungaryNetherlands (2011)
GermanySlovenia
IcelandCzech Republic
United KingdomGreece
New ZealandSpain
EstoniaPortugal
Poland (2011)Israel
CanadaJapan (2011)
Slovak RepublicIreland
SwitzerlandTurkey
South KoreaAustralia (2011)
United StatesChile
Mexico (2011)
EUROZONE
The marginal tax rate indicates how much the individual taxpayer receives after tax per additional dollar earned. The marginal tax rate is therefore vital for the incentive to make an extra effort at the work-place. By including indirect taxes, this benchmark displays the effect of Value Added Tax and other indirect taxes on the consumption value of income after tax.
Chile is the OECD country with the lowest marginal tax for medium wage earners. Belgium takes the bottom place with a marginal tax rate of almost 75 per cent.
* Average wage for an industrial worker.
Note Data for indirect taxes is from 2011
SourceOECD, Taxing Wages 2012, Danish Ministry of Taxation and DI calculations
Total tax revenue is a measure of the size of the government and thus the country’s structure with regard to public versus private handling of welfare tasks such as childcare, hospitals, elderly care etc.
A high level of taxes makes it less attractive for individual citizens to show private initiative. The tax burden is also a fine indicator of how competitive each country is in terms of attracting foreign entrepreneurs.
With a tax burden of almost 20 per cent of GDP, Mexico retains its lead as the country with the lowest overall tax revenue as a percentage of GDP. Chile and the United States occupy the following two positions.
Note The tax burden can be calculated in many different ways.
Source OECD, Revenue Statistics 2013
Behind the benchmark
Behind the benchmark

GLOBAL BENCHMARK REPORT 2014 – COSTS 73
Per cent
Marginal tax rate for high wage earners*, including indirect taxes, 20125.03
0 10 20 30 40 50 60 70 80
EurozoneOECD
BelgiumSweden
ItalySlovenia
FranceDenmark
FinlandGreeceIreland
NorwayPortugalHungary
NetherlandsIceland
Czech RepublicUnited Kingdom
TurkeyEstonia
IsraelGermany
Slovak RepublicAustria
AustraliaPoland
SpainUnited States
CanadaNew Zealand
SwitzerlandJapan
MexicoSouth Korea
Chile Direct marginal taxIndirect taxes
Per cent
Nominal corporate tax rate, 20135.04
0 5 10 15 20 25 30 35 40 45
BrazilIndia
ChinaRussia
United StatesJapan
FranceBelgiumPortugal
SpainMexico
AustraliaGermany
NorwayNew Zealand
ItalyCanadaGreece
NetherlandsIsrael
DenmarkAustriaFinland
South KoreaUnited KingdomSlovak Republic
SwedenSwitzerland
EstoniaHungary
TurkeyIceland
ChilePoland
Czech RepublicSlovenia
Ireland
OECDEUROZONE
The marginal tax rate for higher wage earners affects the labour supply of the most productive workers. High taxes reduce the advantage of taking tertiary educa-tion, completing it quickly, working longer hours and retiring later.
Chile has the lowest level of marginal taxes for higher paid wage earners. The highest marginal tax rate is found in Belgium.
With increasing globalisation, both capital and companies become increasingly mobile. The corporate tax rate therefore becomes increas-ingly significant because it reduces investment yield. OECD analyses show that lower corporate tax is the most effective fiscal measure to increase growth.
Ireland still has the lowest corpo-rate tax rate among OECD countries at only 12.5 per cent. The United States, Japan and France still have the highest corporate tax rates and this reflects the fact that large countries, thanks to their domestic markets, can easily attract invest-ment despite high corporate tax rates.
* 167 per cent of the average wage for an industrial worker
Note Data for indirect taxes is from 2011
Source OECD, Taxing Wages 2012, Danish Ministry of Taxation and DI calculations
Source OECD Tax database and KPMG’s Corporate and Indirect Tax Rate Survey 2013
Behind the benchmark
Behind the benchmark

GLOBAL BENCHMARK REPORT 2014 – COSTS74
Per cent
Annual inflation, 2009-2013 (average)5.06
-2 0 2 4 6 8 10 12
IndiaRussiaBrazilChina
TurkeyIceland
HungaryMexicoEstoniaPoland
United KingdomSouth Korea
IsraelFinland
AustraliaSlovak Republic
ChileNew Zealand
AustriaItaly
NetherlandsGreece
BelgiumDenmark
Czech RepublicSlovenia
SpainNorway
United StatesCanada
GermanyPortugal
FranceSwedenIreland
SwitzerlandJapan
OECDEUROZONE
Per cent
Actual corporate tax rate, 20125.05
0 5 10 15 20 25 30 35
BrazilIndia
RussiaChina
New ZealandUnited States
JapanAustralia
NorwayMexico
IsraelGermany
United KingdomSpainChile
NetherlandsItaly
DenmarkTurkey
SwedenAustria
PortugalSouth Korea
PolandFinland
SloveniaIreland
HungaryGreece
SwitzerlandIcelandFrance
EstoniaCzech RepublicSlovak Republic
CanadaBelgium
OECDEUROZONE
Price inflation is central to the sta-bility of a country, and stable price development is also an essential cri-terion for countries in the European monetary cooperation. This bench-mark shows the average annual increase in consumer prices.
For several years, Japan has recorded falling prices (deflation) and once again ranks as number one with an average growth in consumer prices of -0.5 per cent over the past five years. It should be noted that deflation is not desirable.
Growth markets often face problems curbing inflation. Especially Russia and India have high inflation rates.
SourceOECD Economic Outlook No. 94 and DI calculations
The tax payment of businesses depends not only on the corporate tax rate, but also on the breadth of the tax base – which means how big a proportion of the profit that is taxed. The actual corporate tax rate is significant in relation to company localisation and investment deci-sions and, consequently, in relation to retaining and attracting busi-nesses and jobs.
Belgium has OECD’s lowest actual corporate tax rate at 6.4 per cent.
Note The actual corporate tax rate is based on a model calculation (for a conventional production company (Ltd) with 60 employees and without international operations).
Source PricewaterhouseCoopers Paying Taxes “The Global Picture” 2014
Behind the benchmark
Behind the benchmark
Behind the benchmark
Behind the benchmark

GLOBAL BENCHMARK REPORT 2014 – COSTS 75
Index 0-10
Access to capital markets, 20135.07
0 1 2 3 4 5 6 7 8 9 10
RussiaChinaBrazilIndia
IcelandSlovenia
GreeceSpain
ItalyHungaryPortugal
MexicoEstonia
Slovak RepublicSouth Korea
AustriaJapan
New ZealandFranceIreland
Czech RepublicFinland
ChileAustralia
TurkeyCanada
United KingdomNetherlands
DenmarkUnited States
BelgiumIsrael
NorwayGermany
SwedenSwitzerland
Poland
OECDEUROZONE
DKK
Hourly compensation costs in manufacturing, 20125.08
0 50 100 150 200 250 300 350 400
Norway
Sweden
Belgium
Denmark
France
Germany
Finland
Netherlands (2011)
Austria
United States
Japan
Ireland
Italy
Spain
United Kingdom
Greece (2009)
Slovenia
Portugal
Czech Republic
Slovak Republic
Hungary
Poland
EUROZONEOECD
Easy access to capital markets mini-mises the financial costs for busi-nesses, contributes to increased investment, and stimulates economic growth. In the wake of the financial crisis, access to capital markets is still difficult in many countries.
In their own assessment, senior managers in Poland, Switzerland and Sweden have easy access compared with the other OECD countries.
Note This benchmark shows to which degree senior managers assess that access to national and foreign capital markets is easy. The survey dates back to early 2013.
SourceIMD World Competitiveness Yearbook 2013 (survey, scale 0-10)
In a globalised world, company competitiveness is determined by a reasonable relationship between productivity and costs. The higher the costs, the more productive busi-nesses need to be in order to be competitive – all other things being equal.
Poland, Hungary and the Slovak Republic are among the countries with the lowest hourly compensation costs in manufacturing.
SourceDA’s database on international wage statistics
Behind the benchmark
Behind the benchmark
Behind the benchmark
Behind the benchmark

GLOBAL BENCHMARK REPORT 2014 – COSTS76
Per cent of GDP
Yield of environmental taxes as a percentage of GDP, 20115.10
0.0 0.5 1.0 1.5 2.0 2.5 3.0 3.5 4.0 4.5
OECD
Eurozone
Denmark
Netherlands
Slovenia
Finland
Estonia
Italy
Greece
Norway (2010)
United Kingdom
Ireland
Poland
Hungary
Sweden
Austria
Portugal
Czech Republic
Germany
Belgium
Iceland
Slovak Republic
France
SpainEnergyTransport excluding fuelPollution/resources
Per cent
Annual growth in unit labour costs, 2009-2013 (average)5.09
-3 -2 -1 0 1 2 3 4 5 6
Iceland
Norway
Finland
United Kingdom
Austria
Australia
Belgium
Germany
South Korea
Hungary
Italy
Canada
Netherlands
France
Poland
Denmark
Slovenia
Sweden
Czech Republic
Slovak Republic
Switzerland
Estonia
United States
Japan
Spain
Ireland
Greece
EUROZONEOECD
Environmental taxes are a cost for enterprises and have major influ-ence on their international compet-itiveness.
The rationale behind environmental taxes is to make utilisation of scarce or undesired resources more expen-sive and thus reduce consumption. If individual countries choose to go alone and impose increased costs on production without balancing them with other relief, then there is a risk that production moves away from these countries.
Taxes on resources and trans-boundary pollution should be agreed internationally if they are to have an effect on global resource consump-tion and the climate.
Spain has the smallest yield of envi-ronmental taxes as a percentage of GDP, and Denmark the highest.
Source European Commission, Taxation trends in the EU, 2013
The development of unit labour costs illustrates the combined effect on production costs of wage increases and productivity devel-opment. An increase is an expres-sion of the fact that the pay rises were larger than productivity devel-opment.
All OECD countries except for Greece, Ireland, Spain and Japan display average positive growth in unit labour costs over the past few years.
Note Unit labour costs for the entire economy. Data from the second half of 2013 is an OECD estimate.
Source OECD, Economic Outlook No. 94 and DI calculations
Behind the benchmark
Behind the benchmark

GLOBAL BENCHMARK REPORT 2014 – COSTS 77

78 GLOBAL BENCHMARK REPORT 2014 – XXX
79GLOBAL BENCHMARK REPORT 2014 – XXXX
Global Benchmark Report

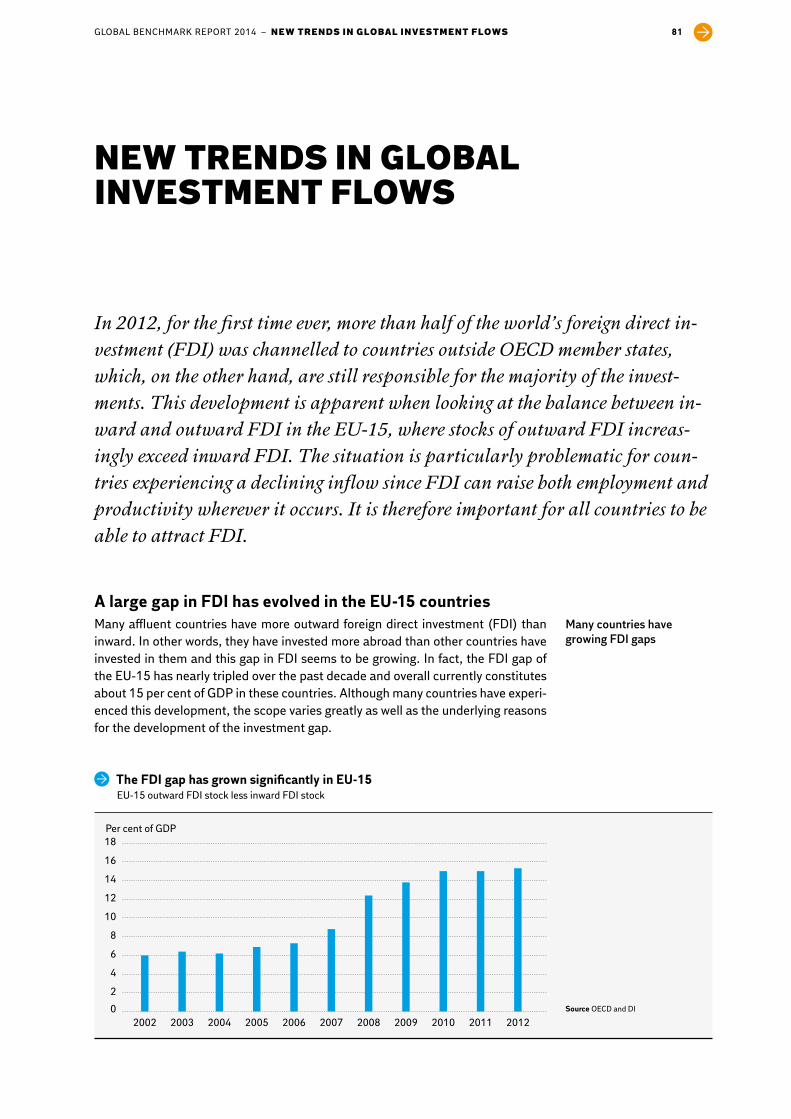
GLOBAL BENCHMARK REPORT 2014 – NEW TRENDS IN GLOBAL INVESTMENT FLOWS 81
In 2012, for the first time ever, more than half of the world’s foreign direct in-vestment (FDI) was channelled to countries outside OECD member states, which, on the other hand, are still responsible for the majority of the invest-ments. This development is apparent when looking at the balance between in-ward and outward FDI in the EU-15, where stocks of outward FDI increas-ingly exceed inward FDI. The situation is particularly problematic for coun-tries experiencing a declining inflow since FDI can raise both employment and productivity wherever it occurs. It is therefore important for all countries to be able to attract FDI.
NEW TRENDS IN GLOBAL INVESTMENT FLOWS
AlargegapinFDIhasevolvedintheEU-15countriesMany affluent countries have more outward foreign direct investment (FDI) than inward. In other words, they have invested more abroad than other countries have invested in them and this gap in FDI seems to be growing. In fact, the FDI gap of the EU-15 has nearly tripled over the past decade and overall currently constitutes about 15 per cent of GDP in these countries. Although many countries have experi-enced this development, the scope varies greatly as well as the underlying reasons for the development of the investment gap.
Many countries have growing FDI gaps
TheFDIgaphasgrownsignificantlyinEU-15EU-15 outward FDI stock less inward FDI stock
0
2
4
6
8
10
12
14
16
18
20122011201020092008200720062005200420032002
Per cent of GDP
Source OECD and DI

GLOBAL BENCHMARK REPORT 2014 – NEW TRENDS IN GLOBAL INVESTMENT FLOWS82
Similar to the EU-15, many OECD member states are experiencing a gap between inbound and outbound FDI. The reason is a general and growing tendency to in-vest outside these countries. In 2006, 70 per cent of the world’s FDI flows went to OECD member states while, in 2012, less than half landed there.
The main part of the world’s FDI, however, still comes from OECD member states even though there has been a small decline in their share of the world’s outward FDI flows from 80 per cent in 2006 to 70 per cent in 2012. This means that in 2012, 70 per cent of the world’s FDI came from OECD member states while only half of global FDI was channelled to those countries. The result is that overall the gap has increased.
Furthermore, the financial crisis in 2008 and the debt crisis in 2011 had a restrain-ing effect on global FDI flows. The flows, however, were only below the 2006 level in 2009; otherwise, they have been higher. The general increase in FDI has to do with the general growth of the world economy and is similarly an expression of an increasingly globalised world. In comparing OECD member states, it appears that outward FDI primarily exceeds inward FDI in the most affluent countries. The question is then whether such a FDI gap is good or bad?
FDI is moving outside of the OECD…
… but it still comes from OECD member states
0
500
1,000
1,500
2,000
2,500
2010 20122008200620042002200019981996199419921990
USD bn
Financial crisis
Europeandebt crisis
Dot-com bubble
IncreasingamountsofFDIchannelledtonon-OECDcountriesTotal global flow of inward FDI from OECD member states and the world's other countries
Note Estonia and the Slovak Republic are not included in flow to the OECE before 1992.
The world's aggregate inward and outward FDI flows should be the same but are not due to measurement errors.
Source UNCTAD and DI
OECD
The world excluding the OECD

GLOBAL BENCHMARK REPORT 2014 – NEW TRENDS IN GLOBAL INVESTMENT FLOWS 83
Although investment gaps seem to have occurred primarily in the most affluent OECD member states, the pattern of inward FDI is not the same across the states. OECD member states differ significantly in their ability to attract direct investments from abroad. This shows that although a larger share of global FDI is channelled outside OECD member states, there is still great potential to attract more FDI with-in these countries.
It is not obvious whether a gap between the outward and inward FDI is a positive or negative development for a given country. As an example a FDI gap that occurs due to less inward FDI and increasing outward FDI could indicate that domestic busi-nesses increasingly remain with domestic owners while they are acquiring foreign companies and expanding their operations in export markets. At face value that sounds positive, but is foreign ownership necessarily a bad thing, or could it even be preferable?
On the other hand, the gap could signify that both domestic and foreign companies have lost interest in the given country. In that case, a large and growing FDI gap is undesirable.
In order to understand whether a FDI gap is good or bad, it is necessary to take a closer look at the development of the investment balance, and at what FDI actu-ally entails. Based on the development in many European countries, it appears that there are both positive and negative aspects to a growing FDI gap.
Great differences in a country’s ability to attract FDI
Not so clear whether the development is positive or negative
0
500
1,000
1,500
2,000
2,500
201220102008200620042002200019981996199419921990
USD bn
Financial crisis
Europeandebt crisis
Dot-com bubble
FDIprimarilycomesfromtheOECDmember-statesTotal global flow of outward FDI to OECD member states and the world's other countries
OECD
The world excluding the OECD
Note Estonia and the Slovak Republic are not included in flow to the OECE before 1992.
The world's aggregate inward and outward FDI flows should be the same but are not due to measurement errors.
Source UNCTAD and DI

GLOBAL BENCHMARK REPORT 2014 – NEW TRENDS IN GLOBAL INVESTMENT FLOWS84
AN INVESTMENT GAP CAN BE LARGE OR SMALL FOR MANY REASONS
OutwardFDIexceedsinwardFDIinaffluentcountriesOECD member states' outward FDI stock less inward FDI stock, 2012
-80 -60 -40 -20 0 20 40 60 80 100Czech Republic
EstoniaSlovak Republic
HungaryChile
New ZealandPoland
PortugalTurkey
SloveniaIcelandMexico
AustraliaSpainIsrael
GreeceSouth Korea
CanadaNorwayBelgiumSweden
USAItaly
JapanAustriaFrance
United KingdomFinland
GermanyDenmark
IrelandNetherlandsSwitzerland
Luxembourg
Per cent of GDPSourceOECD and DI
TheattractionofFDIvariesgreatlyamongtheindividualcountriesAverage annual flow of inward FDI 2007-2012 as a proportion of GDP
0 5 10 15 20 25 30Japan
GreeceItaly
South KoreaGermanyDenmark
FinlandSlovak Republic
USANew Zealand
FranceTurkeyMexico
PortugalSpain
AustriaSlovak Republic
PolandNorway
Czech RepublicSwedenCanada
United KingdomNetherlands
AustraliaSwitzerland
IsraelHungaryEstonia
ChileIcelandIreland
BelgiumLuxembourg
Per centSourceUNCTAD and DI

GLOBAL BENCHMARK REPORT 2014 – NEW TRENDS IN GLOBAL INVESTMENT FLOWS 85
SourceOECD and UNCTAD
France’s stocks of both inward and outward FDI have decreased in the same period, and since outward FDI has decreased more, the gap has become smaller. An explana-tion could be that France is generally struggling with poor competitiveness and has had a tough time in the fi nancial crisis and the successive debt crisis.
In Australia, the stock of outward FDI has declined from 2006 through 2012 while the stock of inward FDI has increased. It is primarily the major infl ow of FDI to the mining industry that has caused Australia’s stock of inward FDI to exceed outward FDI.
France
Australia
Similar to Denmark, outward FDI in Norway exceeds inward FDI, but in Norway, the gap is smaller today than in 2006 because the inward FDI stock has increased more than the outward FDI. The increase in inbound FDI is mainly found in oil production and real estate.
Norway
The Danish FDI gap is caused by a decreasing fl ow of inward FDI thatcoincides with an increasing fl ow of outward FDI.
Denmark

GLOBAL BENCHMARK REPORT 2014 – NEW TRENDS IN GLOBAL INVESTMENT FLOWS86
FDIhasmanyfavourableeffectsIn principle, FDI is a transfer of capital securing the investor a significant share of equity and accordingly influence in the company in which he has invested. Techni-cally, FDI can be divided into four types:
1 Start-up of a new company/subsidiary2 Transfer of capital to subsidiaries3 Whole or partial acquisition of companies4 Flow-through investment
The division into the four types makes it easier to understand how FDI can affect the economy in the country it targets.
Start-up of new companies will involve the creation of new jobs since it can be char-acterised as green field investment. This is a particularly interesting aspect of in-ward FDI.
The transfer of capital to subsidiaries may also involve green field investment in cases where the capital is used to expand the activities of the subsidiaries. There may be other motives, though. If, for instance, the company’s investment goes to improvements in production equipment, it does not immediately create a need for more employment. On the other hand, it increases productivity. However, invest-ment in a subsidiary may also be pure cash management with no real economic ef-fect since it is simply a transfer of money that will be returned at a later stage.
Acquisitions have no obvious effect on employment. Since a major part of FDI cov-ers whole or partial acquisitions of companies, no direct correlation between FDI and employment can be expected.
FDI can be many things
Some FDI benefits employment ...
… while others have no real economic effect
Much FDI is acquisitions
Over the next five years Siemens will expand its presence in Brazil by investing up to USD 1 bil-lion inlcuding a brand new factory producing high and low voltage motors and generators and a R&D center in Rio de Janeiro.
1 Start-upofnewbusiness
SourcesSiemens, Microsoft, Dell and Nationalbanken
2 Transferofcapitaltosubsidiary
Dell is expected to expand its operations in China by 2020 with a USD 100 billion investment.

GLOBAL BENCHMARK REPORT 2014 – NEW TRENDS IN GLOBAL INVESTMENT FLOWS 87
Flow-through investment has no real economic significance since the capital is merely flowing through a holding company to the country where the actual invest-ment takes place. In countries such as Belgium, Ireland, the Netherlands and Lux-embourg, where much FDI flows through holding companies, both inbound and outbound FDI will be at an artificially high level.
This means that not all FDI has an effect on the economy, but over the years, the FDI will presumably include all types.
Flow-through investment has no effect on the economy
Increasing globalisation makes it important to understand the factors that determine whether national and international companies expand abroad or at home. The easy answer is that businesses locate wherever it is most profitable.
billionUSD
American DuPont paid 5.8 billion dollars for the acquisi-tion of Danish Danisco in 2011. The company was acquired through a holding company in Luxembourg. Therefore, the investment did not affect the economy of Luxembourg, even though it was considered an American investment in Luxem-bourg and an investment from Luxembourg into Denmark.
4 Flow-throughinvestments
billionUSD
In 2013, software giant Microsoft bought Nokia’s main handset business for 5.44 billion euros.
3 Acquisitionofcompany
billioneuros

GLOBAL BENCHMARK REPORT 2014 – NEW TRENDS IN GLOBAL INVESTMENT FLOWS88
ForeignownersraiseproductivityAs mentioned above, foreign ownership per se does not affect employment, but may have a positive effect on productivity. Considering Denmark as an example, foreign-owned companies in Denmark have higher revenue per employee than Danish-owned companies. This may be due to the fact that new owners bring new knowledge, new ideas or new technology when they take over a company.
Part of the explanation as to why foreign-owned companies have higher revenue per employee is presumably also that it is often the largest and most productive companies that are acquired by foreign investors. On the other hand, the object of acquiring a company must be to increase its value by increasing the expected future earnings, either by raising productivity or by increasing sales. This leads to the conclusion that foreign owners often work with productivity improvements – a conclusion that is confirmed in a Danish context by a survey taken among DI mem-ber companies.
When FDI increases the productivity of companies invested in, it also works as an incentive for other companies to increase their productivity in order to remain com-petitive. One way to do this could be to copy some of the foreign owners’ methods, and this means that, over time, foreign ownership could create a broader produc-tivity lift.
Last, but not least, a general interest from foreign investors is important in terms of being able to obtain capital for the companies of a country. Major interest will make it easier and less expensive for companies to find financing. This will make more investment attractive, and this again will increase the physical capital stocks and raise productivity.
Higher revenue per employ-ee with foreign owners
Interest from abroad also facilitates access to capital
0
100
200
300
400
500
600
Foreign ownersDanish owners
USD 1,000 per employee
Greaterrevenueperemployeewithforeignowners2006-2011, number of employees in man-years
SourceStatistics Denmark

GLOBAL BENCHMARK REPORT 2014 – NEW TRENDS IN GLOBAL INVESTMENT FLOWS 89
The majority of companies in Denmark have Danish ownersProportion of foreign-owned companies of all firms and all private-sector employees in Denmark
Foreign ownership not always to be preferredForeign capital may provide new jobs in the country it is invested in, but it may also have a positive effect on productivity through the increase of capital goods or the in-troduction of new ideas and technologies by the foreign owners. It does not mean, however, that any FDI or acquisition is an advantage for the receiving country. The motive of the individual investor varies, and for some this could be the closure of domestic branches. Precisely for this reason, it is vital to be as attractive as possi-ble to a large number of investors so that it is possible to deselect those who do not benefit the country.
In this context it is worth stressing that we are not anywhere near a situation where all companies in either individual countries or in Europe as such are owned by for-eigners. Denmark has relatively many foreign-owned companies compared with other European countries, and still only 1.3 per cent of all companies in Denmark have non-Danish owners. On the other hand, these are mainly larger companies, so non-Danish ownership comprises a larger share of privately employed Danes.
Not all foreign acquisitions are good…
... but most businesses still have national owners
CompanieswithforeignownershiphavemorefocusonproductivityimprovementsResponses to question whether the company is working to enhance productivity
0
20
40
60
80
100Per cent
Foreign ownership Danish owners
No
Yes, but without concrete productivity targets
Yes, with concrete productivity targets
SourceDI's company panel, survey among 552 member companies of which 157 have foreign owners among their ownership
Number of companies Number of employees
19.8%1.3%
80.2%98.7%
Danish owned
Foreign owned
Note Number of employees in man-years
SourceStatistics Denmark and DI

GLOBAL BENCHMARK REPORT 2014 – NEW TRENDS IN GLOBAL INVESTMENT FLOWS90
Measured by the number of employees, one fifth of those employed in the private sector in Denmark are working in a company with non-Danish owners. These do not only count companies acquired by foreign investors, but also jobs that were cre-ated as a result of foreign companies’ green field investment.
You could fear that companies that are being acquired will relocate to another country. It seems at least plausible that foreign owners do not have the same sense of belonging to the countries where they buy companies that the national owners have. On the other hand, it is not a given fact that national owners have a choice in deciding whether to keep the company in the original country. Irrespective of the nationality of the owner, it is difficult for a company to survive if the product or ser-vice it offers can be produced more efficiently and cheaply abroad.
What keeps the companies at home in the long term are not the boundaries to the outside world, but rather the conditions businesses operate under. National bor-ders simply have diminishing significance for many companies. The increasing in-vestment flows across national borders are evidence of that.
OutwardFDIisnotallpositiveWhen a country’s businesses have many direct investments and employees abroad, it is generally good for the country. It is evidence of efficient and expanding compa-nies that increase their presence in the world through acquisitions and expansion. This was also highlighted in a Danish context in a survey taken among DI’s mem-bers. The survey showed that access to new markets and proximity to customers were the main motive when Danish companies established jobs abroad.
When proximity to customers and new markets are the main motive for establish-ing jobs abroad, there is obviously nothing to be done differently to convince the companies to establish the jobs at home. On the other hand, we can do something
Relocation may be neces-sary for companies…
…. if they are not competi-tive in their country of origin
Outward FDI is often a good thing …
…. but not always
0 20 40 60 80 100
Better access to new markets/close to the customer
Reduction of labour costs
Enhancement of company structure and internal division of labour
Taxes
Not sufficient access to qualified labour in Denmark
To get better access to specialised knowledge and technology
NewmarketsabroadandhighlabourcostsinDenmarkaremainmotivesforestablishingjobsabroadIndicate how you weighted the motives for the decision to establish jobs abroad and not in Denmark
Very important
Important
Less important
Not important
Don't know
SourceDI's company panel. Survey among 442 companies. Completed mid-June 2011

GLOBAL BENCHMARK REPORT 2014 – NEW TRENDS IN GLOBAL INVESTMENT FLOWS 91
in relation to the second most quoted motive for establishing jobs abroad, which was reduction of labour costs.
In Denmark, as in several other affluent countries, we are not interested in com-peting directly with low-wage countries on wages. In order to avoid that, work car-ried out in Denmark must have a high level of knowledge in order to give it a higher value, and production must be smarter or more automated. Many other European countries also meet these criteria; so irrespective of how innovative Danish compa-nies are, costs are still very important.
OutwardFDIalsocoversoutsourcingSome of the jobs that companies establish abroad are not just expansions, but a relocation of jobs to other countries. In other words, some of the outward FDI does not only mean that a country is missing out on new jobs, but is an expression of a direct loss of jobs.
Outsourcing may be necessary in order to secure the survival of companies if they have activities that could be performed more efficiently or cheaply in other coun-tries. In this case, outsourcing contributes to ensuring the survival of domestic businesses. It is however a problem from a country’s perspective if its businesses will be outperformed if they retain the jobs in the country.
When looking at the degree of outsourcing that takes place from countries across Europe, the pattern seems to be that the most affluent countries are outsourcing the largest share of their industrial jobs.
Costs are a common cause of outsourcing in many other European countries, par-ticularly the most affluent among them.
Quality should offset costs
Outward FDI can also be outsourcing…
… some countries outsource more than others…
…. mainly due to high costs
DenmarkhasoutsourcedthehighestproportionofindustrialjobsOutsourced jobs in the period 2009-2011 as a proportion of employment in industrial companies with 100 or more employees
Per cent0 1 2 3 4 5 6
LithuaniaRomania
FranceSlovak Republic
EstoniaBelgiumSwedenPortugalNorway
NetherlandsDenmark
Source Eurostat

GLOBAL BENCHMARK REPORT 2014 – NEW TRENDS IN GLOBAL INVESTMENT FLOWS92
In contrast, in affluent countries, access to qualified labour, specialised knowledge and higher quality apparently have no significance in relation to outsourcing deci-sions. However, these factors cause companies to outsource from the less afflu-ent countries in the study. The reasons for outsourcing offer indications about the strengths and weaknesses of the individual countries. Denmark, for example, pro-duces high quality products with high knowledge content, and very few companies outsource with the motive to improving those aspects. The motivation for Danish companies to relocate their production to other countries is Denmark’s high level of costs.
The major scope of outward FDI and in some cases also outsourcing that many countries experience could partly be compensated for by a capacity for attracting more investment from abroad. In this context, it may be natural that inward FDI and outward FDI do not balance in many OECD member states since a long list of countries outside the OECD record far higher growth rates, which simply make it more attractive to invest there. There are, however, major differences across coun-tries, and some countries are doing far better than others in terms of the scope of outsourcing and the ability to attract FDI.
ReducedinwardFDIisworryingAs mentioned earlier, there is major difference as to how much FDI the various countries attract. It is, however, equally interesting whether the individual coun-tries, irrespective of level, have been able to increase their attraction of FDI or whether they have experienced a distinct fall in recent years.
This picture is also rather mixed, but in general, most countries have increased their attraction of new FDI in the period 2007-2012 compared with the period 2001-2006. This has to do with the fact that the flow of FDI to OECD member states has generally increased in the period despite constituting a smaller propor-tion of the world’s total FDI.
However, many countries have also experienced a major decline in inward FDI, which is a development that those countries should aim to reverse since it means that they miss out on investment that can increase productivity and create jobs.
High knowledge content retains jobs in affluent
countries
Many countries attract less FDI than they used to
HighcostsmotivateoutsourcinginaffluentcountriesProportion that states costs as motivation factor for outsourcing
Per cent0 10 20 30 40 50 60
RomaniaEstonia
PortugalLatvia
FranceSlovak Republic
NetherlandsBelgiumNorwayIreland
SwedenDenmark
Finland
SourceEurostat, International sourcing statistics survey 2012
Lower wage costs
Lower costs (excluding wage costs)

GLOBAL BENCHMARK REPORT 2014 – NEW TRENDS IN GLOBAL INVESTMENT FLOWS 93
Inlowwagecountries,quality,knowledgeandqualificationsmotivatecompaniestooutsourceProportion that states quality, knowledge and qualification as motivation factor for outsourcing
Per cent0 5 10 15 20 25 30
DenmarkFrance
NetherlandsSwedenBelgiumNorwayFinlandIreland
Slovak RepublicPortugal
LatviaEstonia
Romania
SourceEurostat, International sourcing statistics survey 2012
ManycountrieshaverecordedincreasinginwardFDIIn the national currency, growth in inward FDI including flow-through from the period 2001-2006 through the period 2007-2012
-100 -50 0 50 100 150 200 250 300 350 400
Slovak RepublicDenmark
South KoreaFinlandFrance
Czech RepublicSloveniaEstonia
ItalyLuxembourgNetherlands
PortugalGermany
GreeceNew Zealand
MexicoSweden
United KingdomSpain
HungaryPoland
SwitzerlandIceland
USAAustria
IsraelCanada
BelgiumTurkeyJapan
AustraliaChile
NorwayIreland
Per cent
Source OECD and DI
Enhanced quality or intro-duction of new products
Access to specialised know-ledge and technology
Shortage of qualified labour

GLOBAL BENCHMARK REPORT 2014 – NEW TRENDS IN GLOBAL INVESTMENT FLOWS94
Ifreturnistoolow,noinvestmentThe increasing global flow of foreign direct investment makes it important to un-derstand the factors that determine whether national and international companies expand abroad or at home. The easy answer is that businesses locate wherever it is most profitable, and this is determined by the return on investment (ROI) and the security for achieving the desired ROI.
For countries such as Denmark, which attract less FDI than their neighbours and other comparable countries, as a minimum, investments should return the same yield as in the other countries. Declining or relatively low inward FDI is not simply a natural development that must be accepted.
Severalfactorscanincreaseacountry’sattractivenessInvestments in any country have advantages and drawbacks, but it is vital to strengthen the advantages and reduce the drawbacks if the flow of FDI is to in-crease. This will also ensure a situation in which national businesses increasingly retain and establish jobs at home instead of abroad. As stated earlier, several EU-15 countries struggle with high costs and are therefore attracting less FDI than ear-lier. However, apart from the high costs, these countries have strong foundations for attracting FDI on other accounts.
Taking Denmark as an example, the advantages of operating a business include our business conditions that fundamentally support the Danish industrial strengths, which are production of high quality products and niche products. Denmark has a qualified labour force, a low degree of corruption and a high level of confidence in the population. These are strengths we should hold on to and continuously im-prove. Generally speaking, we have a strong foundation for operating a business in Denmark, and this also suggests that foreigners should invest more in Denmark.
The fact that this is not the case is because other factors limit investment in Den-mark. Locating in Denmark does not provide access to a large market. This factor is difficult to change. On the other hand, we can do something about the high level of costs, which many businesses point to as an important motive for choosing to invest abroad rather than in Denmark.
We are not talking about Denmark lowering the level of cost to that of Eastern Eu-rope or Asia. The high level of knowledge in the products that are made in Denmark vouch for that. It is rather about competing with the cost levels in the countries around us.
Many other factors could be adjusted in order to make Denmark or any other coun-try an attractive investment destination. This would make long-term investment far more attractive along with an increased focus on ensuring sufficient labour with the right qualifications, a good infrastructure and improved conditions for research and development.
Other countries become more attractiv …
… because high costs re-duce the yield
EU-15 can increase their attractiveness
Denmark has a strong foun-dation for attracting FDI ...
... but it must be even stronger ...
... our neighbours have a strong foundation, too
Improvement can be made in many areas

GLOBAL BENCHMARK REPORT 2014 – NEW TRENDS IN GLOBAL INVESTMENT FLOWS 95
In addition, an investment always involves a certain degree of risk, and the greater the risk, the larger the ROI required. For this reason, we must also consider how the risk can be minimised. One way for governments to contribute is by being forth-coming and action-oriented towards foreign investors. If, from the outset, the com-panies experience fast and efficient service from the public authorities, it will be a clear indication that they do not risk their investment and subsequent operation being negatively affected by unpredictable costs due to slow case processing or other administrative burdens. Fewer administrative burdens, per se, will reduce the costs of the companies.
DI RECOMMENDSIn general, these recommendations deal with the following categories: administra-tive burdens, interaction with government investment, and direct financial incen-tives. The recommendations touch upon areas that any country should aim to im-prove if it wants to attract and retain more investment.
Feweradministrativeburdens > Governments should establish ambitious quantitative targets for
reducing the administrative burdens of businesses.
> Public case processing should have a focus on attracting more businesses and investment
> Consistent municipal planning and transparent planning criteria will support a shorter path “from project to product” for businesses.
EnhancedinteractionbetweenpublicandprivateR&D will raise the level of knowledge and innovation > Focus on business-oriented research
> Enhanced cooperation between businesses and universities
> Focus on strong and business-relevant public research environments
Financial incentives > Competitive corporate tax
> Ensuring competitiveness of several other taxes that affect businesses, which compete on the international markets
> Improved wage competitiveness
The problem can be solved

Africa’s size is often under- estimated. The map illustrates that Africa is about the same size as USA, China, India, Japan, and Europe combined.
USA
Spain
Portugal
Denmark
FranceGermany
Italy
Switzerland
EasternEurope
India
Indiapart 2China
Chinapart 2
Japan
Great Britain
BelgiumThe Netherlands

GLOBAL BENCHMARK REPORT 2014 – AFRICA: OPEN FOR BUSINESS 97
In the past decade, Africa has developed from being an extremely impoverished continent with gloomy prospects for the future to accommodating some of the world’s fastest growing economies. The progress is thanks to high growth rates caused by a strong increase in inward foreign direct investment, major demand for African raw materials and a remarkable development of the African consumer markets. Business conditions in Africa have also improved. The EU is still Africa's largest donor and trading partner. However, the EU is getting less relevant to the continent due to other countries' interest in trading with and investing in the African countries. With changes in trade agreements and aid policy underway, 2014 holds ample opportunity for revitalizing the cooperation between the two regions.
AFRICA: OPEN FOR BUSINESS
Imagine Africa as the world’s factory floor. The first place that any CEO would con-sider to have any kind of product manufactured at a reasonable price and quality. The question is only whether to locate the production in Uganda, Ethiopia or Mali.
Imagine Africa as the world’s food producer. A producer of tonnes of meat, vege-tables, fruit, cereals and dairy products that are shipped – both as processed and unprocessed goods – to consumers across the world.
Or imagine Africa as one of the world’s most interesting consumer markets. New trends are created and born here, and any international brand worth its salt has a massive presence.
These three scenarios may all sound utopian. The reality, however, is that now, in 2014, Africa is in the midst of a development process that may very well lead to all three situations coming true by 2040.
The continent has already made so much progress that what is reality today – that half of the African countries are middle income states and that there are more than 650 million mobile telephone subscribers in Africa – would have sounded like science fiction for a citizen of the world in the year 2000.
The world’s factory floor …
… the world’s food producer …
… the world’s most interesting consumer market …
… may be found in Africa in 2040

GLOBAL BENCHMARK REPORT 2014 – AFRICA: OPEN FOR BUSINESS98
At that time, Africa was named “The hopeless continent” by the Economist.
”Floods in Mozambique; threats of famine in Ethiopia (again); mass murder in Uganda; the implosion of Sierra Leone; and a string of wars across the conti-nent. The new millennium has brought more disaster than hope to Africa. Worse, the few candles of hope are flickering weakly. ...
All the bottom places in the world league tables are filled by African countries, and the gap between them and the rest of the world is widening.”
The Economist, May 2000
In the early 1990s, a few African countries had experienced years of decent growth rates, but around the turn of the millennium, growth rates had fallen to 1-3 per cent, and with major population growth the countries were in reality in economic recession. In the 1990s, several new leaders had given the impression that they were more concerned with fighting poverty than lining their own pockets, but by 2000 several of them had thrown their countries into war. On top of this, a num-ber of states suffered natural disasters such as floods, drought and, subsequently, failed harvests and floods of refugees. In addition, diseases such as aids threatened to make major inroads into the new generations.
In conclusion, prospects for Africa were far from promising in 2000. In spite of this, something surprising happened in the first decade of this century. Most African countries have arrived at a positive course that has turned out to be self-reinforc-ing. Many years have displayed stable, high growth rates driven by external and in-ternal demand and increasing direct investment from the rest of the world. There have been fewer wars and more good leaders. Less disease and more education.Most of all, however, optimism and growing self-confidence bring even more fuel to Africa’s wish of creating a better life for coming generations.
In brief, Africa is open for business.
The future of Africa was far from bright in 2000

GLOBAL BENCHMARK REPORT 2014 – AFRICA: OPEN FOR BUSINESS 99
Africa – a continent in progressThe African economy is forging ahead. With an annual average growth rate of 4.6 per cent in the period 2000-2012, Africa was one of the fastest growing regions in the world.
Per cent0 1 2 3 4 5 6 7
G7*
Central andEastern Europe
Sub-Saharan Africa
Africa
Middle East
Asia
Africa had the world's third highest growth rates in the 2000sAverage annual GDP growth, 2000-2012
* G7 are Canada, France, Germany, Italy, Japan, UK and USA.
Note Africa includes Northern Africa
SourceIMF, World Economic Outlook, Database, October 2013
Growth will speed up even more in the next five years when Africa – led by the sub-Saharan states – is expected to be world champion in growth. According to forecasts by the International Monetary Fund, Africa will have an average annual growth rate of more than five per cent in the years up to 2018. And this even in a period when the majority of advanced economies are licking their wounds after the financial crisis.
Per cent0 1 2 3 4 5 6
G7*
Central andEastern Europe
Middle East
Asia
Africa
Sub-Saharan Africa
AfricawillbeworldchampionineconomicgrowthinthenextfiveyearsExpected average annual GDP growth, 2013-2018
High and stable growth in the 2000s …
… and in the 2010s
10 of the world’s 20 fastest growing economies in 2012 are situated in Africa
* G7 are Canada, France, Germany, Italy, Japan, UK and USA.
Note Africa includes Northern Africa
SourceIMF, World Economic Outlook, Database, October 2013

GLOBAL BENCHMARK REPORT 2014 – AFRICA: OPEN FOR BUSINESS100
In 2012, a quarter of the African countries recorded growth rates of seven per cent or higher. Several of them were even among the countries in the world with the highest growth rates. These include Sierra Leone, Niger, Ivory Coast, Liberia, Ethi-opia, Burkina Faso and Rwanda. It should be considered, however, that most of them come from a very low level. If they can maintain high growth rates, many Afri-can states will quickly ascend the world’s GDP charts.
Africa’seconomyismorevoluminousAfrica’s economy has tripled since 1980 – GDP (fi xed prices, million, USD 2000)
Source IMF, World Bank and DI-projection
1980
346,000 million,USD2000
1995
485,000 million,USD2000
2018
1,400,000 million,USD2000
… AND THE DEVELOPMENT
IS EXPECTED TO CONTINUE …
2010
920,000 million,USD2000

GLOBAL BENCHMARK REPORT 2014 – AFRICA: OPEN FOR BUSINESS 101
Several driving forces behind the African growth engineAfrican growth is more stable and credible now than in previous growth waves be-cause it is based on numerous underlying trends. Until the year 2000, various Af-rican countries would periodically experience high levels of growth, but the cause was nearly always increasing commodity prices. When the world market price for copper or cocoa fell again so would the country’s growth rate.
Even today, exports of raw materials and natural resources are important elements in the African growth adventure, but they are now accompanied by increasing in-ward FDI and increasing demand by the African countries’ own markets. Altogeth-er, it means that a series of self-reinforcing trends have started accumulating, and this may forge high and stable growth rates in many African countries for several years ahead.
AfricanconsumersarechargingaheadOne of the most important forces behind growth in Africa is a pronounced change in many of the continent’s consumer markets.
While local consumers would previously only really be relevant for local shopkeep-ers, the markets now reflect a larger degree of variety. The middle and upper in-come segments are growing fast; and a third of the African populations are cur-rently considered middle class. At the same time, the lower income segments are dwindling.
0
20
40
60
80
100Per cent
2000 2008 2020
TheAfricanconsumerismovinguptheincomeladderConsumer segments by income groups in USD PPP
SourceMcKinsey Global Institute, 2010
By 2008, about 85 million households in Africa reached an annual income of more than USD 5,000. This income marks a significant limit since, at this level, people begin to use about half of their income on other things than food. By 2020, 128 million households, corresponding to 52 per cent of all households, are expected to reach this level.
Growth fuelled by more than raw materials
One third of Africa’s population is middle class
128 million households will soon demand new products and services
> $ 20,000 $ 10,000 – $ 20,000 $ 5,000 – $ 10,000 $ 2,000 – $ 5,000 < $ 2,000

GLOBAL BENCHMARK REPORT 2014 – AFRICA: OPEN FOR BUSINESS102
The increasing incomes in Africa are generating demand for a long list of products and services. Consumers increasingly demand quality and branded goods. At the same time, prices are important since low prices may signal low quality and on the other hand it is limited how much the lower income segments can pay.
Some countries have particularly interesting consumer markets. Nigeria and South Africa are large countries and in the forefront in all segments with annual income of more than USD 2,000. Countries such as Kenya, Sudan and Angola also have ma-jor groups in the upper income segments.
In many places, however, the purchasing power of ordinary citizens is still so low that the market for classic Danish quality products is limited. Developments are fast, though, and a significant proportion of the middle class is concentrated around Africa’s financial centres including Lagos, Nairobi and Johannesburg. Seventy Af-rican cities currently have a population of over a million, and in Lagos, for example, the population is nearly three times that of the whole of Denmark.
At the same time, Africa is one of the continents in which most people are migrating to the cities. About 40 per cent of the continent’s population live in urban areas; and this percentage is expected to increase rapidly over the coming years.
In 2008-2011, African cities grew on average by 3.5 per cent annually, and in some countries, the tendency is even stronger. Led by Lagos, Nigeria, which is the world’s seventh fastest growing city, urbanisation will be one of the strong trends that will fuel the development of the African consumer markets over the coming years.
Urbanisation strengthens the African consumer markets for several reasons. One reason is that a major part of the middle class and the higher income segments will be moving to the cities – an urban dweller’s consumption is often twice as high as that of a farmer – and the average income in the cities is 80 per cent higher than the national average.
Urbanisation is also important for the development of the African consumer mar-kets because it is easier to reach the consumers in cities. The majority of Africans used to be spread over a large continent with poor infrastructure that made the development of a distribution network very difficult. But distribution channels in the cities are developing fast, and several large supermarket chains are expanding significantly. In Nigeria alone, the number of international shops opening on the market is increasing by 36 per cent annually.
70 African cities with a population of over one
million
Urbanisation supports the development of consumer
markets
In 2050, the population south of the Sahara is expected to reach 2 billion with 1.2 billion living in cities. Of these, 300 million will earn more than USD 20 per day, resulting in a market of USD 2 trillion.
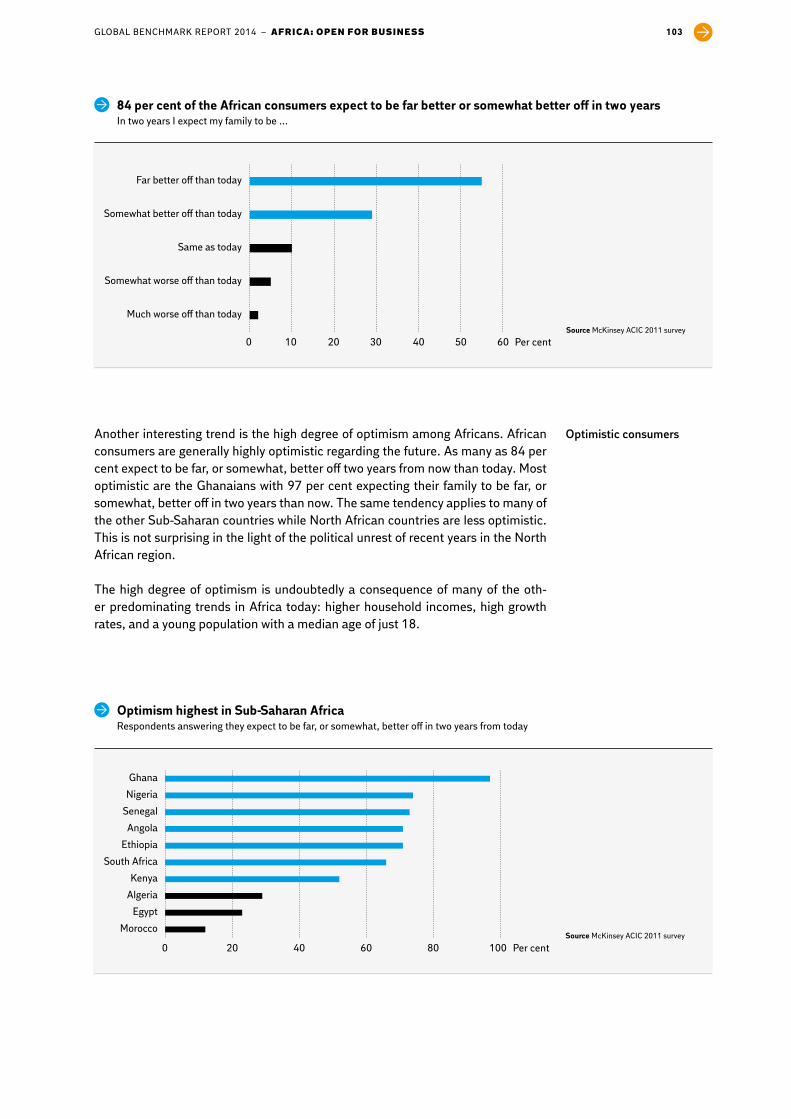
GLOBAL BENCHMARK REPORT 2014 – AFRICA: OPEN FOR BUSINESS 103
Another interesting trend is the high degree of optimism among Africans. African consumers are generally highly optimistic regarding the future. As many as 84 per cent expect to be far, or somewhat, better off two years from now than today. Most optimistic are the Ghanaians with 97 per cent expecting their family to be far, or somewhat, better off in two years than now. The same tendency applies to many of the other Sub-Saharan countries while North African countries are less optimistic. This is not surprising in the light of the political unrest of recent years in the North African region.
The high degree of optimism is undoubtedly a consequence of many of the oth-er predominating trends in Africa today: higher household incomes, high growth rates, and a young population with a median age of just 18.
Optimistic consumers
Per cent0 10 20 30 40 50 60
Much worse off than today
Somewhat worse off than today
Same as today
Somewhat better off than today
Far better off than today
84percentoftheAfricanconsumersexpecttobefarbetterorsomewhatbetteroffintwoyearsIn two years I expect my family to be …
Source McKinsey ACIC 2011 survey
Per cent0 20 40 60 80 100
Morocco
Egypt
Algeria
Kenya
South Africa
Ethiopia
Angola
Senegal
Nigeria
Ghana
OptimismhighestinSub-SaharanAfricaRespondents answering they expect to be far, or somewhat, better off in two years from today
SourceMcKinsey ACIC 2011 survey
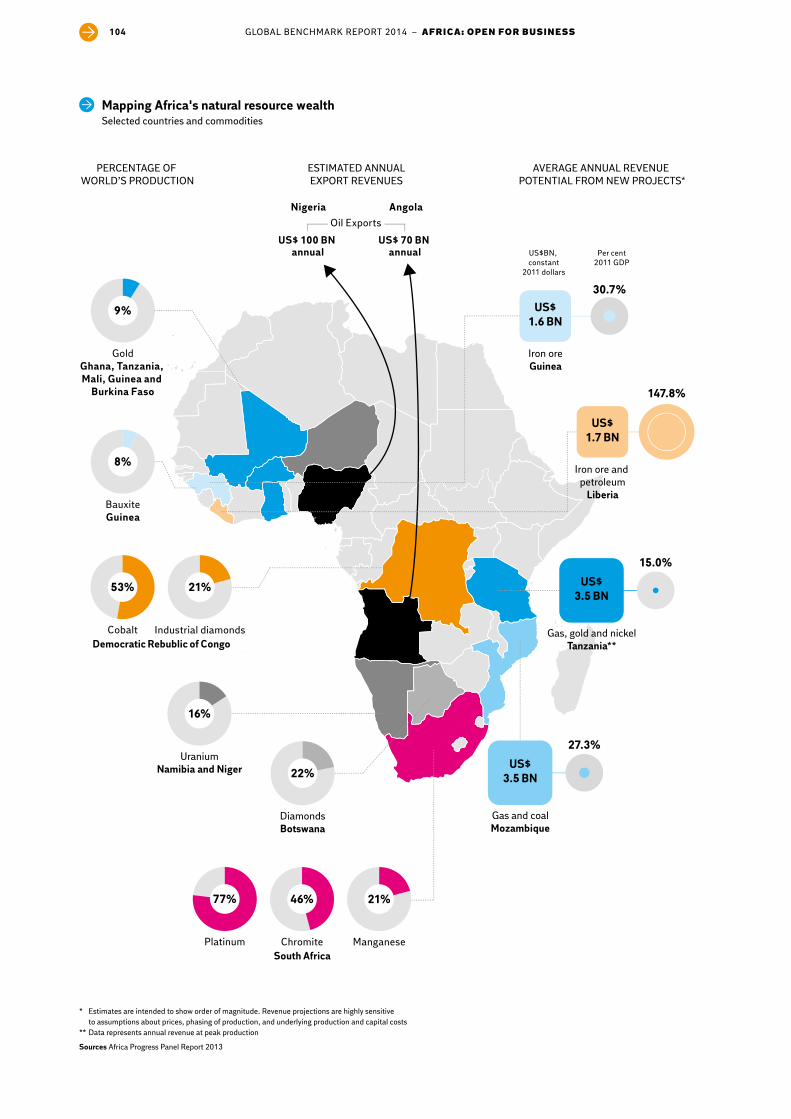
GLOBAL BENCHMARK REPORT 2014 – AFRICA: OPEN FOR BUSINESS104
PERCENTAGE OF WORLD’S PRODUCTION
ESTIMATED ANNUALEXPORT REVENUES
AVERAGE ANNUAL REVENUE POTENTIAL FROM NEW PROJECTS*
Nigeria AngolaOil Exports
US$ 100 BN annual
US$ 70 BN annual US$BN,
constant2011 dollars
Per cent2011 GDP
GoldGhana, Tanzania, Mali, Guinea and
Burkina Faso
9%
BauxiteGuinea
8%
Cobalt
53%
Industrial diamonds
21%
Democratic Rebublic of Congo
DiamondsBotswana
22%
Platinum
77%
Chromite
46%
South AfricaManganese
21%
US$3.5 BN
27.3%
Gas and coalMozambique
US$1.7 BN
147.8%
Iron ore and petroleum
Liberia
US$1.6 BN
30.7%
Iron oreGuinea
UraniumNamibia and Niger
16%
15.0%
Gas, gold and nickelTanzania**
US$3.5 BN
MappingAfrica'snaturalresourcewealthSelected countries and commodities
* Estimates are intended to show order of magnitude. Revenue projections are highly sensitive to assumptions about prices, phasing of production, and underlying production and capital costs** Data represents annual revenue at peak production
SourcesAfrica Progress Panel Report 2013

GLOBAL BENCHMARK REPORT 2014 – AFRICA: OPEN FOR BUSINESS 105
Major demand for African raw materialsWhile the steep increase in domestic demand is a relatively new factor, the exter-nal demand for African raw materials is a wellknown story. The new aspect is that demand does not only come from Europe, but also from growth nations including India and China, which are hungry for natural resources such as oil and minerals. This means that world market prices are expected to continue to and ensure higher income for the resourcerich African countries.
Africa's natural resource wealth is not just made up of oil, gas, and minerals. The world’s large growth countries demand increasing amounts of food; and if Af-rica is able to develop its agriculture, the continent has a major potential for fu-ture growth. Agriculture in Africa is unproductive compared with other parts of the world, and has not taken advantage of new knowledge and technology. At the same time, more than half of the world’s uncultivated farmland is in Africa. The exploita-tion of these resources contains major opportunities. Finally, there is only little pro-cessing of African foods in Africa, and there is a great potential in the development of a competitive food industry.
Major potential in African agriculture
60 per cent of the world’s uncultivated farmland is African.
0
1
2
3
4
5
6
20122007200219971992198719821977197219671962
Cereal yield (ton per hectare)
Africa
EU
Southeast Asia
Sub-Saharan Africa
SlowproductivitygrowthintheAfricanagriculturalsectorDevelopment in productivity of cereal yields per hectare from 1961-2012
Source World Bank

GLOBAL BENCHMARK REPORT 2014 – AFRICA: OPEN FOR BUSINESS106
Dramatic increase in inward FDIA third trend fuelling growth is inward foreign direct investment. There has been a pronounced increase in inward FDI in Africa since 2000. After stagnation in 2008, investment picked up again when it turned out that Africa was not seriously affect-ed by the financial crisis.
Apart from raw materials, the telecommunication and financial sectors are the most attractive targets for non-African investors. There is also some interest in the retail sector due to the advance of the African consumer markets.
China has been a particularly remarkable investor in Africa in recent years. Contra-ry to general perception, the majority of Chinese investment is not directed at the raw materials sector, but at the service sector. In addition, the Chinese have invest-ed in agriculture and industry; and this trend will presumably be intensified with the development of industrial estates aimed at attracting production companies, in countries such as Nigeria, Ghana, Kenya and South Africa.
It is difficult to calculate the total Chinese investment in Africa since not all FDI is officially registered. The figure on the next page, however, presents an estimate of the official and unofficial parts of Chinese FDI in Africa.
In recent years, China has channelled a lot of FDI to particularly Zimbabwe, Ghana and Ethiopia.
Trade between China and the African countries has also increased in recent years. China bought more than 10 per cent of Africa’s total exports in 2011, and this is 15 times as much as in 2001. In 2012, the overall trade between China and the Af-rican countries amounted to USD 198 billion, an increase of 20 per cent from the previous year.
Raw materials, telecommunication and the
financial sector
Major Chinese investment in the service sector
0
100
200
300
400
500
600
201220112010200920082007200620052004200320022001
USDbn
InvestmentflowsintoAfricaDevelopment in total inward FDI holding in Africa
SourceUNCTAD

GLOBAL BENCHMARK REPORT 2014 – AFRICA: OPEN FOR BUSINESS 107
Chinese FDI in Africa often generates negative news in the western world. Sto-ries speak of the overexploitation of African raw materials without sufficient compensation to the local populations, the use of Chinese labour rather than local labour, and a lack of respect for the environment and people in general.
If, however, you ask the individual Kenyan or Zambian of their perception of the Chinese, you would rarely get such a one-dimensional picture. First, the Chi-nese have built a visible infrastructure that has significantly improved the lives of many Africans and created a basis for further development. The western donors have rather focused on other forms of aid such as budgetary support, anti-corruption and the development of a state structure. While the donors be-lieve these types of development aid are more effective, they are less visible for the individual African citizen.
Secondly, the Chinese intention to trade with the African countries is highly appreciated. Many Africans feel that this approach is more dignified than the donor-recipient relations that exist with the western world. The aid from west-ern countries may be presented as donations, but there are also conditions and conditions attached.
An important point is that the African states increasingly demand trade and investment and, to a lesser extent, donations. This means that the western donors, including the EU, should not be afraid of integrating trade and aid – on the contrary. Naturally, European involvement should be based on European values with focus on cooperation and social and environmental sustainability.
CASE: Can Europe learn from China’s involvement in Africa?
0
10
20
30
40
50
60
2011201020092008200720062005200420032002200120000
50
100
150
200
250
300USDbn Number of projects
China has taken an interest in AfricaNumber of Chinese projects and their value in Africa
Source AidData
Number of projects
Official total value
Unofficial total value

GLOBAL BENCHMARK REPORT 2014 – AFRICA: OPEN FOR BUSINESS108
Conditions for African growthThe conditions, on which growth in Africa has been based in the past decade, have also changed significantly. In many cases, it is a self-reinforcing process under which improved conditions create the foundation for increased growth and vice versa.
Diversity characterises AfricaIn general, Africa is characterised by major economic and political differences among the countries. In South Africa, for example, the average income is ten times higher than in neighbouring Mozambique. Congo, Benin and Angola are among the group of countries in the world in which the World Bank assesses it is the hardest to do business. In contrast, the business climate in countries such as Ghana and Bot-swana is assessed to be better than in several European countries including Italy and the Czech Republic.
Some countries have business climates that are so favourable that they outrank many European and Asian countries. Many countries, however, are lagging behind with less business-friendly conditions, and African countries still dominate the low-est ranks on the World Bank’s Doing Business Index.
There are, however, indications that changes are underway. In 2011/2012, 98 per cent of the sub-Saharan countries implemented at least two reforms that benefit-ted the business climate.
Major differences across the continent
Several African countries range above BRIC in terms
of business climate
-10
0
10
20
30
40
50
60
100806040200
Economic growth (2008-2012), per cent
Business Climate (index 1-100)
EthiopiaGhana
Morocco
South Africa
EU-28 average
Algeria
Sudan
Côte d'Ivoire
Egypt
Nigeria
Angola
Congo, Dem
Kenya
Majordifferencesineconomy,growthandbusinessclimateComparison of economic growth, business climate and total size of economy
Note The size of the circle indicates the total size of the economy (GDP/PPP), 2012Source World Bank, IMF and DI calculations

GLOBAL BENCHMARK REPORT 2014 – AFRICA: OPEN FOR BUSINESS 109
Rwanda is the leading country in Africa in terms of reforms of the business climate. In the past few years, Rwanda has focused on improving its business climate in order to invite FDI and speed up the country’s industrial develop-ment. Over the past five years, the country has implemented 22 reforms aimed at making it easier to start a business, initiate exports, get access to financ-ing, and several other business-friendly approaches. In this way, Rwanda has moved from a rank as number 143 of 189 countries in 2009 to number 32 in the 2014 World Bank Doing Business Index. With this position, Rwanda has overtaken countries such as Belgium (36) and France (38).
Among other African countries struggling to improve their business climates, Burundi has implemented 16 reforms over the past five years and the Ivory Coast 9 reforms in the same period.
CASE: African countries compete for the favour of businesses
Population
Level of income
Industrialisation
Internationalisation
Business Climate
Size of population 2013, UN
GDP per capita, 2013, IMF
Value increment in production sector/GDP 2011, World Bank
Trade/GDP 2011, World Bank
World Bank’s Doing Business Index 2014
Nigeria Seychelles
EquatorialGuinea Malawi
Swaziland Sierra Leone
Lesotho Central African Republic
Mauritius Chad
DiversityischaracteristicoftheAfricancountries
93,000174 million
USD 215
USD 22,344
2.4%43.8%
35.6%154.6%
No. 189
No. 20
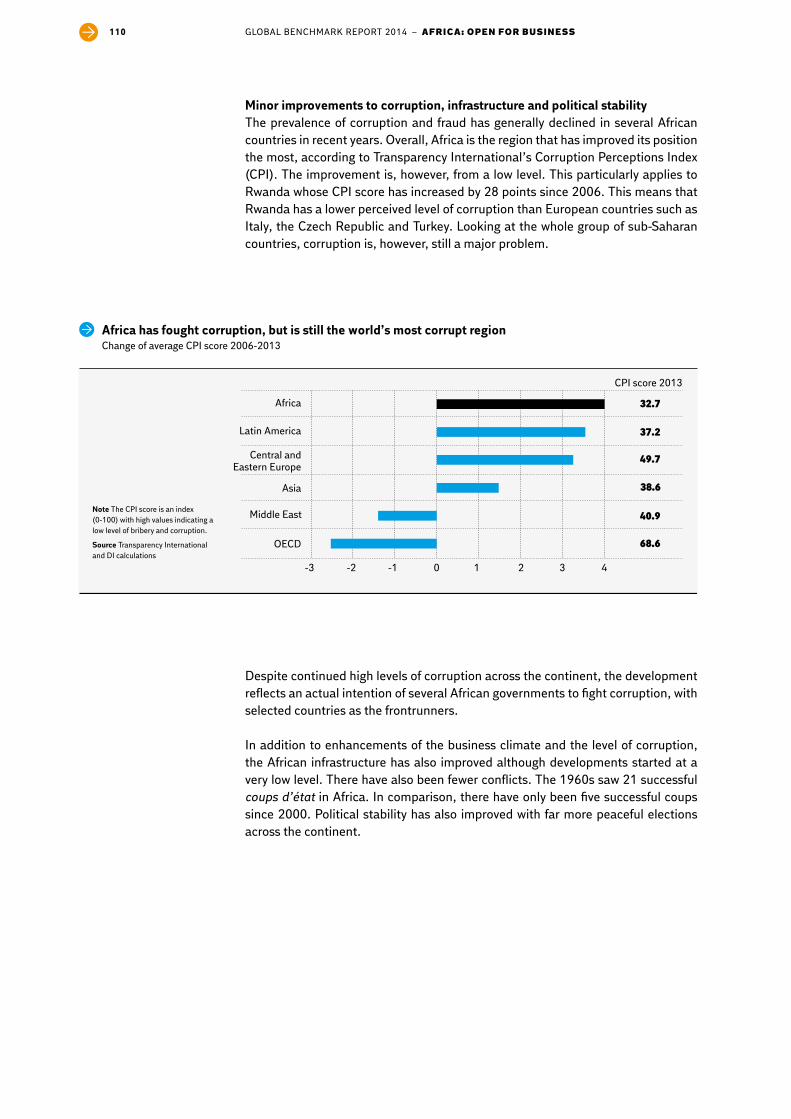
GLOBAL BENCHMARK REPORT 2014 – AFRICA: OPEN FOR BUSINESS110
Minorimprovementstocorruption,infrastructureandpoliticalstabilityThe prevalence of corruption and fraud has generally declined in several African countries in recent years. Overall, Africa is the region that has improved its position the most, according to Transparency International’s Corruption Perceptions Index (CPI). The improvement is, however, from a low level. This particularly applies to Rwanda whose CPI score has increased by 28 points since 2006. This means that Rwanda has a lower perceived level of corruption than European countries such as Italy, the Czech Republic and Turkey. Looking at the whole group of sub-Saharan countries, corruption is, however, still a major problem.
-3 -2 -1 0 1 2 3 4
OECD
Middle East
Asia
Central andEastern Europe
Latin America
Africa 32.7
37.2
49.7
38.6
40.9
68.6
CPI score 2013
Africahasfoughtcorruption,butisstilltheworld’smostcorruptregionChange of average CPI score 2006-2013
Note The CPI score is an index (0-100) with high values indicating a low level of bribery and corruption.
SourceTransparency International and DI calculations
Despite continued high levels of corruption across the continent, the development reflects an actual intention of several African governments to fight corruption, with selected countries as the frontrunners.
In addition to enhancements of the business climate and the level of corruption, the African infrastructure has also improved although developments started at a very low level. There have also been fewer conflicts. The 1960s saw 21 successful coups d’état in Africa. In comparison, there have only been five successful coups since 2000. Political stability has also improved with far more peaceful elections across the continent.

GLOBAL BENCHMARK REPORT 2014 – AFRICA: OPEN FOR BUSINESS 111
The many positive changes in Africa have also led to a distinct development of the African business community. Previously, only few African companies were visible outside their domestic market or in a position to measure up to the global elite of large corporations. This has changed with a number of African companies reaching a substantial size and experiencing constant high growth rates. Most large African companies still have their roots in South Africa, but companies of other nationalities are breathing down their necks. Many of the com-panies are primarily working in the natural resource sector, but in keeping with developments, more sectors are being represented.
CASE: The new African giants
0 10 20 30 40 50 60 70 80
De Beers Consolidated MinesMining
Imperial HoldingsIndustry
Vodacom GroupTelecommunication
Shoprite HoldingsTrade
EskomElectricity
The Bidvest GroupService, trade and distribution
MTN GroupTelecommunication
SasolEnergy and chemicals
SonangolOil
A.P. Moller-MaerskTransport and energy
SonatrachOil and gas
Annual revenue, USDbn
72.0
60.2
33.3
17.5
15.0
14.6
14.1
8.9
8.2
8.0
7.4
Note Revenue figures are from 2011 or 2011/2012.A.P. Moller-Maersk inserted as benchmark
SourceThe African Report and A.P. Moller – Maersk

GLOBAL BENCHMARK REPORT 2014 – AFRICA: OPEN FOR BUSINESS112
Theworld’syoungestcontinentMore than half of Africa’s population is below the age of 24, and the population is growing rapidly. By 2050, Africa will have a population of 2 billion and have over-taken both China and India. At the same time, Africa’s demographic development is such that the vast majority of people are of working age. Compared with other regions, the African countries also have few children and old people to support in this period.
This development offers a unique opportunity for economic and social develop-ment if the African countries succeed in creating a sufficient number of new jobs. You could say that Africa has the last, major labour resource in the world, which means that Africa has a unique potential as a major unexploited labour production location. If this opportunity is to be brought to fruition, and Africa is to become a real alternative to other production destinations, a further improvement is required in business climates, infrastructure, the level of education, and access to cross-border trading.
Threats to the African growth adventureMany of the trends that create opportunities for the African countries also have a downside. The large young population could turn out to be a ticking time bomb under the stability in countries unable to generate a sufficient number of new jobs. With many young people migrating to the cities hoping to find a job, the infrastruc-ture is under heavy pressure while this migration may also cause increasing prob-lems of slums with poor living conditions and social tensions.
At the same time, the authoritarian, repressive, undemocratic and generally inef-fective governments of many countries may halt the positive development. Unrest in one land can rapidly infect the neighbouring countries making it vital that all countries join the progress.
Inflation and exchange rate fluctuations are also risks affecting the African coun-tries. Although inflation following the increasing oil and food prices in 2008 has de-creased, it is still at a high level around 7 per cent. Earlier this year, Morgan Stanley included South Africa in the “Fragile Five” group along with Turkey, Brazil, India and Indonesia due to the risk connected to the exchange rate.
A unique opportunity for economic and social
development
Unemployed youth may create unrest
Many countries do not have inflation and exchange rate
developments under control
Africa’slabourforcewillbethelargestintheworldin2040Expected development of labour force 1950-2045
0
300
600
900
1,200
1,500
2045203520252015200519951985197519651955
Million
Africa
Europe
India
China
SourceUN - World Population Prospects

GLOBAL BENCHMARK REPORT 2014 – AFRICA: OPEN FOR BUSINESS 113
ThefutureofEU-AfricarelationsIn spite of Africa’s new partners such as China, India, Brazil, and South Korea, the EU is still a key actor. The EU continues to be Africa’s largest aid donor as well as the continent’s single largest trading partner.
In April 2014, the two partners will meet at the 4th Africa-EU Summit to carry out a high level political dialogue. The Summit will follow up on the Joint Africa-EU Strat-egy from 2007, which focuses on a number of issues. Prominent topics in the dis-cussions at the April summit are certain to be development aid and trade.
EU-Africa trade increasing – but at a slow pace The EU is still the single largest trading partner for Africa. There are, however, vast differences in how much the various EU member states trade with Africa. In gen-eral, the EU-15 countries export more to Africa than the EU-28 countries with Bel-gium and the Netherlands in the lead. In fact, the average exports per average citi-zen in Belgium have been more than 20 times higher than the average exports per average citizen in Poland over the past five years.
The EU is Africa's single largest trading partner
EU exports to Africa from the 28 member states have more than doubled in the pe-riod 2000 – 2012. Again, some member states are clearly in the lead – some build-ing on top of already large exports to Africa such as Portugal and the Netherlands, others starting from a lower level such as Poland.
0 200 400 600 800 1,000
EU28EU15
PolandSlovak Republic
RomaniaCyprus
LithuaniaCroatia
BulgariaHungary
Czech RepublicLatvia
GreeceDenmark
AustriaUnited Kingdom
SloveniaEstoniaIreland
GermanySpain
FinlandItaly
LuxembourgMalta
PortugalFrance
SwedenNetherlands
Belgium
GreatEuropeandifferencesinexportstoAfricaAverage exports to Africa 2008-2012 per average citizen 2008-2012, Euro
SourceEurostat and DI calculations

GLOBAL BENCHMARK REPORT 2014 – AFRICA: OPEN FOR BUSINESS114
Looking at imports of African goods to Europe, the picture is much the same. Total imports have more than doubled in the period, but import growth for the individual member states is highly diversified. The Netherlands and Portugal have increased their imports from Africa by a factor three to four during the period, as have Den-mark and Sweden, whereas Hungary’s imports from Africa have actually decreased in the same period.
0
100
200
300
400
500
600
2012201120102009200820072006200520042003200220012000
Austria
Belgium
Denmark
Spain
France
Netherlands
Poland
Portugal
EU15
0
100
200
300
400
500
600
2012201120102009200820072006200520042003200220012000
Sweden
Belgium
Denmark
France
United Kingdom
Hungary
Poland
Portugal
EU27
Austria
Belgium
Denmark
Spain
France
Netherlands
Poland
Portugal
EU15
EUexportstoAfricadoubledsince2000Index 100 = 2000
EUimportsfromAfricadoubledsince2000Index 100 = 2000
SourceEurostat and DI calculations
Source Eurostat and DI calculations

GLOBAL BENCHMARK REPORT 2014 – AFRICA: OPEN FOR BUSINESS 115
Deadline for EU-Africa trade negotiations approachingThe year 2014 marks a shift in trade policy between the EU and Africa. First, re-visions of the EU’s Generalised Scheme of Preferences (GSP), under which devel-oping country exporters face lower duties on exports to the EU, came into force as of January 1. The new GSP significantly reduces the number of beneficiaries with the aim of focusing on those countries that are most in need, i.e. the poorest coun-tries. Since a number of African countries are now counted as upper middle income countries, they will no longer qualify for GSP.
The EU and the different African regions are currently going through the final rounds of the negotiations of Economic Partnership Agreements (EPAs). The EPAs are aimed at promoting trade between the EU and the African regions and include initiatives related to trade development, sustainable growth and poverty reduction. Countries that no longer fall under GSP should therefore be covered by the EPAs in stead. However, reaching an agreement in the different regions and between the regions and the EU has proven to be complicated.
Economic Partnership Agreements to promote trade and support development
Sida, the Swedish aid agency, is currently working with a vision of making the pri-vate sector as close a partner to Swedish development aid as governments and civil society. Based on this objective, Sida has already developed a number of in-novations in development aid. One example of how the vision has been trans-formed into reality is a project with the Swedish bus and truck manufacturer Vol-vo. The two partners have established a programme to train car mechanics in Ethiopia, a country with large gaps in the supply of skilled labour. Sida also sup-ports the development and test of new products and services for the poor, private sector contributions to peace building, and a number of other interventions. With plans to integrate private sector aid into all its strategies, Sida will continue to de-velop new ideas for cooperation with business over the coming years.
Several other European countries have taken concrete steps and launched new strategies in 2013 for working closer with the business world:
> UK Secretary of State for International Development Justine Greening an-nounced three priorities for development: 1) Lowering barriers to trade and investment, 2) promoting entrepreneurs and businesspeople in developing countries, and 3) greater investment by UK businesses.
> In a new policy by the Netherlands, “A World to Gain”, three types of relation-ships will be pursued: “aid relationships” guided by altruism for fragile and post-conflict states, “trade relationships” with other wealthy countries, and “transition relationships”, which link aid with commercial policies and are guided by enlightened self-interest.
> The German government has an announced commitment to “strengthening the linkage between foreign trade and development cooperation”, and it is a priority for German businesses to play a stronger role in official development cooperation.
CASE: European donors are rethinking aid and trade

GLOBAL BENCHMARK REPORT 2014 – AFRICA: OPEN FOR BUSINESS116
The European Commission has set a deadline of October 1, 2014 for regions to conclude, sign, and start implementing the agreements. If the deadline is not met, African countries that are no longer eligible for GSP will lose some or all of their preferential access to the European market. Furthermore, the prospects of losing this access with serious consequences for exports and growth may prompt some countries to split from their regional grouping and instead negotiate individual trade deals with the EU.
Therefore, there is a strong interest from all sides in ensuring that the EPAs are fi-nalised before the deadline. However, it is still uncertain whether it will be possible to identify acceptable compromises with all regions before October 2014.
EU aid to AfricaBetween 2007 and 2012, the EU donated more than EUR 24 billion to Africa in of-ficial development assistance. In light of the great advances made by many African countries in recent years, and the African countries’ increased interest in trade and investments, the role of development aid is diminishing although, an amount of this scale is still significant, especially to some countries. Furthermore, while African leaders have put industrialisation high on their agendas over the past few years, the EU has largely maintained a focus on aid for social sectors.
In an effort to adjust to the changing circumstances, the EU developed the aid re-form strategy Agenda for Change in 2011. Alongside a focus on human rights, de-mocracy and governance, the Agenda for Change prioritises inclusive and sustain-able growth for human development, including job creation driven by the private sector.
Following this, the EU is trying to work closer with business and other private sec-tor partners. For many years, business was not considered a relevant partner in de-velopment. Rather, this was a field for public donors and civil society organisations only. Similarly, the issue of job creation was not considered as important as support to social sectors such as health and education.
However, the rise of several countries from developing country status to developed or emerging economies has proven that job creation driven by the private sector is inseparable from longterm development objectives. Without it, improving the health and education level of a country is unsustainable in the long run. Therefore, the role of job creation and the private sector as a partner in development have been added to the agenda of almost all important international development meet-ings and fora over the past few years.
EU aid to focus more on supporting inclusive and sustainable growth than
before

GLOBAL BENCHMARK REPORT 2014 – AFRICA: OPEN FOR BUSINESS 117
In September 2000 world leaders came together at United Nations Headquar-ters in New York to adopt the United Nations Millennium Declaration. They each committed their nations to a new global partnership to reduce extreme poverty by setting out a series of time-bound targets with a deadline of 2015 that have become known as the Millennium Development Goals.
1 Eradicate extreme poverty and hunger2 Achieve universal primary education3 Promote gender equality and empower women4 Reduce child mortality5 Improve maternal health6 Combat hiv/aids, malaria and other diseases7 Ensure environmental sustainability8 Global partnership for development
However, the reality is that not all MDGs will be reached before 2015. Also, the achievement of the MDGs has been uneven among and within countries. Africa is one of the continents that lags behind. In fact, Africa as a whole is off-track on five out of the eight MDGs.
While the deadline of 2015 draws closer, the world is debating what should come after the MDGs. The MDGs have been widely praised for their ability to make the world come together and collaborate on achieving these eight goals. However, the drawback of this is that focus has been pulled away from other important issues, which are not prominent among the eight goals.
One example is the issue of job creation. Even though it is an important part of fighting extreme poverty (MDG1), it has not received sufficient attention from donors. While some countries whose leaders have had a strong focus on job creation are well on track to reaching the goal (e.g. several countries in Asia), the unemployment rate remains much the same – or has increased – in many African countries.
This is one of the reasons why the High-level Panel on the Post-2015 Devel-opment Agenda has included the following as one of five transformative shifts that the post-2015 development agenda should build on:
Transformeconomiesforjobsandinclusivegrowth “Diversified economies, with equal opportunities for all, can unleash the dynamism that creates jobs and livelihoods … We should make it easier for people to invest, start-up a business, and trade”.
CASE: A new development agenda post-2015 – beyond the Millennium Development Goals
The EU is currently working on a new Communication, which will set the framework for strengthening the role of the private sector in achieving inclusive and sustaina-ble growth in developing countries in relation to EU development aid over the com-ing years. It is important that this Communication is adjusted to the current state of the world and flexible enough to be workable for several years to come. Further-more, the EU should look to some of the member countries for inspiration on how to work with the business sector.

GLOBAL BENCHMARK REPORT 2014 – AFRICA: OPEN FOR BUSINESS118
DI RECOMMENDSAfrican countries need growth, income, infrastructure, goods, and services. Euro-pean companies can offer all this. If development aid is structured in a way so that it leverages business activities in the best possible way, positive development effects would be enormous.
With that in mind, DI recommends the following:
Thepost-2015framework:
> As recommended by the High Level Panel on the post-2015 development agenda, the post-2015 framework should have a strong focus on transform-ing economies for jobs and inclusive growth. The entire post-2015 framework should be based on the notion that poverty is best fought by allowing people to lift themselves out of poverty through employment driven by the private sector.
Abetterenablingenvironmentforbusiness and job creation:
> The EU should consult with the European private sector to identify concrete barriers for trade with, and investment in developing countries. The EU should fight these barriers through financial support to business environment re-forms and by applying policy pressure on partner governments.
> The EU should strengthen the support to business membership organizations in developing countries to build their capacity and ensure that they can be a strong voice for businesses.
> The EU should strengthen the support to public private dialogue. This should be done through financial support and policy pressure on partner govern-ments.
Usingtradeasacatalystforjobcreationanddevelopment:
> The EU should support regional integration in Africa and support efforts to re-move trade barriers between African countries.
> The EU should speed up efforts to finalise Economic Partnership Agreements with all African regions.
Usingtheprivatesectoras“deliverychannel” for development:
> The EU should increasingly promote and support private sector engagement in the delivery of all types of services. In many sectors, there is an untapped potential for marketbased solutions that are more sustainable in the long run than conventional public service delivery mechanisms. The EU should further promote and support new innovative business models through new financial instruments and policy support.

GLOBAL BENCHMARK REPORT 2014 – AFRICA: OPEN FOR BUSINESS 119
Newfinancialinstrumentsforbusinessdevelopmentandjobcreation:
> The EU should develop relevant financial instruments (grants, loans, guaran-tees) enabling European companies to partner with companies in developing countries in order to develop capacity and transfer knowledge and technology.
> The EU should develop programmes that would create incentives for Europe-an companies to engage local SMEs in their value chain in connection with an investment in a developing country. This is particularly relevant for infrastruc-ture projects and mining projects, but also in other industries.
A better trained African workforce:
> There is a need for more and better vocational training and education in Af-rica. The EU should ensure the involvement of employers in the supply of all types of education in order to ensure relevance for businesses.
> The EU should establish incentives and financial instruments to support ap-prenticeships in connection with investments by European companies in de-veloping countries.
DI has been actively involved in Africa on behalf of, and in cooperation with Dan-ish businesses since the early 1990s. At that time, DI entered into dialogue with the Danish development aid agency, Danida, to discuss how the Danish business community could be involved in developing the business sectors of Danida’s part-ner countries. This marked the beginning of a long and constructive dialogue on the development of private sector programmes and various financing instruments, which are now an integrated part of Danish aid policy.
DI has also been active in the global dialogue on business and development on its own and as a member of organizations such as the European Business Council on Africa and the Mediterranean (EBCAM), BUSINESSEUROPE and Business and Industry Advisory Committee to the OECD (BIAC). Currently, DI's focus is on con-tributing to the dialogue on the post-2015 development agenda and the issue of development effectiveness.
Furthermore, since 1996, DI has provided consulting to more than 250 Danish companies on how to develop their businesses in numerous African countries. The generated expertise includes everything from discussion on initial considerations, across strategy development, to the implementation of new and innovative busi-ness concepts. This knowledge makes DI one of the organisations in Denmark with the most extensive experience in business development directed at the base of the income pyramid. For many years, DI has also been initiator and coorganiser of delegations to selected African countries.
Finally, since 1996, DI has been a close partner to more than 20 African business organisations. Through capacity building, DI has contributed to making the Af-rican business organisations professional voices for the business sector in their countries. DI has helped gather sister organisations in regional networks to pro-mote cooperation aimed at improving business conditions across national borders.
DI and Africa


121GLOBAL BENCHMARK REPORT 2014 – XXXX
Global Benchmark Report
123 METHODOLOGY, DEFINITIONS AND SOURCES
127 DESCRIPTION OF SOURCES
131 SUMMARY OF BENCHMARKS
137 INDEX TO BENCHMARKS

GLOBAL BENCHMARK REPORT 2014 – XXX

123GLOBAL BENCHMARK REPORT 2014 – METHODOLOGY, DEFINITIONS AND SOURCES
In this report we have benchmarked the global performance and general business conditions of 33 OECD member states in terms of their utilisation of the opportuni-ties offered by globalisation. All the members of the OECD except for Luxembourg are benchmarked.
The comparison is based on 87 measurable benchmarks divided into five pillars: Level of Globalisation, Productivity and Innovation, Qualified Labour, Public Econ-omy and Costs.
For each of the 87 benchmarks, the countries have been ranked according to how well they perform in international competition and whether they have the proper conditions and prerequisites to exploit the opportunities offered by globalisation.
Data for the BRIC countries (Brazil, Russia, India, and China) is included whenever available. With their high growth and increasing purchasing power, these countries have growing significance in global competition, and it is interesting to compare them with the OECD countries. They are not, however, included in rankings and overall results.
CalculationsofaverageMost charts show an OECD average and an average for eurozone countries. The av-erage is only calculated on the basis of countries for which data is available. Data is weighted for GDP at PPP using the following formula:
G = Averagei = 1,…,I. Number of OECD member states for which data existsgdpi = GDP for country iVi = Data value for country i
For a few benchmarks, for which data exists for less than two thirds of the OECD member states, an overall OECD average is not calculated. Similarly, there is no average for the eurozone in the few cases where data is unavailable for the largest euro-countries.
Benchmarking 33 OECD countries
87 benchmarks across five pillars
Data from BRIC countries
Average for the OECD and eurozone
METHODOLOGY, DEFINITIONS AND SOURCES

GLOBAL BENCHMARK REPORT 2014 – METHODOLOGY, DEFINITIONS AND SOURCES124
Within each of the five pillars of benchmarks, we have calculated the average rank of each country. Since data does not exist for all countries, this calculation requires several steps. First we calculate an average rank for each country based on the benchmarks that include data for the country in question. This average is used to create a relative ranking for the country in benchmarks for which there is no data for the country. Then we rank again and calculate an average ranking in the whole section.
In the few cases where a benchmark includes data for less than two thirds of the OECD countries, this benchmark will not be used in the calculation of the average for the pillar.
When two (or more) countries obtain the same ranking, they are shown with the same ranking corresponding to the highest possible ranking.
The summary on page 12 includes an overall average of the countries’ ranks in the five pillars called The Global Benchmark Report’s Competitiveness Index 2014. It is calculated as a simple average of the countries’ ranks in each of the five pillars. The purpose is to present an overall ranking of the OECD countries and not just their ranks in the individual pillars and benc
FundamentalpillarsofcompetitivenessLast year, the structure of the report was revised such that it is aligned with five fun-damental pillars of competitiveness. Together these five pillars constitute the foun-dation for creating open and prosperous nations capable of creating and sustaining growth and balance. Thus, the comparison is based on 87 benchmarks divided into Level of Globalisation, Productivity and Innovation, Qualified Labour, Public Econ-omy and Costs. Furthermore, it should be noted that the two benchmarks GDP growth and GDP per capita in the summary only contribute to the greater picture of globalisation and are not part of the global competitiveness index ranks.
ChoiceofdataandsourcesThe benchmarks have been selected with a view to providing as good a picture as possible of the countries’ competitiveness and general business conditions. Data has been drawn from internationally recognised sources and is internationally com-parable. The sources of each benchmark can be found in the figures and in the list of tables at the end of the report. See a list and a description of sources on the fol-lowing pages.
In cases where historical data is not available for each country, the last known value is used. Not all 33 OECD countries have been members of the OECD for the whole period. Israel, Chile, Estonia and Slovenia joined in 2010. There countries are nev-ertheless included in the period.
Benchmark 2.26 (Quality of electrical supply) is new in the Global Benchmark Re-port 2014.
Average rank of countries
Overall average
Revised structure
Recognised sources

GLOBAL BENCHMARK REPORT 2014 – METHODOLOGY, DEFINITIONS AND SOURCES 125
Because new data was not available during the preparation of the Global Bench-mark Report 2014, 2.12 (Growth expectations among entrepreneurs) and 2.13 (Entrepreneurial activity) are identical with the benchmarks of last year. Metadata for each individual benchmark has been prepared. It explains what the benchmark shows, why it is of relevance to a country's international competitive-ness and provides a thorough description of the source. Metadata is available in the PDF version of the Global Benchmark Report 2014, which can be downloaded from di.dk/gbr.
Further information

GLOBAL BENCHMARK REPORT 2014 – DESCRIPTION OF SOURCES126

GLOBAL BENCHMARK REPORT 2014 – DESCRIPTION OF SOURCES 127
DESCRIPTION OF SOURCES
The African Report is a magazine with focus on African economy and politics. Africa Progress Panel is a panel consisting of ten high level members with great insight in the African region. They are working towards a more sustainable and equitable development in Africa and publish an annual report with different topics. AidData is a research and innovation collaboration providing easy accessible in-formation on development financing. BLS (Bureau of Labour Statistics) is the US government’s premier research insti-tute focusing on labour market and economics. CarlsbergGroup is a Danish multinational brewery and the fourth largest brew-ery in the world.
Cato Institute is an independent think tank focusing on individual liberty, free markets, and peace. Cato issues an annual publication, Economic Freedom of the World, in cooperation with the Fraser Institute in Canada and more than 70 other think tanks from across the globe.
TheConfederationofDanishEmployers(DA) is the main organisation for 14 employer associations in the Danish private labour market in manufacturing, trade, transport, service and construction. DA regularly publishes statistics about international wage developments. The Conference Board is a global, independent business organisation. It publish-es financial reports and analyses business trends. Danida is Denmark’s official development agency and part of the Danish Ministry of Foreign Affairs. TheDanishMinistryofBusinessandGrowth seeks to improve the conditions for growth in Denmark. The Ministry conducts economic analyses and suggests policy initiatives in areas imperative to economic growth. The Ministry publishes an annual account of Danish competitiveness called “Denmark in the global econ-omy”. The Danish Ministry of Taxation consists of the Department and the Danish Tax Authority (SKAT). The Department works as staff function for the entire organisa-tion and holds the main leadership. SKAT collects income, business and corporate taxes.
www.theafricanreport.com
www.africaprogresspanel.org
www.aiddata.org
www.bls.gov
www.bls.gov
www.cato.org
intstat.da.dk
www.conference-board.org
www.um.dk/da/danida
www.evm.dk
www.skm.dk

GLOBAL BENCHMARK REPORT 2014 – DESCRIPTION OF SOURCES128
TheDanishPatentandTrademarkOffice issues patent and design rights, and registers trademarks and utility models.
Dell is a multinational computer technology company based in the United States. DI's company panel consists of 2,100 member companies. Four times per year, panel members respond to questionnaires on the company’s financial state, em-ployee situation and growth opportunities supplemented by various theme ques-tions.
TheEconomist is a weekly magazine with focus on economics, politics and finan-cial matters. Energiforskning.dk is a portal with information on research and development programmes in energy technology. TheEuropeanCommissionis the executive body of the European Union. Among other publications, the Commission publishes Taxation Trends in the EU.
TheEuropeanPatentOffice is the executive arm of the European Patent Organ-isation.
Eurostat is the statistical body of the European Commission, producing data for the European Union.
EVCA(European Private Equity and Venture Capital Association) is an associa-tion of European equity funds.
GEM(Global Entrepreneurship Monitor) is a non-profit academic research con-sortium focusing on international research on entrepreneurship.
IEA, the International Energy Agency, is an intergovernmental organisation, which acts as energy policy advisor to 28 member countries. The agency issues the an-nual Key World Energy Statistics publication with detailed data on the world’s en-ergy consumption.
IFU(Investment Fund for Developing Countries) is providing consulting and ven-ture capital for Danish companies wishing to start up business and partnerships in developing countries.
IMD, the International Institute for Management Development, located in Lau-sanne, Switzerland, is one of the world’s leading management schools. It is the publisher of the World Competitiveness Yearbook.
IMF, the International Monetary Fund is an organisation of 188 countries, working to promote global monetary cooperation.
InnovationUnionScoreboard tracks innovation performance in a broad range of countries. The publication is issued by PRO INNO Europe, which is an initiative under the European Commission’s Directorate-General for Enterprise and Indus-try. The objective of PRO INNO Europe is to be a venue for analyses related to innovation policies in Europe.
www.ip-center.dkpto.dk
www.dell.com
www.di.dk
www.economist.com
www.energiforskning.dk
www.ec.europa.eu
www.epo.org
www.epp.eurostat.ec.europa.eu
www.evca.eu
www.gemconsortium.org
www.iea.org
www.ifu.dk
www.imd.ch
www.imf.org
www.proinno-europe.eu

GLOBAL BENCHMARK REPORT 2014 – DESCRIPTION OF SOURCES 129
KPMG is a leading audit and consultancy firm represented in 146 countries. McKinseyGlobal Institute is the economic and business research unit of the American management and consulting company McKinsey & Company.
A.P.Moller–MaerskGroup is a Danish business conglomerate with activities primarily in transport and energy.
Morgan Stanley is an American multinational company providing financial ser-vices.
Nationalbanken (the National Bank of Denmark) is Denmark’s central bank.
OECD (Organisation for Economic Co-operation and Development), based in Paris, is an economically oriented organisation for cooperation between demo-cratic countries with a market economy. The OECD issues various publications and operates an online database.
OECD.stat is the statistics bank of the OECD. It has data from member states as well as non-member states.
PricewaterhouseCoopers (PwC) is a global audit and consultancy firm.
Produktion360 is an internet portal about management, organisation and tech-nological challenges in production, food and life science companies. The IT com-pany Columbus is behind the initiative.
Siemens is a German multinational engineering and electronics company. Statistics Denmark is the official statistical bureau of Denmark.
Transparency International is an organisation working to eradicate corruption.
UN(United Nations) is a world organisation consisting of 193 member countries. The organisation plays an important role in global development politics, environ-mental collaboration, the fight for human rights and negation of peace. UNCTAD (United Nations Conference on Trade and Development) is a part of UN that is responsible of the development and focuses on trade. WDI (World Development Indicators) is the World Bank’s bank of statistics and consists of data for development countries.
WEF(World Economic Forum) is an independent international organisation com-mitted to improving the situation in the world by engaging leaders in partnerships to shape global, regional, and industrial agendas. WEF publishes the annual Glob-al Competitiveness Report.
TheWorldBank’s“Doing Business” report provides a status of the conditions for operating a business in 189 countries. World Bank is an international bank working for reconstruction and develop-ment. The objective is to fight poverty by financing states.
www.kpmg.com/Global
www.mckinsey.com
www.maersk.com
www.morganstanley.com
www.nationalbanken.dk
www.oecd.org
www.stats.oecd.org
www.pwc.com
www.p360.dk
www.siemens.com
www.dst.dk
www.transparency.org
www.unctad.org
www.data.worldbank.org
www.weforum.org
www.doingbusiness.org
www.worldbank.org

GLOBAL BENCHMARK REPORT 2014 – XXX
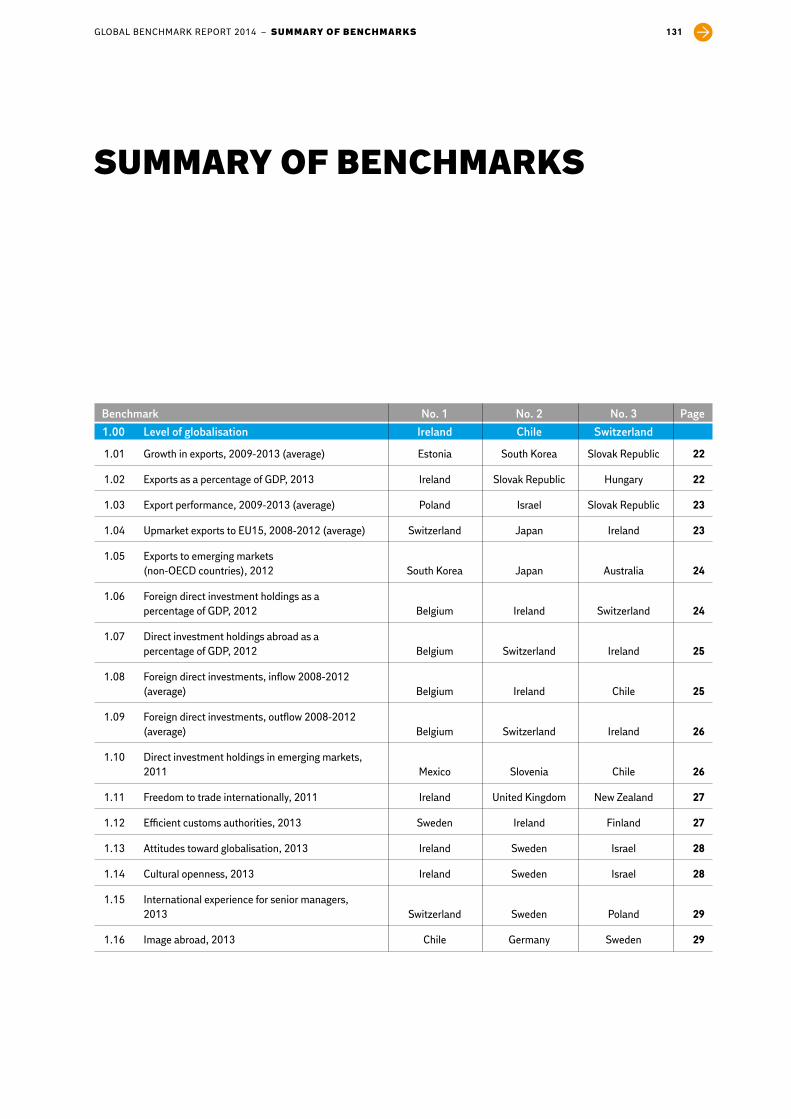
GLOBAL BENCHMARK REPORT 2014 – SUMMARY OF BENCHMARKS 131
SUMMARY OF BENCHMARKS
Benchmark No. 1 No. 2 No. 3 Page
1.00 Level of globalisation Ireland Chile Switzerland
1.01 Growth in exports, 2009-2013 (average) Estonia South Korea Slovak Republic 22
1.02 Exports as a percentage of GDP, 2013 Ireland Slovak Republic Hungary 22
1.03 Export performance, 2009-2013 (average) Poland Israel Slovak Republic 23
1.04 Upmarket exports to EU15, 2008-2012 (average) Switzerland Japan Ireland 23
1.05 Exports to emerging markets (non-OECD countries), 2012 South Korea Japan Australia 24
1.06 Foreign direct investment holdings as a percentage of GDP, 2012 Belgium Ireland Switzerland 24
1.07 Direct investment holdings abroad as a percentage of GDP, 2012 Belgium Switzerland Ireland 25
1.08 Foreign direct investments, inflow 2008-2012 (average) Belgium Ireland Chile 25
1.09 Foreign direct investments, outflow 2008-2012 (average) Belgium Switzerland Ireland 26
1.10 Direct investment holdings in emerging markets, 2011 Mexico Slovenia Chile 26
1.11 Freedom to trade internationally, 2011 Ireland United Kingdom New Zealand 27
1.12 Efficient customs authorities, 2013 Sweden Ireland Finland 27
1.13 Attitudes toward globalisation, 2013 Ireland Sweden Israel 28
1.14 Cultural openness, 2013 Ireland Sweden Israel 28
1.15 International experience for senior managers, 2013 Switzerland Sweden Poland 29
1.16 Image abroad, 2013 Chile Germany Sweden 29

GLOBAL BENCHMARK REPORT 2014 – SUMMARY OF BENCHMARKS132
Benchmark No. 1 No. 2 No. 3 Page
2.00 Productivity and innovation Switzerland Sweden Netherlands
2.01 Investment as a percentage of GDP, 2013 Australia Estonia South Korea 32
2.02 Public sector investments as a percentage of GDP, 2011 Poland South Korea Estonia 32
2.03 Labour productivity, 2013 Norway United States Belgium 33
2.04 Growth in labour productivity, 2009-2013 (average) Poland Ireland South Korea 33
2.05 Total research and development expenditure as a percentage of GDP, 2011 Israel South Korea Finland 34
2.06 Public expenditure on research and development as a percentage of GDP, 2011 Iceland Austria South Korea 34
2.07 Quality of scientific research institutions, 2012-2013 (average) Israel Switzerland United Kingdom 35
2.08 University/industry research collaboration, 2012-2013 (average) Switzerland Finland United States 35
2.09 European patent applications, 2012 Switzerland Sweden Finland 36
2.10 Triadic patent families, 2011 Japan Switzerland Sweden 36
2.11 Innovation performance, 2012 Switzerland Sweden Germany 37
2.12 Growth expectations among entrepreneurs, 2012 Turkey Australia Chile 37
2.13 Entrepreneurial activity, 2012 Chile Estonia United States 38
2.14 Framework conditions for entrepreneurship, 2013 New Zealand Canada Australia 38
2.15 Average time to complete the procedure of closing a business, 2013 Ireland Japan Canada 39
2.16 Venture capital investments as a percentage of GDP, 2009-2012 (average) Denmark Switzerland Sweden 39
2.17 Gazelle enterprises, 2010 Czech Republic Estonia France 40
2.18 Mentality of society supporting competitiveness, 2013 United States Switzerland Israel 40
2.19 Flexibility and adaptability, 2013 Ireland Israel Poland 41
2.20 Fixed broadband subscribers, 2012 Switzerland Nederlands Denmark 41
2.21 E-commerce, 2012 Iceland Norway Sweden 42
2.22 Economic freedom, 2011 New Zealand Switzerland Finland 42
2.23 Burden of government regulation, 2012-2013 (average) Finland Estonia New Zealand 43
2.24 Quality of infrastructure, 2012-2013 (average) Nederlands Finland France 43
2.25 Energy intensity, 2011 Ireland Switzerland United Kingdom 44
2.26 Quality of electricity supply, 2012-2013 (average) Switzerland Netherlands Austria 44

GLOBAL BENCHMARK REPORT 2014 – SUMMARY OF BENCHMARKS 133
Benchmark No. 1 No. 2 No. 3 Page
3.00 Qualified labour Canada Switzerland South Korea
3.01 Labour market participation rate, 2012 Iceland Switzerland Sweden 48
3.02 Labour market participation rate for the 55 to 64-year-olds, 2012 Iceland Sweden New Zealand 48
3.03 Unemployment, 2013 South Korea Norway Japan 49
3.04 Average annual working hours per employed person, 2012 Mexico South Korea Greece 49
3.05 Share of employees with tertiary education in the private sector, 2012 Ireland Belgium Finland 50
3.06 Labour regulations, 2013 Iceland Denmark Switzerland 50
3.07 Job mobility, 2012 Chile South Korea Turkey 51
3.08 Employee motivation, 2013 Denmark Switzerland Ireland 51
3.09 Financial incentives to work, 2011 Australia Greece Turkey 52
3.10 Equal opportunities, 2013 Norway Sweden Canada 52
3.11 Expenditure on educational institutions as a percentage of GDP, 2010 South Korea United States Norway 53
3.12 Expenditure on tertiary education as a percentage of GDP, 2010 United States Canada South Korea 53
3.13 Intended instruction time in public institutions per year for 7 to 14-year-olds (average), 2011 Chile Australia France 54
3.14 OECD Pisa study, Reading skills, 2012 Japan South Korea Finland 54
3.15 OECD Pisa study, Mathematical qualifications, 2012 South Korea Japan Switzerland 55
3.16 OECD Pisa study, Scientific qualifications, 2012 Japan Finland Estonia 55
3.17 Share of 25 to 34-year-olds with upper secondary education, 2011 South Korea Czech Republic Slovak Republic 56
3.18 Share of 25 to 34-year-olds with tertiary education, 2011 South Korea Japan Canada 56
3.19 Age by completion of tertiary education, 2011 Belgium Nederlands Turkey 57
3.20 Share of graduates by subject, 2011 South Korea Germany Greece 57
3.21 Personal gain on further education, 2009 United States Ireland Czech Republic 58
3.22 Share of foreign students at tertiary education institutions, 2011 New Zealand Switzerland Australia 58
3.23 Attractive business environment for foreign highly skilled people, 2013 Switzerland United States Australia 59
3.24 Completed PhDs in science and engineering, 2011 Switzerland Germany United Kingdom 59
3.25 Adult participation in education and learning, 2012 Denmark Switzerland IcelandB 6060

GLOBAL BENCHMARK REPORT 2014 – SUMMARY OF BENCHMARKS134
Page
Benchmark No. 1 No. 2 No. 3 Page
4.00 Public economy Switzerland South Korea Estonia
4.01 Public spending as a percentage of GDP, 2012 Switzerland Mexico Chile 64
4.02 Public primary expenditure as a percentage of GDP, 2011 South Korea Switzerland Turkey 64
4.03 Structural budget balance, 2013 South Korea Greece Italy 65
4.04 Public gross debt as a percentage of GDP, 2013 Estonia Norway Australia 65
4.05 Public net debt as a percentage of GDP, 2013 Norway Finland South Korea 66
4.06 Growth expenditures as percentage of primary expenses, 2011 South Korea Poland Switzerland 66
4.07 Government-funded research, development and demonstration in energy technologies, 2012 Finland Hungary Canada 67
4.08 Government purchase of goods and services, 2012 United Kingdom Finland Iceland 67
4.09 E-government usage by enterprises, 2013 Finland Iceland France 68
4.10 Bribery and corruption, 2013 Denmark New Zealand Finland 68
Benchmark No. 1 No. 2 No. 3 Page
5.00 Costs Switzerland Chile Poland
5.01 Total tax revenue as a percentage of GDP, 2012 Mexico Chile United States 72
5.02 Marginal tax rate for medium wage earners, including indirect taxes, 2012 Chile Mexico Switzerland 72
5.03 Marginal tax rate for high wage earners, including indirect taxes, 2012 Chile South Korea Mexico 73
5.04 Nominal corporate tax rate, 2013 Ireland Slovenia Poland 73
5.05 Actual corporate tax rate, 2012 Belgium Canada Slovak Republic 74
5.06 Annual inflation, 2009-2013 (average) Japan Switzerland Ireland 74
5.07 Access to capital markets, 2013 Poland Switzerland Sweden 75
5.08 Hourly compensation costs in manufacturing, 2012 Poland Hungary Slovak Republic 75
5.09 Annual growth in unit labour costs, 2009-2013 (average) Greece Ireland Spain 76
5.10 Yield of environmental taxes as a percentage of GDP, 2011 Spain France Slovak Republic 76

135GLOBAL BENCHMARK REPORT 2014

GLOBAL BENCHMARK REPORT 2014 – INDEX TO BENCHMARKS136

GLOBAL BENCHMARK REPORT 2014 – INDEX TO BENCHMARKS 137
INDEX TO BENCHMARKS
Adult participation in education and learning > 3.25 60
Attractive business environment for foreign highly skilled people > 3.23 59
Bribery and corruption > 4.10 68
Broadband subscribers, fixed > 2.20 41
Budget balance, structural > 4.03 65
Burden of government regulation > 2.23 43
Capital markets, access to > 5.07 75
Closing a business, average time to complete the procedure of > 2.15 39
Compensation costs in manufacturing, hourly > 5.08 75
Corporate tax rate, actual > 5.05 74
Corporate tax rate, nominal > 5.04 73
Cultural openness > 1.14 28
Customs authorities, efficient > 1.12 27
Direct investment holding abroad as a percentage of GDP > 1.07 25
Direct investment holding in emerging markets > 1.10 26
E-commerce > 2.21 42
Economic freedom > 2.22 42
E-government usage by enterprises > 4.09 68
Electricity supply, quality > 2.26 44
Employee motivation > 3.08 51
Employees in the private sector, share with tertiary education > 3.05 50
Energy intensity > 2.25 44
Entrepreneurial activity > 2.13 38
Environmental taxes as a percentage of GDP, yield of > 5.10 76
Equal opportunities > 3.10 52
Expenditure on educational institutions as a percentage of GDP > 3.11 53
Expenditure on tertiary education as a percentage of GDP > 3.12 53
A
B
C
D
E

GLOBAL BENCHMARK REPORT 2014 – INDEX TO BENCHMARKS138
Export performance > 1.03 23
Exports as a percentage of GDP > 1.02 22
Exports to emerging markets (non-OECD countries) > 1.05 24
Exports, growth in > 1.01 22
Financial incentives to work > 3.09 52
Flexibility and adaptability > 2.19 41
Foreign direct investment holdings as a percentage of GDP > 1.06 24
Foreign direct investments, inflow (average) > 1.08 25
Foreign direct investments, outflow (average) > 1.09 26
Foreign students at tertiary education institutions, share of > 3.22 58
Framework conditions, for entrepreneurship > 2.14 38
Freedom to trade internationally > 1.11 27
Gazelle enterprises > 2.17 40
Globalisation, attitudes toward > 1.13 28
Government purchase of goods and services > 4.08 67
Growth expectations among entrepreneurs > 2.12 37
Growth expenditures as a percentage of primary expenditure > 4.06 66
Hours worked per person in employment, annual average > 3.04 49
Image abroad > 1.16 29
Inflation, annual > 5.06 74
Infrastructure, quality > 2.24 43
Innovation performance > 2.11 37
Intended instruction time in public institutions per year for 7 to 14-year-olds > 3.13 54
International experience for senior managers > 1.15 29
Investments as a percentage of GDP > 2.01 32
Job mobility > 3.07 51
Labour market participation rate > 3.01 48
Labour market participation rate for 55 to 64-year-olds > 3.02 48
Labour productivity > 2.03 33
Labour productivity, growth in > 2.04 33
Labour regulations > 3.06 50
Marginal tax rate for high wage earners, including indirect taxes > 5.03 73
Marginal tax rate for medium wage earners, including indirect taxes > 5.02 72
Mathematical qualifications, OECD's PISA Study > 3.15 55
Mentality of society supporting competitiveness > 2.18 40
E
F
G
H
I
J
L
M

GLOBAL BENCHMARK REPORT 2014 – INDEX TO BENCHMARKS 139
Patent applications, European > 2.09 36
Patent families, triadic > 2.10 36
Personal gain on further education > 3.21 58
PhDs in science and engineering, completed > 3.24 59
Public gross debt as a percentage of GDP > 4.04 65
Public net debt as a percentage of GDP > 4.05 66
Public primary expenditure as a percent of GDP > 4.02 64
Public sector investments as a percentage of GDP > 2.02 32
Public spending as a percentage of GDP > 4.01 64
Reading skills, OECD's PISA Study > 3.14 54
Research and development expenditures as a percentage of GDP, total > 2.05 34
Research and development, public expenditure as a percentage of GDP > 2.06 34
Research, development and demonstration in energy technologies, publicly funded > 4.07 67
Scientific qualifications, OECD's PISA Study > 3.16 55
Scientific research institutions, quality of > 2.07 35
Tax revenue as a percentage of GDP, total > 5.01 72
Tertiary education, age by completion of > 3.19 57
Tertiary education, share of 25 to 34-year-olds with > 3.18 56
Tertiary education, share of graduates by subject > 3.20 57
Unemployment > 3.03 49
Unit labour costs, annual growth in > 5.09 76
University/industry research collaboration > 2.08 35
Upmarket exports to EU15 > 1.04 23
Upper secondary education, share of 25 to 34-year-olds with > 3.17 56
Venture capital investments as a percentage of GDP > 2.16 39
P
R
S
T
U
V

Including themes on global investment fl ows and Africa
The conditions for doing business in the global economy are con-stantly changing – presenting new challenges and opportunities.
For the tenth consecutive year, the Global Benchmark Report 2014 examines how the global challenge is met in the OECD countries. The assessment is based on 87 benchmarks across fi ve pillars com-prising Level of globalisation, Productivity and innovation, Qualifi ed labour, Public economy and Costs. Together these pillars constitute the foundation for creating open and prosperous nations capable of creating and sustaining growth and balance. The report highlights strengths and weaknesses of each OECD country in facing interna-tional competition, providing a picture of each country’s ability to de-velop attrac tive business environments and utilise opportunities pre-sented by globalisation.
For further information on the Global Benchmark Report see di.dk/gbr. The website provides a unique opportunity to download a PDF-version of the report where you can read more about how the in-dividual benchmarks are prepared and why they are relevant in inter-national competition. All graphs and fi gures are available for down-load intended for your own presentations and analyses.
DI – Confederation of Danish Industry H.C. Andersens Boulevard 18 1787 Copenhagen V Phone 3377 3377 [email protected] di.dk
GLO
BA
L BEN
CH
MA
RK
REP
OR
TR
eady for globalisation?D
I AN
ALY
SIS
DI ANALYSIS
Ready for globalisation?
GLOBALBENCHMARKREPORT
Ready for globalisation?