Embed Size (px)
Citation preview
Global & MENA FintechSector Perspective
November 2020
Prepared by:
Jad SalameMohamed IbrahimSaeb NahasRamzi MneimnehAhmad Tuffaha
Phoenician Invest Ltd. (a subsidiary of More Capital)DD-16-118-005, 16, Wework, Hub71, Al Khatem TowerADGM Square, Al Maryah Island Abu Dhabi, United Arab Emirates
Tel: +971 50 671 9088Email: [email protected]
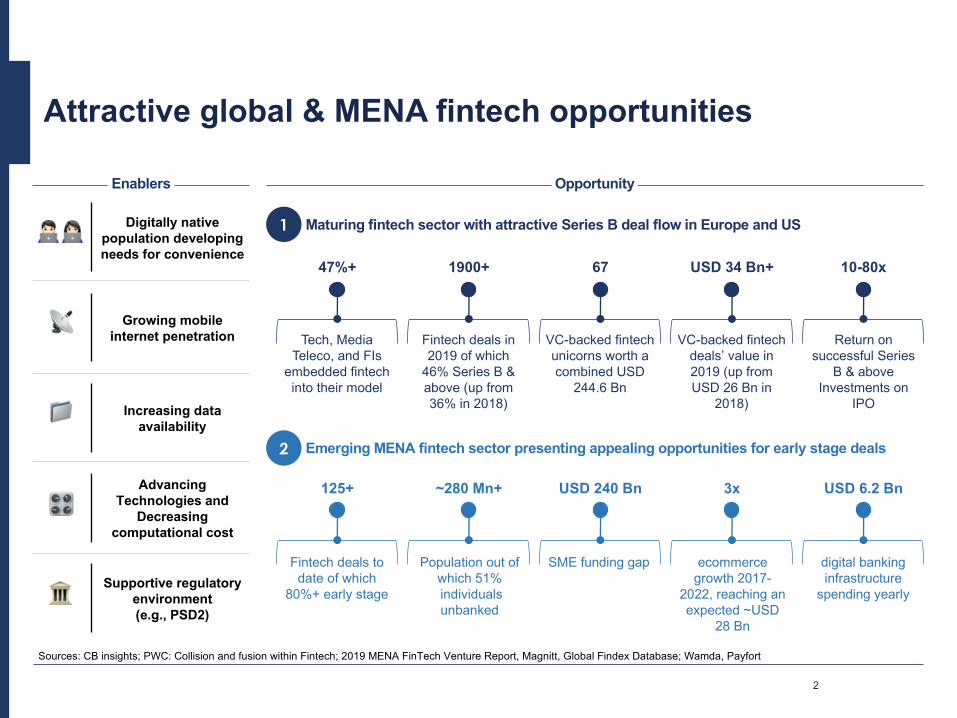
Attractive global & MENA fintech opportunities
Population out of which 51%individuals unbanked
SME funding gap ecommerce growth 2017-
2022, reaching an expected ~USD
28 Bn
Fintech deals to date of which
80%+ early stage
digital banking infrastructure
spending yearly
Emerging MENA fintech sector presenting appealing opportunities for early stage deals
Maturing fintech sector with attractive Series B deal flow in Europe and US
Return on successful Series
B & above Investments on
IPO
VC-backed fintech unicorns worth a combined USD
244.6 Bn
VC-backed fintech deals’ value in 2019 (up from USD 26 Bn in
2018)
Fintech deals in 2019 of which
46% Series B & above (up from 36% in 2018)
Tech, Media Teleco, and FIs
embedded fintech into their model
Digitally native population developing needs for convenience
Growing mobile internet penetration
Increasing data availability
Advancing Technologies and
Decreasing computational cost
Supportive regulatory environment (e.g., PSD2)
Enablers
10-80xUSD 34 Bn+671900+47%+
USD 6.2 Bn3xUSD 240 Bn~280 Mn+125+
Opportunity
Sources: CB insights; PWC: Collision and fusion within Fintech; 2019 MENA FinTech Venture Report, Magnitt, Global Findex Database; Wamda, Payfort
1
2
2
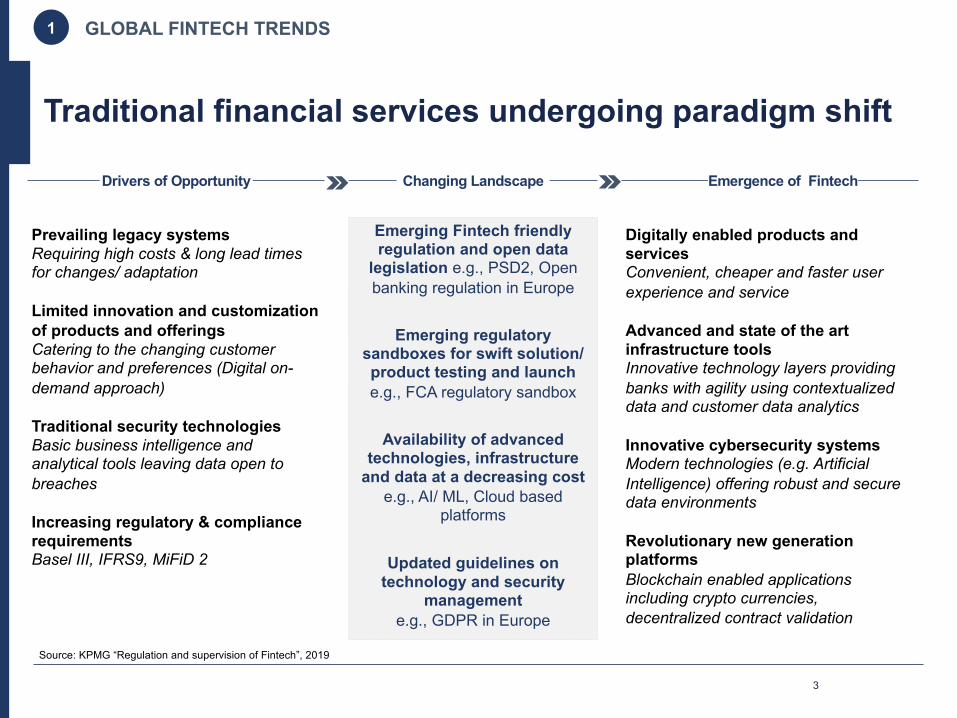
Traditional financial services undergoing paradigm shift
Source: KPMG “Regulation and supervision of Fintech”, 2019
1 GLOBAL FINTECH TRENDS
Prevailing legacy systemsRequiring high costs & long lead times for changes/ adaptation
Limited innovation and customization of products and offeringsCatering to the changing customer behavior and preferences (Digital on-demand approach)
Traditional security technologies Basic business intelligence and analytical tools leaving data open to breaches
Increasing regulatory & compliance requirements Basel III, IFRS9, MiFiD 2
Drivers of Opportunity Emergence of Fintech
Emerging Fintech friendly regulation and open data
legislation e.g., PSD2, Open banking regulation in Europe
Changing Landscape
Emerging regulatory sandboxes for swift solution/ product testing and launch e.g., FCA regulatory sandbox
Availability of advanced technologies, infrastructure
and data at a decreasing cost e.g., AI/ ML, Cloud based
platforms
Updated guidelines on technology and security
management e.g., GDPR in Europe
Digitally enabled products and services Convenient, cheaper and faster user experience and service
Advanced and state of the art infrastructure toolsInnovative technology layers providing banks with agility using contextualized data and customer data analytics
Innovative cybersecurity systemsModern technologies (e.g. Artificial Intelligence) offering robust and secure data environments
Revolutionary new generation platforms Blockchain enabled applications including crypto currencies, decentralized contract validation
3
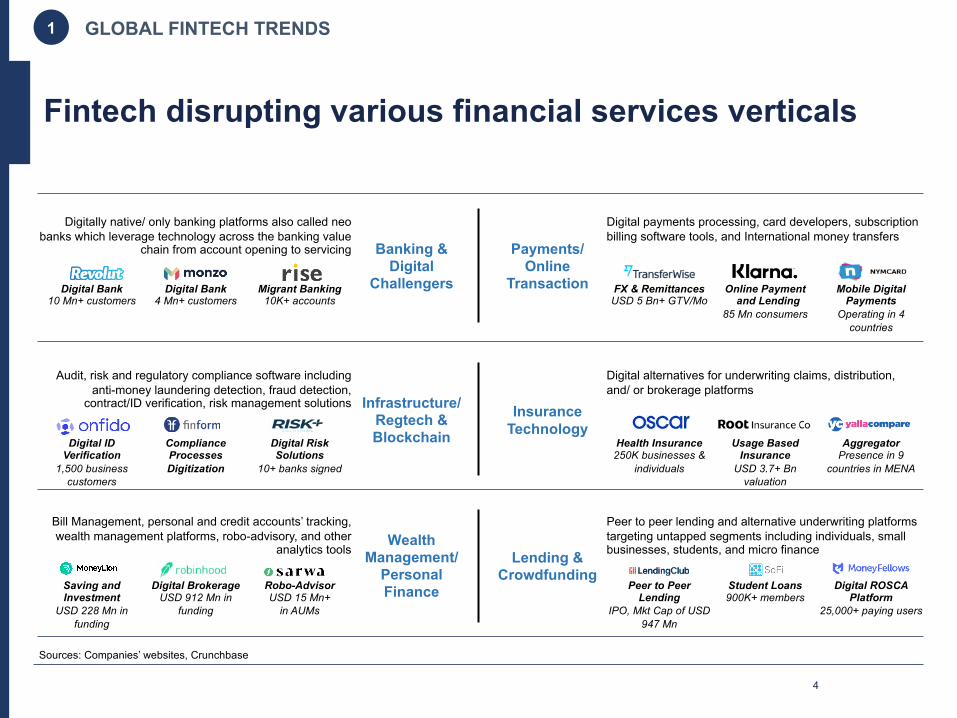
Fintech disrupting various financial services verticals
Digitally native/ only banking platforms also called neo banks which leverage technology across the banking value
chain from account opening to servicing
Audit, risk and regulatory compliance software including anti-money laundering detection, fraud detection,
contract/ID verification, risk management solutions
Bill Management, personal and credit accounts’ tracking, wealth management platforms, robo-advisory, and other
analytics tools
Digital payments processing, card developers, subscription billing software tools, and International money transfers
Digital alternatives for underwriting claims, distribution, and/ or brokerage platforms
Peer to peer lending and alternative underwriting platforms targeting untapped segments including individuals, small businesses, students, and micro financeLending &
Crowdfunding
Wealth Management/
Personal Finance
Insurance Technology
Infrastructure/ Regtech & Blockchain
Payments/ Online
Transaction
Banking & Digital
ChallengersDigital Bank10 Mn+ customers
Digital Bank4 Mn+ customers
FX & RemittancesUSD 5 Bn+ GTV/Mo
Online Paymentand Lending
85 Mn consumers
Health Insurance250K businesses &
individuals
Usage Based Insurance
USD 3.7+ Bnvaluation
Digital ID Verification
1,500 business customers
Compliance Processes Digitization
Student Loans900K+ members
Peer to Peer Lending
IPO, Mkt Cap of USD 947 Mn
Saving and Investment
USD 228 Mn in funding
Digital BrokerageUSD 912 Mn in
funding
Digital ROSCA Platform
25,000+ paying users
Migrant Banking10K+ accounts
Robo-AdvisorUSD 15 Mn+
in AUMs
AggregatorPresence in 9
countries in MENA
Mobile Digital Payments
Operating in 4 countries
Digital Risk Solutions
10+ banks signed
Sources: Companies’ websites, Crunchbase
1 GLOBAL FINTECH TRENDS
4
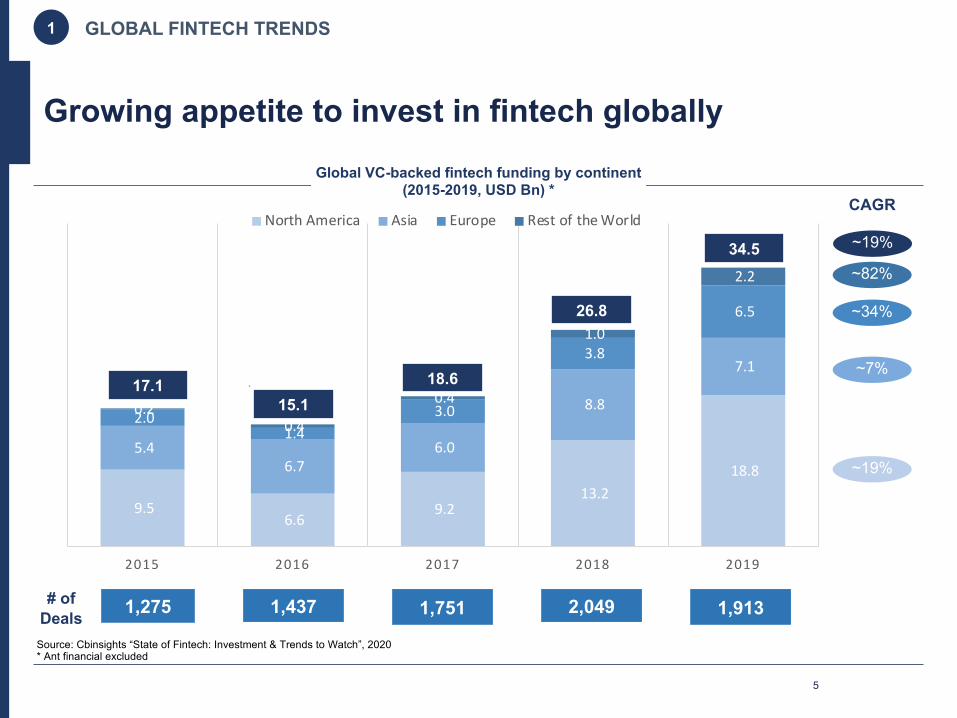
Growing appetite to invest in fintech globally
9.5 6.6
9.2 13.2
18.8 5.4
6.7 6.0
8.8
7.1
2.0 1.4
3.0
3.8
6.5
0.2 0.4
0.4
1.0
2.2
2015 2016 2017 2018 2019
North America Asia Europe Rest of the World
# of Deals 1,275 1,437 1,751
~19%
2,049 1,913
17.1
26.8
18.615.1
34.5
Source: Cbinsights “State of Fintech: Investment & Trends to Watch”, 2020* Ant financial excluded
Global VC-backed fintech funding by continent(2015-2019, USD Bn) *
1 GLOBAL FINTECH TRENDS
~82%
CAGR
~34%
~7%
~19%
5
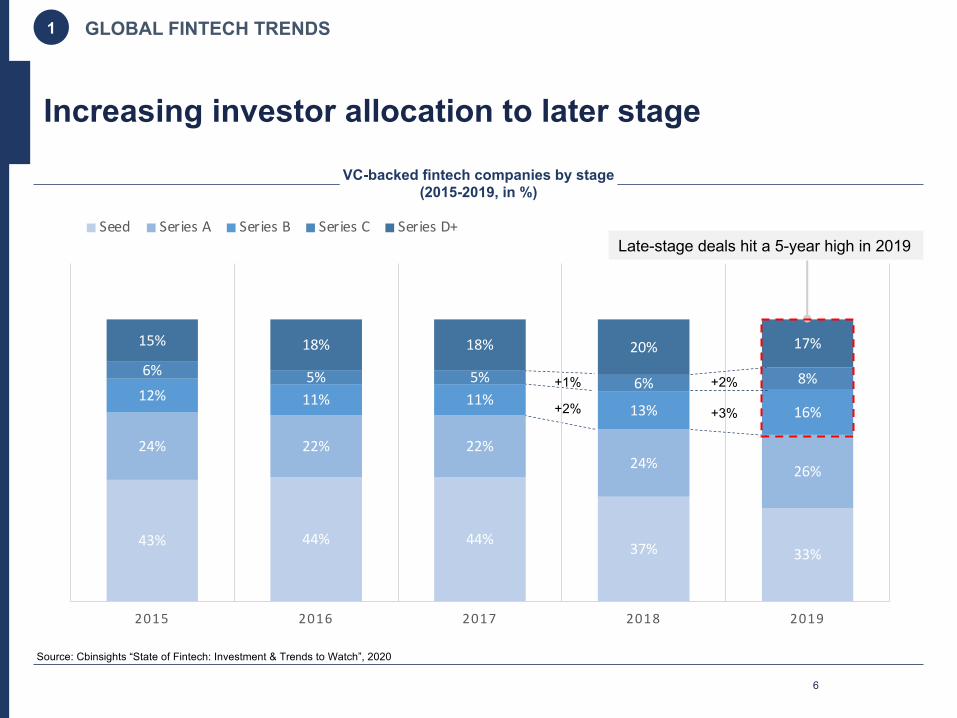
43% 44% 44% 37% 33%
24% 22% 22%24% 26%
12% 11% 11%13% 16%
6% 5% 5% 6% 8%
15% 18% 18% 20% 17%
2015 2016 2017 2018 2019
Seed Series A Series B Series C Series D+
Increasing investor allocation to later stage
VC-backed fintech companies by stage (2015-2019, in %)
1 GLOBAL FINTECH TRENDS
+2%
+3%
Late-stage deals hit a 5-year high in 2019
Source: Cbinsights “State of Fintech: Investment & Trends to Watch”, 2020
+1%
+2%
6
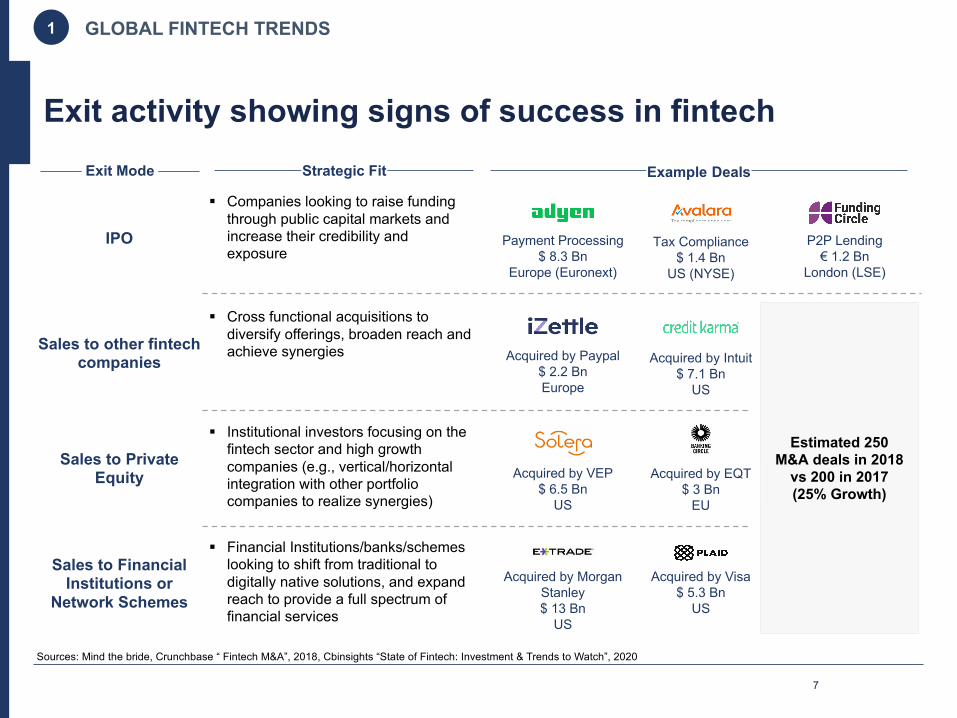
Exit activity showing signs of success in fintech
1 GLOBAL FINTECH TRENDS
§ Institutional investors focusing on the fintech sector and high growth companies (e.g., vertical/horizontal integration with other portfolio companies to realize synergies)
Sales to Financial Institutions or
Network Schemes
Sales to other fintechcompanies
Sales to Private Equity
IPO
Strategic Fit Example Deals
Payment Processing$ 8.3 Bn
Europe (Euronext)
Tax Compliance $ 1.4 Bn
US (NYSE)
§ Financial Institutions/banks/schemes looking to shift from traditional to digitally native solutions, and expand reach to provide a full spectrum of financial services
§ Cross functional acquisitions to diversify offerings, broaden reach and achieve synergies
Exit Mode
§ Companies looking to raise funding through public capital markets and increase their credibility and exposure
Acquired by Paypal$ 2.2 BnEurope
Acquired by Intuit$ 7.1 Bn
US
Acquired by VEP$ 6.5 Bn
US
Acquired by EQT$ 3 Bn
EU
Acquired by Morgan Stanley$ 13 Bn
US
Acquired by Visa$ 5.3 Bn
US
Sources: Mind the bride, Crunchbase “ Fintech M&A”, 2018, Cbinsights “State of Fintech: Investment & Trends to Watch”, 2020
7
Estimated 250 M&A deals in 2018
vs 200 in 2017 (25% Growth)
P2P Lending€ 1.2 Bn
London (LSE)
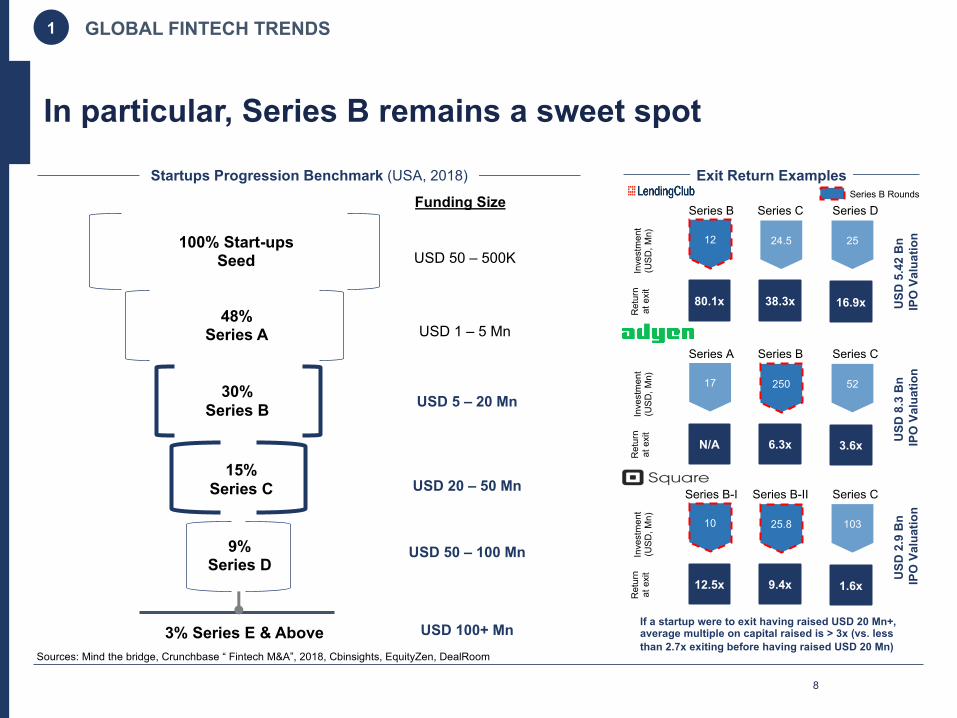
In particular, Series B remains a sweet spot
Funding Size
1 GLOBAL FINTECH TRENDS
15% Series C
100% Start-upsSeed
9%Series D
USD 50 – 500K
USD 1 – 5 Mn
USD 5 – 20 Mn
USD 20 – 50 Mn
USD 100+ Mn3% Series E & AboveSources: Mind the bridge, Crunchbase “ Fintech M&A”, 2018, Cbinsights, EquityZen, DealRoom
Startups Progression Benchmark (USA, 2018) Exit Return Examples
If a startup were to exit having raised USD 20 Mn+, average multiple on capital raised is > 3x (vs. less than 2.7x exiting before having raised USD 20 Mn)
12 24.5 25
38.3x 16.9x80.1x
Inve
stm
ent
(USD
, Mn)
Ret
urn
at e
xit
USD
8.3
Bn
IPO
Val
uatio
nU
SD 5
.42
Bn
IPO
Val
uatio
n
Series B Series C Series D
17 250 52
6.3x 3.6xN/A
Inve
stm
ent
(USD
, Mn)
Ret
urn
at e
xit
Series A Series B Series C
USD
2.9
Bn
IPO
Val
uatio
n
10 25.8 103
9.4x 1.6x12.5x
Inve
stm
ent
(USD
, Mn)
Ret
urn
at e
xit
Series B-I Series B-II Series C
Series B Rounds
8
48% Series A
30% Series B
USD 50 – 100 Mn
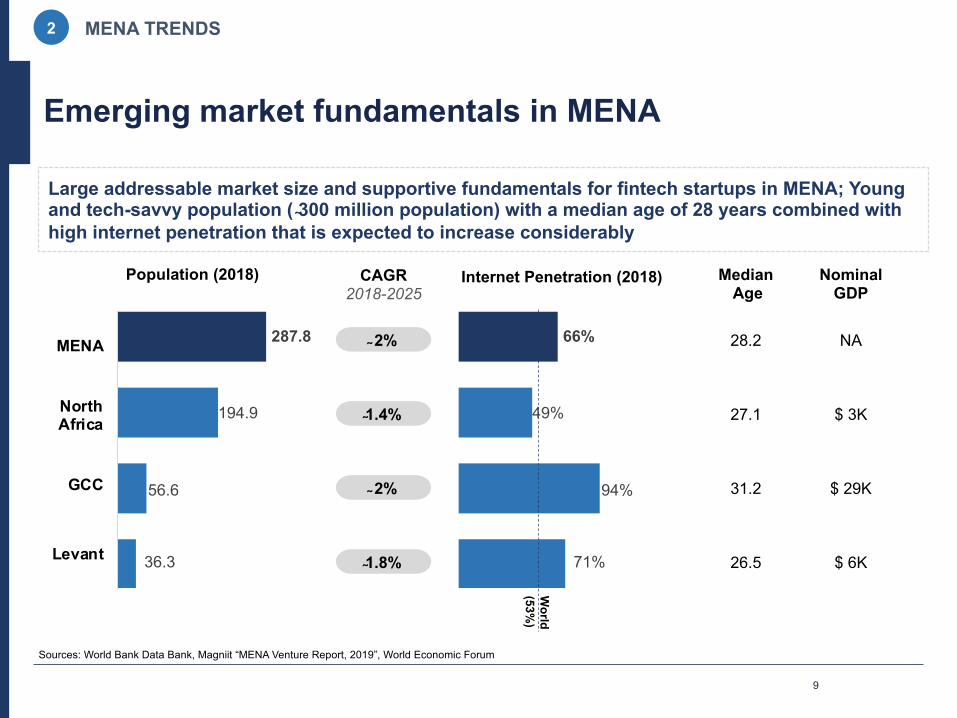
Emerging market fundamentals in MENA
Sources: World Bank Data Bank, Magniit “MENA Venture Report, 2019”, World Economic Forum
2 MENA TRENDS
Large addressable market size and supportive fundamentals for fintech startups in MENA; Young and tech-savvy population ( 300 million population) with a median age of 28 years combined with high internet penetration that is expected to increase considerably
36.3
56.6
194.9
287.8
Levant
GCC
NorthAfrica
MENA
Population (2018)
2%
CAGR 2018-2025
1.4%
2%
1.8% 26.5
31.2
27.1
28.2
MedianAge
$ 6K
$ 29K
$ 3K
NA
Nominal GDP
71%
94%
49%
66%
Internet Penetration (2018)
World
(53%)
9

24.7
7.1 4.41.1 0.3 0 0.020.3
4.50.7 0.4
36.1
44.3
13.8
Egypt Lebanon Jordan Iraq KSA UAE Kuwait
Inflow Outflow
95%
Untapped white spaces with potential for disruption
~150 Mn individuals could be newly included in financial system
Significant need for payments infrastructure driving by e-commerce
OECD avg. Global average middle income countries
Sources: World Bank Data Bank, World Economic Forum, Union of Arab Banks, McKinsey Global Institute, Wamda “State of Fintech”
Share of Loans to SMEs by Arab Banks (2015 - selected countries, %)MENA Banked Population (in % , 2018)
MENA E-commerce Market Value (2017-2022, USD Bn)
2.3 8.9 3.0
10.0
1 0.7
2.9
2.2
6.8
2017 2022
UAE KSA Egypt Rest Of MENA
28.5
8.3
2 MENA TRENDS
77%
37% 35% 49%
GCC Levant North Africa MENA
USD 240 Bn SME credit gap in MENA region with 63% of SMEs not having access to finance
18%
2%
15% 14%8%
GCC Levant North Africa MENA
Total remittances inflows grew 9.3% to USD 53 Bnin 2017
MENA Migrant Remittance (2017- selected countries , USD Bn)
~28%CAGR
10
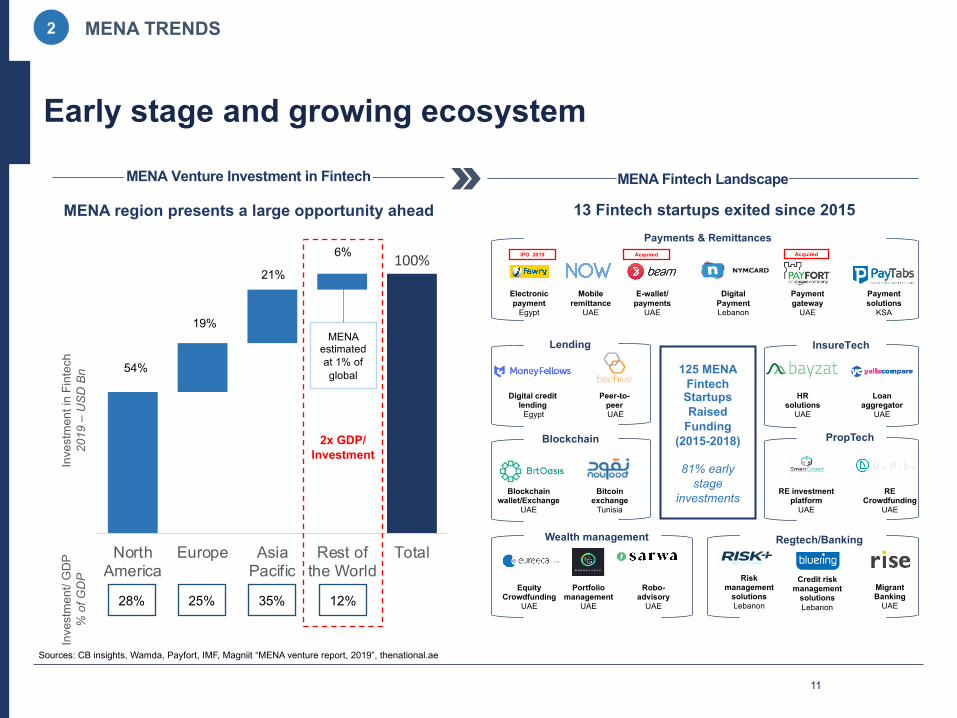
Early stage and growing ecosystemIn
vest
men
t in
Fint
ech
2019
–U
SD
Bn
100%
NorthAmerica
Europe AsiaPacific
Rest ofthe World
Total
Inve
stm
ent/
GD
P%
of G
DP
54%
19%
21%
6%
28% 25% 35% 12%
2x GDP/ Investment
Sources: CB insights, Wamda, Payfort, IMF, Magniit “MENA venture report, 2019”, thenational.ae
MENA region presents a large opportunity ahead
MENA Fintech LandscapeMENA Venture Investment in Fintech
2 MENA TRENDS
Risk management
solutionsLebanon
Robo-advisoryUAE
Digital credit lendingEgypt
Loan aggregator
UAE
Peer-to-peerUAE
Electronic paymentEgypt
E-wallet/ paymentsUAE
Digital PaymentLebanon
Payment gatewayUAE
Payment solutionsKSA
HR solutionsUAE
BitcoinexchangeTunisia
Blockchainwallet/Exchange
UAE
Mobile remittance
UAE
Acquired AcquiredIPO 2019
Payments & Remittances
Lending
Blockchain
Wealth management Regtech/Banking
PropTech
InsureTech
Equity Crowdfunding
UAE
Migrant BankingUAE
RE Crowdfunding
UAE
RE investment platformUAE
125 MENA Fintech Startups Raised
Funding (2015-2018)
81% early stage
investments
13 Fintech startups exited since 2015
Portfolio management
UAE
Credit risk management
solutions Lebanon
11
MENA estimated at 1% of global
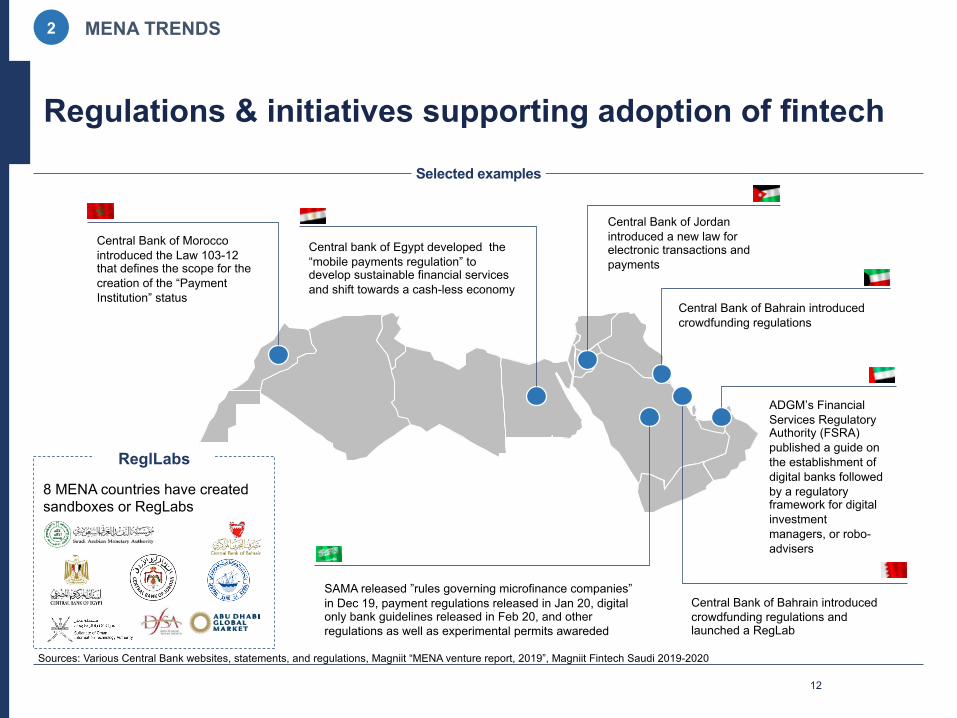
Regulations & initiatives supporting adoption of fintech
SAMA released ”rules governing microfinance companies” in Dec 19, payment regulations released in Jan 20, digital only bank guidelines released in Feb 20, and other regulations as well as experimental permits awareded
Central bank of Egypt developed the “mobile payments regulation” to develop sustainable financial services and shift towards a cash-less economy
ADGM’s Financial Services Regulatory Authority (FSRA) published a guide on the establishment of digital banks followed by a regulatory framework for digital investment managers, or robo-advisers
Central Bank of Bahrain introduced crowdfunding regulations and launched a RegLab
Central Bank of Bahrain introduced crowdfunding regulations
Central Bank of Jordan introduced a new law for electronic transactions and payments
Central Bank of Morocco introduced the Law 103-12 that defines the scope for the creation of the “Payment Institution” status
8 MENA countries have created sandboxes or RegLabs
ReglLabs
Sources: Various Central Bank websites, statements, and regulations, Magniit “MENA venture report, 2019”, Magniit Fintech Saudi 2019-2020
2 MENA TRENDS
Selected examples
12