Embed Size (px)
Citation preview
Glenelg Ark 2005–2011: Evidence of
Sustained Control of Foxes and Benefits for Native Mammals A. Robley, A. Gormley, R. Albert, M. Bowd, C. Hatfield, R. McDonald, M. Scroggie, A. Smith, A. Thorp and F. Warton
2012
Arthur Rylah Institute for Environmental Research
Technical Report Series No. 240

Glenelg Ark 2005–2011: Evidence of Sustained Control of Foxes and
Benefits for Native Mammals
Alan Robley, Andrew Gormley, Ray Albert, Michael Bowd, Chris Hatfield, Robert McDonald,
Michael Scroggie, Arlene Smith, Alex Thorp and Fred Warton
Arthur Rylah Institute for Environmental Research
123 Brown Street, Heidelberg, Victoria 3084
November 2012
Arthur Rylah Institute for Environmental Research Department of Sustainability and Environment
Heidelberg, Victoria
Report produced by: Arthur Rylah Institute for Environmental Research
Department of Sustainability and Environment
PO Box 137
Heidelberg, Victoria 3084
Phone (03) 9450 8600
Website: www.dse.vic.gov.au/ari
© State of Victoria, Department of Sustainability and Environment 2012
This publication is copyright. Apart from fair dealing for the purposes of private study, research, criticism or review as
permitted under the Copyright Act 1968, no part may be reproduced, copied, transmitted in any form or by any means
(electronic, mechanical or graphic) without the prior written permission of the State of Victoria, Department of
Sustainability and Environment. All requests and enquiries should be directed to the Customer Service Centre, 136 186
or email [email protected]
Citation: Robley, A., Gormley A., Albert, R., Bowd, M., Hatfield, C., McDonald, R., Scroggie, M., Smith, A., Thorp,
A., and Warton, F. (2012) Glenelg Ark 2005–2011: Evidence of Sustained Control of Foxes and Benefits for Native
Mammals. Arthur Rylah Institute for Environmental Research Technical Report Series No. 240. Department of
Sustainability and Environment, Heidelberg, Victoria.
ISSN 1835-3827 (print)
ISSN 1835-3835 (online)
ISBN 978-1-74287-711-2 (print)
ISBN 978-1-74287-712-9 (online)
Disclaimer: This publication may be of assistance to you but the State of Victoria and its employees do not guarantee
that the publication is without flaw of any kind or is wholly appropriate for your particular purposes and therefore
disclaims all liability for any error, loss or other consequence which may arise from you relying on any information in
this publication.
Accessibility: If you would like to receive this publication in an accessible format, such as large print or audio, please telephone
136 186, or through the National Relay Service (NRS) using a modem or textphone/teletypewriter (TTY) by dialling
1800 555 677, or email [email protected]
This document is also available in PDF format on the internet at www.dse.vic.gov.au
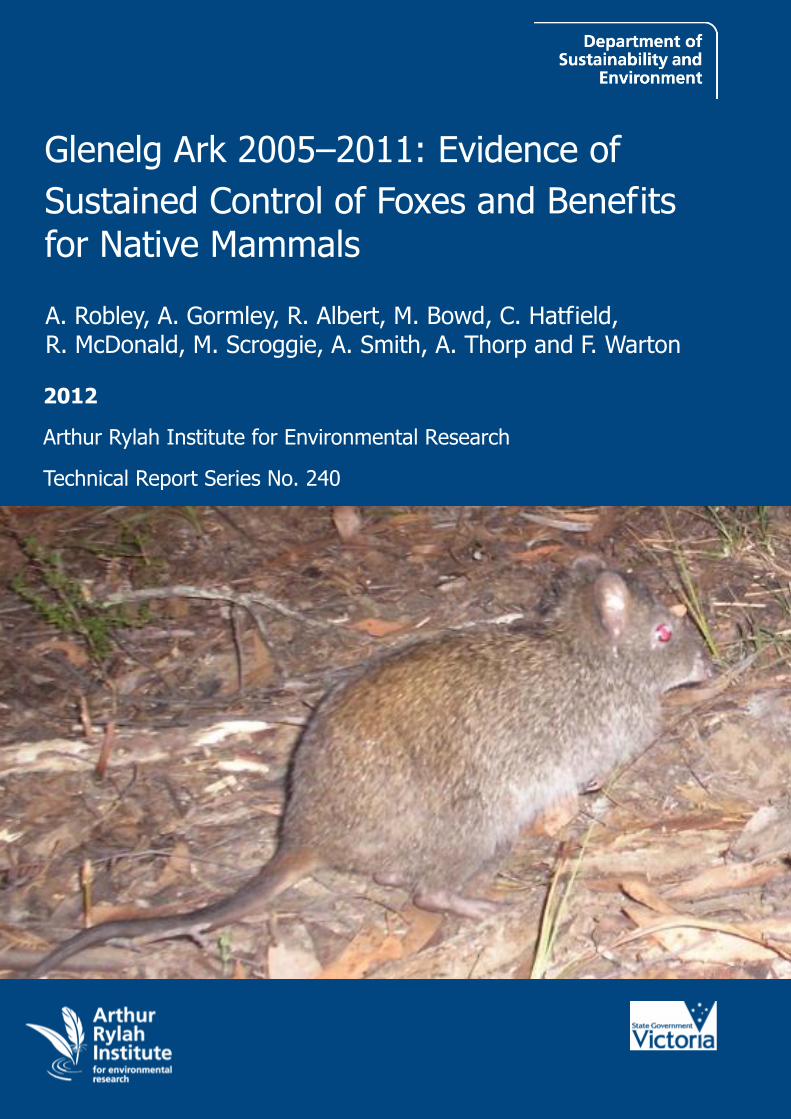
Front cover photo: Long-nosed Potoroo (Alan Robley).
Authorised by: Victorian Government, Melbourne
Printed by: PRINTROOM 77 St Georges Rd, Preston 3072
iii
Contents
Acknowledgements ...........................................................................................................................iv
Summary ............................................................................................................................................ 1
1 Introduction ............................................................................................................................. 2
1.1 Background ............................................................................................................................... 2
1.2 Glenelg Ark ............................................................................................................................... 2
2 Methods .................................................................................................................................... 3
2.1 Monitoring and evaluation design ............................................................................................ 3
2.2 Measuring changes in foxes ...................................................................................................... 4
2.2.1 Demonstrating the impact of the initial knockdown of the fox population ............... 4
2.2.2 Sustained reduction in the fox population ................................................................. 6
2.3 Measuring populations of key native species ........................................................................... 6
2.3.1 Logistic Regression of Southern Brown Bandicoot data ........................................... 8
2.4 Rainfall ...................................................................................................................................... 9
3 Results .................................................................................................................................... 10
3.1 Response of foxes to control ................................................................................................... 10
3.1.1 Lower Glenelg National Park .................................................................................. 10
3.1.2 Cobboboonee National Park and Annya State Forest ............................................. 12
3.1.3 Mount Clay and Hotspur State Forest ..................................................................... 14
4 Monitoring changes in native species .................................................................................. 16
4.1 Long-nosed Potoroos .............................................................................................................. 16
4.2 Southern Brown Bandicoot ..................................................................................................... 19
4.2.1 Additional analysis of Southern Brown Bandicoot data ......................................... 22
4.3 Common Brushtail Possum..................................................................................................... 23
5 Discussion .............................................................................................................................. 27
References ........................................................................................................................................ 30
Appendix 1. Ecological Vegetation Classes within each treatment and non-treatment area ... 32
Appendix 2. Occupancy model specifications ............................................................................... 33
Appendix 3. Location and year of detection for Long-nosed Potoroos across the Glenelg Ark
monitoring area ............................................................................................................................... 34
Appendix 4. Location and year of detection for Southern Brown Bandicoots across the
Glenelg Ark monitoring area ......................................................................................................... 35

Acknowledgements
This project was funded by the Pests and Weeds on Public Land Initiative of the Department of
Sustainability and Environment through the Glenelg Ark project. The collection of field data was
managed by Donald Pratt. Justin Cook and Stephen Balharrie provided valuable input into this
report and the development of the monitoring and evaluation program, as did Simon Nicol and
Daryl MacKenzie. Dave Forsyth and Michael Johnston provided many useful comments that
improved this report.
This work was conducted under the Department of Sustainability and Environment Animal Ethics
Committee Permit Numbers 10/23, 9/15 and 8/28.
Glenelg Ark 2005–2011
Arthur Rylah Institute for Environmental Research Technical Report Series No. 240 1
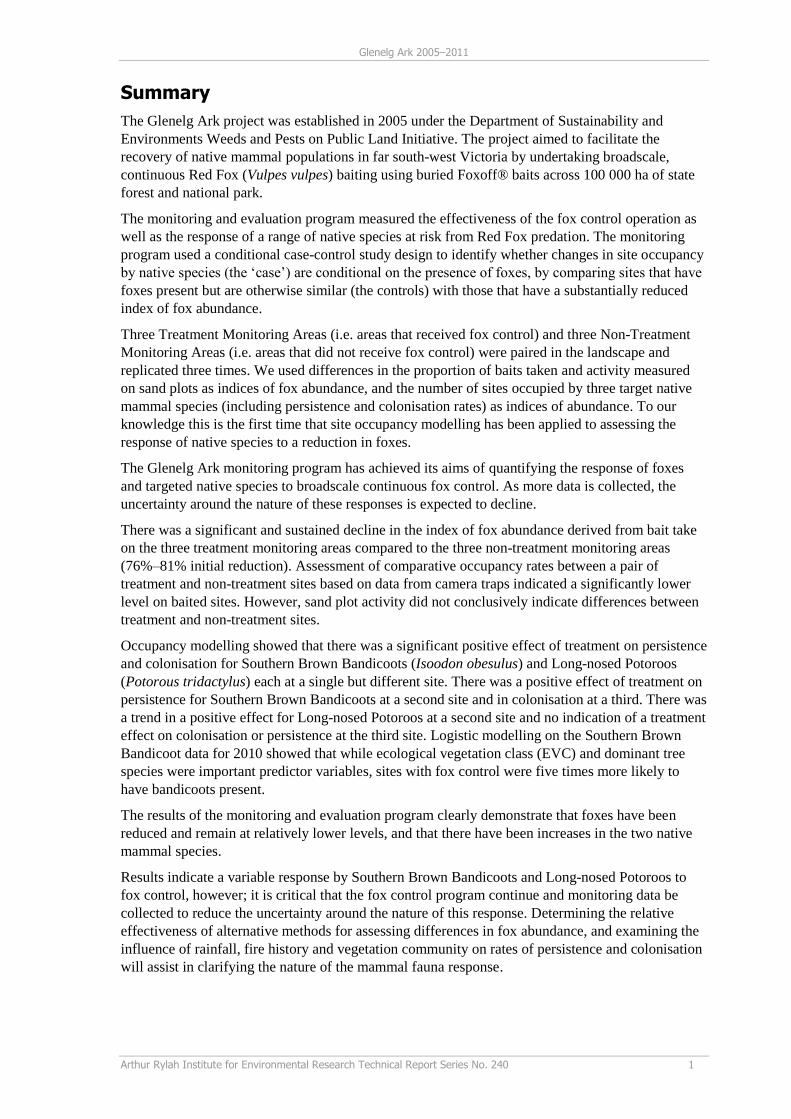
Summary
The Glenelg Ark project was established in 2005 under the Department of Sustainability and
Environments Weeds and Pests on Public Land Initiative. The project aimed to facilitate the
recovery of native mammal populations in far south-west Victoria by undertaking broadscale,
continuous Red Fox (Vulpes vulpes) baiting using buried Foxoff® baits across 100 000 ha of state
forest and national park.
The monitoring and evaluation program measured the effectiveness of the fox control operation as
well as the response of a range of native species at risk from Red Fox predation. The monitoring
program used a conditional case-control study design to identify whether changes in site occupancy
by native species (the ‘case’) are conditional on the presence of foxes, by comparing sites that have
foxes present but are otherwise similar (the controls) with those that have a substantially reduced
index of fox abundance.
Three Treatment Monitoring Areas (i.e. areas that received fox control) and three Non-Treatment
Monitoring Areas (i.e. areas that did not receive fox control) were paired in the landscape and
replicated three times. We used differences in the proportion of baits taken and activity measured
on sand plots as indices of fox abundance, and the number of sites occupied by three target native
mammal species (including persistence and colonisation rates) as indices of abundance. To our
knowledge this is the first time that site occupancy modelling has been applied to assessing the
response of native species to a reduction in foxes.
The Glenelg Ark monitoring program has achieved its aims of quantifying the response of foxes
and targeted native species to broadscale continuous fox control. As more data is collected, the
uncertainty around the nature of these responses is expected to decline.
There was a significant and sustained decline in the index of fox abundance derived from bait take
on the three treatment monitoring areas compared to the three non-treatment monitoring areas
(76%–81% initial reduction). Assessment of comparative occupancy rates between a pair of
treatment and non-treatment sites based on data from camera traps indicated a significantly lower
level on baited sites. However, sand plot activity did not conclusively indicate differences between
treatment and non-treatment sites.
Occupancy modelling showed that there was a significant positive effect of treatment on persistence
and colonisation for Southern Brown Bandicoots (Isoodon obesulus) and Long-nosed Potoroos
(Potorous tridactylus) each at a single but different site. There was a positive effect of treatment on
persistence for Southern Brown Bandicoots at a second site and in colonisation at a third. There was
a trend in a positive effect for Long-nosed Potoroos at a second site and no indication of a treatment
effect on colonisation or persistence at the third site. Logistic modelling on the Southern Brown
Bandicoot data for 2010 showed that while ecological vegetation class (EVC) and dominant tree
species were important predictor variables, sites with fox control were five times more likely to
have bandicoots present.
The results of the monitoring and evaluation program clearly demonstrate that foxes have been
reduced and remain at relatively lower levels, and that there have been increases in the two native
mammal species.
Results indicate a variable response by Southern Brown Bandicoots and Long-nosed Potoroos to
fox control, however; it is critical that the fox control program continue and monitoring data be
collected to reduce the uncertainty around the nature of this response. Determining the relative
effectiveness of alternative methods for assessing differences in fox abundance, and examining the
influence of rainfall, fire history and vegetation community on rates of persistence and colonisation
will assist in clarifying the nature of the mammal fauna response.
2 Arthur Rylah Institute for Environmental Research Technical Report Series No. 240
1 Introduction
1.1 Background
Predation by the Red Fox (Vulpes vulpes) is a key threatening process for smaller native mammals
and ground-nesting birds, and may be partly responsible for several extinctions (e.g. Lunney 2001).
Predation by foxes is listed as a key threatening process under the Victorian Flora and Fauna
Guarantee Act 1988 and the Federal Environmental Protection and Biodiversity Conservation Act
1999. Fox control operations are conducted for threatened species and livestock protection on an
estimated 10.5 million ha of land in Australia per year (Reddiex et al. 2004).
Poisoned baits are widely used to reduce populations of foxes throughout Australia. It is the main
tool used in projects aimed at protecting or enhancing populations of native wildlife (Saunders and
McLeod 2007).
Measuring the response of native wildlife to fox control is problematic. McLeod et al. (2008)
review 14 studies that measured the response of native species’ population size following fox
control and found the results were inconsistent and sometimes conflicting. Possible explanations
include: different species being effected in different ways; complex interactions between factors
such as habitat and other predators; the baiting strategy being ineffective; the time frame of the
control not being sufficient; or fox predation not having a measurable impact. Most studies only
monitored the prey species of interest; however, Risbey et al. (2000) highlighted the complexity of
ecosystems with a positive response to fox control in populations of feral cats, which then impacted
on the preferred prey species.
An alternative to measuring changes in population size is to measure changes in the proportion of
sites in an area that are occupied by the species in question (termed ‘occupancy’). The simplest
approach to estimating occupancy is to derive a naive estimate, i.e. the number of sites with at least
one detection divided by the total number of sites in the study area. This assumes that if a species is
present on a site then it will be detected, i.e. the probability of detection is 1. This method will
likely result in a negatively biased estimate of site occupancy, as it is possible that sites that are
considered unoccupied could in fact have species present that were undetected. MacKenzie and
Kendall (2002) proposed that an unbiased estimation of occupancy can be achieved by repeated
surveying of sites.
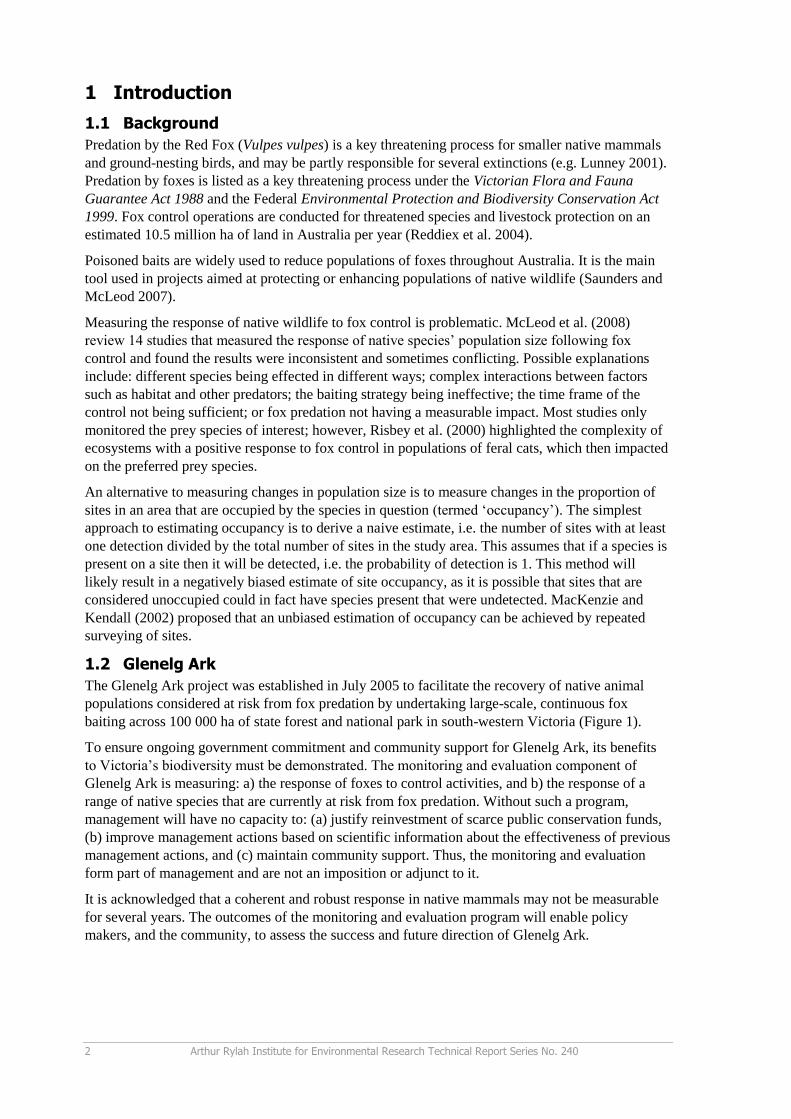
1.2 Glenelg Ark
The Glenelg Ark project was established in July 2005 to facilitate the recovery of native animal
populations considered at risk from fox predation by undertaking large-scale, continuous fox
baiting across 100 000 ha of state forest and national park in south-western Victoria (Figure 1).
To ensure ongoing government commitment and community support for Glenelg Ark, its benefits
to Victoria’s biodiversity must be demonstrated. The monitoring and evaluation component of
Glenelg Ark is measuring: a) the response of foxes to control activities, and b) the response of a
range of native species that are currently at risk from fox predation. Without such a program,
management will have no capacity to: (a) justify reinvestment of scarce public conservation funds,
(b) improve management actions based on scientific information about the effectiveness of previous
management actions, and (c) maintain community support. Thus, the monitoring and evaluation
form part of management and are not an imposition or adjunct to it.
It is acknowledged that a coherent and robust response in native mammals may not be measurable
for several years. The outcomes of the monitoring and evaluation program will enable policy
makers, and the community, to assess the success and future direction of Glenelg Ark.

Glenelg Ark 2005–2011
Arthur Rylah Institute for Environmental Research Technical Report Series No. 240 3
2 Methods
2.1 Monitoring and evaluation design
The aim of the Glenelg Ark monitoring and evaluation program is to provide quantitative evidence
of the effect of the fox baiting program and the associated changes in native mammal species. The a
priori assumption is that fox predation is the key threatening process and that species at risk from
fox predation would escape population regulation and increase in abundance once foxes had been
reduced. Implicit in this assumption is the notion that although there are many variables which
impact on a population’s growth (e.g. food, predation, disease, climate, social and genetic), the
major controlling variable (in this case fox predation) will show strong signals through the noise of
contingent events.
We use a conditional case-control study design to identify whether changes in site occupancy by
native species (the ‘case’) is conditional on the presence of foxes, by comparing sites that have
foxes present but are otherwise similar (the controls) to those that have a substantially reduced
number of foxes.
Three paired monitoring areas known as Treatment Monitoring Areas (TMAs, i.e. areas that
received fox control) and Non-Treatment Monitoring Areas (NTMA, i.e. areas that did not receive
fox control) (Figure 1) are used to assess the effectiveness of the program. In order to achieve a
broadscale reduction in foxes across the public land estate areas, treatment for fox control was
consolidated in the southern half of the overall project area (Figure 1). This meant that random
allocation of treatment and non-treatment sites was not feasible. The three paired areas are:
1. Lower Glenelg National Park south (TMA; 8954 ha) and Lower Glenelg National Park north
(NTMA; 4659 ha); separated by the Glenelg River
2. Cobobboonee National Park (TMA; 9750 ha) and Annya State Forest (NTMA; 8520 ha)
3. Mount Clay State Forest (TMA; 4703 ha) and Hotspur State Forest (NTMA; 6940 ha).
This design will identify any patterns of association between a reduction in foxes and an increase in
site occupancy of targeted native species but does not allow any statistical interpretation of
causality or effect (Lande et al. 1994).
4 Arthur Rylah Institute for Environmental Research Technical Report Series No. 240
Land Tenure
Parks and Reserves
State Forest
Softwood Plantation
Other Public Land
Roads
Treatment Areas
TMA
NTMA
# Monitoring Stations
LEGEND
0 5 10 Km
# ##
#
#
## #
#
#
#
#
# #
#
#
#
#
#
#
#
#
###
#
#
#
# #
#
# #
##
# #
##
#
#
#
##
##
#
#
#
#
#
#
#
#
# #
## #
##
#
#
#
#
#
####
#
#
#
#
#
##
#
#
#
##
#
## #
##
#
###
#
#
#
##
##
#
##
##
#
#
#
#
##
#
#
##
#
#
##
#
#
#
#
###
# ###
##
# #
#
##
#
#
#
# #
#
#
#
#
# # #
# #
#
# #
#
##
#
##
#
#
#
#
##
#
#
#
#
#
#
#
#
###
#
##
#
#
#
#
#
#
#
#
##
# #
#
##
#
#
#
##
#
#
# #
#
#
##
#
#
##
## #
#
#
#
#
##
#
##
#
#
#
#
# ##
#
#
#
##
#
#
#
#
#
LGNP-South
LGNP-North
Coboboonee
Mt Clay
Annya
Hotspur
#
Figure 1. Glenelg Ark monitoring and evaluation areas.
2.2 Measuring changes in foxes
In the TMAs and NTMAs there had been little previous fox control prior to 2005. Each TMA bait
station was constructed at a 1 km interval, and a single 1080 Foxoff bait was buried to a depth of 10
cm. Bait stations were checked and all baits replaced on a fortnightly basis throughout the year. An
assessment of which species was likely to have taken bait was recorded at the time of bait checking.
NTMA bait stations were constructed in the same manner and non-toxic Foxoff baits used. The
number of bait stations ranged from 46 to 78 per area. Monitoring the results of the baiting program
has three components:
1. demonstrating the impact of the initial knockdown of the fox population
2. monitoring the outcome of the sustained fox control measures
3. measuring changes in fox activity.
2.2.1 Demonstrating the impact of the initial knockdown of the fox population
To establish an index of pre-baiting fox activity, free-feed (i.e. non-toxic) baits were used for
several weeks prior to the commencement of poisoning. Progressively higher frequencies of bait
take occur as time passes during the free-feed phase, as foxes become familiar with the location of
bait stations and the presence of the baits. The assessment period for pre-toxic bait take was
commenced once variation in daily bait take had stabilised (<10–15% variation). Contagion causes
the daily frequencies of bait take to form a curve that flattens out at high values. An index of fox
abundance can be achieved by checking bait stations daily and recording visitations until the curve
has reached a plateau. The mean of three or more days after the plateau is reached is used as the
Glenelg Ark 2005–2011
Arthur Rylah Institute for Environmental Research Technical Report Series No. 240 5
0
10
20
30
40
50
60
70
80
90
100
1 3 5 7 9 11 13 15 17 19 21 23 25 27 29 31 33 35 37 39 41 43 45 47 49
Day
10 days free-feeding with <10% variation 10 days poisoning
with <10% variation
Sand Plots
Poison Baiting Commenced
Sand Plots
Sand Plots
Sand Plots
Perc
enta
ge B
ait t
ake
Free-feeding Period
index. This may take many days to achieve, with studies by Thompson and Fleming (1994)
showing that 10 days were needed, Fleming (1997) showing 16 days, and Allen et al. (1996)
showing 21 days were needed for dingoes to achieve the required results.
In association with the baiting program, changes in fox activity before and after poison baiting were
measured using the presence of fox signs on sand plots. Sand plots are areas of smoothed sand
covering the width of a track. They are checked daily for three consecutive days for sign of foxes,
with plots smoothed over after checking (Allen et al. 1996). Plots were distributed at a density of
one plot per kilometre of road/track with a minimum of 20 plots per monitoring area. The
proportion of sand plots recording tracks per night between TMA and NTMA provide estimates of
the efficacy of the poisoning program. Once free-feed baiting had stabilised, two sessions of sand
plot monitoring were undertaken. This was repeated several days after the initial poison baiting on
the TMAs.
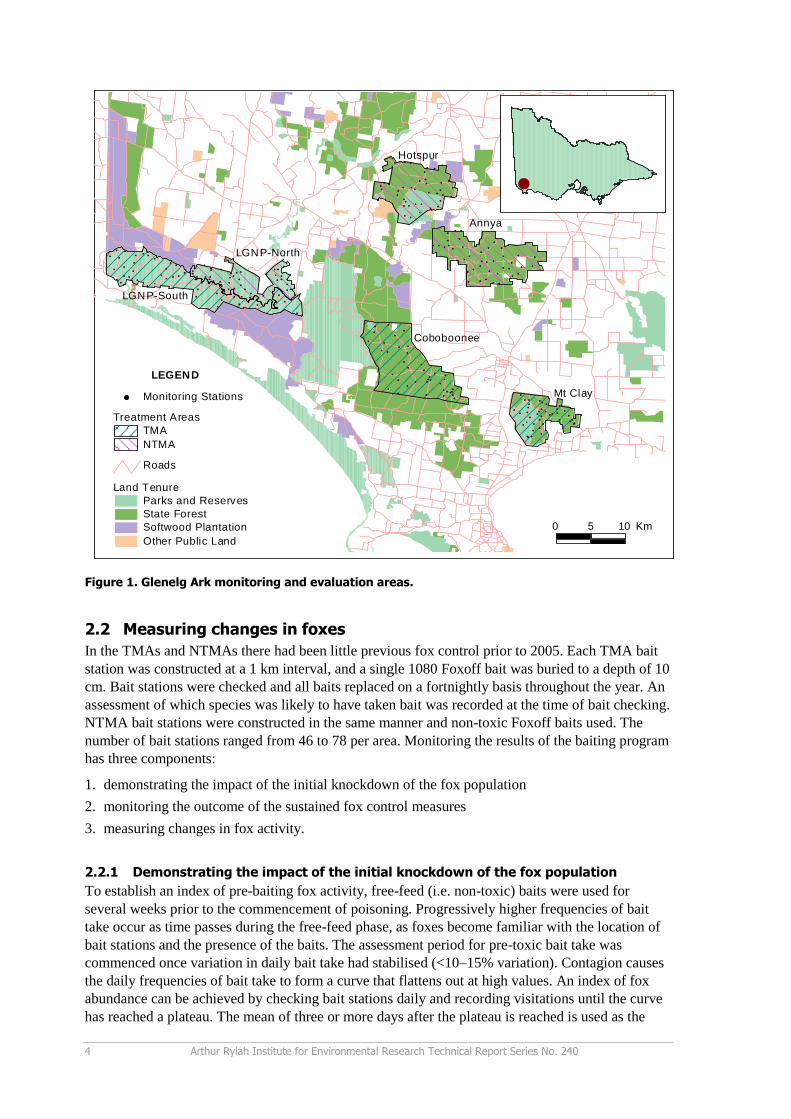
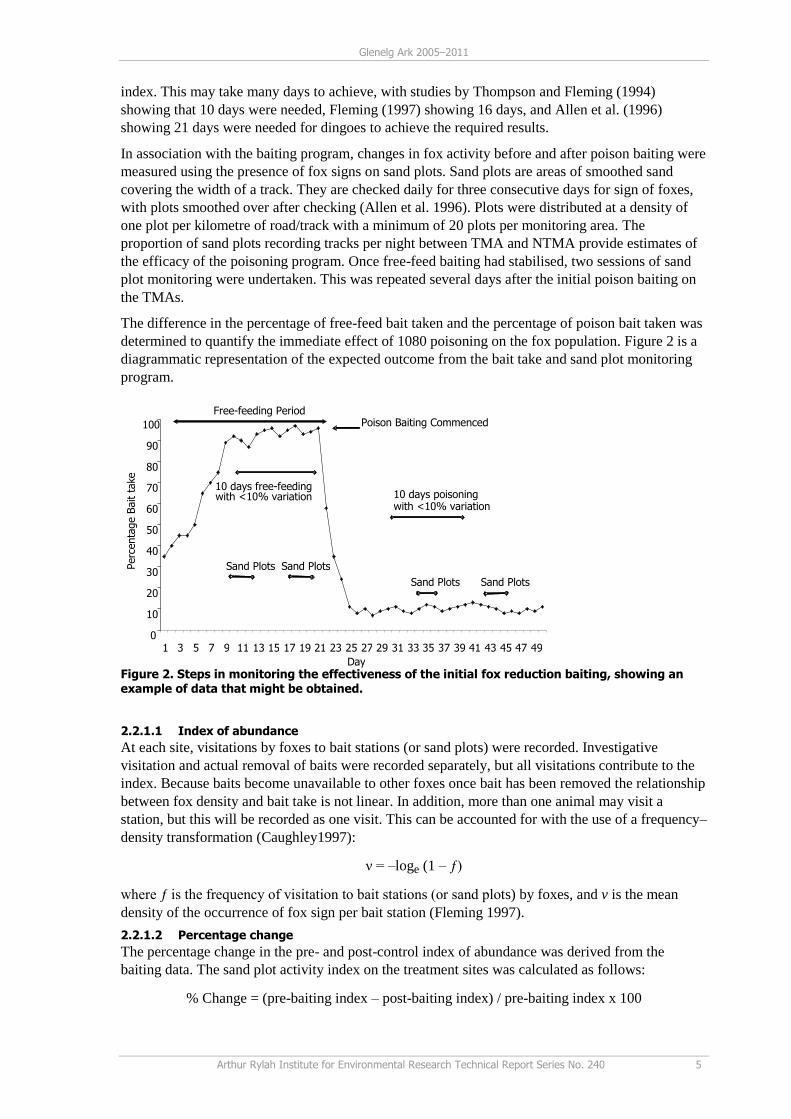
The difference in the percentage of free-feed bait taken and the percentage of poison bait taken was
determined to quantify the immediate effect of 1080 poisoning on the fox population. Figure 2 is a
diagrammatic representation of the expected outcome from the bait take and sand plot monitoring
program.
Figure 2. Steps in monitoring the effectiveness of the initial fox reduction baiting, showing an example of data that might be obtained.
2.2.1.1 Index of abundance
At each site, visitations by foxes to bait stations (or sand plots) were recorded. Investigative
visitation and actual removal of baits were recorded separately, but all visitations contribute to the
index. Because baits become unavailable to other foxes once bait has been removed the relationship
between fox density and bait take is not linear. In addition, more than one animal may visit a
station, but this will be recorded as one visit. This can be accounted for with the use of a frequency–
density transformation (Caughley1997):
ν = –loge (1 – ƒ)
where ƒ is the frequency of visitation to bait stations (or sand plots) by foxes, and v is the mean
density of the occurrence of fox sign per bait station (Fleming 1997).
2.2.1.2 Percentage change
The percentage change in the pre- and post-control index of abundance was derived from the
baiting data. The sand plot activity index on the treatment sites was calculated as follows:
% Change = (pre-baiting index – post-baiting index) / pre-baiting index x 100
6 Arthur Rylah Institute for Environmental Research Technical Report Series No. 240
2.2.2 Sustained reduction in the fox population
Once the initial knockdown of foxes had been established, continued low levels of bait take and
sand plot activity, measured at two weekly intervals on TMAs and NTMAs, provided evidence of a
sustained reduction in foxes.
NTMAs also had free-feed bait laid initially to establish the presence of foxes. Free-feeding and
sand plot activity monitoring was undertaken once a year between 2005 and 2010 on each NTMA.
By comparing free-feed and poison bait take and sand plot activity between the yearly estimates,
evidence can be provided that foxes remain unchanged on the NTMAs.
2.2.2.1 Supplementary assessment of sustained reduction in foxes using digital cameras
We assessed the occupancy rate of foxes at Lower Glenelg National Park north and south in
October 2011 using data generated from 39 Reconyx PC900 digital cameras (Reconyx Inc.,
Wisconsin, USA) that were deployed for 21 days. Cameras were randomly deployed within
randomly selected 2 km2 blocks. Camera set up was the same as in previous years (Robley et al.
2010).
2.3 Measuring populations of key native species
Assessing changes in elusive native species abundance, presence or activity in response to fox
control is problematic (McLeod et al. 2008). McLeod et al. (2008), in reviewing the effectiveness of
fox control programs in Australia, noted that these difficulties have produced results that have been
varied, sometimes conflicting, and hard to interpret.
While information on population-level parameters, such as age-specific fecundity and survivorship,
would be ideal, these are difficult to obtain for species with a low abundance. Indices such as the
minimum number of animals known to be alive (MNA) have been a popular measure of population
size for mark–recapture studies of small mammals and have been used to assess responses to fox
control (see e.g. Dexter and Murray 2008). The use of MNA has, however, been strongly
questioned by Jolly and Dickson (1983), Nichols and Pollock (1983), Seber (1986), Montgomery
(1987), Pollock et al. (1990), and Efford (1992) mainly on the basis that it is always negatively
biased. In fact, Efford (1992) reports that in some cases the index could be biased by as much as
24–45%.
The use of occupancy modelling specifically accounts for spatial and temporal variability in the
detection of species. It can incorporate site covariates and include the use of different detection
methods, and requires relatively less effort and cost compared to more traditional methods of
estimating abundance (Tyre et al. 2001; MacKenzie and Kendall 2002). To our knowledge this is
the first time that site occupancy modelling has been applied to assessing the response of native
species to a reduction in foxes.
Changes in site occupancy of the three target species (Long-nosed Potoroo Potorous tridactylus,
Southern Brown Bandicoot Isoodon obesulus, and Common Brushtail Possum Trichosurus
vulpecula) were monitored annually at 40 monitoring stations established within each TMA and
NTMA. The selection of locations of monitoring sites was based on descriptions of the habitat of
the target species (Menkhorst 1995). Site location was then stratified according to the proportion of
habitat, based on EVC, within each TMA and NTMA (Appendix 1). At each monitoring site, nine
handiglaze hair tubes (Murray 2005), baited with peanut butter, rolled oats and honey, were set and
checked daily for four consecutive days, with tapes replaced each day. These daily surveys
represented four repeat surveys of the monitoring site per sampling period.
Monitoring was typically carried out in spring (2005, 2007–2010). Initial sampling was conducted
in winter 2005, pre-poison baiting. In 2006 sampling was undertaken in late winter due to staff
resource issues, and the spring 2007 sampling was delayed due to staff being allocated to fire
fighting delaying sampling until summer 2007. Severe fires affected large areas of Victoria in
summer 2005–2006, which interrupted the delivery of this program. As a result, hair-tube
monitoring was not completed at Mt Clay and Hotspur in spring 2006. Follow-up monitoring was
undertaken in February 2007 at Mt Clay and Hotspur.
Glenelg Ark 2005–2011
Arthur Rylah Institute for Environmental Research Technical Report Series No. 240 7
The repeat surveys allowed us to construct a detection history for each site, and thus a detection
probability p. The above approach has been extended by MacKenzie et al. (2003) to enable the
estimation of colonisation and local persistence (or extinction) probabilities of sites over multiple
sampling periods, i.e. years or seasons. In the multi-period model, colonisation (γt) is analogous to
reproduction rate, and is the probability that a site that was not occupied at time t1 becomes
occupied at t2. Persistence (øt) is analogous to survival and is the probability that sites that were
occupied at t1 remain occupied at t2. Extinction εt is simply 1 – persistence, and is the probability
that a previously occupied site becomes unoccupied from one time period to the next.
Colonisation and persistence are important as they are the processes that drive occupancy. Site
occupancy (ψ) in subsequent years results from the number of currently occupied sites multiplied
by the probability of persistence (ψt øt), and the number of currently unoccupied sites (1 – ψt)
multiplied by the probability of colonisation (γt). Specifically, the site occupancy at time t + 1 is
given in terms of these colonisation and persistence parameters as:
1 1t t t t t
i.e. occupied sites will remain occupied with probability ø, and unoccupied sites will be colonised
with probability γ.
It was considered likely that the probability of detection using hair tubing (as opposed to the
probability of occupancy) might have differed between years because of seasonal effects on
foraging behaviour.
We modelled the occupancy rate in the six areas (three TMAs and three NTMAs) from winter 2005
to spring 2010. Initial probabilities of site occupancy at the start of the study were likely to have
differed between the six study sites because of differences in habitat quality and other factors
between the sites. Therefore, all models allowed for different initial rates of occupancy among the
six areas.
It was considered possible over the medium term (5 to 7 years) that local rates of persistence and
rates of colonisation would be higher at monitoring areas where predator control was conducted
than at sites where no predator control was carried out. We estimated the effect of baiting on
colonisation and persistence for each species between the treatment and non-treatment sites, with
treatment effects estimated separately for each pair. Derived estimates of the overall treatment
effect on persistence and colonisation for each pair was determined by taking the difference in those
parameters between the TMA and NTMA. Values greater than zero indicate a positive effect of
treatment. All parameters were estimated using WinBUGS 1.4 (Lunn et al. 2000). Appendix 2
provides details of the model construction.
Depending on the species, some parameters may be poorly estimated. For example, if all sites
within an area were occupied, then an estimate of colonisation (γt) for that year will not be possible
as there are no unoccupied sites to colonise. Similarly, if all sites are unoccupied, then estimates of
persistence (øt) will not be possible.
For each process and area-pair, the resulting probability provides a measure of the evidence that the
treatment effect is real i.e., a probability of greater than 0.99 provides strong evidence of a positive
treatment effect, a probability between 0.95–0.99 provides moderate evidence of positive treatment
effect, and a probability between 0.9–0.95 provides weak evidence of a positive treatment effect.
Correspondingly, strong, moderate or weak evidence of a negative treatment effect are indicated by
small probabilities (e.g. 0.01, 0.05 and 0.1 respectively).
The probabilities correspond to the 95% credible intervals (CI). In general, strong evidence of a
positive treatment effect is indicated by the entire 95% CI being above zero. Similarly, strong
evidence of a negative treatment effect is indicated when the 95% CI is below zero. Where the 95%
CI includes 0, there will be either weak or no evidence for a treatment effect.
8 Arthur Rylah Institute for Environmental Research Technical Report Series No. 240
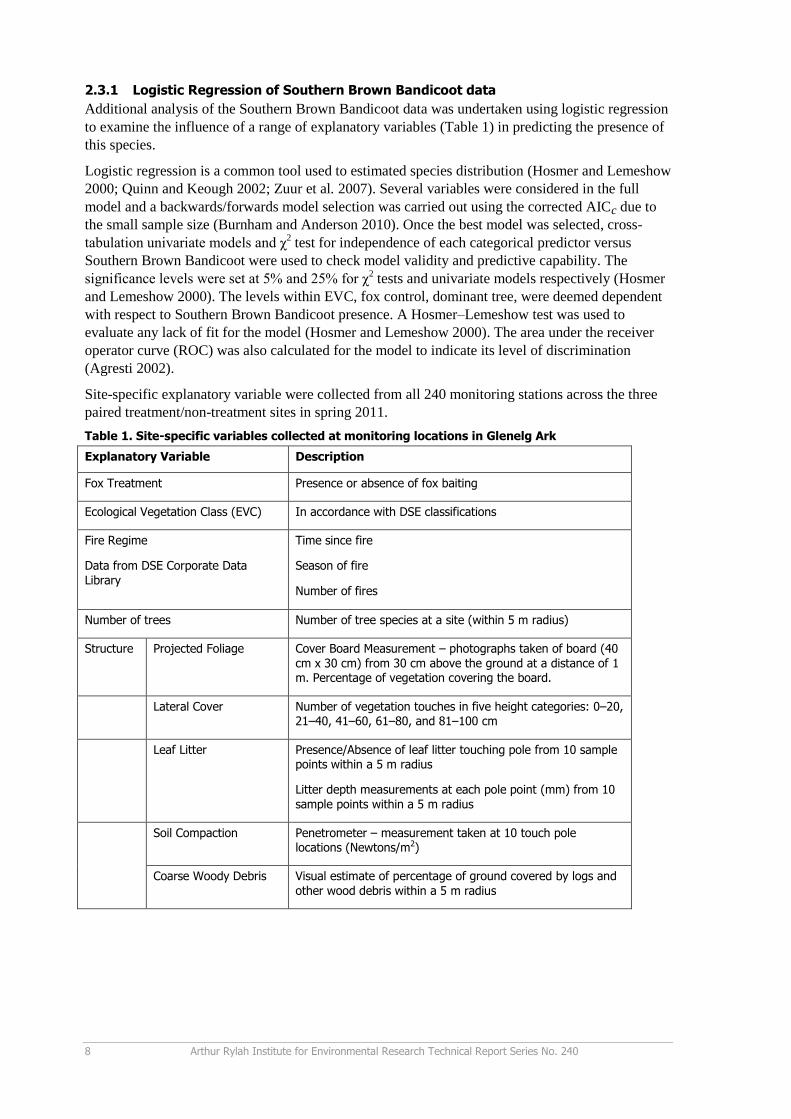
2.3.1 Logistic Regression of Southern Brown Bandicoot data
Additional analysis of the Southern Brown Bandicoot data was undertaken using logistic regression
to examine the influence of a range of explanatory variables (Table 1) in predicting the presence of
this species.
Logistic regression is a common tool used to estimated species distribution (Hosmer and Lemeshow
2000; Quinn and Keough 2002; Zuur et al. 2007). Several variables were considered in the full
model and a backwards/forwards model selection was carried out using the corrected AICc due to
the small sample size (Burnham and Anderson 2010). Once the best model was selected, cross-
tabulation univariate models and χ2 test for independence of each categorical predictor versus
Southern Brown Bandicoot were used to check model validity and predictive capability. The
significance levels were set at 5% and 25% for χ2 tests and univariate models respectively (Hosmer
and Lemeshow 2000). The levels within EVC, fox control, dominant tree, were deemed dependent
with respect to Southern Brown Bandicoot presence. A Hosmer–Lemeshow test was used to
evaluate any lack of fit for the model (Hosmer and Lemeshow 2000). The area under the receiver
operator curve (ROC) was also calculated for the model to indicate its level of discrimination
(Agresti 2002).
Site-specific explanatory variable were collected from all 240 monitoring stations across the three
paired treatment/non-treatment sites in spring 2011.
Table 1. Site-specific variables collected at monitoring locations in Glenelg Ark
Explanatory Variable Description
Fox Treatment Presence or absence of fox baiting
Ecological Vegetation Class (EVC) In accordance with DSE classifications
Fire Regime
Data from DSE Corporate Data
Library
Time since fire
Season of fire
Number of fires
Number of trees Number of tree species at a site (within 5 m radius)
Structure Projected Foliage Cover Board Measurement – photographs taken of board (40
cm x 30 cm) from 30 cm above the ground at a distance of 1 m. Percentage of vegetation covering the board.
Lateral Cover Number of vegetation touches in five height categories: 0–20, 21–40, 41–60, 61–80, and 81–100 cm
Leaf Litter Presence/Absence of leaf litter touching pole from 10 sample points within a 5 m radius
Litter depth measurements at each pole point (mm) from 10
sample points within a 5 m radius
Soil Compaction Penetrometer – measurement taken at 10 touch pole locations (Newtons/m2)
Coarse Woody Debris Visual estimate of percentage of ground covered by logs and
other wood debris within a 5 m radius
Glenelg Ark 2005–2011
Arthur Rylah Institute for Environmental Research Technical Report Series No. 240 9
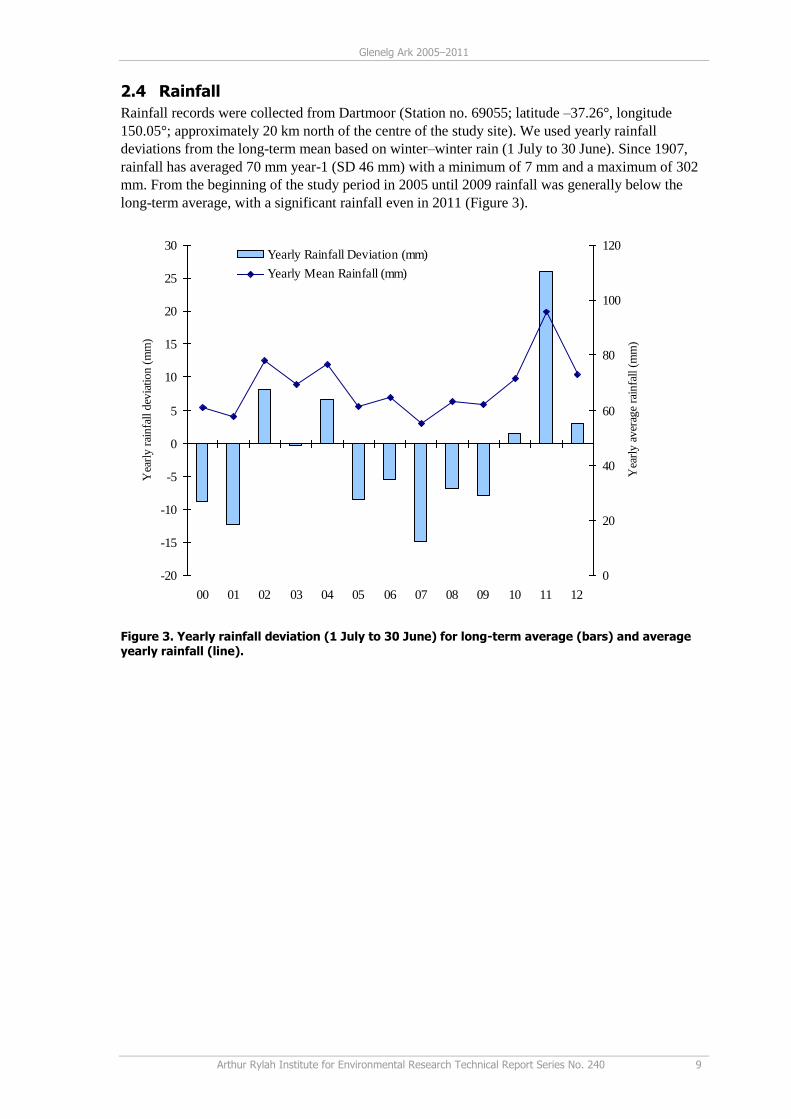
2.4 Rainfall
Rainfall records were collected from Dartmoor (Station no. 69055; latitude –37.26°, longitude
150.05°; approximately 20 km north of the centre of the study site). We used yearly rainfall
deviations from the long-term mean based on winter–winter rain (1 July to 30 June). Since 1907,
rainfall has averaged 70 mm year-1 (SD 46 mm) with a minimum of 7 mm and a maximum of 302
mm. From the beginning of the study period in 2005 until 2009 rainfall was generally below the
long-term average, with a significant rainfall even in 2011 (Figure 3).
-20
-15
-10
-5
0
5
10
15
20
25
30
00 01 02 03 04 05 06 07 08 09 10 11 12
Yea
rly
rai
nfa
ll d
evia
tio
n (
mm
)
0
20
40
60
80
100
120
Yea
rly
av
erag
e ra
infa
ll (
mm
)
Yearly Rainfall Deviation (mm)
Yearly Mean Rainfall (mm)
Figure 3. Yearly rainfall deviation (1 July to 30 June) for long-term average (bars) and average
yearly rainfall (line).
10 Arthur Rylah Institute for Environmental Research Technical Report Series No. 240
3 Results
3.1 Response of foxes to control
3.1.1 Lower Glenelg National Park
Free-feeding in the TMA and the NTMA commenced in July 2005 and continued until late
September 2005. Seventy-two poison baits were first laid in October 2005 in the TMA and were
checked fortnightly, and taken baits were replaced. Free-feeding at 46 bait stations continued in the
NTMA until the end of November 2005, baits being checked and replaced fortnightly.
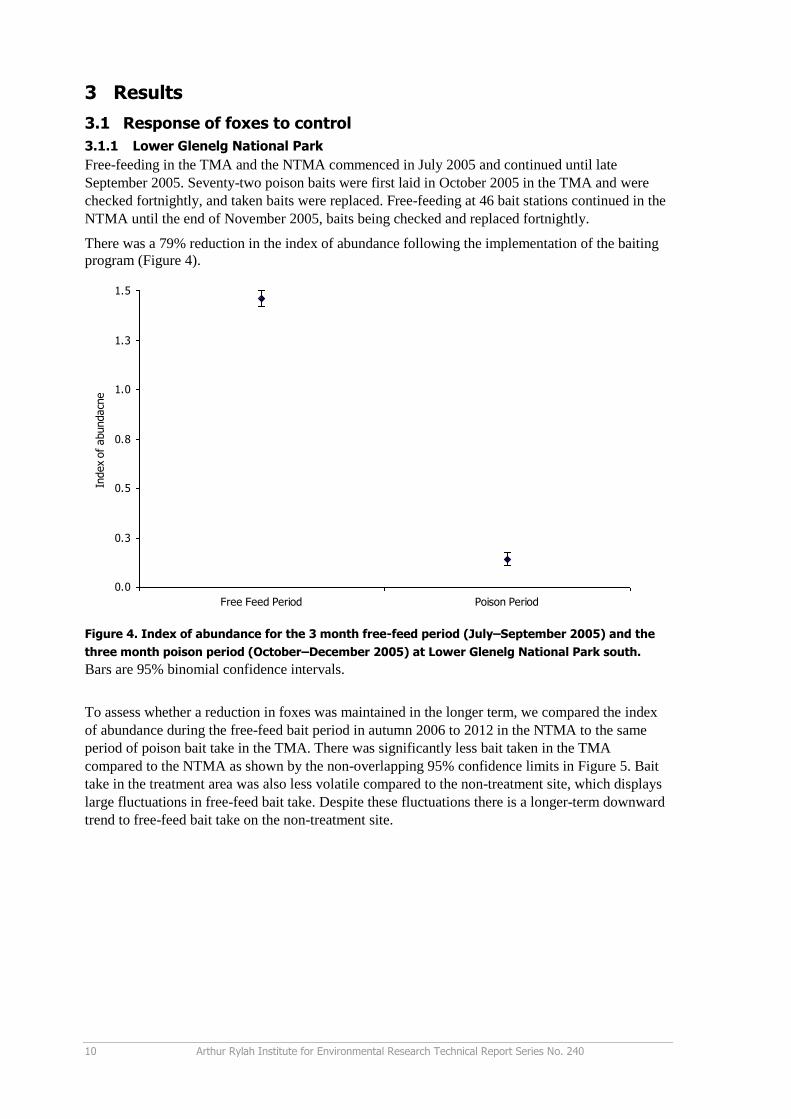
There was a 79% reduction in the index of abundance following the implementation of the baiting
program (Figure 4).
0.0
0.3
0.5
0.8
1.0
1.3
1.5
Free Feed Period Poison Period
Index
of
abundacn
e
Figure 4. Index of abundance for the 3 month free-feed period (July–September 2005) and the
three month poison period (October–December 2005) at Lower Glenelg National Park south.
Bars are 95% binomial confidence intervals.
To assess whether a reduction in foxes was maintained in the longer term, we compared the index
of abundance during the free-feed bait period in autumn 2006 to 2012 in the NTMA to the same
period of poison bait take in the TMA. There was significantly less bait taken in the TMA
compared to the NTMA as shown by the non-overlapping 95% confidence limits in Figure 5. Bait
take in the treatment area was also less volatile compared to the non-treatment site, which displays
large fluctuations in free-feed bait take. Despite these fluctuations there is a longer-term downward
trend to free-feed bait take on the non-treatment site.
Glenelg Ark 2005–2011
Arthur Rylah Institute for Environmental Research Technical Report Series No. 240 11
0.0
0.5
1.0
1.5
2.0
2.5
Aut-06 Aut-07 Aut-08 Aut-09 Aut-10 Aut-11 Aut-12
Index o
f abundance
Free Feed Poison
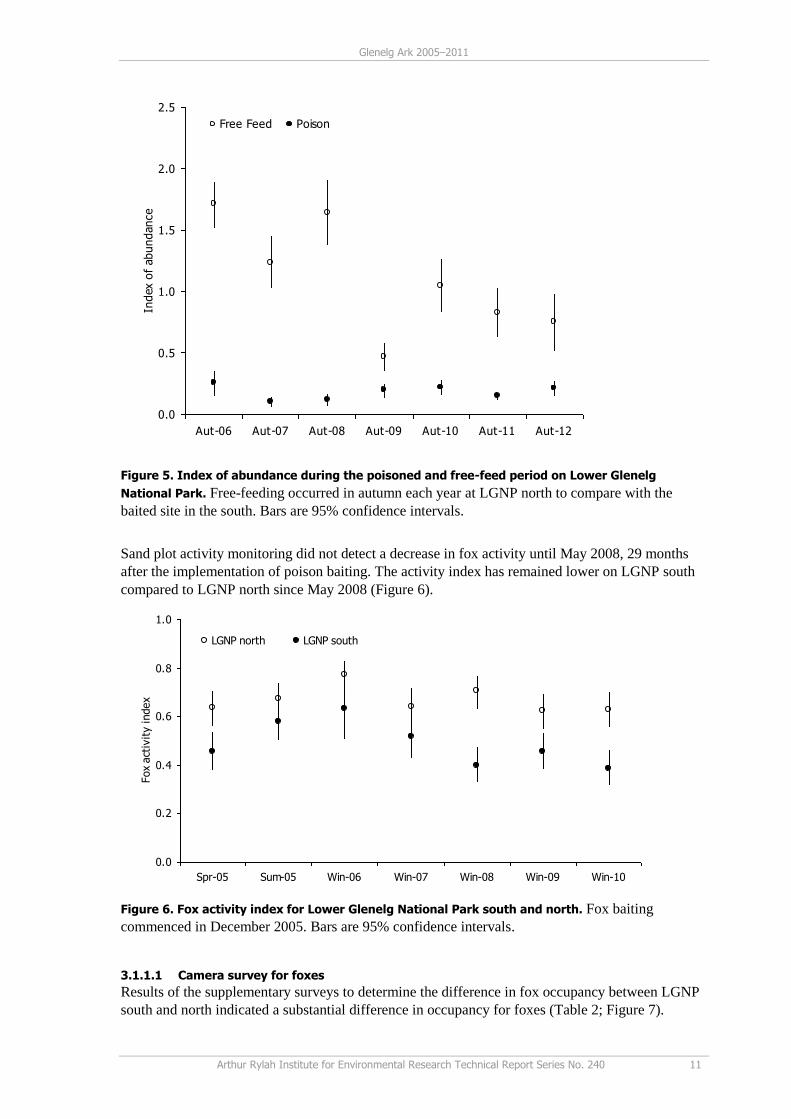
Figure 5. Index of abundance during the poisoned and free-feed period on Lower Glenelg
National Park. Free-feeding occurred in autumn each year at LGNP north to compare with the
baited site in the south. Bars are 95% confidence intervals.
Sand plot activity monitoring did not detect a decrease in fox activity until May 2008, 29 months
after the implementation of poison baiting. The activity index has remained lower on LGNP south
compared to LGNP north since May 2008 (Figure 6).
0.0
0.2
0.4
0.6
0.8
1.0
Spr-05 Sum-05 Win-06 Win-07 Win-08 Win-09 Win-10
Fox
act
ivit
y index
LGNP north LGNP south
Figure 6. Fox activity index for Lower Glenelg National Park south and north. Fox baiting
commenced in December 2005. Bars are 95% confidence intervals.
3.1.1.1 Camera survey for foxes
Results of the supplementary surveys to determine the difference in fox occupancy between LGNP
south and north indicated a substantial difference in occupancy for foxes (Table 2; Figure 7).
12 Arthur Rylah Institute for Environmental Research Technical Report Series No. 240
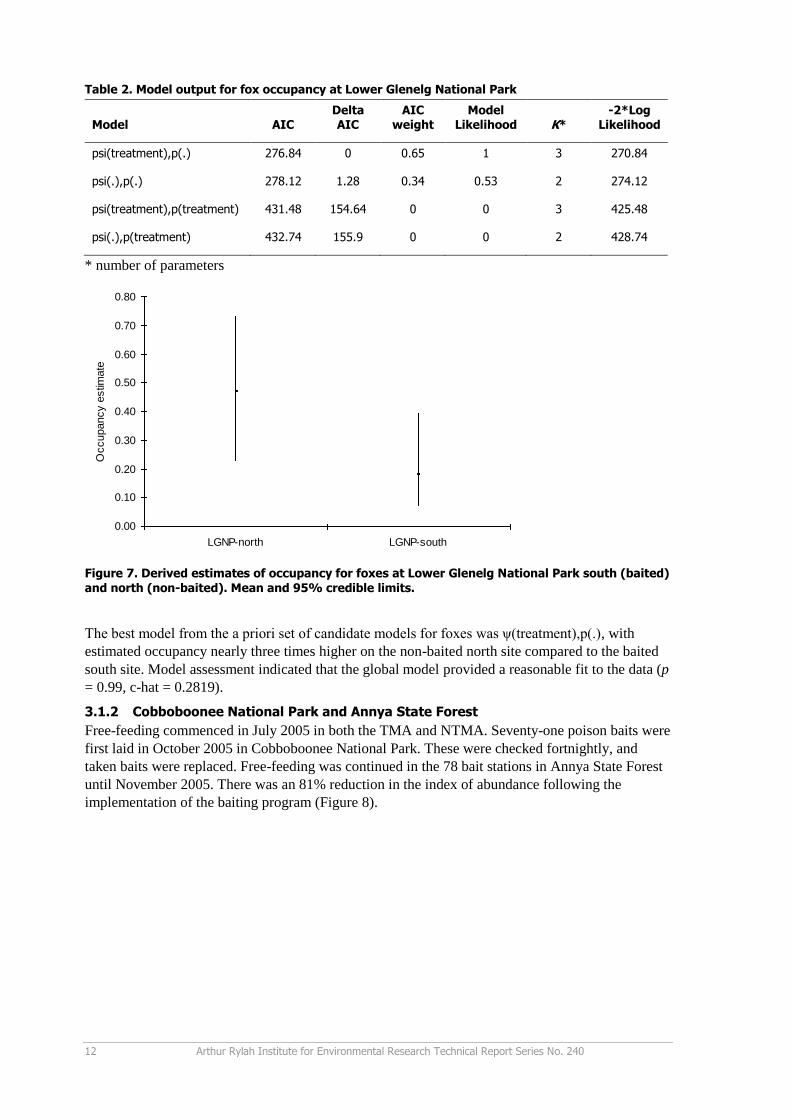
Table 2. Model output for fox occupancy at Lower Glenelg National Park
Model AIC Delta AIC
AIC weight
Model Likelihood K*
-2*Log Likelihood
psi(treatment),p(.) 276.84 0 0.65 1 3 270.84
psi(.),p(.) 278.12 1.28 0.34 0.53 2 274.12
psi(treatment),p(treatment) 431.48 154.64 0 0 3 425.48
psi(.),p(treatment) 432.74 155.9 0 0 2 428.74
* number of parameters
0.00
0.10
0.20
0.30
0.40
0.50
0.60
0.70
0.80
LGNP-north LGNP-south
Occupancy e
stim
ate
Figure 7. Derived estimates of occupancy for foxes at Lower Glenelg National Park south (baited)
and north (non-baited). Mean and 95% credible limits.
The best model from the a priori set of candidate models for foxes was ψ(treatment),p(.), with
estimated occupancy nearly three times higher on the non-baited north site compared to the baited
south site. Model assessment indicated that the global model provided a reasonable fit to the data (p
= 0.99, c-hat = 0.2819).
3.1.2 Cobboboonee National Park and Annya State Forest
Free-feeding commenced in July 2005 in both the TMA and NTMA. Seventy-one poison baits were
first laid in October 2005 in Cobboboonee National Park. These were checked fortnightly, and
taken baits were replaced. Free-feeding was continued in the 78 bait stations in Annya State Forest
until November 2005. There was an 81% reduction in the index of abundance following the
implementation of the baiting program (Figure 8).
Glenelg Ark 2005–2011
Arthur Rylah Institute for Environmental Research Technical Report Series No. 240 13
0
0.1
0.2
0.3
0.4
0.5
0.6
0.7
0.8
Free Feed Period Poison Period
Index
of
abundance
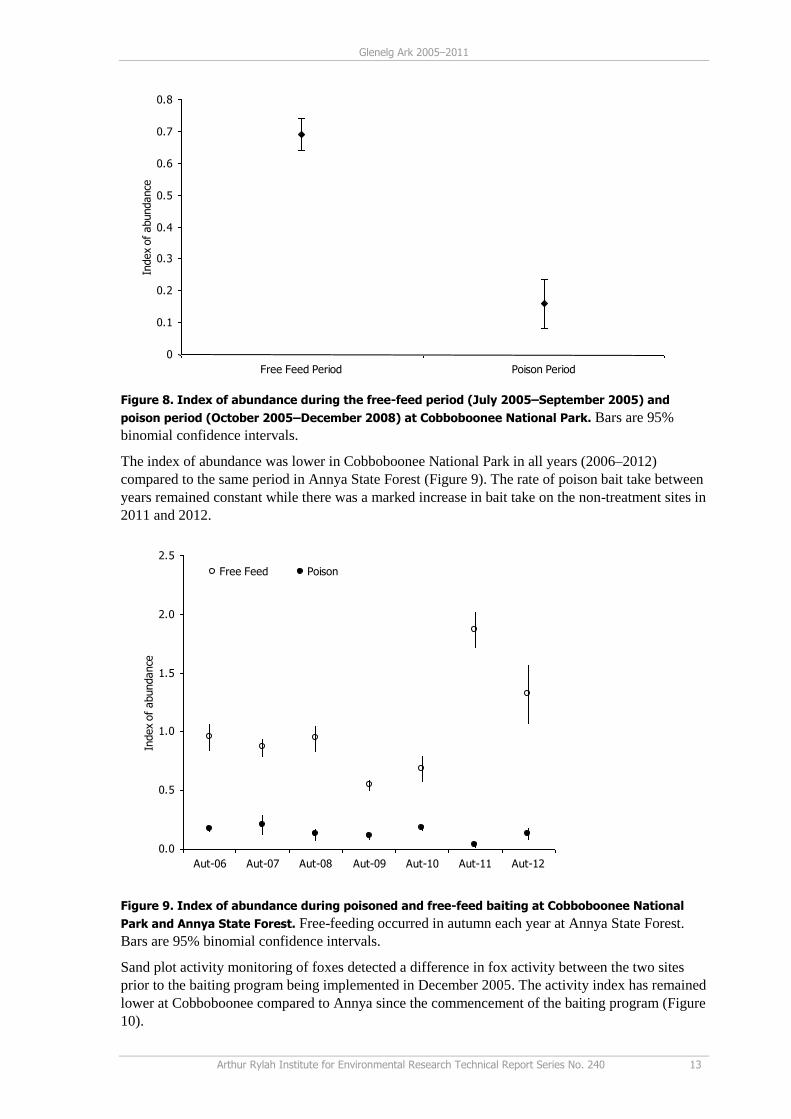
Figure 8. Index of abundance during the free-feed period (July 2005–September 2005) and
poison period (October 2005–December 2008) at Cobboboonee National Park. Bars are 95%
binomial confidence intervals.
The index of abundance was lower in Cobboboonee National Park in all years (2006–2012)
compared to the same period in Annya State Forest (Figure 9). The rate of poison bait take between
years remained constant while there was a marked increase in bait take on the non-treatment sites in
2011 and 2012.
0.0
0.5
1.0
1.5
2.0
2.5
Aut-06 Aut-07 Aut-08 Aut-09 Aut-10 Aut-11 Aut-12
Index
of
abundance
Free Feed Poison
Figure 9. Index of abundance during poisoned and free-feed baiting at Cobboboonee National
Park and Annya State Forest. Free-feeding occurred in autumn each year at Annya State Forest.
Bars are 95% binomial confidence intervals.
Sand plot activity monitoring of foxes detected a difference in fox activity between the two sites
prior to the baiting program being implemented in December 2005. The activity index has remained
lower at Cobboboonee compared to Annya since the commencement of the baiting program (Figure
10).
14 Arthur Rylah Institute for Environmental Research Technical Report Series No. 240
0.0
0.2
0.4
0.6
0.8
1.0
Spr-05 Sum-05 Win-06 Win-07 Win-08 Win-09 Win-10
Fox
act
ivit
y index
Annya Cobboboonee
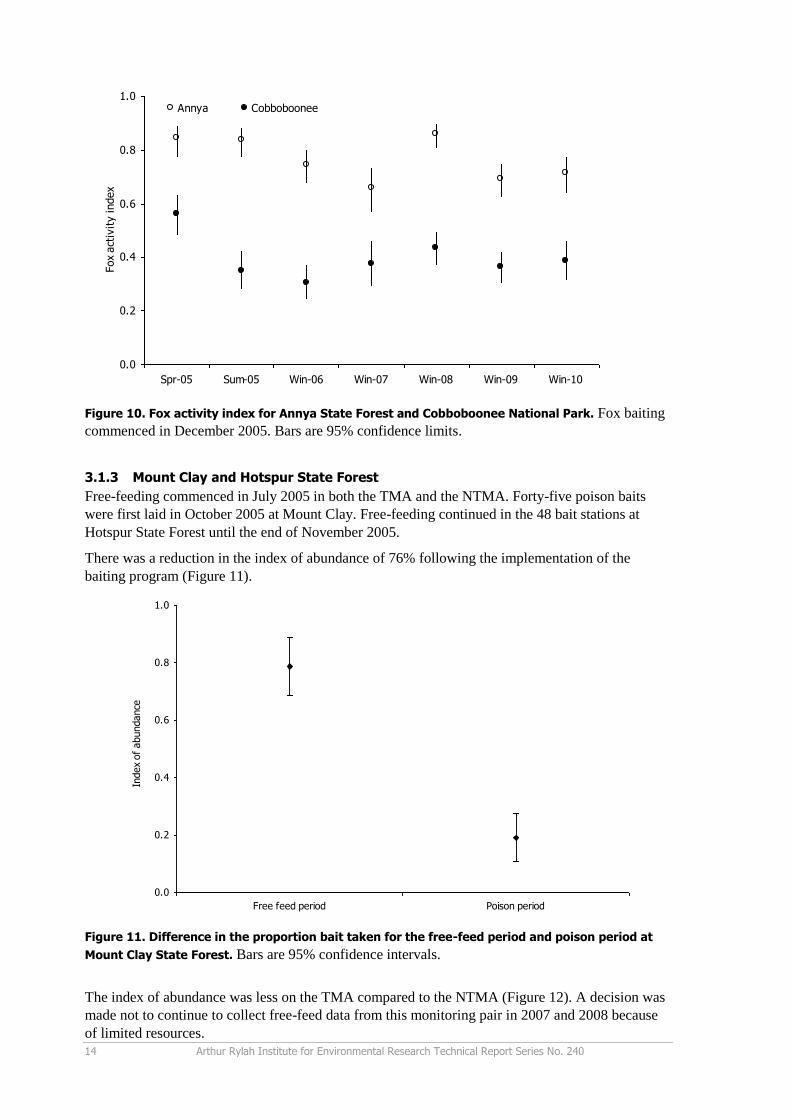
Figure 10. Fox activity index for Annya State Forest and Cobboboonee National Park. Fox baiting
commenced in December 2005. Bars are 95% confidence limits.
3.1.3 Mount Clay and Hotspur State Forest
Free-feeding commenced in July 2005 in both the TMA and the NTMA. Forty-five poison baits
were first laid in October 2005 at Mount Clay. Free-feeding continued in the 48 bait stations at
Hotspur State Forest until the end of November 2005.
There was a reduction in the index of abundance of 76% following the implementation of the
baiting program (Figure 11).
0.0
0.2
0.4
0.6
0.8
1.0
Free feed period Poison period
Index
of
abundance
Figure 11. Difference in the proportion bait taken for the free-feed period and poison period at
Mount Clay State Forest. Bars are 95% confidence intervals.
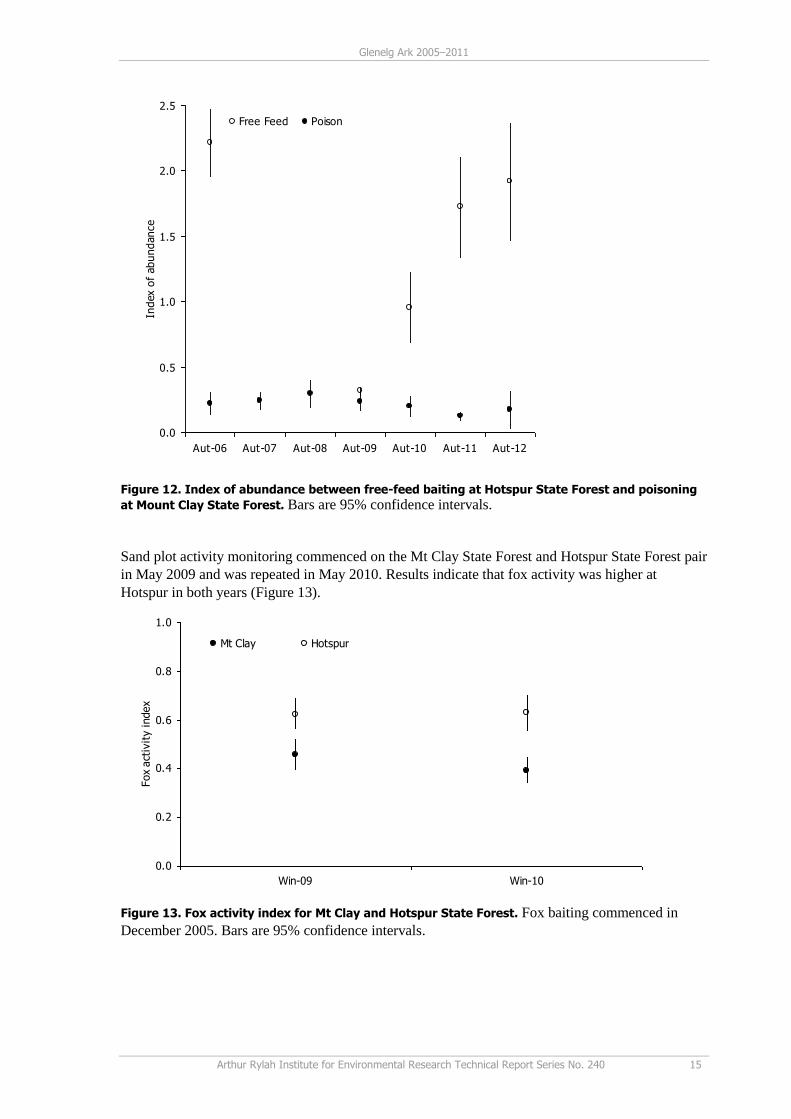
The index of abundance was less on the TMA compared to the NTMA (Figure 12). A decision was
made not to continue to collect free-feed data from this monitoring pair in 2007 and 2008 because
of limited resources.
Glenelg Ark 2005–2011
Arthur Rylah Institute for Environmental Research Technical Report Series No. 240 15
0.0
0.5
1.0
1.5
2.0
2.5
Aut-06 Aut-07 Aut-08 Aut-09 Aut-10 Aut-11 Aut-12
Index o
f abundance
Free Feed Poison
Figure 12. Index of abundance between free-feed baiting at Hotspur State Forest and poisoning
at Mount Clay State Forest. Bars are 95% confidence intervals.
Sand plot activity monitoring commenced on the Mt Clay State Forest and Hotspur State Forest pair
in May 2009 and was repeated in May 2010. Results indicate that fox activity was higher at
Hotspur in both years (Figure 13).
0.0
0.2
0.4
0.6
0.8
1.0
Win-09 Win-10
Fox
act
ivit
y index
Mt Clay Hotspur
Figure 13. Fox activity index for Mt Clay and Hotspur State Forest. Fox baiting commenced in
December 2005. Bars are 95% confidence intervals.
16 Arthur Rylah Institute for Environmental Research Technical Report Series No. 240
4 Monitoring changes in native species
In each of the sampling years the main species of interest (Long-nosed Potoroo, Southern Brown
Bandicoot and Common Brushtail Possum) were detected. Figures in Appendices 3 and 4 show the
monitoring station and year of detection for Long-nosed Potoroos and Southern Brown Bandicoots
respectively.
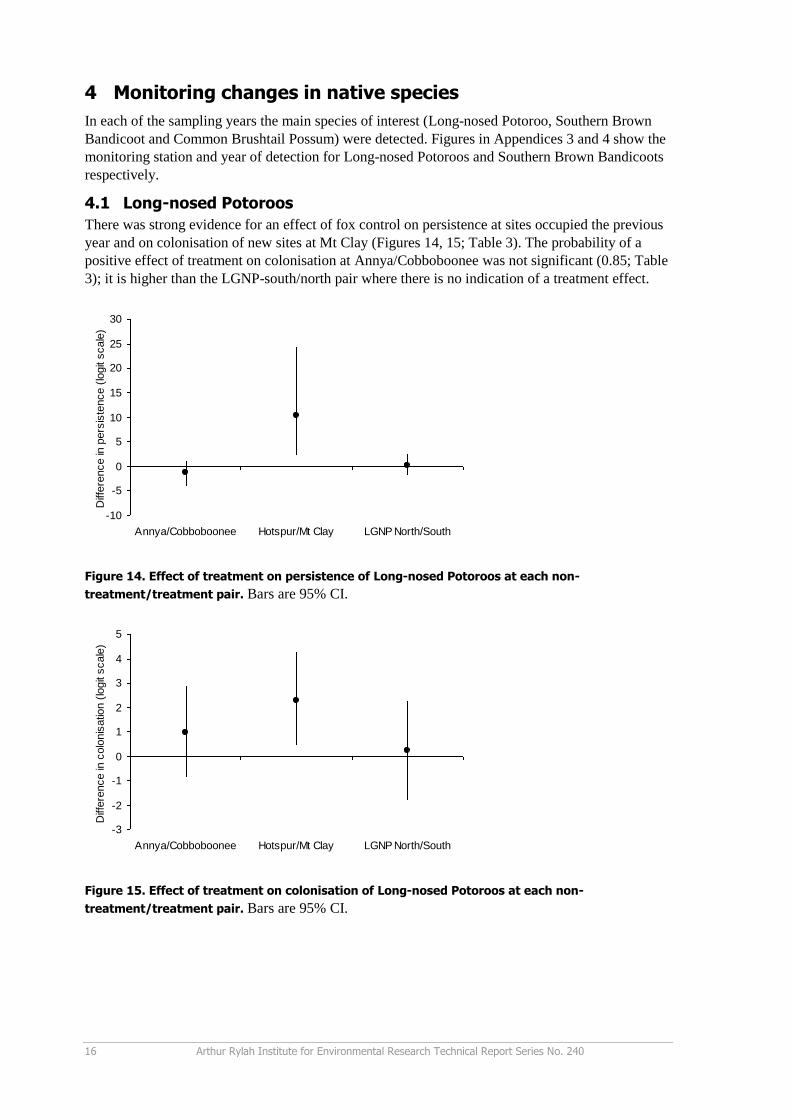
4.1 Long-nosed Potoroos
There was strong evidence for an effect of fox control on persistence at sites occupied the previous
year and on colonisation of new sites at Mt Clay (Figures 14, 15; Table 3). The probability of a
positive effect of treatment on colonisation at Annya/Cobboboonee was not significant (0.85; Table
3); it is higher than the LGNP-south/north pair where there is no indication of a treatment effect.
-10
-5
0
5
10
15
20
25
30
Annya/Cobboboonee Hotspur/Mt Clay LGNP North/South
Diff
ere
nce in
pers
iste
nce (
logit
scale
)
Figure 14. Effect of treatment on persistence of Long-nosed Potoroos at each non-
treatment/treatment pair. Bars are 95% CI.
-3
-2
-1
0
1
2
3
4
5
Annya/Cobboboonee Hotspur/Mt Clay LGNP North/South
Diff
ere
nce in
colo
nis
atio
n (
logit
scale
)
Figure 15. Effect of treatment on colonisation of Long-nosed Potoroos at each non-
treatment/treatment pair. Bars are 95% CI.
Glenelg Ark 2005–2011
Arthur Rylah Institute for Environmental Research Technical Report Series No. 240 17
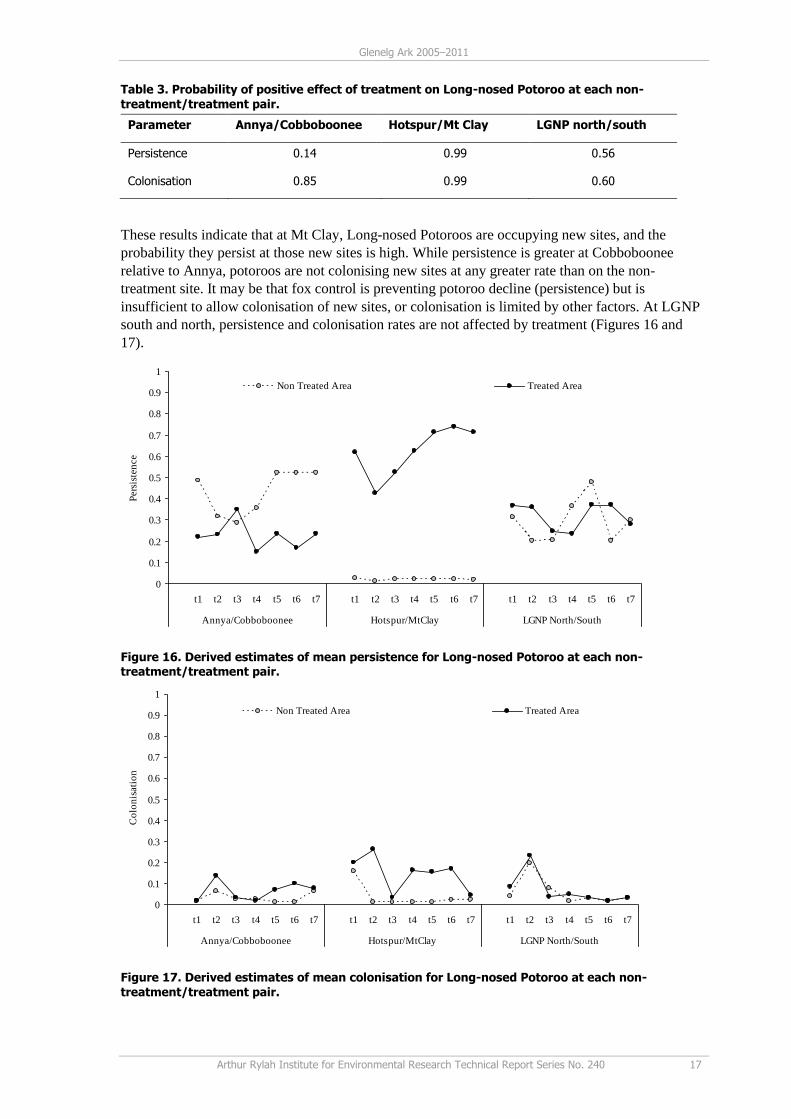
Table 3. Probability of positive effect of treatment on Long-nosed Potoroo at each non-
treatment/treatment pair.
Parameter Annya/Cobboboonee Hotspur/Mt Clay LGNP north/south
Persistence 0.14 0.99 0.56
Colonisation 0.85 0.99 0.60
These results indicate that at Mt Clay, Long-nosed Potoroos are occupying new sites, and the
probability they persist at those new sites is high. While persistence is greater at Cobboboonee
relative to Annya, potoroos are not colonising new sites at any greater rate than on the non-
treatment site. It may be that fox control is preventing potoroo decline (persistence) but is
insufficient to allow colonisation of new sites, or colonisation is limited by other factors. At LGNP
south and north, persistence and colonisation rates are not affected by treatment (Figures 16 and
17).
0
0.1
0.2
0.3
0.4
0.5
0.6
0.7
0.8
0.9
1
t1 t2 t3 t4 t5 t6 t7 t1 t2 t3 t4 t5 t6 t7 t1 t2 t3 t4 t5 t6 t7
Annya/Cobboboonee Hotspur/MtClay LGNP North/South
Pers
iste
nce
Non Treated Area Treated Area
Figure 16. Derived estimates of mean persistence for Long-nosed Potoroo at each non-treatment/treatment pair.
0
0.1
0.2
0.3
0.4
0.5
0.6
0.7
0.8
0.9
1
t1 t2 t3 t4 t5 t6 t7 t1 t2 t3 t4 t5 t6 t7 t1 t2 t3 t4 t5 t6 t7
Annya/Cobboboonee Hotspur/MtClay LGNP North/South
Co
lon
isati
on
Non Treated Area Treated Area
Figure 17. Derived estimates of mean colonisation for Long-nosed Potoroo at each non-
treatment/treatment pair.
18 Arthur Rylah Institute for Environmental Research Technical Report Series No. 240
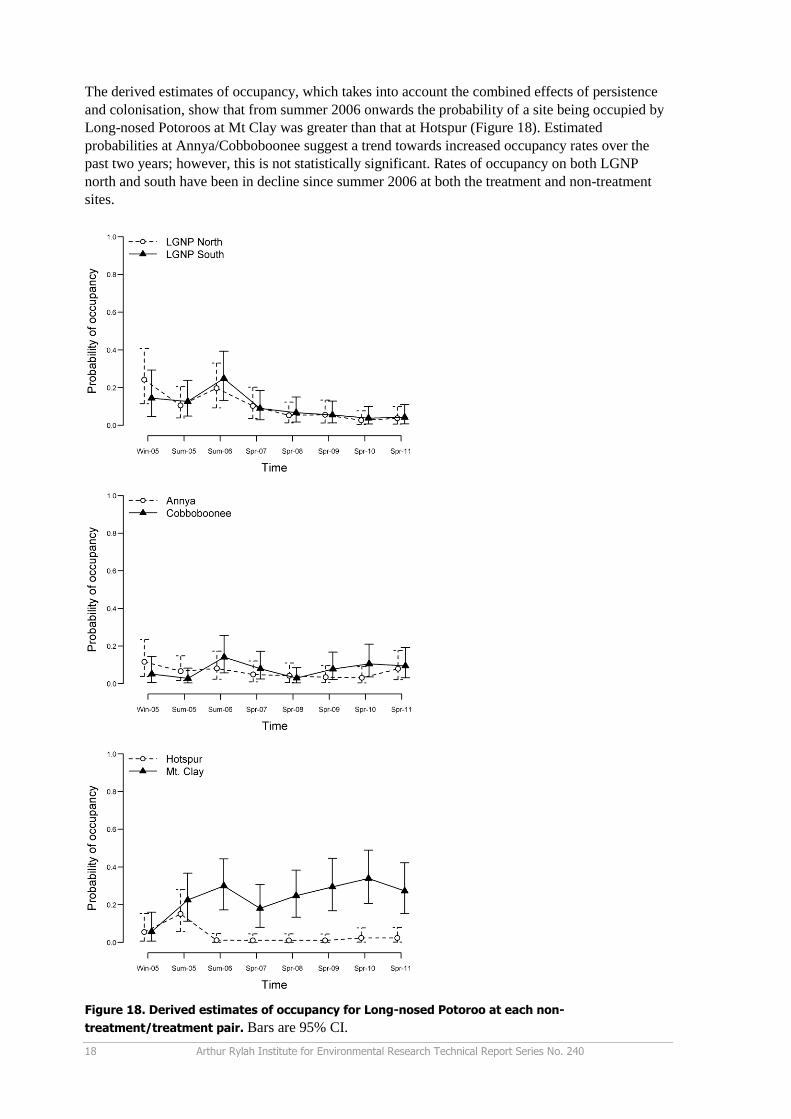
The derived estimates of occupancy, which takes into account the combined effects of persistence
and colonisation, show that from summer 2006 onwards the probability of a site being occupied by
Long-nosed Potoroos at Mt Clay was greater than that at Hotspur (Figure 18). Estimated
probabilities at Annya/Cobboboonee suggest a trend towards increased occupancy rates over the
past two years; however, this is not statistically significant. Rates of occupancy on both LGNP
north and south have been in decline since summer 2006 at both the treatment and non-treatment
sites.
Figure 18. Derived estimates of occupancy for Long-nosed Potoroo at each non-
treatment/treatment pair. Bars are 95% CI.
Glenelg Ark 2005–2011
Arthur Rylah Institute for Environmental Research Technical Report Series No. 240 19
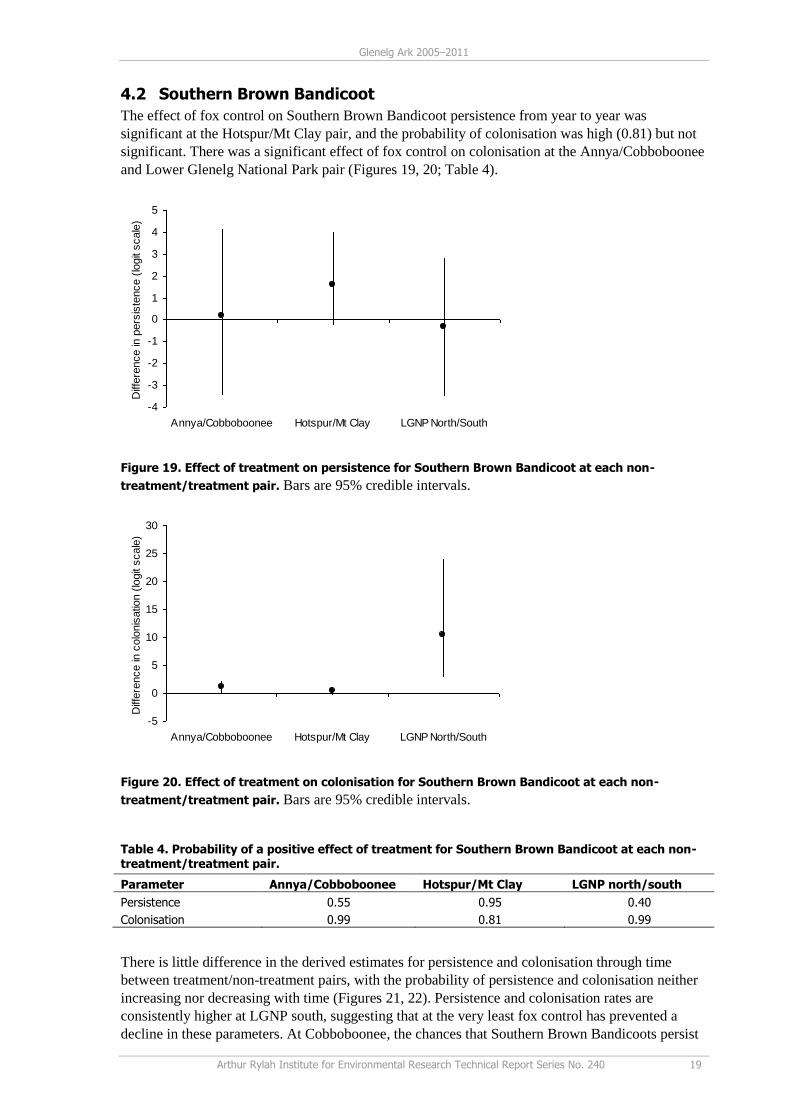
4.2 Southern Brown Bandicoot
The effect of fox control on Southern Brown Bandicoot persistence from year to year was
significant at the Hotspur/Mt Clay pair, and the probability of colonisation was high (0.81) but not
significant. There was a significant effect of fox control on colonisation at the Annya/Cobboboonee
and Lower Glenelg National Park pair (Figures 19, 20; Table 4).
-4
-3
-2
-1
0
1
2
3
4
5
Annya/Cobboboonee Hotspur/Mt Clay LGNP North/South
Diff
ere
nce in
pers
iste
nce (
logit
scale
)
Figure 19. Effect of treatment on persistence for Southern Brown Bandicoot at each non-
treatment/treatment pair. Bars are 95% credible intervals.
-5
0
5
10
15
20
25
30
Annya/Cobboboonee Hotspur/Mt Clay LGNP North/South
Diff
ere
nce in
colo
nis
atio
n (
logit
scale
)
Figure 20. Effect of treatment on colonisation for Southern Brown Bandicoot at each non-
treatment/treatment pair. Bars are 95% credible intervals.
Table 4. Probability of a positive effect of treatment for Southern Brown Bandicoot at each non-treatment/treatment pair.
Parameter Annya/Cobboboonee Hotspur/Mt Clay LGNP north/south
Persistence 0.55 0.95 0.40
Colonisation 0.99 0.81 0.99
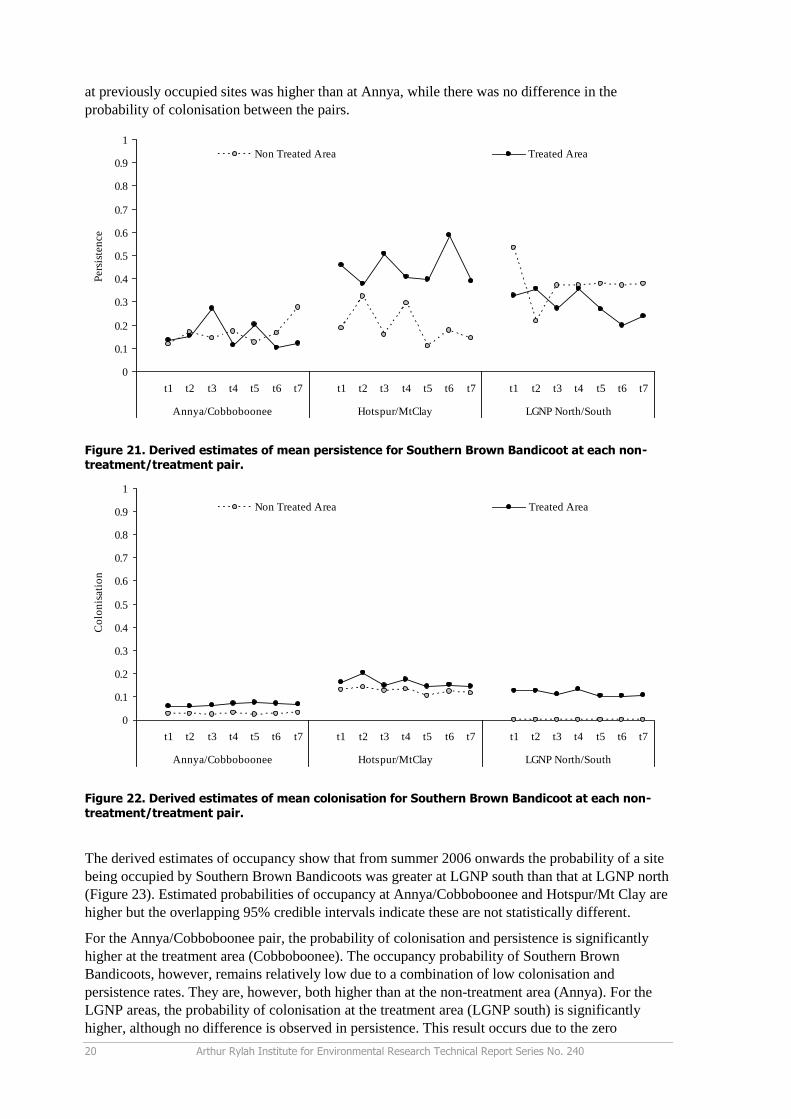
There is little difference in the derived estimates for persistence and colonisation through time
between treatment/non-treatment pairs, with the probability of persistence and colonisation neither
increasing nor decreasing with time (Figures 21, 22). Persistence and colonisation rates are
consistently higher at LGNP south, suggesting that at the very least fox control has prevented a
decline in these parameters. At Cobboboonee, the chances that Southern Brown Bandicoots persist
20 Arthur Rylah Institute for Environmental Research Technical Report Series No. 240
at previously occupied sites was higher than at Annya, while there was no difference in the
probability of colonisation between the pairs.
0
0.1
0.2
0.3
0.4
0.5
0.6
0.7
0.8
0.9
1
t1 t2 t3 t4 t5 t6 t7 t1 t2 t3 t4 t5 t6 t7 t1 t2 t3 t4 t5 t6 t7
Annya/Cobboboonee Hotspur/MtClay LGNP North/South
Pers
iste
nce
Non Treated Area Treated Area
Figure 21. Derived estimates of mean persistence for Southern Brown Bandicoot at each non-treatment/treatment pair.
0
0.1
0.2
0.3
0.4
0.5
0.6
0.7
0.8
0.9
1
t1 t2 t3 t4 t5 t6 t7 t1 t2 t3 t4 t5 t6 t7 t1 t2 t3 t4 t5 t6 t7
Annya/Cobboboonee Hotspur/MtClay LGNP North/South
Co
lon
isati
on
Non Treated Area Treated Area
Figure 22. Derived estimates of mean colonisation for Southern Brown Bandicoot at each non-
treatment/treatment pair.
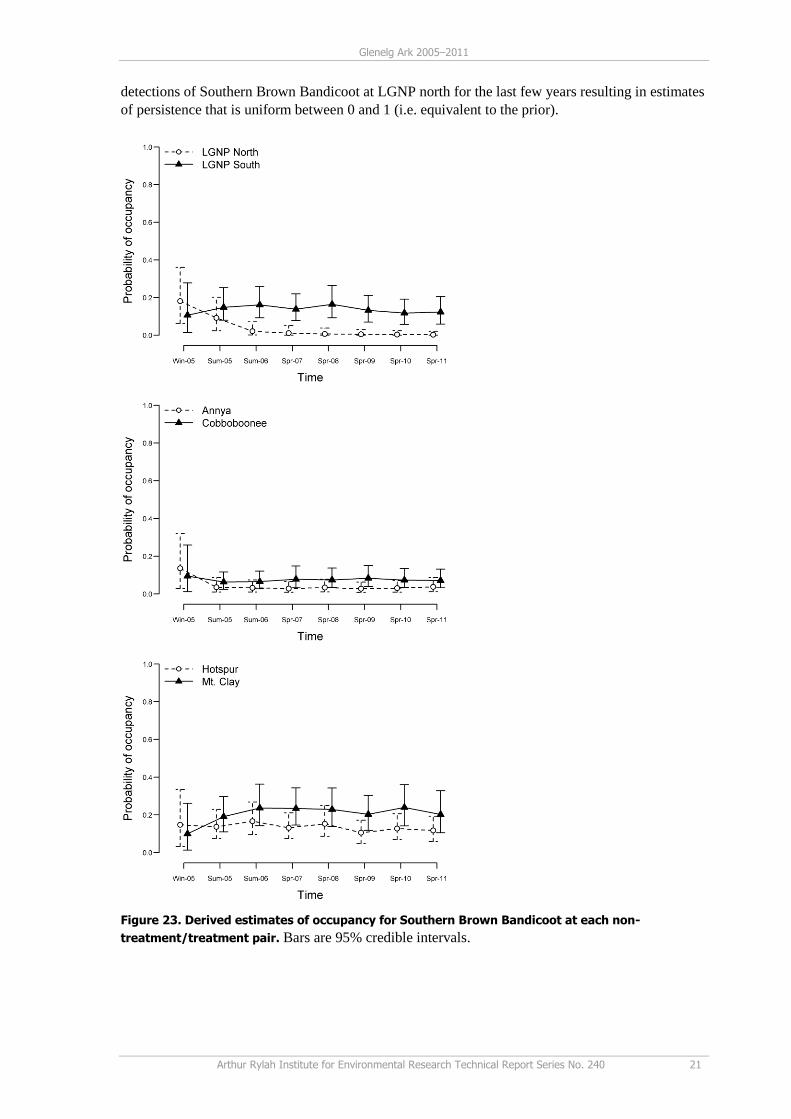
The derived estimates of occupancy show that from summer 2006 onwards the probability of a site
being occupied by Southern Brown Bandicoots was greater at LGNP south than that at LGNP north
(Figure 23). Estimated probabilities of occupancy at Annya/Cobboboonee and Hotspur/Mt Clay are
higher but the overlapping 95% credible intervals indicate these are not statistically different.
For the Annya/Cobboboonee pair, the probability of colonisation and persistence is significantly
higher at the treatment area (Cobboboonee). The occupancy probability of Southern Brown
Bandicoots, however, remains relatively low due to a combination of low colonisation and
persistence rates. They are, however, both higher than at the non-treatment area (Annya). For the
LGNP areas, the probability of colonisation at the treatment area (LGNP south) is significantly
higher, although no difference is observed in persistence. This result occurs due to the zero
Glenelg Ark 2005–2011
Arthur Rylah Institute for Environmental Research Technical Report Series No. 240 21
detections of Southern Brown Bandicoot at LGNP north for the last few years resulting in estimates
of persistence that is uniform between 0 and 1 (i.e. equivalent to the prior).
Figure 23. Derived estimates of occupancy for Southern Brown Bandicoot at each non-
treatment/treatment pair. Bars are 95% credible intervals.
22 Arthur Rylah Institute for Environmental Research Technical Report Series No. 240
4.2.1 Additional analysis of Southern Brown Bandicoot data
Boxplots of the covariates (separated by presence) indicated that per cent lateral cover had the
greatest difference, with coarse woody debris and soil approaching significance. Fitting the
univariate models for each covariate suggested that, at least initially, percentage lateral cover
squared, percentage vertical cover, litter depth and the number of trees may also be included in the
model. The model included fox control, EVC, dominant tree, and per cent lateral coverage squared.
The most parsimonious model estimates for the parameters in the best model are:
The model provided an adequate fit to the data (Hosmer–Lemeshow test 0.2). There is insufficient
evidence to suggest a lack of fit of the model to the data. For the model, using 0.5 as an intuitive
cut-point, the sensitivity (correctly classifying presence) was 52.9% and the specificity (correctly
classifying absence) was 79.9%. The area under the ROC curve was 0.79, which we consider to be
an acceptable level of discrimination between sites with and without Southern Brown Bandicoots.
These factors combined and no pattern in the residuals means that there is insufficient evidence to
reject any of the assumptions underlying the model.
As can be seen from Table 5, fox control increased the odds ratio of the presence of Southern
Brown Bandicoots by an estimated factor of 4.82 when compared to areas without fox control.
Similarly, in EVC 15 the odds ratio is about one sixth (factor of 0.16) of the ‘Other’ EVCs
surveyed. As the percentage lateral coverage increases, the odds ratio of Southern Brown
Bandicoots increases. For instance, an increase of 10% in the percentage of lateral coverage is
estimated to increase the odds ratio of Southern Brown Bandicoots by 2.5% (factor of 1.025) if all
other variables remain fixed. The model predicts 84.5% likelihood of Southern Brown Bandicoots
being present in an area with fox control, in an EVC classified as ‘Other’, with Manna Gums being
a dominant tree and the lateral cover of 67.53% (the upper quartile). Finally, the model predicts
2.3% likelihood of Southern Brown Bandicoots being present in an area without fox control, in
herb-rich woodlands, with the dominant tree not Manna Gums or Stringy Bark and the lateral cover
of 39.65% (the lower quartile).
The dominant tree classes were predominantly Stringy Bark (111) and Manna Gum/Stringy Bark
(69). We therefore collapsed the set into three groups: ‘Manna Gum Dominant’, ‘Stringy Bark
Dominant’ (without Manna Gum) where the remaining dominant trees form the group ‘Other’.
2
BarkStringy Manna
1532
0002.094.027.1
28.283.180.047.057.1ˆlogit
LatCoveeDominantTreeDominantTr
EVCEVCEVCFoxControl
Glenelg Ark 2005–2011
Arthur Rylah Institute for Environmental Research Technical Report Series No. 240 23
Table 5. The odds ratios for each variable in the final model, including 95% confidence intervals.
Variable Value Odds Ratio 95% CI
Fox Control No 1.00
Yes 4.82 2.46 9.88
EVC
2 0.62 0.18 2.13
3 0.45 0.16 1.25
15 0.16 0.05 0.53
‘Other’ 1.00
Dominant Tree Manna Gum 3.57 1.13 12.79
Stringy Bark 2.56 0.86 8.90
Percentage Lateral Coverage Quadratic 1.0002 1.00008 1.0042
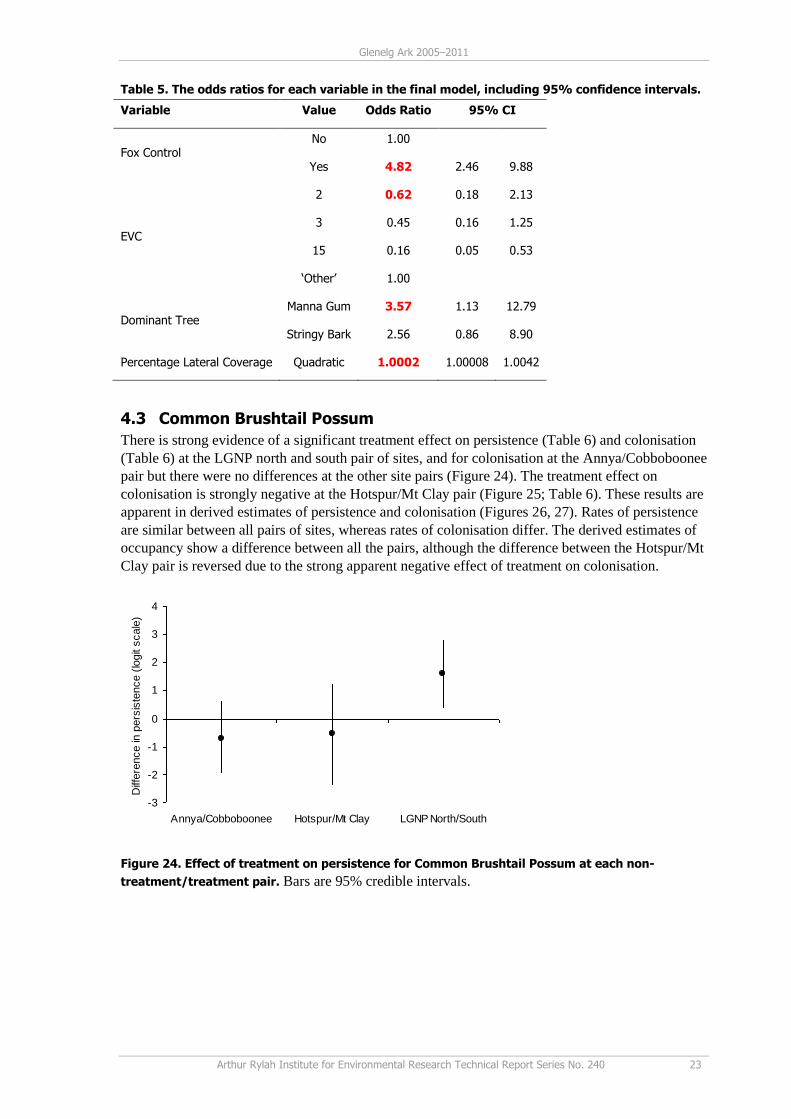
4.3 Common Brushtail Possum
There is strong evidence of a significant treatment effect on persistence (Table 6) and colonisation
(Table 6) at the LGNP north and south pair of sites, and for colonisation at the Annya/Cobboboonee
pair but there were no differences at the other site pairs (Figure 24). The treatment effect on
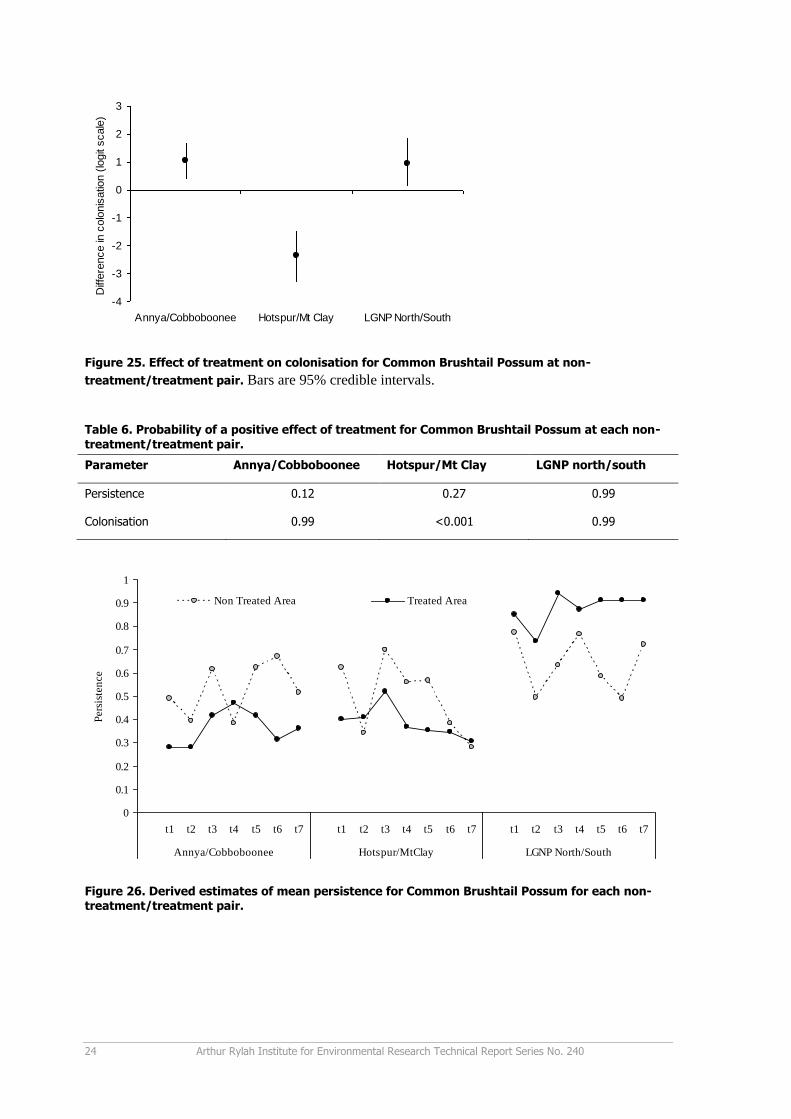
colonisation is strongly negative at the Hotspur/Mt Clay pair (Figure 25; Table 6). These results are
apparent in derived estimates of persistence and colonisation (Figures 26, 27). Rates of persistence
are similar between all pairs of sites, whereas rates of colonisation differ. The derived estimates of
occupancy show a difference between all the pairs, although the difference between the Hotspur/Mt
Clay pair is reversed due to the strong apparent negative effect of treatment on colonisation.
-3
-2
-1
0
1
2
3
4
Annya/Cobboboonee Hotspur/Mt Clay LGNP North/South
Diff
ere
nce in
pers
iste
nce (
logit
scale
)
Figure 24. Effect of treatment on persistence for Common Brushtail Possum at each non-
treatment/treatment pair. Bars are 95% credible intervals.
24 Arthur Rylah Institute for Environmental Research Technical Report Series No. 240
-4
-3
-2
-1
0
1
2
3
Annya/Cobboboonee Hotspur/Mt Clay LGNP North/South
Diff
ere
nce in
colo
nis
atio
n (
logit
scale
)
Figure 25. Effect of treatment on colonisation for Common Brushtail Possum at non-
treatment/treatment pair. Bars are 95% credible intervals.
Table 6. Probability of a positive effect of treatment for Common Brushtail Possum at each non-
treatment/treatment pair.
Parameter Annya/Cobboboonee Hotspur/Mt Clay LGNP north/south
Persistence 0.12 0.27 0.99
Colonisation 0.99 <0.001 0.99
0
0.1
0.2
0.3
0.4
0.5
0.6
0.7
0.8
0.9
1
t1 t2 t3 t4 t5 t6 t7 t1 t2 t3 t4 t5 t6 t7 t1 t2 t3 t4 t5 t6 t7
Annya/Cobboboonee Hotspur/MtClay LGNP North/South
Pers
iste
nce
Non Treated Area Treated Area
Figure 26. Derived estimates of mean persistence for Common Brushtail Possum for each non-
treatment/treatment pair.
Glenelg Ark 2005–2011
Arthur Rylah Institute for Environmental Research Technical Report Series No. 240 25
0
0.1
0.2
0.3
0.4
0.5
0.6
0.7
0.8
0.9
1
t1 t2 t3 t4 t5 t6 t7 t1 t2 t3 t4 t5 t6 t7 t1 t2 t3 t4 t5 t6 t7
Annya/Cobboboonee Hotspur/MtClay LGNP North/South
Co
lon
isati
on
Non Treated Area Treated Area
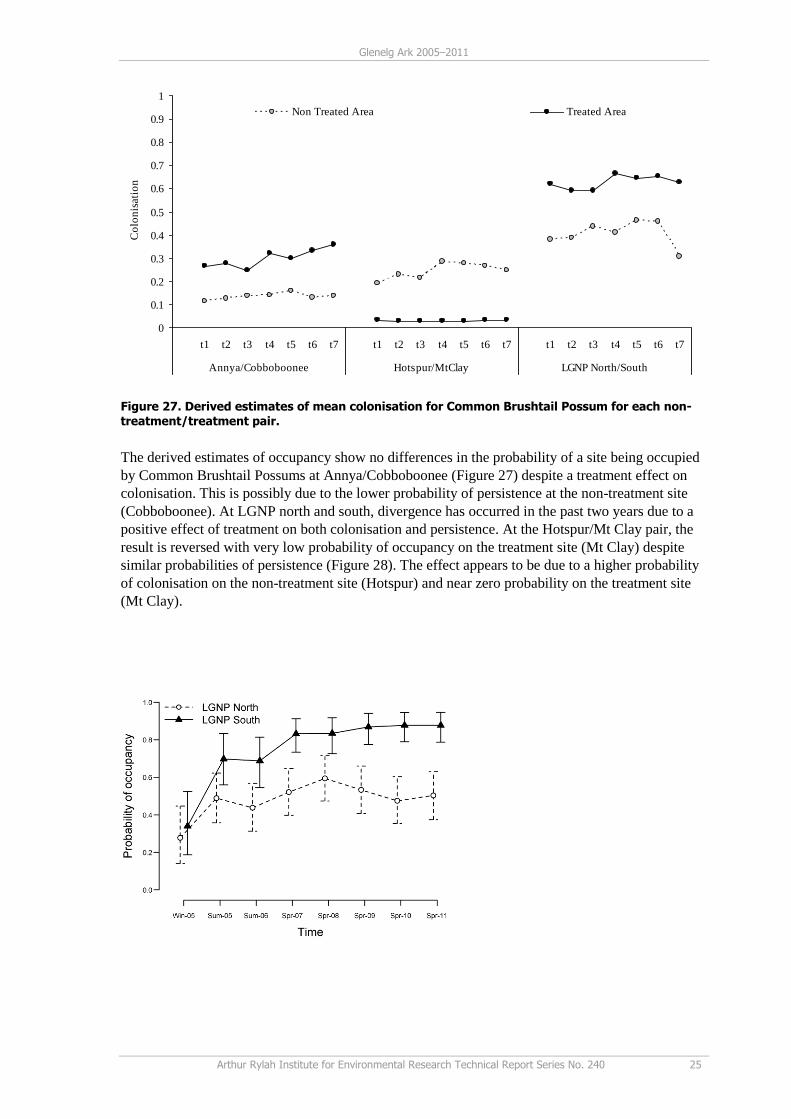
Figure 27. Derived estimates of mean colonisation for Common Brushtail Possum for each non-
treatment/treatment pair.
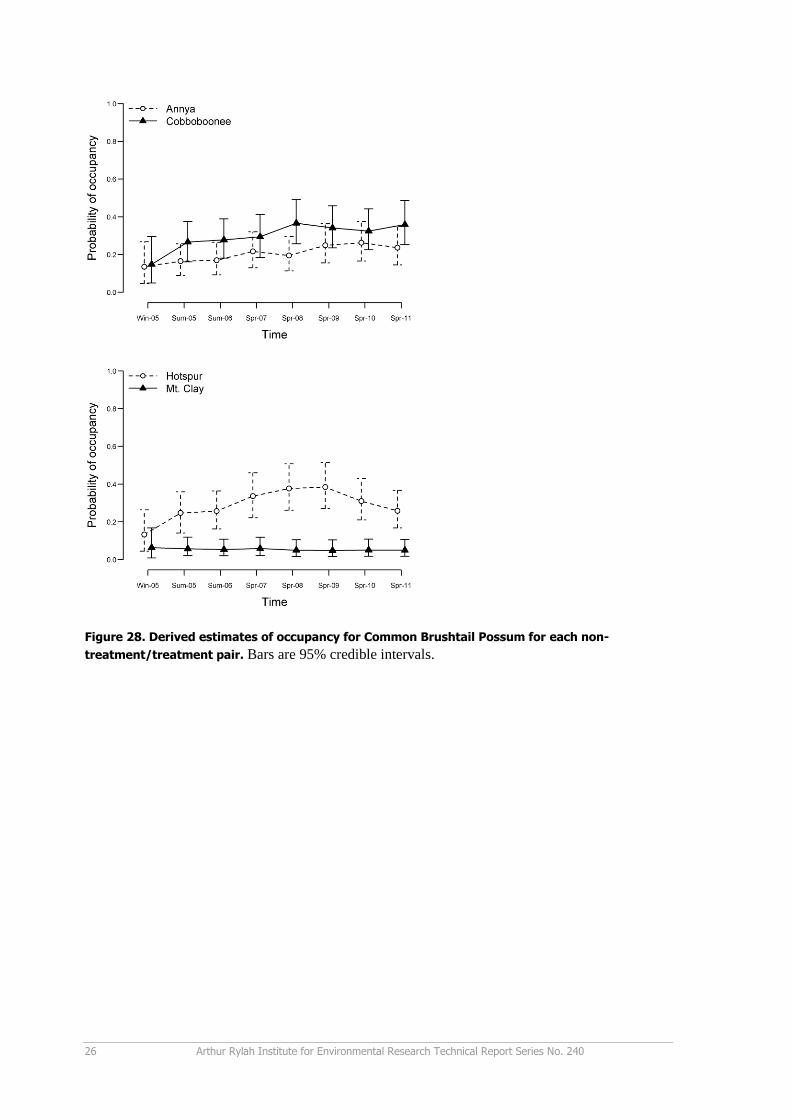
The derived estimates of occupancy show no differences in the probability of a site being occupied
by Common Brushtail Possums at Annya/Cobboboonee (Figure 27) despite a treatment effect on
colonisation. This is possibly due to the lower probability of persistence at the non-treatment site
(Cobboboonee). At LGNP north and south, divergence has occurred in the past two years due to a
positive effect of treatment on both colonisation and persistence. At the Hotspur/Mt Clay pair, the
result is reversed with very low probability of occupancy on the treatment site (Mt Clay) despite
similar probabilities of persistence (Figure 28). The effect appears to be due to a higher probability
of colonisation on the non-treatment site (Hotspur) and near zero probability on the treatment site
(Mt Clay).
26 Arthur Rylah Institute for Environmental Research Technical Report Series No. 240
Figure 28. Derived estimates of occupancy for Common Brushtail Possum for each non-
treatment/treatment pair. Bars are 95% credible intervals.
Glenelg Ark 2005–2011
Arthur Rylah Institute for Environmental Research Technical Report Series No. 240 27
5 Discussion
The monitoring program for Glenelg Ark achieved its aims of quantifying the response of foxes to
control actions and the response of targeted native species. As the monitoring program receives
further information, certainty around the nature of these responses is expected to increase.
Indices of abundance derived from bait take data, sand plot data and cameras surveys (LGNP only)
at all three treatment areas (LGNP south, Cobboboonee National Park and Mt Clay State Forest),
demonstrate a sustained lower abundance of foxes.
Independence of the treatment and non-treatment sites is an important issue as we compare rates of
change in foxes and native species between sites. At Glenelg Ark, the distance between treatment
and non-treatment areas was more than 10 km. We saw no reduction in foxes on the non-treatment
sites (as indexed by abundance indices) in Glenelg Ark, indicating that the treatment/non-treatment
sites are independent from the control imposed on the treatment sites. This is particularly important
for the Glenelg National Park sites, suggesting that the Glenelg River is an effective barrier to the
movement of foxes and hence allows a clearer interpretation of results.
Two of the three targeted species had a greater probability of occupancy at sites with fox control:
Southern Brown Bandicoots at Lower Glenelg National Park, and Long-nosed Potoroos at Mt Clay.
There was no overall effect of treatment on occupancy rates for Common Brushtail Possums.
Further evidence of an association between fox control and species’ response was provided by the
logistic regression on the 2011 Southern Brown Bandicoot data. While other factors (EVC and
dominant tree species) were important, the probability of Southern Brown Bandicoots occurring at
sites with fox control was nearly five times higher than on sites without. Three EVCs (2, 3 and 15)
accounted for most of the sites, with the remaining 27 forming a group called ‘Other’. It is possible
that the selection of these groupings could be improved with smaller like EVCs combined, rather
than pooled in an ‘Other’ category. Fire regime (time since fire, season of fire and number of fires)
did not influence the prediction of presence for Southern Brown Bandicoots. However, the interval
between fires may be a more important factor worth consideration in future analysis. Fire regime
may better reflect the changes in habitat structure likely to influence the dynamics of native
mammal species.
Colonisation and persistence can be considered as surrogates for birth and death rates (the inverse
of persistence is extinction; MacKenzie et al. 2006). Birth and death rates are key functional aspects
of population dynamics, and understanding which processes are being affected by fox predation is
important to developing appropriate management strategies.
At LGNP south, bandicoots were able to survive at sites (persistence) but colonisation rates were
not any greater than at the non-control site. This suggests that bandicoots are able to find refuge
from predation at specific locations in the landscape in the treatment area but are currently unable
to exploit new locations. Factors may include predation by foxes (despite the control program) and
feral cats. Feral cats were in relatively higher abundance compared to the non-treatment site
(Robley et al. 2010). This supports work by Risbey et al. (2000) who reported a positive response to
fox control in populations of feral cats, which then impacted on the preferred prey species. It may
also be possible that predation is regulating bandicoots and there is a limit to the availability of
appropriate food or nesting locations. The overall derived estimate of occupancy (combined
colonisation and persistence) indicates that bandicoots have declined markedly at the non-treatment
site and increased marginally at the treatment site, this suggests that they have not significantly
responded to the reduction in foxes, and fox predation or some other factor has precipitated the
decline on the non-treatment site.
The probability of Southern Brown Bandicoots colonising sites at Cobboboonee National Park was
significant, but persistence levels for this species at Cobboboonee were low at 55%. This suggests
that Southern Brown Bandicoots are able to survive and occupy new sites in the presence of low
levels of predation, but were unable to survive or establish in those new locations. The overall
28 Arthur Rylah Institute for Environmental Research Technical Report Series No. 240
derived estimate of occupancy suggests that bandicoots have remained stable on the treatment site
and declined on the non-treatment site.
At Mt Clay, bandicoots were able to persist in parts of the landscape, but colonisation rates were
relatively high but not significantly greater on the treatment site, suggesting they were susceptible
to predation or some other factor that prevented colonisation of new sites relative to Hotspur State
Forest. The overall occupancy estimates indicate that bandicoots have increased slightly in the
years following fox control, although the effect is not statistically significant.
Long-nosed Potoroos had higher rates of colonisation and persistence at Mt Clay than at Hotspur,
suggesting that relative to Hotspur, potoroos were able to escape regulation by foxes. Colonisation
and persistence rates at the remaining sites were dissimilar suggesting that at these sites Long-nosed
Potoroos are limited by something other than fox predation, or that the level of fox reduction
achieved is insufficient to allow this species to increase.
If foxes were the key limiting factor for bandicoots, potoroos and possums then the expectation
would be that populations of these species would respond positively at all treatment sites, albeit at
different rates. However, the data indicate that this is not the case, suggesting that:
a) the fox control has not reduced predation pressure sufficiently at some sites to release
populations from limitation, or that the baiting and monitoring program has not run long
enough;
b) predation by feral cats and/or other predators (e.g. raptors) is a more significant factor; or
c) resources are limiting at some sites (e.g. food and shelter) and predation is not a factor.
Changes to the composition of the predator assemblage can result in altered rates of predation on
prey species. Supplementary fox control that captured feral cats as a non-target species and camera
survey data indicate that feral cat populations on the treatment site at LGNP were three times higher
than on the non-treatment site. While no pre-fox control data are available on cats at these sites, it
suggests that cats may have at least partly replaced foxes as the apex mammalian predator.
Below long-term average rainfall was recorded across the general study area between 2005 and
2009, with only average rainfall recorded in 2010. Drought-breaking rain followed in 2011. The
lower than average rainfall may have contributed to the responses in the three native mammal
species. Fox control may have allowed populations to persist in areas within the treatment sites that
provide suitable drought refuge, while on the non-treatment sites both fox control and drought
combined to maintain or even lower existing populations. Some evidence for this can be seen in the
results for Southern Brown Bandicoots at LGNP. Bandicoots on the non-treatment site decreased
from 2005 to 2006 and have remained at low levels, while on the treatment site bandicoots showed
signs of an increase over the same period. A similar pattern can be seen at the Annya/Cobboboonee
pair. Significant rainfall in 2011 may result in increases in colonisation rates in the fox control areas
leading to higher overall levels of occupancy for Southern Brown Bandicoots and Long-nosed
Potoroos in 2012.
The results of the monitoring and evaluation program clearly demonstrate that foxes have been
reduced and remain at relatively low levels, and that the use of occupancy modelling as applied in
this project is capable of measuring changes in native species. However, the variable results suggest
that blanket broadscale fox control may not be the most effective approach to recovery or protection
of species threatened by fox predation, and that a greater understanding of both bottom-up and top-
down processes may lead to more effective and targeted management of species that are rare in the
landscape.
More complex models could be used to explore additional factors of occupancy and detection
processes, including:
interseasonal variation in detection probability due to weather or other factors. Lumsden et al.
(2007) previously documented significant levels of inter-annual variation in the detection
probabilities of Long-footed Potoroos (Potorous tridactylus) in a study conducted in north-
Glenelg Ark 2005–2011
Arthur Rylah Institute for Environmental Research Technical Report Series No. 240 29
eastern Victoria using hair tubes. Detection probability in our study was assumed to be constant
across sites and within years
differences in probability of occupancy among sites in an area due to habitat variables, such as
vegetation, rainfall, temperature, exposure to solar radiation and fire
other predictors of colonisation and extinction such as measured predator activity levels, spatial
effects such as adjacency to known occupied or unoccupied sites, and the impact of fuel
reduction burning and wildfires.
Developing multi-species dynamic occupancy models would explicitly link the probabilities of
foxes and native species occupying areas, allowing for more direct estimates of the link between a
reduction in fox (and potentially the presence of other predators) abundance and any increase in
native species. These models could include site-specific covariates to help understand the non-
uniform response of target species.
One limitation on the interpretation of the results from the current design is that we lack sufficient
pre-baiting data to draw robust conclusions about changes in occupancy post-baiting. Non-
manipulative studies have demonstrated that predation plays a role in limiting primary prey
populations, but they cannot be used to unequivocally assess whether predation is a limiting factor
because of the potential confounding effect of other factors. Pech et al. (1995) and Krebs et al.
(2001) ascribed the possible manipulations of prey to test predator regulation, which include
changes in prey density through reintroductions, altering food supply or the abundance of
alternative prey species and predators. In the case of Glenelg Ark, a similar approach could be
applied, including the reintroduction of species currently extinct or the translocation of species
currently in low abundance, e.g., Long-nosed Potoroos. This approach would require careful design
and implementation, strict monitoring and detailed analysis to ensure the outcome was properly
interpreted and translated into management recommendations.
The Glenelg Ark monitoring program has achieved its aims of quantifying the response of foxes
and targeted native species to broadscale continuous fox control through the rigorous
implementation of the monitoring program. This report has highlighted several issues for further
consideration. Consideration could also be given to how the monitoring of Glenelg Ark should
continue into the future.
30 Arthur Rylah Institute for Environmental Research Technical Report Series No. 240
References
Agresti A. (2002) Categorical Data Analysis. Wiley Interscience, New York
Allen, L., Engerman, R. and Krupa, H. (1996). Evaluation of three relative abundance indices for
assessing dingo populations. Wildlife Research 23, 197–206
Burnham K. P. and Anderson D. R. (2010) Model selection and multi-model inference: A practical
information-theoretic approach. Springer-Verlag, New York
Caughley, G. (1977) Analysis of vertebrate populations. John Wiley, London
Dexter, N. and Murray, A. (2008) The impact of fox control on the relative abundance of forest
mammals in East Gippsland, Victoria. Wildlife Research 36, 252–261
Efford, M. (1992) Comment – Revised estimates of the bias in the ‘minimum number alive’
estimator. Canadian Journal of Zoology 70, 628–632
Fleming, P. (1997) Uptake of baits by red foxes (Vulpes vulpes): Implications for rabies
contingency planning in Australia. Wildlife Research 24, 335–346
Hosmer, D. W. and Lemeshow, S. (2000) Applied logistic regression. Wiley Interscience, New
York
Jolly, G. M. and Dickson, J. M. (1983) The problem of unequal catchability in mark–recapture
estimation of small mammal populations. Canadian Journal of Zoology 61, 922–927
Krebs, C. J., Boutin, S. and Boonstra, R. (2001) Ecosystem dynamics of the Boreal Forest: The
Kluane Project. Oxford University Press, New York
Lande, N., Ryan, L., Billard, L. and Farber, D. (1994) Case studies in biometry. John Wiley and
Sons, New York
Lumsden, L. F., Scroggie, M. P., Chick, R., Grgat, L., Woodford, L., Bush, A., Alexander, J. and
Robley, A. (2007) Assessing management strategies and wildfire impact on Long-footed Potoroos
in north-eastern Victoria: 2nd progress report: Results from 2004/2005 and 2005/2006.
Unpublished report to the Department of Sustainability and Environment. Arthur Rylah Institute for
Environmental Research, Heidelberg
Lunn, D. J., Thomas, A., Best, N. and Spiegelhalter, D. (2000) WinBUGS — a Bayesian modelling
framework: concepts, structure, and extensibility. Statistics and Computing 10, 325–337
Lunney, D. (2001) Causes of the extinction of native mammals of the western division of New
South Wales: an ecological interpretation of the nineteenth century historical records. Rangelands
Journal 23(1), 44–70
MacKenzie, D. and Kendall, W. (2002) How should detection probabilities be incorporated into
estimates of relative abundance? Ecology 83, 2387–2393
MacKenzie, D. I., Nichols, J. D., Hines, J. E., Knutson, M. G. and Franklin, A. B. (2003)
Estimating site occupancy, colonization, and local extinction when a species is detected
imperfectly. Ecology 84, 2200–2207
MacKenzie, D. I., Nichols, J. D., Royle, J. A., Pollock, K. H., Bailey, L. L., and Hines, J. E. (2006)
Occupancy estimation and modelling: inferring patterns and dynamics of species occurrence.
Elsevier, San Diego
McLeod, L. J., Saunders, G. R. and Kabat, T. J. (2008) Do control interventions effectively reduce
the impact of European Red Foxes on conservation values and agricultural production in Australia?
Systematic Review No. 24. Collaboration for Environmental Evidence,
www.environmentalevidence.org
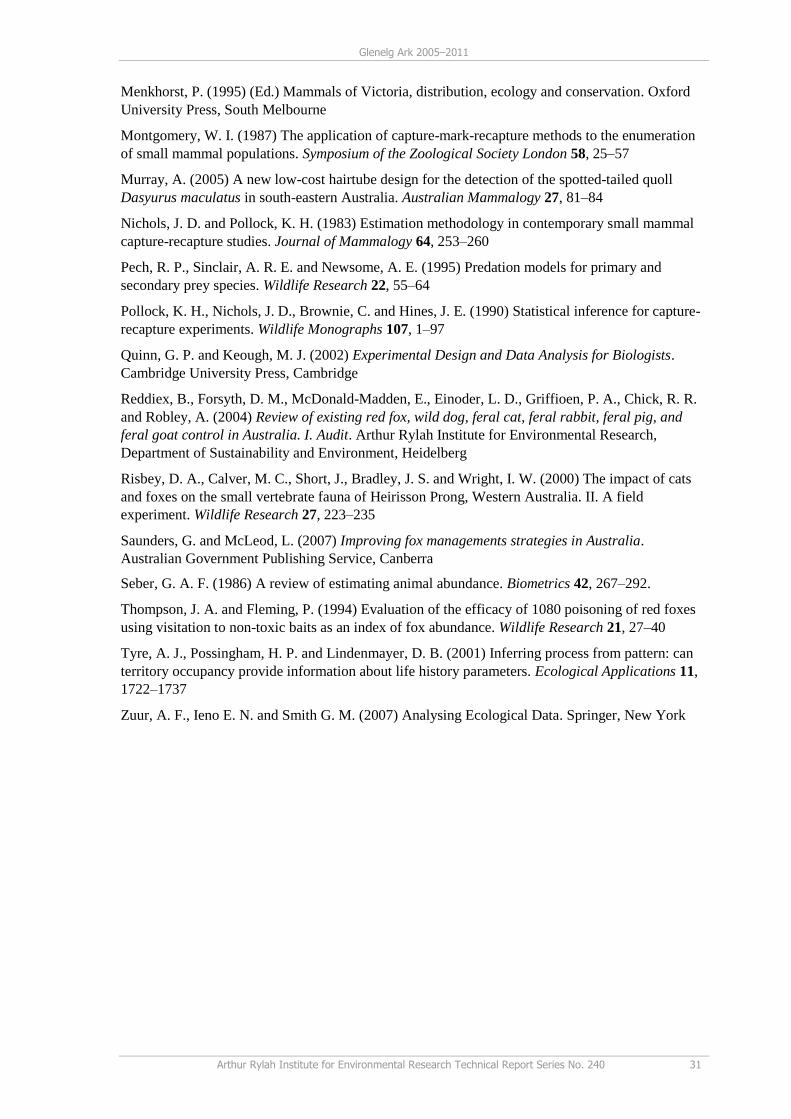
Glenelg Ark 2005–2011
Arthur Rylah Institute for Environmental Research Technical Report Series No. 240 31
Menkhorst, P. (1995) (Ed.) Mammals of Victoria, distribution, ecology and conservation. Oxford
University Press, South Melbourne
Montgomery, W. I. (1987) The application of capture-mark-recapture methods to the enumeration
of small mammal populations. Symposium of the Zoological Society London 58, 25–57
Murray, A. (2005) A new low-cost hairtube design for the detection of the spotted-tailed quoll
Dasyurus maculatus in south-eastern Australia. Australian Mammalogy 27, 81–84
Nichols, J. D. and Pollock, K. H. (1983) Estimation methodology in contemporary small mammal
capture-recapture studies. Journal of Mammalogy 64, 253–260
Pech, R. P., Sinclair, A. R. E. and Newsome, A. E. (1995) Predation models for primary and
secondary prey species. Wildlife Research 22, 55–64
Pollock, K. H., Nichols, J. D., Brownie, C. and Hines, J. E. (1990) Statistical inference for capture-
recapture experiments. Wildlife Monographs 107, 1–97
Quinn, G. P. and Keough, M. J. (2002) Experimental Design and Data Analysis for Biologists.
Cambridge University Press, Cambridge
Reddiex, B., Forsyth, D. M., McDonald-Madden, E., Einoder, L. D., Griffioen, P. A., Chick, R. R.
and Robley, A. (2004) Review of existing red fox, wild dog, feral cat, feral rabbit, feral pig, and
feral goat control in Australia. I. Audit. Arthur Rylah Institute for Environmental Research,
Department of Sustainability and Environment, Heidelberg
Risbey, D. A., Calver, M. C., Short, J., Bradley, J. S. and Wright, I. W. (2000) The impact of cats
and foxes on the small vertebrate fauna of Heirisson Prong, Western Australia. II. A field
experiment. Wildlife Research 27, 223–235
Saunders, G. and McLeod, L. (2007) Improving fox managements strategies in Australia.
Australian Government Publishing Service, Canberra
Seber, G. A. F. (1986) A review of estimating animal abundance. Biometrics 42, 267–292.
Thompson, J. A. and Fleming, P. (1994) Evaluation of the efficacy of 1080 poisoning of red foxes
using visitation to non-toxic baits as an index of fox abundance. Wildlife Research 21, 27–40
Tyre, A. J., Possingham, H. P. and Lindenmayer, D. B. (2001) Inferring process from pattern: can
territory occupancy provide information about life history parameters. Ecological Applications 11,
1722–1737
Zuur, A. F., Ieno E. N. and Smith G. M. (2007) Analysing Ecological Data. Springer, New York
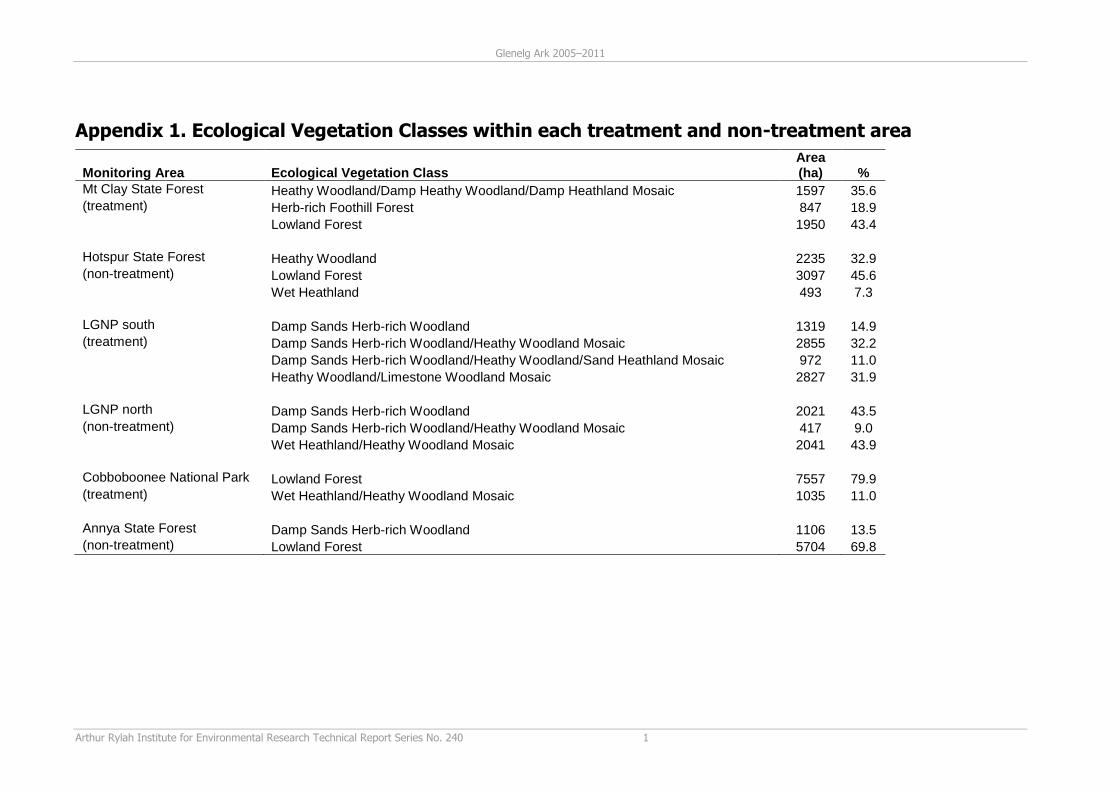
Glenelg Ark 2005–2011
Arthur Rylah Institute for Environmental Research Technical Report Series No. 240 1
Appendix 1. Ecological Vegetation Classes within each treatment and non-treatment area
Monitoring Area Ecological Vegetation Class
Area (ha) %
Mt Clay State Forest Heathy Woodland/Damp Heathy Woodland/Damp Heathland Mosaic 1597 35.6 (treatment) Herb-rich Foothill Forest 847 18.9 Lowland Forest 1950 43.4 Hotspur State Forest Heathy Woodland 2235 32.9 (non-treatment) Lowland Forest 3097 45.6 Wet Heathland 493 7.3 LGNP south Damp Sands Herb-rich Woodland 1319 14.9 (treatment) Damp Sands Herb-rich Woodland/Heathy Woodland Mosaic 2855 32.2 Damp Sands Herb-rich Woodland/Heathy Woodland/Sand Heathland Mosaic 972 11.0 Heathy Woodland/Limestone Woodland Mosaic 2827 31.9 LGNP north Damp Sands Herb-rich Woodland 2021 43.5 (non-treatment) Damp Sands Herb-rich Woodland/Heathy Woodland Mosaic 417 9.0 Wet Heathland/Heathy Woodland Mosaic 2041 43.9 Cobboboonee National Park Lowland Forest 7557 79.9 (treatment) Wet Heathland/Heathy Woodland Mosaic 1035 11.0 Annya State Forest Damp Sands Herb-rich Woodland 1106 13.5 (non-treatment) Lowland Forest 5704 69.8
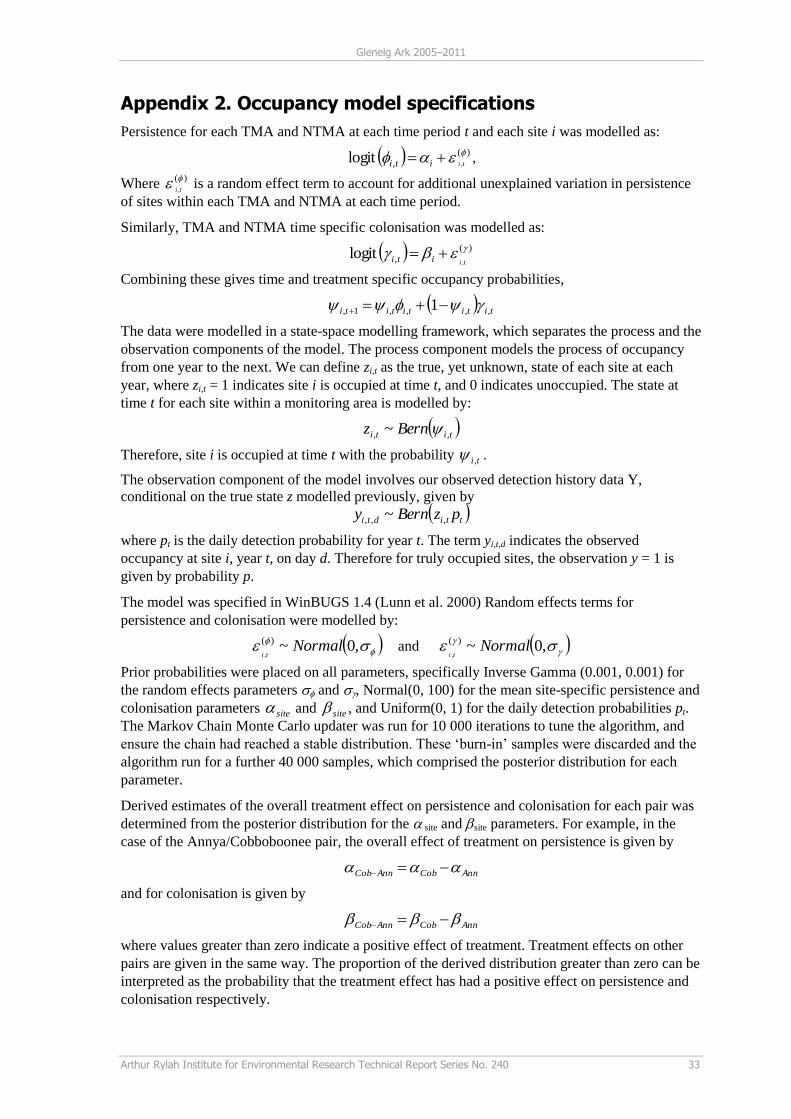
Glenelg Ark 2005–2011
Arthur Rylah Institute for Environmental Research Technical Report Series No. 240 33
Appendix 2. Occupancy model specifications
Persistence for each TMA and NTMA at each time period t and each site i was modelled as:
)(
, ,logit
tiiti ,
Where )(
,
ti
is a random effect term to account for additional unexplained variation in persistence
of sites within each TMA and NTMA at each time period.
Similarly, TMA and NTMA time specific colonisation was modelled as:
)(
, ,logit
tiiti
Combining these gives time and treatment specific occupancy probabilities,
tititititi ,,,,1, 1
The data were modelled in a state-space modelling framework, which separates the process and the
observation components of the model. The process component models the process of occupancy
from one year to the next. We can define zi,t as the true, yet unknown, state of each site at each
year, where zi,t = 1 indicates site i is occupied at time t, and 0 indicates unoccupied. The state at
time t for each site within a monitoring area is modelled by:
titi Bernz ,, ~
Therefore, site i is occupied at time t with the probability ti , .
The observation component of the model involves our observed detection history data Y,
conditional on the true state z modelled previously, given by
ttidti pzBerny ,,, ~
where pt is the daily detection probability for year t. The term yi,t,d indicates the observed
occupancy at site i, year t, on day d. Therefore for truly occupied sites, the observation y = 1 is
given by probability p.
The model was specified in WinBUGS 1.4 (Lunn et al. 2000) Random effects terms for
persistence and colonisation were modelled by:
,0~)(
,Normal
ti and ,0~)(
,Normal
ti
Prior probabilities were placed on all parameters, specifically Inverse Gamma (0.001, 0.001) for
the random effects parameters and , Normal(0, 100) for the mean site-specific persistence and
colonisation parameters site and site , and Uniform(0, 1) for the daily detection probabilities pt.
The Markov Chain Monte Carlo updater was run for 10 000 iterations to tune the algorithm, and
ensure the chain had reached a stable distribution. These ‘burn-in’ samples were discarded and the
algorithm run for a further 40 000 samples, which comprised the posterior distribution for each
parameter.
Derived estimates of the overall treatment effect on persistence and colonisation for each pair was
determined from the posterior distribution for the site and site parameters. For example, in the
case of the Annya/Cobboboonee pair, the overall effect of treatment on persistence is given by
AnnCobAnnCob
and for colonisation is given by
AnnCobAnnCob
where values greater than zero indicate a positive effect of treatment. Treatment effects on other
pairs are given in the same way. The proportion of the derived distribution greater than zero can be
interpreted as the probability that the treatment effect has had a positive effect on persistence and
colonisation respectively.
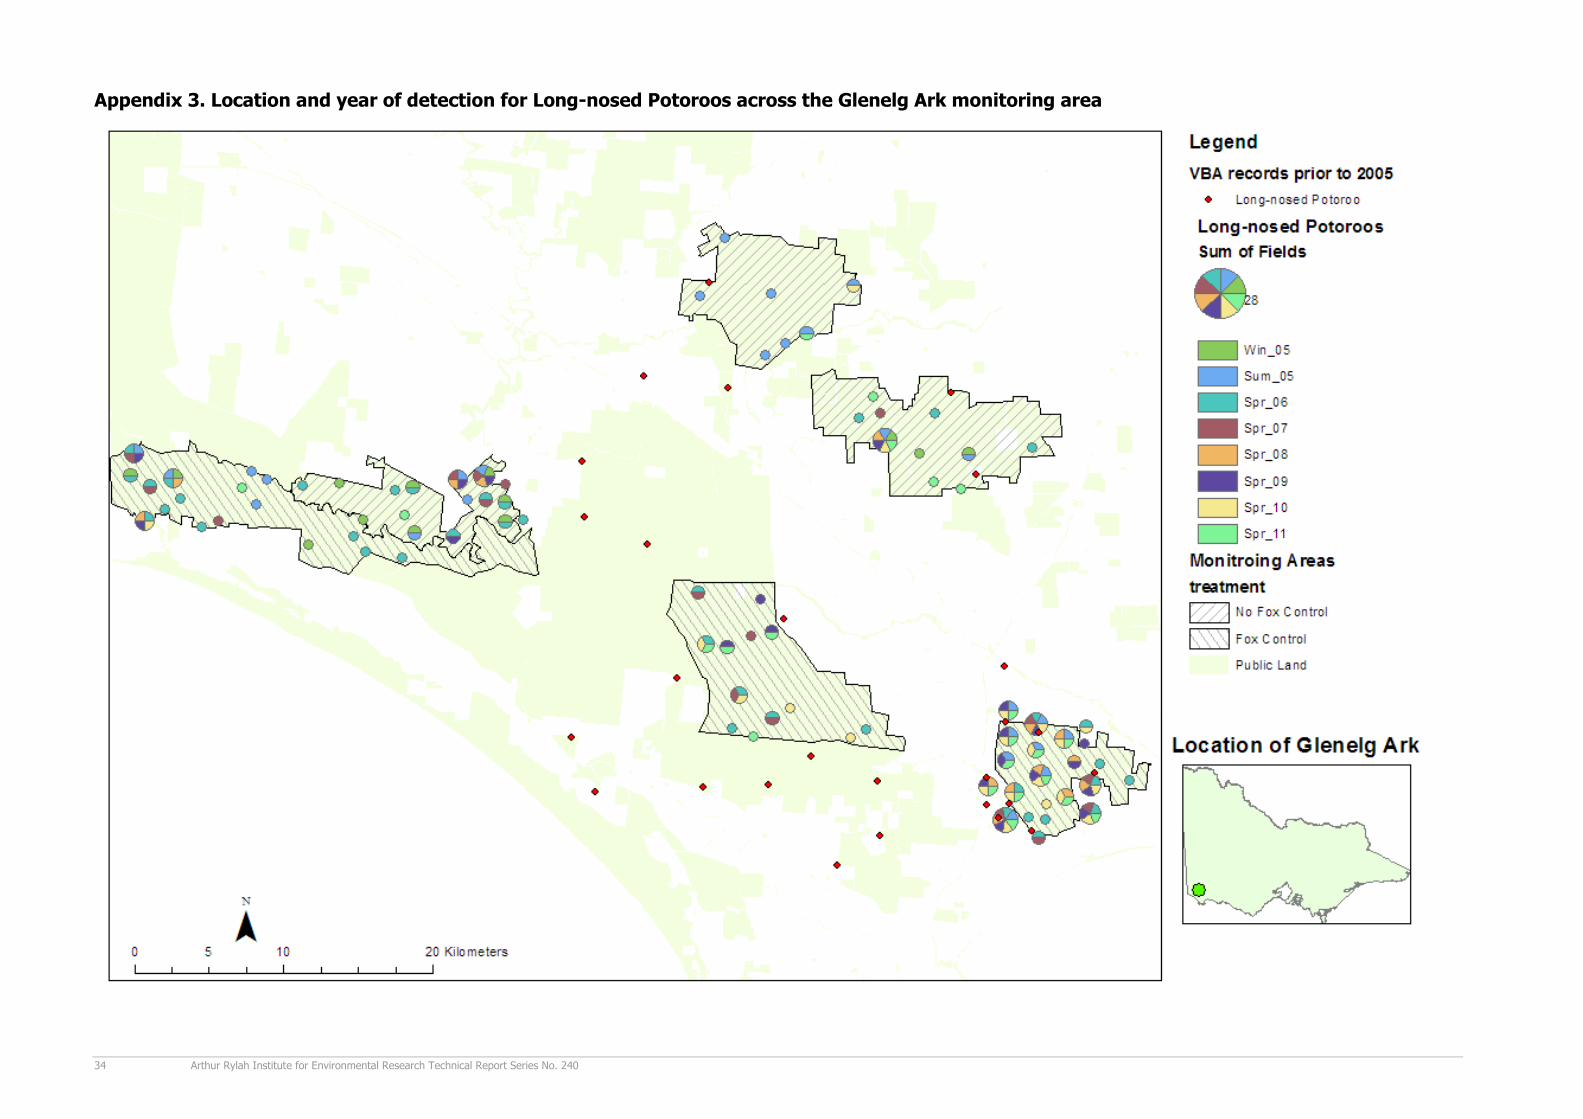
34 Arthur Rylah Institute for Environmental Research Technical Report Series No. 240
Appendix 3. Location and year of detection for Long-nosed Potoroos across the Glenelg Ark monitoring area
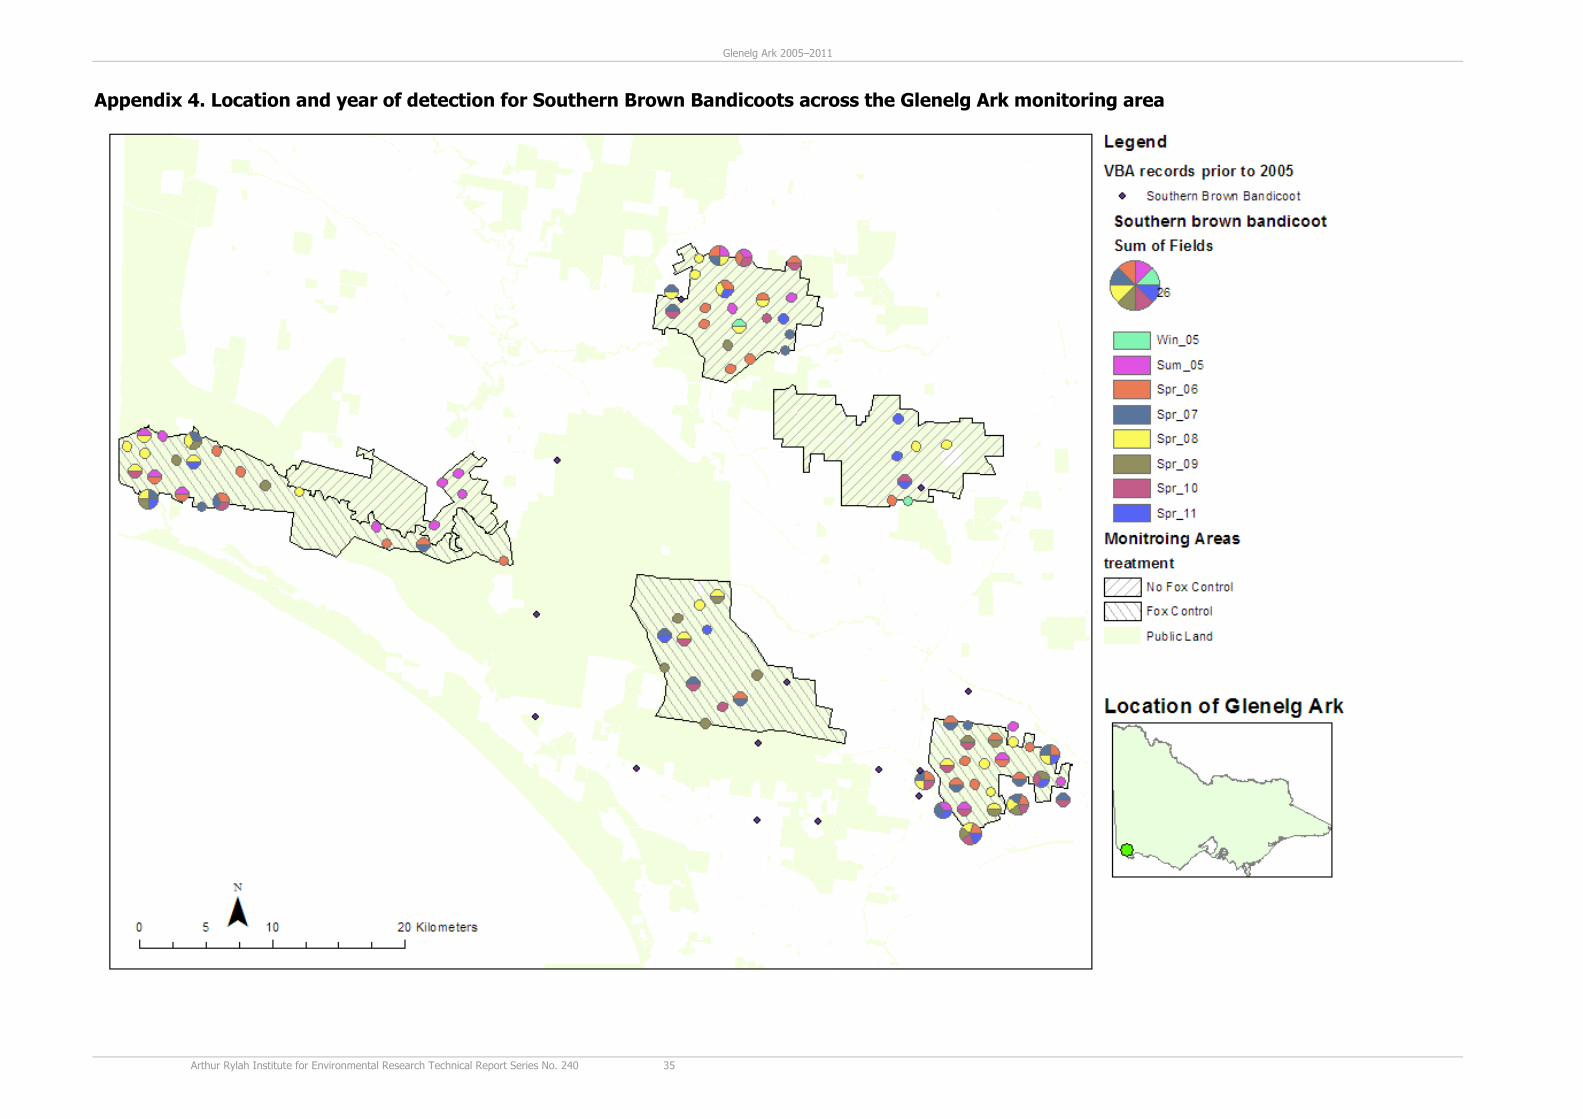
Glenelg Ark 2005–2011
Arthur Rylah Institute for Environmental Research Technical Report Series No. 240 35
Appendix 4. Location and year of detection for Southern Brown Bandicoots across the Glenelg Ark monitoring area

36 Arthur Rylah Institute for Environmental Research Technical Report Series No. 240
ISSN 1835-3827 (print)
ISSN 1835-3835 (online)
ISBN 978-1-74287-711-2 (print)
ISBN 978-1-74287-712-9 (online)