Embed Size (px)
Citation preview
I ..I
r .
I
The Flood Control Districtof
Maricopa County, Arizona
GLENDALE-PEORIA AREADRAINAGE MASTER PLAN
by
CAMP DRESSER & McKEE INC.
and
MAY 1987
!-~-...,~:~:-:: cfFlr-,vl r.~~,-- _: . . , .. _
"-<....i"-l _L· : -, ~ _~: -:. i ~ \-~._ Libraryi , ",. i.. c.,
-.-.- -- ( "'" - .)
rhc.~.:;~~t ~J~ ..:~ L~-~v9
Table of Contents
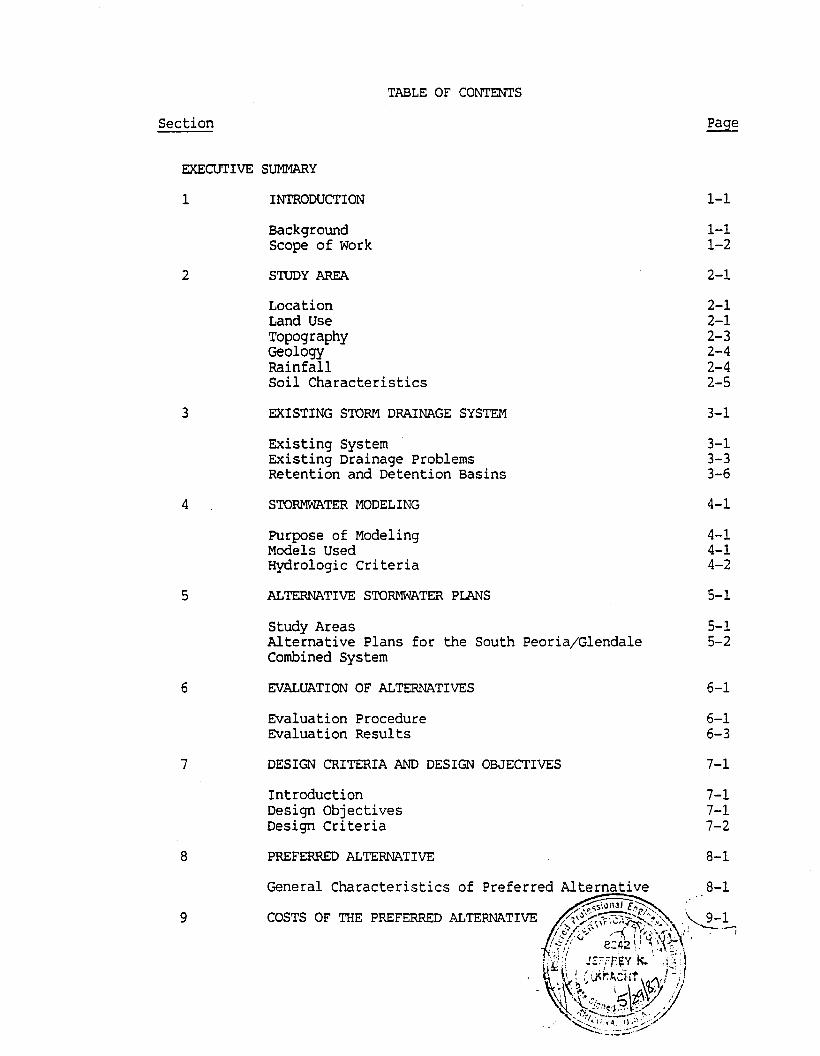
TABLE OF CONTENTS
Section
EXECUTIVE SUMMARY
1
2
3
4
5
INTRODUCTION
BackgroundScope of Work
STUDY AREA
LocationLand UseTopographyGeologyRainfallSoil Characteristics
EXISTING STORM DRAINAGE SYSTEM
Existing SystemExisting Drainage ProblemsRetention and Detention Basins
STORMWATER MODELING
Purpose of ModelingModels UsedHydrologic Criteria
ALTERNATIVE STORMWATER PLANS
1-1
1-11-2
2-1
2-12-12-32-42-42-5
3-1
3-13-33-6
4-1
4-14-14-2
5-1
Study Areas 5-1Alternative Plans for the South Peoria/Glendale 5-2Combined System
6
7
8
EVALUATION OF ALTERNATIVES
Evaluation ProcedureEvaluation Results
DESIGN CRITERIA AND DESIGN OBJECTIVES
IntroductionDesign ObjectivesDesign Criteria
PREFERRED ALTERNATIVE
6-1
6-16-3
7-1
7-17-17-2
8-1
9
Section
10
11
12
13
14
APPENDIX A
TABLE OF CONTENTS(Continued)
IMPLEMENTATION AND CONSTRUCTION PHASING
Adoption of the Preferred AlternativeInteragency CooperationSuggested Phasing
FINANCING ALTERNATIVES
IntroductionCapital RequirementsOPeration and Maintenance Requirements
INSTITUTIONAL CONSIDERATIONS AND INFRASTRUCTUREIMPROVEMENTS
Institutional ConsiderationsInfrastructure Improvements
CONDITIONS AND LIMITATIONS
REFERENCES AND ACKNa-lLEDGEMENTS
ReferencesAcknowledgements
page
10-1
10-110-110-2
11-1
11-111-111-4
12-1
12-112-3
13-1
14-1
14-114-3
A-I
NOTE: This report was completed in April 1986. During the past year, anaddendum "Addendum to Glendale-Peoria Area Drainage Master Plan" wasissued. Both reports were published and dated this year (May 1987).
Table
1
2
3
4
5
6
7
8
9
10
11
12
13
14
15
16
17
18
19
20
LIST OF TABLES
Summary of Discharges
Summary of 100-Year Floodplain Widths andElevations
Alternative Cost Summary
Evaluation Matrix
Suggested Maximum Permissible Mean Channelvelocities
Selected Facilities for South Glendale
Selected Facilities for South Peoria/Glendale
Selected Facilities for North Glendale
Selected Facilities for North Peoria
Selected Facilities for South Peoria West ofNew River
Right-of-Way Land Acquisition Requirements forSouth Glendale
Right-of-Way Land Acquisition Requirements forSouth Peoria/Glendale
Right-of-Way Land Acquisition Requirements forNorth Glendale
Right-of-Way Land Acquisition Requirements forNorth Peoria
Right-of-Way Land Acquisition Requirements forSouth Peoria West of New River
Critical Utility Interferences
Capital Costs of South Glendale Pipes
Capital Costs for South Glendale Detention Basins
Capital Costs for South Peoria/Glendale Pipes
Capital Costs for South Peoria/Glendale DetentionBasins and Pipe Right-of-Way
3-5
3-6
6-4
6-5
7-2
8-4
8-7
8-12
8-13
8-15
8-16
8-17
8-18
8-19
8-21
8-22
9-2
9-3
9-4
9-5
Table
21
22
23
24
25
26
27
LIST OF TABLES(Continued)
Capital Costs for North Glendale Pipes
Capital Costs for North Glendale Detention Basins
capital Costs for North Peoria Pipes and Channels
Capital Costs for North Peoria Detention Basinsand Channel Right-of-Way
Capital Costs for South Peoria West of New RiverFipes
Capital Costs for South Peoria West of New RiverPipe Right-of-Way
Funding Sources Availability andApplicabili ty
Page
9-6
9-7
9-8
9-9
9-11
9-12
11-2
LIST OF FIGURES
Figure
1 Study Area
2 lOO-Year Flood Boundary
3 Alternative 1
4 Alternative 2
5 Alternative 3
6 Alternative 4
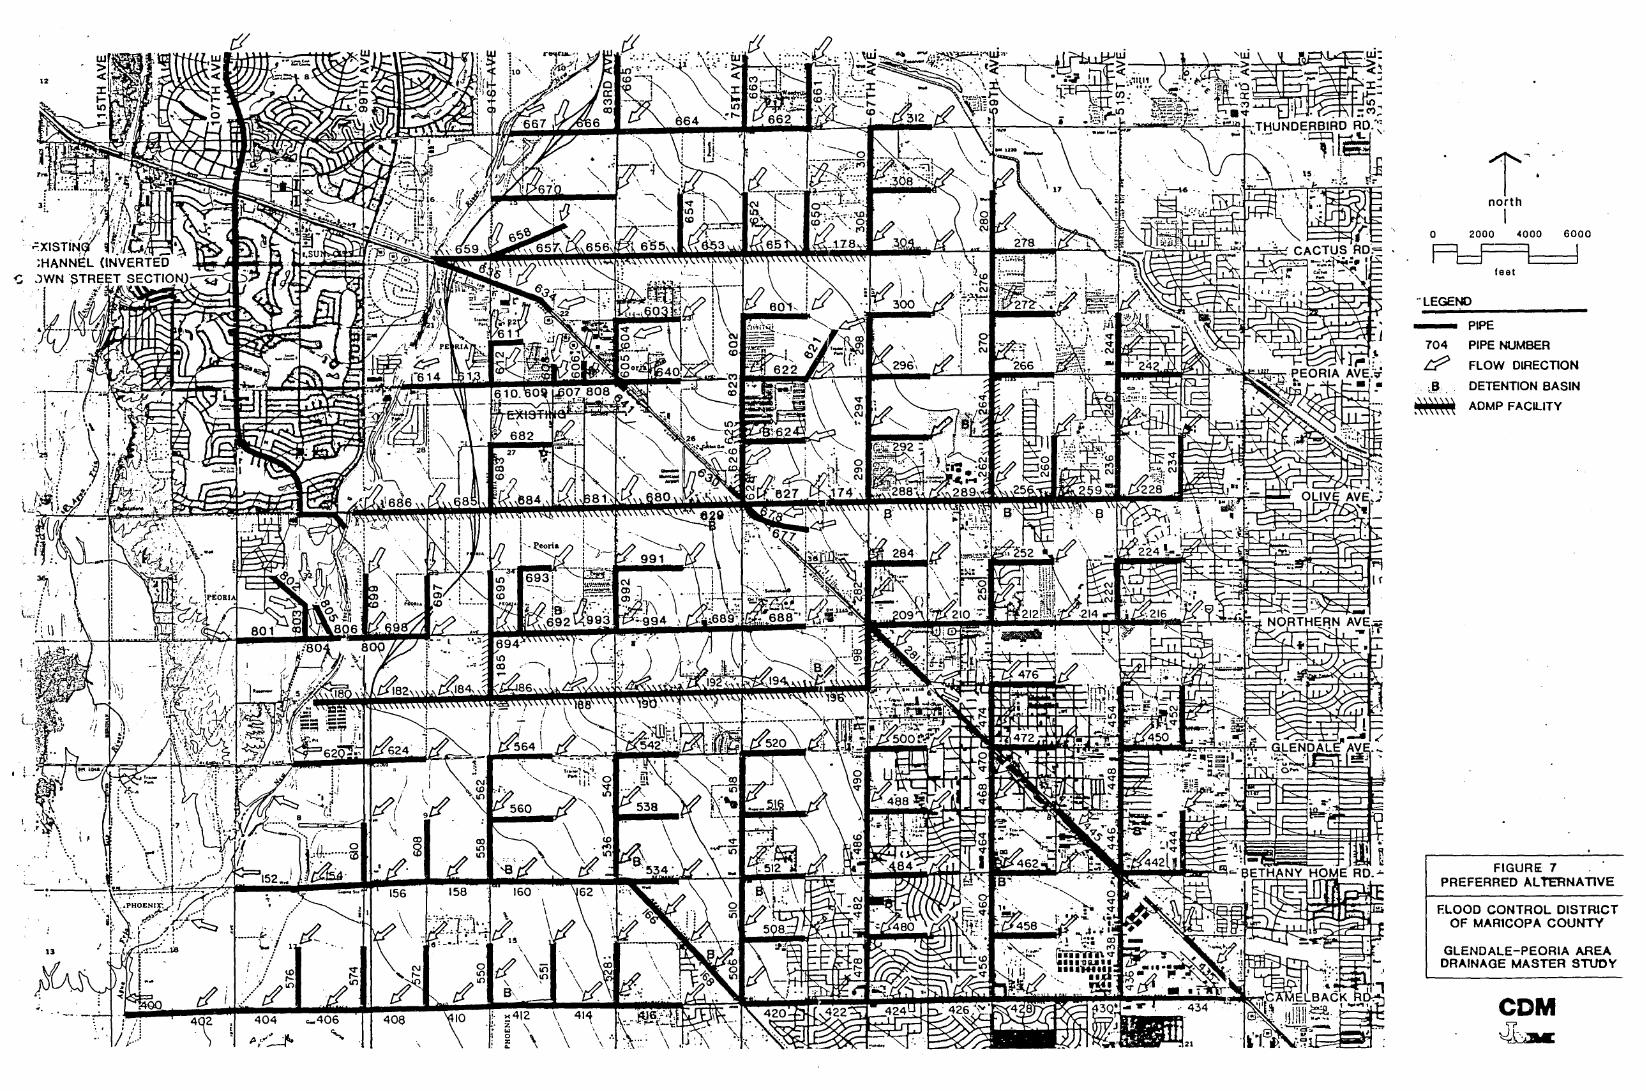
7 Preferred Alternative
8 Preferred Alternative
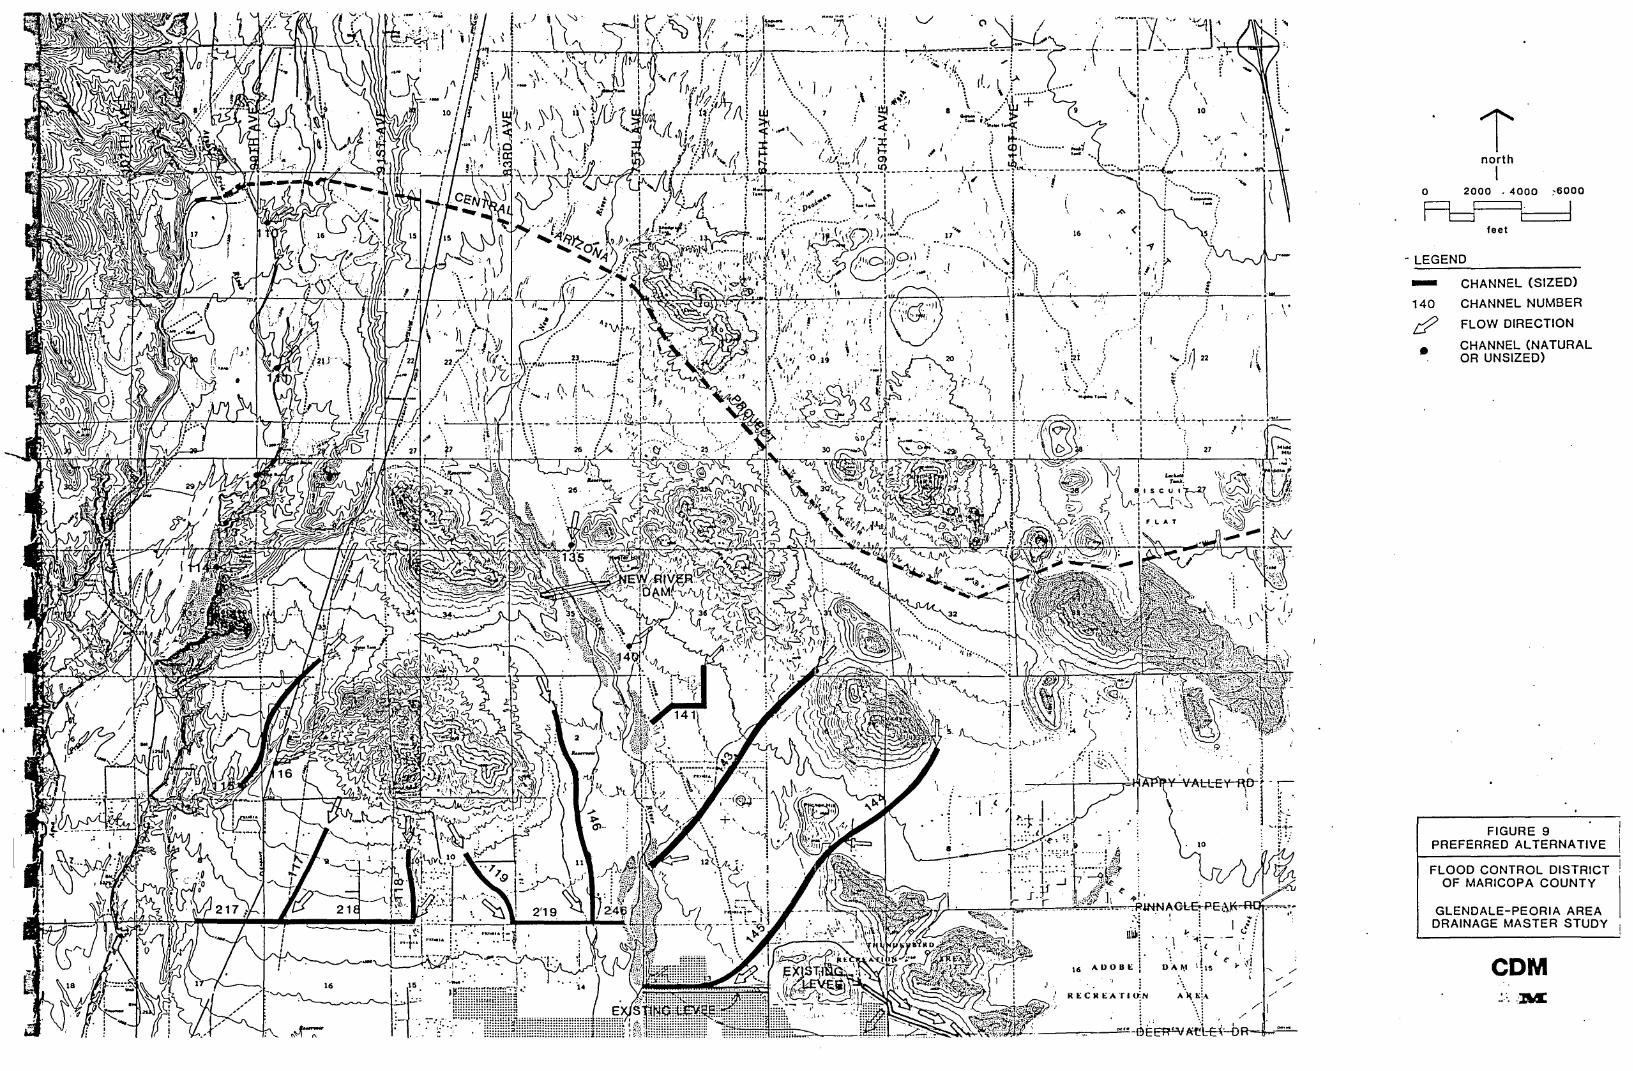
9 Preferred Alternative
FollowsPage
2-1
3-5
5-2
5-3
5-3
5-3
Attached
Attached
Attached
Executive Summary
EXECt1l'IVE SUMMARY
The Cities of Glendale and Peoria generally experience a dry climate withlow average rainfall. However, occasional storms can produce significantstor.mwater runoff. Neither city has a comprehensive storm drainage system;generally runoff is carried in streets to an outlet or ponding location.Rapid urbanization in both cities has greatly increased rates of runofffrom formerly agricultural lands, resulting in more inconvenience becauseof water in ,the streets and the potential for flood damage to a greaternumber of structures.
To respond to these needs, both Glendale and Peoria recently had separatestorm drainage master plans completed by Camp Dresser & McKee, Inc. (COM)and James M. Montgomery, Consulting Engineers, Inc. (JMM) respectively.These separate studies, which were funded in part by the Flood ControlDistrict of Maricopa County, were confined to the area within the municipalboundary of each city. However, because of the area's topography, portionsof Glendale would (under normal conditions) drain to and across Peoria.Therefore, the Flood Control District initiated a Glendale-Peoria AreaDrainage Master study (ADMS) to examine the potential benefits of combiningthe storm drainage systems of Glendale and Peoria. The study also includedsome areas adjacent to Glendale and Peoria which lie within the samewatershed. This report presents the results of the study and outlines theGlendale-Peoria Area Drainage Master Plan (ADMP).
The study area included the City of Glendale, the City of Peoria, andcontributing drainages bounded on the west by the Agua Fria River, on thenorth by the Central Arizona Project (CAP) Canal and the New River Damalignment, and on the east by the Hedgepeth Hills and Weir Valley. Inorder to develop the Glendale-Peoria ADMP, the study area was divided intothe following subareas.
South Glendale
This area consists of the area in Glendale generally between Camelback Roadand Northern Avenue. The drainage facilities selected for this area in the
1
"Glendale Stormwater Management Plan" could not be improved by combiningwith a drainage facility in Peoria. Therefore, the facilities previouslyselected were included in the Glendale-Peoria ADMP without change.
South Peoria/Glendale
This area consists of the portion of Glendale south of the Arizona CanalDiversion Channel (ACDC) that is not included in the South Glendale area,and the portion of Peoria east of New River and Skunk Creek. Because ofthe natural drainage pattern from east to west in this area, it appearedthat combining the Glendale facilities in this area with Peoria facilitieswould be advantageous. Therefore, facilities in this area were determinedby formulating and evaluating combined ADMP facilities.
North Glendale
This area consists of the portion of Glendale that is north of the ACDC.Facilities for this area were included from the "Glendale StormwaterManagement Plan" wi thout change.
North Peoria
This area consists of the area of Peoriawest of New River and north of Sun City.included from the "City of Peoria Masterchange.
South Peoria West of New River
that is north of Skunk Creek orFacilities for this area were
plan of Storm Drainage" without'
This area consists of the area of Peoria that is west of New River andsouth of Sun City. Facilities for this area were included from the "Cityof Peoria Master Plan of Storm Drainage" without change.
Sun City
This area consists of the entire area of Sun City which is an unincorporated planned development. Sun City is already almost completely
2
developed, and has an existing self-contained storm drainage system whichdoes not affect any other subareas. There is no detailed information aboutthe design capacity of the drainage system; however, the system has beenhandling the drainage flows within the area. Therefore, no improvementswere recommended for this area, and the existing facilities were includedin this plan for information purposes.
Several alternative drainage plans were developed for ADMP facilities inthe South Peoria/Glendale area that would collect water from both citiesand convey it to New River. These alternatives were then evaluated using amulti-criteria matrix procedure to determine an overall rating for eachalternative. The following criteria were used for evaluation purposes:capital cost; compatibility with other projects and potential disruption;acceptability to the public; environmental factors; compatibility withmajor street projects scheduled for construction during the next fiveyears; direct outlets to New River to adequately handle flows; ability toeffectively use detention basins to attenuate peak flows, therebydecreasing pipe sizes downstream of basins and lowering costs;compatibility with OUter Loop Freeway; ability to effectively handle eachCity's individual drainage needs; and, potential for staged construction.In addition, the cost of the ADMP facilities was compared with the sum ofthe costs for individual Glendale and Peoria systems, in order to determineif the combined system would have any cost advantage over the individualsystems.
The evaluation showed that the cost of combined ADMP facilities would beabout $2.5 million less than the sum of separate systems for both Peoriaand Glendale. Alternative 1 for the combined facilities was the mostfavorably-rated and was selected as the preliminary preferred alternative.This alternative consisted of drains along Cactus Road and Olive Avenuethat would carry flow from Glendale west through Peoria. In addition, adrain along Northern Avenue in Peoria would carry flows to OrangewoodAvenue in Glen~ale, where it would join other flows from the Glendale area.The advantages of this alternative included: it was the lowest costoption; it was well balanced in terms of avoiding major problem areas and
3
providing a logical path for flows; and, it had three outlets to New Riverand would allow construction to proceed more rapidly.
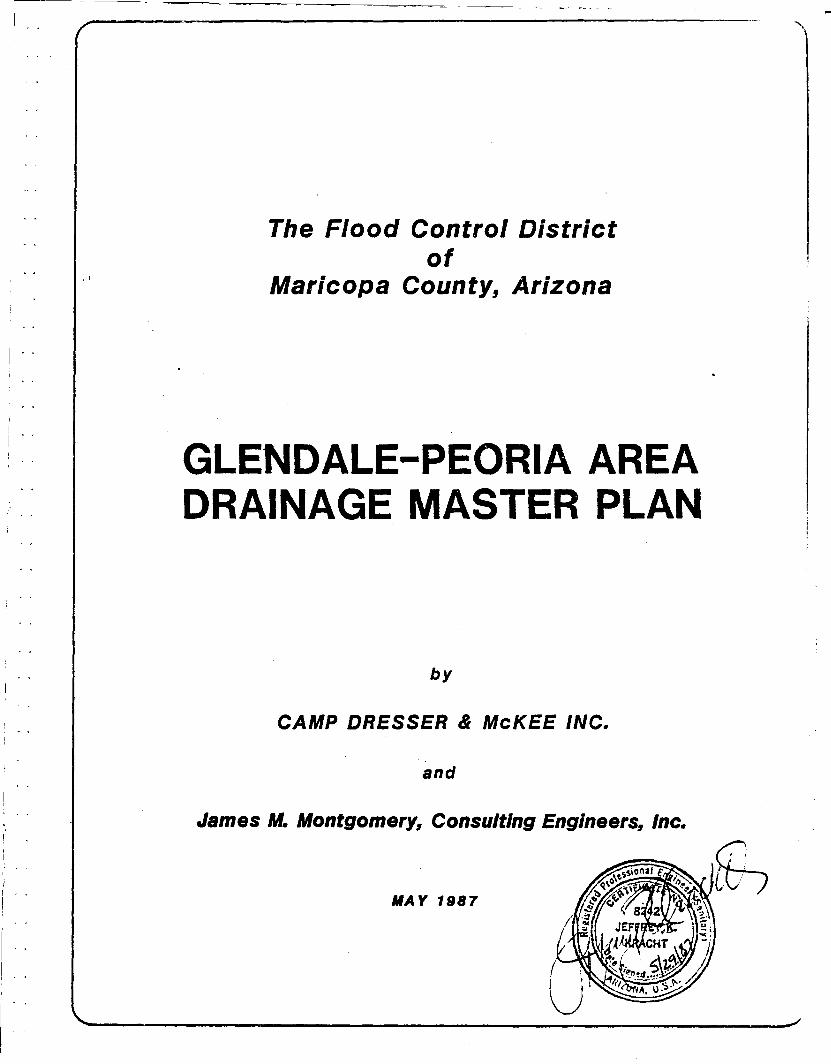
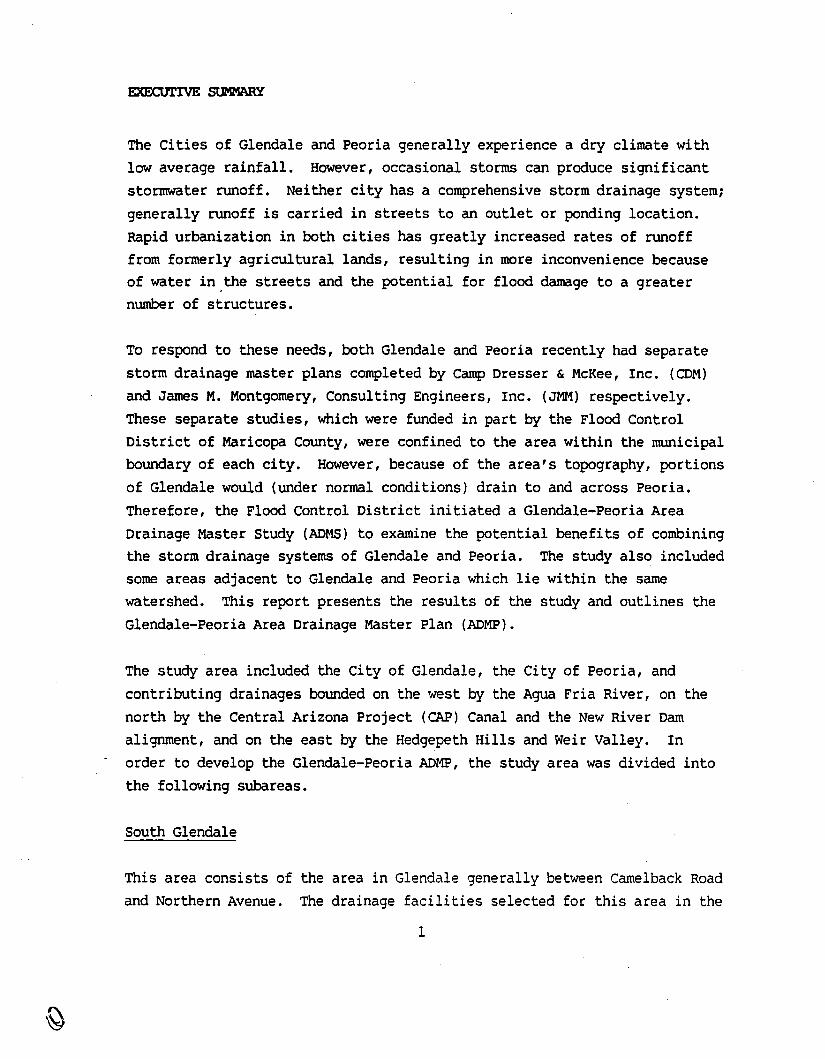
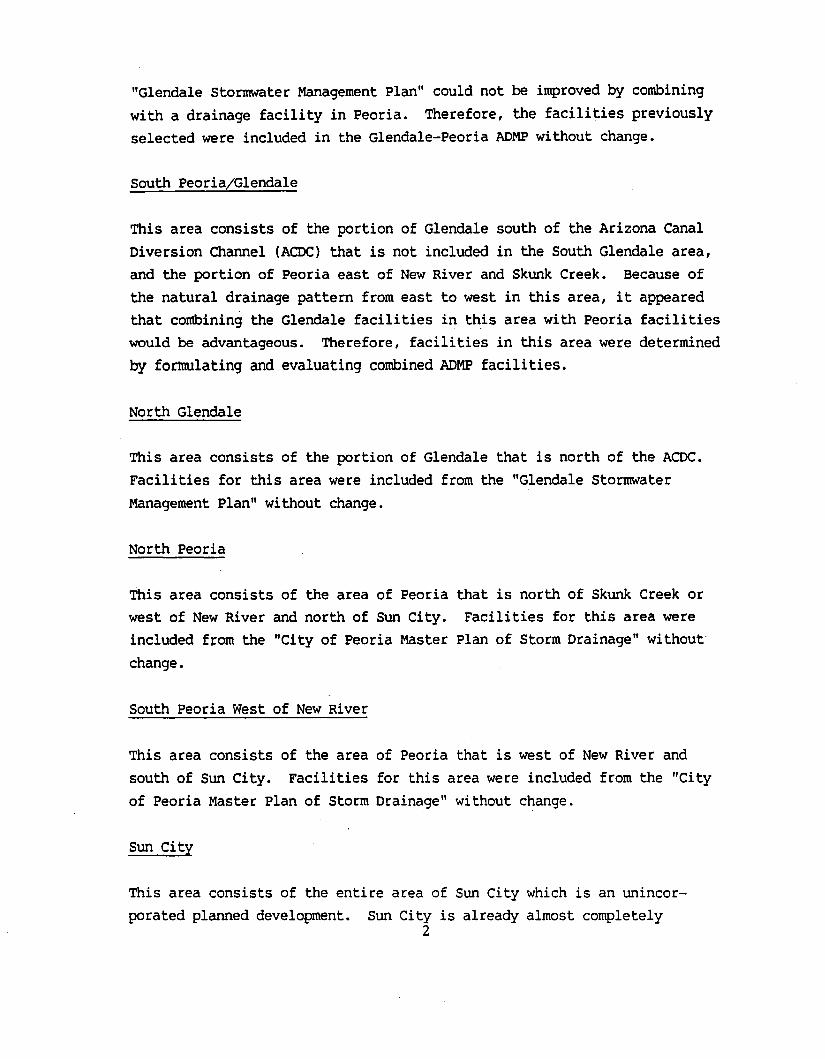
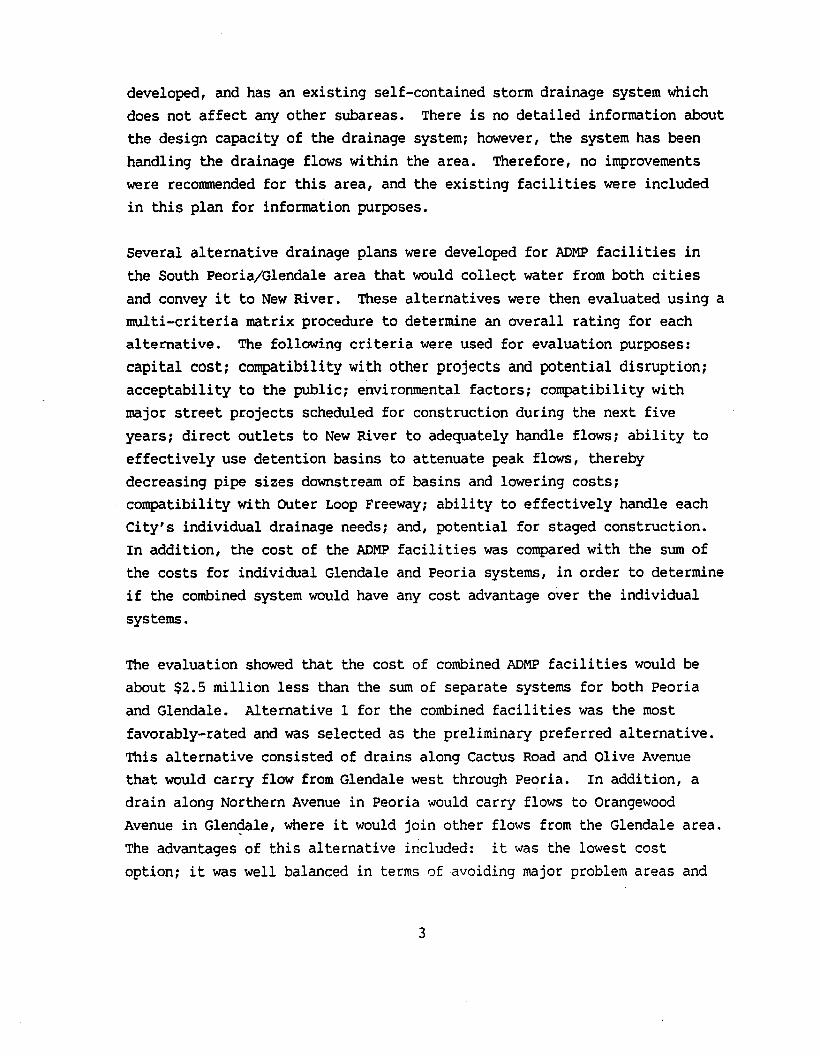
The selected facilities for South Peoria/Glendale for the ADMP preferredalternative were obtained from a more detailed analysis of Alternative 1.The facilities for the other subareas were obtained directly from the"Glendale stormwater Management Plan" and the "City of Peoria Master Planof Storm Drainage". The locations of the ADMP facilities for the preferredalternative in South Peoria/Glendale, as well as the facilities in theother subareas, are shown on the reduced-scale figures at the end of thissurmnary. (The full-size figures are located at the back of the report, andtables showing facility sizes, design flows, and land acquisitionrequirements are contained in Section 8.)
Due to the extent of the selected storm drainage facilities, the plan wouldbe implemented in phases. The highest priority items for implementationinclude:
o Updating of the individual storrnwater master plans for Glendale andPeoria to ensure compatibility with the ADMP, and initiation of anynecessary revisions to their respective City codes.
o Acquisition of right-of-way for detention basins, since sizes of pipesdownstream of these basins may be affected by decisions to change thelocation or size of these basins.
o Planning and construction of pipes to cross the OUter Loop Freeway.
o Implementation of the ADMP facilities which would include the NorthernAvenue, Olive Avenue and Cactus Road drains in Peoria and Glendale.Construction of these facilities will relieve existing floodingproblems in these areas, and will provide outlets for subsidiary drainsthat can be added as second priority items.
The following outline summarizes the recommended phased construction
program and estimated capital costs.
4
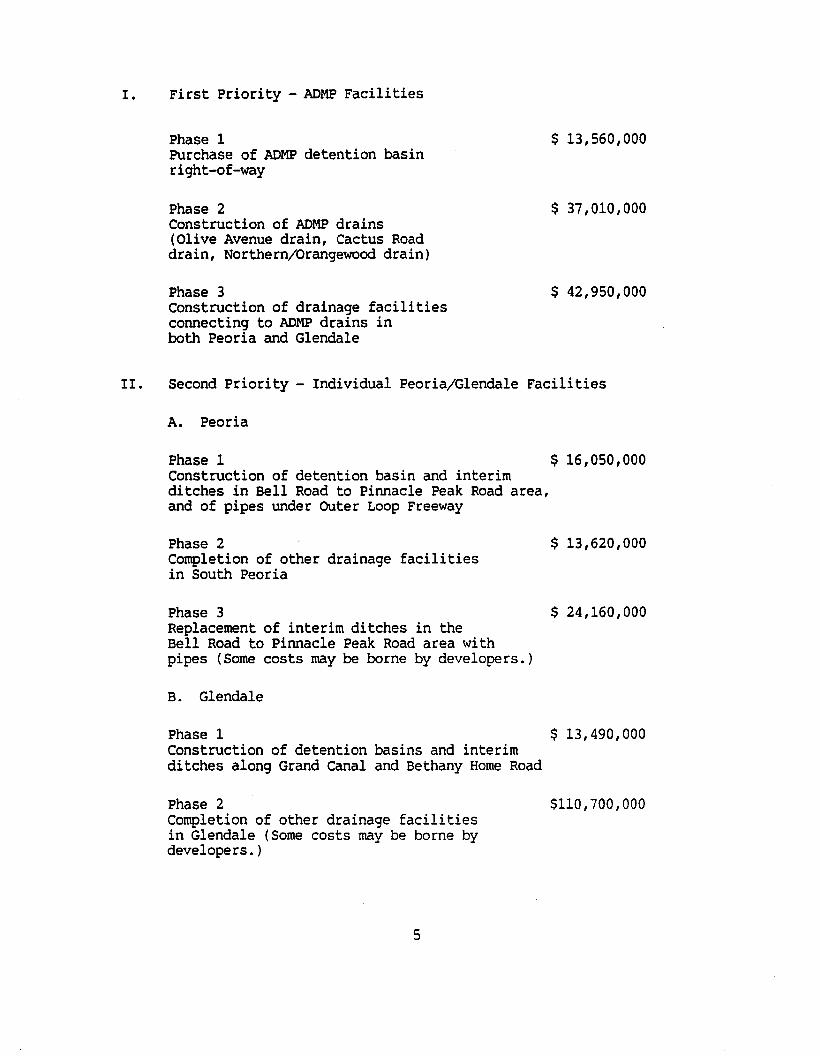
I. First priority - ADMP Facilities
Phase 1Purchase of ADMP detention basinright-of-way
Phase 2Construction of ADMP drains(Olive Avenue drain, Cactus Roaddrain, Northern/orangewood drain)
Phase 3Construction of drainage facilitiesconnecting to ADMP drains inboth Peoria and Glendale
$ 13,560,000
$ 37,010,000
$ 42,950,000
II. Second priority - Individual Peoria/Glendale Facilities
A. Peoria
Phase 1 $ 16,050,000Construction of detention basin and interimditches in Bell Road to Pinnacle Peak Road area,and of pipes under OUter Loop Freeway
Phase 2 $ 13,620,000Completion of other drainage facilitiesin South Peoria
Phase 3 $ 24,160,000Replacement of interim ditches in theBell Road to Pinnacle Peak Road area withpipes (Some costs may be borne by developers.)
B. Glendale
Phase 1 $ 13,490,000Construction of detention basins and interimditches along Grand Canal and Bethany Home Road
Phase 2 $110,700,000Completion of other drainage facilitiesin Glendale (Some costs may be borne bydevelopers.)
5
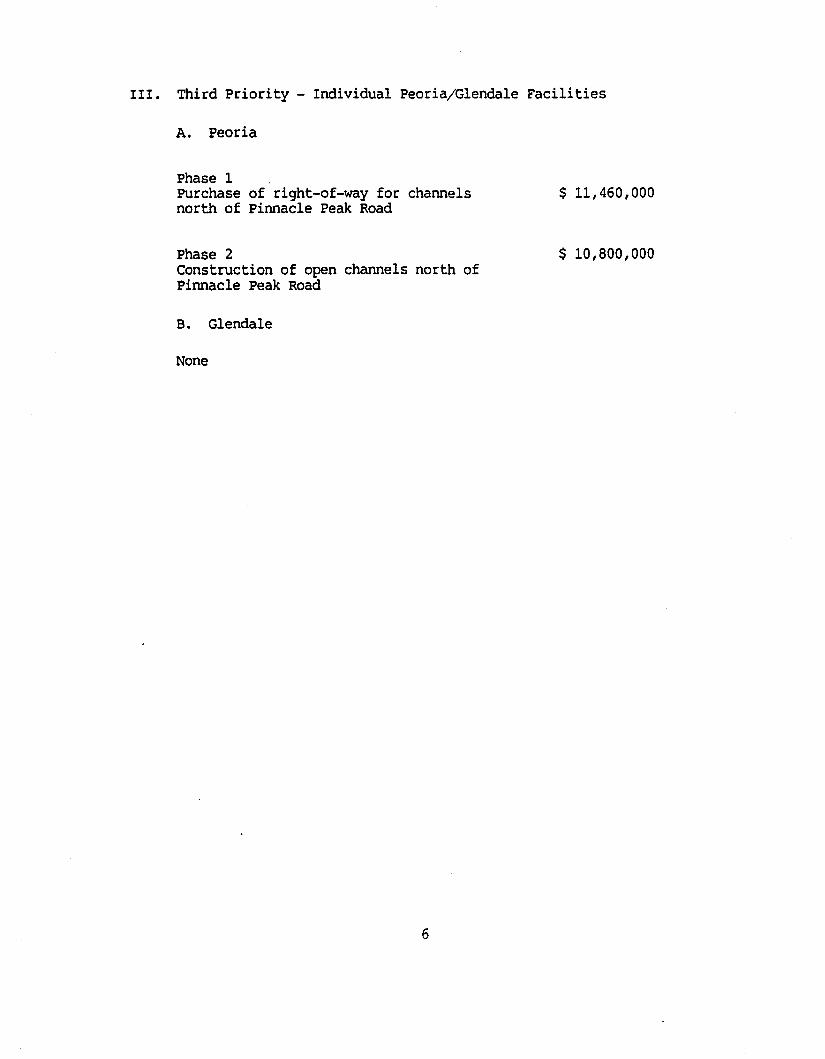
III. Third priority - Individual Peoria/Glendale Facilities
A. Peoria
Phase 1Purchase of right-of-way for channelsnorth of Pinnacle Peak Road
Phase 2Construction of open channels north ofPinnacle Peak Road
B. Glendale
None
6
$ 11,460,000
$ 10,800,000
PIPE
PIPE NUMBER
FLOW DIRECTION
DETENTION BASIN
ADMP FACILITY
GLENDALE-PEORIA AREADRAINAGE MASTER SnJOY
CDM"7
~
leel
FIGUR~ 7PREFERRED ALTERNATlVE
F.LOOD CONTROL DISTRICTOF MAR1COPA COUNTY
1"north
Ia 2000 4000 6000
"LEGEND!
704
&J~
~
412\
"
.\ ~·:~·-'I·.:·.;1· \.... .. If.. ... .:. ...;. ~
".. .• •. I. ~: _•.1.._;.' 1!.\
·rf \~" 's'
408404 ••.406
p .....~ "
.. ':
//J
I •
12
-:.--~-

6000
leet
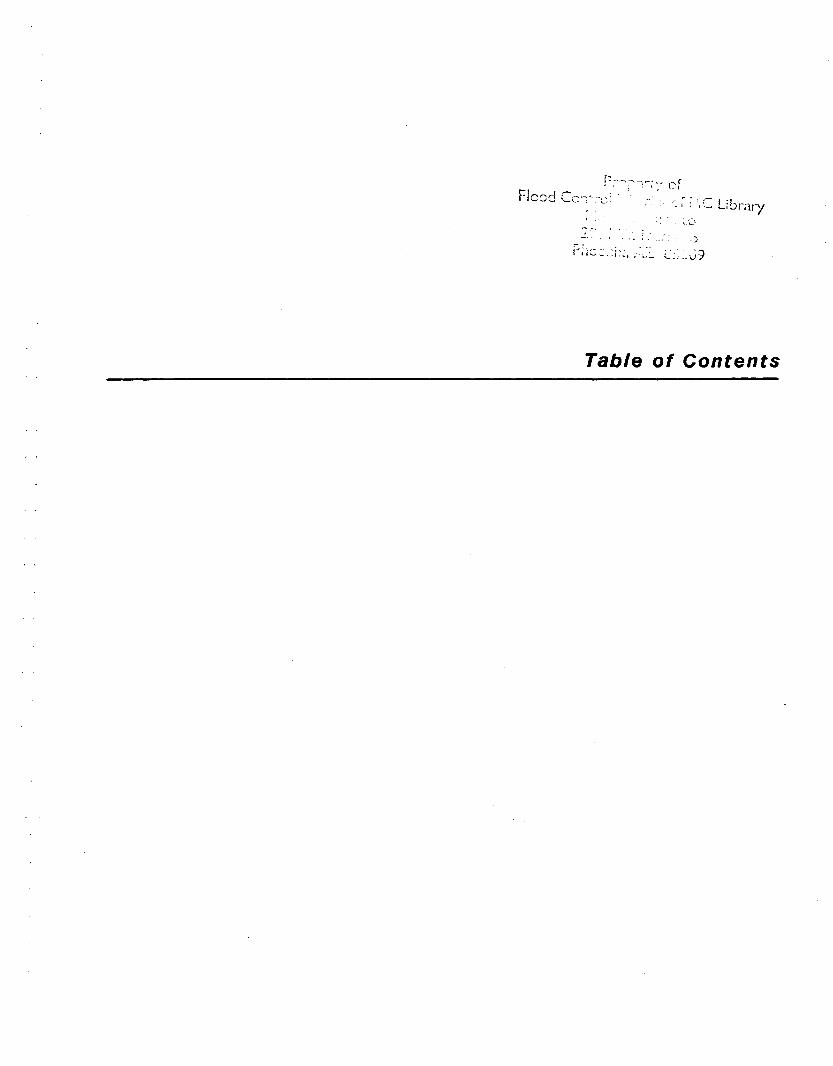
PIPE
PIPE NJMBER
FlOW DIRECTION
DETENTION BASI N
I'north
I
COMJ6w
GLENDALE-PEORIA AREADRAJNAQE MASTER STUDY
FLOOD CONTROL DISTRICTOF MARICOPA COUNTY
FIGURE 8PREFERRED ALTERNATIVE
o
L:P/;" ...~;>
I 704
200~ .. 000
Fed====:.-!-.....~.~,
lJLEGEND
to
\
....19"
\,
,',.,,00.'
\
i\
\ \\ ~.,
:r~~.·.-·-·-·-'2'4.· ... ,. . .,.:~';: ~~ 22
.....
\ ,".,j,.
' :
, 12'
-.-.
.:.'..,.J,IW:
feet
COM
GLENDALE-PEORIA AREADRAINAGE MASTER STUDY
FIGURE 9PREFERRED ALTERNATIVE
FLOOD CONTROL DISTRICTOF MARICOPA COUNTY
PdF~Il::::'==
northI
o 2000, 4000 ~6000
•
" LEGEND
- CHANNEL (SIZED)
140 CHANNEL NUMBER
d FLOW DIRECTION
CHANNEL (NATURALOR UNSIZED)
\ .\.
.'IO!..-
!I
": :c" fI :
(', "r \,'1.
~
'..
"j 10,.
16
" ,'I '-1:-" . \( (
~ iOA ~l '115
.\R£CR£ATIti;N A'~lI:jA
~,·-eE'ffi!-V~~l~c.B/,/
OF.. ~ . ,--. " -_.,-'\,.... : .. !l
;- I

Section One
1. INTRODUCTION
BACKGROUND
Glendale and Peoria are located in Central Arizona and experience a dry
climate with a low average rainfall. In spite of the low rainfallexperienced, occasional storms can produce significant stormwater runoff in
both cities.
Until recently, the Cities have primarily been centers for agriculturalactivities, with relatively low population density. In this setting, therunoff from infrequent storms could generally be handled without a formal
drainage system and without causing significant damage or problems.
with the rapid residential growth of this area, the increased urbanizationtended to expand the volume and rate of runoff that occurred. Also, withthe larger population base, more inconvenience was experienced because ofwater in the streets, and the potential for flood damage increased with thegreater number of structures.
As a first step in solving these drainage problems, the Cities recently hadstorm drainage master plans completed. The City of Glendale selected CampDresser & McKee Inc. (COM) to develop their master plan, while the City ofPeoria selected James M. Montgomery, Consulting Engineers, Inc. (JMM) to
prepare their plan. Both studies were funded in part by the Flood ControlDistrict of Maricopa County, which is responsible for stormwater management
in the county.
Because of the topography of the area, portions of the City of Glendalewould (under normal conditions) drain to and across the City of Peoria.However, the Glendale Master Plan only examined alternative drainagesystems that would be entirely within the Glendale city limits. Due to the
potential benefits of combining the storm drainage systems of Glendale andPeoria, the Flood Control District felt that a plan not limited by municipal boundaries might best serve the needs of both Cities and the County.
1-1
Such a plan was to be formulated under the District's Area Drainage MasterStudy (ADMS) program which investigates stormwater management problems and
jurisdictional constraints of a particular watershed or watershed cluster.Each ADMS has as its product an Area Drainage Master Plan (ADMP), adopted
by the District's Board of Directors and any subsidiary jurisdictions, toprovide guidelines for stormwater management as the area develops. CDM,
with JMM as a subconsultant, was chosen to develop a Glendale-Peoria ADMP.
SCOPE OF WORK
The process of developing the ADMP for the Glendale-Peoria Area was dividedinto the following tasks:
Task 1 - Assemble and Review Basic Data
Task 2 - Compile and Evaluate Rainfall Data
Task 3 - Model the Existing Peoria Stormwater Drainage System
Task 4 - Develop Alternative Drainage Systems for CombinedGlendale-Peoria Area
Task 5 - Analyze Alternative Drainage Systems
Task 6 - Estimate Alternative Costs
Task 7 - Present Alternatives to Review Committee
Task 8 - Recommend Design Criteria and Design Objectives
Task 9 - Establish Facilities for Selected Alternative
Task 10 - Recommend Phased Construction Program
Task 11- Prepare Technical Report
Task 12 - Prepare Maps
Task 13- Participate in Conferences
Task 14 - Provide Reports
This document represents the completion of Tasks 1 through 14 listed above.
1-2

After the ADMP had been developed, the District requested that an addendum
to the initial study be undertaken which would relate costs of the
Glendale-Peoria ADMP facilities to storm frequency. Specifically,
additional information was requested to compare costs of varying levels ofprotection (2-, 5-, 10-, 25-, 50-, and 100-year storm frequencies) forjoint facilities. The addendum is discussed in a separate document"Addendum to the Glendale-Peoria Area Drainage Master Plan" dated May 1987.
Although the initial "Glendale-Peoria Area Drainage Master Plan" report wascompleted in April 1986, it was dated and published in May 1987 with theaddendum report.
1-3
Section Two
2. STUDY AREA
LOCATION
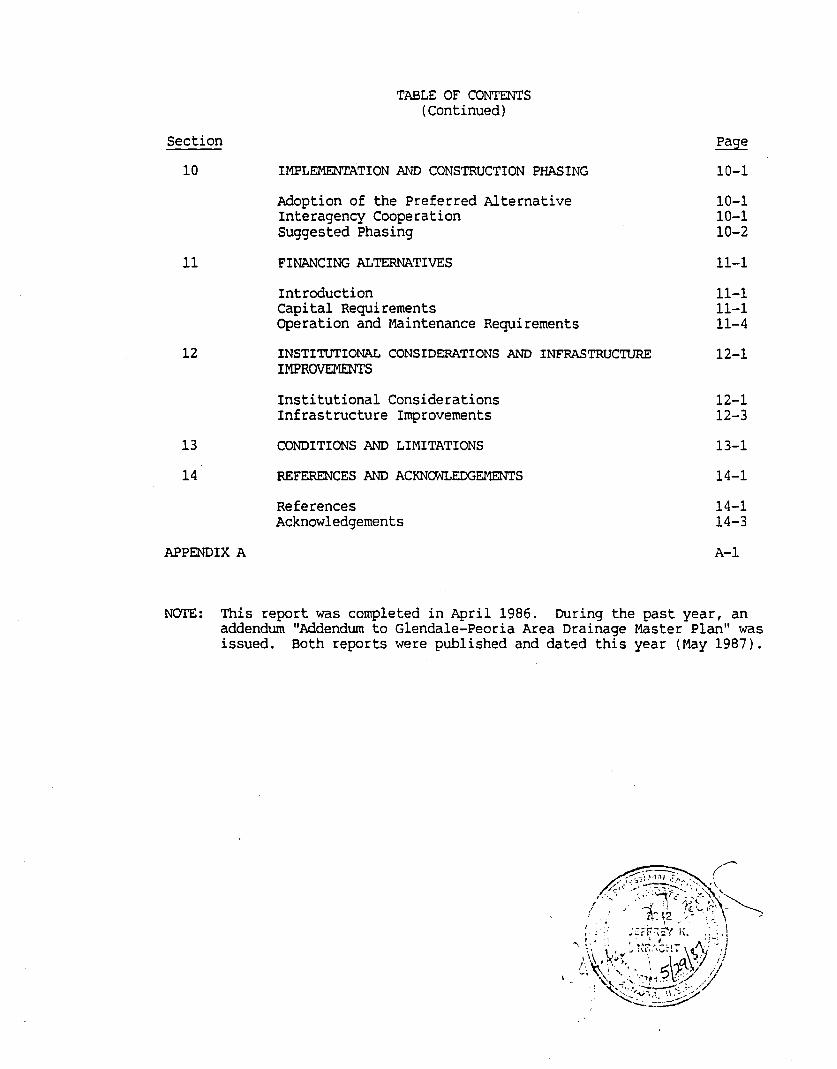
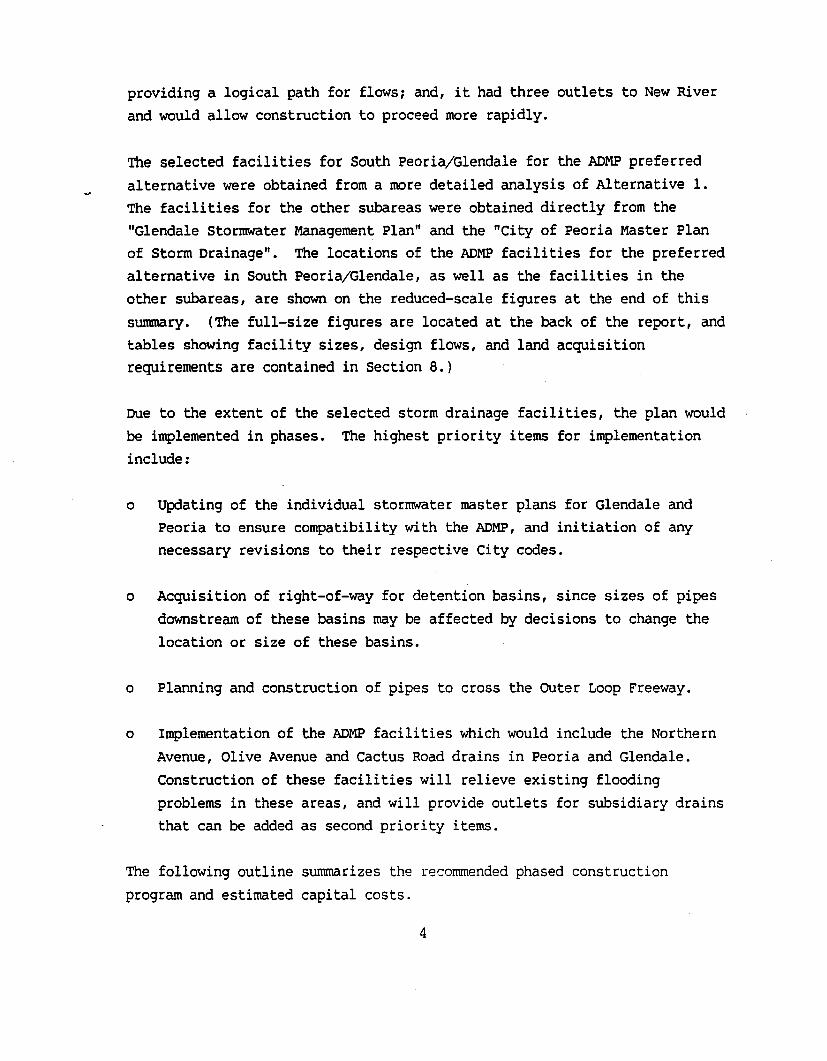
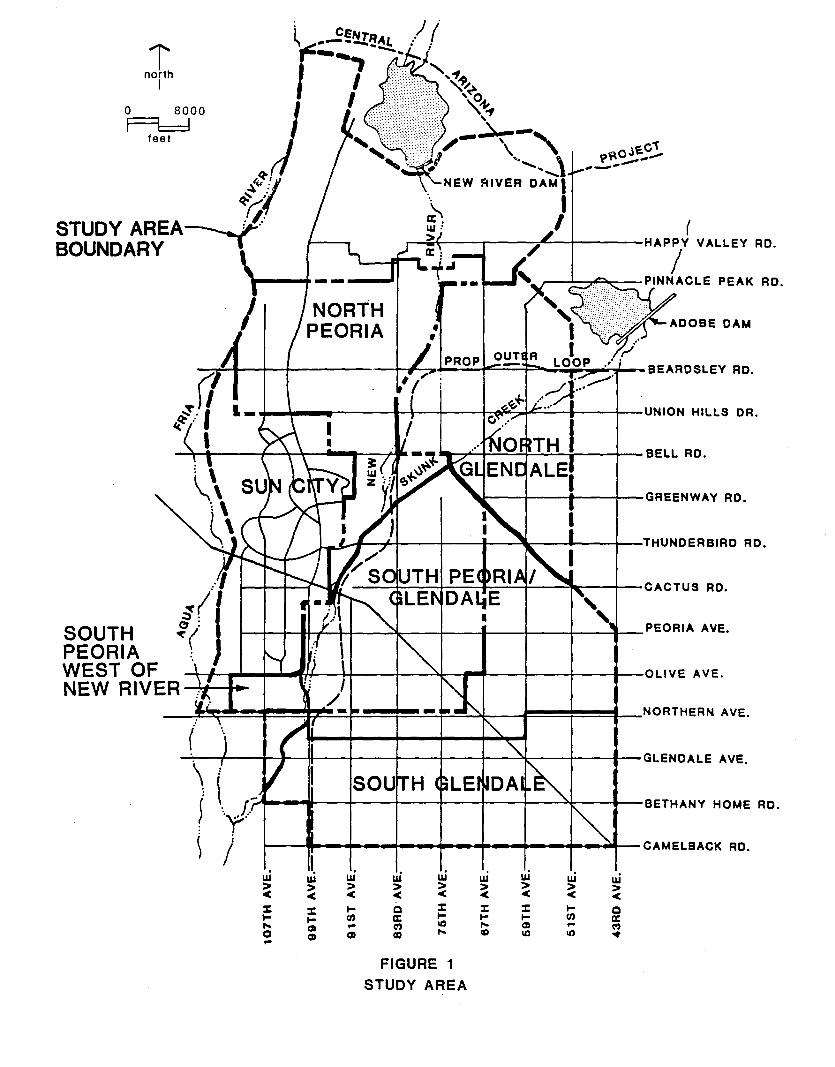
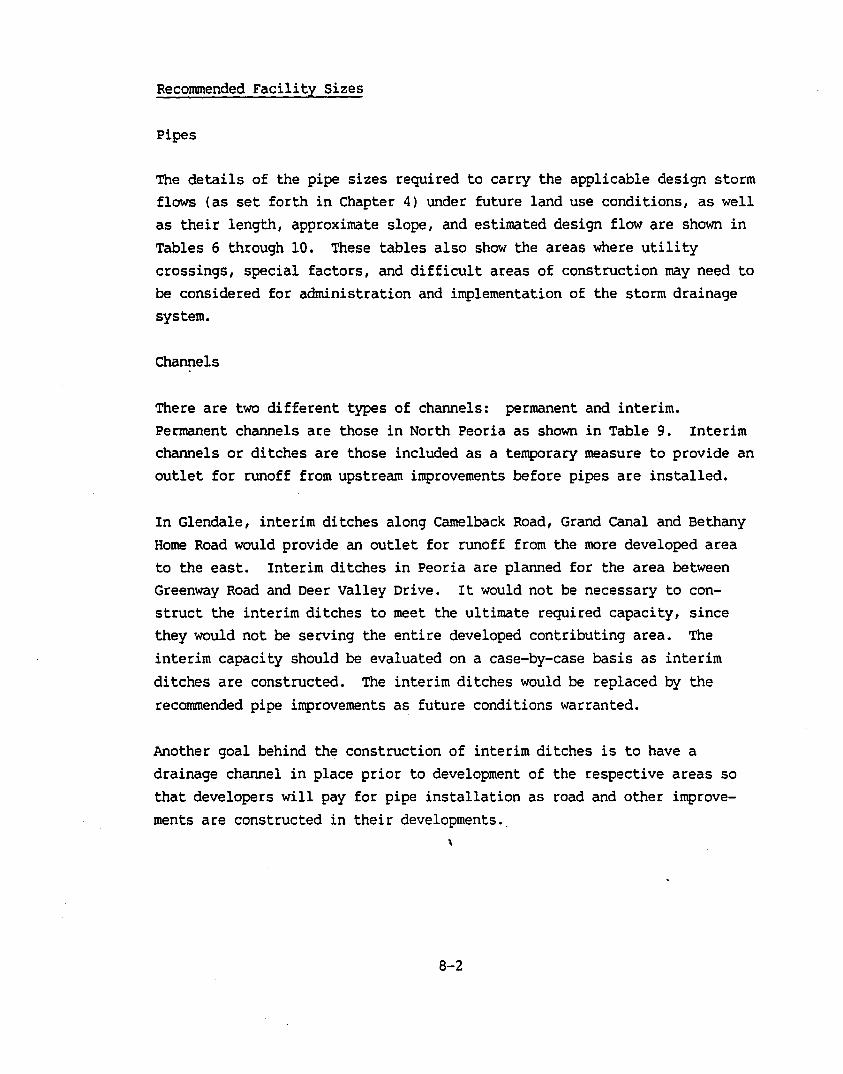
The Cities of Glendale and Peoria are located in the center of MaricopaCounty, in south-central Arizona. The Cities are bounded on the south andeast by the City of Phoenix and on the northeast by the Cities of EI Mirageand Youngtown. The study area, as shown in Figure 1, included the City ofGlendale, the City of Peoria, and contributing drainages bounded on thewest by the Agua Fria River, on the north by the Central Arizona project(CAP) Canal and the New River Dam alignment, and on the east by theHedgepeth Hills and Weir Valley.
LAND USE
Since the distribution of land use differs between cities, this discussionwill address land use in three sections: Glendale, Peoria, and Sun City.
Glendale
The City of Glendale was originally a trade and service center for the richagricultural area lying west of the City of Phoenix. Glendale's populationremained relatively constant until after World War II, at which time alarge population influx occurred due to the conversion of farmland toresidential tracts. Between 1970 and 1980, the population increased by 176percent. The 1980 population of Glendale was 96,988, and the 1985 population was estimated to be 130,000. According to the City of Glendale Plan1980-2005, additional population growth of 50 to 100 percent is expected by
the year 2000.
The City of Glendale General Plan also indicates that land use in the Cityis distributed among the following categories, with approximate percentagesfor each: agriculture (48%); residential development (24%); undevelopedland (17%); schools and parks (6%); commercial enterprises (3%); and industry (2%). Growth is anticipated in residential, commercial, and industrial development while agricultural use is expected to decline.
2-1
w><Qa:(')
•
w><l(/)..10
w><:tIal10
w><:tI,..co
w><:tI10,..
w><Qa:(')CO
w><l(/)...c:D
I.w><:tICltClt
;---4f-A--l---..:....-t---:::!~--!--"T-THUND ER BIRD RD.
~--+--jt---j--GREENWAY RD.
~...,.L+.!-'!~4!-!..!-!.+--t-- BELL RD.
(-U-~--~:"--+----HAPPY VALLEY RD.
Ir--C:?!2005:slPINNACLE PEAK RD.
'~~'~~+::::'=T=s""':;'~~~-BEARDSLEY RD.
·">Z.-,. ADOBE DAM
L_.L_+---.+-4--r--t--t---,-- CAMELBACK RD.
w><:t...,..o...
.1-~-.....----t-+-t--l~?F::",-r-T-UN'ON HILLS DR.
LLLIh~+--~:---i--1r--r---r--!- PEORIA AVE.
-iL.J......J.l....«fJ.-~+--+-~-:-1-t---t-,I-r--O LI VE AVE.
~(~.-J--Wi-~-+--+--+--t-4,-r-r--GLENDALE AVE.
\ ( BETHANY HOME RO.: \ ~:L.-t---+--+--+-+-~t:ir-f "'y!'\ J
inorth
I
o 8000
F=b:::dfeet
SOUTHPEORIAWEST OF
NEW RI~E=R~_-j~~~~~~~~~~~~~~~~~~~~~~~~NORTHERNAVE.
FIGURE 1
STUDY AREA
Glendale exhibits varying levels of development. The portion of the Citybetween 67th Avenue and New River, bounded on the south by Camelback Roadand on the north by Northern Avenue is primarily agricultural land with asmall amount of scattered residential development. The Western GlendaleArea Plan calls for residential development on much of the undevelopedfarmland. Some small areas are designated for commercial and office use.
At present, the most developed area of Glendale is between 67th Avenue and43rd Avenue, north of Camelback Road to the Arizona Canal DiversionChannel. Within this area lies the downtown portion of Glendale. Althoughsmall areas of undeveloped land exist, future changes to this part of theCity. will be minimal. Large amounts of undeveloped land remain in Glendalenorth of the Arizona Canal Diversion Channel; included is the ArrowheadRanch, located north of Skunk Creek. Future plans for development of thisarea provide for mostly residential use; however some land is designatedfo~ commercial and light industrial use, as well as for floodplainallowance.
Peoria
The City of Peoria was founded in 1879 as a farming community, and historically has served as the agricultural center for the surrounding farmareas. With the rapid growth in the region, Peoria has been moving awayfrom its agricultural origins and is shifting into a major urban center inwhat has now become the greater Phoenix metropolitan area. As a result ofthis growth, the population in Peoria increased 157% from a population of4,753 in 1970 to 12,230 in 1980. Recent estimates put Peoria's 1985population at approximately 27,000, with a projected population of 75,000by the year 2000. Due to this rapid increase in population, large farmingtracts are being sold to developers for conversions to subdivisions,schools, commercial centers, and industrial parks. This trend of decreasing agricultural land and increasing residential, commercial, and industrial development is expected to continue. According to the 1982 City ofPeoria General Land Use Plan, the ultimate development of Peoria will becomprised of approximately 70% residential; 21% commercial and industrial;and 9% for schools, parks, floodplain, and special uses.
2-2
As in Glendale, development in Peoria varies throughout the City. The areafrom Northern Avenue to Bell Road is the most extensively developed part ofthe City. The land use here consists of residential, commercial, industrial, office, and open space. Future development of this part of Peoria
.- is severely limited.
The portion of Peoria between Bell Road and Pinnacle Peak Road is just nowbeginning to be developed. Ultimate utilization is expected to occur within the next 20 years, with residential, commercial, and office use comprising the majority of the development. The region north of Pinnacle PeakRoad is undeveloped and development is not planned for the foreseeablefuture.
Sun City
Sun City is an unincorporated large residential community. Nearly all theland in Sun City is used for residential purposes except those land areasdesignated for open space. The open space areas primarily consist of golfcourses. Future development of Sun City will be limited due to the smallamount of undeveloped land.
'!OPOGRAPHY
Glendale and Peoria are situated in the basin of New River, which originates in the New River Mountains north and east of the Cities.
The primary watercourses in the area include the Agua Fria River, NewRiver, and Skunk Creek. The Agua Fria River starts in the mountains of
central Arizona near Prescott, and flows south more than 100 miles beforejoining the Gila River 15 miles west of Phoenix. New River, a tributary ofthe Agua Fria River, flows generally southwesterly until it joins the AguaFria River west of Glendale. Skunk Creek is a major tributary of New Riverwhich starts in the New River Mountains and flows generally southwest untilit joins New River west of Glendale. Apart from the major rivers in thearea, natural drainage was previously provided by poorly defined washes
2-3
flowing across the alluvial fan. However, when valley land was convertedto agricultural uses, these small washes were generally obliterated.
The terrain in the City of Glendale is flat, with a gradual slope of about4.5 feet per 1,000 towards the southwest and about 3 feet per 1,000 alongthe principal streets, which run north and south or east and west in arectangular grid.
The City of Peoria is also located on mostly flat terrain, with slopessimilar to those found in Glendale. North Peoria, however, has a considerably more uneven terrain. Several small mountains and hills can befound in North Peoria, some of which rise as much as 400 to 500 feet about
the valley floor.
GEOLOGY
The geology in the Glendale-Peoria area consists of a basement complex predominantly of Precambian schistose and massive metaigneous rocks withlesser amounts of gneiss and quartzite. These are overlain with andintruded by igneous rocks consisting of granites, rhyolite, andesite, flowsof vesicular basalt, tuff, and tuffaceous agglomerate. The valleys in thisarea are filled with alluvium derived from the same general material ofwhich the bedrock is composed. Older alluvium is found on the side slopesof the valleys and underlying more recent deposits in the valleys, and consists of well-cemented residual soil and debris, mostly sand and siltysand. Recent alluvium is found in valley areas near streambed channels,and consists of uncemented silts, sands, gravels, cobbles, and boulders.The total depth of the alluvium is estimated to be 1,000 to 1,200 feet in
the Glendale-Peoria area. The groundwater table is about 250 to 300 feet
below the surface.
RAINFALL
Rain storms that occur in the Glendale-Peoria area are generally one ofthree tyPes, as indicated by the U. S. Army Corps of Engineers (Design
Memorandum No.2, 1982). These storms are described below:
2-4
General winter Storms. These storms originate from the northPacific Ocean, and can occur from late October through May,although they are most cormnon from December through earlyMarch. These storms frequently last several days and spreadgenerally light to moderate precipitation over large areas.Although these storms are generally of low intensity, combined with snowmelt from the mountains, their large arealextent and long duration, these storms can produce high peakflows on the large rivers in the area.
General Surmner storms. These storms generally originate fromthe southeast or south and are often associated with tropicalstorms or hurricanes. The storms can occur from late Junethrough mid-october, but are most frequent from Augustthrough early October. They usually last from 1 to 3 days,and produce locally heavy precipitation for many areas withina widespread area of light to moderate rain.
Local Storms. These convective storms are generally referredto as thunderstorms or cloudbursts and consist of heavy downpours of rain over relatively small areas for short periodsof time. They are most prevalent during the surmner months ofJuly to September. The runoff from these storms generallyhas a high peak and low volume, and can result in seriousflash floods.
SOIL CHARACTERISTICS
Major soil types found in the study area have been mapped by the UnitedStates Department of Agriculture Soil Conservation Service (SCS).Generally, these soils are loarns, sandy loarns, clay loarns, and clay. Ahydrologic group classification has been determined for soils by the SCS toindicate the general potential of various soils to generate runoff fromrainfall. The following definitions of hydrologic soil groups are used:
Group A (Low runoff potential). Soils having high infiltrationrates even when thoroughly wetted and consisting chieflyof deep, well to excessively drained sands or gravels.These soils have a high rate of water transmission.
Group B Soils having moderate infiltration rates when thoroughlywetted and consisting chiefly of moderately deep todeep, moderately well, to well-drained soils with moderately fine to moderately coarse textures. These soilshave a moderate rate of water transmission.
2-5
Group C Soils having slow infiltration rates when thoroughlywetted and consisting chiefly of soils with a layer thatimpedes downward movement of water, or soils with moderately fine to fine texture. These soils have a slowrate of water transmission.
Group D (High runoff potential). Soils having very slow infiltration rates when thoroughly wetted and consistingchiefly of clay soils with a high swelling potential,soils with a permanent high water table, soils with aclaypan or clay layer at or near the surface, andshallow soils over nearly impervious material. Thesesoils have a very slow rate of water transmission.
The soil types found within the Cities generally belong to the B hydrologicsoil group, which have a moderately low runoff potential. Some soilsbelonging to the A, C, and D soil groups are also found within the Cities.For the analysis of the stormwater system, infiltration rates were used asa parameter rather than the hydrologic soil group.
2-6

Section Three
3. EXISTING STORM DRAINAGE SYSTEM
EXISTING SYSTEM
Glendale
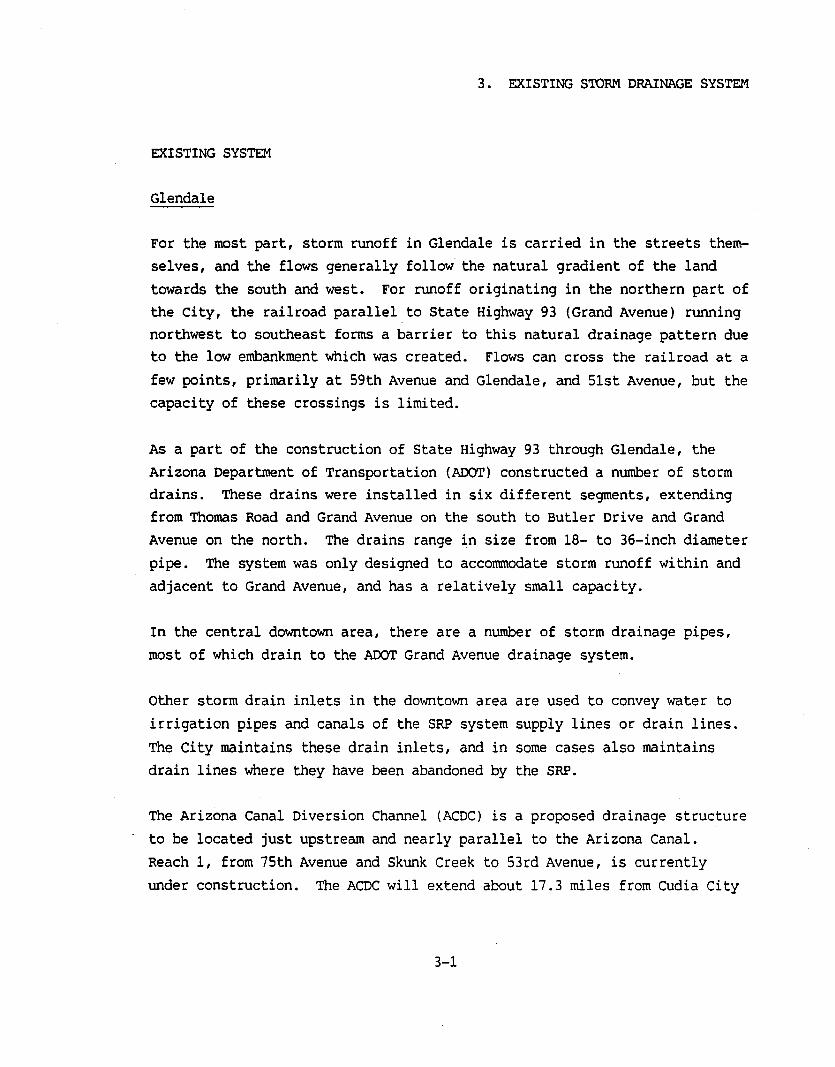
For the most part, storm runoff in Glendale is carried in the streets themselves, and the flows generally follow· the natural gradient of the land
towards the south and west. For runoff originating in the northern part ofthe City, the railroad parallel to State Highway 93 (Grand Avenue) runningnorthwest to southeast forms a barrier to this natural drainage pattern dueto the low embankment which was created. Flows can cross the railroad at a
few points, primarily at 59th Avenue and Glendale, and 51st Avenue, but thecapacity of these crossings is limited.
As a part of the construction of State Highway 93 through Glendale, theArizona Department of Transportation (ADOT) constructed a number of stormdrains. These drains were installed in six different segments, extendingfrom Thomas Road and Grand Avenue on the south to Butler Drive and GrandAvenue on the north. The drains range in size from 18- to 36-inch diameter
pipe. The system was only designed to accommodate storm runoff within andadjacent to Grand Avenue, and has a relatively small capacity.
In the central downtown area, there are a number of storm drainage pipes,most of which drain to the ADOT Grand Avenue drainage system.
other storm drain inlets in the downtown area are used to convey water to
irrigation pipes and canals of the SRP system supply lines or drain lines.
The City maintains these drain inlets, and in some cases also maintainsdrain lines where they have been abandoned by the SRP.
The Arizona Canal Diversion Channel (ACDC) is a proposed drainage structure
to be located just upstream and nearly parallel to the Arizona Canal.Reach 1, from 75th Avenue and Skunk Creek to 53rd Avenue, is currently
under construction. The ACDC will extend about 17.3 miles from Cudia City
3-1
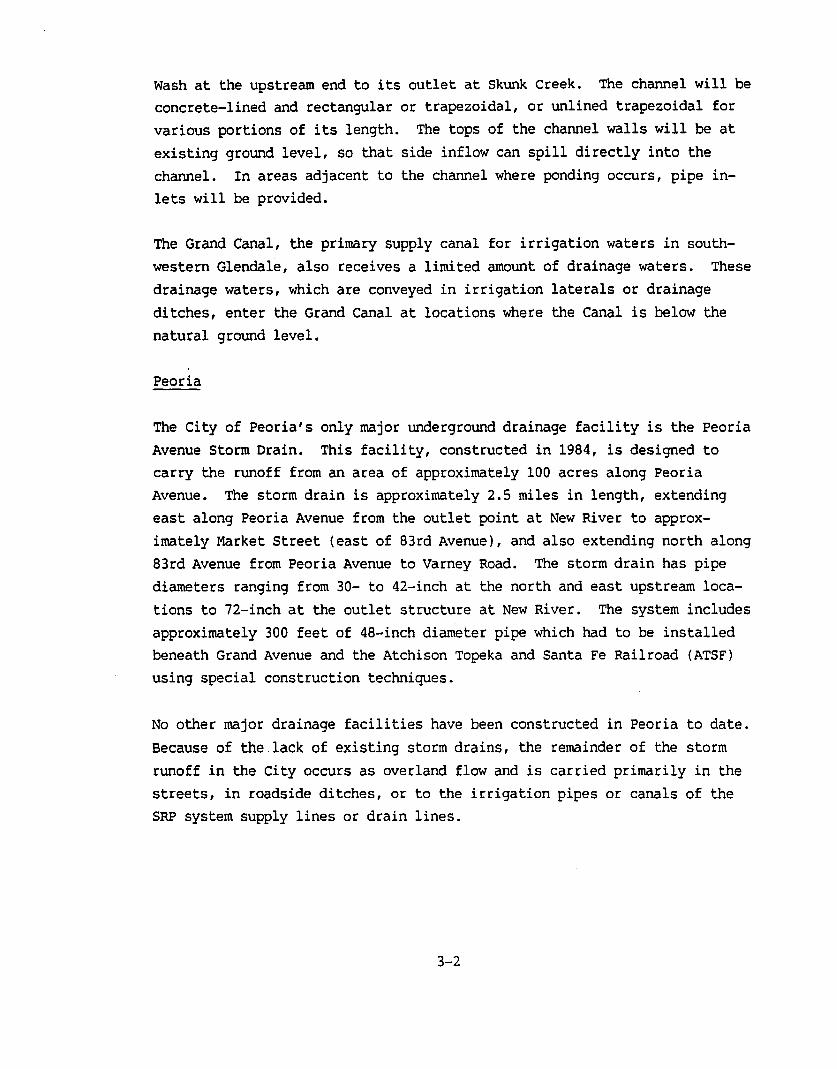
Wash at the upstream end to its outlet at Skunk Creek. The channel will beconcrete-lined and rectangular or trapezoidal, or unlined trapezoidal forvarious portions of its length. The tops of the channel walls will be atexisting ground level, so that side inflow can spill directly into thechannel. In areas adjacent to the channel where ponding occurs, pipe inlets will be provided.
The Grand Canal, the primary supply canal for irrigation waters in southwestern Glendale, also receives a limited amount of drainage waters. Thesedrainage waters, which are conveyed in irrigation laterals or drainageditches, enter the Grand Canal at locations where the Canal is below thenatural ground level.
Peoria
The City of Peoria's only major underground drainage facility is the PeoriaAvenue Storm Drain. This facility, constructed in 1984, is designed tocarry the runoff from an area of approximately 100 acres along PeoriaAvenue. The storm drain is approximately 2.5 miles in length, extendingeast along Peoria Avenue from the outlet point at New River to approximately Market Street (east of 83rd Avenue), and also extending north along83rd Avenue from Peoria Avenue to Varney Road. The storm drain has pipediameters ranging from 30- to 42-inch at the north and east upstream locations to 72-inch at the outlet structure at New River. The system includesapproximately 300 feet of 48-inch diameter pipe which had to be installedbeneath Grand Avenue and the Atchison Topeka and Santa Fe Railroad (ATSF)using special construction techniques.
No other major drainage facilities have been constructed in Peoria to date.Because of the lack of existing storm drains, the remainder of the stormrunoff in the City occurs as overland flow and is carried primarily in thestreets, in roadside ditches, or to the irrigation pipes or canals of theSRP system supply lines or drain lines.
3-2
EXISTING DRAINAGE PROBLEMS
The inadequacy of the current drainage system causes a number of problemsunder existing conditions during intense storms. These problems consistprimarily of flooding of streets and intersections and subsequent traffic
disruption, as well as ponding of water in ditches and gutters at manylocations in the study area.
The flooding problems are most severe where the shallow flood flows areinterrupted by natural or manmade barriers, which cause pending of water.This occurs on the north side of Grand Avenue, where the downtown commercial district is particularly affected, and on the north side of the GrandCanal.
A number of intersections in the study area also have dip crossings where ashallow gutter along one street extends across an intersecting street toallow passage of stormwater. The flow of traffic at these crossings can berestricted when stormwater flow is high.
With increased development, street flooding has worsened to the point whereit is a severe nuisance on the threshold of causing damage to structuresand their contents in some areas.
Some flooding occurs because of water that enters Glendale from surroundingareas. In the northern part of Glendale, stormwater enters the City fromPhoenix along 51st Avenue. Most of this water flows west on ThunderbirdRoad and into the ACDC. This is a severe problem making Thunderbird Roadimpassable, causing property damage, and critically reducing access to theThunderbird Samaritan Hospital. The remaining stormwater continues south
on 51st Avenue and enters the ACDC at Cactus Road.
A similar problem occurs in Peoria as it receives excess runoff fromGlendale along its eastern boundary. This additional runoff compoundsflooding problems already occurring at the Grand Avenue-ATSF Railroad flowbarrier.
3-3
The most serious flooding in Peoria has occurred in the Olive Avenue and75th Avenue areas near Grand Avenue, as stor.mwater ponds along the northside of the highway and railroad and floods adjacent property.
Arizona Department of Transportation (ADQT) projects, particularly theOUter Loop Freeway and Grand Avenue improvements, will potentially affectdrainage in the study area. Cooperation with ADQT would be beneficial toassess possible effects on the existing drainage situation and planneddrainage improvements, as well as to explore the possibility of jointfacilities.
Flooding problems have also occurred along the Grand Canal, which causeswater to pond where the canal is higher than the surroundin3 3round.
Stormwater entering the canal can also cause the canal to overflow.
In the past, considerable water has entered the Arizona Canal during stormperiods, causing it to overflow in the study area. When the adjoiningdrainage channel (ACDC) is completed, overflows from the canal will begreatly reduced. The drainage channel has been designed to intercept theestimated 100-year future peak storm flow that would otherwise enter thecanal between Skunk Creek and 40th Street. Storm runoff could still enterthe canal east of 40th Street.
There are several rivers within the study area that experience periodicflooding. Skunk Creek and New River flow directly through the study areawhile the Agua Fria River forms the western boundary of the study area. Inaddition, flooding has been experienced along the Arizona Canal and alongGrand Canal. In September 1981 a flood insurance study for the City ofGlendale was completed by Harris-Toups Associates under the direction ofthe Federal Emergency Management Agency. This study provides the basis forthe following discussion.
The hydrologic analysis of the three rivers within the study area established the peak discharges for the 10-, SO-, 100-, and SOO-year storms.These peak discharges for New River and Skunk Creek are shown in Table 1.It was also determined that the capacity of the Arizona and Grand Canals
3-4
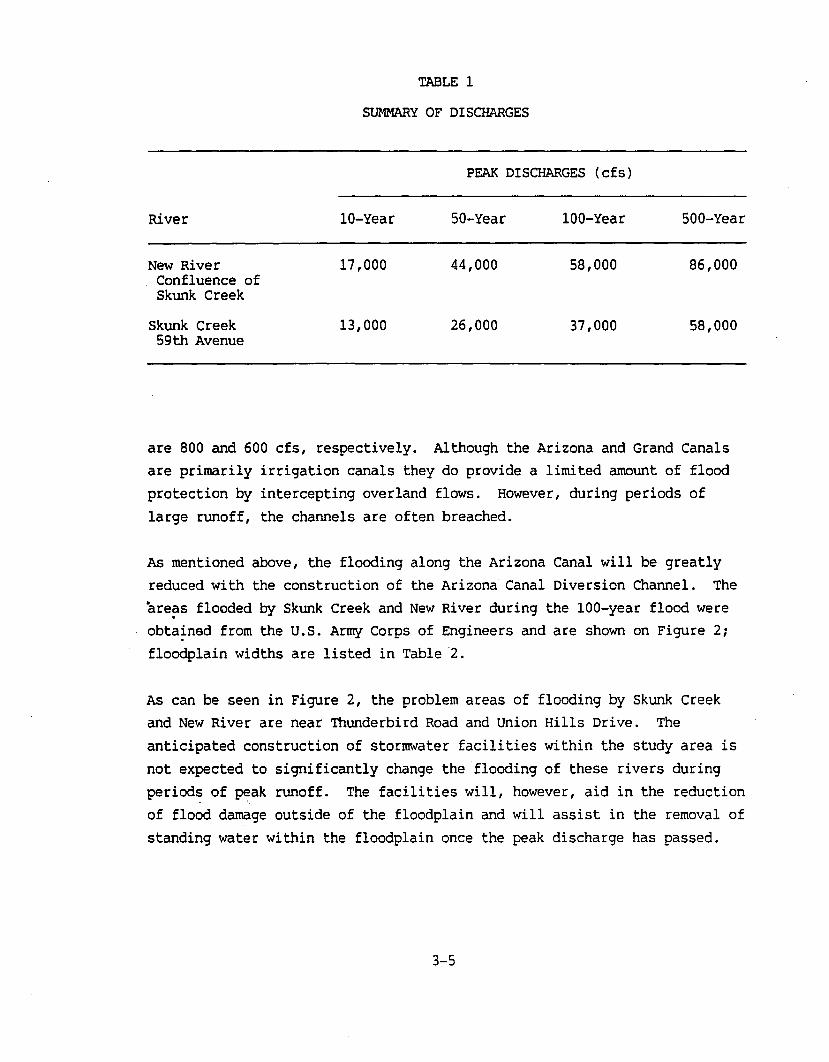
TABLE 1
SUMMARY OF DISCHARGES
PEAK DISCHARGES (cfs)
River la-Year 50-Year lOa-Year SaO-Year
New River 17,000 44,000 58,000 86,000Confluence ofSkunk Creek
Skunk Creek 13,000 26,000 37,000 58,00059th Avenue
are 800 and 600 cfs, respectively. Although the Arizona and Grand Canalsare primarily irrigation canals they do provide a limited amount of floodprotection by intercepting overland flows. However, during periods oflarge runoff, the channels are often breached.
As mentioned above, the flooding along the Arizona Canal will be greatlyreduced with the construction of the Arizona Canal Diversion Channel. Theare~s flooded by Skunk Creek and New River during the lOO-year flood wereobta~nad from the u.S. Army Corps of Engineers and are shown on Figure 2;floodplain widths are listed in Table ·2.
As can be seen in Figure 2, the problem areas of flooding by Skunk Creekand New River are near Thunderbird Road and Union Hills Drive. The
anticipated construction of storrnwater facilities within the study area isnot expected to significantly change the flooding of these rivers during
period~ of peak runoff. The facilities will, however, aid in the reductionof flood damage outside of the floodplain and will assist in the removal ofstanding water within the floodplain once the peak discharge has passed.
3-5
EC'tp~~-----
f"'-~~-~----:-.'---1r----HAPP Y V ALLEY RD.
I_-L...~~-PINNACLE PEAK RD.
---+----+--I--+----;.~-_r_-CACTUSRD.
-l,...~r----it',+-r--it=:~~~~-I----+-UNIONHILLS .DR.
~~-i--+-~--_t_-+-_t-----:~-__r-BETHANY HOME RD.
1--I--+-if.#+-~---:~-_t--f_;;:;_;_i=w:;,l:l~I-PEORIA AVE.
~~J---t--I------+~7~.:.;:;.:~===,==--~e~;.t-BEARDSLEY RD.
---:lr-t----f---lr-T-- • .-~ '-~~~~--+--i---t- BELL RD.
inorth
I
o 8000
f=bdfeet
~--'"-~--ot--~--+--+_-..,.-....r__ CAMELBACK RD.
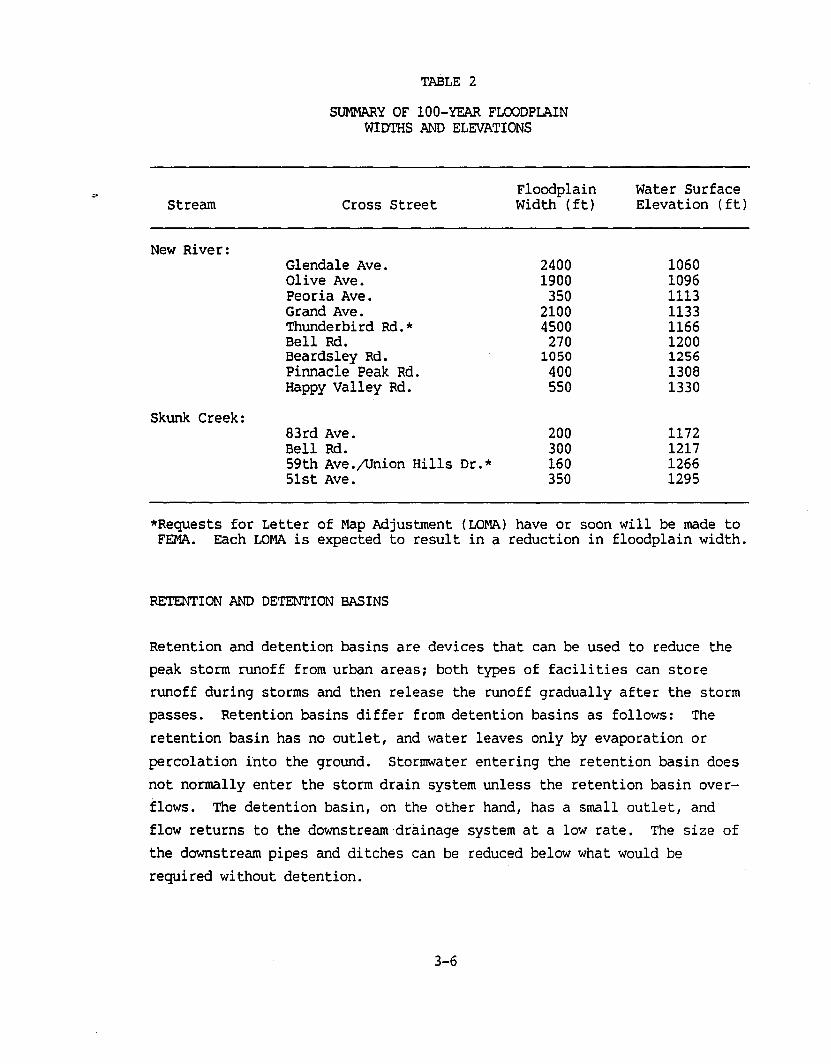
TABLE 2
SUMMARY OF 100-YEAR FLOODPLAINWIDTHS AND ELEVATIONS
~Floodplain water Surface
stream Cross Street Width (ft) Elevation (ft)
New River:Glendale Ave. 2400 1060Olive Ave. 1900 1096Peoria Ave. 350 1113Grand Ave. 2100 1133Thunderbird Rd.* 4500 1166Bell Rd. 270 1200Beardsley Rd. 1050 1256Pinnacle Peak Rd. 400 1308Happy Valley Rd. 550 1330
Skunk Creek:83rd Ave. 200 1172Bell Rd. 300 121759th Ave./Union Hills Dr.* 160 126651st Ave. 350 1295
*Requests for Letter of Map Adjustment (LOMA) have or soon will be made toFEMA. Each LOMA is expected to result in a reduction in floodplain width.
RETENTION AND DETENTION BASINS
Retention and detention basins are devices that can be used to reduce thepeak storm runoff from urban areas; both types of facilities can storerunoff during storms and then release the runoff gradually after the stormpasses. Retention basins differ from detention basins as follows: The
retention basin has no outlet, and water leaves only by evaporation or
percolation into the ground. Storrnwater entering the retention basin does
not normally enter the storm drain system unless the retention basin overflows. The detention basin, on the other hand, has a small outlet, andflow returns to the downstream-drainage system at a low rate. The size of
the downstream pipes and ditches can be reduced below what would berequired without detention.
3-6
The use of retention/detention basins is a relatively new concept for theCity of Glendale, having been used only within the last 2 or 3 years.Glendale now owns and maintains several retention basins, and some of themare used as city parks. Two of these basins are located at Montarra Park,near Peoria and 65th Avenues, and at Sunnyside Park, at 63rd Avenue andCholla Street. The City has found that water in these basins tends topercolate very slowly, allowing standing water to remain in the basin forlong periods. occasionally, the City has used portable pumps to drain thebasins by pumping water into the street; dry wells are planned tofacilitate percolation and reduce retention time in parks.
In addition to the City operated retention basins in Glendale, there are a
number of privately owned retention basins. The current City regulationsspecify that new development retain on site all flow from a lO-year storm.At the present time, developers in Glendale are required to installretention basins for new development. Parking lots have typically beenused as retention facilities for commercial developments. Problems havebeen experienced with landscaping and filling activities in these areaswith small retention basins, thereby reducing or eliminating the retentionstorage. The present policy is to use larger retention sites that serveall or major portions of developments.
The City of Peoria, like the City of Glendale, does not have extensiveexperience with retention/detention basins. presently there are no City
~
operated retention/detention facilities within the City of Peoria. Privateretention basins do, however, exist within Peoria.
According to the current administration of the City of Peoria Code, all newdevelopments are to provide on-site storage for the difference in runoffbetween the 2-year storm and the lO-year storm; additional runoff must beconveyed safely to the nearest major mile street. The intent of theseregulations is to minimize nuisance flooding allowing normal traffic flow.The provision requiring excess runoff to be routed to major mile streetsforesees the construction of a stormwater network along the major arterialroutes.
3-7
on-site retention of runoff in Peoria may be achieved in two ways: one, byconstructing a common retention site which is required for multi-familyresidential, commercial, and industrial developments; or two, by constructing a depressed rear yard for single family residential areas. The co~
bined storage of the depressed rear yards should provide the same amount of
storage as a common retention area. The City's policies have been effective where common retention basins have been provided (often a parking lotis used), but have been less effective for single family residential areas.This lack of effectiveness stems from homeowners regrading or filling intheir rear yards to prevent pending of stormwater. The resulting lack ofrunoff storage compounds flooding problems in downstream developments andon the major arterial streets where the anticipated stormwater system has
yet to be implemented.
3-8
Section Four
4. STORMWATER MODELING
PURPOSE OF MODELING
Because of the complexity of storm runoff, and the difficulty of measuringactual peak flows in small urban watersheds, modeling of watersheds usingcomputer simulation techniques is necessary to develop a reliable stor~
water plan. Computer models also have the advantage of being able to predict flows under a variety of physical conditions (including existing andfuture land use conditions), and different storm conditions. The effect ofvarious stormwater facilities can also be studied with the use of themodels.
The methods used by these models is to take the physical parameters of thewatershed that normally affect the runoff process, such as slope, roughness, and infiltration, and use mathematical equations to predict the runoff hydrograph that will be produced on the watershed by a given rainfallpattern.
Because of the need to divide the watershed into a relatively small numberof segments, and the need to use an average value for the parameters ineach segment, the models can only approximate the runoff hydrograph thatwill actually occur. However, if the values of the parameters chosen forthe watershed are truly representative of actual conditions, the approximation can be quite close, and well within the limits of accuracy requiredfor planning drainage facilities.
MODELS USED
A number of the runoff simulation models in general use were considered forthe Glendale Stormwater Management Plan, the Peoria Master Plan of StormDrainage and the Glendale-Peoria ACME. These included the Storm WaterManagement Model (SWMM) developed by the Environmental Protection Agency,the Illinois Urban Drainage Area Simulator (ILLUDAS) model developed by theIllinois State Water Survey, and the HEC-l Flood Hydrograph Packagedeveloped by the U. S. Army Corps of Engineers.
4-1
The SWMM model was used for developing the Glendale Stormwater Management
Plan, the portion of the Peoria Master Plan of Storm Drainage south ofPinnacle Peak Road, and the Glendale-Peoria ADMP. The area north ofPinnacle Peak Road in Peoria was originally modeled using the HEC-l modelbecause of that model's suitability to less developed areas. However, inorder to make it compatible with the remainder of the Glendale-Peoria studyarea, the area was converted to the SWMM model.
HYDROLOGIC CRITERIA
In order to assure the validity of the results obtained with the stormwatermodel, the input parameters used must be obtained in a consistent and reasonable manner, and must agree with the objectives of the stormwater plan.
The simulation done by the SWMM model is divided into two phases. Thewatershed to be simulated is divided into catchments, and the overland flowhydrograph is computed for each catchment. The input parameters requiredfor each catchment include the drainage area, land slope, overland flowlength, overland flow roughness, infiltration parameters, infiltrationdecay rate, and depression storage depth.
After the individual runoff hydrographs for each catchment are computed,these hydrographs are combined and routed through the stormwater system.For modeling purposes, the drain system is divided into reaches, with eachreach having a constant channel section and slope. Input parameters forthe model include the channel shape and dimensions (diameter if a pipe, orbottom width and side slope if an open channel), the slope, and the roughness coefficient.
Detention basins are modeled in SWMM by including, downstream of the proposed basin location, a pipe whose capacity equals the outlet capacity fromthe basin. When inflow to the basin exceeds the capacity of this pipe, theexcess is stored in the model as surcharge. The surcharge represents thestormwater storage volume needed at that basin location. When inflowequals the specified basin outlet capacity, the surcharge (storage) has
4-2

reached its maximum volume. As inflow drops below the basin outlet capacity, the model allows the surcharge back into the system. The volume ofwater detained in the basin can be adjusted by changing the size of the
basin outlet pipe.
The criteria used for the Glendale plan was that a lO-year storm should becarried by the storm drainage system. It was assumed that new developmentin Glendale would retain on site all flow from a lO-year storm, as specified by the current City regulations. This was simulated by decreasing thecontributing drainage areas for those catchments that would be developed inthe future. Fifteen percent of the area to be developed was included inthe model to represent roads and other areas for which retention would notbe feasible.
The criteria used for the Peoria Plan was that a 2-year storm would becarried by the storm drainage system. It was assumed that the differencebetween the lO-year storm and the 2-year storm would be stored in on-siteretention areas. The 2-year storm was used in the SWMM model to determinethe required storm drainage system.
The criteria used for the Glendale-Peoria ADMP was that the lO-year stormwould be carried by the storm drainage system. The lO-year storm withreduced contributing areas for new development was used for those portionsof the study area in Glendale. For those portions of the study area inPeoria, all runoff from the lO-year storm from existing developed areas wasconsidered to enter the combined Glendale-Peoria trunk drains. As mentioned above, it was assumed that the difference in runoff from the lO-yearand 2-year storms for new developments would be retained on site.
The land use conditions assumed for the Glendale-Peoria ADMP were futureconditions, based on ultimate development with the current city land useplans.
4-3
Rainfall Patterns
The SWMM Model requires input of an entire rainfall pattern for a sto~
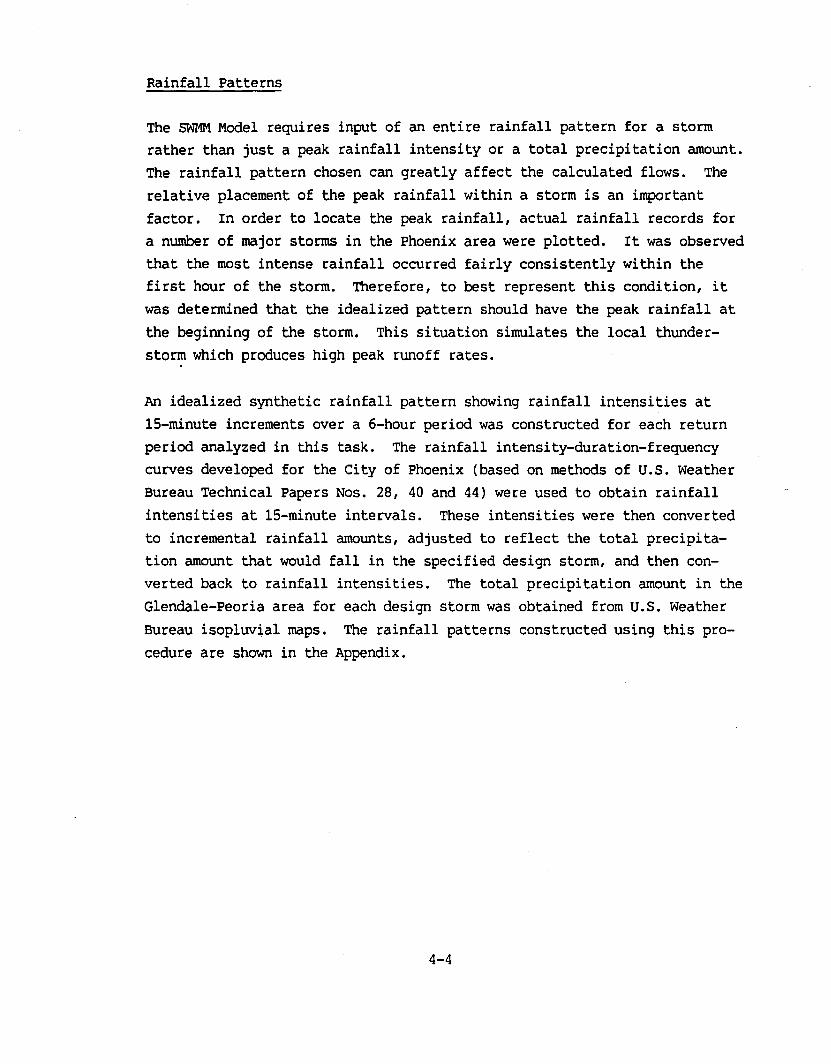
rather than just a peak rainfall intensity or a total precipitation amount.The rainfall pattern chosen can greatly affect the calculated flows. Therelative placement of the peak rainfall within a sto~ is an importantfactor. In order to locate the peak rainfall, actual rainfall records fora number of major storms in the Phoenix area were plotted. It was observedthat the most intense rainfall occurred fairly consistently within thefirst hour of the sto~. Therefore, to best represent this condition, itwas determined that the idealized pattern should have the peak rainfall atthe beginning of the sto~. This situation simulates the local thunderstorm which produces high peak runoff rates.
An idealized synthetic rainfall pattern showing rainfall intensities at15-minute increments over a 6-hour period was constructed for each returnperiod analyzed in this task. The rainfall intensity-duration-frequencycurves developed for the City of Phoenix (based on methods of u.s. weatherBureau Technical Papers Nos. 28, 40 and 44) were used to obtain rainfallintensities at 15-minute intervals. These intensities were then convertedto incremental rainfall amounts, adjusted to reflect the total precipitation amount that would fall in the specified design storm, and then converted back to rainfall intensities. The total precipitation amount in theGlendale-Peoria area for each design storm was obtained from u.s. WeatherBureau isopluvial maps. The rainfall patterns constructed using this procedure are shown in the Appendix.
4-4

Section Five
5. ALTERNATIVE STORMWATER PLANS
SWDY AREAS
For the purposes of developing the Glendale-Peoria ADMP facilities, thestudy area was divided into a number of subareas as shown in Figure 1.These subareas and the procedure used for developing the drainage facilities for each area are described below.
South Glendale
This area consists of the area in Glendale generally between Camelback Roadand Northern Avenue. The drainage facilities selected for this area in the"Glendale Storrnwater Management Plan" could not be improved by combiningwith a drainage facility in Peoria. Therefore, the facilities previouslyselected have been included in the Glendale-Peoria ADMP without change.
South Peoria/Glendale
This area consists of the portion of Glendale south of the ACDC that is notincluded in the South Glendale area, and the portion of Peoria east of NewRiver and Skunk Creek. Because of the natural drainage pattern from eastto west in this area, it appeared that combining the Glendale facilities inthis area with Peoria facilities would be advantageous. Therefore, facilities in this area were determined by choosing the best set of combinedfacilities. The process for this selection is described in more detailin this section.
North Glendale
This area consists of the portion of Glendale that is north of the ACDC.Facilities for this area were included from the "Glendale Stormwater
Management Plan" without change.
5-1
North Peoria
This area consists of the area of Peoria that is north of Skunk Creek orwest of New River and north of Sun City. Facilities for this area wereincluded from the "City of Peoria Master Plan of Storm Drainage" withoutchange.
South Peoria West of New River
This area consists of the area of Peoria that is west of New River andsouth of Sun City. Facilities for this area were included from the "Cityof Peoria Master Plan of Storm Drainage" without change.
Sun City
This area consists of the entire area of Sun City which is an unincorporated planned development. Sun City is already almost completelydeveloped, and has an existing self-contained storm drainage system whichdoes not affect any other subareas. There is no detailed information aboutthe design capacity of the drainage system; however, the system has beenhandling the drainage flows within the area. Therefore, no improvementsare recommended for this area, and the existing facilities are included inthis plan for information purposes.
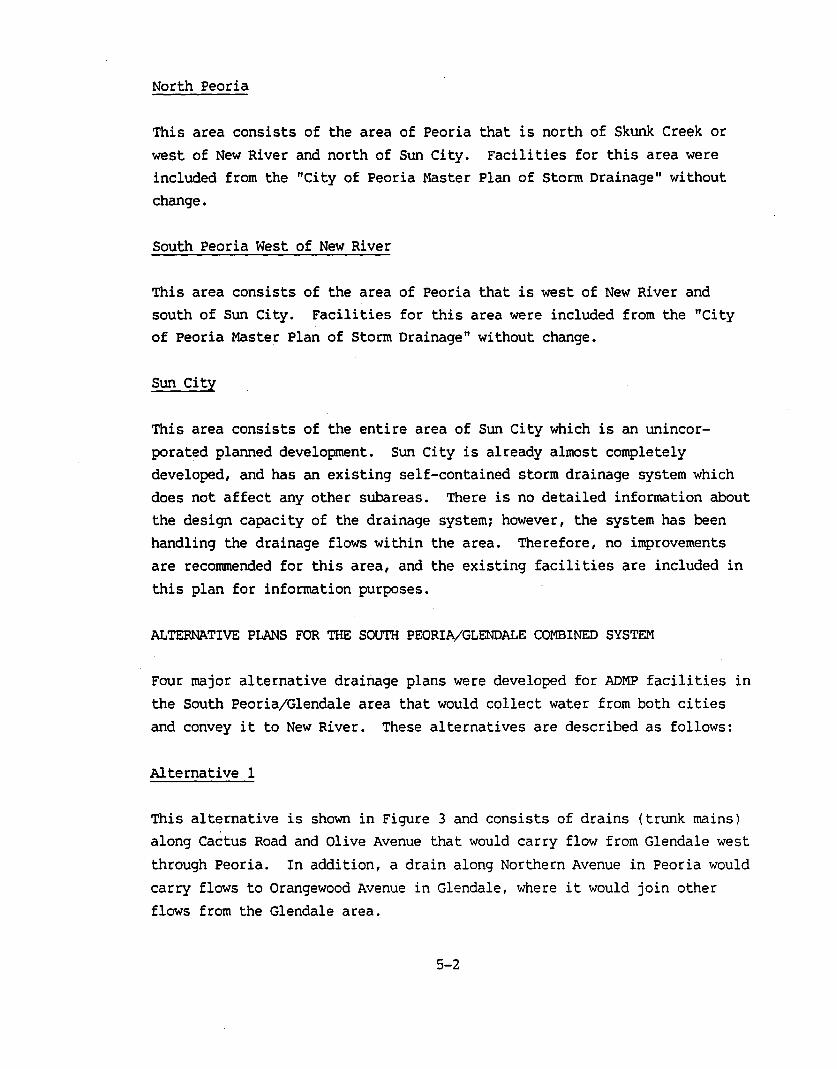
ALTERNATIVE PI..ANS FOR THE SOUTH PEORIA/GLENDALE COMBINED SYSTEM
Four major alternative drainage plans were developed for ADMP facilities inthe South Peoria/Glendale area that would collect water from both citiesand convey it to New River. These alternatives are described as follows:
Alternative 1
This alternative is shown in Figure 3 and consists of drains (trunk mains)along Cactus Road and Olive Avenue that would carry flow from Glendale west
through Peoria. In addition, a drain along Northern Avenue in Peoria wouldcarry flows to Orangewood Avenue in Glendale, where it would join otherflows from the Glendale area.
5-2
)
\.
.I:':""~%;~'; ....\.:":: \~:l"'"
'. '6.--'"':':"',L-.~~""......
" .'
\:11---
", ,
I,., ',; ,," 'f'
\,; ;:.:- .:-,,;
",
.... ,.,;.
,i' ,,:,:
;..
l'lIort"
I. .- .....-Fl::::Fkd
LEGEND
-'I'E~ AD'" FACILITY
FIGURE 3
ALTERNATIVE 1-...
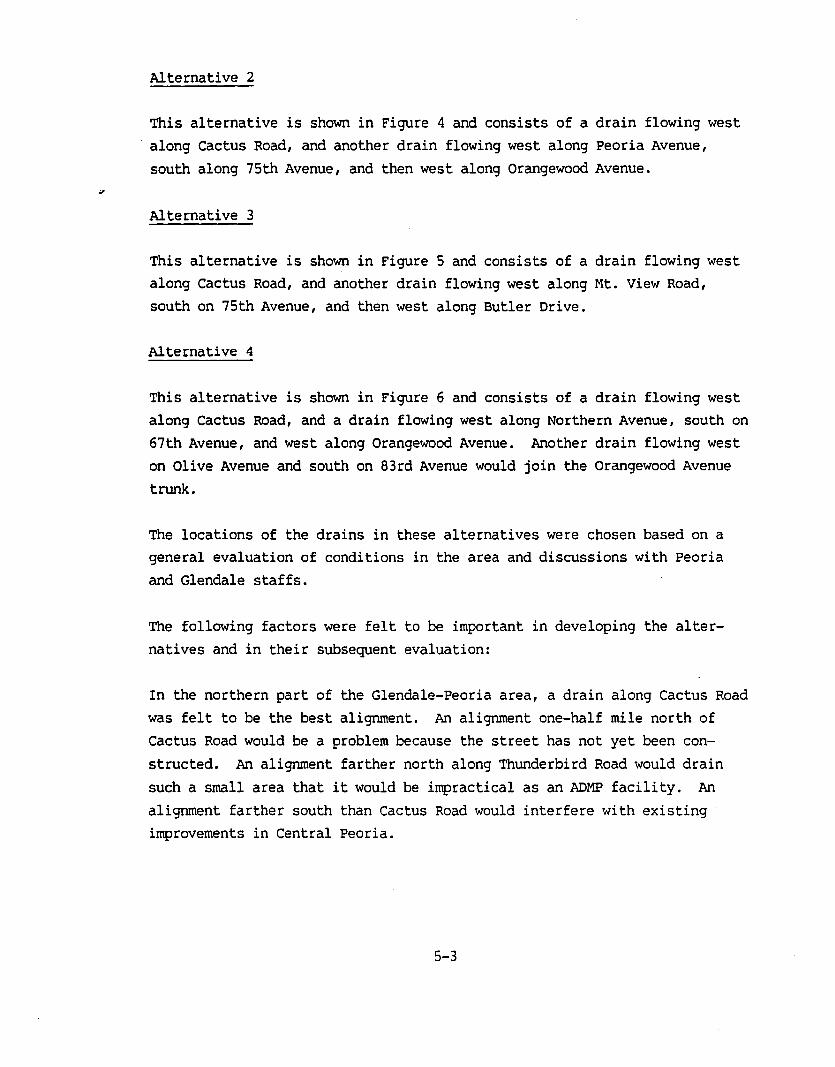
Alternative 2
This alternative is shown in Figure 4 and consists of a drain flowing westalong Cactus Road, and another drain flowing west along Peoria Avenue,south along 75th Avenue, and then west along Orangewood Avenue.
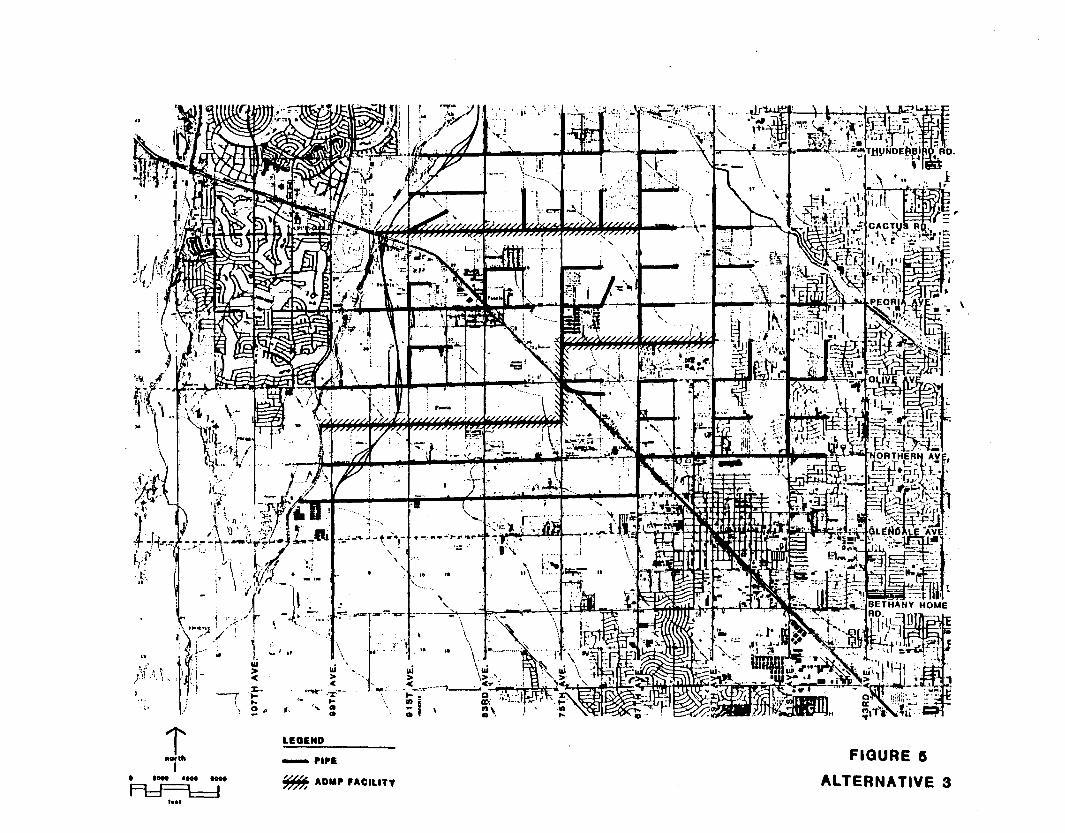
Alternative 3
This alternative is shown in Figure 5 and consists of a drain flowing westalong Cactus Road, and another drain flowing west along Mt. View Road,south on 75th Avenue, and then west along Butler Drive.
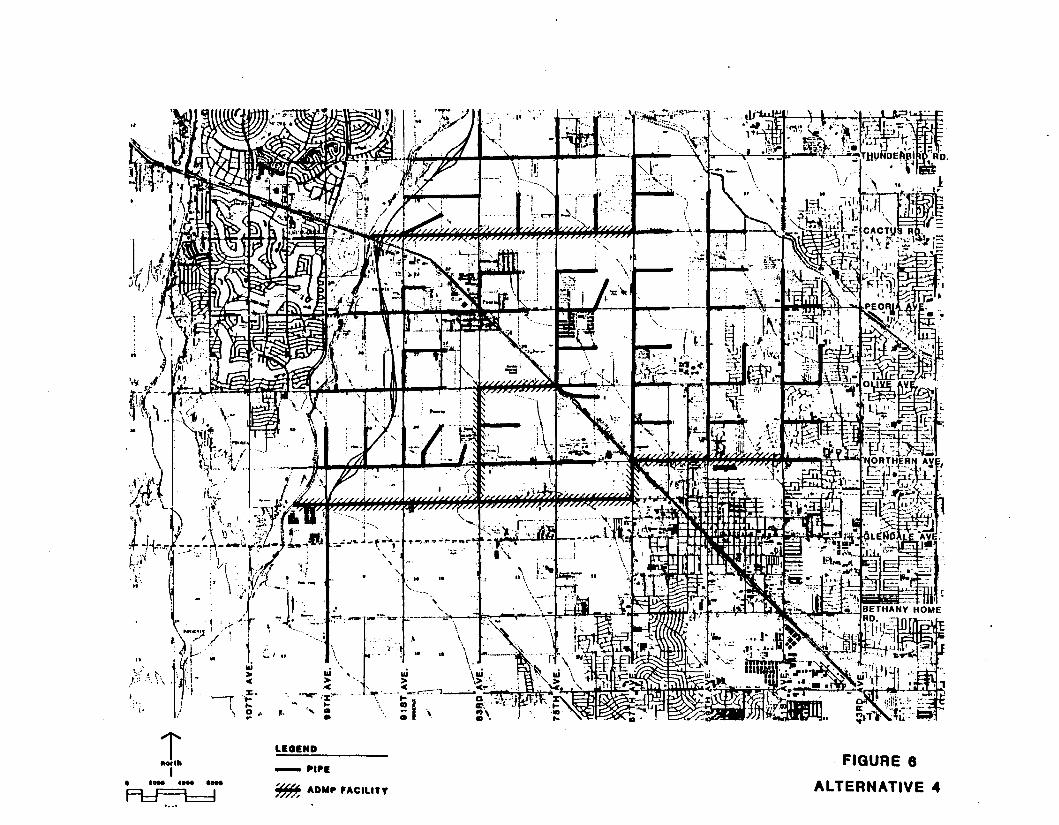
Alternative 4
This alternative is shown in Figure 6 and consists of a drain flowing westalong Cactus Road, and a drain flowing west along Northern Avenue, south on67th Avenue, and west along Orangewood Avenue. Another drain flowing weston Olive Avenue and south on 83rd Avenue would join the Orangewood Avenue
trunk.
The locations of the drains in these alternatives were chosen based on ageneral evaluation of conditions in the area and discussions with Peoriaand Glendale staffs.
The following factors were felt to be important in developing the alter
natives and in their subsequent evaluation:
In the northern part of the Glendale-Peoria area, a drain along Cactus Roadwas felt to be the best alignment. An alignment one-half mile north ofCactus Road would be a problem because the street has not yet been con
structed. An alignment farther north along Thunderbird Road would drain
such a small area that it would be impractical as an ADMP facility. An
alignment farther south than Cactus Road would interfere with existingimprovements in Central Peoria.
5-3
;
..
t_",I
• 1- ........
A::F=l::::d...,
LEGEND
-Pl'E
!aLL,7777; AD'" FACILIty
FIGURE 4
ALTERNATIVE 2
i
..
. 1_._-~
t••,
LEGEND
-'I'E~ ADM' FACILITY
FIGURE 5
ALTERNATIVE 3
t1101111
I. ._._-A=Fl:d
LEGIND
- PIPI
~ ADM' FACILITY
FIGURE 8
ALTERNATIVE ..
In the central part of the Glendale-Peoria area, it was recommended thatthe alignment avoid drains which would pass through the central Peoriaarea, because of the resulting congestion and interference problems withutilities in this area. The use of Olive Avenue was felt to be a desirablealignment because both Peoria and Glendale are planning to make majorimprovements to this street in the near future, and this would tie in wellwith the installation of a storm drain system.
In the southern part of the Glendale-Peoria area, an alignment for a drainalong Northern Avenue was considered but was felt to present a number ofconstruction difficulties due to the number of utilities located in thisstreet. Therefore, an alignment one-half mile south along OrangewoodAvenue was chosen in this area.
The advantages and disadvantages of the alternatives that were consideredare as follows:
Alternative 1
This alternative is well balanced in terms of avoiding the major problemareas and providing a logical path for flows. It has three outlets to NewRiver and would allow construction to proceed more rapidly.
Alternative 2
This alternative avoids the major problem areas but combines most of theflow from Glendale and some of the flow from Peoria into one drain along75th Avenue then along Orangewood Avenue that would have to be very large.This would cause extra construction difficulties, and could require a large
initial expenditure for the first phase of the plan.
Alternative 3
This alternative has the disadvantage of haVing all of the ADMP drainslocated in Peoria. In addition, the drain along Butler Drive is locatedtoo far north to effectively carry runoff from Glendale.
5-4
Alternative 4
This alternative combines most of the flow from Glendale and Peoria into asingle drain that would have to be very large. This could have the samedisadvantages as Alternative 2 of construction difficulties and largerequired initial expenditures.
Because of the disadvantages of Alternative 3, and because it did not seemto provide any distinct advantage over the other alternatives, it wasdropped from further consideration.
5-5

Section Six
6. EVALUATION OF ALTERNATIVES
EVALUATION PROCEDURE
In order to compare and evaluate the alternatives described in Section 5,an evaluation matrix procedure was used. With this procedure, a number ofcriteria important to the project were established. These criteria werethen evaluated to determdne an overall rating for each alternative.
The following criteria were established for evaluation purposes.
1. Capital Cost
An estimate of capital cost was made for each drainage systemconfiguration.
2. COmpatibility and Disruption
An estimate was made of the compatibility of the drainagesystem configuration with other projects and plans. Thefactors considered were disruption of existing roads andutilities during construction of the system.
3. Acceptability to the Public
An assessment was made of how the public would react to eachdrainage system configuration.
4. Environmental Factors
The relative impact that implementation of the drainagesystem configuration would have on the quantity and qualityof water in the receiving channel, as well as the effects onwildlife, aquatic life, and vegetation, were evaluated.
5. COmpatibility with Major Street projects Scheduled forConstruction ouring Next 5 Years .
An assessment was made of the compatibility of the proposeddrainage system with planned major street improvements tominimize construction costs and public inconvenience.
6. Direct OUtlets to New River
This criterion evaluated the ability of each alternativ~ toprovide an adequate major drain system to handle ADMP flowsand meet each City's individual needs.
6-1
8.
7. Effective Use of Detention Basins
An assessment was made of the use of detention basins in thedrainage system configuration to reduce required pipe sizesdownstream of the basins, and the availability of theCity-owned or vacant land for construction of the basins.
Compatibility with Outer Loop Freeway
The impact of the Outer Loop Freeway on the alternatives wasevaluated in terms of the effect on pipe and channel alignments, compatibility with the ADOT drainage system, andeffective functioning of the regional drainage system.
9. Benefits to Glendale Versus Benefits to Peoria
An assessment was made of the ability of each alternative to"effectively handle each City's individual drainage needscompared to implementation of a completely separate systemfor each city.
10. Potential for Staged Construction
Each alternative was assessed to determine its potential fora phased implementation of the proposed drainage system thatwould allow the system to be constructed in reasonable,well-defined segments to meet immediate drainage needs whileallowing implementation of the remaining portions to bespread over a number of years.
The evaluation of each criterion, as it applied to the various drainagesystem configurations, was done on the basis of a positive, negative, orneutral rating. Positive (+) indicates that the alternative would have afavorable (least negative) impact upon the element. Negative (-) indicatesthat the alternative would have an unfavorable (most negative) impact upon
the element, and neutral (0) indicates that the alternative would notsignificantly affect the element. This rating was intended to evaluateeach project only in relation to the other alternative projects. Therating factor is not intended to have a meaning in relation to projects inother locations.
The cost of Alternatives 1, 2, and 4 were determined by using the SWMM
model to estimate the pipe sizes and detention basin sizes required tohandle the storm flow.
6-2
Alternative detention basin sites and sizes were considered in the SWMManalysis. Basin sites were chosen based on areas that are presently vacantor devoted to open space uses such as parks or recreation areas. Sites andthe maximum amount of space that could be devoted to detention at each sitewere confirmed with City staff.
Because of the many different combinations of pipe sizes and detentionbasin sizes and locations, it was not possible to evaluate all combinationsand determine an optimal set of facilities for each alternative. However,based on a number of simulations for each alternative, it is believed thatthe results obtained were approaching an optimum solution. In general, itwas found that increasing the volume of detention storage available woulddecrease the total construction cost of the storm drainage facilities.
The cost of the ADMP facilities was compared with the sum of the costs forthe individual Glendale and Peoria systems in order to determine if thecombined system would have any cost advantage over the individual systems.
EVALUATION RESULTS
The results of the cost analysis showed that the cost of each of thecombined alternatives would be about $2.5 million less than the sum ofseparate systems for both Peoria and Glendale.
In addition, it appears that Alternative 1 would be the lowest cost option,although all three alternatives were very close in cost.
Table 3 shows a surranary of the estimated costs.
The results of the evaluation procedure for the three drainage systemconfigurations (Alternatives 1, 2 and 4) are presented in Table 4.Alternative 1 received an overall positive rating, while the other twoalternatives received an overall neutral rating. Therefore, Alternative 1
was chosen as the preferred alternative.
6-3
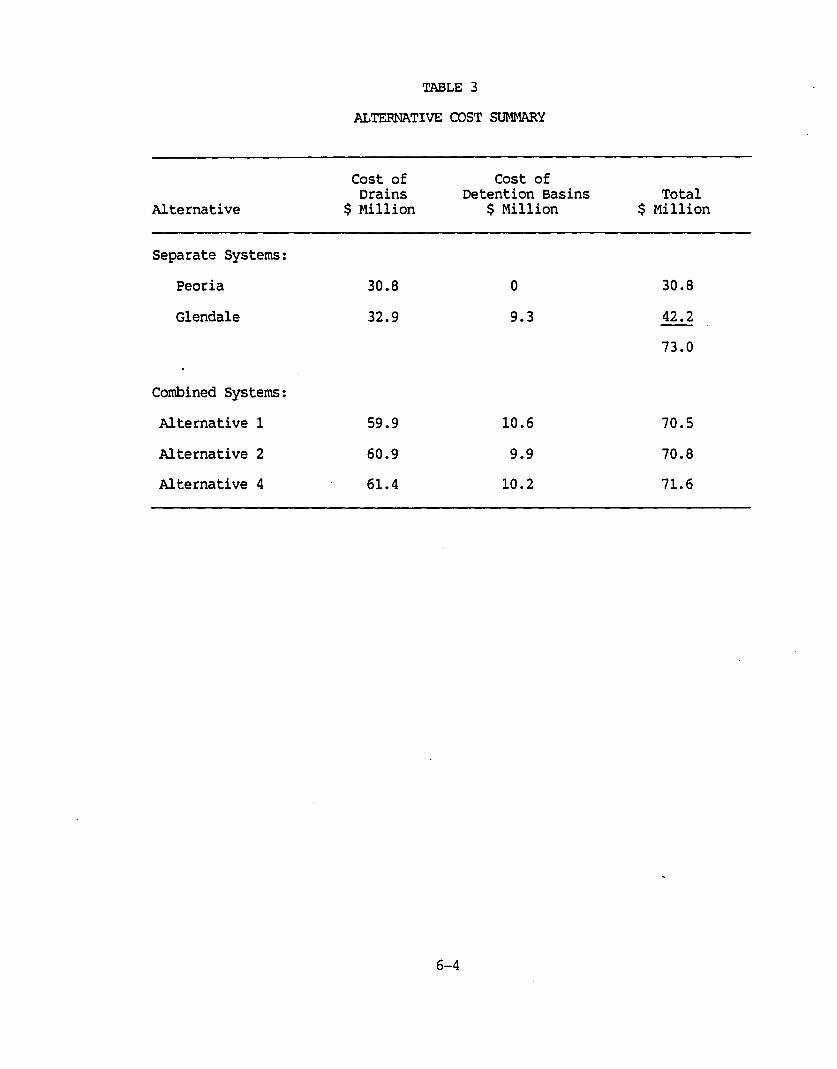
TABLE 3
ALTERNATIVE COST SUMMARY
Cost of Cost ofDrains Detention Basins Total
Alternative $ Million $ Million $ Million
Separate Systems:
Peoria 30.8 0 30.8
Glendale 32.9 9.3 42.2
73.0
Combined Systems:
Alternative 1 59.9 10.6 70.5
Alternative 2 60.9 9.9 70.8
Alternative 4 61.4 10.2 71.6
6-4
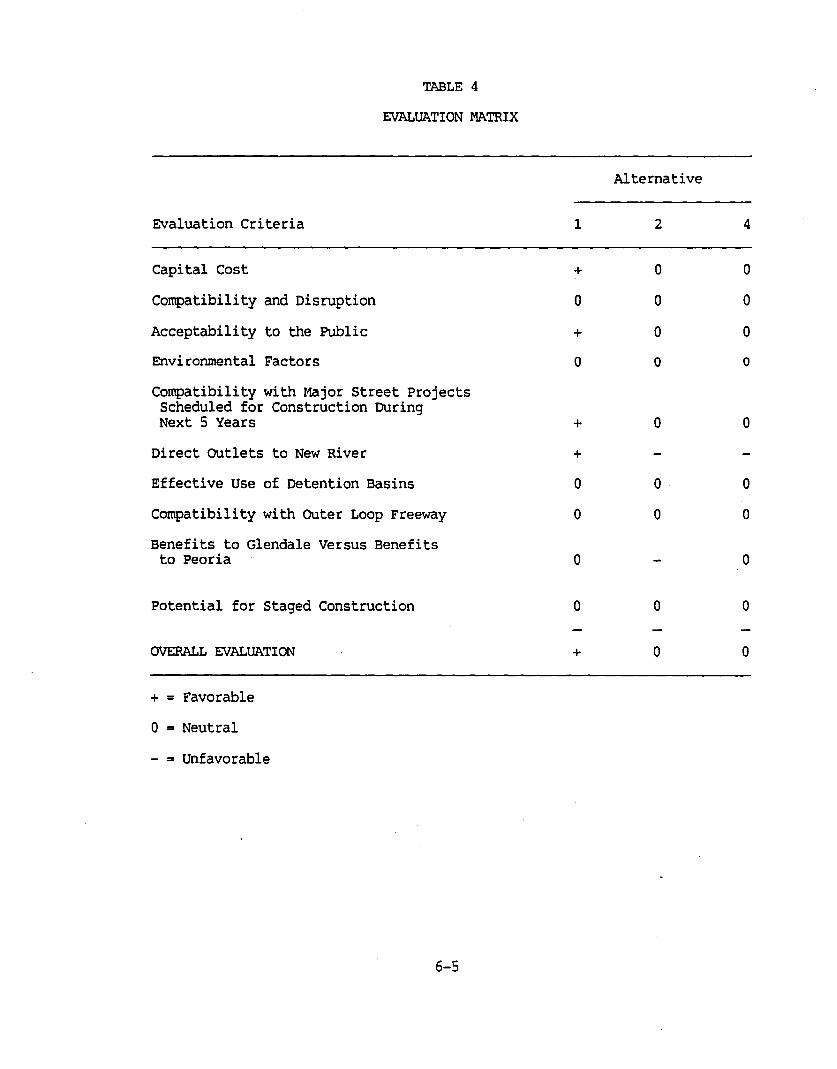
TABLE 4
EVALUATION MATRIX
Alternative
Evaluation Criteria 1 2 4
Capital Cost + 0 0
Compatibility and Disruption 0 0 0
Acceptability to the Public + 0 0
Environmental Factors 0 0 0
Compatibility with Major Street projectsScheduled for Construction DuringNext 5 Years + 0 a
Direct OUtlets to New River +
Effective Use of Detention Basins a o· 0
Compatibility with outer Loop Freeway 0 a aBenefits to Glendale Versus Benefitsto Peoria a a
Potential for Staged Construction a a a
OVERALL EVALUATION + a a
+ = Favorable
a = Neutral
- = Unfavorable
6-5
Section Seven
7. DESIGN CRITERIA AND DESIGN OBJECTIVES
INTRODUCTION
In order to ensure that the Glendale-Peoria ADMP facilities will providethe desired protection for the communities, it is necessary to clearlydefine the design objectives to be met and the design criteria to be used.This will ensure that
All parts of the drainage facilities will be compatible withother parts;
The facilities will carry the desired flows;
They will not interfere with other services in the community;and
They will have a normal service life.
Unless otherwise noted, it is expected that the criteria and objectivesestablished for this study area would be compatible with the DrainagePolicies and Standards currently under development by Maricopa County. Theitems discussed in the following sections are intended to supplement theMaricopa County general criteria and cover conditions special to theGlendale-Peoria study area.
DESIGN OBJECTIVES
The objectives of the stormwater drainage system for the Glendale-Peoriastudy area will be to safely store and convey the runoff during the la-yearstorm without causing flood damage or inconvenience. In addition, the flowduring the lOa-year storm in excess of the design capacity should be carried along streets and other pathways without causing damage to structures.
The major storm drainage conveyance facilities will be planned ultimatelyto be an underground system. In some cases, an open channel or othertemporary facility can be installed where existing land use cannot justifythe immediate cost of an underground pipe system. However, the temporary
7-1
facility should be compatible with the eventual installation of an underground pipe system. If an interim channel is in place prior to development, the developers may be required to pay for the pipe installation aspart of their street and other improvements.
DESIGN CRITERIA
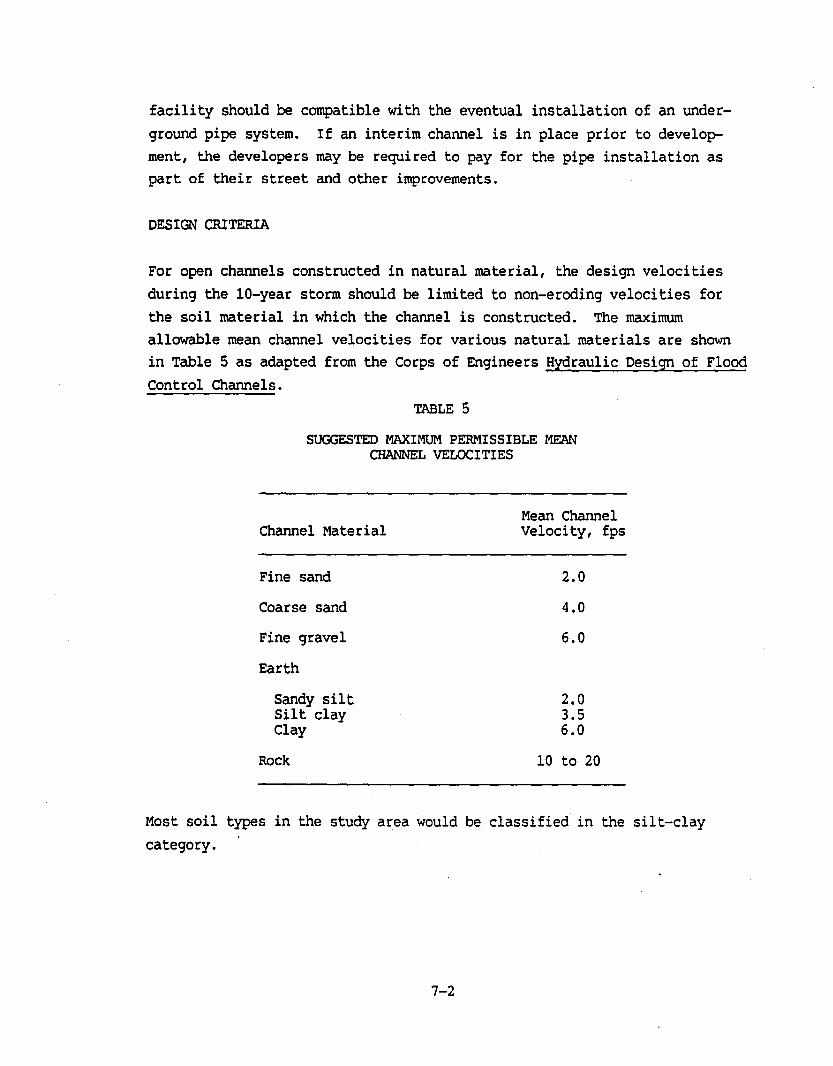
For open channels constructed in natural material, the design velocitiesduring the 10-year storm should be limited to non-eroding velocities forthe soil material in which the channel is constructed. The maximumallowable mean channel velocities for various natural materials are shownin Table 5 as adapted from the Corps of Engineers HydraUlic Design of FloodControl Channels.
TABLE 5
SUGGESTED MAXIMUM PERMISSIBLE MEANCHANNEL VELOCITIES
Channel Material
Fine sand
Coarse sand
Fine gravel
Earth
sandy siltSilt clayClay
Rock
Mean ChannelVelocity, fps
2.0
4.0
6.0
2.03.56.0
10 to 20
Most soil types in the study area would be classified in the silt-claycategory.
7-2
If design velocities exceed the allowable non-eroding velocity, erosionprotection should be provided along the sides and invert of the channel, ordrop structures should be provided to reduce channel velocities. If dropstructures are used, they should be located wherever possible at planned
~
road crossing structures. The vertical drop at each structure should notexceed one half of the normal design flow depth in the channel. Based onground slopes in the study area, the distance between successive drop structures should not exceed 1/4 mile. The design of the drop structure shouldprovide sufficient measures for dissipation of energy at the structure.Channel areas just upstream and downstream of drop structures should beprovided with erosion protection measures consistent with the velocities tobe expected in these areas.
The radius of curved sections of channels as measured at the channelcenterline should be at least three times the top width of the channel. Atcurved sections, the superelevation of the design water surface should beaccounted for in determining the required height of the channel.
Where major channels join, they should enter as nearly parallel to eachother as possible.
Although conveyance facilities in the recommended plan are indicated aspipes, for sizes larger than 7 to 8 feet in diameter, box culverts ofequivalent capacity will probably be less costly to construct. Pipe sizeswill be chosen so that the pipes flow full or nearly full under design flowconditions. In certain cases,' pipes can flow under pressure if thehydraulic grade line at the adjacent inlets is 0.5 feet or more below thegutter inlet. Where there are no stormwater inlets, the entrance to sidestreets should be slightly humped so that stormwater flowing in gutters onmile and one-half mile streets will not enter the side streets.
In preparing this plan, it was assumed that the current on-site retentionregulations imposed on new development would be continued and facilitieswere sized accordingly. If basins for on-site retention are allowed todrain into the system, stormwater should be held a minimum of two hours orthe basin outlet should have a low capacity so that peak flows are notaffected.
7-3
The drainage system configuration outlined in this plan makes use of detention basins to allow further reductions in pipe sizes. Design criteria fordetention basins include:
Maximum water depth of 3 feet.
Maximum embankment height around the basin of 2 feet.
Basin should have an uncontrolled overpour spillway to keepstormwater from overtopping the banks. The top of theembankment should be I foot above the la-year maximum watersurface elevation.
A surface route for the lOa-year flood flow through and downstream from the basin should be provided, so that no morethan nuisance damage to adjacent and downstream facilitiescan occur.
outlets should be provided to release incoming flows to downstream facilities at retarded rates, but not greater than thecapacity of the downstream facilities.
Provision should be made for storm flows in excess of the la-year designcapacity of the storm drainage system up to the lOa-year storm flow.Wherever possible, the excess flow should be confined to the street orareas immediately adjacent to the street. However, major roads shouldmaintain one flood-free lane in each direction. Excess flow should bedirected along routes that have surface outlets to watercourses, ratherthan to areas that will cause water to pond and flood structures. Thegeneral pattern of flows should maintain the natural runoff pattern, ratherthan be re-directed to other drainage basins. Flooding of structuresshould be avoided, and access to community facilities such as firestations, schools, and hospitals should be maintained during the lOa-yearstorm.
7-4

Section Eight
8. PREFERRED ALTEBNATIVE
GENERAL CHARACI'ERISTICS OF PREFERRED ALTEBNATIVE
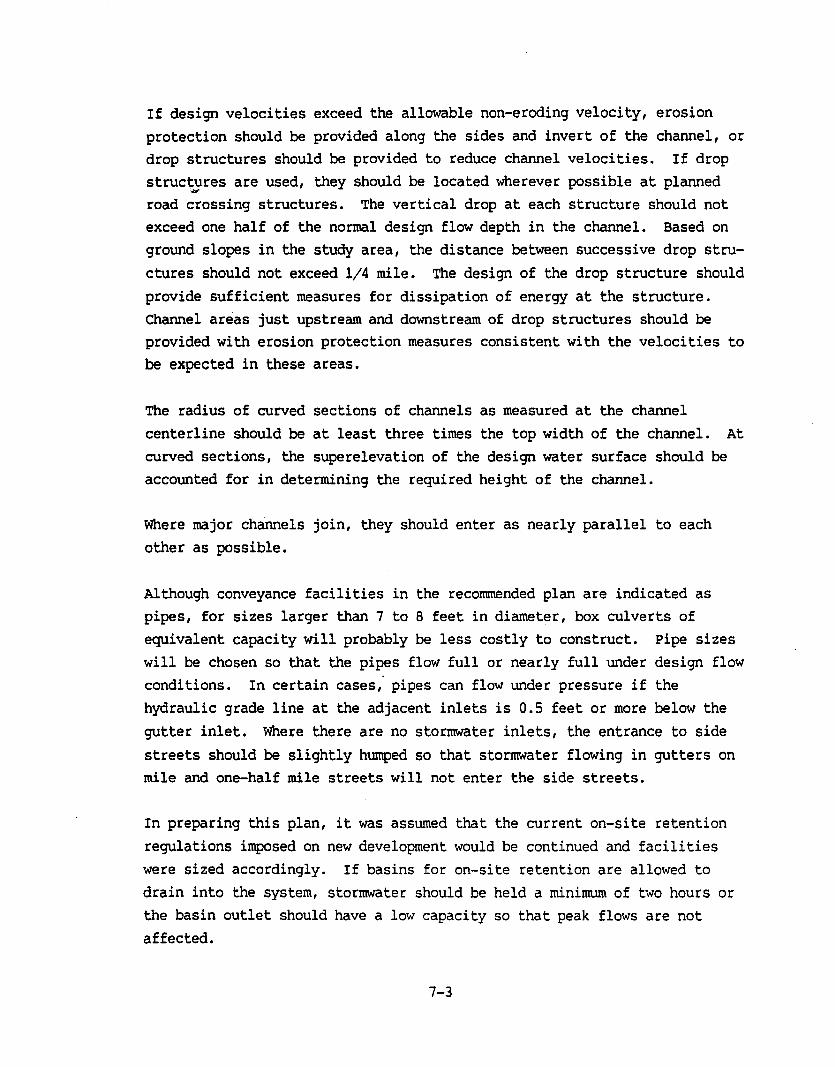
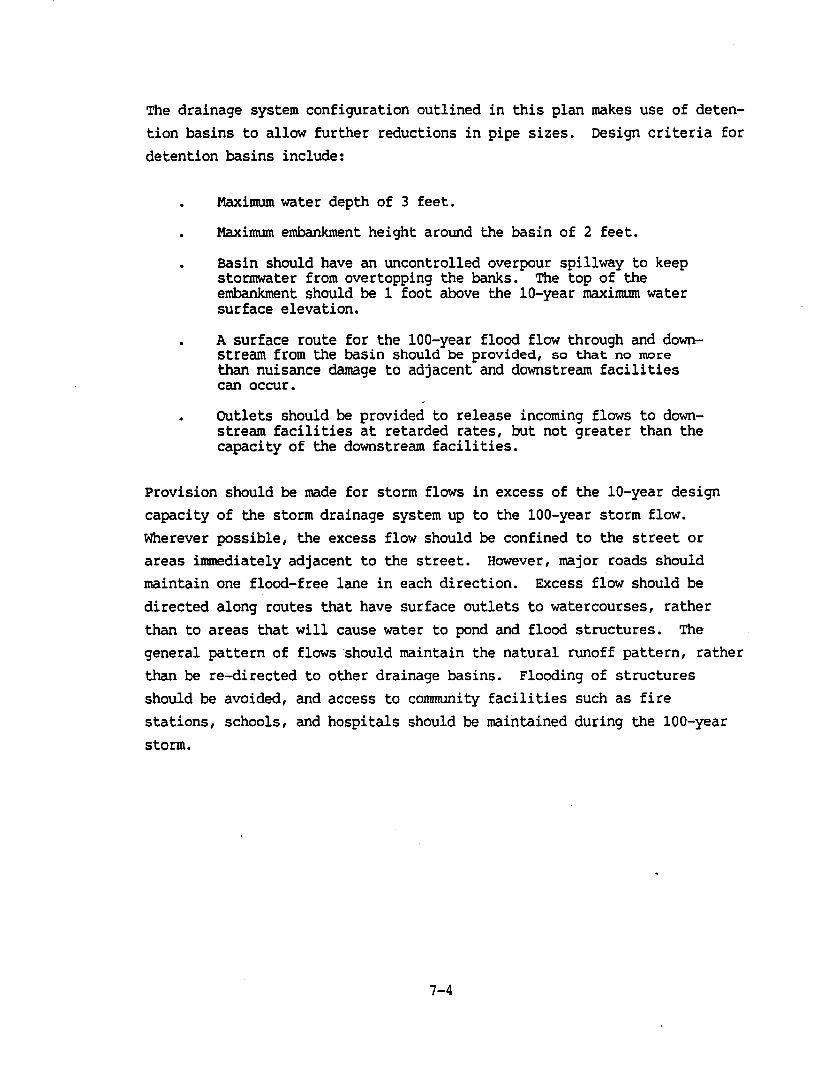
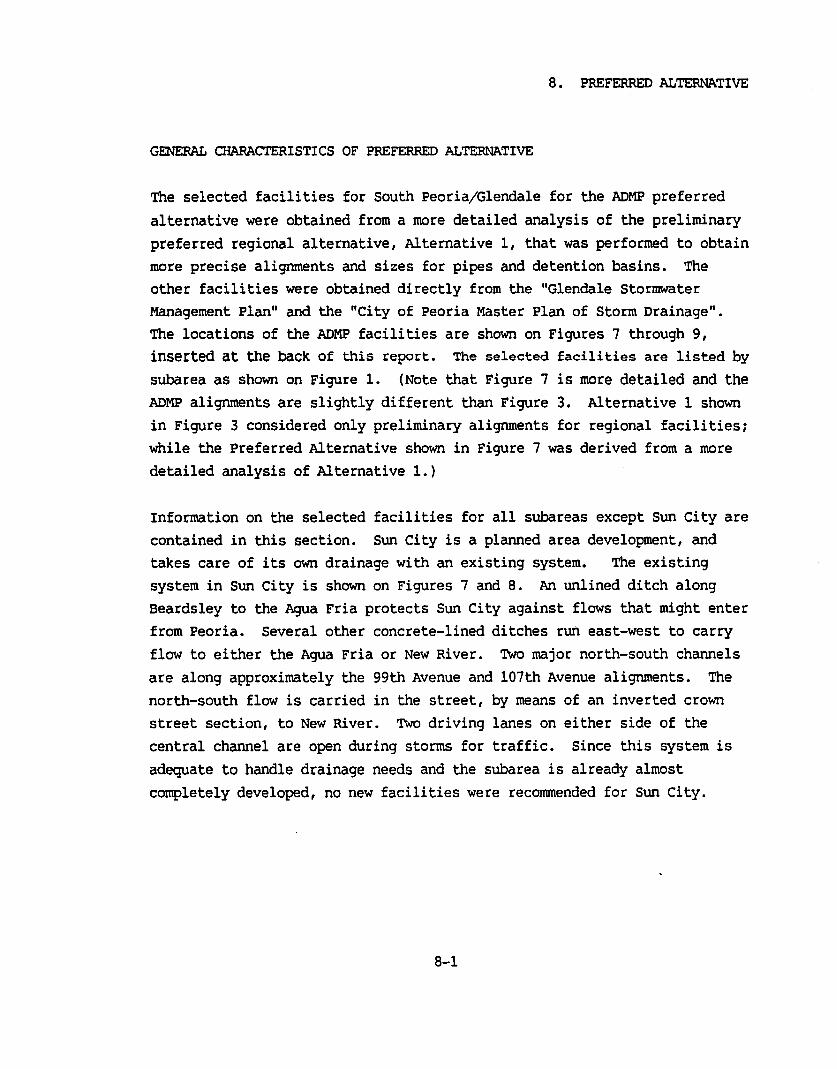
The selected facilities for South Peoria/Glendale for the ADMP preferredalternative were obtained from a more detailed analysis of the preliminarypreferred regional alternative, Alternative 1, that was performed to obtainmore precise alignments and sizes for pipes and detention basins. Theother facilities were obtained directly from the "Glendale StormwaterManagement Plan" and the "City of Peoria Master Plan of Storm Drainage".The locations of the ADMP facilities are shown on Figures 7 through 9,inserted at the back of this report. The selected facilities are listed by
subarea as shown on Figure 1. (Note that Figure 7 is more detailed and theADMP alignments are slightly different than Figure 3. Alternative 1 shownin Figure 3 considered only preliminary alignments for regional facilities;while the Preferred Alternative shown in Figure 7 was derived from a moredetailed analysis of Alternative 1.)
Information on the selected facilities for all subareas except Sun City arecontained in this section. Sun City is a planned area development, andtakes care of its own drainage with an existing system. The existingsystem in Sun City is shown on Figures 7 and 8. An unlined ditch alongBeardsley to the Agua Fria protects Sun City against flows that might enterfrom Peoria. Several other concrete-lined ditches run east-west to carryflow to either the Agua Fria or New River. 'IWo major north-south channelsare along approximately the 99th Avenue and 107th Avenue alignments. Thenorth-south flow is carried in the street, by means of an inverted crownstreet section, to New River. 'IWo driving lanes on either side of thecentral channel are open during storms for traffic. Since this system isadequate to handle drainage needs and the subarea is already almostcompletely developed, no new facilities were recommended for Sun City.
8-1
Recommended Facility Sizes
Pipes
The details of the pipe sizes required to carry the applicable design stormflows (as set forth in Chapter 4) under future land use conditions, as wellas their length, approximate slope, and estimated design flow are shown inTables 6 through 10. These tables also show the areas where utilitycrossings, special factors, and difficult areas of construction may need tobe considered for administration and implementation of the storm drainagesystem.
Channels
There are two different types of channels: permanent and interim.Peomanent channels are those in North Peoria as shown in Table 9. Interimchannels or ditches are those included as a temporary measure to provide anoutlet for runoff from upstream improvements before pipes are installed.
In Glendale, interim ditches along Camelback Road, Grand Canal and BethanyHome Road would provide an outlet for runoff from the more developed areato the east. Interim ditches in Peoria are planned for the area betweenGreenway Road and Deer Valley Drive. It would not be necessary to construct the interim ditches to meet the ultimate required capacity, sincethey would not be serving the entire developed contributing area. Theinterim capacity should be evaluated on a case-by-case basis as interim
ditches are constructed. The interim ditches would be replaced by therecommended pipe improvements as future conditions warranted.
Another goal behind the construction of interim ditches is to have adrainage channel in place prior to development of the respective areas sothat developers will pay for pipe installation as road and other improvements are constructed in their developments ..
,
8-2
Land ACquisition Requirements
The land acquisition requirements for detention basins and for pipes thatwill not be located in existing public rights-of-way are shown for eachsubarea in Tables 11 through 15. Basin locations are generalized and canbe within 1/4 mile of the specified location.
critical Conflicts
Of the potential conflicts between proposed storm drain pipes and otherutilities and facilities shown in Tables 6 through 10, most can be satisfactorily resolved during the design process by carefully choosing thestorm drain profile to cross under or over utilities, by altering the
drainage structure cross-section to a low profile shape, or by reroutingutility lines.
Some conflicts could prove to be more difficult to resolve, and additionalplanning may be required to resolve them. Critical conflicts are definedas those that occur where proposed drains cross 48-inch or larger existingutility lines. Critical conflicts also occur where the proposed drainscross utility lines smaller than 48-inch at the same location as a railroador freeway crossing. Pipes that would have to cross the railroad tracksalong Grand Avenue would require special construction methods to installwithout interrupting rail traffic. Construction access areas that will notinterfere with road or railroad traffic will have to be identified. Pipesthat will cross the path of the proposed outer Loop Freeway could also be acritical conflict and should be planned in advance. Planning and construction of these crossings should be coordinated with the construction of thefreeway.
The areas shown in Table 16 were identified as locations where conflictsmay exist that will require more than the normal design and planningprocedures.
All conveyance facilities in the preferred alternative are indicated aspipes. However, for pipes larger than 7 to 8 feet in diameter, boxculverts of equivalent capacity will probably be less costly to construct.
8-3
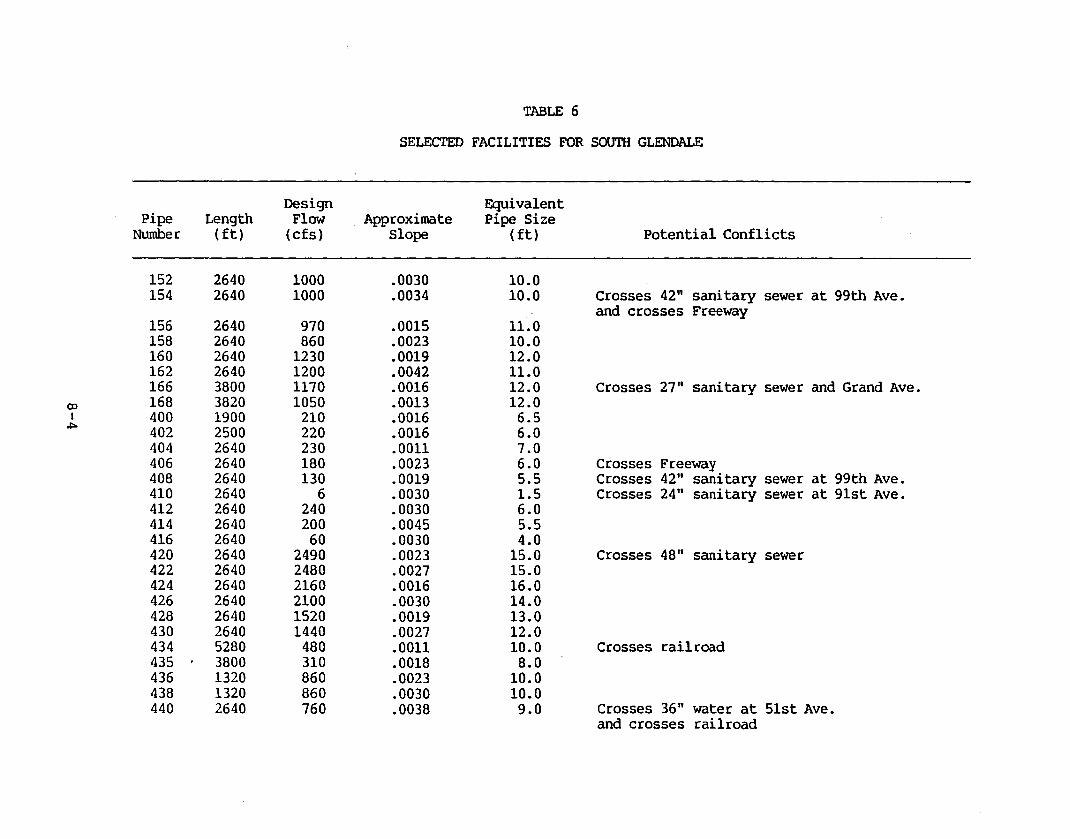
TABLE 6
SELECTED FACILITIES FOR SOUTH GLENDALE
Design EquivalentPipe Length Flow Approximate Pipe Size
Number (ft) (cfs) Slope (ft) Potential Conflicts
152 2640 1000 .0030 10.0154 2640 1000 .0034 10.0 Crosses 42 11 sanitary sewer at 99th Ave.
and crosses Freeway156 2640 970 .0015 11.0158 2640 860 .0023 10.0160 2640 1230 .0019 12.0162 2640 1200 .0042 11.0166 3800 1170 .0016 12.0 Crosses 27 11 sanitary sewer and Grand Ave.
CD 168 3820 1050 .0013 12.0I 400 1900 210 .0016 6.5~ 402 2500 220 .0016 6.0
404 2640 230 .0011 7.0406 2640 180 .0023 6.0 Crosses Freeway408 2640 130 .0019 5.5 Crosses 4211 sanitary sewer at 99th Ave.410 2640 6 .0030 1.5 Crosses 24 11 sanitary sewer at 91st Ave.412 2640 240 .0030 6.0414 2640 200 .0045 5.5416 2640 60 .0030 4.0420 2640 2490 .0023 15.0 Crosses 48 11 sanitary sewer422 2640 2480 .0027 15.0424 2640 2160 .0016 16.0426 2640 2100 .0030 14.0428 2640 1520 .0019 13.0430 2640 1440 .0027 12.0434 5280 480 .0011 10.0 Crosses railroad435 3800 310 .0018 8.0436 1320 860 .0023 10.0438 1320 860 .0030 10.0440 2640 760 .0038 9.0 Crosses 36 11 water at 51st Ave.
and crosses railroad
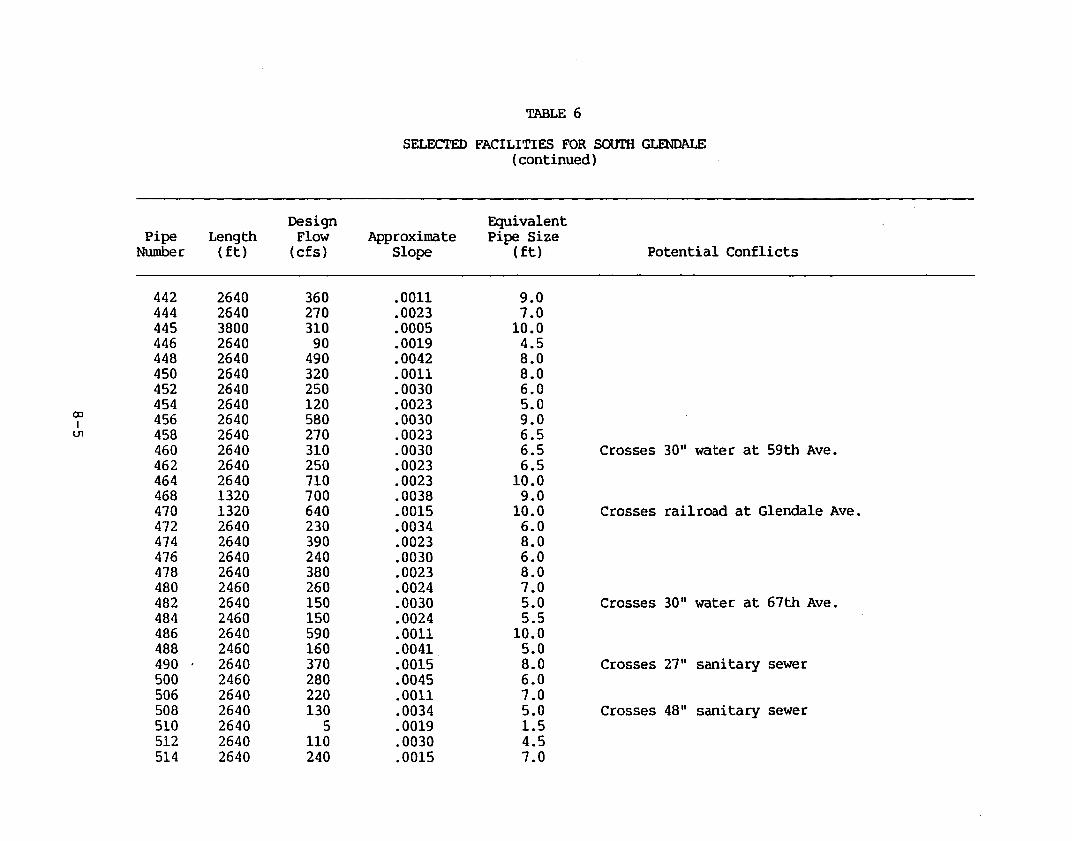
TABLE 6
SELECTED FACILITIES FOR SOUTH GLENDALE(continued)
Design EquivalentPipe Length Flow Approximate Pipe Size
Number (ft) (cfs) Slope (ft) Potential Conflicts
442 2640 360 .0011 9.0444 2640 270 .0023 7.0445 3800 310 .0005 10.0446 2640 90 .0019 4.5448 2640 490 .0042 8.0450 2640 320 .0011 8.0452 2640 250 .0030 6.0454 2640 120 .0023 5.0
00 456 2640 580 .0030 9.0IU1 458 2640 270 .0023 6.5
460 2640 310 .0030 6.5 Crosses 30" water at 59th Ave.462 2640 250 .0023 6.5464 2640 710 .0023 10.0468 1320 700 .0038 9.0470 1320 640 .0015 10.0 Crosses railroad at Glendale Ave.472 2640 230 .0034 6.0474 2640 390 .0023 8.0476 2640 240 .0030 6.0478 2640 380 .0023 8.0480 2460 260 .0024 7.0482 2640 150 .0030 5.0 Crosses 30 11 water at 67th Ave.484 2460 150 .0024 5.5486 2640 590 .0011 10.0488 2460 160 .0041 5.0490 2640 370 .0015 8.0 Crosses 27 11 sanitary sewer500 2460 280 .0045 6.0506 2640 220 .0011 7.0508 2640 130 .0034 5.0 Crosses 48" sanitary sewer510 2640 5 .0019 1.5512 2640 110 .0030 4.5514 2640 240 .0015 7.0
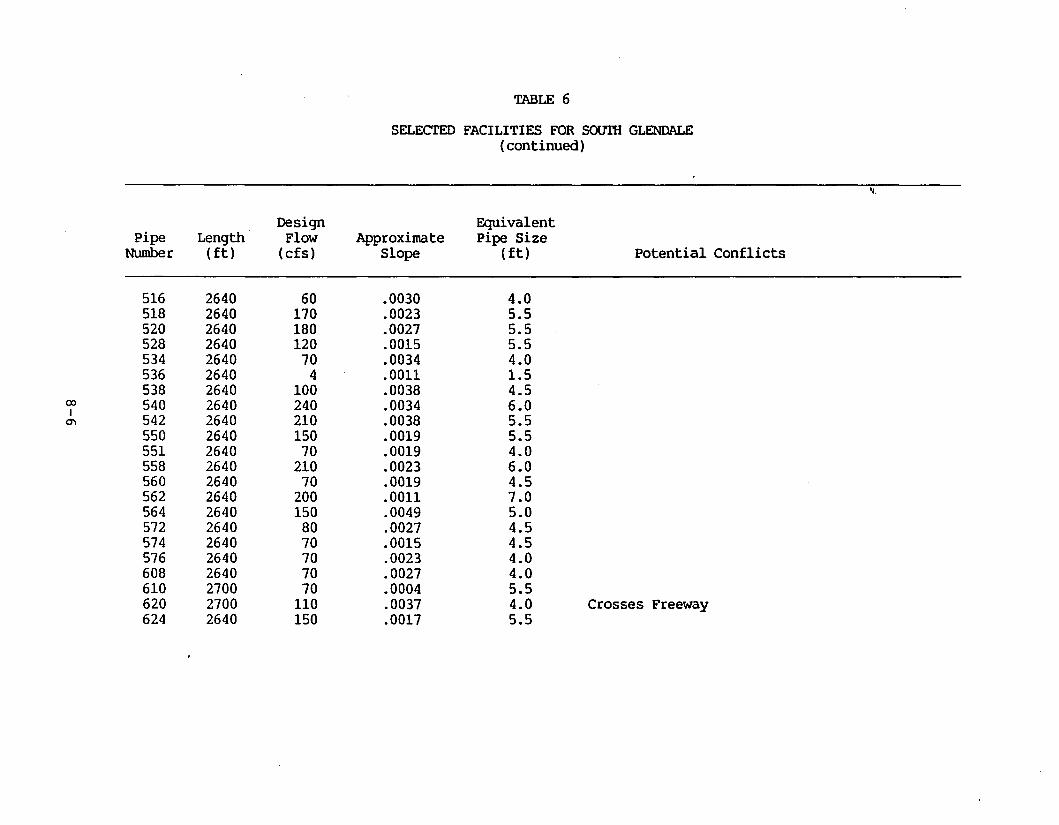
TABLE 6
SELECTED FACILITIES FOR soom GLENDALE(continued)
...
Design EquivalentPipe Length Flow Approximate Pipe Size
Number (ft) (cfs) Slope (ft) Potential Conflicts
516 2640 60 .0030 4.0518 2640 170 .0023 5.5520 2640 180 .0027 5.5528 2640 120 .0015 5.5534 2640 70 .0034 4.0536 2640 4 .0011 1.5538 2640 100 .0038 4.5
00 540 2640 240 .0034 6.0I0'1 542 2640 210 .0038 5.5
550 2640 150 .0019 5.5551 2640 70 .0019 4.0558 2640 210 .0023 6.0560 2640 70 .0019 4.5562 2640 200 .0011 7.0564 2640 150 .0049 5.0572 2640 80 .0027 4.5574 2640 70 .0015 4.5576 2640 70 .0023 4.0608 2640 70 .0027 4.0610 2700 70 .0004 5.5620 2700 110 .0037 4.0 Crosses Freeway624 2640 150 .0017 5.5
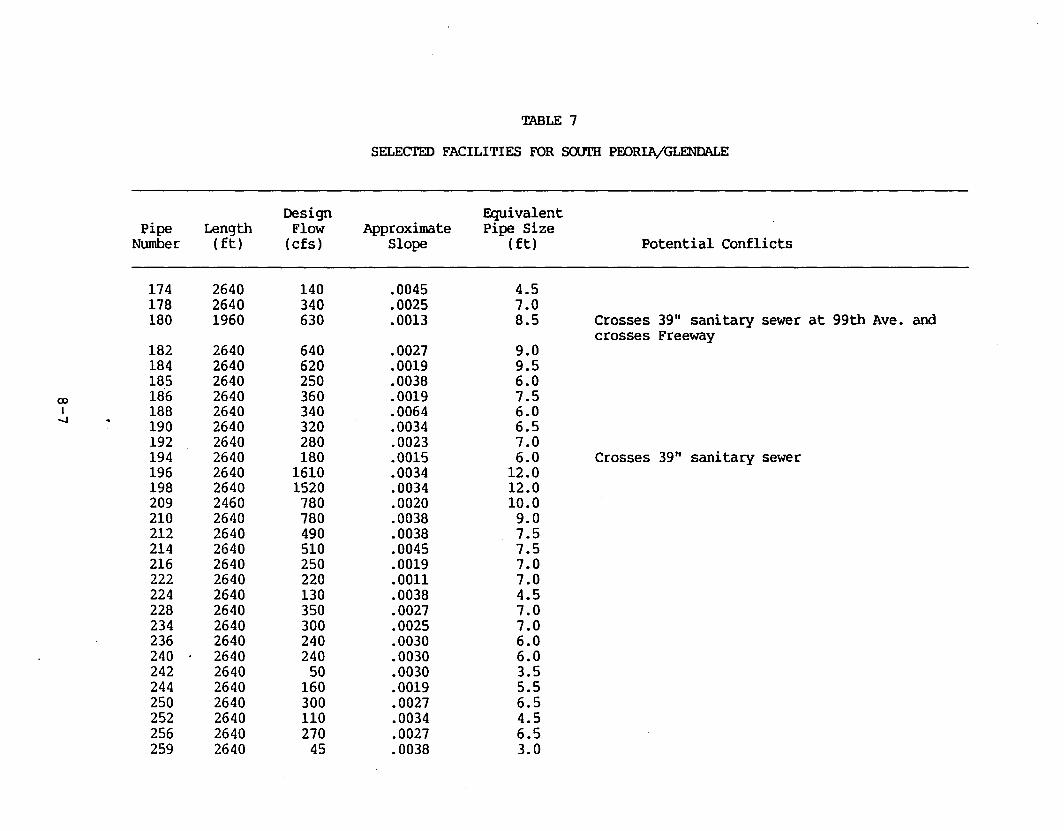
TABLE 7
SELECTED FACILITIES FOR SOUTH PEORIA/GLENDALE
Design EquivalentPipe Length Flow Approximate Pipe Size
Number ( ft) (cfs) Slope (ft) Potential Conflicts
174 2640 140 .0045 4.5178 2640 340 .0025 7.0180 1960 630 .0013 8.5 Crosses 39" sanitary sewer at 99th Ave. and
crosses Freeway182 2640 640 .0027 9.0184 2640 620 .0019 9.5185 2640 250 .0038 6.0
co 186 2640 360 .0019 7.5I 188 2640 340 .0064 6.0
-...I 190 2640 320 .0034 6.5192 2640 280 .0023 7.0194 2640 180 .0015 6.0 Crosses 39" sanitary sewer196 2640 1610 .0034 12.0198 2640 1520 .0034 12.0209 2460 780 .0020 10.0210 2640 780 .0038 9.0212 2640 490 .0038 7.5214 2640 510 .0045 7.5216 2640 250 .0019 7.0222 2640 220 .0011 7.0224 2640 130 .0038 4.5228 2640 350 .0027 7.0234 2640 300 .0025 7.0236 2640 240 .0030 6.0240 . 2640 240 .0030 6.0242 2640 50 .0030 3.5244 2640 160 .0019 5.5250 2640 300 .0027 6.5252 2640 110 .0034 4.5256 2640 270 .0027 6.5259 2640 45 .0038 3.0
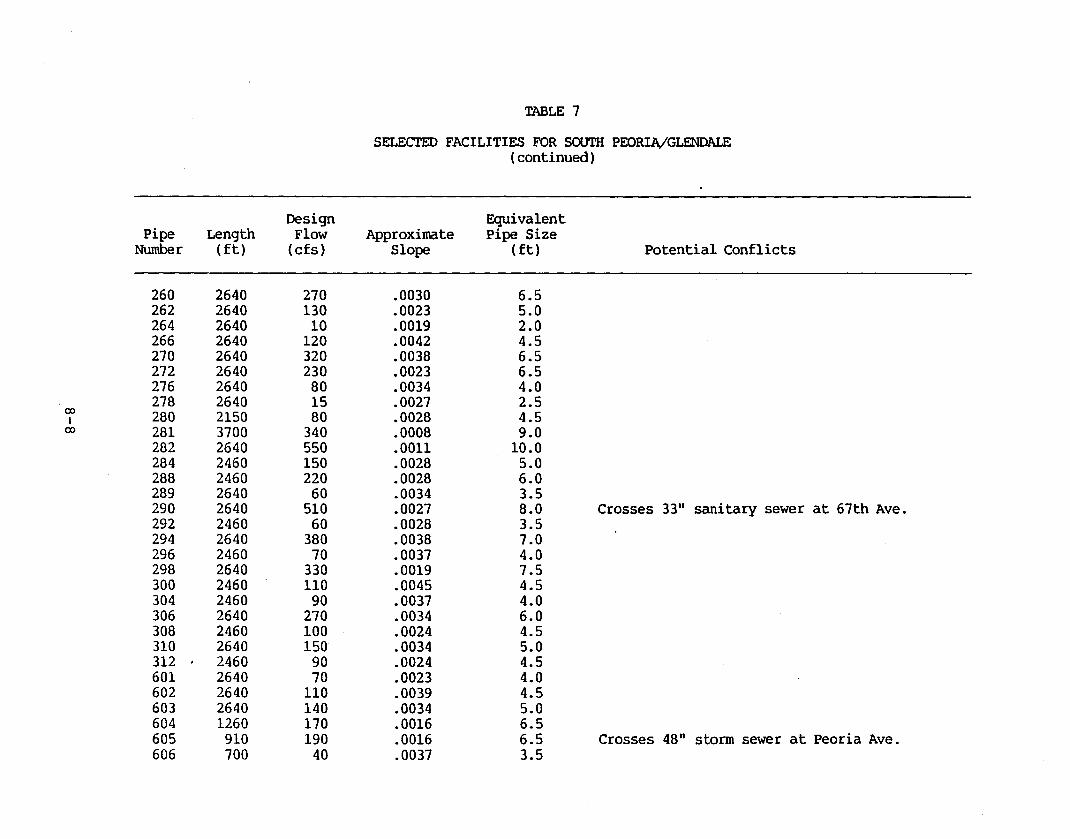
TABLE 7
SELECTED FACILITIES FOR SOUTH PEORIA/GLENDALE(continued)
Design EquivalentPipe Length Flow Approximate Pipe Size
Number (ft) (cfs) Slope (ft) Potential Conflicts
260 2640 270 .0030 6.5262 2640 130 .0023 5.0264 2640 10 .0019 2.0266 2640 120 .0042 4.5270 2640 320 .0038 6.5272 2640 230 .0023 6.5276 2640 80 .0034 4.0278 2640 15 .0027 2.5
(X) 280 2150 80 .0028 4.5I(X) 281 3700 340 .0008 9.0
282 2640 550 .0011 10.0284 2460 150 .0028 5.0288 2460 220 .0028 6.0289 2640 60 .0034 3.5290 2640 510 •0027 8.0 Crosses 33" sanitary sewer at 67th Ave •292 2460 60 .0028 3.5294 2640 380 .0038 7.0296 2460 70 .0037 4.0298 2640 330 .0019 7.5300 2460 110 .0045 4.5304 2460 90 .0037 4.0306 2640 270 .0034 6.0308 2460 100 .0024 4.5310 2640 150 .0034 5.0312 . 2460 90 .0024 4.5601 2640 70 .0023 4.0602 2640 110 .0039 4.5603 2640 140 .0034 5.0604 1260 170 .0016 6.5605 910 190 .0016 6.5 Crosses 48" storm sewer at Peoria Ave.606 700 40 .0037 3.5
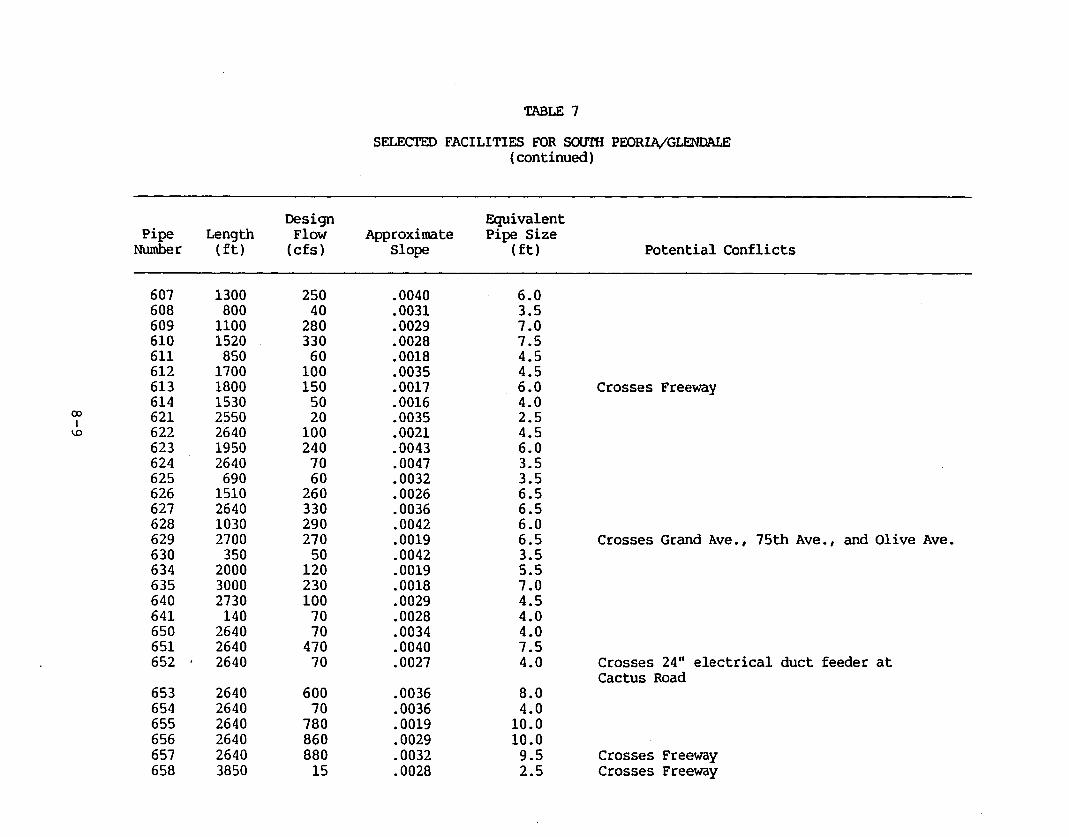
TABLE 7
SELECTED FACILITIES FOR soom PEORIA/GLENDALE(continued)
Design EquivalentPipe Length Flow Approximate Pipe Size
Number (ft) (cfs) Slope (ft) Potential Conflicts
607 1300 250 .0040 6.0608 800 40 .0031 3.5609 1100 280 .0029 7.0610 1520 330 .0028 7.5611 850 60 .0018 4.5612 1700 100 .0035 4.5613 1800 150 .0017 6.0 Crosses Freeway614 1530 50 .0016 4.0
ex> 621 2550 20 .0035 2.5I\0 622 2640 100 .0021 4.5
623 1950 240 .0043 6.0624 2640 70 .0047 3.5625 690 60 .0032 3.5626 1510 260 .0026 6.5627 2640 330 .0036 6.5628 1030 290 .0042 6.0629 2700 270 .0019 6.5 Crosses Grand Ave., 75th Ave., and Olive Ave •630 350 50 .0042 3.5634 2000 120 .0019 5.5635 3000 230 .0018 7.0640 2730 100 .0029 4.5641 140 70 .0028 4.0650 2640 70 .0034 4.0651 2640 470 .0040 7.5652 . 2640 70 .0027 4.0 Crosses 24" electrical duct feeder at
Cactus Road653 2640 600 .0036 8.0654 2640 70 .0036 4.0655 2640 780 .0019 10.0656 2640 860 .0029 10.0657 2640 880 .0032 9.5 Crosses Freeway658 3850 15 .0028 2.5 Crosses Freeway
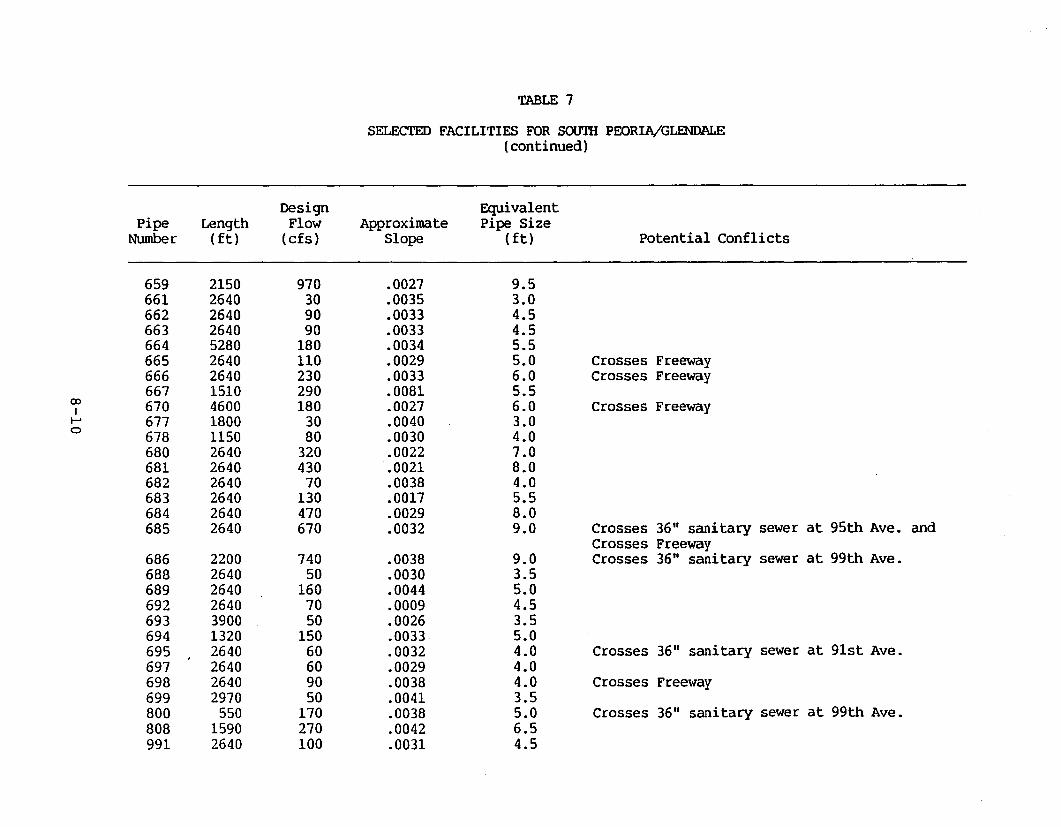
TABLE 7
SELECTED FACILITIES FOR SOUTH PEORIA/GLENDALE(continued)
Design EquivalentPipe Length Flow Approximate Pipe Size
Number (ft) (cfs) Slope (ft) Potential Conflicts
659 2150 970 .0027 9.5661 2640 30 .0035 3.0662 2640 90 .0033 4.5663 2640 90 .0033 4.5664 5280 180 .0034 5.5665 2640 110 .0029 5.0 Crosses Freeway666 2640 230 .0033 6.0 Crosses Freeway667 1510 290 .0081 5.5
ex> 670 4600 180 .0027 6.0 Crosses FreewayII-' 677 1800 30 .0040 3.00 678 1150 80 .0030 4.0
680 2640 320 .0022 7.0681 2640 430 .0021 8.0682 2640 70 .0038 4.0683 2640 130 .0017 5.5684 2640 470 .0029 8.0685 2640 670 .0032 9.0 Crosses 36" sanitary sewer at 95th Ave. and
Crosses Freeway686 2200 740 .0038 9.0 Crosses 36" sanitary sewer at 99th Ave.688 2640 50 .0030 3.5689 2640 160 .0044 5.0692 2640 70 .0009 4.5693 3900 50 .0026 3.5694 1320 150 .0033 5.0695 2640 60 .0032 4.0 Crosses 36" sanitary sewer at 91st Ave.697 2640 60 .0029 4.0698 2640 90 .0038 4.0 Crosses Freeway699 2970 50 .0041 3.5800 550 170 .0038 5.0 Crosses 36" sanitary sewer at 99th Ave.808 1590 270 .0042 6.5991 2640 100 .0031 4.5
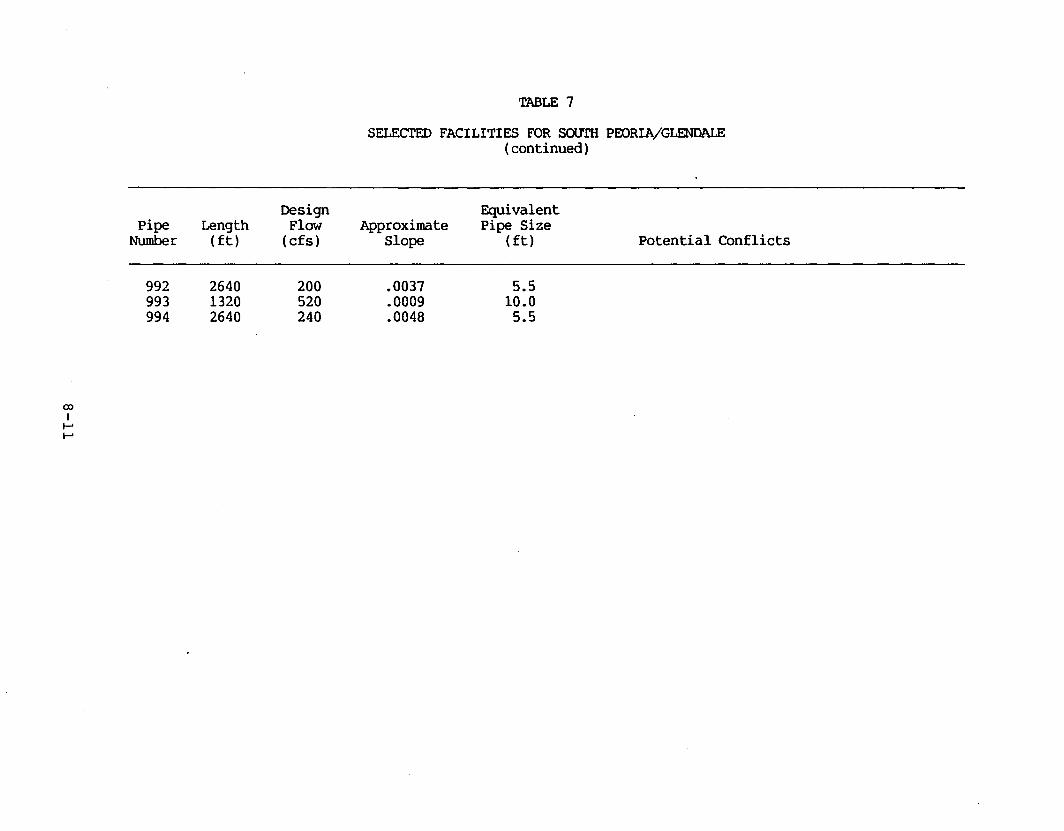
00I
I-'I-'
TABLE 7
SELECTED FACILITIES FOR soum PEORIA/GLENDALE(continued)
Design EquivalentPipe Length Flow Approximate Pipe Size
Number ( ft) (cfs) Slope (ft) Potential Conflicts
992 2640 200 .0037 5.5993 1320 520 .0009 10.0994 2640 240 .0048 5.5
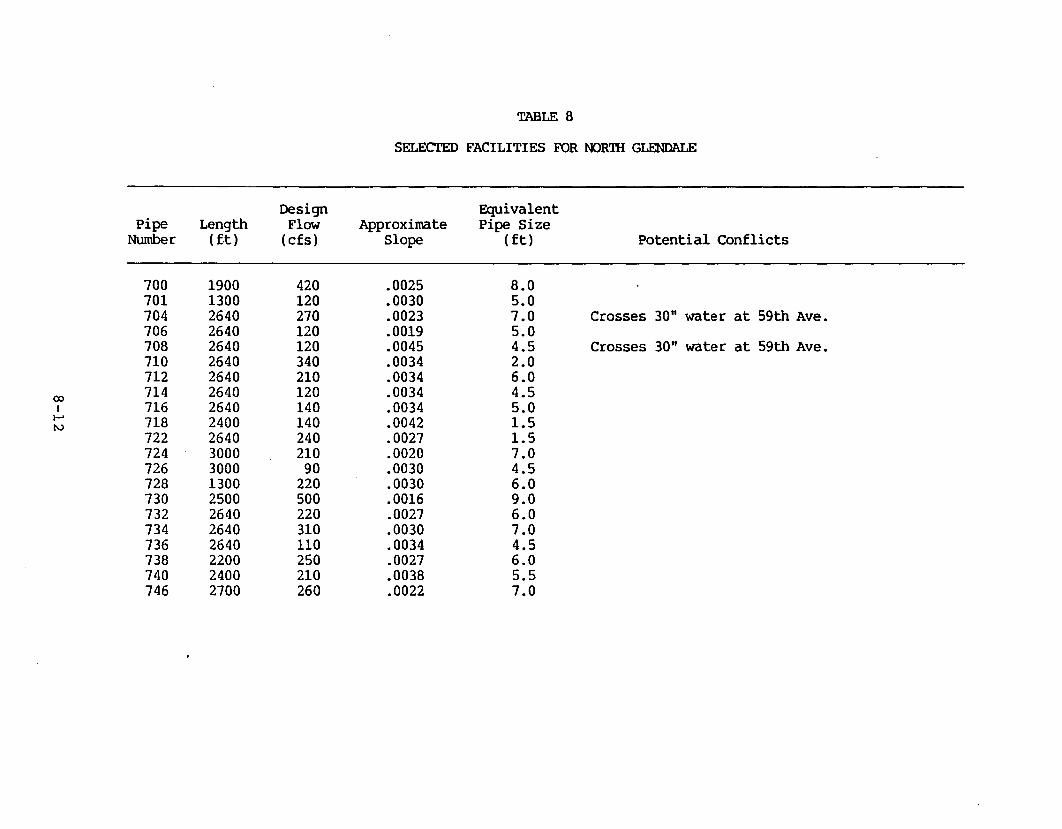
TABLE 8
SELECTED FACILITIES FOR NORTH GLENDALE
Design EquivalentPipe Length Flow Approximate Pipe Size
Number ( ft) (cfs) Slope (ft) Potential Conflicts
700 1900 420 .0025 8.0701 1300 120 .0030 5.0704 2640 270 .0023 7.0 Crosses 30" water at 59th Ave.706 2640 120 .0019 5.0708 2640 120 •0045 4.5 Crosses 30" water at 59th Ave •710 2640 340 .0034 2.0712 2640 210 .0034 6.0
ro 714 2640 120 .0034 4.5I 716 2640 140 .0034 5.0
I-' 718 2400 140 .0042 1.5tv722 2640 240 .0027 1.5724 3000 210 .0020 7.0726 3000 90 .0030 4.5728 1300 220 .0030 6.0730 2500 500 .0016 9.0732 2640 220 .0027 6.0734 2640 310 .0030 7.0736 2640 110 .0034 4.5738 2200 250 .0027 6.0740 2400 210 .0038 5.5746 2700 260 .0022 7.0
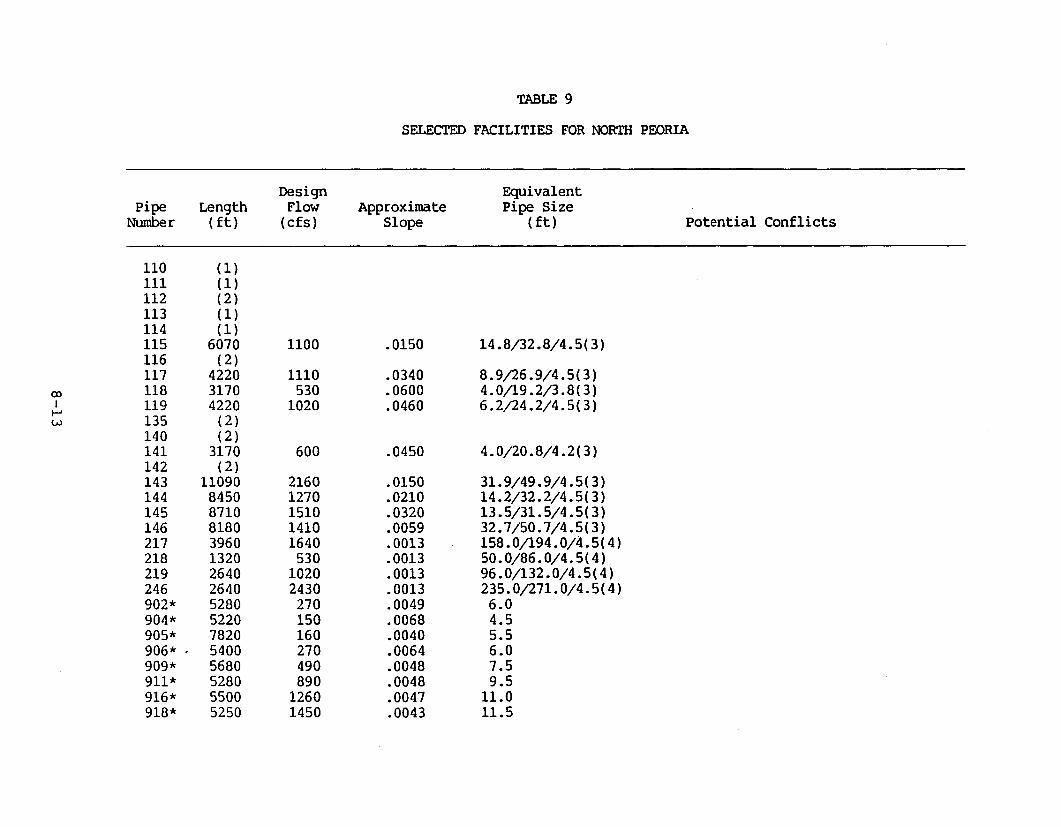
TABLE 9
SELECTED FACILITIES FOR NORTH PEORIA
Design EquivalentPipe Length Flow Approximate Pipe Size
Number (ft) (cfs) Slope (ft) Potential Conflicts
110 (1 )111 (1 )112 (2 )113 (1)114 (1 )115 6070 1100 .0150 14.8/32.8/4.5(3)116 (2 )117 4220 1110 .0340 8.9;26.9/4.5(3)
OJ 118 3170 530 .0600 4.0/19.2/3.8(3)I 119 4220 1020 .0460 6.2;24.2/4.5(3)
t-'w 135 (2)
140 (2)141 3170 600 .0450 4.0/20.8/4.2(3)142 (2)143 11090 2160 .0150 31.9/49.9/4.5(3)144 8450 1270 .0210 14.2/32.2/4.5(3)145 8710 1510 .0320 13.5/31.5/4.5(3)146 8180 1410 .0059 32.7/50.7/4.5(3)217 3960 1640 .0013 158.0/194.0/4.5(4)218 1320 530 .0013 50.0/86.0/4.5(4)219 2640 1020 .0013 96.0/132.0/4.5(4)246 2640 2430 .0013 235.0;271.0/4.5(4)902* 5280 270 .0049 6.0904* 5220 150 .0068 4.5905* 7820 160 .0040 5.5906* . 5400 270 .0064 6.0909* 5680 490 .0048 7.5911* 5280 890 .0048 9.5916* 5500 1260 .0047 11.0918* 5250 1450 .0043 11.5

TABLE 9
SELECTED FACILITIES FOR NORTH PEORIA(continued)
Pipe LengthNumber (ft)
919* 600921 3000
DesignFlow
(cfs)
2901400
ApproximateSlope
.0020
.0017
EquivalentPipe Size
(ft)
7.52-10.5
Potential Conflicts
Crosses 24" sanitary sewer at 91st Ave.
coI
I-'
"""
(1) Existing Natural Channel(2) 90-100% Open land under Ultimate Development (no channel sized)(3) Bottom width/top width/channel depth with 1.s-foot freeboard, assuming
2:1 side slopes, unless otherwise noted (lined channel)(4) 4:1 side slopes (unlined channel)
*Denotes ditch included in interim plan but will ultimately be replaced with a pipe.
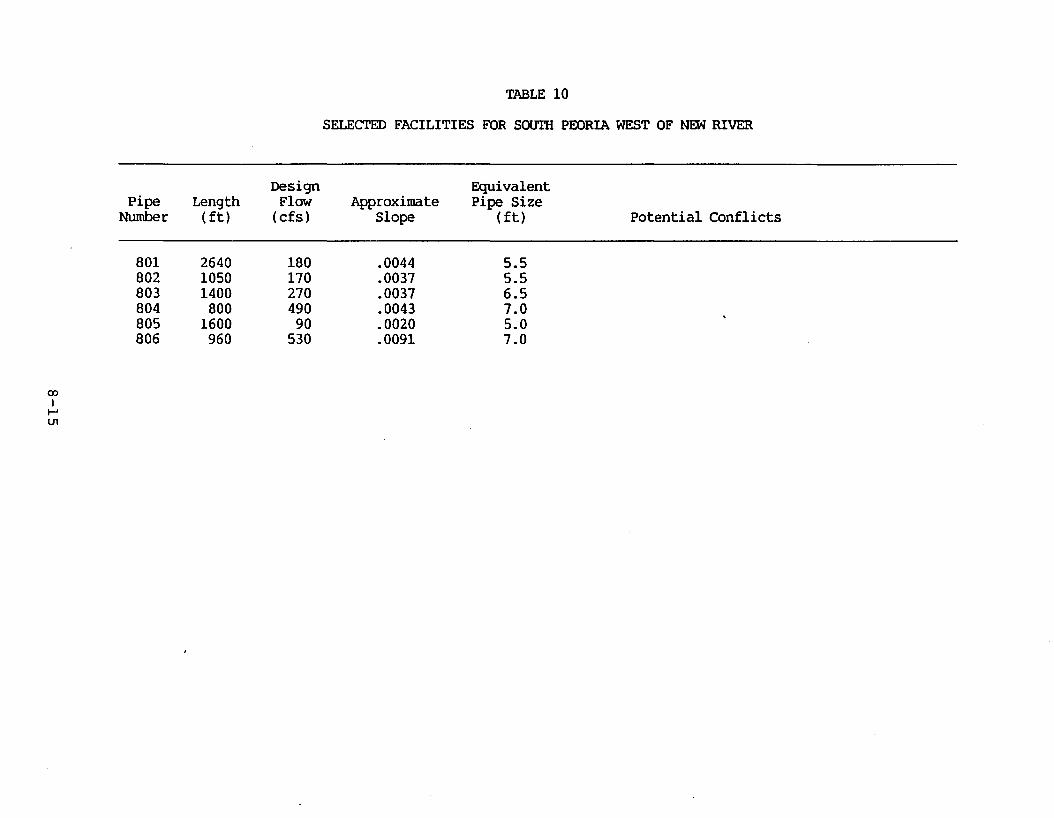
<XlI
I-'U1
TABLE 10
SELECTED FACILITIES FOR soom PEORIA WEST OF NEW RIVER
Design EquivalentPipe Length Flow Approximate Pipe Size
Number (ft) (cfs) Slope (ft) Potential Conflicts
801 2640 180 .0044 5.5802 1050 170 .0037 5.5803 1400 270 .0037 6.5804 800 490 .0043 7.0805 1600 90 .0020 5.0806 960 530 .0091 7.0
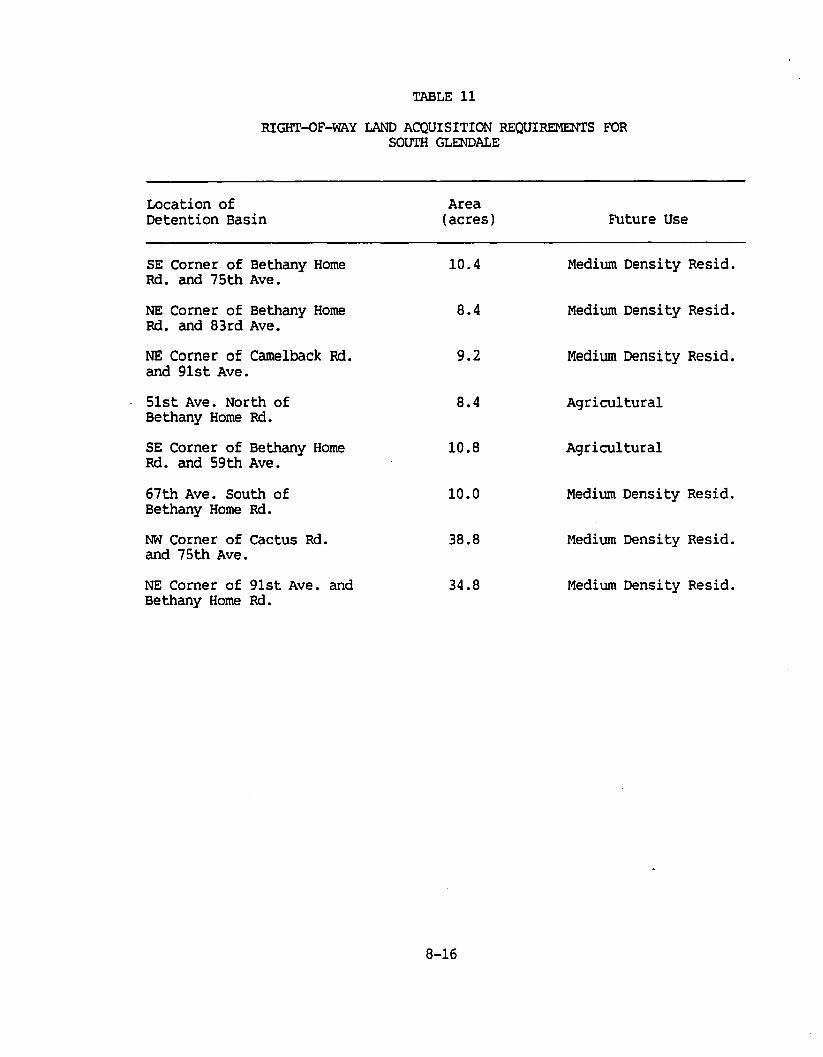
TABLE 11
RIGHT-OF-WAY LAND ACQUISITION REQUIREMENTS FORSOUTH GLENDALE
Location of AreaDetention Basin (acres) Future Use
SE Corner of Bethany Home 10.4 Medium Density Resid.Rd. and 75th Ave.
NE Corner of Bethany Home 8.4 Medium Density Resid.Rd. and 83rd Ave.
NE Corner of Camelback Rd. 9.2 Medium Density Resid.and gIst Ave.
51st Ave. North of 8.4 AgriculturalBethany Home Rd.
SE Corner of Bethany Home 10.8 AgriculturalRd. and 59th Ave.
67th Ave. South of 10.0 Medium Density Resid.Bethany Home Rd.
NW Corner of Cactus Rd. 38.8 Medium Density Resid.and 75th Ave.
NE Corner of 91st Ave. and 34.8 Medium Density Resid.Bethany Home Rd.
8-16
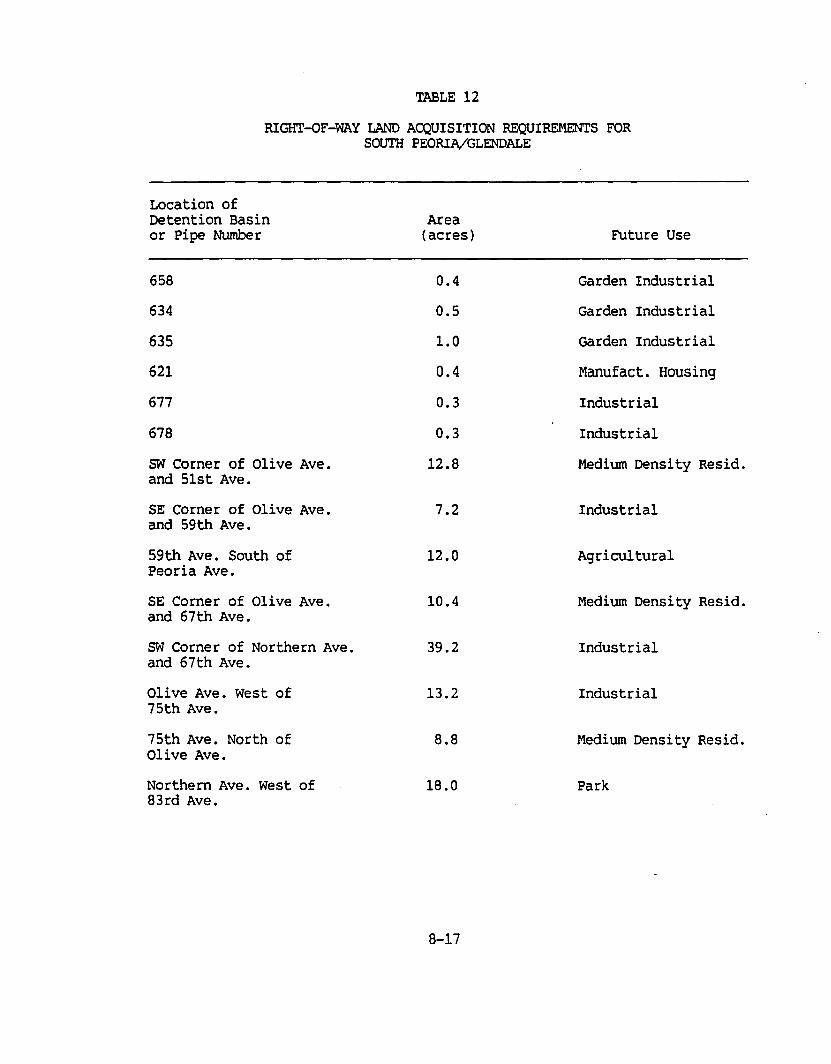
TABLE 12
RIGHT-OF-WAY LAND ACQUISITION REQUIREMENTS FORSOUTH PEORIA/GLENDALE
Location ofDetention Basin Areaor Pipe Number (acres) Future Use
658 0.4 Garden Industrial
634 0.5 Garden Industrial
635 1.0 Garden Industrial
621 0.4 Manufact. Housing
677 0.3 Industrial
678 0.3 Industrial
SW Corner of Olive Ave. 12.8 Medium Density Resid.and 51st Ave.
SE Corner of Olive Ave. 7.2 Industrialand 59th Ave.
59th Ave. South of 12.0 Agricul turalPeoria Ave.
SE Corner of Olive Ave. 10.4 Medium Density Resid.and 67th Ave.
SW Corner of Northern Ave. 39.2 Industrialand 67th Ave.
Olive Ave. West of 13.2 Industrial75th Ave.
75th Ave. North of 8.8 Medium Density Resid.Olive Ave.
Northern Ave. West of 18.0 Park83rd Ave.
8-17
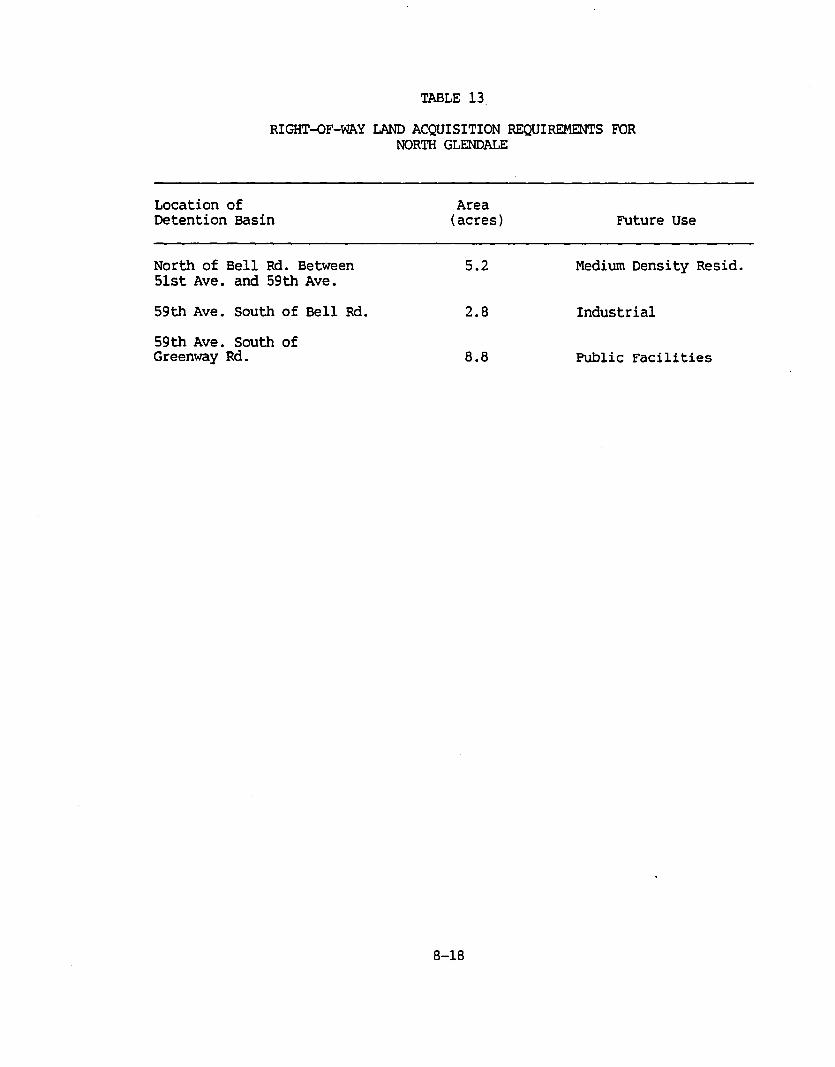
TABLE 13
RIGHT-OF-WAY LAND ACQUISITION REQUIREMENTS FORNORTH GLENDALE
Location of AreaDetention Basin (acres) Future Use
North of Bell Rd. Between 5.2 Medium Density Resid.51st Ave. and 59th Ave.
59th Ave. South of Bell Rd. 2.8 Industrial
59th Ave. South ofGreenway Rd. 8.8 Public Facilities
8-18
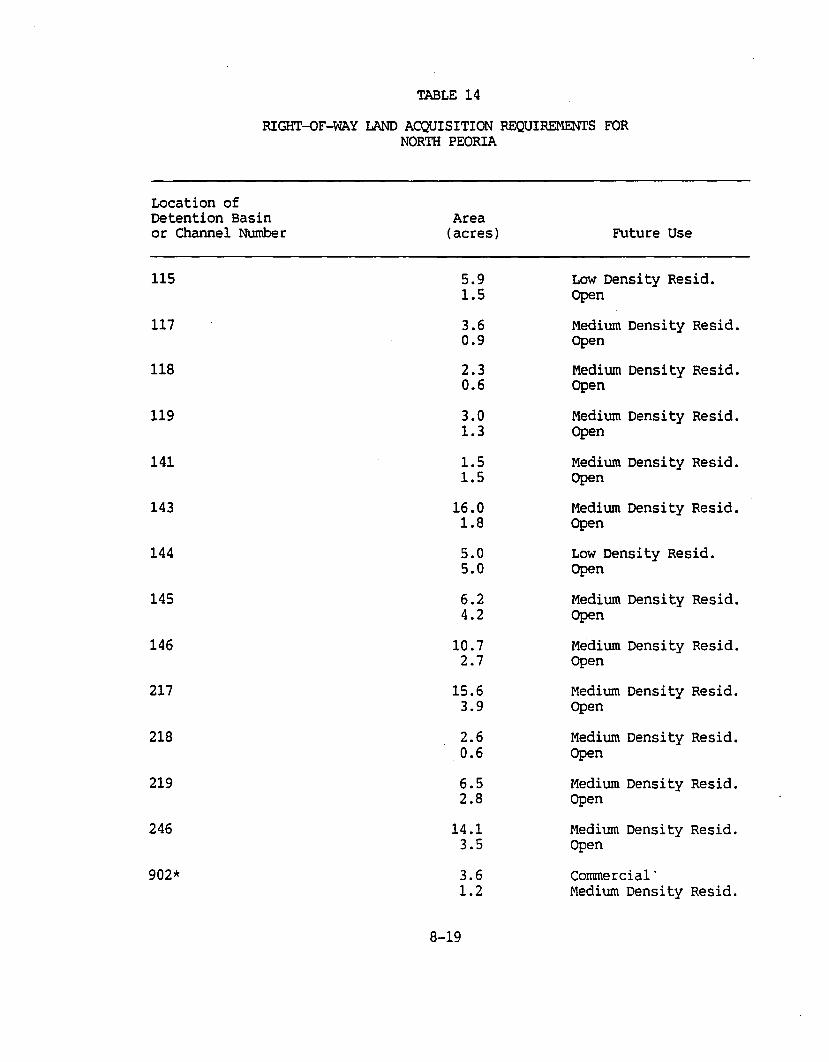
TABLE 14
RIGHT-OF-WAY LAND ACQUISITION REQUIREMENTS FORNORTH PEORIA
Location ofDetention Basin Areaor Channel Number (acres) Future Use
115 5.9 Low Density Resid.1.5 Open
117 3.6 Medium Density Resid.0.9 Open
118 2.3 Medium Density Resid.0.6 Open
119 3.0 Medium Density Resid.1.3 Open
141 1.5 Medium Density Resid.1.5 Open
143 16.0 Medium Density Resid.1.8 Open
144 5.0 Low Density Resid.5.0 Open
145 6.2 Medium Density Resid.4.2 Open
146 10.7 Medium Density Resid.2.7 Open
217 15.6 Medium Density Resid.3.9 Open
218 2.6 Medium Density Resid.0.6 Open
219 6.5 Medium Density Resid.2.8 Open
246 14.1 Medium Density Resid.3.5 Open
902* 3.6 Commercial'1.2 Medium Density Resid.
8-19

TABLE 14
RIGHT-OF-WAY LAND ACQUISTION REQUIREMENTS FORNORTH PEORIA(continued)
Location ofDetention Basinor Channel Number
904*
905*
906*
909*
911*
916*
918*
919*
91st Ave. andBeardsley Rd.
Area(acres) Future Use
0.8 Commercial1.9 Medium Density Resid.1.5 High Density Resid.
0.4 Conunercial5.8 Medium Density Resid.0.4 High Density Resid.
4.6 Medium Density Resid.
2.8 Commercial2.6 Medium Density Resid.0.5 High Density Resid.
1.3 Commercial2.0 Office3.6 High Density Resid.
2.3 Commercial6.1 Office
4.5 Garden Industrial4.5 High Density Resid.0.6 High Density Resid.
18.4 Medium Density Resid.
*Denotes channel included in interim plan but will ultimately be replacedwith a pipe.
8-20
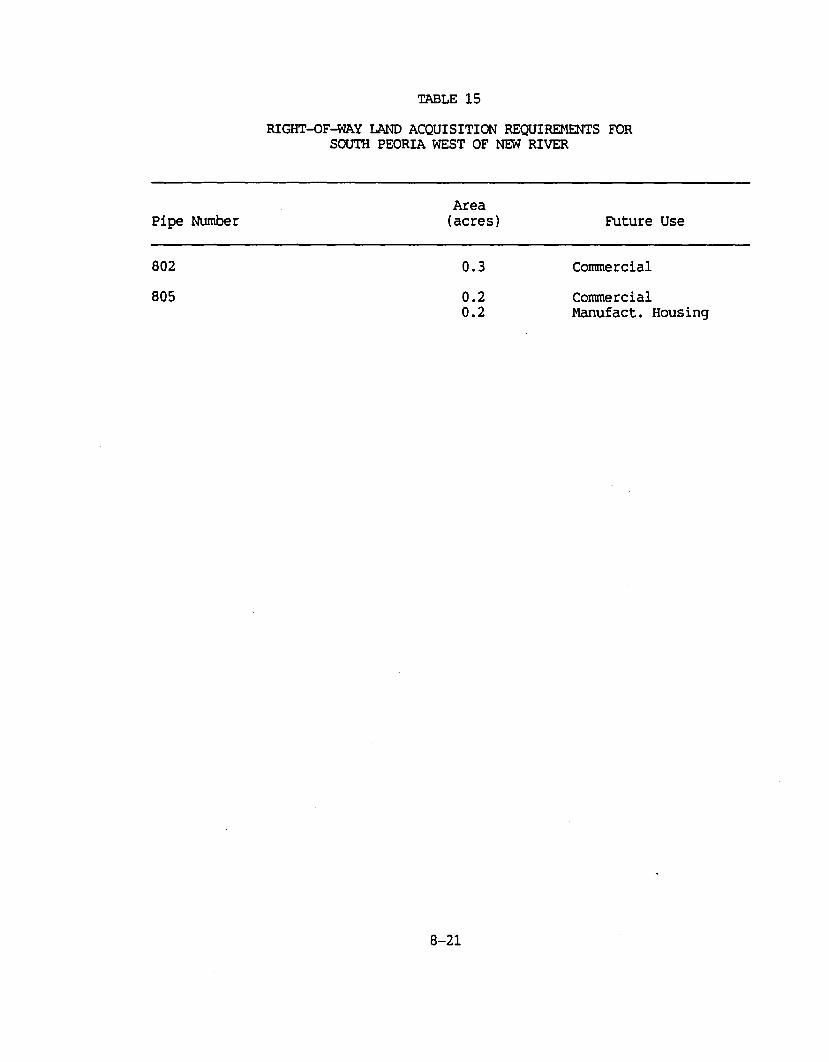
TABLE 15
RIGHT-OF-wAY LAND ACQUISITION REQUIREMENTS FORSOUTH PEORIA WEST OF NEW RIVER
AreaPipe Number (acres) Future Use
802 0.3 Commercial
805 0.2 Commercial0.2 Manufact. Housing
8-21
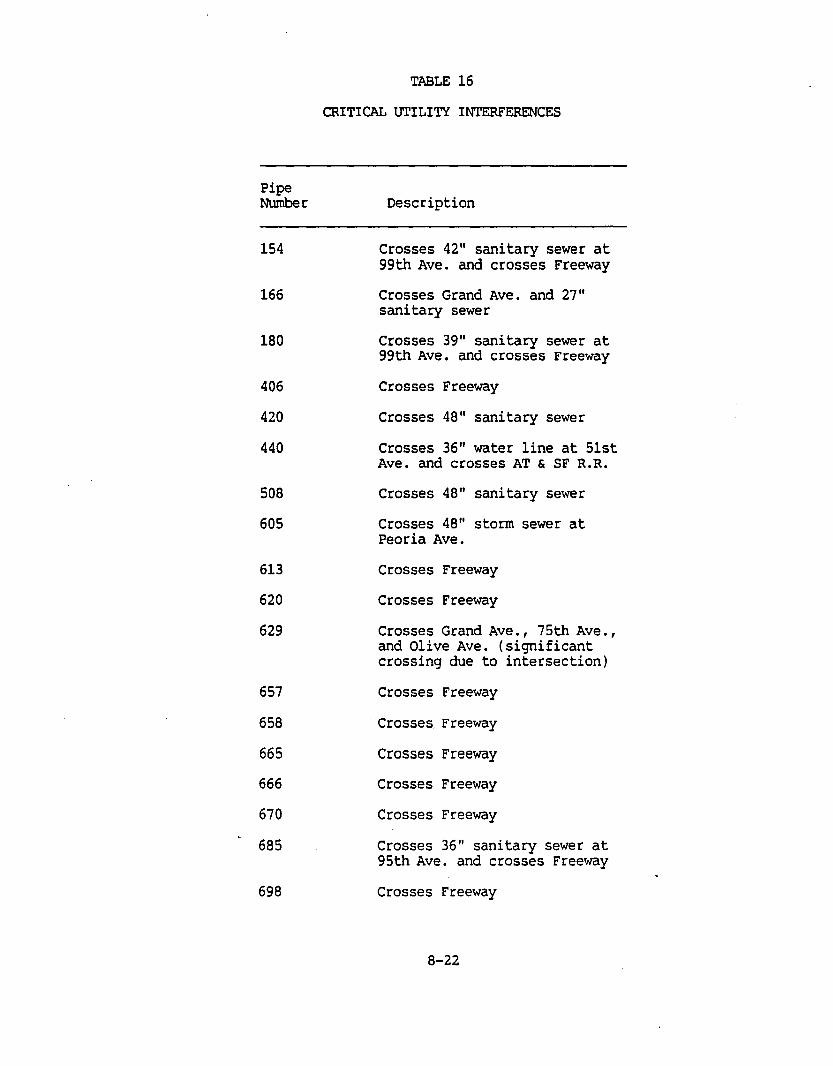
PipeNumber
154
166
180
406
420
440
508
605
613
620
629
657
658
665
666
670
685
698
TABLE 16
CRITICAL UTILITY INTERFERENCES
Description
Crosses 42" sanitary sewer at99th Ave. and crosses Freeway
Crosses Grand Ave. and 27"sanitary sewer
Crosses 39" sanitary sewer at99th Ave. and crosses Freeway
Crosses Freeway
Crosses 48" sanitary sewer
Crosses 36" water line at 51stAve. and crosses AT & SF R.R.
Crosses 48" sanitary sewer
Crosses 48" storm sewer atPeoria Ave.
Crosses Freeway
Crosses Freeway
Crosses Grand Ave., 75th Ave.,and Olive Ave. (significantcrossing due to intersection)
Crosses Freeway
Crosses_ Freeway
Crosses Freeway
Crosses Freeway
Crosses Freeway
Crosses 36" sanitary sewer at95th Ave. and crosses Freeway
Crosses Freeway
8-22

Section Nine
9. COSTS OF THE PREFERRED ALTERNATIVE
The estimated construction costs and land costs for the selected facilitiesin the five subareas are shown in Tables 17 to 26. The costs are basedupon July 1985 construction costs in Maricopa County. The costs include 20percent for engineering, legal, and administration, plus 20 percent forcontingencies, including relocation of utilities.
A discussion of the derivation of the construction unit costs used for thisanalysis is contained in the Appendix.
9-1
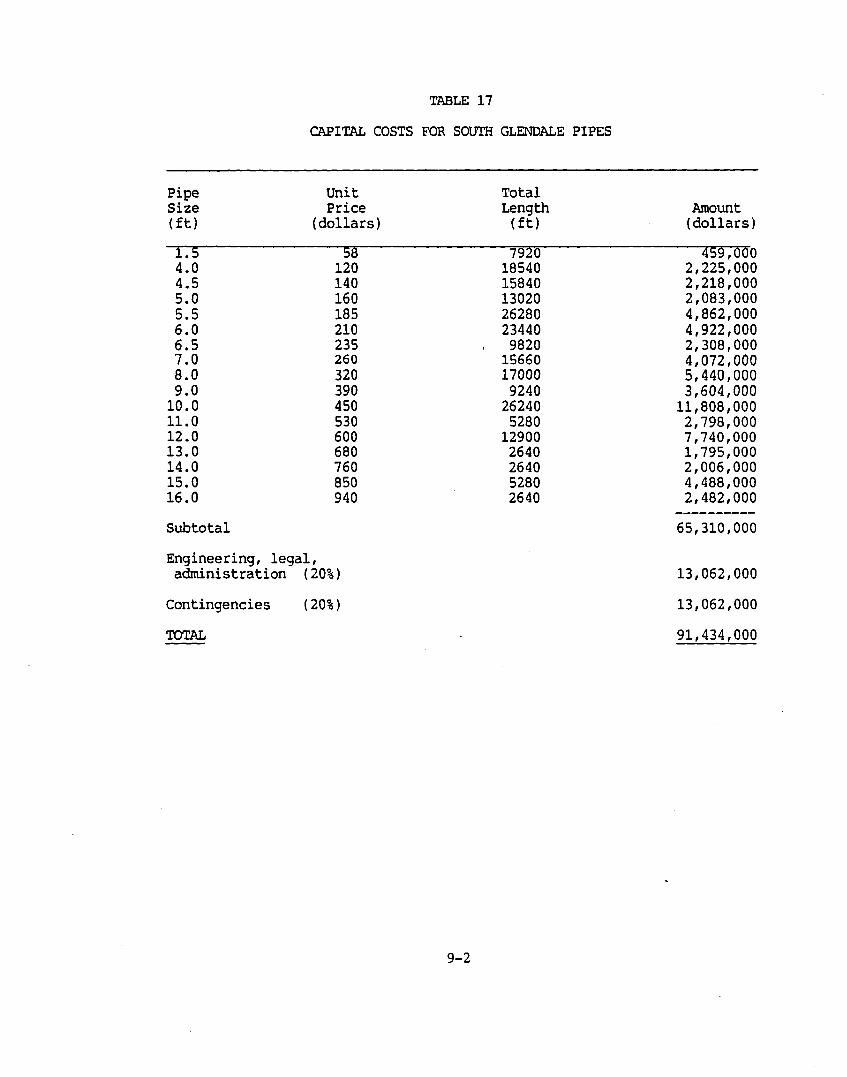
TABLE 17
CAPITAL COSTS FOR SOUTH GLENDALE PIPES
Pipe Unit TotalSize Price Length Amount(ft) (dollars) (ft) (dollars)
1.5 58 7920 459,0004.0 120 18540 2,225,0004.5 140 15840 2,218,0005.0 160 13020 2,083,0005.5 185 26280 4,862,0006.0 210 23440 4,922,0006.5 235 9820 2,308,0007.0 260 15660 4,072,0008.0 320 17000 5,440,0009.0 390 9240 3,604,000
10.0 450 26240 11,808,00011.0 530 5280 2,798,00012.0 600 12900 7,740,00013.0 680 2640 1,795,00014.0 760 2640 2,006,00015.0 850 5280 4,488,00016.0 940 2640 2,482,000
----------Subtotal 65,310,000
Engineering, legal,administration (20%) 13,062,000
Contingencies (20%) 13,062,000
TOTAL 91,434,000
9-2
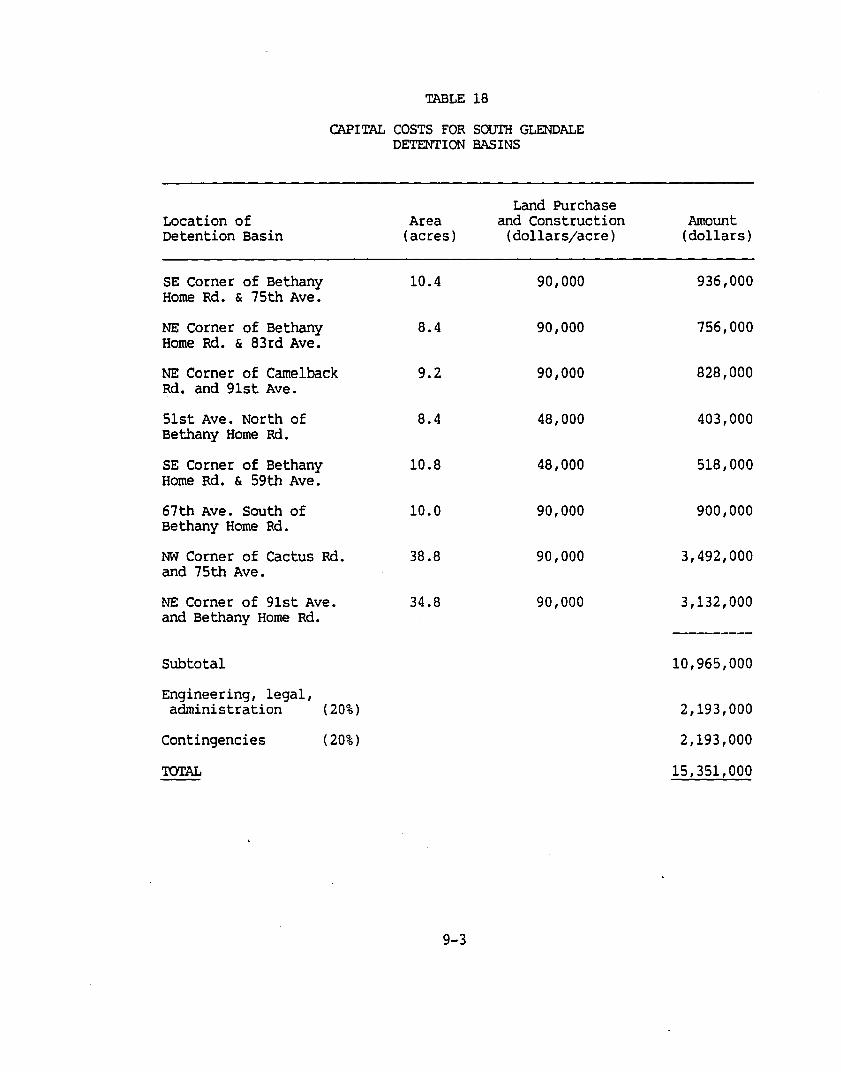
TABLE 18
CAPITAL COSTS FOR SOUTH GLENDALEDETENTION BASINS
Land PurchaseLocation of Area and Construction AmountDetention Basin (acres) (dollars/acre) (dollars)
SE Corner of Bethany 10.4 90,000 936,000Home Rd. & 75th Ave.
NE Corner of Bethany 8.4 90,000 756,000Home Rd. & 83rd Ave.
NE Corner of Camelback 9.2 90,000 828,000Rd. and 91st Ave.
51st Ave. North of 8.4 48,000 403,000Bethany Home Rd.
SE Corner of Bethany 10.8 48,000 518,000Home Rd. & 59th Ave.
67th Ave. South of 10.0 90,000 900,000Bethany Home Rd.
NW Corner of Cactus Rd. 38.8 90,000 3,492,000and 75th Ave.
NE Corner of 91st Ave. 34.8 90,000 3,132,000and Bethany Home Rd.
---------
Subtotal 10,965,000
Engineering, legal,administration (20%) 2,193,000
Contingencies (20%) 2,193,000
'roTAL 15,351,000
9-3
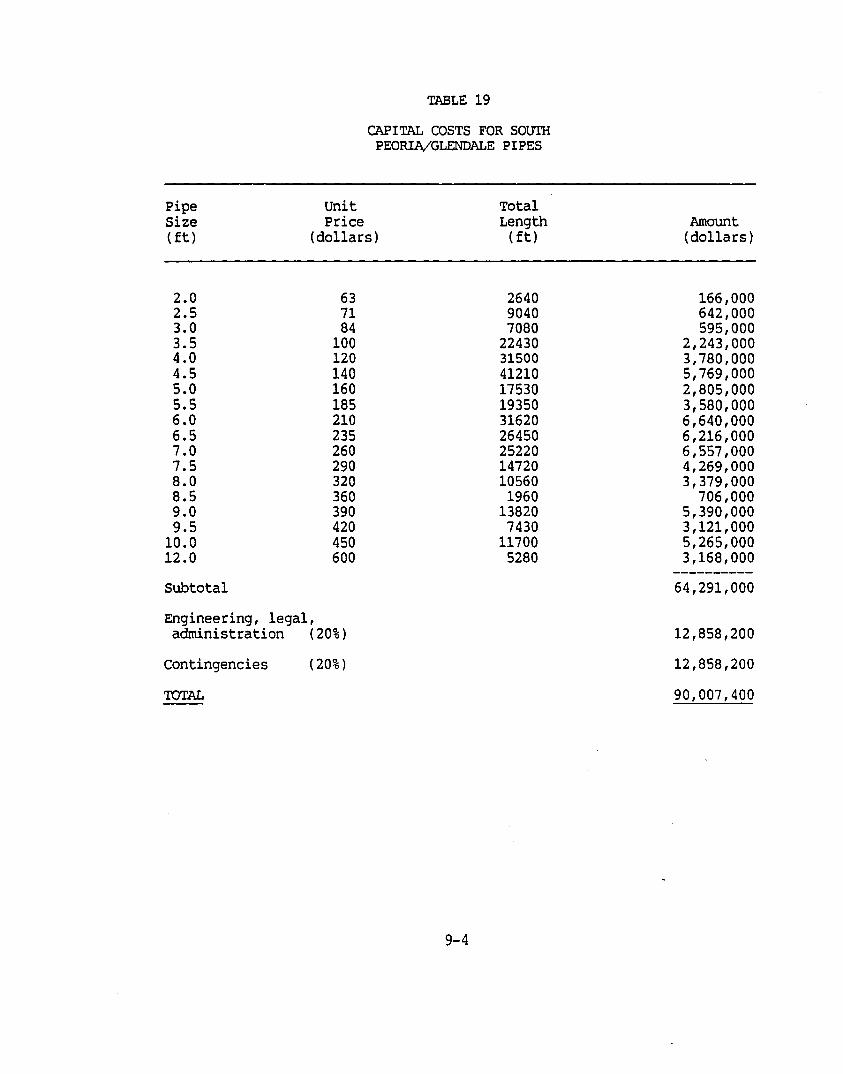
TABLE 19
CAPITAL COSTS FOR SOUTHPEORIA/GLENDALE PIPES
PipeSize(ft)
UnitPrice
(dollars)
TotalLength(ft)
Amount(dollars)
2.0 63 2640 166,0002.5 71 9040 642,0003.0 84 7080 595,0003.5 100 22430 2,243,0004.0 120 31500 3,780,0004.5 140 41210 5,769,0005.0 160 17530 2,805,0005.5 185 19350 3,580,0006.0 210 31620 6,640,0006.5 235 26450 6,216,0007.0 260 25220 6,557,0007.5 290 14720 4,269,0008.0 320 10560 3,379,0008.5 360 1960 706,0009.0 390 13820 5,390,0009.5 420 7430 3,121,000
10.0 450 11700 5,265,00012.0 600 5280 3,168,000
----------Subtotal 64,291,000
Engineering, legal,administration (20%) 12,858,200
contingencies (20%) 12,858,200
'IOTAL 90,007,400
9-4
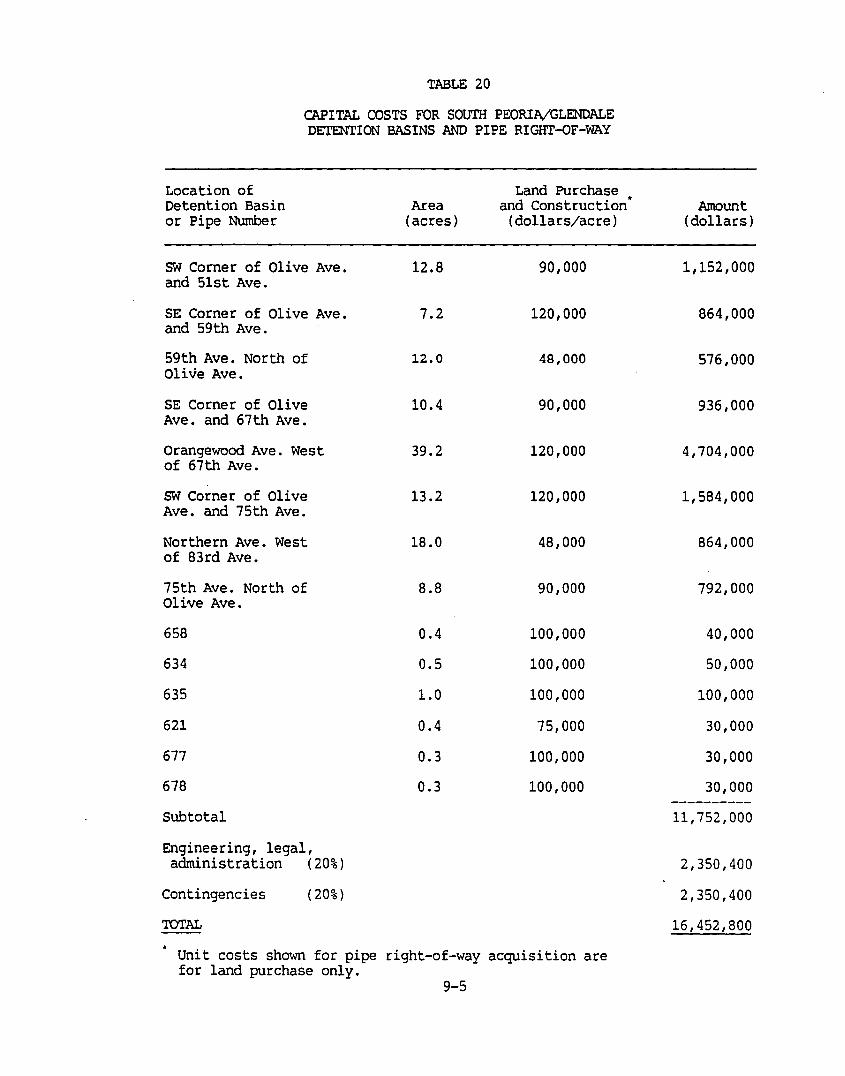
TABLE 20
CAPITAL COSTS FOR SOUTH PEORIA/GLENDALEDETENTION BASINS AND PIPE RIGHT-OF-WAY
Location of Land Purchase •Detention Basin Area and Construction Amountor Pipe Number (acres) (dollars/acre) (dollars)
SW Corner of Olive Ave. 12.8 90,000 1,152,000and 51st Ave.
SE Corner of Olive Ave. 7.2 120,000 864,000and 59th Ave.
59th Ave. North of 12.0 49,000 576,000Olive Ave.
SE Corner of Olive 10.4 90,000 936,000Ave. and 67th Ave.
Orangewood Ave. West 39.2 120,000 4,704,000of 67th Ave.
SW Corner of Olive 13.2 120,000 1,584,000Ave. and 75th Ave.
Northern Ave. West 18.0 48,000 864,000of 83rd Ave.
75th Ave. North of 8.8 90,000 792,000Olive Ave.
658 0.4 100,000 40,000
634 0.5 100,000 50,000
635 1.0 100,000 100,000
621 0.4 75,000 30,000
677 0.3 100,000 30,000
678 0.3 100,000 30,000----------
Subtotal 11,752,000
Engineering, legal,administration (20%) 2,350,400
Contingencies (20%) 2,350,400
TOTAL 16,452,800
unit costs shown for pipe right-of-way acquisition arefor land purchase only.
9-5
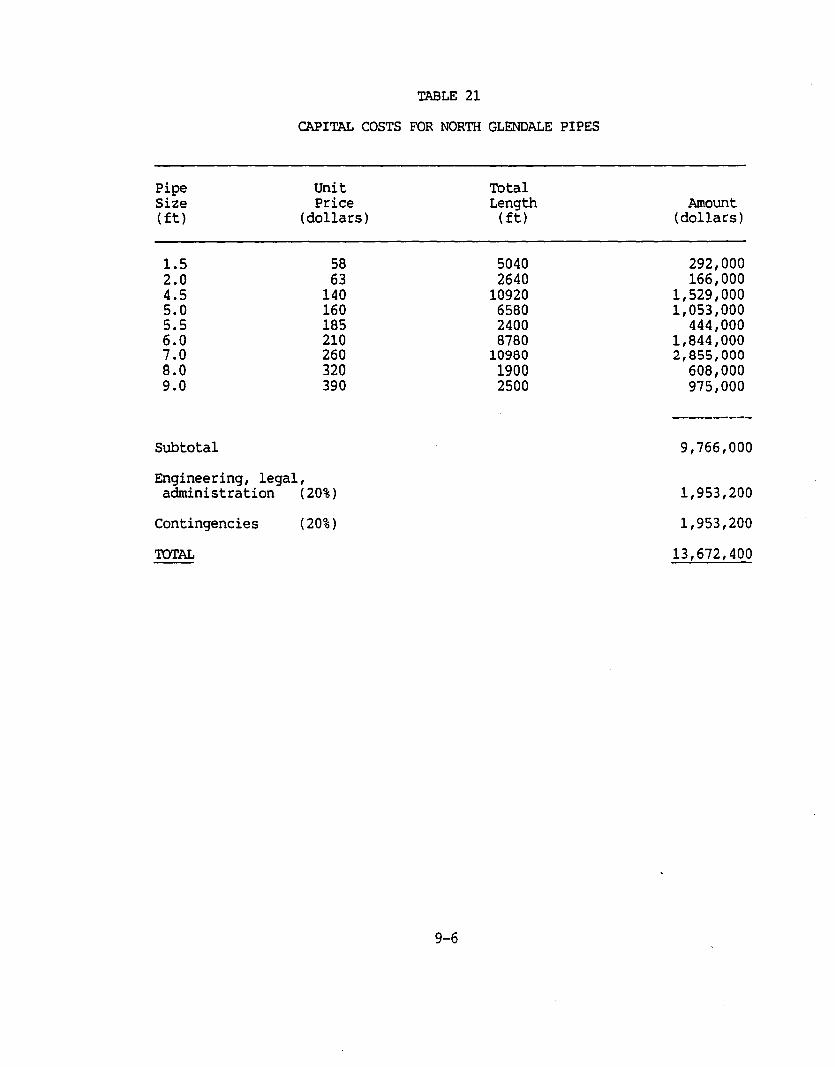
TABLE 21
CAPITAL COSTS FOR NORTH GLENDALE PIPES
Pipe Unit TotalSize Price Length Amount(ft) (dollars) (ft) (dollars)
1.5 58 5040 292,0002.0 63 2640 166,0004.5 140 10920 1,529,0005.0 160 6580 1,053,0005.5 185 2400 444,0006.0 210 8780 1,844,0007.0 260 10980 2,955,0008.0 320 1900 608,0009.0 390 2500 975,000
---------
Subtotal 9,766,000
Engineering, legal,administration (20%) 1,953,200
Contingencies (20%) 1,953,200
TOTAL 13,672,400
9-6
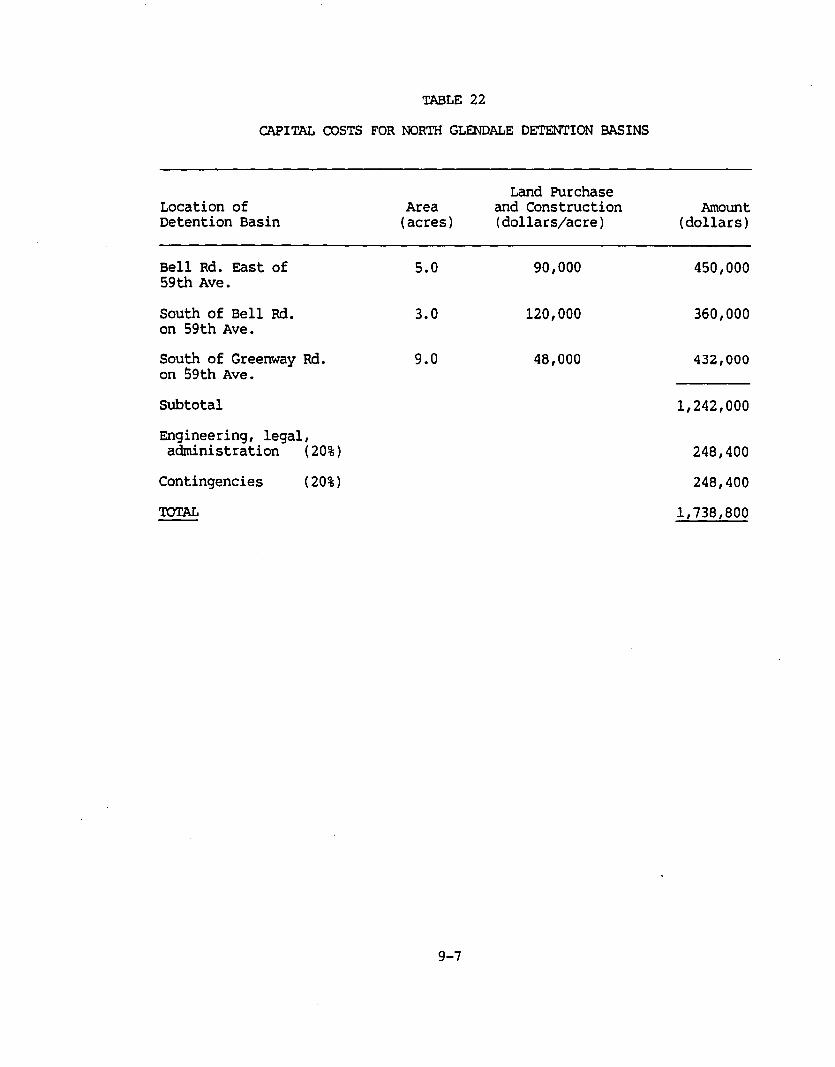
TABLE 22
CAPITAL COSTS FOR NORTH GLENDALE DETENTION BASINS
Location ofDetention Basin
Bell Rd. East of59th Ave.
south of Bell Rd.on 59th Ave.
South of Greenway Rd.on 59th Ave.
Subtotal
Engineering, legal,administration (20%)
Contingencies (20%)
Land PurchaseArea and Construction Amount
(acres) (dollars/acre) (dollars)
5.0 90,000 450,000
3.0 120,000 360,000
9.0 48,000 432,000
1,242,000
248,400
248,400
1,738,800
9-7
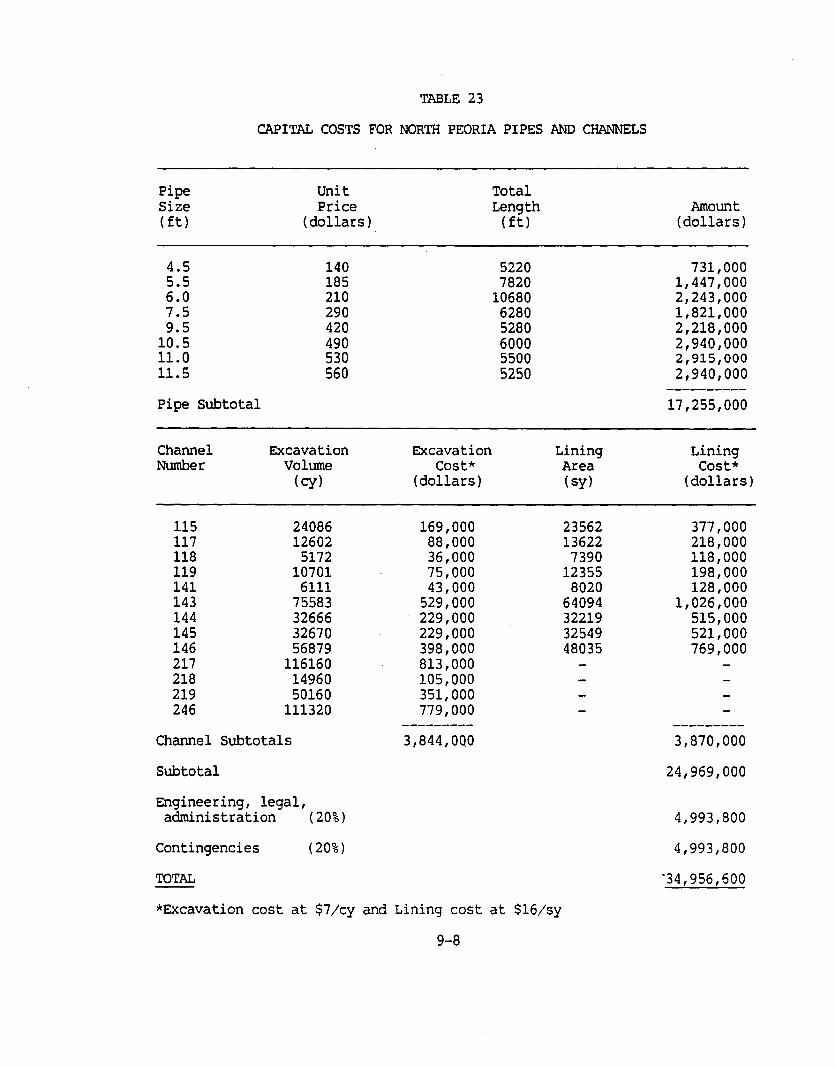
TABLE 23
CAPITAL COSTS FOR NORTH PEORIA PIPES AND CHANNELS
Pipe Unit TotalSize Price Length Amount(ft) (dollars) (ft) (dollars)
4.5 140 5220 731,0005.5 185 7820 1,447,0006.0 210 10680 2,243,0007.5 290 6280 1,821,0009.5 420 5280 2,218,000
10.5 490 6000 2,940,00011.0 530 5500 2,915,00011.5 560 5250 2,940,000
----------Pipe Subtotal 17,255,000
Channel Excavation Excavation Lining LiningNumber Volume Cost* Area Cost*
(cy) (dollars) (sy) (dollars)
115 24086 169,000 23562 377,000117 12602 88,000 13622 218,000118 5172 36,000 7390 118,000119 10701 75,000 12355 198,000141 6111 43,000 8020 128,000143 75583 529,000 64094 1,026,000144 32666 229,000 32219 515,000145 32670 229,000 32549 521,000146 56879 398,000 48035 769,000217 116160 813,000218 14960 105,000219 50160 351,000246 111320 779,000
--------- ---------Channel Subtotals 3,844,000 3,870,000
Subtotal 24,969,000
Engineering, legal,administration (20%) 4,993,800
Contingencies (20%) 4,993,800
TOTAL '34,956,600
*Excavation cost at $7/cy and Lining cost at $16/sy
9-8
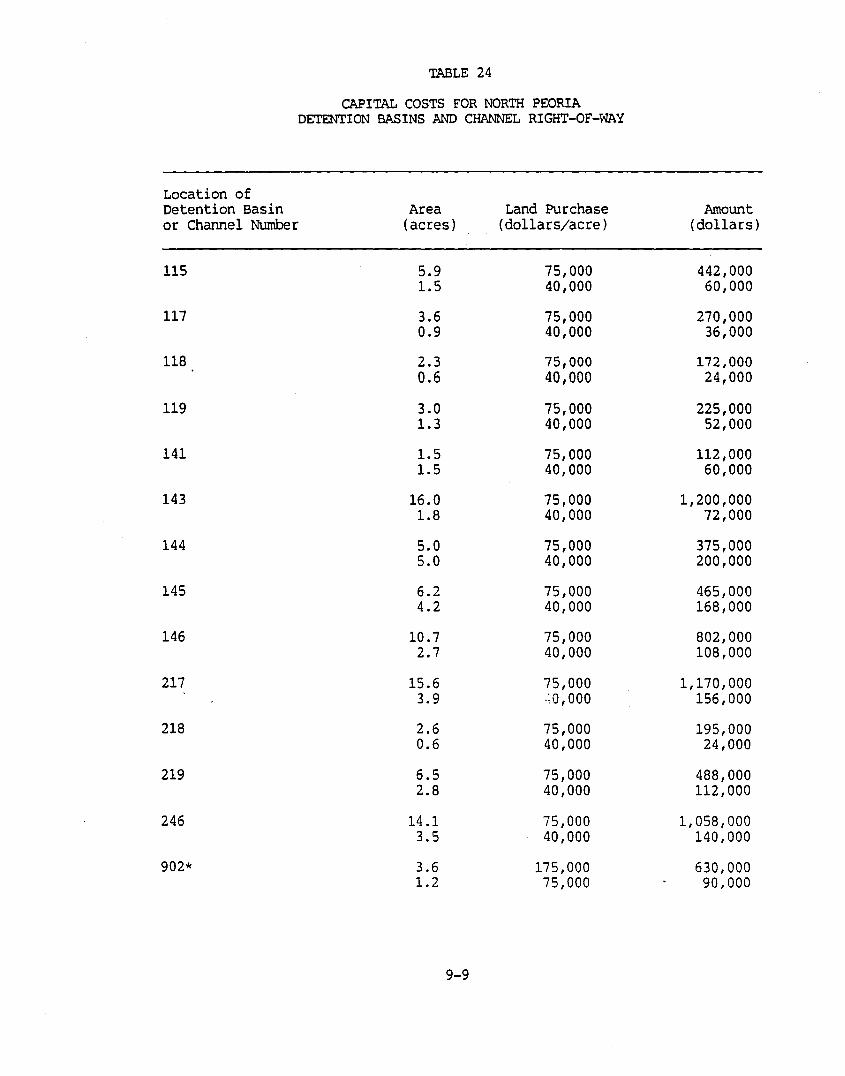
TABLE 24
CAPITAL COSTS FOR NORTH PEORIADETENTION BASINS AND CHANNEL RIGHT-OF-WAY
Location ofDetention Basin Area Land Purchase Amountor Channel Number (acres) (dollars/acre) (dollars)
115 5.9 75,000 442,0001.5 40,000 60,000
117 3.6 75,000 270,0000.9 40,000 36,000
118 2.3 75,000 172,0000.6 40,000 24,000
119 3.0 75,000 225,0001.3 40,000 52,000
141 1.5 75,000 112,0001.5 40,000 60,000
143 16.0 75,000 1,200,0001.8 40,000 72,000
144 5.0 75,000 375,0005.0 40,000 200,000
145 6.2 75,000 465,0004.2 40,000 168,000
146 10.7 75,000 802,0002.7 40,000 108,000
217 15.6 75,000 1,170,0003.9 "20,000 156,000
218 2.6 75,000 195,0000.6 40,000 24,000
219 6.5 75,000 488,0002.8 40,000 112,000
246 14.1 75,000 1,058,0003.5 40,000 140,000
902* 3.6 175,000 630,0001.2 75,000 90,000
9-9

TABLE 24
CAPITAL COSTS FOR NORTH PEORIADETENTION BASINS AND CHANNEL RIGHT-OF-WAY
(continued)
Location ofDetention BasinChannel Number
904*
905*
906*
909*
911*
916*
918*
919*
91st Ave. andBeardsley Rd.
Subtotal
Engineering, legal,administration (20%)
Contingencies (20%)
Area Land Purchase Amount(acres) (dollars/acre) (dollars)
0.8 175,000 140,0003.4 75,000 255,000
0.4 175,000 70,0006.2 75,000 465,000
4.6 75,000 345,000
2.8 175,000 490,0003.1 75,000 232,000
1.3 175,000 228,0002.0 100,000 200,0003.6 75,000 270,000
2.3 175,000 402,0006.1 100,000 610,000
4.5 100,000 450,0004.5 75,000 338,000
0.6 75,000 45,000
18.4 90,000 •• 1,656,000
---------
15,102,000
3,020,400
3,020,400
21,142,800
Note: Different land purchase prices within the same right-of-way are dueto different land uses within the right-of-way.
* Denotes ditch included in interim plan but will ultimately bereplaced with a pipe .
• • unit cost for detention basin includes construction costs.
9-10
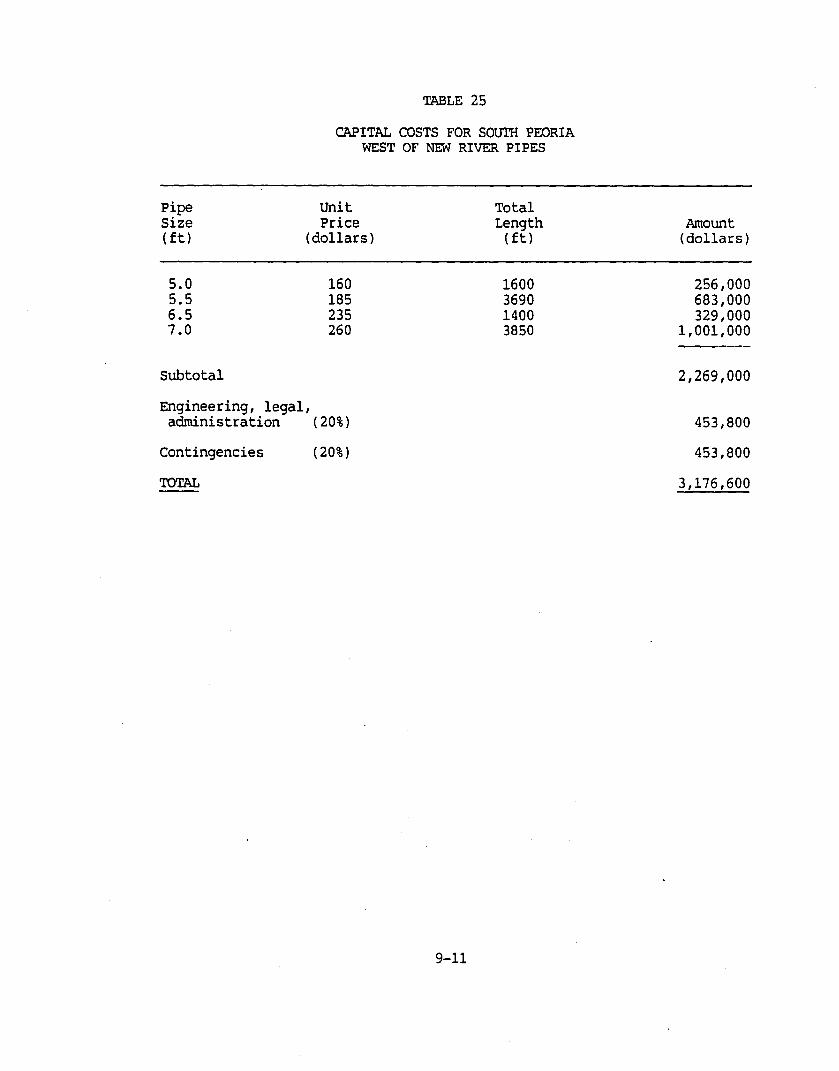
TABLE 25
CAPITAL COSTS FOR SOUTH PEORIAWEST OF NEW RIVER PIPES
Pipe Unit TotalSize Price Length Amount(ft) (dollars) (ft) (dollars)
5.0 160 1600 256,0005.5 185 3690 683,0006.5 235 1400 329,0007.0 260 3850 1,001,000
-------
Subtotal 2,269,000
Engineering, legal,administration (20%) 453,800
Contingencies (20%) 453,800
'roTAL 3,176,600
9-11
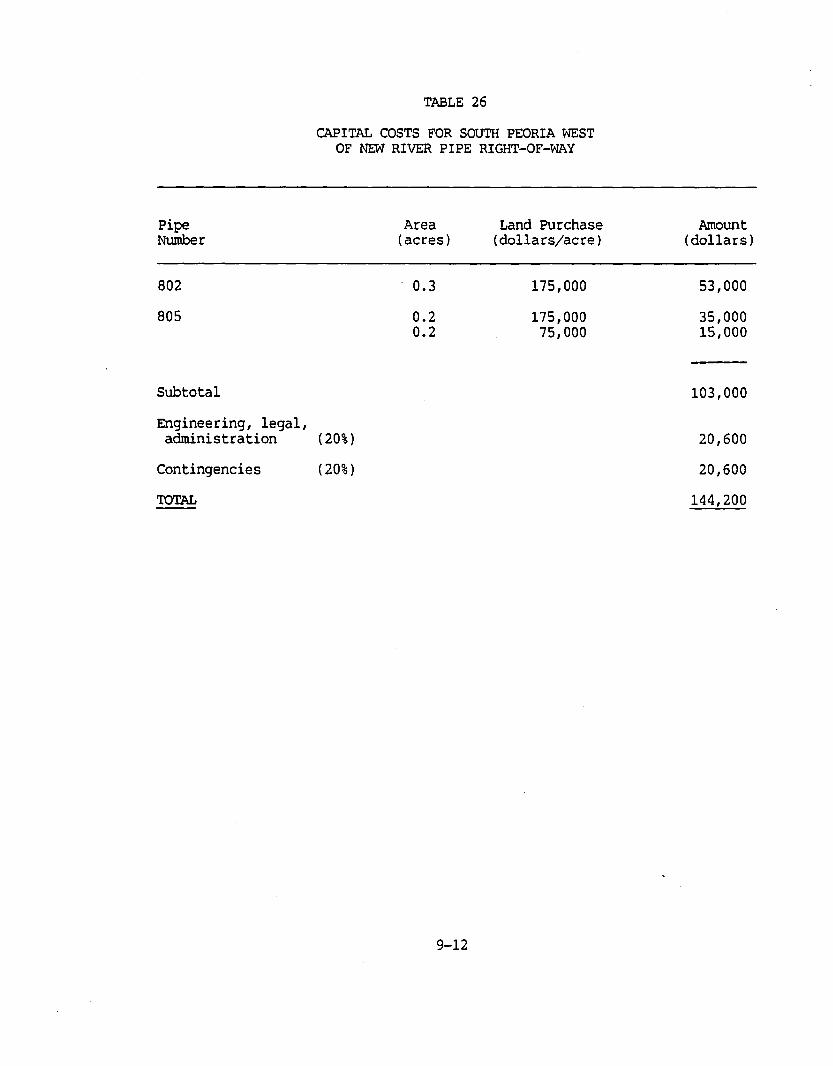
TABLE 26
CAPITAL COSTS FOR SOUI'H PEORIA WESTOF NEW RIVER PIPE RIGHT-OF-WAY
Pipe Area Land Purchase AmountNumber (acres) (dollars/acre) (dollars)
802 0.3 175,000 53,000
805 0.2 175,000 35,0000.2 75,000 15,000
-----Subtotal 103,000
Engineering, legal,administration (20%) 20,600
Contingencies (20%) 20,600
TOTAL 144,200
9-12
Section Ten
10. IMPLEMENTATION AND CONSTRUcrION PHASING
ADOPTION OF THE PREFERRED ALTERNATIVE
It is recommended that the Flood Control District review and adopt thisplan as the Glendale-Peoria Area Drainage Master Plan. The District shouldwork with the Cities of Glendale and Peoria to prevent development ofdeclared detention basins sites prior to their acquisition and to establishalignments for trunk stormwater facilities. This action will strengthenthe policies concerning stormwater and drainage in the City of Glendale,the City of Peoria, and in Maricopa County, and will require new stormwaterfacilities to be in conformance with the ADMP.
INTERAGENCY COOPERATION
The Cities of Glendale and Peoria have storrnwater interfaces with MaricopaCounty, the Arizona Department of Transportation, the Corps of Engineers,and the Salt River Project. Because of these conditions, interagency cooperation in the management of stormwater is recommended.
Interagency agreements might address the following subjects:
1. Control of stormwater overflows;2. Closing of certain streets during periods of heavy runoff;3. Improvement of existing stormwater facilities;4. Construction of new stormwater facilities (interim and/or
permanent) ;5. Runoff controls; and/or6. Emergency operations plan during flood conditions.
Glendale, Peoria and the Flood Control District should cooperate with theArizona Department of Tranportation as the Outer Loop Freeway and GrandAvenue Improvements are designed and constructed.
10-1
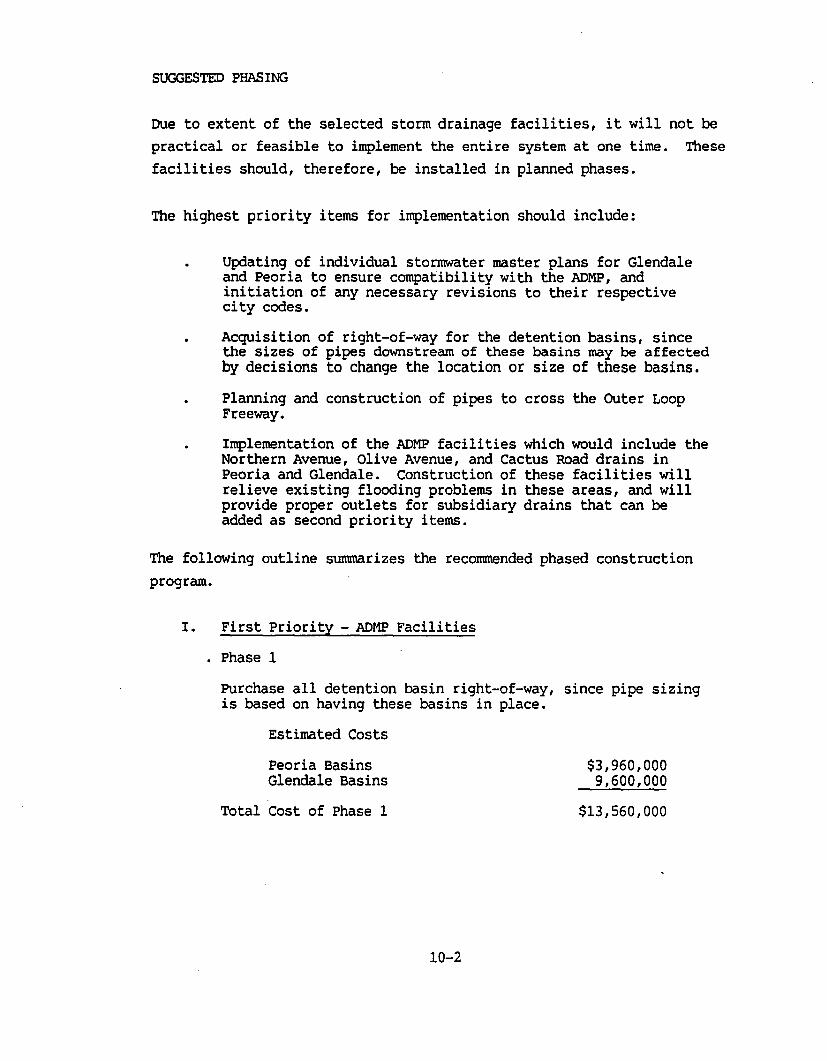
SUGGESTED PHASING
Due to extent of the selected storm drainage facilities, it will not be
practical or feasible to implement the entire system at one time. Thesefacilities should, therefore, be installed in planned phases.
The highest priority items for implementation should include:
Updating of individual stormwater master plans for Glendaleand Peoria to ensure compatibility with the ADMP, andinitiation of any necessary revisions to their respectivecity codes.
Acquisition of right-of-way for the detention basins, sincethe sizes of pipes downstream of these basins may be affectedby decisions to change the location or size of these basins.
Planning and construction of pipes to cross the OUter LoopFreeway.
Implementation of the ADMP facilities which would include theNorthern Avenue, Olive Avenue, and Cactus Road drains inPeoria and Glendale. Construction of these facilities willrelieve existing flooding problems in these areas, and willprovide proper outlets for subsidiary drains that can beadded as second priority items.
The following outline summarizes the recommended phased constructionprogram.
I. First Priority - ADMP Facilities
• Phase I
Purchase all detention basin right-of-way, since pipe sizingis based on having these basins in place.
Estimated Costs
Peoria BasinsGlendale Basins
Total Cost of Phase 1
10-2
$3,960,0009,600,000
$13,560,000
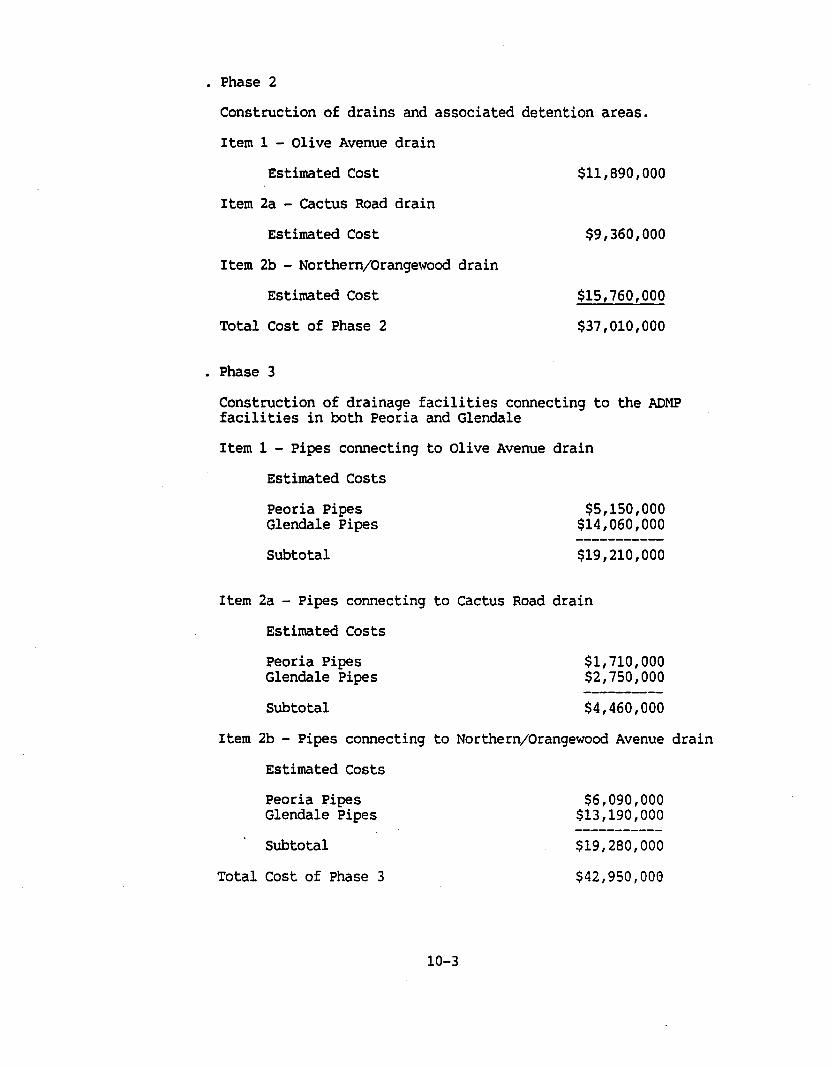
• Phase 2
Construction of drains and associated detention areas.
Item 1 - Olive Avenue drain
Estimated Cost
Item 2a - Cactus Road drain
Estimated Cost
Item 2b - Northern/Orangewood drain
Estimated Cost
Total Cost of Phase 2
• Phase 3
$11,890,000
$9,360,000
$15,760,000
$37,010,000
Construction of drainage facilities connecting to the ADMPfacilities in both Peoria and Glendale
Item 1 - Pipes connecting to Olive Avenue drain
Estimated Costs
Peoria PipesGlendale Pipes
Subtotal
$5,150,000$14,060,000
$19,210,000
Item 2a - Pipes connecting to Cactus Road drain
Estimated Costs
Peoria PipesGlendale Pipes
Subtotal
$1,710,000$2,750,000
$4,460,000
Item 2b - Pipes connecting to Northern/Orangewood Avenue drain
Estimated Costs
Peoria PipesGlendale Pipes
Subtotal
Total Cost of Phase 3
10-3
$6,090,000$13,190,000
$19,280,000
$42,950,008
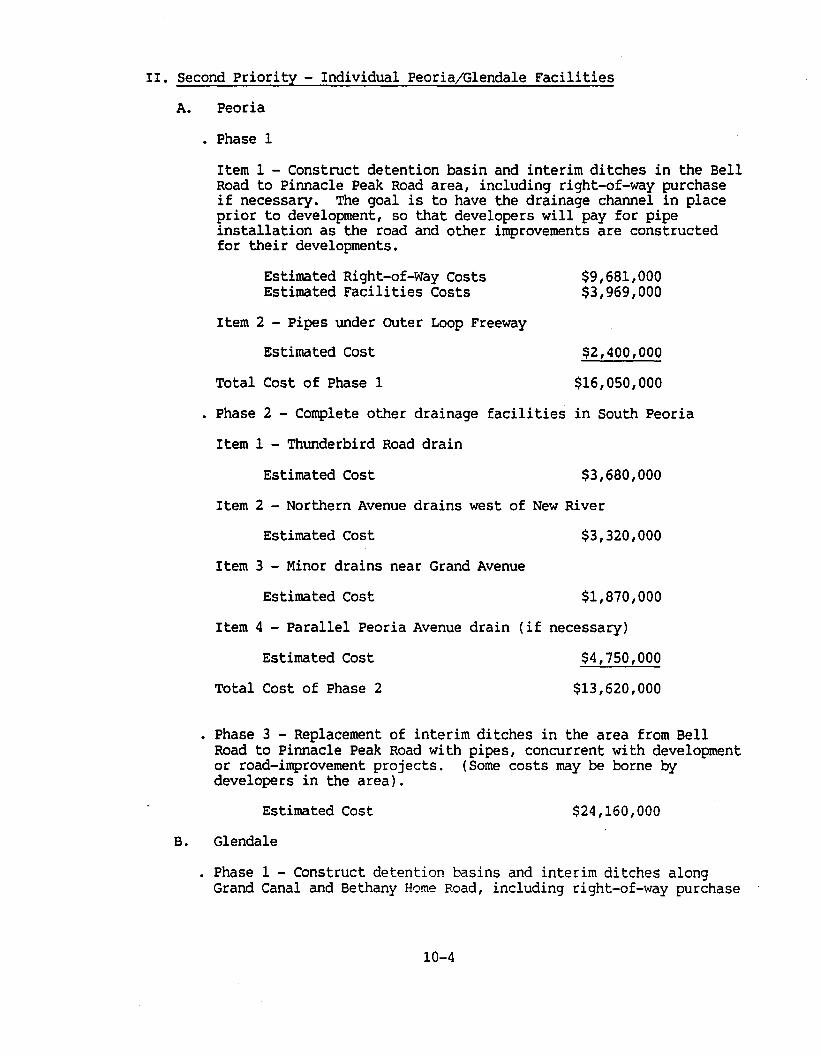
II. Second Priority - Individual Peoria/Glendale Facilities
A. Peoria
• Phase 1
Item 1 - Construct detention basin and interim ditches in the BellRoad to Pinnacle Peak Road area, including right-of-way purchaseif necessary. The goal is to have the drainage channel in placeprior to development, so that developers will pay for pipeinstallation as the road and other improvements are constructedfor their developments.
Estimated Right-of-Way CostsEstimated Facilities Costs
Item 2 - Pipes under outer Loop Freeway
Estimated Cost
Total Cost of Phase 1
$9,681,000$3,969,000
$2,400,000
$16,050,000
• Phase 2 - Complete other drainage facilities in South Peoria
Item 1 - Thunderbird Road drain
Estimated Cost $3,680,000
Item 2 - Northern Avenue drains west of New River
Estimated Cost
Item 3 - Minor drains near Grand Avenue
Estimated Cost
$3,320,000
$1,870,000
Item 4 - Parallel Peoria Avenue drain (if necessary)
Estimated Cost
Total Cost of Phase 2
$4,750,000
$13,620,000
• Phase 3 - Replacement of interim ditches in the area from BellRoad to Pinnacle Peak Road with pipes, concurrent with developmentor road-improvement projects. (Some costs may be borne bydevelopers in the area).
Estimated Cost
B. Glendale
$24,160,000
• Phase 1 - Construct detention basins and interim ditches alongGrand Canal and Bethany Home Road, including right-of-way purchase
10-4
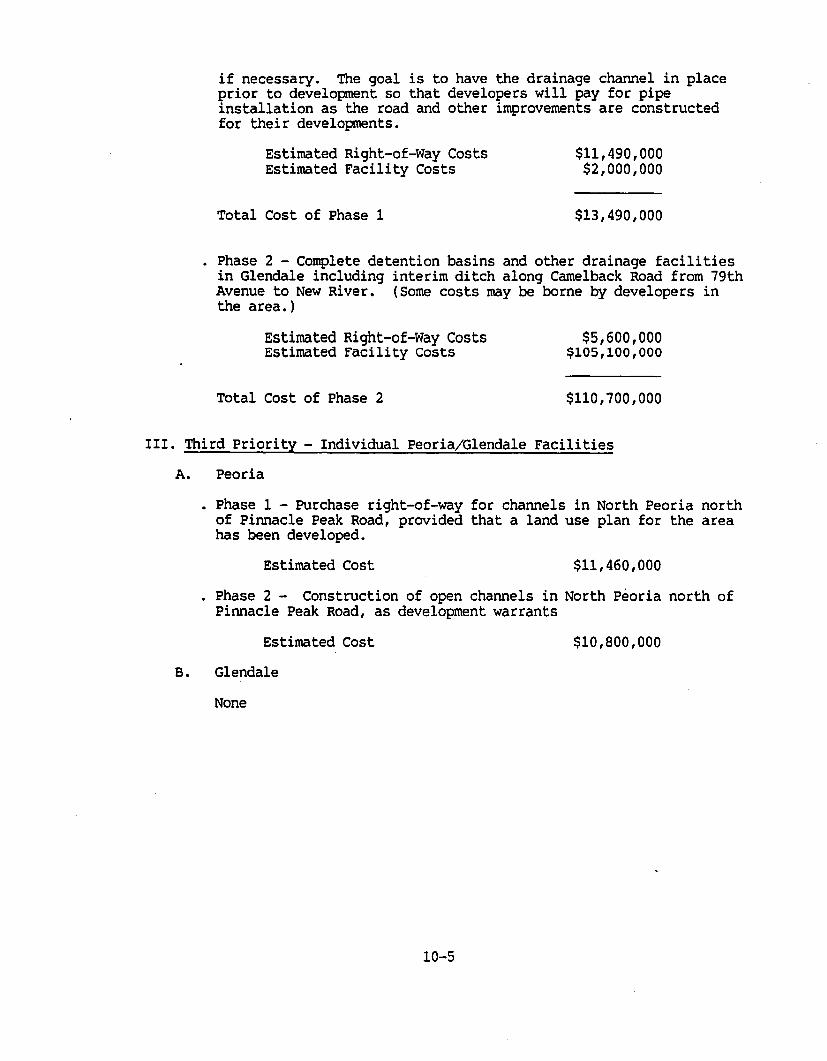
if necessary. The goal is to have the drainage channel in placeprior to development so that developers will pay for pipeinstallation as the road and other improvements are constructedfor their develoPments.
Estimated Right-of-Way CostsEstimated Facility Costs
Total Cost of Phase 1
$11,490,000$2,000,000
$13,490,000
• Phase 2 - Complete detention basins and other drainage facilitiesin Glendale including interim ditch along Camelback Road from 79thAvenue to New River. (Some costs may be borne by developers inthe area.)
Estimated Right-of-Way CostsEstimated Facility Costs
Total Cost of Phase 2
$5,600,000$105,100,000
$110,700,000
III. Third priority - Individual Peoria/Glendale Facilities
A. Peoria
• Phase 1 - Purchase right-of-way for channels in North Peoria northof Pinnacle Peak Road, provided that a land use plan for the areahas been developed.
Estimated Cost $11,460,000
• Phase 2 - Construction of open channels in North Peoria north ofPinnacle Peak Road, as development warrants
Estimated Cost
B. Glendale
None
10-5
$10,800,000
Section Eleven
11. FINANCING ALTERNATIVES
INTRODUCTION
An important part of developing a stormwater drainage system for theGlendale-Peoria study area will be the determination of a satisfactorymethod of obtaining funds for the initial construction of the facilities,and for the yearly operation and maintenance costs that will be needed tokeep the system functioning properly.
There are a number of methods that could be used for obtaining financingthat will be equitable and acceptable to the public. It will be possibleto use different methods for construction funding, and for operation andmaintenance costs. A combination of funding methods could also be used forany of the financial requirements of the drainage plan.
The following sections describe the possible financing methods which couldbe used by the cooperators for implementing and maintaining the selectedfacilities. The key features, advantages, and disadvantages of thesemethods are shown in Table 27.
CAPITAL REQUIREMENTS
Federal Loans/Grants
A number of federal programs exist that relate to funding for drainage andflood control activities. These are initiated through the Department ofAgriculture, the Department of Interior, the Environmental ProtectionAgency, the Department of Commerce, and the Army Corps of Engineers. Mostof the specific programs are structured in a manner that requires lengthystudy, planning, design, and construction staging. The funding of all suchprograms is uncertain due to the need for executive branch budget approvalin concert with legislative branch appropriation.
11-1
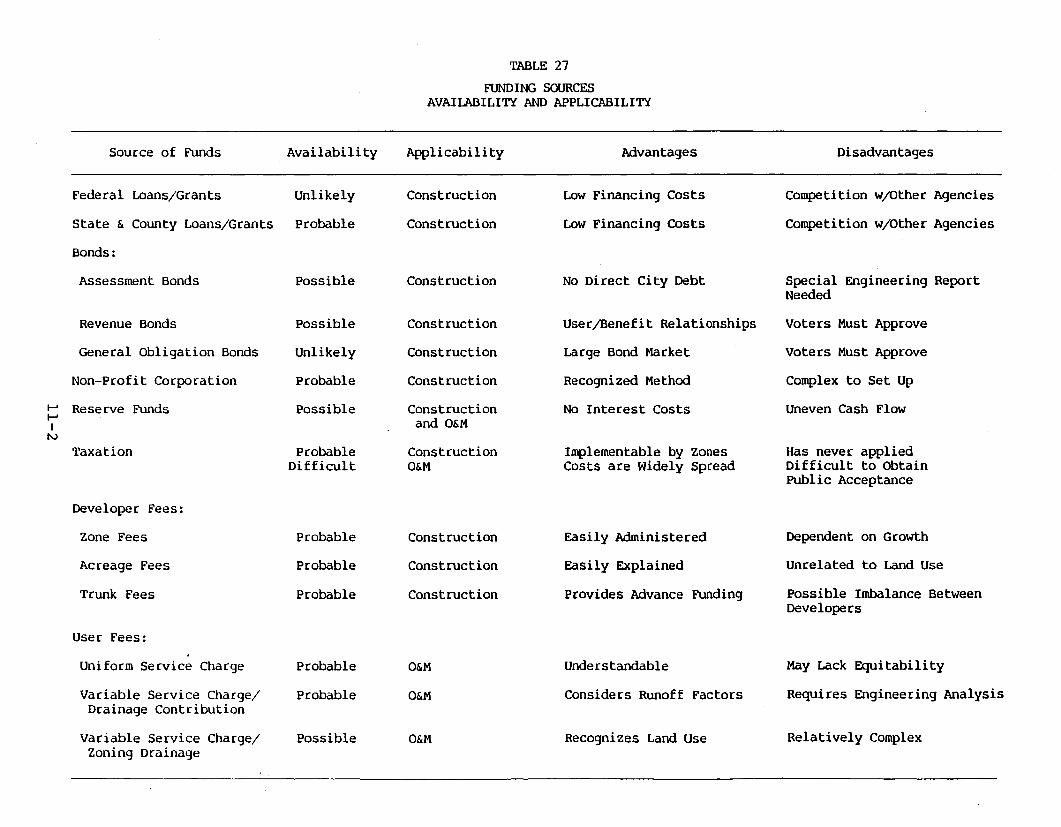
TABLE 27
FUNDING SOURCESAVAILABILITY AND APPLICABILITY
Source of Funds Availability
Federal Loans/Grants Unlikely
State & County Loans/Grants Probable
Bonds:
Applicabil i ty
Construction
Construction
Advantages
Low Financing Costs
Low Financing Costs
Disadvantages
Competition w/Other Agencies
Competition w/Other Agencies
Assessment Bonds
Revenue Bonds
General Obligation Bonds
Non-Profit Corporation
t-' Reserve FundsI-'I
tv
Taxation
Developer Fees:
Possible Construction No Direct City Debt Special Engineering ReportNeeded
possible Construction UserjBenefit Relationships Voters Must Approve
Unlikely Construction Large Bond Market Voters Must Approve
Probable Construction Recognized Method Complex to Set Up
possible Construction No Interest Costs Uneven Cash Flowand O&M
Probable Construction Implementable by Zones Has never appliedDifficult O&M Costs are Widely Spread Difficult to Obtain
Public Acceptance
Zone Fees
Acreage Fees
Trunk Fees
User Fees:
Uniform Service Charge
Variable Service Charge/Drainage Contribution
Variable Service Charge/Zoning Drainage
Probable
Probable
Probable
Probable
Probable
Possible
Construction
Construction
Construction
O&M
O&M
O&M
Easily Administered
Easily Explained
Provides Advance Funding
Understandable
Considers Runoff Factors
Recognizes Land Use
Dependent on Growth
Unrelated to Land Use
Possible Imbalance BetweenDevelopers
May Lack Equitability
Requires Engineering Analysis
Relatively Complex
State Cost-sharing
Drainage and flood control funding administered by the state of Arizona ishandled through the Department of Water Resources. State funding mechanisms are well defined, but availability of funds is uncertain due to theimpact of future budget and appropriation decisions.
Bonds
Three basic tyPes of bond financing are recognized by the State of Arizona:Assessment Bonds, Revenue Bonds, and General Obligation Bonds. Assessmentbond costs are those associated with public works, and represent an unpaidassessment levied against the property owners who benefit from the facilities constructed. This tyPe of bond is also referred to as an "Improvement Act" bond and can be issued under either of two formats. In one case,the issuing agency assumes a contingent liability, and, in the case ofdelinquency, can advance the amount due or can establish a limited tax thatapplies only to the delinquent area. In the other, and more commonly usedform, the issuing agency has no obligation to the bondholder other than toforward payments made by property owners.
Improvement district bonds relate to a debt obligation of an area that isless than district-wide. Debt service costs may be met through propertytaxes or assessments but only against the specific property contained within the improvement district.
Revenue bonds require both the demonstration of adequate revenues and thepledge to create and maintain a reserve fund.
General obligation bonds rely on their security through the taxing powersof the issuing agency. This form of financing is usually, though not necessarily, associated with property taxation.
11-3
Non-Profit Corporations
Initially, non-profit corporations were used in connection with the fundingof a specific facility, frequently a municipal building. More recently,
they have been used in relation to multiple projects or to improvements ofvarious facilities. The essential features of a non-prOfit corporation arethat it can be created by a public agency, that it be truly non-profit,that it act as the landlord during the term of the bond, and that thefacilities become the property of the public agency at the time the debtobligation is retired.
Reserve Funds
The use of reserve funds by a public agency for capital improvements or foroperation and maintenance is limited to critical situations -- those inwhich no other funding source is appropriate. Obviously, the legal constraints that apply to existing reserve funds must be known and followed.In addition, suitable mechanisms must be developed so that reserve fundsused in this way can be replaced in a timely manner.
Taxation
Recent flood control legislation by the state allows flood control districts to designate zones for the purpose of special levies. Propertyowners within each zone may be taxed based on the benefits they obtain fromspecial flood control projects.
OPERATION AND MAINTENANCE REQUIREMENTS
Taxation
A public agency can apply a general tax against property for a demonstratedrevenue need. Taxation would be an appropriate financing device where thepublic need is apparent to the electorate. Special taxes may be per house,per lot, per lot size or other method.
11-4
Developer Fees
When an area is being developed for residential, commercial, or industrialpurposes, it is sometimes appropriate to levy a fee against the developerto offset the capital costs of storm drainage facilities. These costs are
then, clearly, passed along to the eventual owner or user of the property.This transfer of costs may be at cross purposes with agency goals in termsof growth or expansion. Developer fees may also create some problems whenanalyzed in relation to earlier development practices or in relation to thefee to be charged to some future developer. Three types of developer feesare possible. One is a drainage improvement zone fee that is tailored tothe costs associated with a specific location, usually an identifiabledrainage area or basin. Another is commonly referred to as an acreage fee
and is uniformly applied. The third is a trunk facilities fee whoserevenues are used to construct major conveyance facilities.
User Fees
The concept of a user fee for drainage and flood control purposes isrelatively well established in many parts of the country. By its nature,it resolves the issue that those who use or benefit from a public utilitysystem should also pay the associated costs. In some cases, the technicalissues relating to how much rainfall is absorbed into the ground, how muchevaporates, or how much runs off from a given user's land can be of considerable concern. Nevertheless, there are accepted methods for makingthese determinations and producing user fees that are equitable betweenusers or between user classes.
Reserve Funds
As stated above, the use of reserve funds for operation and maintenancecosts is limited to critical situations. Where no alternative source isavailable or appropriate, reserves can be utilized; however, theirreplacement must be planned accordingly.
11-5
Other Methods
In those cases where a municipality or an existing drainage and flood control agency chooses to modify or add to its current facilities, a financialrestructuring is sometimes appropriate. One method of accomplishing thisis under a "redevelopment program." The basic premise of this type of program assumes that redeveloped areas will exhibit an increase in assessedvaluation and that the incremental increase in property tax revenue can beused to fund redevelopment work.
11-6

Section Twelve

12. INSTI'lUTIONAL CONSIDERATIONS AND INFRASTRUCIURE IMPROVEMENTS
INSTI'lUTIONAL CONSIDERATIONS
The actual implementation of the stormwater plan and the maintenance of thestormwater drainage facilities will require actions by political institutions. In addition, planning and coordination with, other institutions thatmay have jurisdiction over some portion of the facilities will be required.
In addition to the Flood Control District of Maricopa County, there are anumber of other institutions that could playa part in the implementationof the plan.
Federal
The U.S. Army Corps of Engineers has traditionally been responsible forflood control planning and construction on major river systems. The Corpsalso issues permits for construction over navigable waters. More recently,the Corps has also devoted some attention to urban flood control with thefunding of a number of urban studies. The Corps emphasizes the use ofstructural solutions, with the justification of these solutions based on afavorable benefit/cost ratio. The Arizona Canal Diversion Channel is aCorps project.
The Soil Conservation Service (SCS) of the U.S. Department of Agricultureis involved with planning and funding of watershed management and floodplain management programs. Traditionally, the SCS has worked with localsoil and water conservation districts in rural areas to provide technical
and financial assistance to local landowners, occupants, and other localagencies. However, the SCS has recently expanded its program to providesimilar assistance in urban areas. There are no current SCS projects inGlendale.
The Federal Emergency Management Agency (FEMA) is responsible for administering the National Flood Insurance Act, which makes flood insurance
12-1
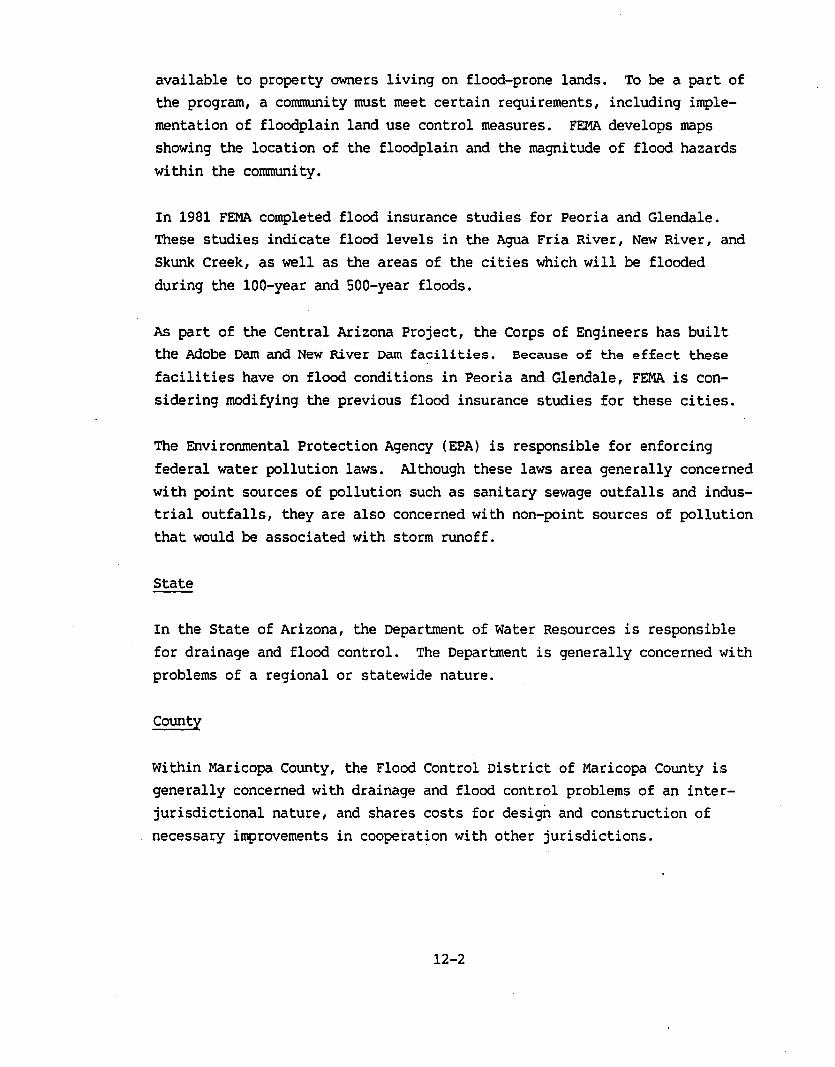
available to property owners living on flood-prone lands. To be a part ofthe program, a community must meet certain requirements, including implementation of floodplain land use control measures. FEMA develops mapsshowing the location of the floodplain and the magnitude of flood hazardswithin the community.
In 1981 FEMA completed flood insurance studies for Peoria and Glendale.These studies indicate flood levels in the Agua Fria River, New River, andSkunk Creek, as well as the areas of the cities which will be floodedduring the 100-year and SOD-year floods.
As part of the Central Arizona project, the Corps of Engineers has builtthe Adobe Dam and New River Dam facilities. Because of the effect these
facilities have on flood conditions in Peoria and Glendale, FEMA is considering modifying the previous flood insurance studies for these cities.
The Environmental Protection Agency (EPA) is responsible for enforcingfederal water pollution laws. Although these laws area generally concernedwith point sources of pollution such as sanitary sewage outfalls and industrial outfalls, they are also concerned with non-point sources of pollutionthat would be associated with storm runoff.
State
In the State of Arizona, the Department of water Resources is responsiblefor drainage and flood control. The Department is generally concerned withproblems of a regional or statewide nature.
County
Within Maricopa County, the Flood Control District of Maricopa County isgenerally concerned with drainage and flood control problems of an interjurisdictional nature, and shares costs for design and construction ofnecessary improvements in cooperation with other jurisdictions.
12-2
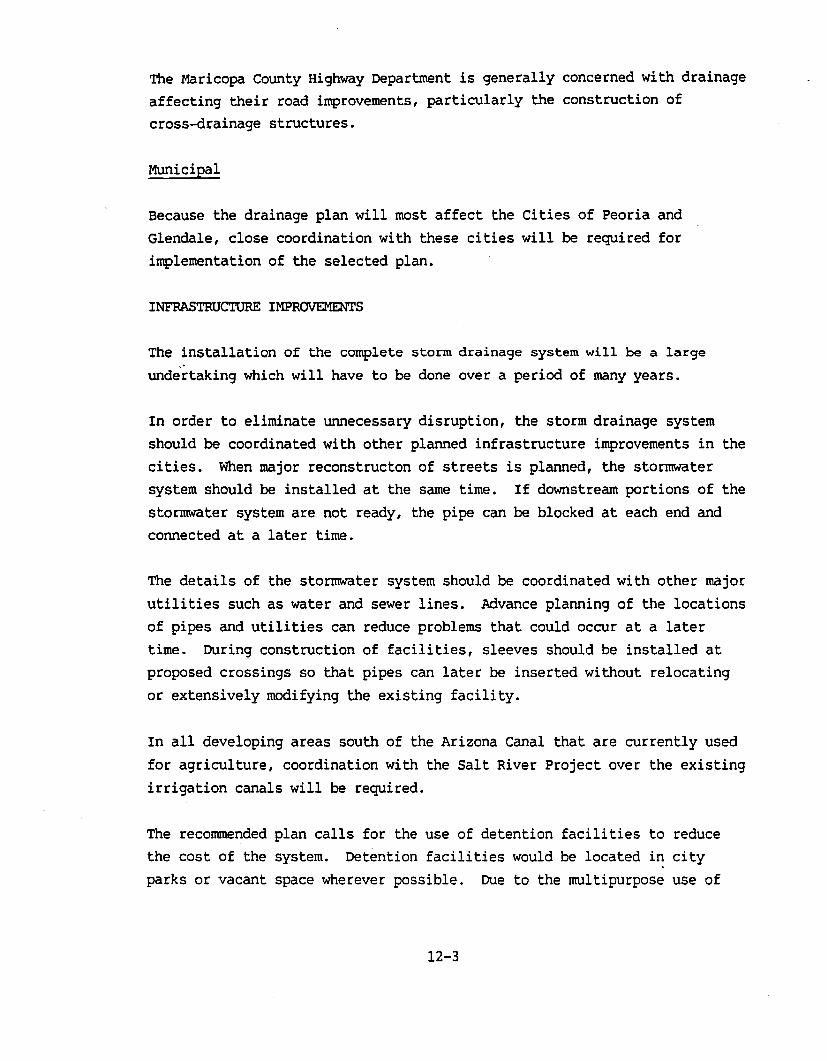
The Maricopa County Highway Department is generally concerned with drainageaffecting their road improvements, particularly the construction ofcross-drainage structures.
Municipal
Because the drainage plan will most affect the Cities of Peoria andGlendale, close coordination with these cities will be required forimplementation of the selected plan.
INFRASTRUCTURE IMPROVEMENTS
The installation of the complete sto~ drainage system will be a largeunde~taking which will have to be done over a period of many years.
In order to eliminate unnecessary disruption, the storm drainage systemshould be coordinated with other planned infrastructure improvements in thecities. When major reconstructon of streets is planned, the stonnwatersystem should be installed at the same time. If downstream portions of thestonnwater system are not ready, the pipe can be blocked at each end andconnected at a later time.
The details of the stonnwater system should be coordinated with other majorutilities such as water and sewer lines. Advance planning of the locationsof pipes and utilities can reduce problems that could occur at a latertime. ouring construction of facilities, sleeves should be installed atproposed crossings so that pipes can later be inserted without relocatingor extensively modifying the existing facility.
In all developing areas south of the Arizona Canal that are currently usedfor agriculture, coordination with the Salt River Project over the existingirrigation canals will be required.
The recommended plan calls for the use of detention facilities to reducethe cost of the system. Detention facilities would be located in cityparks or vacant space wherever possible. Due to the multipurpose use of
12-3
these areas, the use as a detention facility must be carefully coordinatedto avoid unnecessary disruption, inconvenience, and maintenance problems.The detention basins, wherever possible, should have water enter the basinonly when the capacity of the downstream drain is exceeded. This wouldkeep the basin dry during very small storms, and would reduce the interference with other uses of the site.
In planning the detention facilities, it will be necessary to ensure thatno flooding or damage will occur to buildings and structures. It may be
desirable to grade or build compartments in the facility so that someunflooded space will remain after frequent, small storms. Completeinundation would occur only during major storms.
The length of time that water would be stored in the detention facilitywould depend on the size of the storm and the design of the facility'soutlet structure. However, it is anticipated that during major storms,park facilities would drain in 2 hours and other facilities would be
emptied within 1 day after the end of the storm.
12-4

Section Thirteen
13. CONDITIONS AND LIMITATIONS
In the development of the recommended plan, certain conditions andlimitations have been iMPOsed or applied. These include:
1. The ADMP has been based upon information about the existingstormwater system obtained from the City of Glendale, the City ofPeoria, the Arizona Department of Transportation, and otheragencies. No field surveys were performed.
2. Stormwater runoff rates and volumes for the preferred alternativehave been calculated with the information in 1. There are nomeasurements of stormwater runoff rates. !my physical changes inthe stormwater system will modify the runoff rates presentedherein.
3. It was assumed that all existing stormwater system components willbe adequately maintained so that their existing flow carryingcapacity will not be diminished.
4. It was assumed that inlet grates are capable of allowingstormwaters to enter the inlets and that manholes and inlets alongpipelines do not restrict flow.
S. The recommended ADMP is based on the land use projectionspresented in the City of Peoria General Land Use Plan, 1982, Cityof Glendale General Plan 1980-2005, and the two supplements:Western Glendale Community Plan and the West Glendale Area Plan.
6. The recommended ADMP is a first step toward orderly stormwatermanagement. Prior to the next step, preliminary designs and fieldsurveys will be needed to verify pipe sizes, elevations, and otherdetails about the overall stormwater system and areas tributary tothe system.
7. Studies in regard to structural adequacy of the existingstormwater facilities and water quality are beyond the scope ofthis ADMP.
13-1
Section Fourteen
14. REFERENCES AND ACKNCWLEDGEMENTS
1. Arthur Beard Engineers, Inc., Cit~ of Pheonix, Arizona, NorthwestStorm Drainage Study, Volume 1, 1 77.
2. Benson & Gerdin Consulting Engineers, Glendale Drainage study, May1983.
3. Camp Dresser & McKee Inc., 5tormwater Management Plan, City ofGlendale, Arizona, January 1986.
4. The City of Glendale Engineering & Development Department, Planningand Zoning Division, City of Glendale General Plan 1980-2005, adoptedAugust 12, 1980.
5. The City of Glendale, Western Glendale Area Plan, (draft), circa 1985.
6. The City of Glendale, Western Glendale Planning Team, Western GlendaleCommunity Plan, adopted September 11, 1984.
7. City of Peoria, Planning and Zoning Department, General Land Use Plan,City of Peoria, Arizona, December, 1982.
8. The City of Peoria, Public Works Department, preliminary DesignReport, Peoria Avenue Storm Sewer, Project 55-8301, June 1983.
9. City of Phoenix, Engineering Department, Storm Drain Design Manual,Storm Drains With Paving of Major Streets, August 1975.
10. Clouse Engineering, Inc., Storm Drain Report for San Miguel Unit Two,May 1983.
11. Engineering Corporation of America, Storm Sewer Study, 43rd Avenue 51st Avenue, Papago Channel - Glendale, for city of Phoenix, May 1971.
12.
13. Henningson, Durham & Richardson, Master Drainage Report for Sun CityPhase II Area, August 1968.
14. Henningson, Durham & Richardson, Master Drainage Report for Sun CityNorth of Bell Road, January 1972.
15. Huber, Wayne C., James P. Heaney, Stephan J. Nix, Robert E. Dickinson,and Donald J. polmann, Storm Water Management Model User's Manual,Version III, Final Draft November 1981, seventh printing October 1983.
16. Maricopa County Flood Control District, Regional Master Plan of stormDrainage, unpublished.
14-1
17. SCS Methods,
.. ,/
18. James M. Montgomery, Consulting Engineers, Inc., City of Peoria,Master Plan of storm Drainage, February 1986 draft.
19. National Oceanic and Atmospheric Administration, NOAA Atlas 2,precipitation-Frequency Atlas of the Western united states, 1973.
20. National OCeanic and Atmospheric Administration, Technical MemorandumNWS Hydro-40, "Depth-Area Ratios in the Semi-Arid Southwest Uni tedStates", August 1984.
21. PCR Toups Corporation, Report on Master Storm Drainage Plan forArrowhead Ranch Department, Inc., January 1980.
22. Poertner, Herbert G., 5tormwater Management in the United states,September 1980 (report for the u.s. Department of the Interior, Officeof water Research and Technology).
23. u.S. Army Corps of Engineers, Hydrologic Engineering Center, HEC-1Flood Hydrograph Package, Davis, California, 1981. -----
24. Gila River Basin,Memorandum No. 2,
25. u.S. Army Engineer District, Los Angeles, Corps of Engineers,Flood-Damage Re~rt on Storm and Flood of 16-17 AUgust 1963,Glendale-Maryvae Area, Near Phoenix, Arizona, June 1964.
26. u.S. Department of Agriculture, Soil Conservation Service, incooperation with university of Arizona, Agricultural ExperimentStation, Soil Survey of Maricopa County, Arizona, Central Part, IssuedSeptember 1977.
27. u.S. Environmental Protection Agency, Storm water Management Model,Version 111.3, August 1983.
28. u.S. Environmental Protection Agency, Storm Water Management Model,User's Manual, Version III, May 1984.
29. u.S. Federal Emergency Management Agency, Federal InsuranceAdministration, Flood Insurance Study, City of Glendale, Arizona,Maricopa County, septei1iber 1981.
30. Yost and Gardner Engineers, Storm Drainage Report for MaricopaAssociation of Governments, 1970.
14-2
j
ACKNCMLEDGEMENTS
The guidance and support by the members of the Technical Review Conuni tteeis appreciated and gratefully acknowledged.
Kebba Buckley
Kenneth ReedyRonald ReimerEldon JohansenTimothy Phillips
project Engineer, Flood ControlDistrict of Maricopa County
City Engineer, GlendaleCivil Engineer III, GlendaleCity Engineer, PeoriaSenior Engineer, Salt River project
14-3

Appendix A
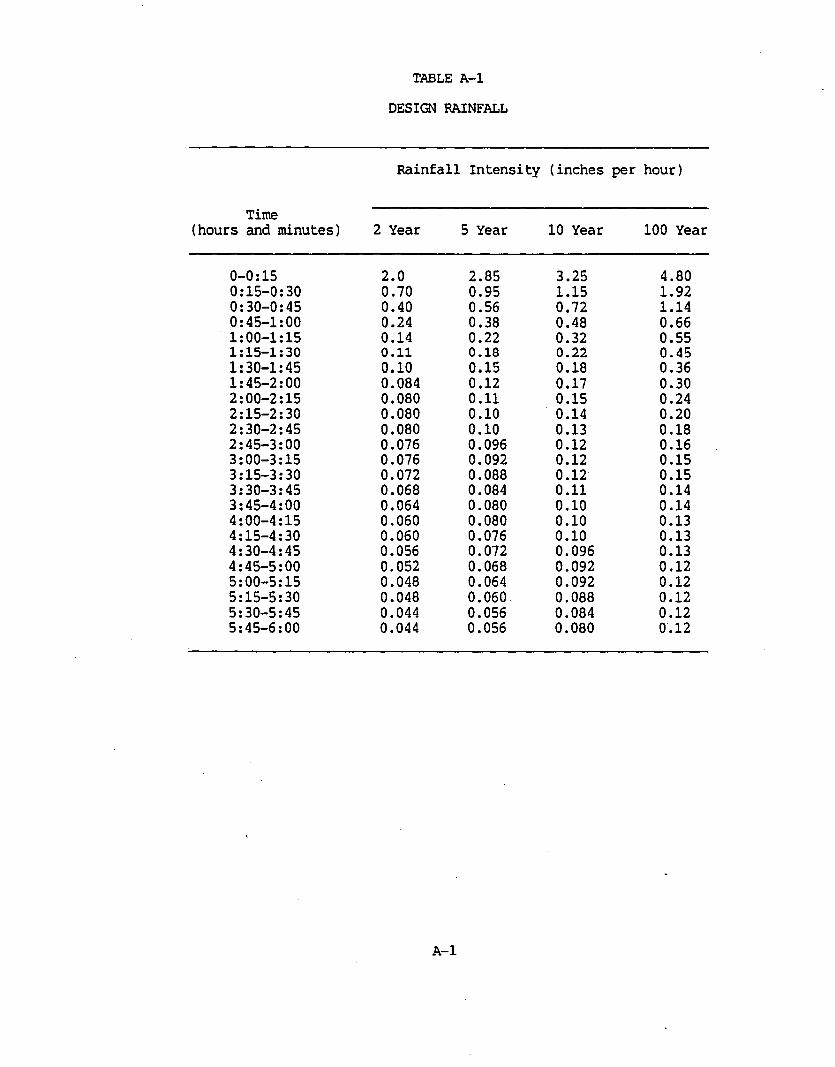
TABLE A-1
DESIGN RAINFALL
Rainfall Intensity (inches per hour)
Time(hours and minutes) 2 Year 5 Year 10 Year 100 Year
0-0:15 2.0 2.85 3.25 4.800:15-0:30 0.70 0.95 1.15 1.920:30-0:45 0.40 0.56 0.72 1.140:45-1:00 0.24 0.38 0.48 0.661:00-1:15 0.14 0.22 0.32 0.551:15-1:30 0.11 0.18 0.22 0.451:30-1:45 0.10 0.15 0.18 0.361:45-2:00 0.084 0.12 0.17 0.302:00-2:15 0.080 0.11 0.15 0.242:15-2:30 0.080 0.10 0.14 0.202:30-2:45 0.080 0.10 0.13 0.182:45-3:00 0.076 0.096 0.12 0.163:00-3:15 0.076 0.092 0.12 0.153:15-3:30 0.072 0.088 0.12 0.153:30-3:45 0.068 0.084 0.11 0.143:45-4:00 0.064 0.080 0.10 0.144:00-4:15 0.060 0.080 0.10 0.134:15-4:30 0.060 0.076 0.10 0.134:30-4:45 0.056 0.072 0.096 0.134:45-5:00 0.052 0.068 0.092 0.125:00-5:15 0.048 0.064 0.092 0.125:15-5:30 0.048 0.060 0.088 0.125:30-5:45 0.044 0.056 0.084 0.125:45-6:00 0.044 0.056 0.080 0.12
A-1
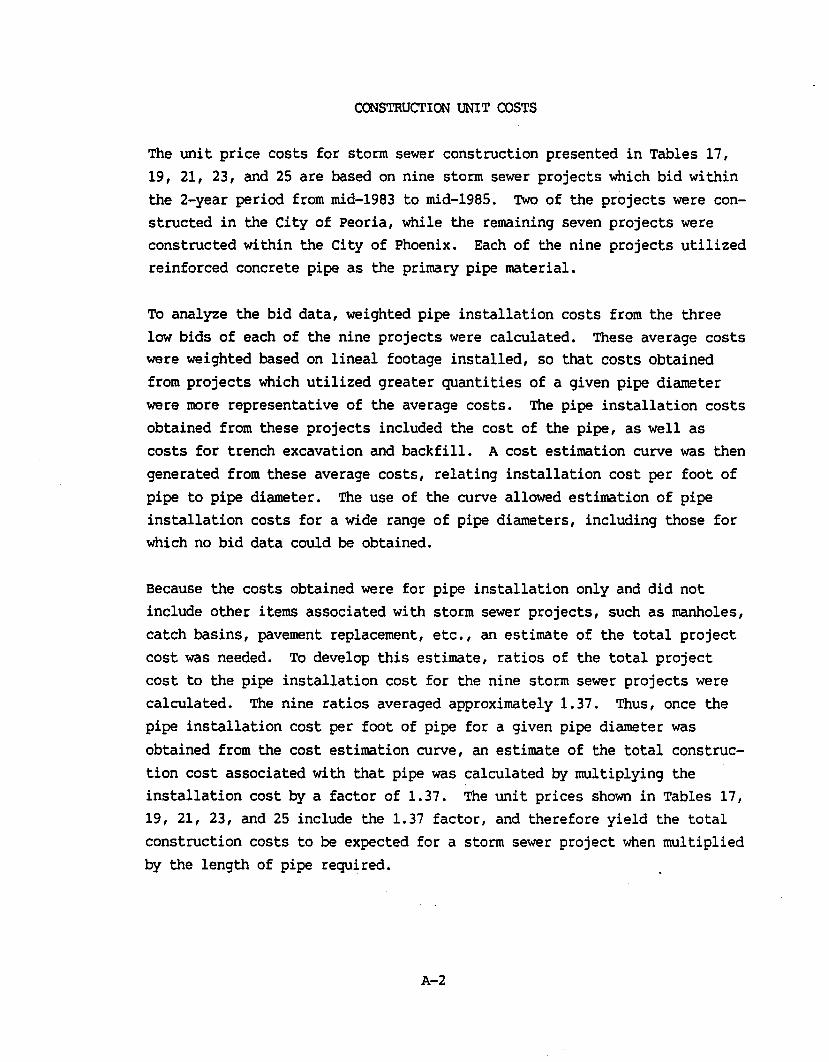
CONSTRUCTION UNIT COSTS
The unit price costs for storm sewer construction presented in Tables 17,19, 21, 23, and 25 are based on nine storm sewer projects which bid withinthe 2-year period from mid-1983 to mid-1985. Two of the projects were constructed in the City of Peoria, while the remaining seven projects wereconstructed within the City of Phoenix. Each of the nine projects utilizedreinforced concrete pipe as the primary pipe material.
To analyze the bid data, weighted pipe installation costs from the threelow bids of each of the nine projects were calculated. These average costswere weighted based on lineal footage installed, so that costs obtainedfrom projects which utilized greater quantities of a given pipe diameterwere more representative of the average costs. The pipe installation costsobtained from these projects included the cost of the pipe, as well ascosts for trench excavation and backfill. A cost estimation curve was thengenerated from these average costs, relating installation cost per foot ofpipe to pipe diameter. The use of the curve allowed estimation of pipeinstallation costs for a wide range of pipe diameters, including those forwhich no bid data could be obtained.
Because the costs obtained were for pipe installation only and did notinclude other items associated with storm sewer projects, such as manholes,catch basins, pavement replacement, etc., an estimate of the total projectcost was needed. To develop this estimate, ratios of the total projectcost to the pipe installation cost for the nine storm sewer projects werecalculated. The nine ratios averaged approximately 1.37. Thus, once thepipe installation cost per foot of pipe for a given pipe diameter was
obtained from the cost estimation curve, an estimate of the total construction cost associated with that pipe was calculated by multiplying theinstallation cost by a factor of 1.37. The unit prices shown in Tables 17,19, 21, 23, and 25 include the 1.37 factor, and therefore yield the totalconstruction costs to be expected for a storm sewer project when multipliedby the length of pipe required.
A-2
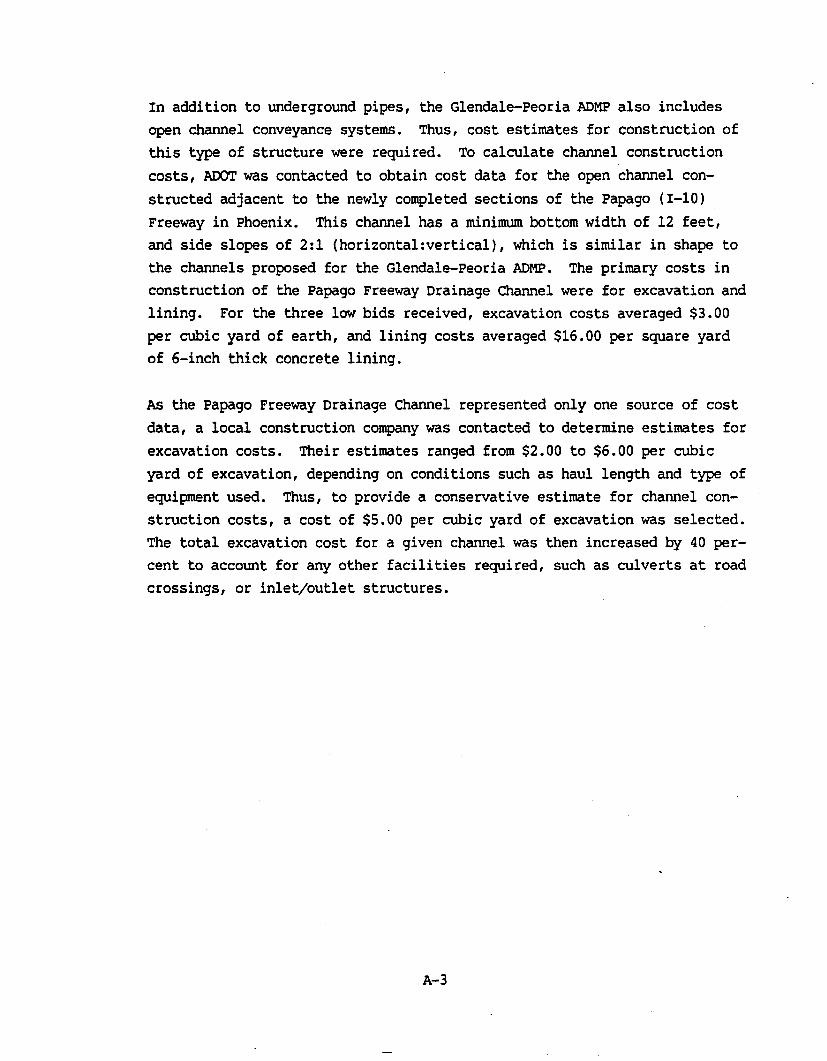
In addition to underground pipes, the Glendale-Peoria ADMP also includesopen channel conveyance systems. Thus, cost estimates for construction ofthis type of structure were required. To calculate channel constructioncosts, ADOT was contacted to obtain cost data for the open channel constructed adjacent to the newly completed sections of the papago (I-lO)Freeway in Phoenix. This channel has a minimum bottom width of 12 feet,and side slopes of 2:1 (horizontal:vertical), which is similar in shape tothe channels proposed for the Glendale-Peoria ADMP. The primary costs inconstruction of the Papago Freeway Drainage Channel were for excavation andlining. For the three low bids received, excavation costs averaged $3.00per cubic yard of earth, and lining costs averaged $16.00 per square yardof 6-inch thick concrete lining.
As the papago Freeway Drainage Channel represented only one source of costdata, a local construction company was contacted to determine estimates forexcavation costs. Their estimates ranged from $2.00 to $6.00 per cubicyard of excavation, depending on conditions such as haul length and type ofequipment used. Thus, to provide a conservative estimate for channel construction costs, a cost of $5.00 per cubic yard of excavation was selected.The total excavation cost for a given channel was then increased by 40 percent to account for any other facilities required, such as culverts at roadcrossings, or inlet/outlet structures.
~3
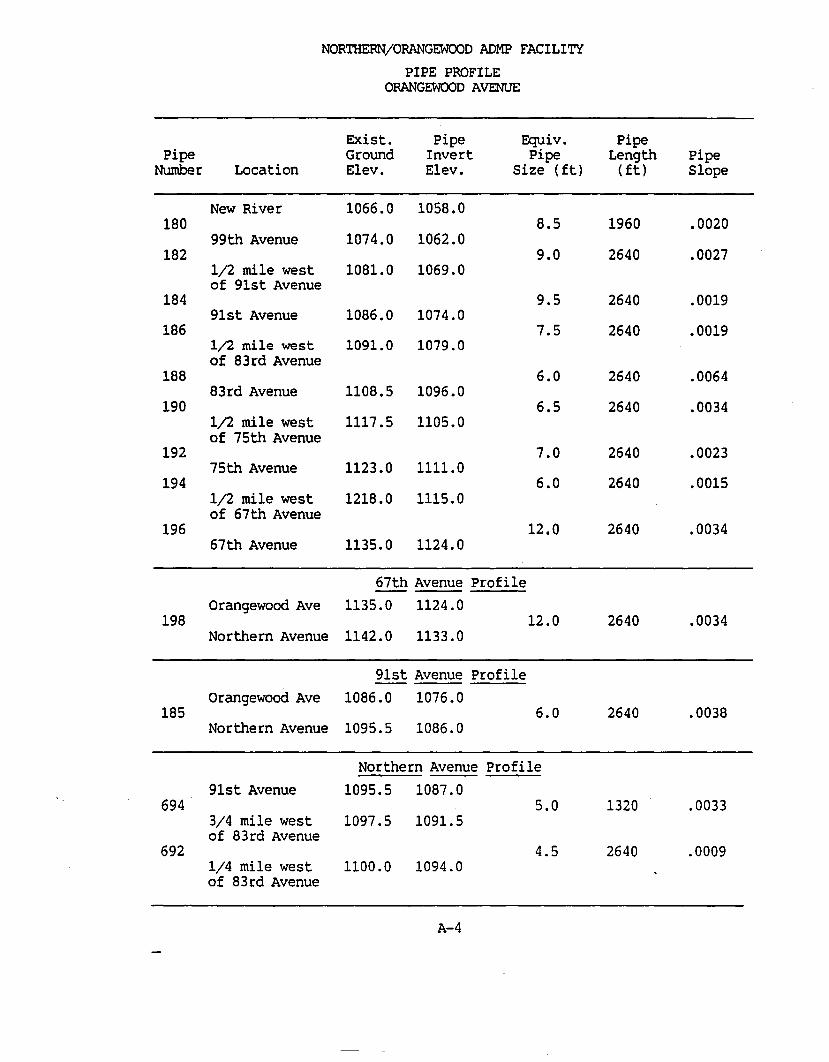
NORTHERN/ORANGEWOOD ADMP FACILITY
PIPE PROFILEORANGEWOOD AVENUE
Exist. Pipe Equiv. PipePipe Ground Invert Pipe Length Pipe
Number Location Elev. Elev. Size (ft) (ft) Slope
New River 1066.0 1058.0180 8.5 1960 .0020
99th Avenue 1074.0 1062.0182 9.0 2640 .0027
1;2 mile west 1081.0 1069.0of 91st Avenue
184 9.5 2640 .001991st Avenue 1086.0 1074.0
186 7.5 2640 .00191;2 mile west 1091.0 1079.0of 83rd Avenue
188 6.0 2640 .006483rd Avenue 1108.5 1096.0
190 6.5 2640 .00341;2 mile west 1117.5 1105.0of 75th Avenue
192 7.0 2640 .002375th Avenue 1123.0 1111.0
194 6.0 2640 .00151;2 mile west 1218.0 1115.0of 67th Avenue
196 12.0 2640 .003467th Avenue 1135.0 1124.0
67th Avenue ProfileOrangewood Ave 1135.0 1124.0
198 12.0 2640 .0034Northern Avenue 1142.0 1133.0
91st Avenue ProfileOrangewood Ave 1086.0 1076.0
185 6.0 2640 .0038Northern Avenue 1095.5 1086.0
Northern Avenue Profile91st Avenue 1095.5 1087.0
694 5.0 1320 .00333/4 mile west 1097.5 1091. 5of 83rd Avenue
692 4.5 2640 .00091/4 mile west 1100.0 1094.0of 83rd Avenue
A-4
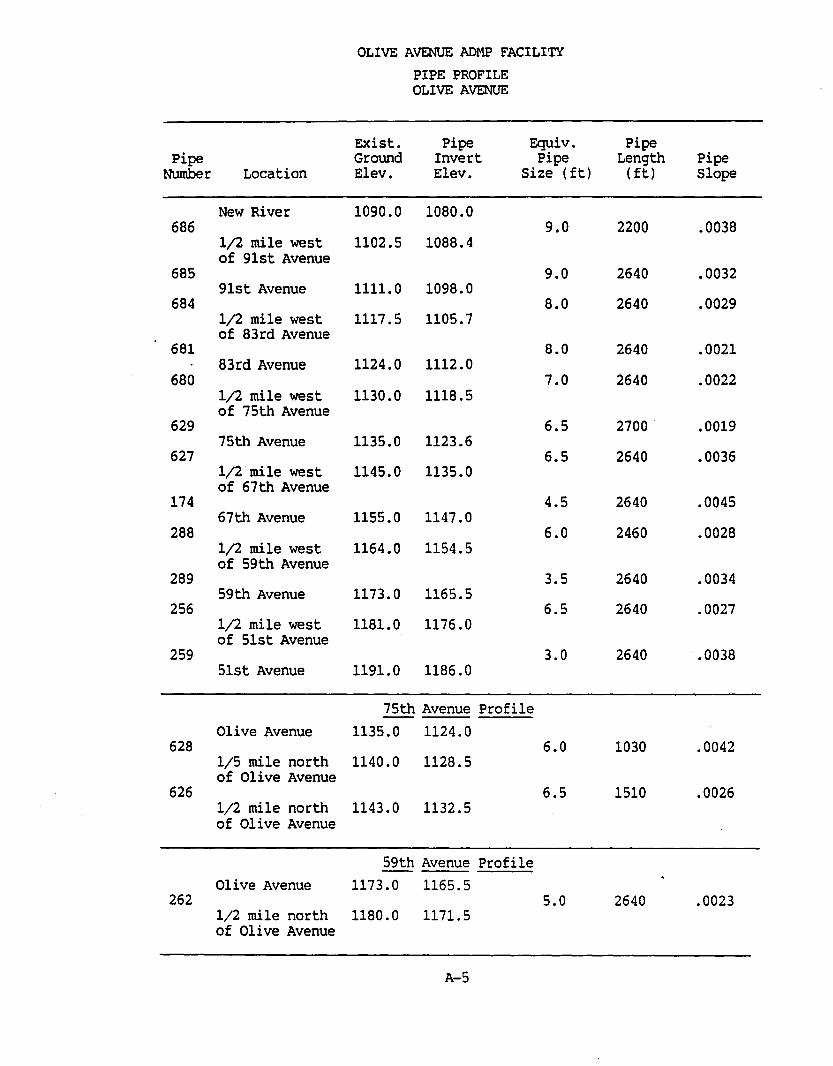
OLIVE AVENUE ADMP FACILITYPIPE PROFILEOLIVE AVENUE
Exist. Pipe Equiv. PipePipe Ground Invert Pipe Length Pipe
Number Location Elev. Elev. Size (ft) (ft) Slope
New River 1090.0 1080.0686 9.0 2200 .0038
1;2 mile west 1102.5 1088.4of 91st Avenue
685 9.0 2640 .003291st Avenue 1111.0 1098.0
684 8.0 2640 .00291;2 mile west 1117.5 1105.7of 83rd Avenue
681 8.0 2640 .002183rd Avenue 1124.0 1112.0
680 7.0 2640 .00221;2 mile west 1130.0 1118.5of 75th Avenue
629 6.5 2700 .001975th Avenue 1135.0 1123.6
627 6.5 2640 .00361/2 mile west 1145.0 1135.0of 67th Avenue
174 4.5 2640 .004567th Avenue 1155.0 1147.0
288 6.0 2460 .00281;2 mile west 1164.0 1154.5of 59th Avenue
289 3.5 2640 .003459th Avenue 1173.0 1165.5
256 6.5 2640 .00271/2 mile west 1181.0 1176.0of 51st Avenue
259 3.0 2640 .003851st Avenue 1191.0 1186.0
75th Avenue ProfileOlive Avenue 1135.0 1124.0
628 6.0 1030 .00421/5 mile north 1140.0 1128.5of Olive Avenue
626 6.5 1510 .00261;2 mile north 1143.0 1132.5of Olive Avenue
59th Avenue ProfileOlive Avenue 1173.0 1165.5
262 5.0 2640 .00231/2 mile north 1180.0 1171.5of Olive Avenue
A-5
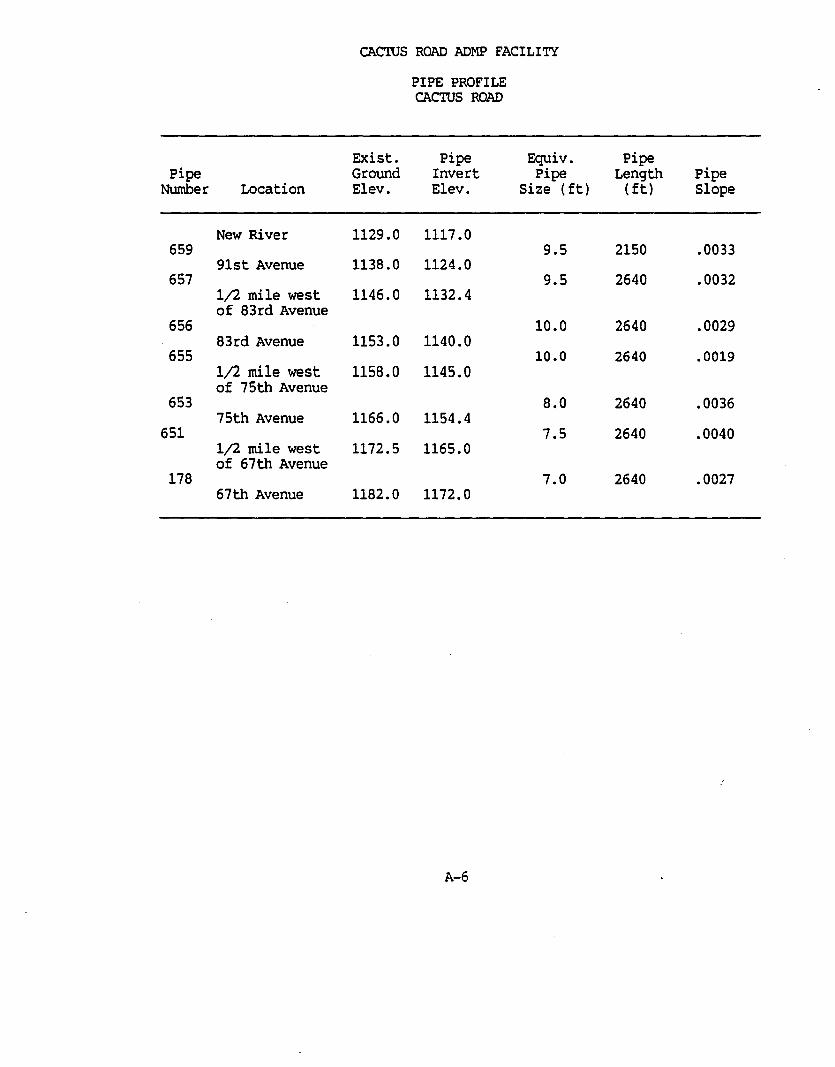
CACIUS ROAD ADMP FACILITY
PIPE PROFILECACIUS ROAD
Exist. Pipe Equiv. PipePipe Ground Invert Pipe Length Pipe
Number Location Elev. Elev. Size (ft) (ft) Slope
New River 1129.0 1117 .0659 9.5 2150 .0033
91st Avenue 1138.0 1124.0657 9.5 2640 .0032
1/2 mile west 1146.0 1132.4of 83rd Avenue
656 10.0 2640 .002983rd Avenue 1153.0 1140.0
655 10.0 2640 .00191;2 mile west 1158.0 1145.0of 75th Avenue
653 8.0 2640 .003675th Avenue 1166.0 1154.4
651 7.5 2640 .00401/2 mile west 1172.5 1165.0of 67th Avenue
178 7.0 2640 .002767th Avenue 1182.0 1172.0
A-6


![Loop drainage after debridement ... - Peoria Surgical Groupof loop drainage of abscesses as described by Tsoraides et al. [3] in the pediatric population. Maintaining the principles](https://img.pdfslide.us/doc/110x75/5eaf8180dcaab976cf3cd76c/loop-drainage-after-debridement-peoria-surgical-of-loop-drainage-of-abscesses.jpg)