Embed Size (px)
Citation preview

Methods to Sample E. coli in Foreshore Sand and Pore Water
Great Lakes Beach Association MeetingOctober 29, 2015
Laura VogelTom EdgeDenis O’CarrollClare Robinson
Department Name Here

Presentation Title Here
Introduction
• E. coli is often orders of magnitude higher in sand/porewater near the shoreline than shallow lake waters
� Acts as non-point source for contaminating lake water• Health units do not currently sample the foreshore reservoir
� “Sampling for microorganisms in sand should… be considered for inclusion
in regulatory programmes aimed at protecting recreational beach users
from infectious disease” (Solo-Gabriele et al. 2015)
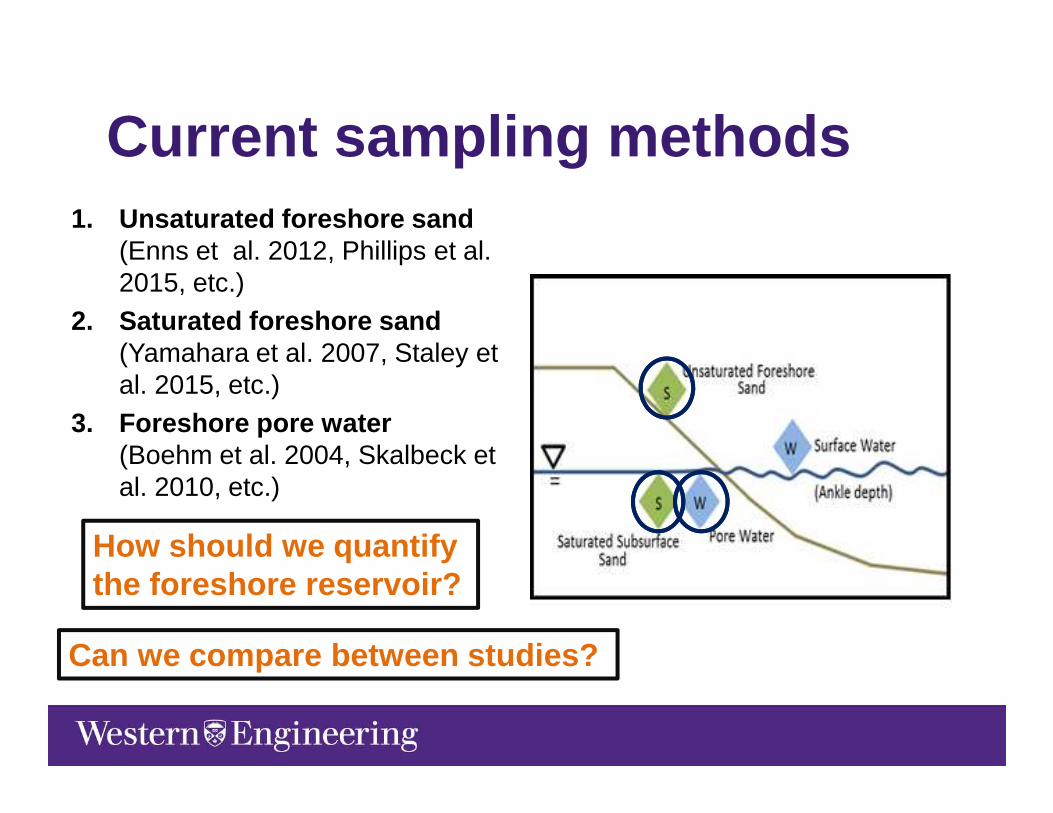
Current sampling methods1. Unsaturated foreshore sand
(Enns et al. 2012, Phillips et al. 2015, etc.)
2. Saturated foreshore sand (Yamahara et al. 2007, Staley et al. 2015, etc.)
3. Foreshore pore water (Boehm et al. 2004, Skalbeck et al. 2010, etc.)
Can we compare between studies?
How should we quantify the foreshore reservoir?
Objectives
Presentation Title Here
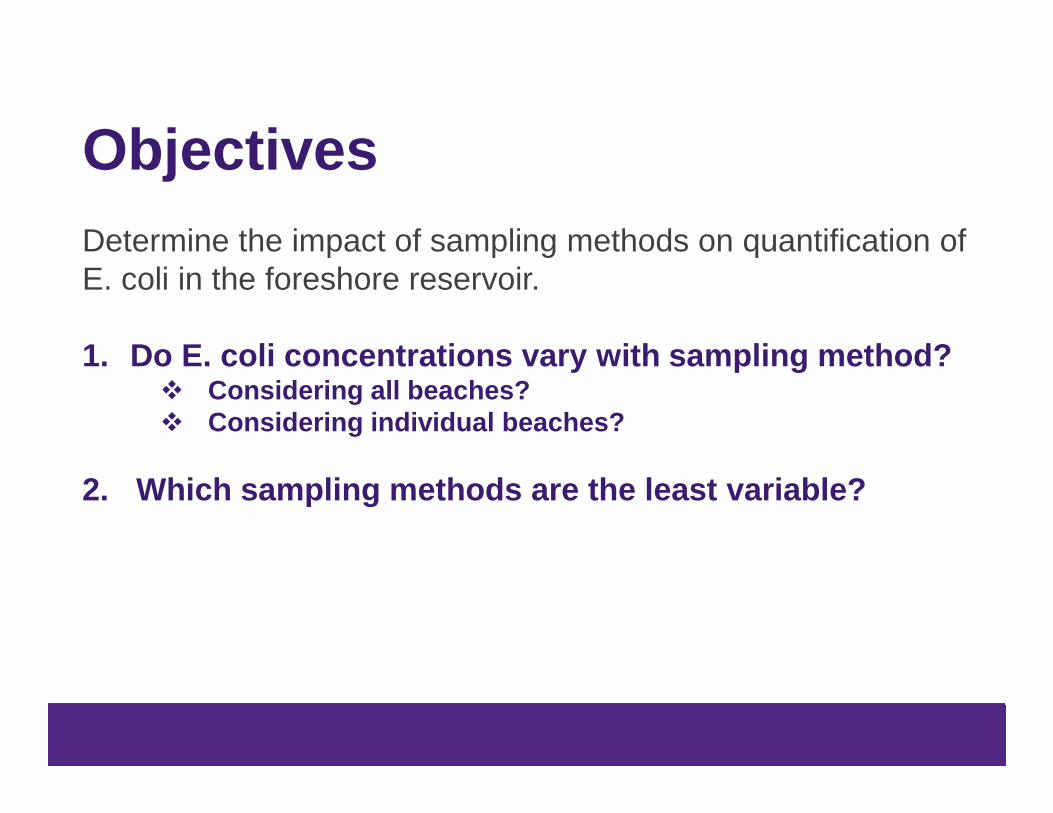
Determine the impact of sampling methods on quantification of E. coli in the foreshore reservoir.
1. Do E. coli concentrations vary with sampling method?� Considering all beaches?� Considering individual beaches?
2. Which sampling methods are the least variable?

Ipperwash Beach
Bayfront Park Beach, Hamilton ON
Burlington Beach, Burlington ON
Bronte Beach, Oakville ON
Marie Curtis Beach,
Etobicoke ON
Sunnyside Beach,
Toronto ON
Study Sites
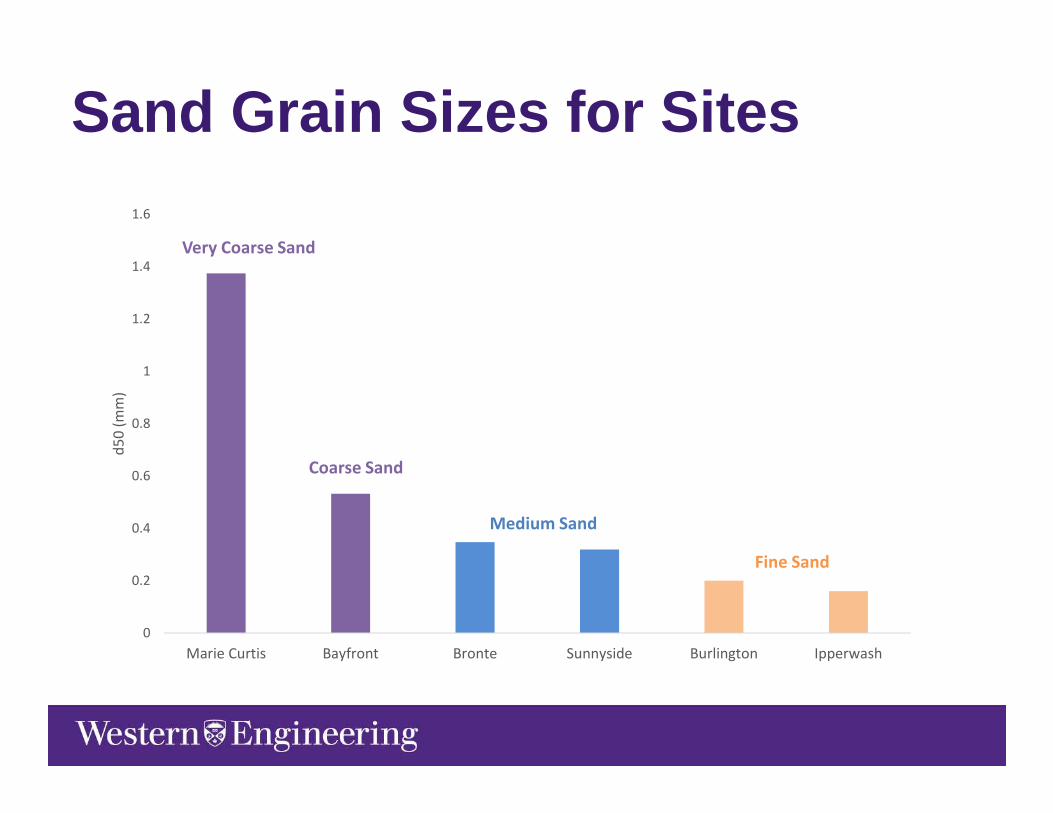
0
0.2
0.4
0.6
0.8
1
1.2
1.4
1.6
Marie Curtis Bayfront Bronte Sunnyside Burlington Ipperwash
d5
0 (
mm
)Sand Grain Sizes for Sites
Coarse Sand
Medium Sand
Fine Sand
Very Coarse Sand
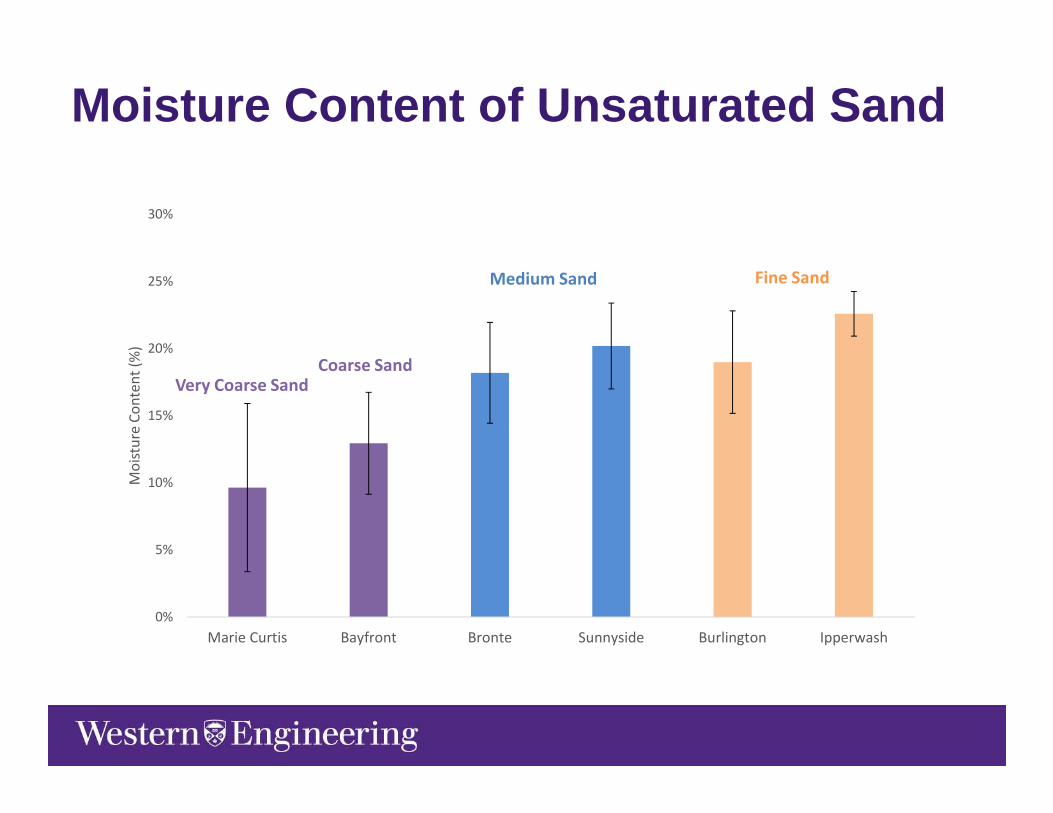
Moisture Content of Unsaturated Sand
0%
5%
10%
15%
20%
25%
30%
Marie Curtis Bayfront Bronte Sunnyside Burlington Ipperwash
Mo
istu
re C
on
ten
t (%
)
Very Coarse SandCoarse Sand
Medium Sand Fine Sand

Organic Content (%)
0%
10%
20%
30%
40%
Marie Curtis Bayfront Bronte Sunnyside Burlington Ipperwash
Org
an
ic M
att
er
(%)
Unsaturated
Saturated

Current sampling methods

Presentation Title Here
Methods SamplingSurface Water

Presentation Title Here
Methods Sampling – pore waterShovel
1 2 3
Careful Excavation Drive Point

Presentation Title Here
Methods Sampling – unsaturated sand
Unsaturated Sand A Unsaturated Sand B
~ 1 cm ~ 5 cm

Methods Sampling – saturated sand
Shovel
1 2 3
5 cm above and below water table
Careful Excavation Core
Do E. coli concentrations vary with sampling method?Considering data for individual beaches

Pore Water Methods0
1
2
3
4
Bayfront Park Marie Curtis Bronte Sunnyside Burlington Ipperwash
Ra
nk Shovel
Careful Excavation
Drive Point
n = 13 12 12 12 13 16
for each bar
Drive point method resulted in lower concentrations for all beaches except
Bayfront Park.

Too variable. No significant results.
0
1
2
3
4
Bayfront Park Marie Curtis Bronte Sunnyside Burlington Ipperwash
Ra
nk Shovel
Careful Excavation
Core
n = 13 12 12 12 13 16
for each bar
Saturated Sand Methods

• Standardized by volume (CFU/cm3)
• Using shovel, careful extraction, and core releases (in order) more E. coli from sand
resulting in lower % amount in sand and higher % amount in porewater
E. coli distribution
Do E. coli concentrations vary with sampling method?Considering data for all beaches

p-values Shovel Careful
Excavation
Shovel -- --
Careful
Excavation
0.2990 --
Drive Point 0.0029 0.0538
Shovel and careful
extraction methods
results in higher pore
water concentrations
than drive point.
Comparing methods – Pore water
N Median
(CFU/100mL)
Shovel 78 3300
Careful
Excavation
78 960
Drive Point 78 510

• Unsaturated sand A had
statistically higher concentrations
than unsaturated sand B
(p=0.0041)
• Unsaturated sand A had
statistically more variable
concentrations than unsaturated
sand B (p=0.014)
Comparing methods –uuuu unsaturated sand
~ 1 cm
~ 5 cm
A
B

N Median (CFU/g)
Shovel 78 20.1
Careful Excavation 78 20.6
Core 78 21.9
Unsaturated 78 376.7
No significant difference between saturated sand
collection methods.
Unsaturated sand was significantly higher than all
saturated sand methods.
Comparing methods - Saturated sand
p-values Careful
Excavation
Core Unsaturated
Shovel 0.8593 0.1342 0.0000
Careful
Excavation
0.1652 0.0000
Core 0.0074

Which component of the reservoir is the least variable for sampling?
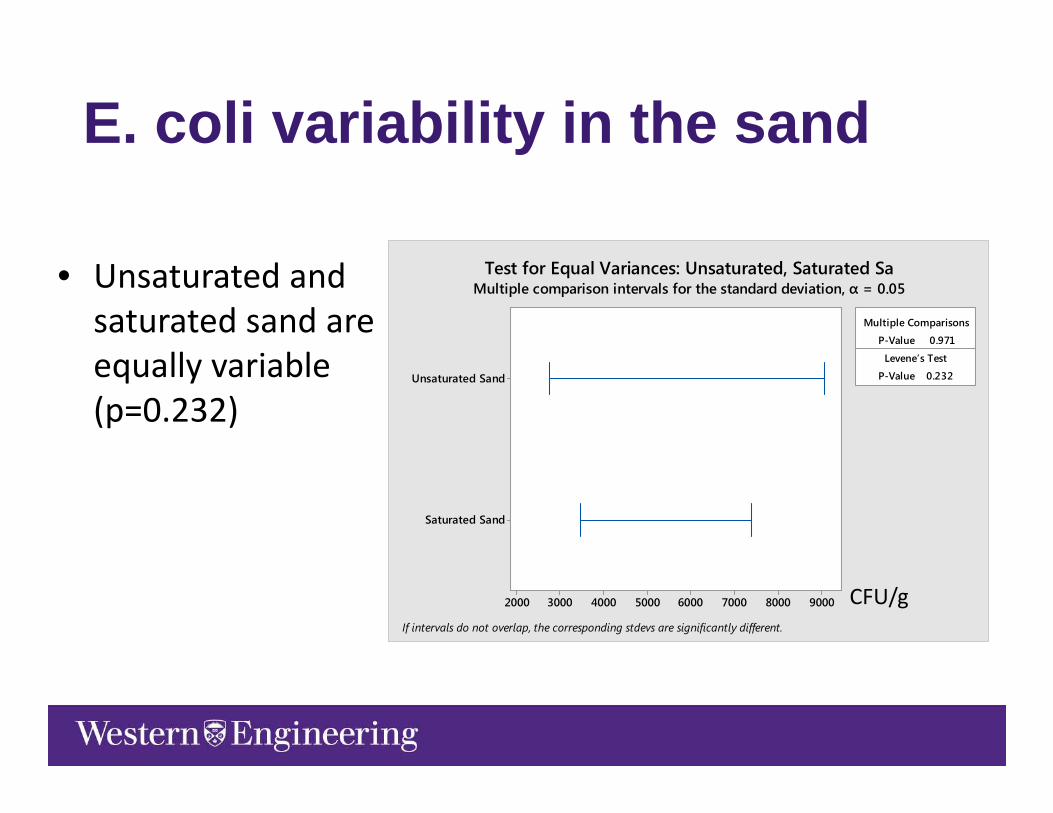
• Unsaturated and
saturated sand are
equally variable
(p=0.232)
Saturated Sand
Unsaturated Sand
90008000700060005000400030002000
P-Value 0.971
P-Value 0.232
Multiple Comparisons
Levene’s Test
Test for Equal Variances: Unsaturated, Saturated SaMultiple comparison intervals for the standard deviation, α = 0.05
If intervals do not overlap, the corresponding stdevs are significantly different.
E. coli variability in the sand
CFU/g
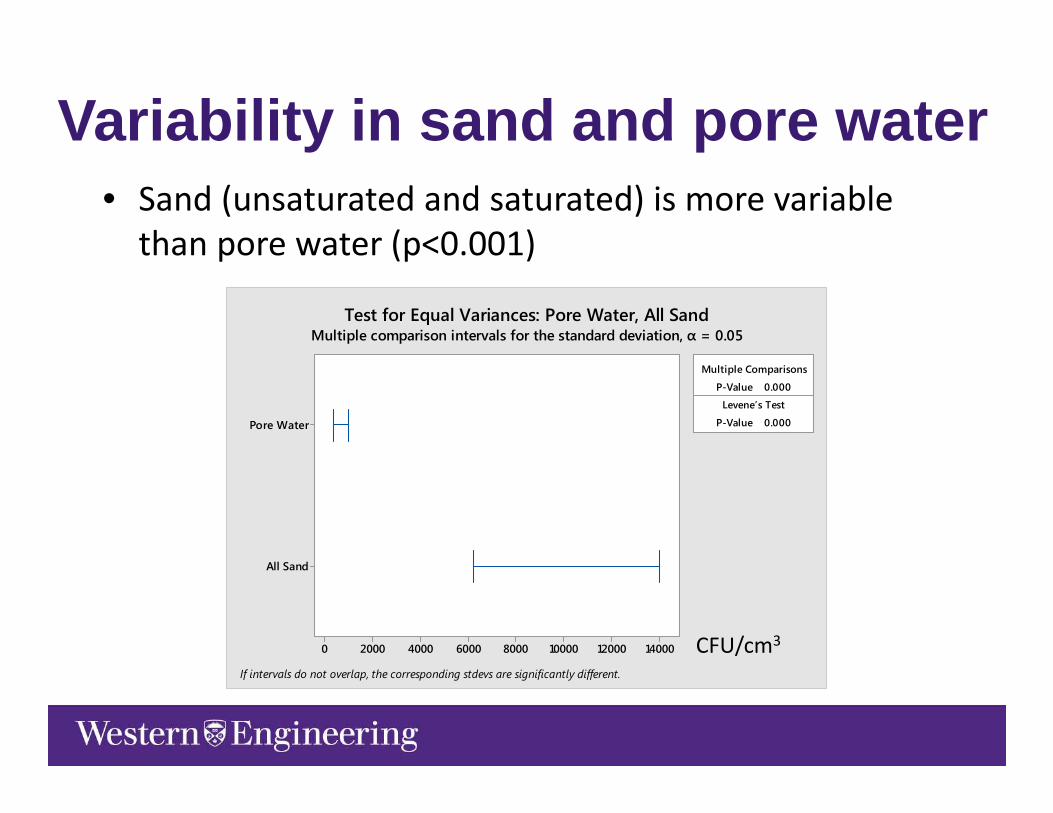
• Sand (unsaturated and saturated) is more variable
than pore water (p<0.001)
All Sand
Pore Water
14000120001000080006000400020000
P-Value 0.000
P-Value 0.000
Multiple Comparisons
Levene’s Test
Test for Equal Variances: Pore Water, All SandMultiple comparison intervals for the standard deviation, α = 0.05
If intervals do not overlap, the corresponding stdevs are significantly different.
CFU/cm3
Variability in sand and pore water

Conclusions
When considering data for individual beaches,
• No statistical difference between E. coli concentrations when comparing sampling methods
• The sampling method used affects the amount of E. Coli released from the sand into the pore water
Presentation Title Here

Conclusions
When considering data for all beaches,
• sampling pore water using a drive point results in lowest observed concentrations
• unsaturated sand has higher concentrations than saturated sand
• the top ~1 cm of unsaturated sand has more E. coli than the top ~5cm
• E. coli concentrations in the sand are more variable than in pore water
Presentation Title Here

Acknowledgements
Presentation Title Here
Supporting organizations: