Embed Size (px)
Citation preview

Gjensidige Insurance Group 4th quarter results 2016
9 February 2017

68.0 70.6
16.0 17.1 84.0 87.7
Q4 2015 Q4 2016Loss ratio Cost ratio
879 700
611 561
1 471 1 306
Q4 2015 Q4 2016
UW-result Financial result Other
• Pre-tax profit NOK 1,306m
• Underwriting result NOK 700m • Combined ratio 87.7%, • 3.5% premium growth • Underlying frequency claims level reflecting a more
normal weather and increased claims inflation • Measures taken to mitigate increased claims
inflation • Good cost control – cost ratio 17.1% (16.0%
adjusted for one-offs)
• Financial result NOK 561m, investment return 1.0%
• 21.4% return on equity*
A solid fourth quarter result
2
NOK m
%
* Annualised, YTD
Pre-tax profit
Combined ratio

A record-strong full-year result - delivering on financial targets
3
• Pre-tax profit NOK 6,140m
• Underwriting result NOK 3,735m • 5.5% premium growth • Underlying frequency claims level slightly less
favourable • Increased level of reserve releases – expected
NOK 900m per year on average next 3-5 years • Good cost control
• Financial result NOK 2,155m, return 3.9%
• Earnings per share NOK 9.34
• Proposed dividend NOK 3,400m or NOK 6.80 per share
Delivered 2016 Target
Return on equity 21.4% >15%
Combined ratio
83.4% 84.6% (adj*) 86-89% **
Cost ratio 14.2% 15.5% (adj*) ~15%
Dividends Nominal ~ +6% Payout ratio ~73%
Nominal high and stable,
>70%
*Adjusted for one-offs **Combined ratio target on an undiscounted basis, assuming ~4 pp run-off gains next 3-5 years and normalised large losses impact. Beyond the next 3-5 years, the target is 90-93 given 0 pp run-off.
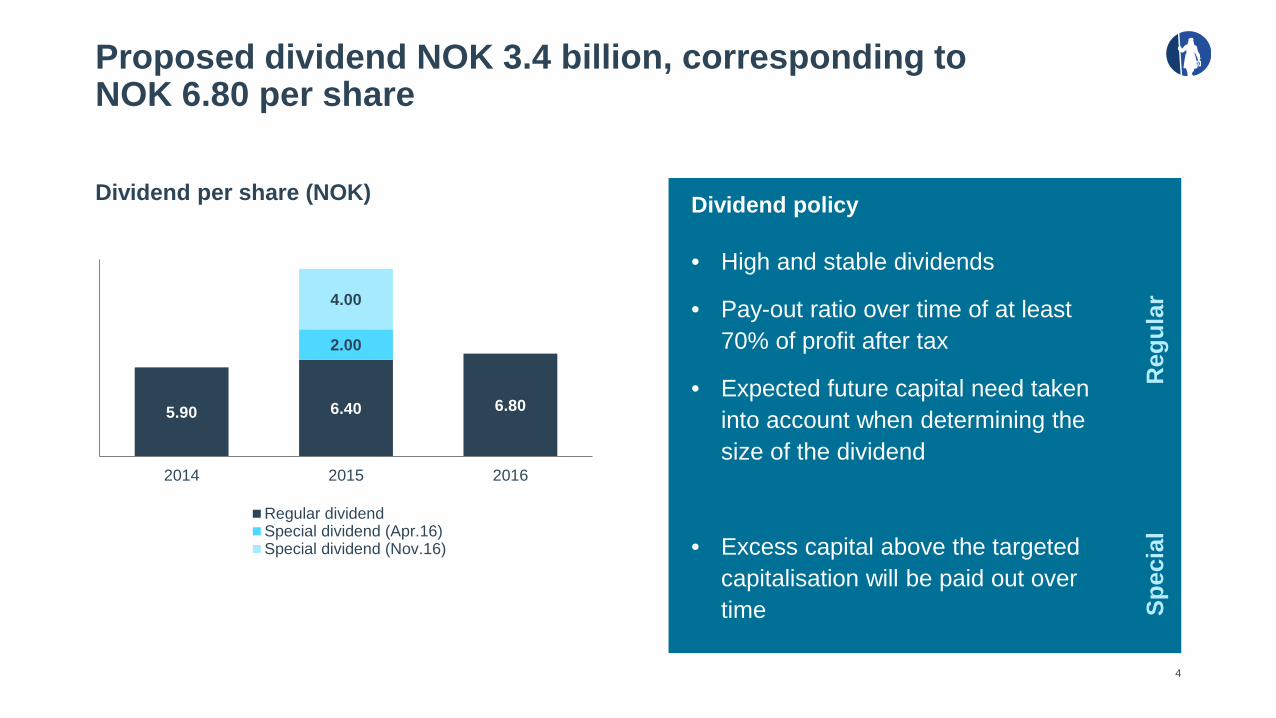
Dividend policy
• High and stable dividends
• Pay-out ratio over time of at least 70% of profit after tax
• Expected future capital need taken into account when determining the size of the dividend
• Excess capital above the targeted capitalisation will be paid out over time
Proposed dividend NOK 3.4 billion, corresponding to NOK 6.80 per share
4
5.90 6.40 6.80
2.00
4.00
2014 2015 2016
Regular dividendSpecial dividend (Apr.16)Special dividend (Nov.16)
Dividend per share (NOK)
Reg
ular
Sp
ecia
l

Delivering on strategy and operational targets
Status key performance indicators**
5 *Based on premiums and currency exchange rates 30.09.2016 ** Targets communicated at Capital Markets Day 25 November 2014 ***Private Norway
Number 2 position pan-Nordic*
Strengthened # 1 position
On track for profitability during 2017
On track for profitability in 2018 Strengthened
platform for growth
KPIs CSI
Digital customers***
Claims reported online***
Claims cost reductions
Customer retention
Customers with > 4 GI products
2014 73.6 54% 26%
2015 76.2 60% 46% On track Maintained Maintained
2016 77.4 65% 52% On track Maintained Maintained
Target 2018 77.0 75% >50% NOK
400m-500m Maintain
high Maintain

• Mølholm Forsikring A/S • Premium volume DKK ~ 400m • Market share ~18% • Total market share increases
to ~7.4% • Closing expected in Q217
• Increased penetration in a growing housing market - new product packages launched - all product
lines - leading position in change of ownership
insurance
• Direct access to 45% of housing market
• Car importer Interdan A/S - Citroën, Peugeot, Mitsubishi
• Doubling direct access to market for new cars from 17% to 34%
Strengthened platform for growth in Denmark
Acquired #1 health insurance position Strengthened position for house insurance
New partner agreement motor insurance New strategic partner agreement
6
• Dansk Supermarked Group - Largest retailer in Denmark
• Innovative product solutions - High digital ambitions
• Loyalty concepts in Private market and conseptual products

Financial performance

Weather wise a more normal fourth quarter - another year with favourable weather overall
8
NOK m Q4 2016 Q4 2015 YTD 2016 YTD 2015
Private 550 639 2 197 2 208
Commercial 382 403 1 631 1 441
Nordic 20 66 247 509
Baltics (37) (64) (100) (99)
Corporate Centre/costs related to owner (128) (102) (11) (332)
Corporate Centre/reinsurance (87) (62) (231) (270)
Underwriting result 700 879 3 735 3 457
Pension and savings 29 23 125 84
Retail Bank 94 83 428 304
Financial result from the investment portfolio 561 611 2 155 1 492
Amortisation and impairment losses of excess value (60) (83) (254) (210)
Other items (19) (43) (49) (78)
Profit/(loss) before tax expenses 1 306 1 471 6 140 5 050

Loss ratio 70.6 per cent - reflecting more normal weather and increased claims inflation
Loss ratio development Q4 2015 – Q4 2016 Key drivers - underlying change loss ratio
9
• More normal weather - Motor and property products in particular affected
• Motor generally weaker than expected - Quarterly randomness/ volatility
- Higher underlying frequency claims inflation than anticipated
- Measures taken to mitigate higher expected claims inflation going forward
• Higher claims inflation in Denmark - Property and agriculture in particular
- Unusually high frequency of mid-sized property claims
- Measures taken to improve profitability
6642.5 % 6509.2 % 6509.2 %
1.6 1.3 68.0 (5.5) 70.6
Q4 2015 Change in largelosses
Change in run off Underlyingchange
Q4 2016

Good premium growth of 3.5 per cent
Premium development Q4 2015 – Q4 2016
Key drivers - premium development
10 * CC = corporate centre
NOK m • Private +3.7% - Underlying +1.7% , portfolio moved from Nordic
- Property, leisure and A&H
• Commercial +2.3% - New business initiatives
- A&H still soft
• Nordic +10.8% - Underlying +5.9% - Commercial property Denmark and private insurance
Sweden
• Baltics -0.5%
• CC mainly driven by reinsurance Vardia
5 686 (1) (72)
5 494 75 40 151
Q4
2015
Priv
ate
Com
mer
cial
Nor
dic
Bal
tics
CC
*
Q4
2016

Continued good cost control - increase due to acquisition and one-off
Cost development Q4 2015 – Q4 2016
Key drivers - cost development
11 * CC = corporate centre
NOK m • Nordic: Increase due to Vardia
• CC: increase in provision for restructuring costs and payroll tax, totalling NOK 64m
• Cost ratio 15.0% adjusted for one-offs and excluding the Baltics - Reported cost ratio 17.1%, 16.0% adjusted for one-offs
971 880 12 9 35 5
31
Q4
2015
Priv
ate
Com
mer
cial
Nor
dic
Bal
tics
CC
*
Q4
2016

Large losses lower than expected - NOK 75m related to the storm Urd
Large losses – reported vs expected Large losses per segment
12
NOK m NOK m
* CC = corporate center. Large losses: Losses > NOK 10m. Weather related large losses are included. Large losses in excess of NOK 30.0m are. charged to the Corporate Centre while up to NOK 30m per claim is charged to the segment in which the large loss occurred. The Baltics segment has, as a main rule, a retention level of EUR 0.5m
11
84
49
0
118
21
103
10 0
48
Private Commercial Nordic Baltics CC*
Q4 2015 Q4 2016
261
182
283
318
Q4 2015 Q4 2016
Reported Expected

Impact of 5.5 percentage points from run-off gains
Run-off net Run-off net per segment
13
NOK m NOK m
* CC = corporate center
231
314
Q4 2015 Q4 2016
126
99
29
-23
0
144 137
61
-2
-26 Private Commercial Nordic Baltics CC*
Q4 2015 Q4 2016

10%
32%
23%
8%
7%
2% 2% 5%
2% 6%
3%
Money marketBonds at amortised costCurrent bondsMoney marketOther bondsHigh Yield bondsConvertible bondsCurrent equitiesPE fundsPropertyOther
Investment return of 1.0 per cent
Investment return (%) Portfolio mix as at 31.12.2016
14
Free portfolio NOK 18.9bn
Match portfolio NOK 35.1bn
Investment return, free portfolio Q4 2016 %
Fixed income 0.1
Current equities 8.1
PE funds (1.9)
Property 3.7
Total free portfolio 1.6
-2.0 %
-1.0 %
0.0 %
1.0 %
2.0 %
Q4 2015
Q1 2016
Q2 2016
Q3 2016
Q4 2016
Match portfolio Free portfolio Total Portfolio

Gjensidige Bank is a retention tool towards private insurance customers in Norway
Solid growth and profitability development Supporting Private segment value creation
Quarterly pre-tax profit
15
49 78 86
57 83 79
116
139
94
Q42014
Q12015
Q22015
Q32015
Q42015
Q12016
Q22016
Q32016
Q42016
• 76% of lending volume to general insurance customers
• Important add-on for affinity groups • Catalyst for strengthening position in
insurance market for new cars
NOKm
Secured (mortgage)
82%
Secured (car
finance) 9%
Unsecured* 9%
NOK 41bn lending portfolio of high quality
*Unsecured: Consumer Loans, Credit Cards and Overdraft facility
-116 -85 67 113
191 254 304 429
2.0
11.7
2007 2008 2009 2010 2011 2012 2013 2014 2015 2016
Pre-tax profit ROE (RHS)
NOKm %

Strong capital position - continued capital discipline
Strong capital position
16 Figures as at 31.12.2016. The Solvency II regulation is principle based. Calculations are based on Gjensidige’s understanding of the Solvency II regulation and how it is implemented in Norway, including the current view of the Norwegian FSA on the guarantee provision. The figures related to the S&P rating model are based on Gjensidige’s interpretations of the model. The figures are adjusted for proposed dividend of NOK 3.4bn.
Capital discipline
• Capital buffers well within risk appetite - Adjusted for proposed dividend of NOK 3.4bn
• Expected capital effect of ~NOK 400m from the acquisition of Mølholm Forsikring - Adjusted S&P strategic buffer NOK 0.9bn
• Solvency margins 183% (PIM) and 150% (SF) when including guarantee scheme
• PIM approval expected in 2017
13.9 11.5 13.9
1.3 9.2 6.5 3.4
3.4 3.4
0
5
10
15
20
25
S&P ratingmodel (GI)
Partial InternalModel (Group)
Standard Formula(Group)
Capital available (NOK bn)
Proposed dividend Capital > Capital requirement Capital requirement
109% 147% 180%
Solvency margin adjusted for proposed dividend:
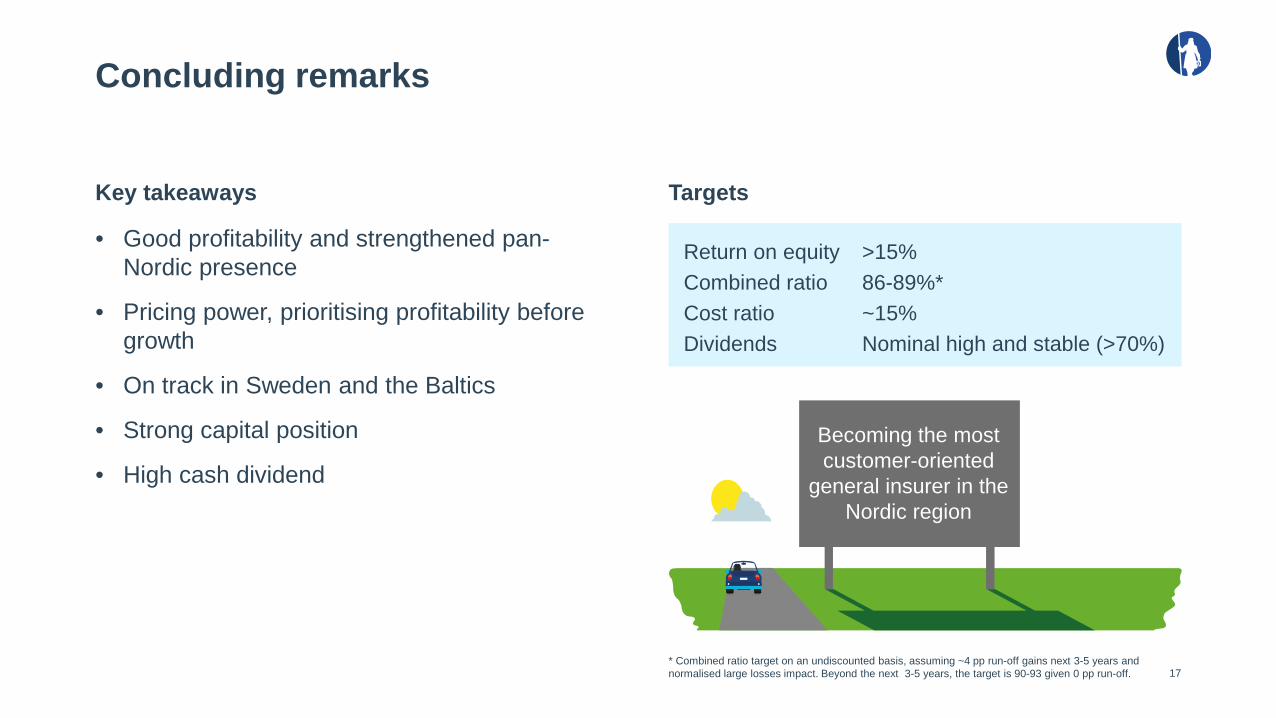
Concluding remarks
Key takeaways Targets
17
• Good profitability and strengthened pan-Nordic presence
• Pricing power, prioritising profitability before growth
• On track in Sweden and the Baltics
• Strong capital position
• High cash dividend
* Combined ratio target on an undiscounted basis, assuming ~4 pp run-off gains next 3-5 years and normalised large losses impact. Beyond the next 3-5 years, the target is 90-93 given 0 pp run-off.
Becoming the most customer-oriented
general insurer in the Nordic region
Return on equity >15% Combined ratio 86-89%* Cost ratio ~15% Dividends Nominal high and stable (>70%)


Roadshows and conferences post Q4 2016 results
Date Location Participants Event Arranged by
9 February 2017 Oslo CEO Helge Leiro Baastad CFO Jostein Amdal IRO Katharina Hesbø
Group lunch Roadshow
Arctic Securities
10 February 2017 London CEO Helge Leiro Baastad CFO Jostein Amdal IRO Katharina Hesbø
Roadshow DNB Bank
14 February 2017
Boston CEO Helge Leiro Baastad Head of IR Janne Flessum
Roadshow Handelsbanken
14 February 2017 Montreal CFO Jostein Amdal IRO Katharina Hesbø
Roadshow RBC
15 February 2017 Chicago CEO Helge Leiro Baastad Head of IR Janne Flessum
Roadshow Handelsbanken
15 February 2017 Toronto CFO Jostein Amdal IRO Katharina Hesbø
Roadshow RBC
16 February 2017 New York CEO Helge Leiro Baastad Head of IR Janne Flessum
Roadshow Handelsbanken
23 March 2017 London Head of IR Janne Flessum Conference Morgan Stanley

Appendix

General insurance – cost ratio and loss ratio per segment
Private Commercial
Nordic Baltics
21
60.2 % 60.7 % 55.5 % 60.8 %
12.7 % 12.8 % 13.1 % 13.2 % 72.9 % 73.5 % 68.6 % 74.0 %
YTD 2015 YTD 2016 Q4 2015 Q4 2016
Loss ratio Cost ratio
68.2 % 66.5 % 66.1 % 67.5 %
11.4 % 11.0 % 11.1 % 11.3 % 79.6 % 77.5 % 77.2 % 78.9 %
YTD 2015 YTD 2016 Q4 2015 Q4 2016
Loss ratio Cost ratio
81.8 % 72.2 % 90.4 % 77.3 %
33.6 % 37.4 % 35.0 % 37.3 %
115.4 % 109.6 % 125.4 % 114.5 %
YTD 2015 YTD 2016 Q4 2015 Q4 2016
Loss ratio Cost ratio
74.6 % 80.1 % 78.8 % 81.6 %
15.6 % 15.7 % 16.5 % 17.1 % 90.3 % 95.8 % 95.3 % 98.7 %
YTD 2015 YTD 2016 Q4 2015 Q4 2016
Loss ratio Cost ratio

Effect of discounting of claims provisions Assuming Solvency II regime
Effect of discounting on CR – Q4 2016 Assumptions
22
• Only claims provisions are discounted (i.e. premium provisions are undiscounted)
• Swap rates in Norway, Sweden and Denmark
• Euroswap rates in the Baltic countries
Reported CR Discounting Discounted CR (SII)
87.7%
1.0%
86.7%

-2.0 %
-1.5 %
-1.0 %
-0.5 %
0.0 %
0.5 %
1.0 %
1.5 %
2.0 %
2.5 %
3.0 %
3.5 %
4.0 %
2000
2001
2002
2003
2004
2005
2006
2007
2008
2009
2010
2011
2012
2013
2014
2015
2016
Run-off (%), net Average
Group life and Motor BI (Norway) Liability and Accident (Denmark)
WC and disease (Norway)
Large losses and run-off development
~ NOK 1.3bn in large losses* expected annually
23
Expected annual run-off gains of ~4 pp next 3-5 years
* Losses >NOK 10m. From and including 2012, the numbers include weather related large losses.
0
50
100
150
200
250
300
350
400
450
500
Q111
Q211
Q311
Q411
Q112
Q212
Q312
Q412
Q113
Q213
Q313
Q413
Q114
Q214
Q314
Q414
Q115
Q215
Q315
Q415
Q116
Q216
Q316
Q416
NOK m
Expected Reported
Run-off % of earned premium
Motor TPL and WC (Norway)

Quarterly underwriting results General Insurance
24
2008 2009 2010 2011 2012 2013 2014 2015 2016Q1 79 97 (369) 50 506 343 349 417 774Q2 270 319 289 615 719 448 951 1070 1072Q3 346 259 562 570 780 853 755 1091 832Q4 165 142 315 186 603 376 807 879 767
( 450)
( 250)
( 50)
150
350
550
750
950
1 150NOK m
Q1 Q2 Q3 Q4*Reported UW result for Q1 2016 was NOK 1,251m. Adjusted for a non-recurring income of NOK 477m related to the pension plans, the UW result was NOK 774m. ** Reported UW result for Q3 2016 was NOK 712m. Adjusted for a non-recurring NOK 120m restructuring cost the UW result was NOK 832m. *** Reported UW result for Q42016 was NOK700m. Adjusted for a non-recurring NOK 44m increase in provision for restructuring cost and NOK23m provision for increased pay-roll tac the UW result was NOK 767m
*
** ***

Investment strategy supporting high and stable nominal dividends
Key characteristics
25
• Match portfolio - Duration and currency matching versus
technical provisions (undiscounted) - Credit element for increased returns - Some inflation hedging
• Free portfolio - Compounding and focused on absolute returns - Dynamic risk management - Tactical allocation - Active management fixed income and equities - Normal risk premiums basis for asset allocation
and use of capital
• Limited risk appetite • Currency hedging vs NOK ~ 100%
- Limit +/- 10% per currency
• Marked-to-market recognition - Except bonds at amortised cost
• Stable performance
100
110
120
130
Q410
Q411
Q412
Q413
Q414
Q415
Accumulated return

Investment portfolio - asset classes and relevant benchmarks
26
Asset class Investments, key elements* Benchmark
Match portfolio
Money market Norwegian money market ST1X index
Bonds at amortised cost Government and corporate bonds EXOGEN
Current bonds Mortgage, sovereign and corporate bonds, investment grade bond funds and loan funds containing secured debt
IBOX COR 1-3 yrs QW5C index
Free portfolio
Money market Norwegian money market ST1X index
Other bonds IG bonds in internationally diversified funds externally managed and current bonds
Global Agg Corp LGCPTRUH index
High Yield bonds Internationally diversified funds externally managed BOAML global HY HWIC index
Convertible bonds Internationally diversified funds externally managed BOAML global 300 conv VG00 index / EXOGEN
Current equities Mainly internationally diversified funds externally managed and SpareBank 1 SR-Bank
MSCIAC NDUEACWF index
PE funds Oil/ oil-service/ general (Norwegian and Nordic funds) OSEBX index / oil price
Property 50% of Oslo Areal IPD index Norway / EXOGEN
Other Miscellaneous
*See quarterly report for a more detailed description

Asset allocation As at 31.12.2016
Match portfolio Free portfolio
27
• Carrying amount: NOK 35.1bn • Average duration: 3.5 years
• Carrying amount: NOK 18.9bn • Average duration fixed-income
instruments: 2.5 years
15%
50%
35%
Money market
Bonds at amortised cost
Current bonds
23%
19%
6% 6%
15%
6%
16%
9%
Money market Other bondsHigh Yield Convertible bondsCurrent equities PE-fundsProperty Other

Stable contribution from the match portfolio
Asset allocation as at 31.12.2016 Quarterly investment returns*
28 * Prior to 2014 former associated companies were not included in the Free portfolio.
65%
35%
Match portfolio Free portfolio
-4%
-2%
0%
2%
4%
Q1 2010
Q3 2010
Q1 2011
Q3 2011
Q1 2012
Q3 2012
Q1 2013
Q3 2013
Q1 2014
Q3 2014
Q1 2015
Q3 2015
Q1 2016
Q3 2016
Match portfolio Free portfolio *

Balanced geographical exposure
Match portfolio Free portfolio, fixed-income instruments
29 Figures as at 31.12.2016. Geographical distribution relates to issuers and does not reflect actual currency exposure
48%
6%
22%
7%
8%
2% 7%
Norway Sweden Denmark USA
UK Baltic Other
40%
1% 2%
37%
9%
0% 11%
Norway Sweden Denmark USA
UK Baltic Other

Credit and counterparty risk
Credit exposure Total fixed income portfolio
30
• The portfolio consists mainly of securities in rated companies with high creditworthiness (Investment grade)
• Issuers with no official rating are mainly Norwegian savings banks, municipalities, credit institutions and power producers and distributors
Figures as at 31.12.2016. * Internal rating – rating by third party
Split - Rating Match portfolio Free portfolio NOK bn % NOK bn %
AAA 10.6 30.4 0.9 8.7 AA 3.5 10.0 0.9 8.7 A 5.7 16.3 2.4 23.5 BBB 1.7 5.0 2.0 19.5 BB 0.5 1.4 0.7 6.5 B 1.4 4.0 0.7 6.6 CCC or lower 0.0 0.0 0.1 1.1 Internal rating* 7.5 21.3 1.9 19.0 Unrated 4.1 11.6 0.7 6.5 Fixed income portfolio 35.0 100.0 10.1 100.0
Split - Counterparty Match portfolio Free portfolio NOK bn % NOK bn %
Public sector 4.2 12.0 2.0 20.1 Bank/financial institutions 18.8 53.6 3.8 37.7 Corporates 12.0 34.4 4.3 42.2 Total 35.0 100.0 10.1 100.0

Overview capitalisation
31
(NOK bn)
SF (Group) SF (general insurance)
PIM (Group) PIM (general insurance)
Rating model (general insurance)
Gjensidige Bank & Gjensidige Investerings-rådgivning
Gjensidige Pensjons-forsikring
Capital available 20.4 14.8 20.7 15.2 15.2 3.6 1.7
Capital requirement 13.9 9.8 11.5 7.3 13.9 3.4 1.3
Solvency margin 147% 151% 180% 206% 109% 108% 134%
Figures as at 31.12.2016. The Solvency II regulation is principle based. Calculations are based on Gjensidige’s understanding of the Solvency II regulation and how it is implemented in Norway, including the current view of the Norwegian FSA on the guarantee provision. If the Guarantee provision had been treated as solvency capital, the Group’s PIM and SF solvency margins would be 183% and 150%, respectively. The figures related to the S&P rating model are based on Gjensidige’s interpretations of the model. The figures are adjusted for proposed dividend of NOK 3.4bn. Allocation of capital to Gjensidige Bank is based on 16 per cent capital adequacy ratio. Allocation of capital to Gjensidige Investeringsrådgivning is based on 8 per cent capital adequacy ratio.

Solvency II economic capital available
32
Figures as at 31.12.2016. GPF = Gjensidige Pensjonsforsikring. The Solvency II regulation is principle based. Calculations are based on Gjensidige’s understanding of the Solvency II regulation and how it is implemented in Norway, including the current view of the Norwegian FSA on the guarantee provision. Deferred tax: All differences in valuation of assets and liabilities are adjusted for tax. No tax is assumed on the security provision. Miscellanious: Main effects are related to the guarantee scheme provision and different valuation of Oslo Areal
22.3 20.7 20.4
0.4 1.5 0.0
3.4
4.5 1.6
0.9 1.9 2.6
1.7 0.3 0.3 0.3
IFRSequitycapital
Adjustmentsfor
other financialsectors
Sub-ordinated
debt
Dividend(minimumdividend
according todividend
policy. 70% ofYTD result)
Declareddividend, not
alreadyrecognised in
accounts
Intangibleassets
Fair valueadjustment,
assets
Discountingeffect ofclaims
provisions(which are notalready disc.)
Risk margin Solvency IIcalculation of
premiumprovisions
Solvency IIcalculation of
technicalprovisions forlife insurance
(GPF)
Deferred taxliability
Miscellaneous Economiccapital
available(internalmodel)
Additional riskmargin
standardformula
Economiccapital
available(standardformula)
NOK bn

Non-life and health uw risk Market riskLife insurance risk Operational riskOther risks
Solvency II capital requirements
33
Figures as at 31.12.2016. The Solvency II regulation is principle based. Calculations are based on Gjensidige’s understanding of the Solvency II regulation and how it is implemented in Norway, including the current view of the Norwegian FSA on the guarantee provision. If the Guarantee provision had been treated as solvency capital, the Group’s PIM and SF solvency margins would be 183% and 150%, respectively. The figures are adjusted for proposed dividend of NOK 3.4bn. Allocation of capital to Gjensidige Bank is based on 16 per cent capital adequacy ratio. Pie chart is based on allocated capital for the specified risk types within the Gjensidige Group excl. Gjensidige Bank and Gjensidige Investeringsrådgivning .
Out of scope, covered by SF
Within IM scope
Scope internal model
NOK bn PIM SF
Capital available 20.7 20.4
Capital charge for non-life and health uw risk 6.2 8.1
Capital charge for life uw risk 1.3 1.3
Capital charge for market risk 6.0 6.5
Capital charge for counterparty risk 0.5 0.5
Diversification (4.5) (3.8)
Basic SCR 9.5 12.7
Operational risk 0.9 0.9
Adjustments (risk-reducing effect of deferred tax) (2.3) (3.1)
Gjensidige Bank/Gjensidige Investeringsrådgivning 3.4 3.4
Total capital requirement 11.5 13.9
Solvency ratio 180% 147%

180% 177% 176%
192%
173% 184% 184%
169%
Solvency II ratio Equity(-20%/+20%)
Interest rate(-100 bps/+100 bps)
Spread(-100 bps/ +100 bps)
Inflation +100 bps
Solvency II sensitivities PIM
34 Figures as at 31.12.2016. Calculations are based on Gjensidige’s understanding of the Solvency II regulation and how it is implemented in Norway, including the current view of the Norwegian FSA on the guarantee provision. If the Guarantee provision had been treated as solvency capital, the Group’s PIM solvency margin would be 183%. The figures are adjusted for proposed dividend of NOK 3.4bn. UFR-sensitivity is very limited.
SCR 100%

147% 142% 143%
156%
140% 152% 150%
137%
Solvency II ratio Equity(-20%/+20%)
Interest rate(-100 bps/+100 bps)
Spread(-100 bps/ +100 bps)
Inflation +100 bps
Solvency II sensitivities standard formula
35 Figures as at 31.12.2016. Calculations are based on Gjensidige’s understanding of the Solvency II regulation and how it is implemented in Norway, including the current view of the Norwegian FSA on the guarantee provision. If the Guarantee provision had been treated as solvency capital, the Group’s solvency margin would be 150%. The figures are adjusted for proposed dividend of NOK 3.4bn. UFR-sensitivity is very limited.
SCR 100%
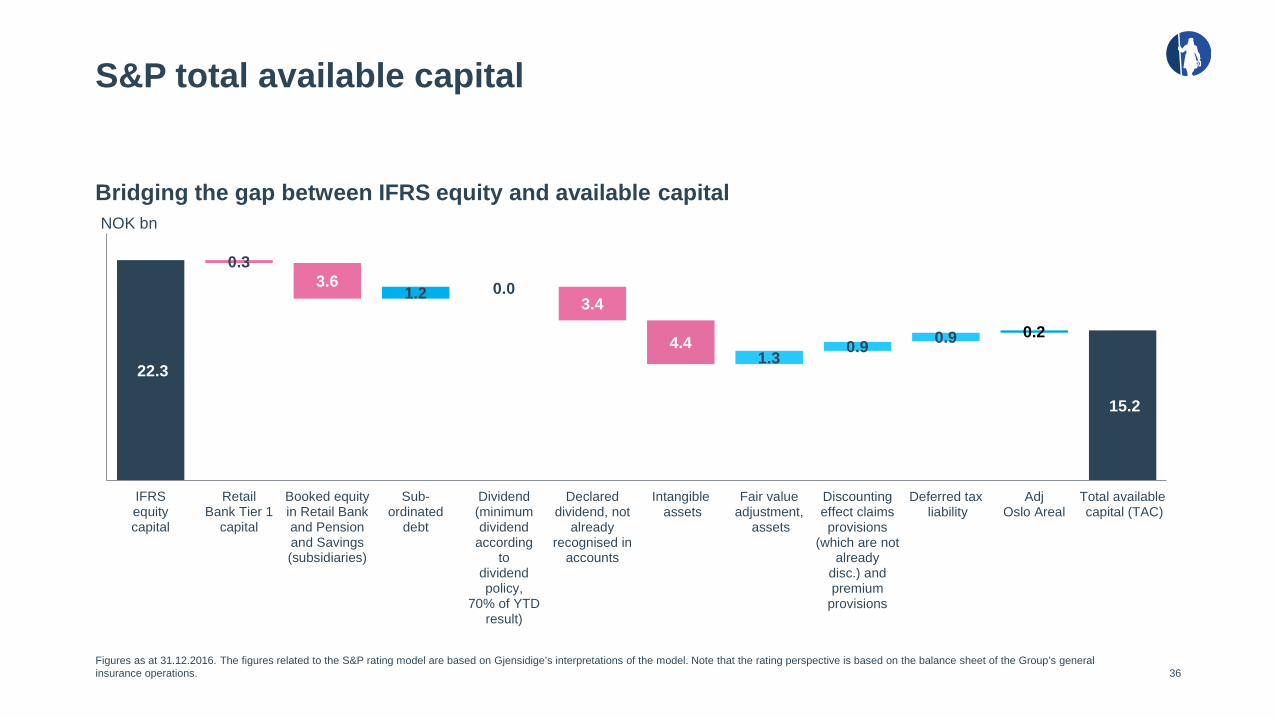
S&P total available capital
Bridging the gap between IFRS equity and available capital
36 Figures as at 31.12.2016. The figures related to the S&P rating model are based on Gjensidige’s interpretations of the model. Note that the rating perspective is based on the balance sheet of the Group’s general insurance operations.
22.3
15.2
0.3 3.6
1.2 0.0 3.4
4.4 1.3
0.9 0.9 0.2
IFRSequitycapital
RetailBank Tier 1
capital
Booked equityin Retail Bankand Pensionand Savings(subsidiaries)
Sub-ordinated
debt
Dividend(minimumdividend
accordingto
dividendpolicy,
70% of YTDresult)
Declareddividend, not
alreadyrecognised in
accounts
Intangible assets
Fair valueadjustment,
assets
Discountingeffect claimsprovisions
(which are notalready
disc.) andpremium
provisions
Deferred tax liability
AdjOslo Areal
Total available capital (TAC)
NOK bn

S&P capital requirement
37
NOK bn
Total capital charge for asset risk 6.9
Total capital charge for insurance risk 8.9
Total gain diversification (1.1)
Quantitative credit (0.8)
Total capital requirement A-rating 13.9
Figures as at 31.12.2016. The figures related to the S&P rating model are based on Gjensidige’s interpretations of the model. Note that the rating perspective is based on the balance sheet of the Group’s general insurance operations.

Intermediate Equity Content Constraint
S&P 25% of TAC
For the general insurance group, both Solvency II Tier 1 and Tier 2 instruments are
classified as Intermediate Equity Content. Capital
must be regulatory eligible in order to be
included.
T1 T2 Constraint
SII Max 20% of Tier 1 capital
Max 50% of SCR less other T2 capital items
Must be satisfied at group and solo level
Subordinated debt capacity
Capacity and utilisation
38
• Tier 1 remaining capacity is NOK 1.6bn
• Utilised Tier 1 debt capacity: NOK 1.0bn
• Tier 2 capacity is fully utilised for the insurance group assuming PIM approval
• Utilised sub debt: NOK 1.5bn*
• Utilised natural perils fund and guarantee scheme: NOK 2.9bn
Figures as at 31.12.2016. The Solvency II regulation is principle based. Calculations are based on Gjensidige’s understanding of the Solvency II regulation and how it is implemented in Norway. However, the FSA’s view on the Guarantee provision as a liability for solvency purposes has not been reflected in the debt capacity figures, as Gjensidige still assumes that the Guarantee provision will count as solvency capital. * Sub debt Gjensidige Forsikring ASA NOK 1.2bn, Gjensidige Pensjonsforsikring NOK 0.3bn
Principles for capacity

Return on equity 21.4 per cent
Equity (NOK m)
Return on equity (%)
39
31.12.2015 Profit2016
Dividendpaid
Totalcomponents
of othercomprehensive
income
RT1issue
31.12.2016
23 331 21 349 21 349 22 326
4 670
998
6 197
456
FY 2015 FY 2016
17.4 21.4
Bridge shows main elements in equity development

Market leader in Norway
Market share – Total market
40 Source: Finance Norway, non-life insurance, 3rd quarter 2016
Market share – Commercial Market share – Private
Gjensidige If Tryg Sparebank1
27.1% 24.0%
14.2%
4.3%
Gjensidige If Sparebank1 Tryg
24.5%
19.3%
13.3% 12.8%
25.4%
21.0%
13.3%
10.1% 4.8%
4.3%
2.9% 18.2%
Gjensidige If Tryg Sparebank1 DNB Eika Codan Other

Nordic and Baltic growth opportunities
Market shares Norway Market shares Sweden
41
Market shares Denmark Market shares Baltics
25.4%
21.0%
13.3% 10.1%
30.2% Gjensidige If Tryg Sparebank1 Other
2.4%
18.2%
30.0% 16.3%
15.0%
18.1% Gjensidige If Lansförsäkringar Folksam Trygg Hansa Other
6.6%
17.2%
18.0%
9.7% 11.2% 5.7%
31.5%
Gjensidige Topdanmark Tryg Alm.Brand Codan If Other
11.3%
12.9%
24.4% 13.1%
12.8%
25.5%
Gjensidige inc PZU
If
PZU
Ergo
BTA
Other
Sources: Finance Norway, 3rd quarter 2016. Insurance Sweden, 3rd quarter 2016 (Gjensidige including Vardia), The Danish Insurance Association 4th quarter 2015. Baltics Insurance Supervisory Authorities of Latvia and Lithuania, Estonia Statistics, competitor reports, and manual calculations, 3rd quarter 2016

Ownership
10 largest shareholders* Geographical distribution of shares**
42
40%
23% 8%
4%
23%
2%
Norway North America
UK Asia
Europe excl. UK and Norway
RoW/ Unidentified
Gjensidige Foundation ownership policy: • Long term target holding: >60% • Can accept reduced ownership ratio in case of
acquisitions and capital issues when in accordance with Gjensidige’s overall strategy
* Shareholder list based on analysis performed by Orient Capital Ltd of the register of shareholders in the Norwegian Central Securities Depository (VPS) as per 30 December 2016. This analysis provides a survey of the shareholders who are behind the nominee accounts. There is no guarantee that the list is complete. ** Distribution of shares excluding share held by the Gjensidige Foundation (Gjensidigestiftelsen).
No Shareholder Stake (%) 1 Gjensidigestiftelsen 62.2
2 Folketrygdfondet 4.3
3 Deutsche Bank 3.6
4 Caisse de Depot et Placement du Quebec 3.3
5 Danske Bank 2.8
6 BlackRock 1.8
7 KLP 0.9
8 State Street Corporation 0.8
9 The Vanguard Group 0.8
10 DNB 0.6
Total 10 largest 81.1

Disclaimer
43
This presentation and the information contained herein have been prepared by and is the sole responsibility of Gjensidige Forsikring ASA (the "Company”). Such information is being provided to you solely for your information and may not be reproduced, retransmitted, further distributed to any other person or published, in whole or in part, for any purpose. Failure to comply with this restriction may constitute a violation of applicable securities laws. The information and opinions presented herein are based on general information gathered at the time of writing and are therefore subject to change without notice. The Company assumes no obligations to update or correct any of the information set out herein. These materials may contain statements about future events and expectations that are forward-looking statements. Any statement in these materials that is not a statement of historical fact including, without limitation, those regarding the Company’s financial position, business strategy, plans and objectives of management for future operations is a forward-looking statement that involves known and unknown risks, uncertainties and other factors which may cause our actual results, performance or achievements of the Company to be materially different from any future results, performance or achievements expressed or implied by such forward-looking statements. Such forward-looking statements are based on numerous assumptions regarding the Company’s present and future business strategies and the environment in which the Company will operate in the future. The Company assumes no obligations to update the forward-looking statements contained herein to reflect actual results, changes in assumptions or changes in factors affecting these statements. This presentation does not constitute or form part of, and is not prepared or made in connection with, an offer or invitation to sell, or any solicitation of any offer to subscribe for or purchase any securities and nothing contained herein shall form the basis of any contract or commitment whatsoever. No reliance may be placed for any purposes whatsoever on the information contained in this presentation or on its completeness, accuracy or fairness. The information in this presentation is subject to verification, completion and change. The contents of this presentation have not been independently verified. While the Company relies on information obtained from sources believed to be reliable, it does not guarantee its accuracy or completeness. Accordingly, no representation or warranty, express or implied, is made or given by or on behalf of the Company or any of its owners, directors, officers or employees or any other person as to the accuracy, completeness or fairness of the information or opinions contained in this presentation. None of the Company, its affiliates or any of their respective advisors or representatives or any other person shall have any liability whatsoever (in negligence or otherwise) for any loss howsoever arising from any use of this presentation or its contents or otherwise arising in connection with the presentation. The Company's securities have not been and will not be registered under the US Securities Act of 1933, as amended (the "US Securities Act”), and are offered and sold only outside the United States in accordance with an exemption from registration provided by Regulation S of the US Securities Act. This presentation should not form the basis of any investment decision. Investors and prospective investors in securities of any issuer mentioned herein are required to make their own independent investigation and appraisal of the business and financial condition of such company and the nature of the securities. Any decision to purchase securities in the context of a proposed offering of securities, if any, should be made solely on the basis of information contained in any offering documents published in relation to such an offering. For further information about the Company, reference is made public disclosures made by the Company, such as filings made with the Oslo Stock Exchange, periodic reports and other materials available on the Company's web pages. In addition to the financial statements according to IFRS, Gjensidige uses different alternative performance measures (APM) to present the business in a more relevant way for its different stakeholders. The alternative performance measures have been used consistent over time, and relevant definitions have been disclosed in the quarterly reports. Comparable figures are provided for all alternative performance measures in the quarterly reports.

Notes
44

Notes
45

Notes
46

Notes
47

48
Janne Flessum Head of Investor relations, M&A and Capital management [email protected] Mobile: +47 91 51 47 39 Katharina H. Hesbø Investor relations officer [email protected] Mobile: +47 99 36 28 04
Address: Schweigaards gate 21, PO Box 700 Sentrum, 0106 Oslo, Norway www.gjensidige.no/ir
Investor relations