Embed Size (px)
Citation preview
Lecture 4:
GIS Data Input Methods and
Techniques
GE 118: INTRODUCTION TO GIS Engr. Meriam M. Santillan Caraga State University
Geographic Data in GIS
Can be obtained from various sources in
different formats
Can be inputted into a GIS using different
methods
Some Sources of Data for GIS
Maps
Census and Survey Data
Aerial Photographs
Satellite Images
Ground/Land Survey Data
GPS Data
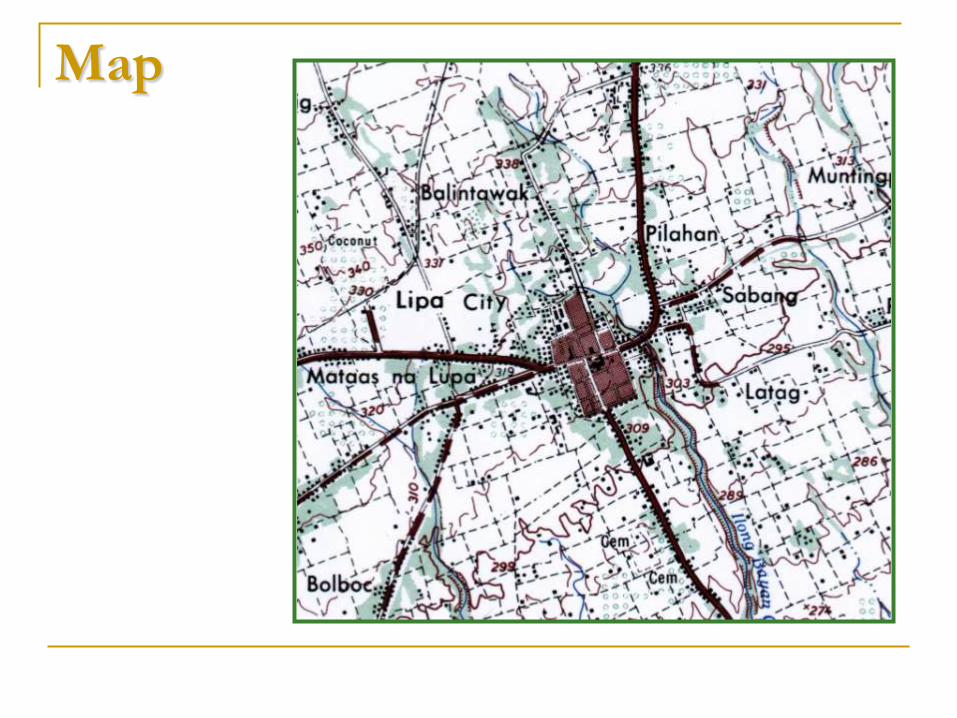
Map
Gender Quickstat
(An Update of NSO's Most Requested Sex-
disaggregated Statistics)
as of 1st Quarter 2005
60
.2
295,
056
39
.8
195,
185
490,
241
80
and
over
56
.7
286,
734
43
.3
218,
622
505,
356
75 -
79
years
54
.7
436,
356
45
.3
361,
614
797,
970
70 -
74
years
53
.2
605,
374
46
.8
533,
469
1,13
8,84
3
65 -
69
years
51
.9
847,
013
48
.1
786,
137
1,63
3,15
0
60 -
64
years
50
.5
960,
516
49
.5
943,
133
1,90
3,64
9
55 -
59
years
49
.7
1,30
3,68
4
50
.3
1,31
8,63
2
2,62
2,31
6
50 -
54
years
49
.0
1,63
3,34
2
51
.0
1,69
6,71
2
3,33
0,05
4
45 -
49
years
49
.1
2,04
3,18
0
50
.9
2,12
0,31
4
4,16
3,49
4
40 -
44
years
49
.1
2,40
4,20
2
50
.9
2,49
6,82
1
4,90
1,02
3
35 -
39
years
49
.4
2,74
1,77
2
50
.6
2,80
4,52
2
5,54
6,29
4
30 -
34
years
49
.7
3,01
7,47
3
50
.3
3,05
3,61
6
6,07
1,08
9
25 -
29
years
50
.2
3,54
6,88
5
49
.8
3,52
2,51
8
7,06
9,40
3
20 -
24
years
49
.9
3,99
9,46
8
50
.1
4,01
7,83
0
8,01
7,29
8
15 -
19
years
49
.3
4,40
8,41
7
50
.7
4,54
1,19
7
8,94
9,61
4
10 -
14
years
48
.8
4,73
2,76
8
51
.2
4,96
2,01
3
9,69
4,78
1
5 -
9
years
48
.8
4,71
7,57
0
51
.2
4,95
1,93
2
9,66
9,50
2
2000
0 -
4
years
49
.6
37,9
79,8
10
50
.4
38,5
24,2
67
76,5
04,0
77
May
Total
Popul
ation
DEMOGRAPHY (Source: Census of Population
and Housing)
Pe
rc
en
t
Nu
mb
er
Pe
rc
en
t
Nu
mb
er
Nu
mbe
r
Year
Female Male
Bot
h
Sex
es
DATA
REF
ERE
NCE
PERI
OD
INDIC
ATOR
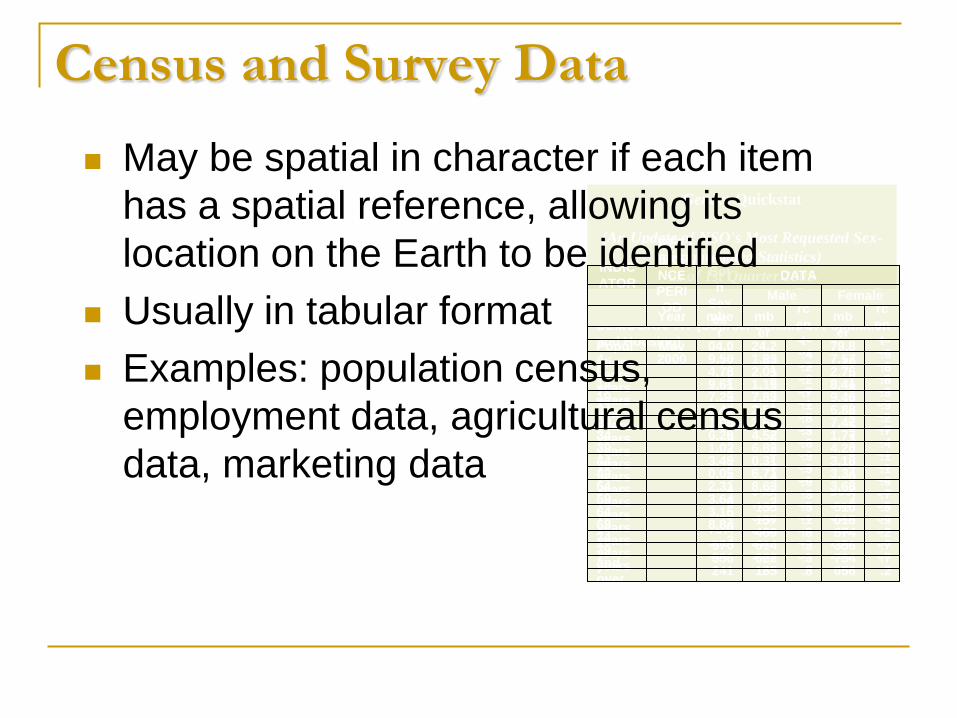
Census and Survey Data
May be spatial in character if each item
has a spatial reference, allowing its
location on the Earth to be identified
Usually in tabular format
Examples: population census,
employment data, agricultural census
data, marketing data
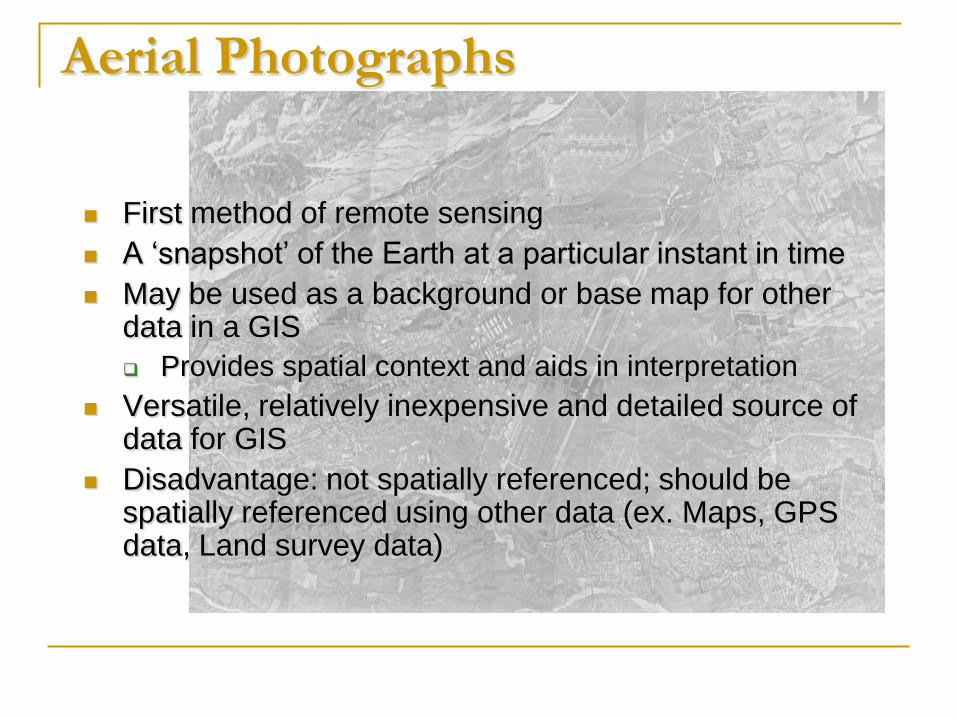
Aerial Photographs
First method of remote sensing
A ‘snapshot’ of the Earth at a particular instant in time
May be used as a background or base map for other data in a GIS
Provides spatial context and aids in interpretation
Versatile, relatively inexpensive and detailed source of data for GIS
Disadvantage: not spatially referenced; should be spatially referenced using other data (ex. Maps, GPS data, Land survey data)
Important Characteristics of Aerial
Photos for GIS (Curran 1989)
Wide availability
Low cost compared with other
remotely sensed images
Wide area views
Time-freezing ability
High spectral and spatial resolution
Three-dimensional perspective
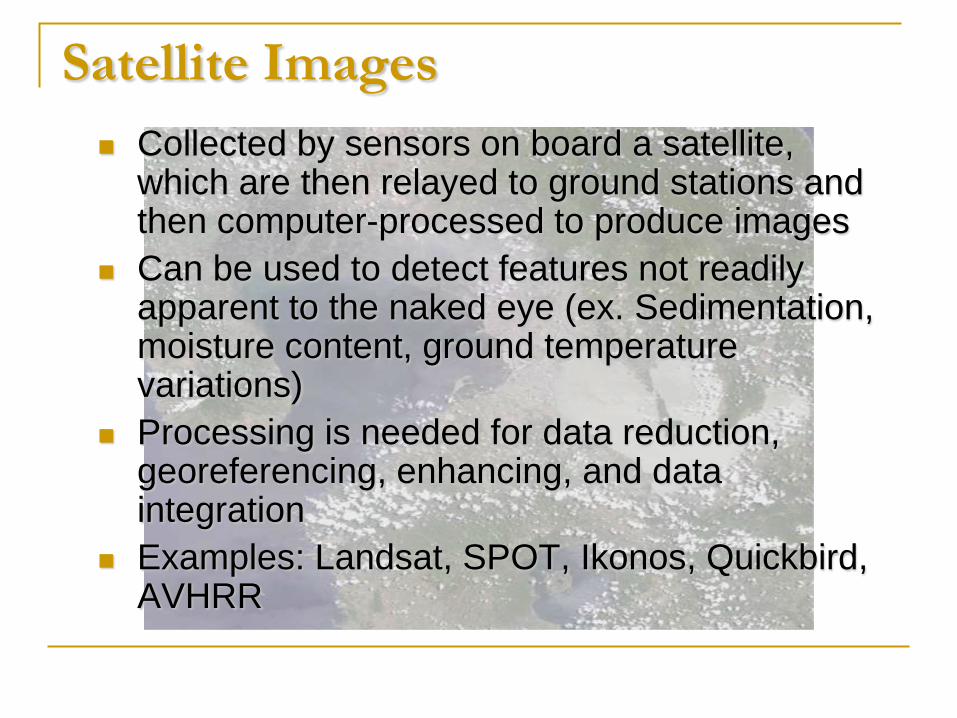
Satellite Images
Collected by sensors on board a satellite, which are then relayed to ground stations and then computer-processed to produce images
Can be used to detect features not readily apparent to the naked eye (ex. Sedimentation, moisture content, ground temperature variations)
Processing is needed for data reduction, georeferencing, enhancing, and data integration
Examples: Landsat, SPOT, Ikonos, Quickbird, AVHRR
Advantages of Satellite Images
Easy to transfer/transport -- always available in digital form
Specific features can be highlighted by manipulating the displayed wavebands
Repeated converage of the Earth – important for temporal analysis and continuous monitoring
Large coverage area – useful for regional or national mapping applications
Low cost compared with other data sources
Ability to acquire current/timely images
Accurate and complete
Uniform standards across areas
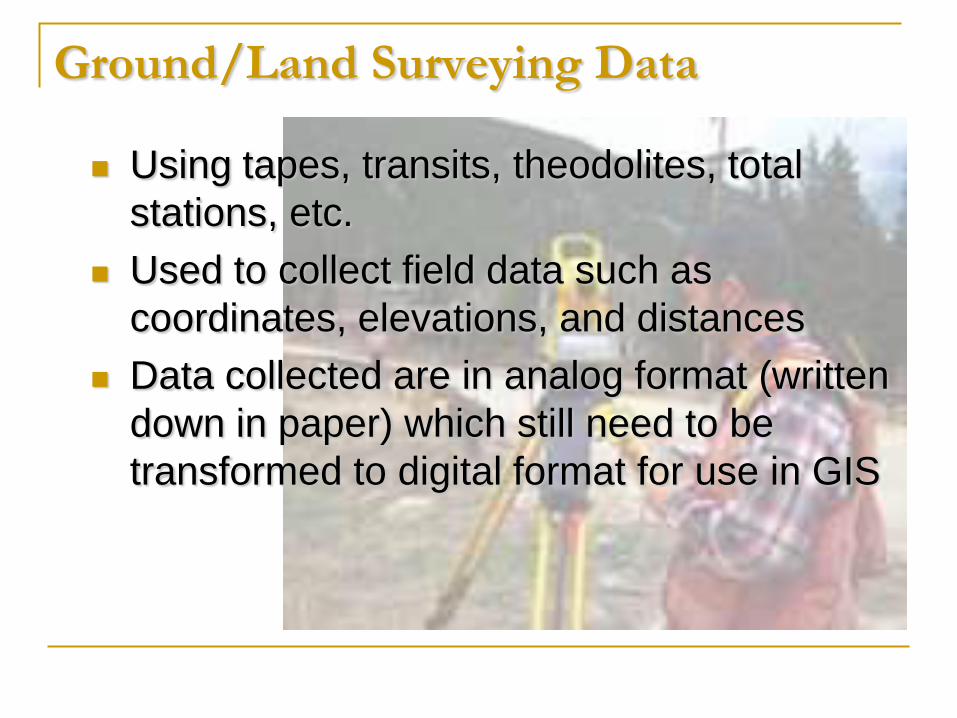
Ground/Land Surveying Data
Using tapes, transits, theodolites, total
stations, etc.
Used to collect field data such as
coordinates, elevations, and distances
Data collected are in analog format (written
down in paper) which still need to be
transformed to digital format for use in GIS
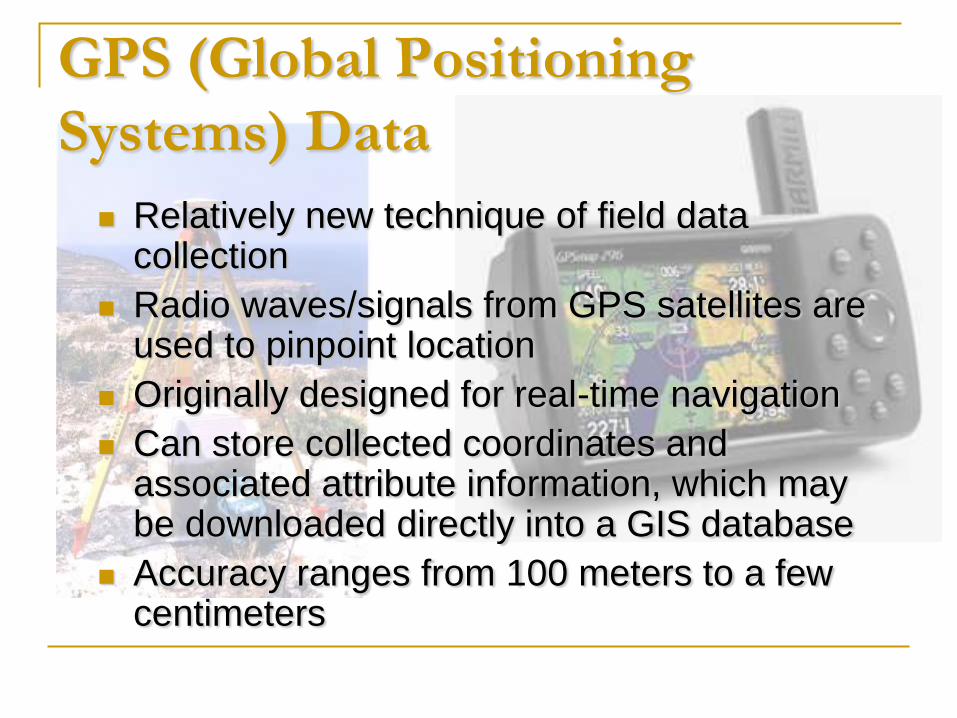
GPS (Global Positioning
Systems) Data
Relatively new technique of field data collection
Radio waves/signals from GPS satellites are used to pinpoint location
Originally designed for real-time navigation
Can store collected coordinates and associated attribute information, which may be downloaded directly into a GIS database
Accuracy ranges from 100 meters to a few centimeters
Categories of Geographic Data
Acquisition
Primary – collected through first-hand
observation
Secondary – data collected by another
individual or organization; most are published
data
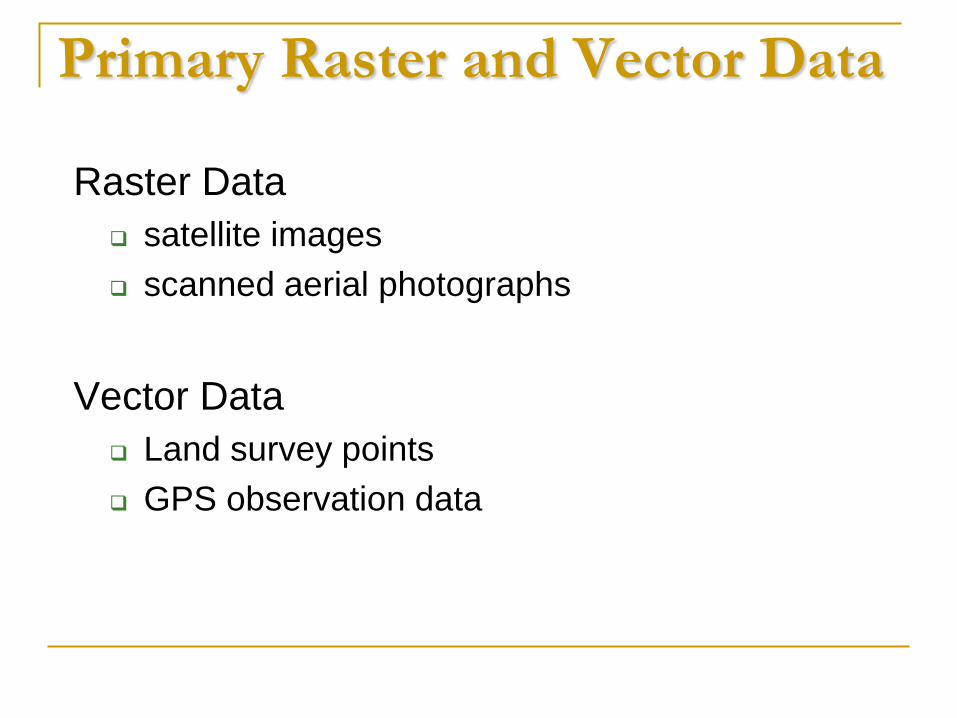
Primary Raster and Vector Data
Raster Data
satellite images
scanned aerial photographs
Vector Data
Land survey points
GPS observation data
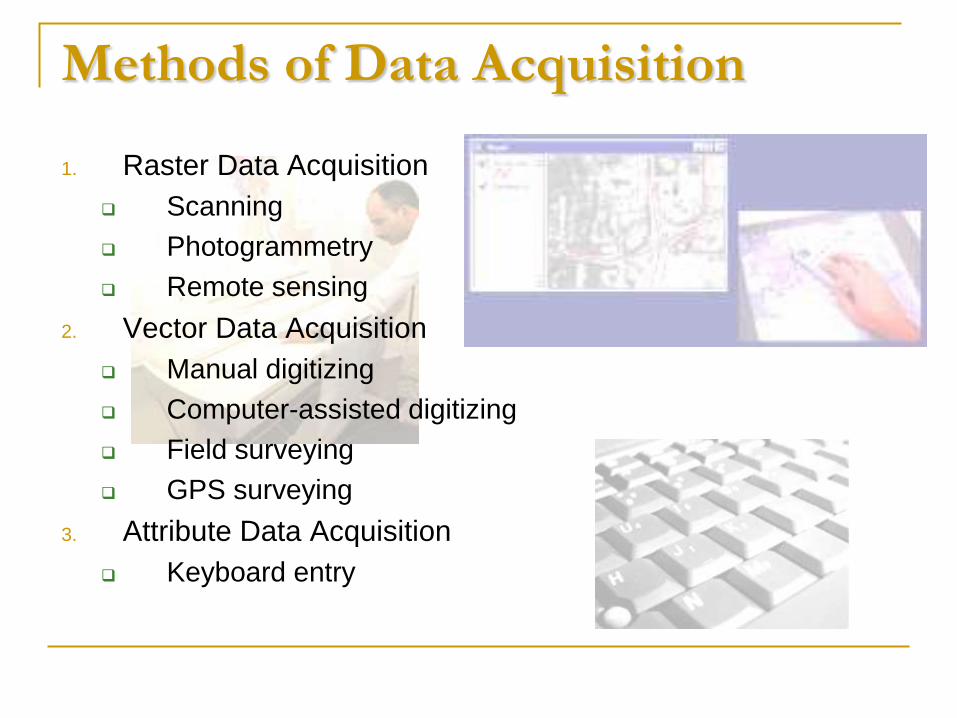
Methods of Data Acquisition
1. Raster Data Acquisition
Scanning
Photogrammetry
Remote sensing
2. Vector Data Acquisition
Manual digitizing
Computer-assisted digitizing
Field surveying
GPS surveying
3. Attribute Data Acquisition
Keyboard entry
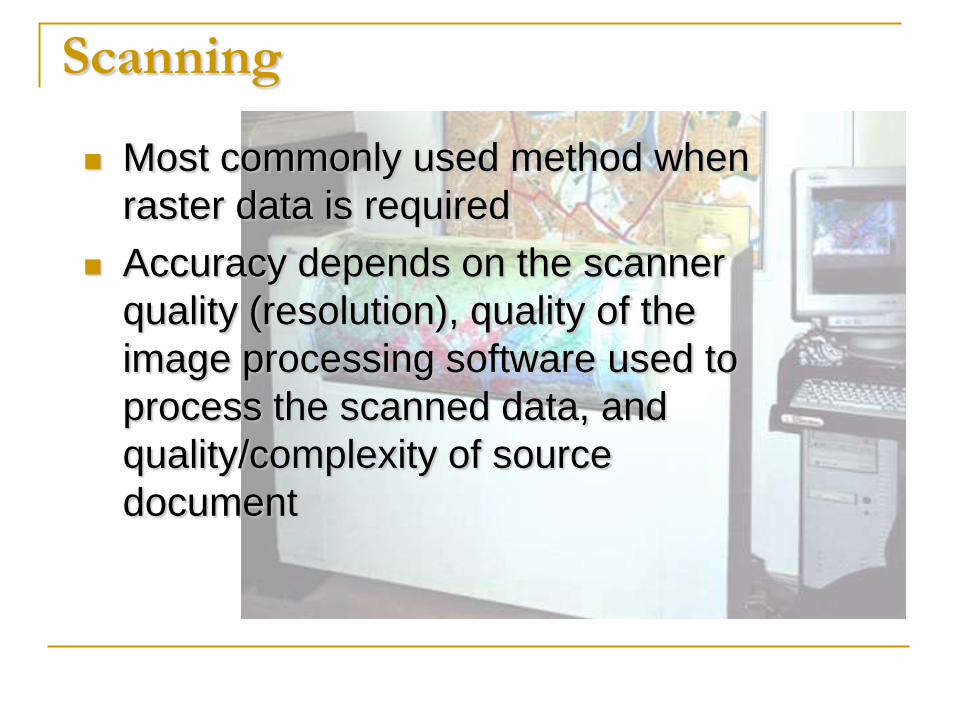
Scanning
Most commonly used method when
raster data is required
Accuracy depends on the scanner
quality (resolution), quality of the
image processing software used to
process the scanned data, and
quality/complexity of source
document
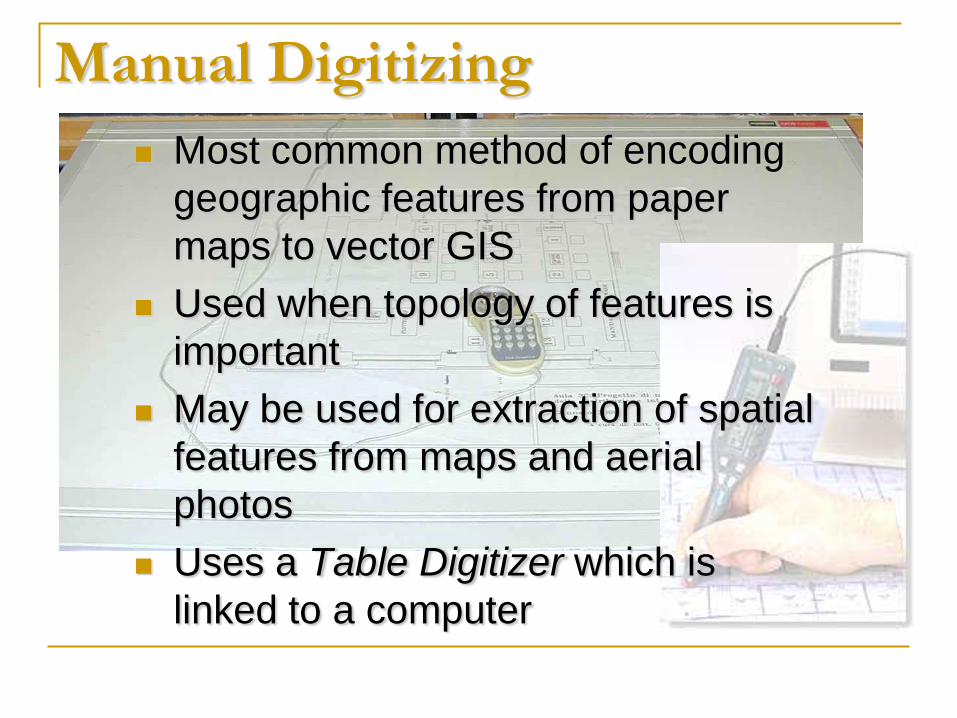
Manual Digitizing
Most common method of encoding
geographic features from paper
maps to vector GIS
Used when topology of features is
important
May be used for extraction of spatial
features from maps and aerial
photos
Uses a Table Digitizer which is
linked to a computer
Manual Digitizing
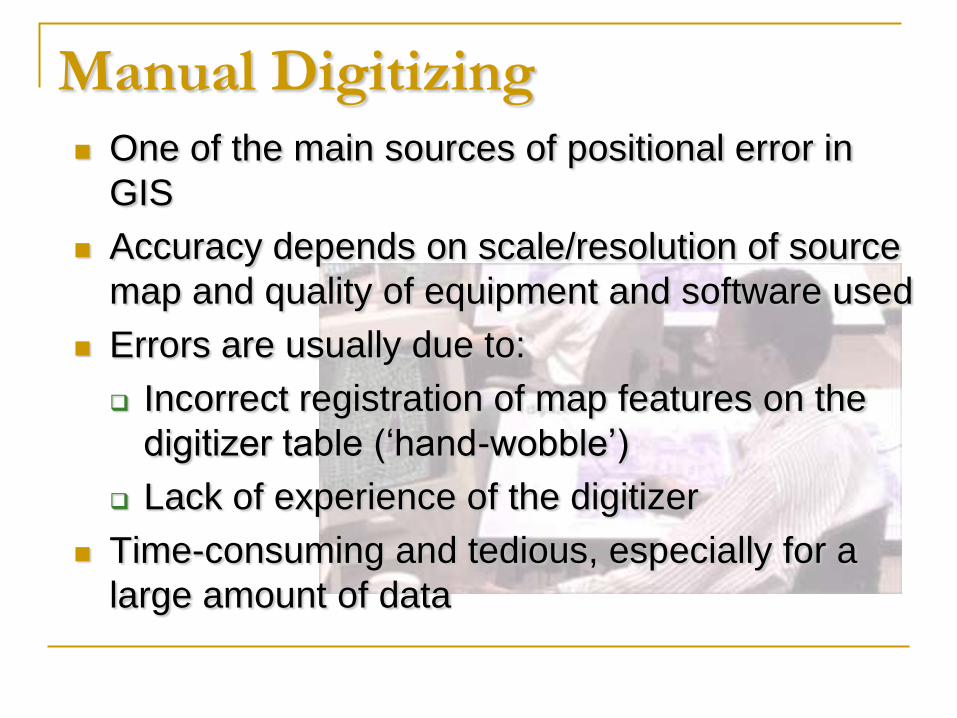
One of the main sources of positional error in
GIS
Accuracy depends on scale/resolution of source
map and quality of equipment and software used
Errors are usually due to:
Incorrect registration of map features on the
digitizer table (‘hand-wobble’)
Lack of experience of the digitizer
Time-consuming and tedious, especially for a
large amount of data
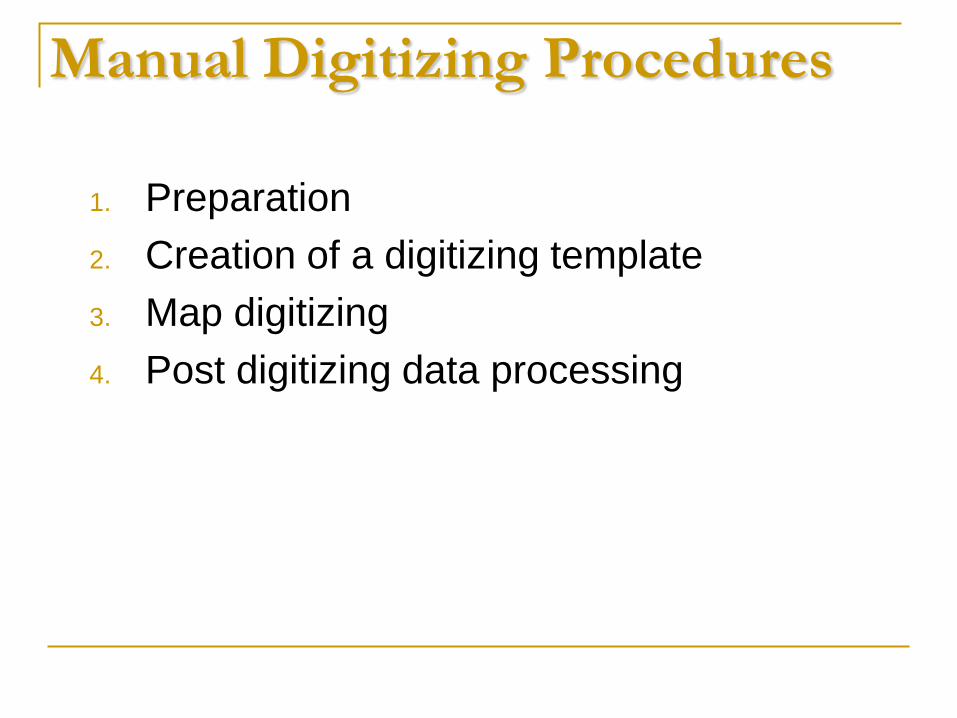
Manual Digitizing Procedures
1. Preparation
2. Creation of a digitizing template
3. Map digitizing
4. Post digitizing data processing
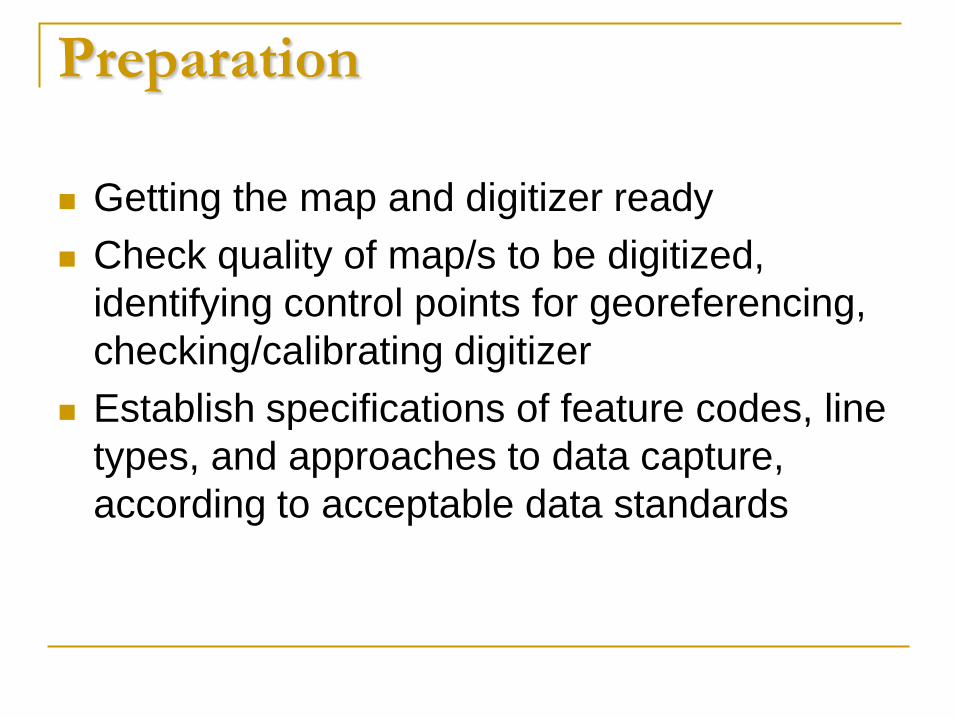
Preparation
Getting the map and digitizer ready
Check quality of map/s to be digitized,
identifying control points for georeferencing,
checking/calibrating digitizer
Establish specifications of feature codes, line
types, and approaches to data capture,
according to acceptable data standards
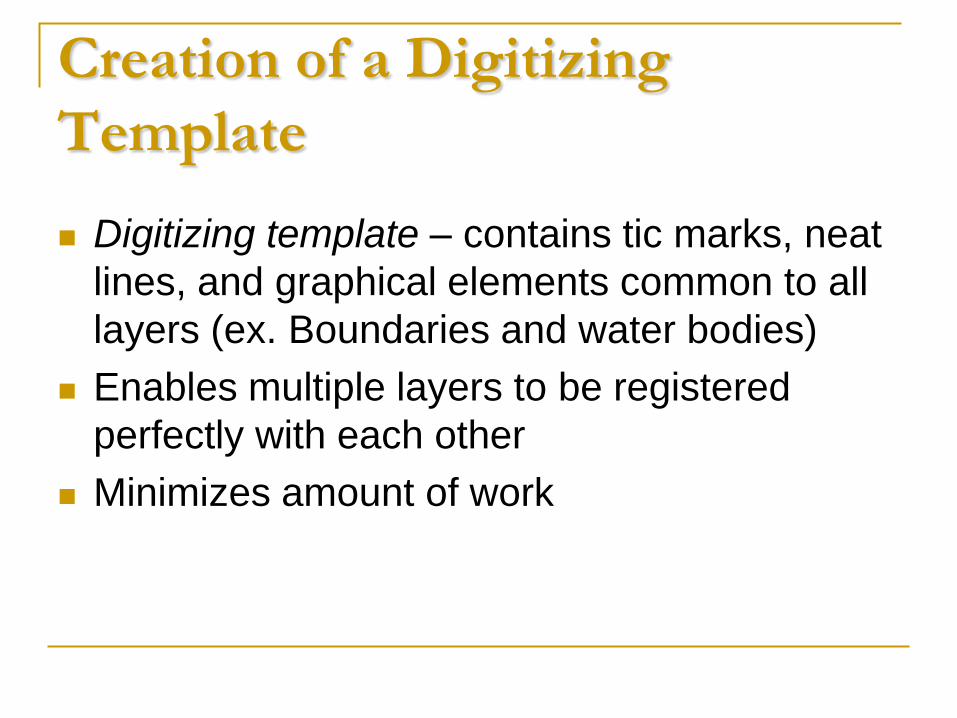
Creation of a Digitizing
Template
Digitizing template – contains tic marks, neat
lines, and graphical elements common to all
layers (ex. Boundaries and water bodies)
Enables multiple layers to be registered
perfectly with each other
Minimizes amount of work
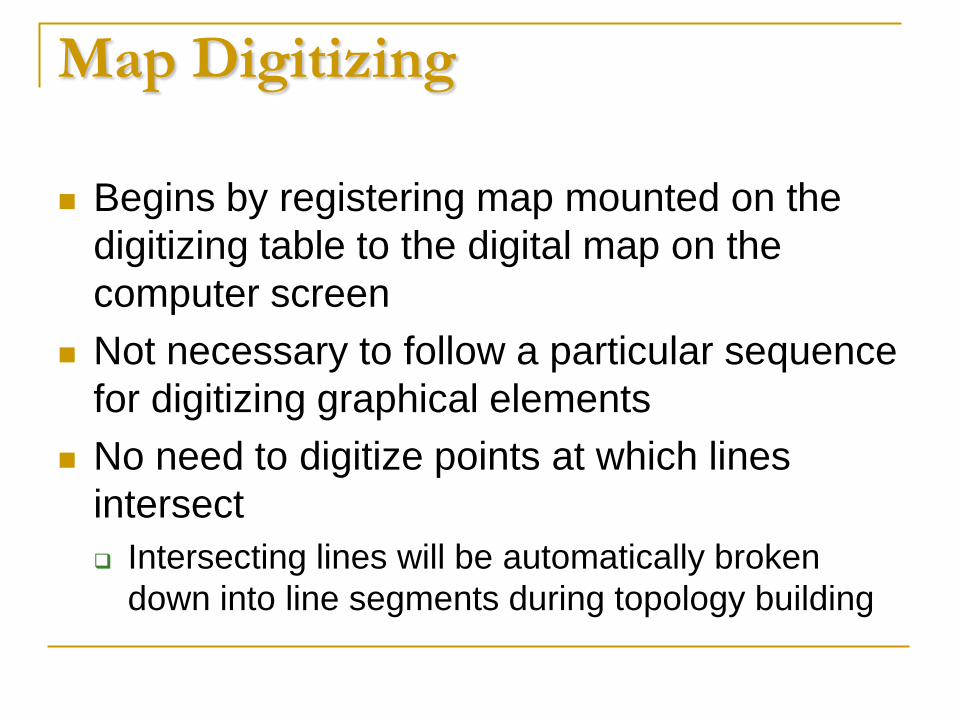
Map Digitizing
Begins by registering map mounted on the
digitizing table to the digital map on the
computer screen
Not necessary to follow a particular sequence
for digitizing graphical elements
No need to digitize points at which lines
intersect
Intersecting lines will be automatically broken
down into line segments during topology building
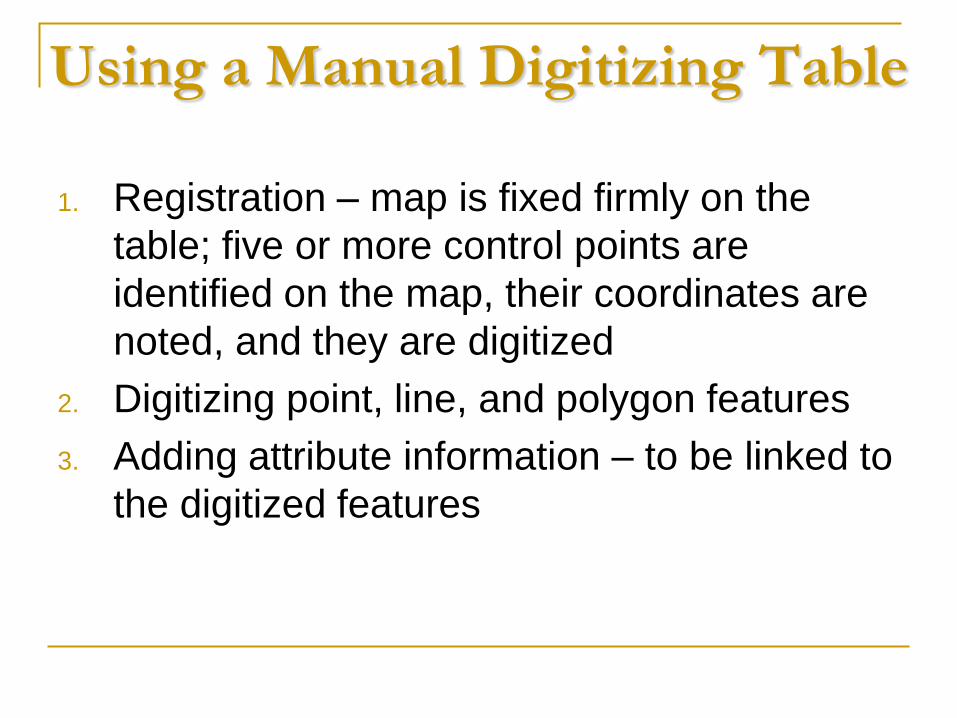
Using a Manual Digitizing Table
1. Registration – map is fixed firmly on the
table; five or more control points are
identified on the map, their coordinates are
noted, and they are digitized
2. Digitizing point, line, and polygon features
3. Adding attribute information – to be linked to
the digitized features
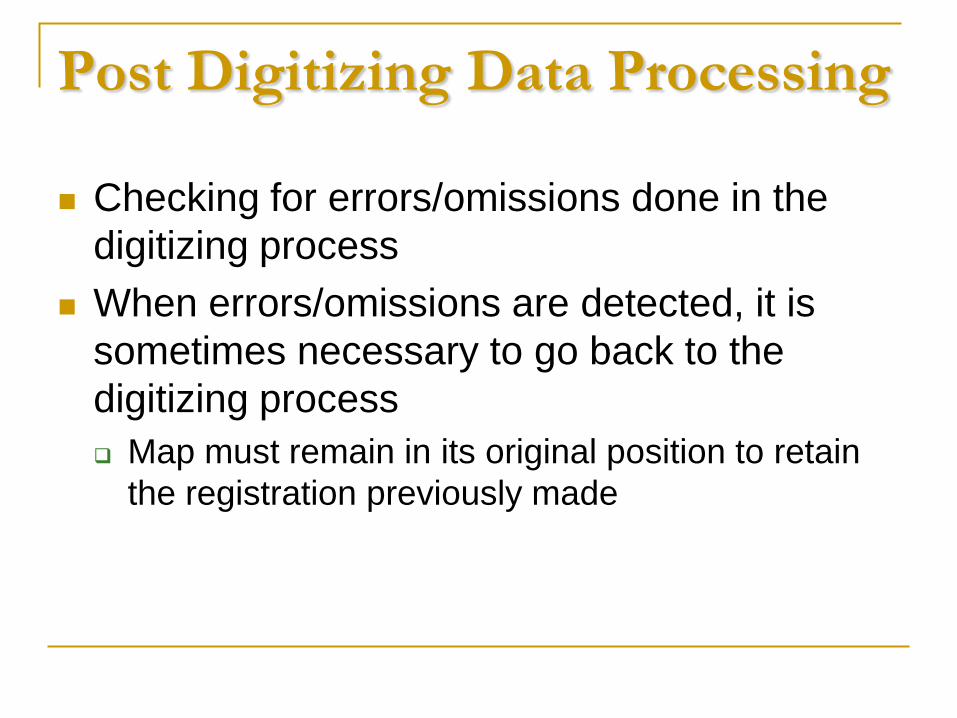
Post Digitizing Data Processing
Checking for errors/omissions done in the
digitizing process
When errors/omissions are detected, it is
sometimes necessary to go back to the
digitizing process
Map must remain in its original position to retain
the registration previously made
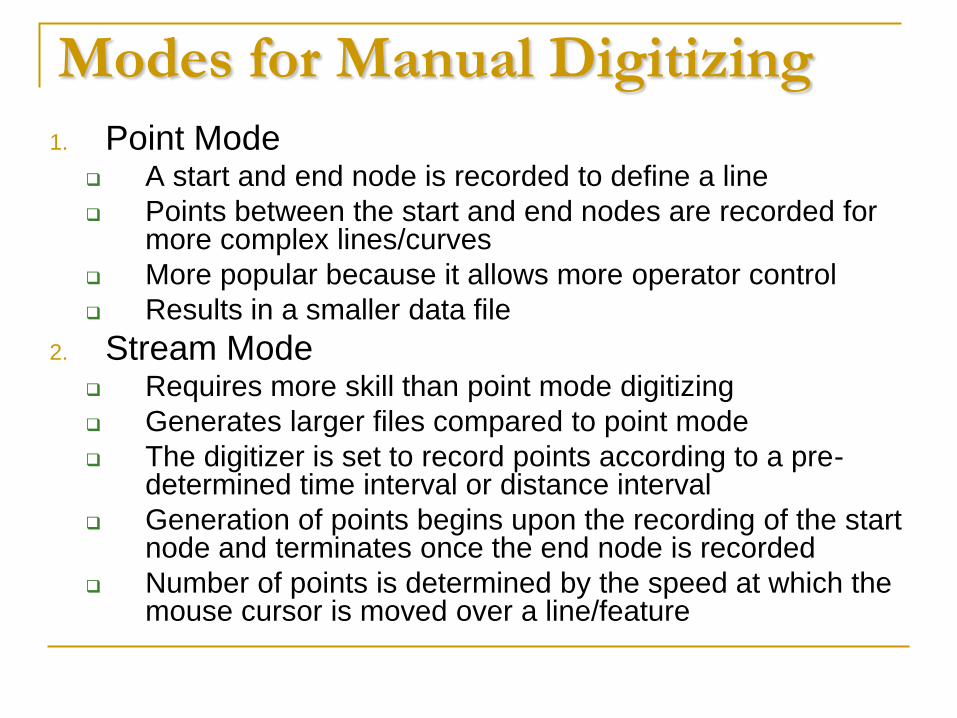
Modes for Manual Digitizing
1. Point Mode A start and end node is recorded to define a line
Points between the start and end nodes are recorded for more complex lines/curves
More popular because it allows more operator control
Results in a smaller data file
2. Stream Mode Requires more skill than point mode digitizing
Generates larger files compared to point mode
The digitizer is set to record points according to a pre-determined time interval or distance interval
Generation of points begins upon the recording of the start node and terminates once the end node is recorded
Number of points is determined by the speed at which the mouse cursor is moved over a line/feature
Computer-Assisted Digitizing
Heads-up or On-screen digitizing
May be automatic or semi-automatic
Used instead of manual digitizing when a large number of complex maps is to be digitized in a short period of time
Popularity has grown considerably due to improved hardware design, software capabilities, and data-compression techniques
Very efficient and time-saving
Proprietary hardware and software are required very expensive
Semi-Automatic Digitizing
Process
1. Scanning map to the computer (raster format)
2. Operator moves cursor to a position at the start
of a line/contour and activates the software
3. Software automatically converts the raster data
to vector by following the pixels until it
encounters a break
4. Operator moves the cursor to another position
Keyboard Entry/Keycoding
Used for entering tabular/attribute data, which are commonly
only available in paper form, into the GIS database
Examples: vegetation classes, polygon identifiers, soil
types, topographic detail, etc.
May involve numeric, alphanumeric, or logical data
May be done through keyboard entry or text scanning (OCR)
Manageable for a small amount of data
Disadvantages:
Not feasible for a large amount of data
Prone to typographical errors
Electronic Data Transfer
Used when data is already in digital form
Usually followed by data conversion,
particularly when the transferred data is in a
different format than what is required
Data Editing
Errors and inaccuracies during data
acquisition and input translate into errors in
the GIS
Before further analyses are made, these
errors should be corrected to prevent the
errors from propagating to generated
information
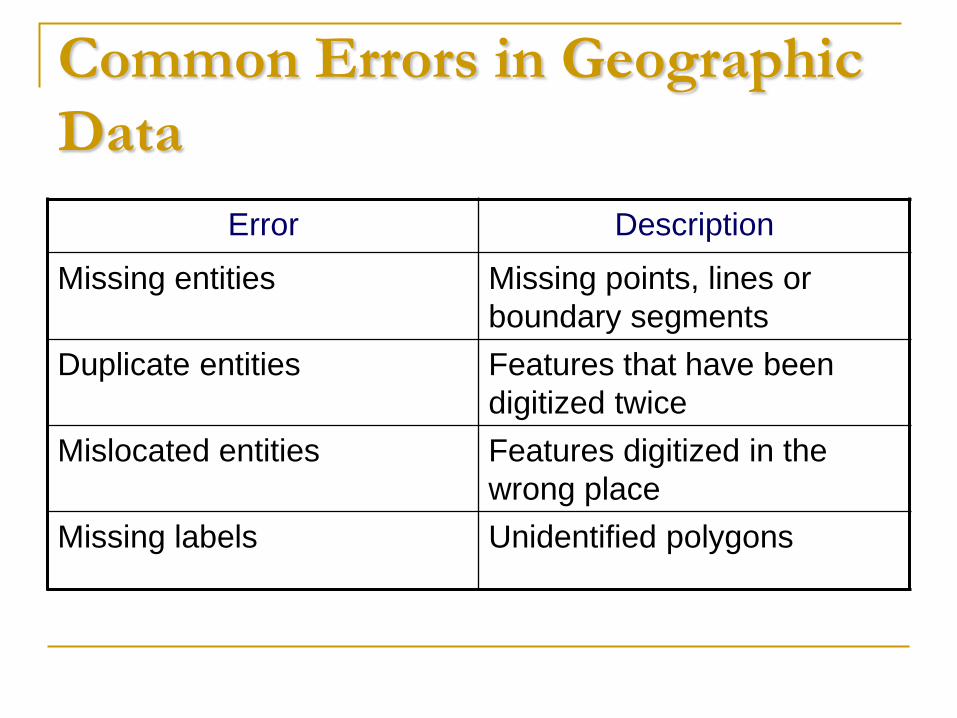
Common Errors in Geographic
Data
Error Description
Missing entities Missing points, lines or
boundary segments
Duplicate entities Features that have been
digitized twice
Mislocated entities Features digitized in the
wrong place
Missing labels Unidentified polygons
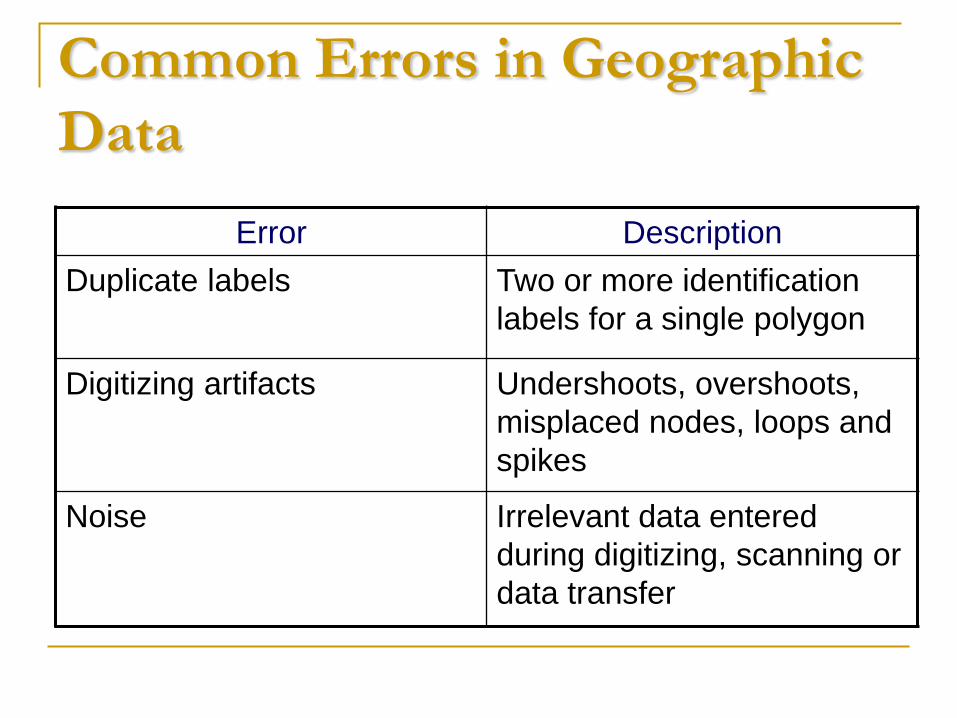
Common Errors in Geographic
Data
Error Description
Duplicate labels Two or more identification
labels for a single polygon
Digitizing artifacts Undershoots, overshoots,
misplaced nodes, loops and
spikes
Noise
Irrelevant data entered
during digitizing, scanning or
data transfer
Raster Data Editing
Refers to correcting specific contents of
raster images
To produce a clean raster image which will
meet data-processing standards
Can better be done using digital image
processing packages, instead of GIS
packages
Raster Data Editing Functions
Filling holes and gaps
Edge smoothing and boundary simplification
– remove or fill single-pixel irregularities
along line edges
Deskewing – rotate the image by a small
angle to align with axis to be used
Speckle removal or filtering – remove noise
or random pixels
Raster Data Editing Functions
Erase or delete – manually removing unwanted
pixels/speckles
Thinning – reduce the width of linear features to
a single cell
Clipping/Subsetting – cut/remove a specific
portion of the image to have a new, smaller
image
Drawing and Rasterization – add vector graphics
or text to a raster image and convert them to a
raster form
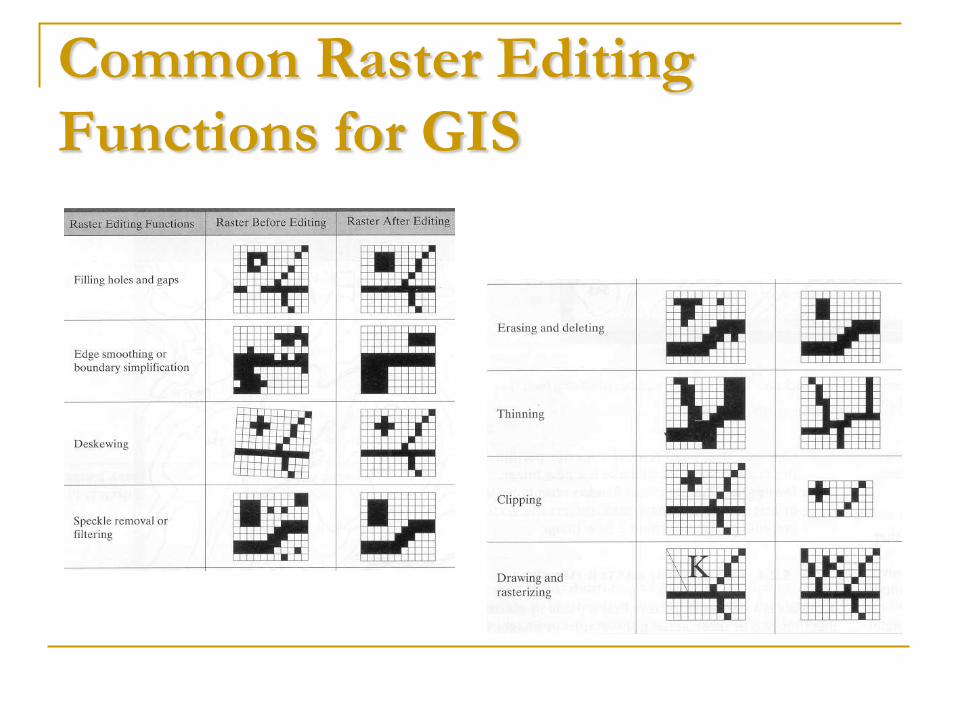
Common Raster Editing
Functions for GIS
Vector Data Editing
Post digitizing process designed to ensure
integrity of the data before using them in the
GIS
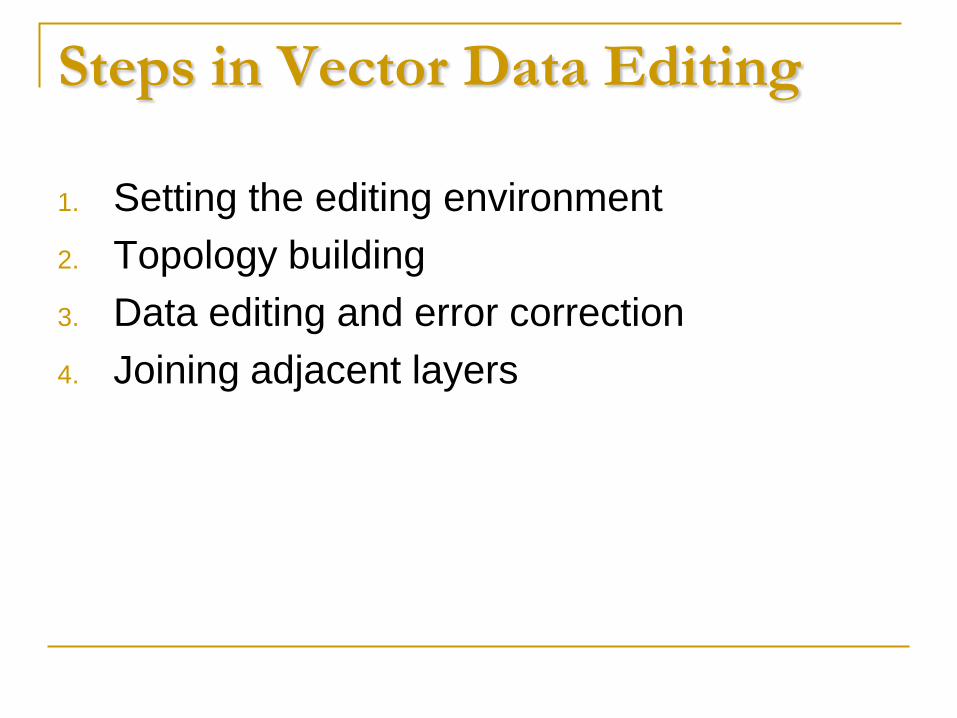
Steps in Vector Data Editing
1. Setting the editing environment
2. Topology building
3. Data editing and error correction
4. Joining adjacent layers
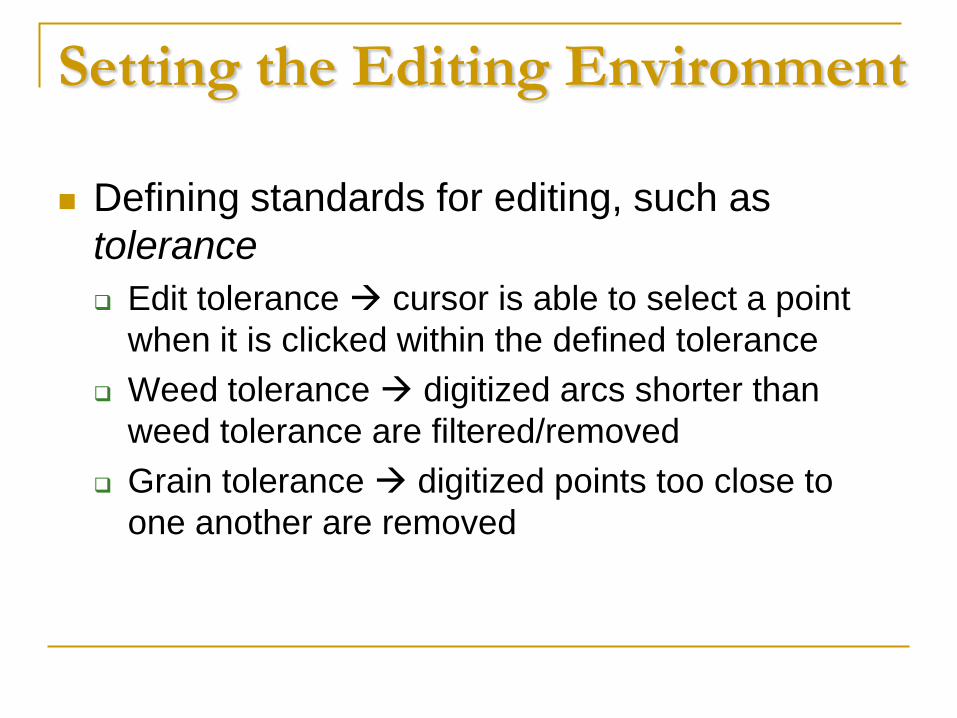
Setting the Editing Environment
Defining standards for editing, such as
tolerance
Edit tolerance cursor is able to select a point
when it is clicked within the defined tolerance
Weed tolerance digitized arcs shorter than
weed tolerance are filtered/removed
Grain tolerance digitized points too close to
one another are removed
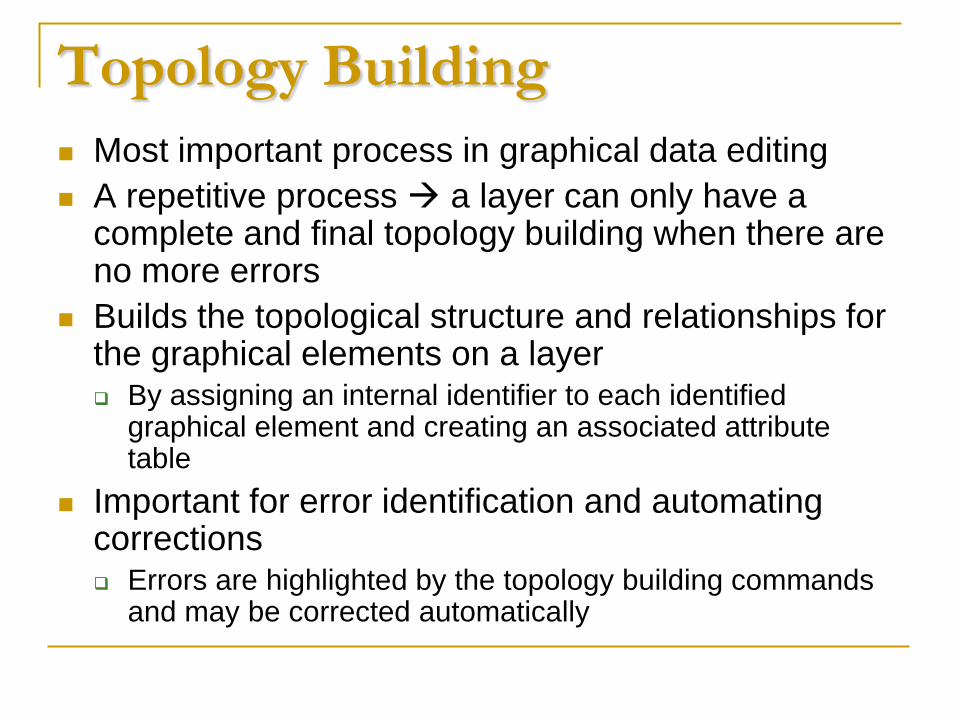
Topology Building
Most important process in graphical data editing
A repetitive process a layer can only have a complete and final topology building when there are no more errors
Builds the topological structure and relationships for the graphical elements on a layer By assigning an internal identifier to each identified
graphical element and creating an associated attribute table
Important for error identification and automating corrections Errors are highlighted by the topology building commands
and may be corrected automatically
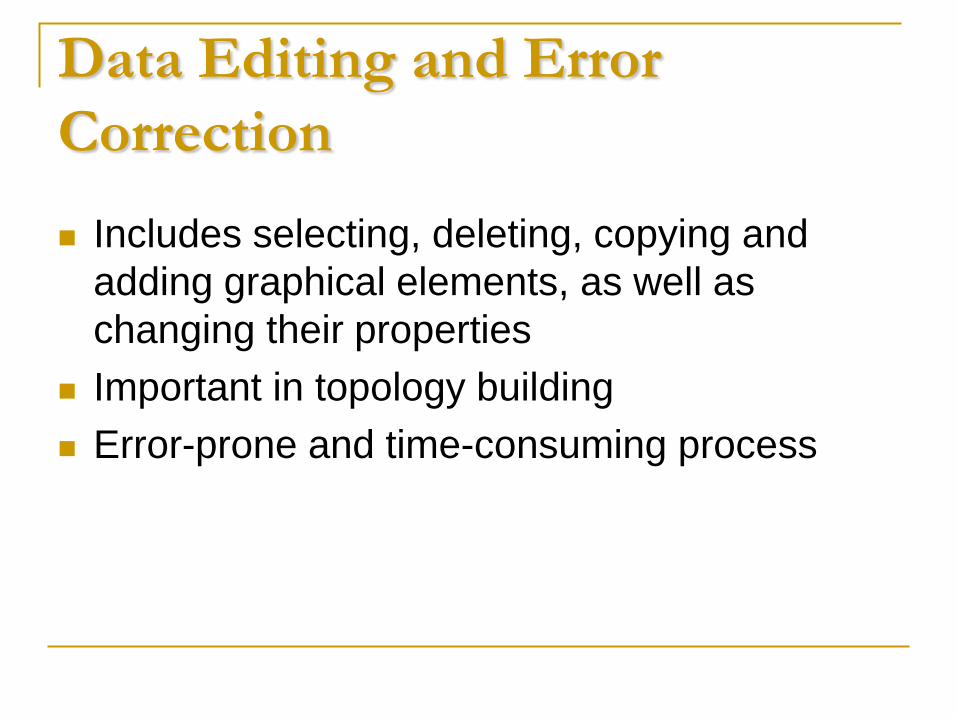
Data Editing and Error
Correction
Includes selecting, deleting, copying and
adding graphical elements, as well as
changing their properties
Important in topology building
Error-prone and time-consuming process
Joining Adjacent Layers
Needed when there are multiple map sheets
to be used
Ensures that all layers form a continuous
geographic database when joined together
Attribute Data Editing
Attribute errors – most difficult to detect since
the GIS doesn’t know which attributes are
correct and incorrect
Usually involves missing attribute values,
incorrect attribute values, or misplaced
attribute values
Generally done manually
Data Conversion
After input and editing of individual datasets,
it is usually necessary to process the data
before integrating them all into a single GIS
Process of converting data on one form to a
more useful format for the specific GIS
application
One of the most tedious, time-consuming,
and error-prone processes in GIS
Digital Data Conversion Process
1. Acquisition – digitizing existing maps, purchasing ready-made products, collecting new data using field surveying, GPS, photogrammetry, or remote sensing
2. Editing – cleaning acquired digital data to meet certain specifications
3. Formatting/Translating – converting digital data into the specific physical database format of the GIS
4. Linking – associating attribute data with the graphical data
Raster to Vector Conversion
Vectorization
Converting scanned raster images to vector
features (point, line, or polygons)
Results are visually problematic most of the
time
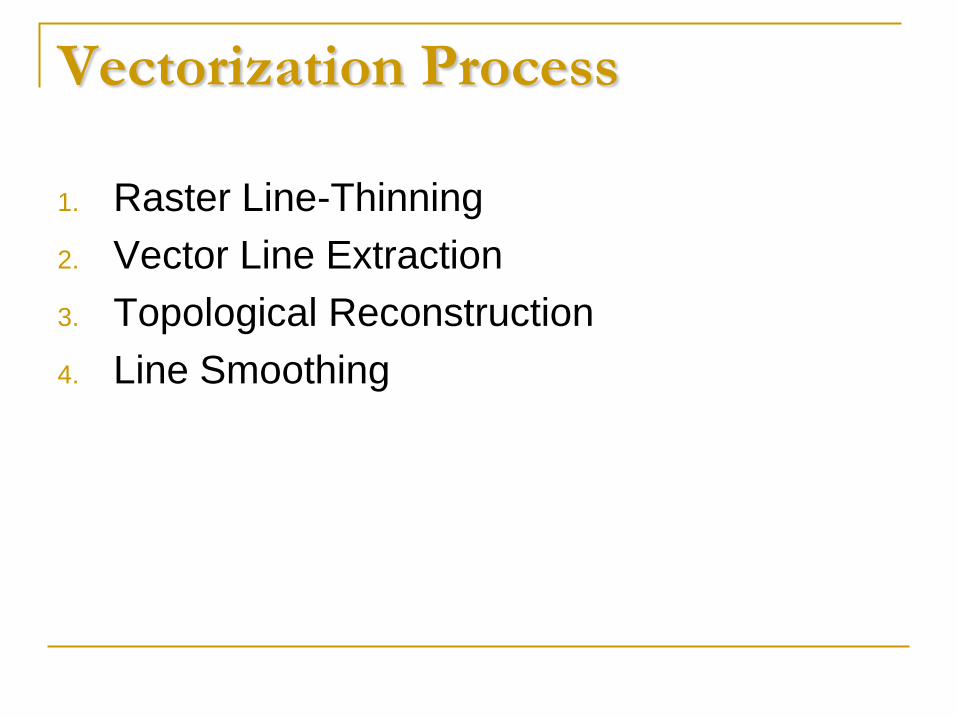
Vectorization Process
1. Raster Line-Thinning
2. Vector Line Extraction
3. Topological Reconstruction
4. Line Smoothing
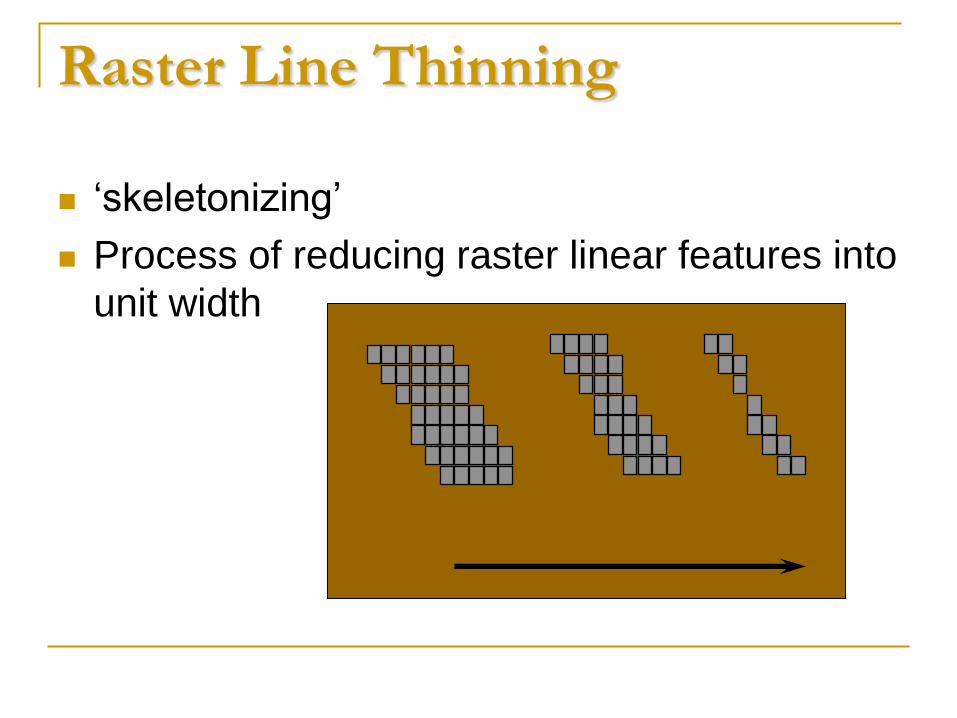
Raster Line Thinning
‘skeletonizing’
Process of reducing raster linear features into
unit width
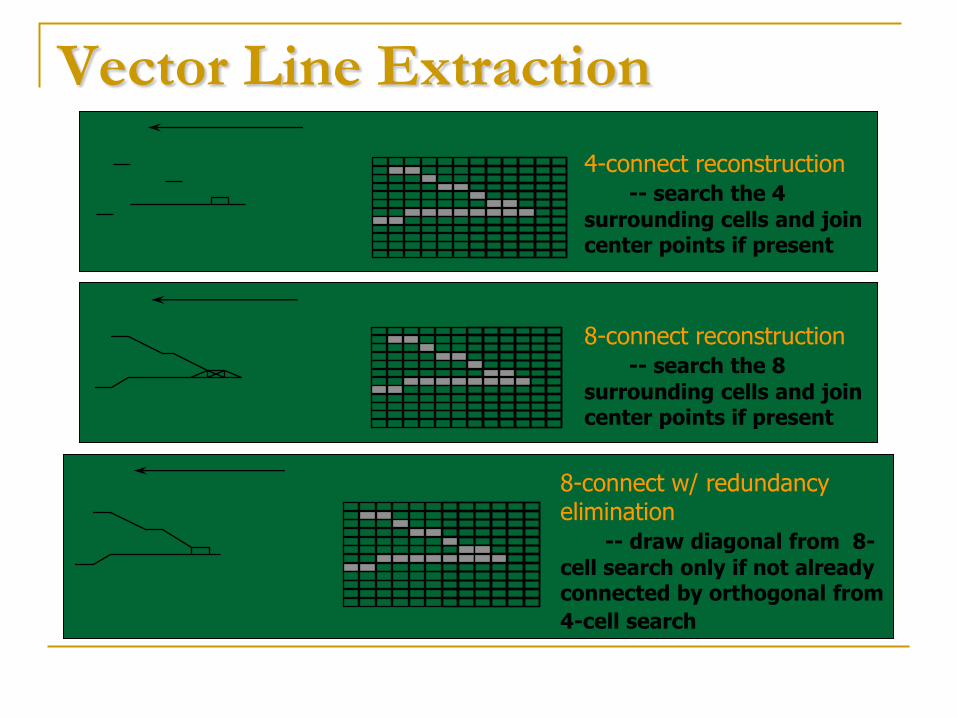
Vector Line Extraction
4-connect reconstruction -- search the 4
surrounding cells and join center points if present
8-connect reconstruction -- search the 8
surrounding cells and join center points if present
8-connect w/ redundancy elimination -- draw diagonal from 8-
cell search only if not already connected by orthogonal from
4-cell search
Topological Reconstruction
involves the creation of nodes at line
junctions, construction of arcs, and polygon
definition
Line Smoothing
Employed to make the resulting vectors more
visually appealing
during raster to vector conversion, the results are
usually jagged/crooked (especially for diagonal
lines)
Vectorization Methods
1. Manual – user selects and picks out
features to be converted
2. Automatic – entire raster image is
converted by the computer software
without user intervention
3. Semi-automatic – combination of
manual point picking and computerized
line tracing
– produces best results
Post Scanning Processing
1. Raster to vector conversion
2. Raster text conversion
3. Raster symbol conversion
4. Graphical data editing
5. Attribute data tagging
Raster to Vector Conversion
Changing raster images into vector graphics
May be done manually, automatically, or
semi-automatically
Major limiting factor is the map quality
Raster Text Conversion
Characters in the raster image are converted
to alphanumeric data using character
recognition (ex. OCR)
Involves a large amount of manual
verification of the results and correction of
errors
Raster Symbol Conversion
Cartographic symbols in the raster image are
converted to alphanumeric codes
Largely a manual task
Automated symbol recognition is a much more
difficult task than character recognition
No available standards in the form, size, and
codes of cartographic symbolss
Graphical Data Editing
Cleaning graphics by removing data
conversion errors
Attribute Data Tagging
Adding attribute data (e.g., feature identifiers,
feature codes, and contour labels) to the
graphical data
Vector to Raster Conversion
Rasterization
process of converting vector data (points,
lines and polygons) into raster data (series of
cells each with a discrete value)
Produces visually satisfactory results
May be problematic in terms of the attributes
assigned to pixels
Most evident along edges/boundaries (partial
cells)
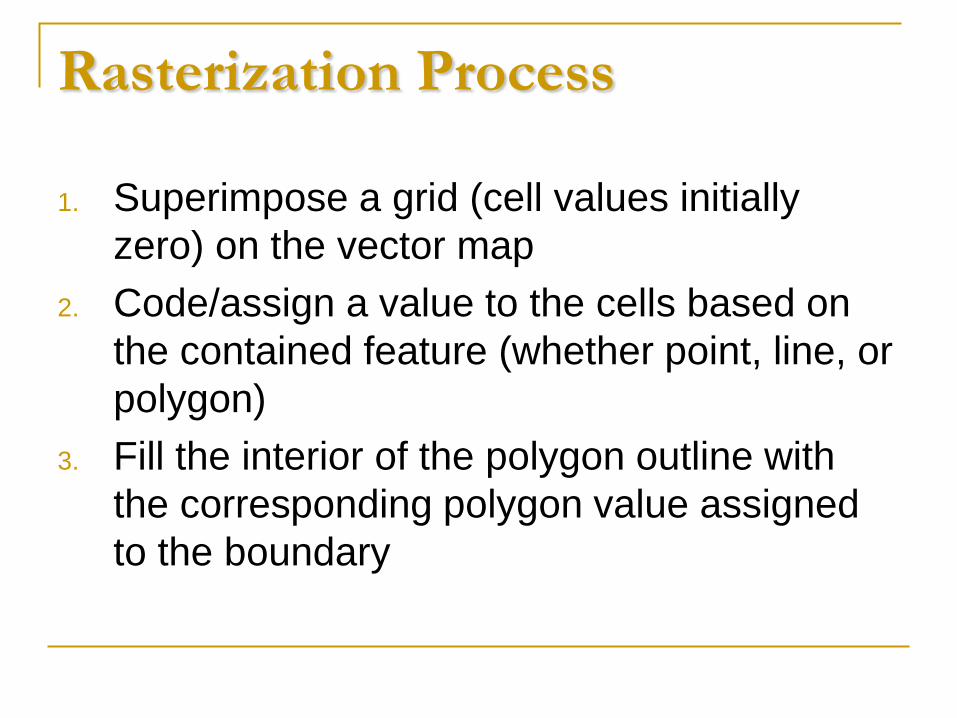
Rasterization Process
1. Superimpose a grid (cell values initially
zero) on the vector map
2. Code/assign a value to the cells based on
the contained feature (whether point, line, or
polygon)
3. Fill the interior of the polygon outline with
the corresponding polygon value assigned
to the boundary
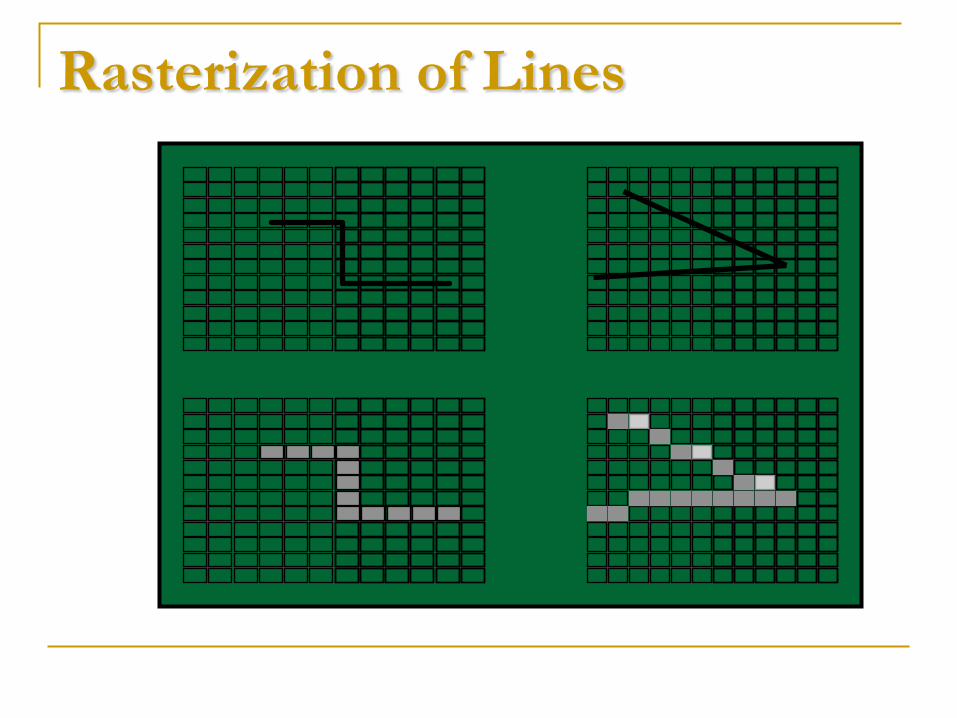
Rasterization of Lines
Data Integration
Combining data from various sources and in
various formats to be able to extract
more/better information
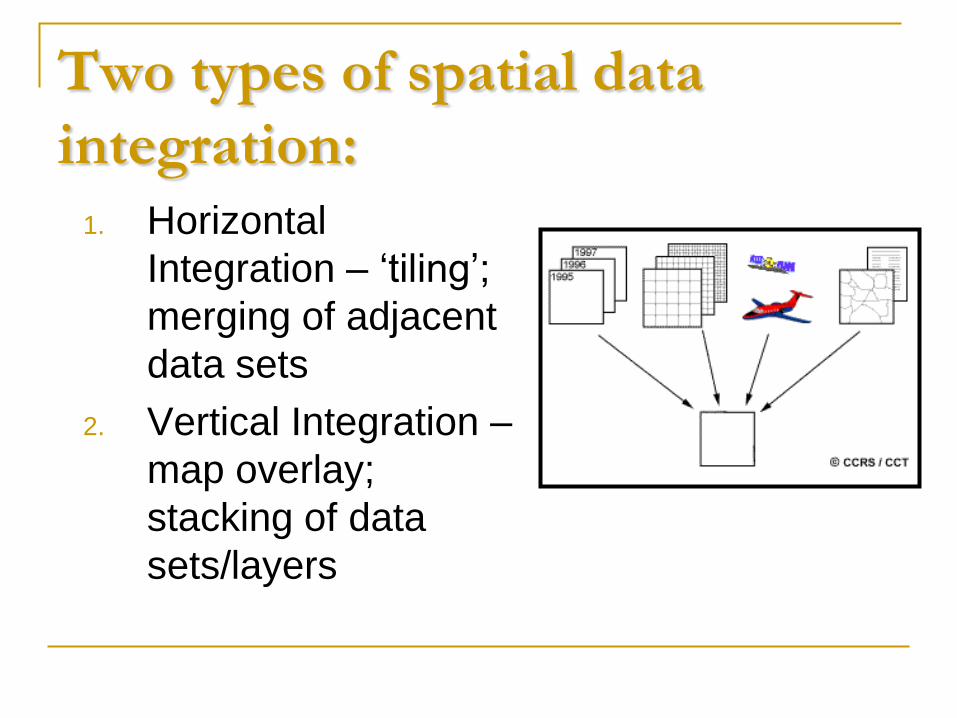
Two types of spatial data
integration:
1. Horizontal
Integration – ‘tiling’;
merging of adjacent
data sets
2. Vertical Integration –
map overlay;
stacking of data
sets/layers
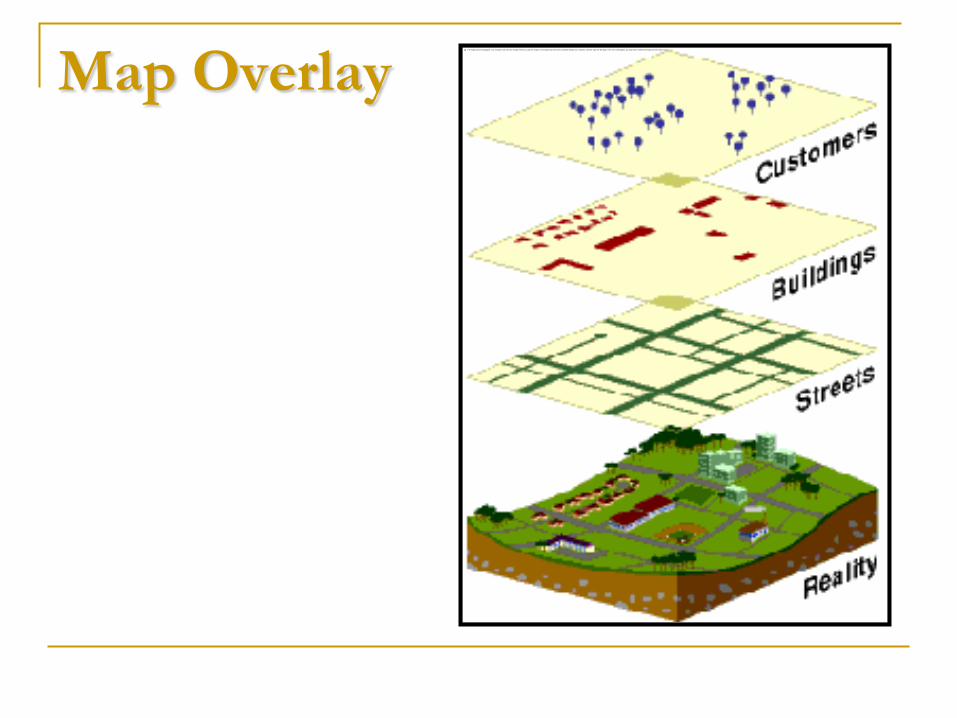
Map Overlay
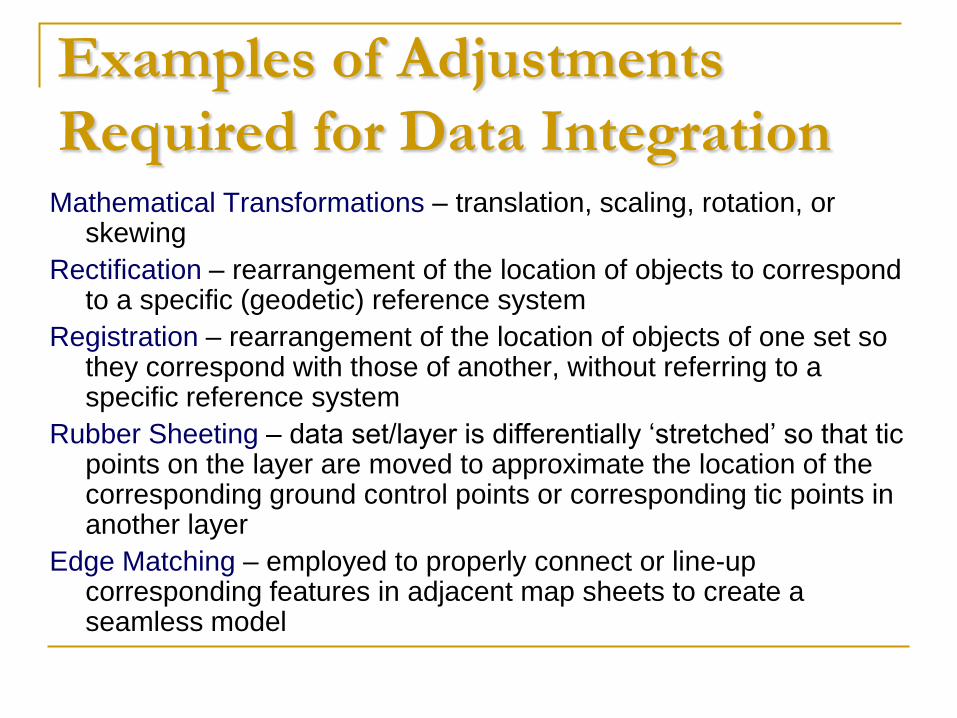
Examples of Adjustments
Required for Data Integration Mathematical Transformations – translation, scaling, rotation, or
skewing
Rectification – rearrangement of the location of objects to correspond to a specific (geodetic) reference system
Registration – rearrangement of the location of objects of one set so they correspond with those of another, without referring to a specific reference system
Rubber Sheeting – data set/layer is differentially ‘stretched’ so that tic points on the layer are moved to approximate the location of the corresponding ground control points or corresponding tic points in another layer
Edge Matching – employed to properly connect or line-up corresponding features in adjacent map sheets to create a seamless model
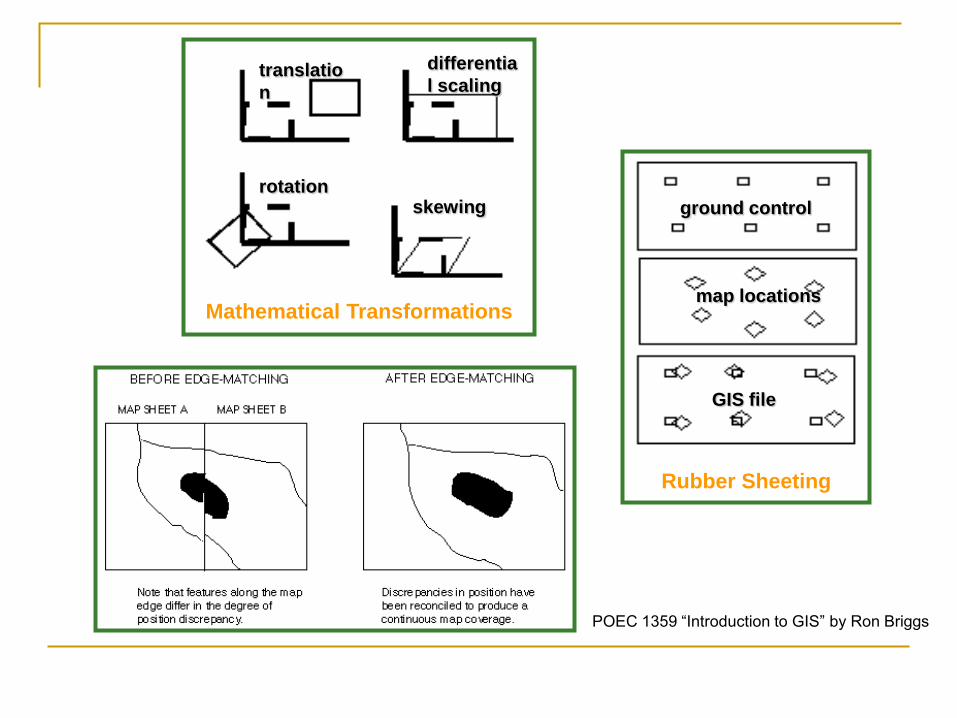
Mathematical Transformations
translatio
n
differentia
l scaling
rotation skewing
Rubber Sheeting
ground control
map locations
GIS file
POEC 1359 “Introduction to GIS” by Ron Briggs

Thank you!