Embed Size (px)
Citation preview
GIS is dead, long live to GIS!
Javier de la Torre - @jatorreFriday, March 8, 13
Friday, March 8, 13
My name is Javier de la Torre, Co-founded Vizzuality, a data analysis and visualization company working lot on environment and maps. We started teveloping CartoDB, and Open Source Geospatial database 2 years ago and now is our main business.
_the GEO world is changingPossibly best time in history to work on the market.
Friday, March 8, 13
the Geospatial market is changing. It is probably the most interesting moment in history to work on this market. Wanna show you why.
_the 4th revolutionJohn SnowArcGISGoogle MapsData visualization and real time
Friday, March 8, 13
My own invention, we are on the 4th revolution :D
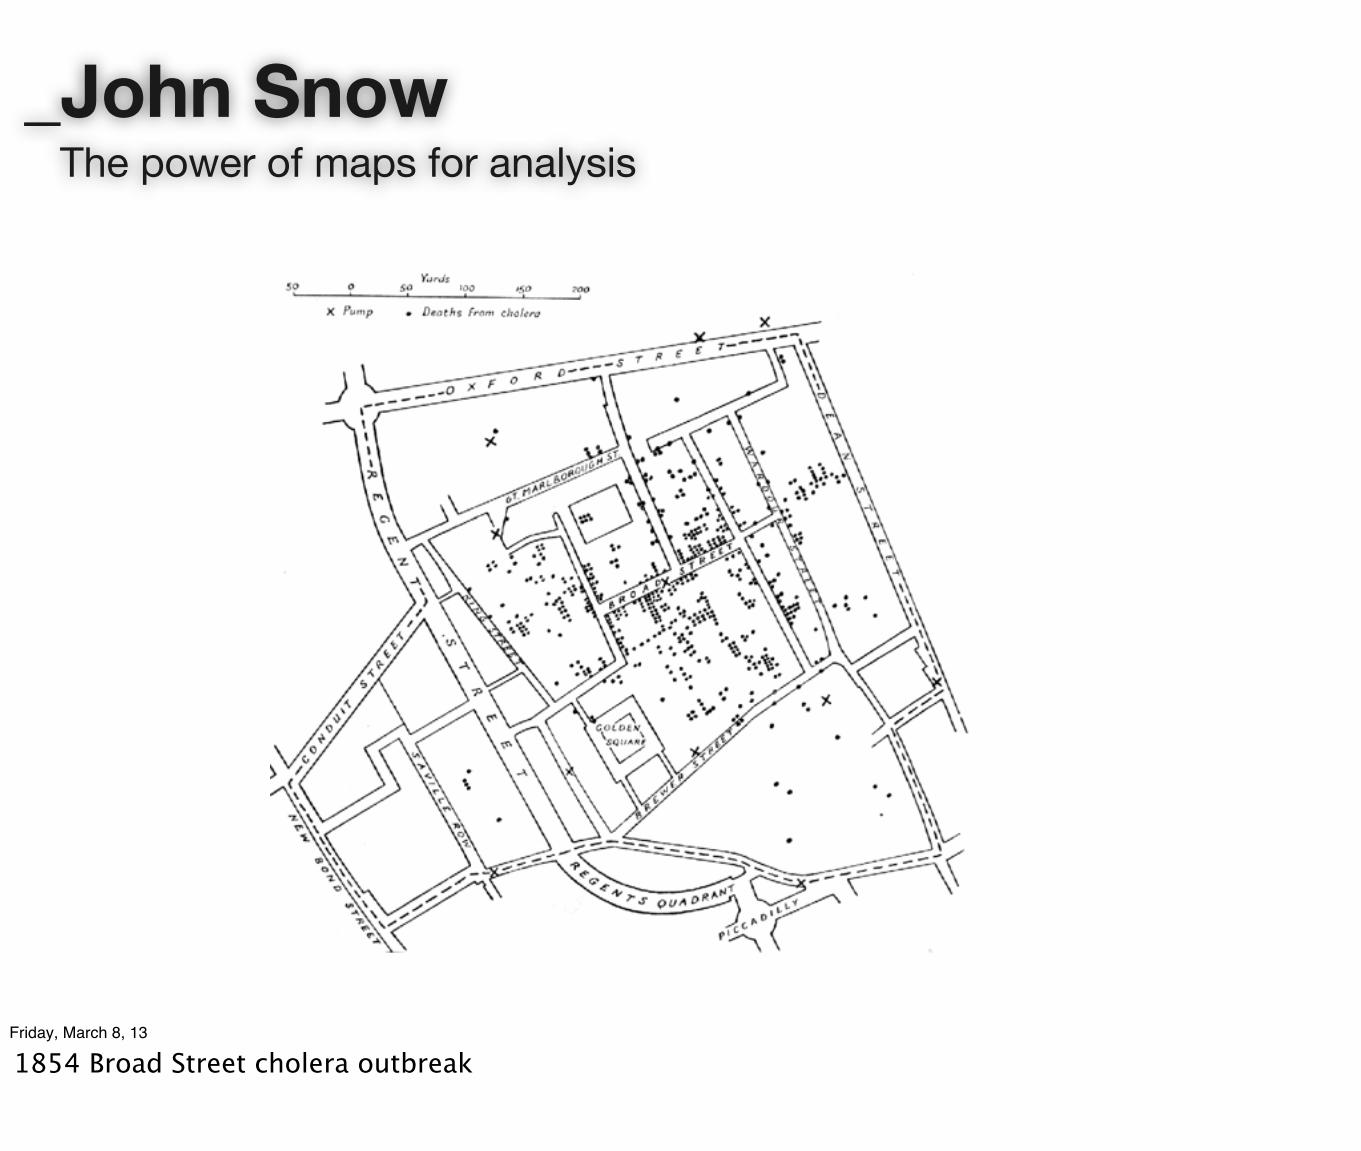
_John SnowThe power of maps for analysis
Friday, March 8, 13
1854 Broad Street cholera outbreak
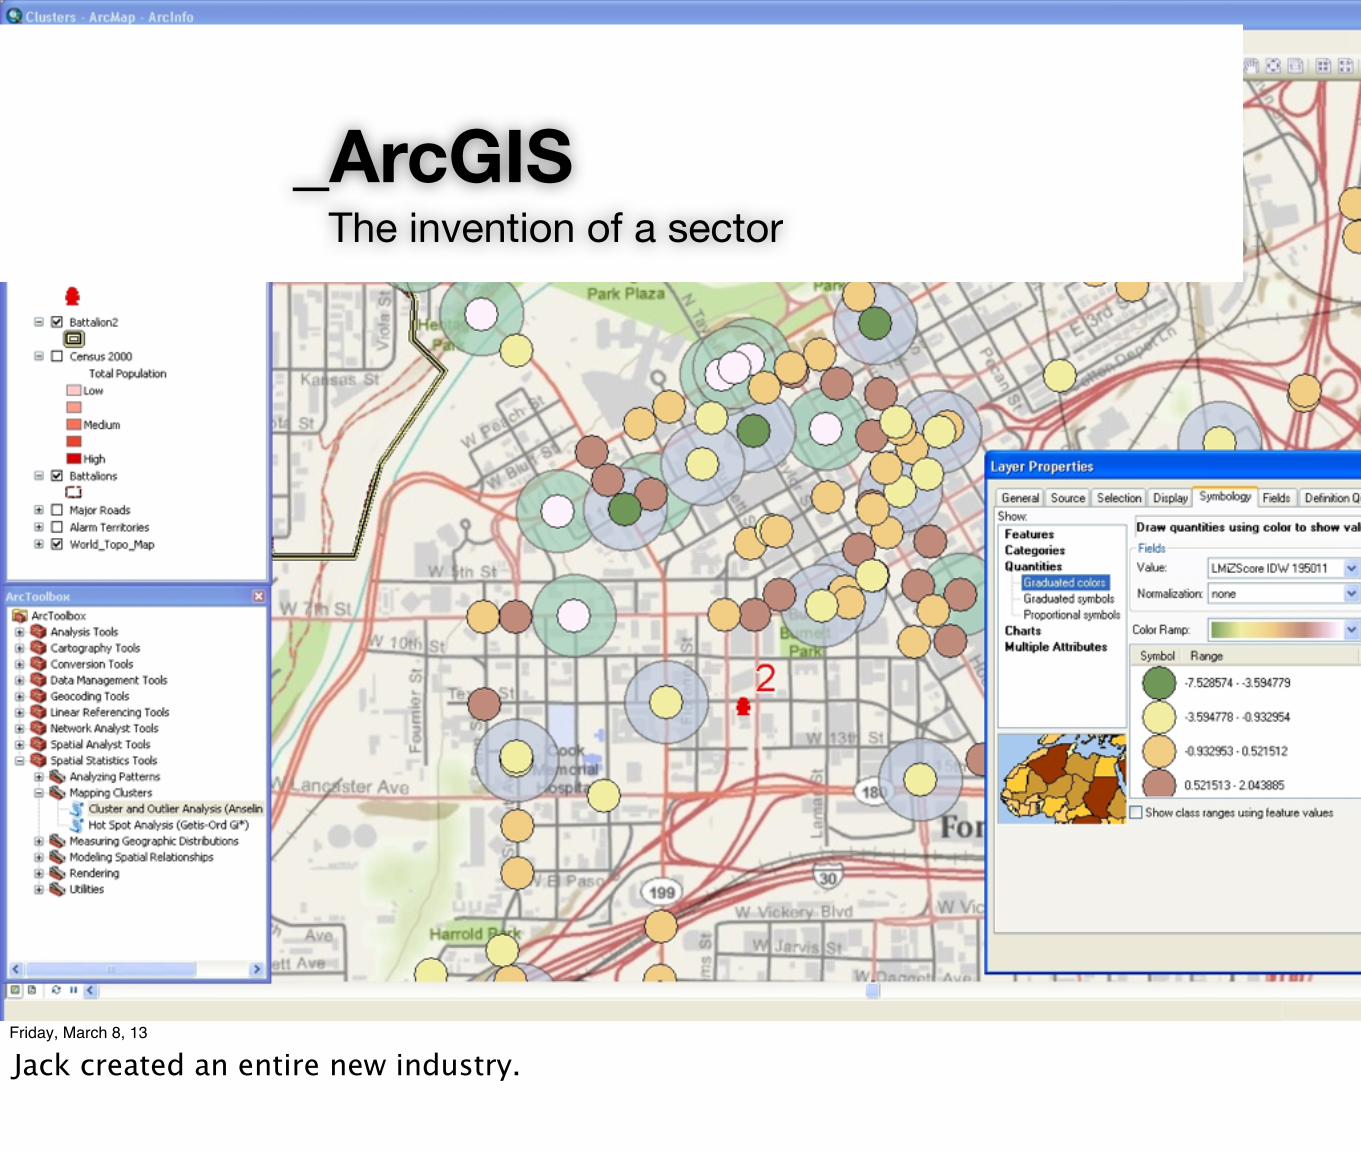
_ArcGISThe invention of a sector
Friday, March 8, 13
Jack created an entire new industry.
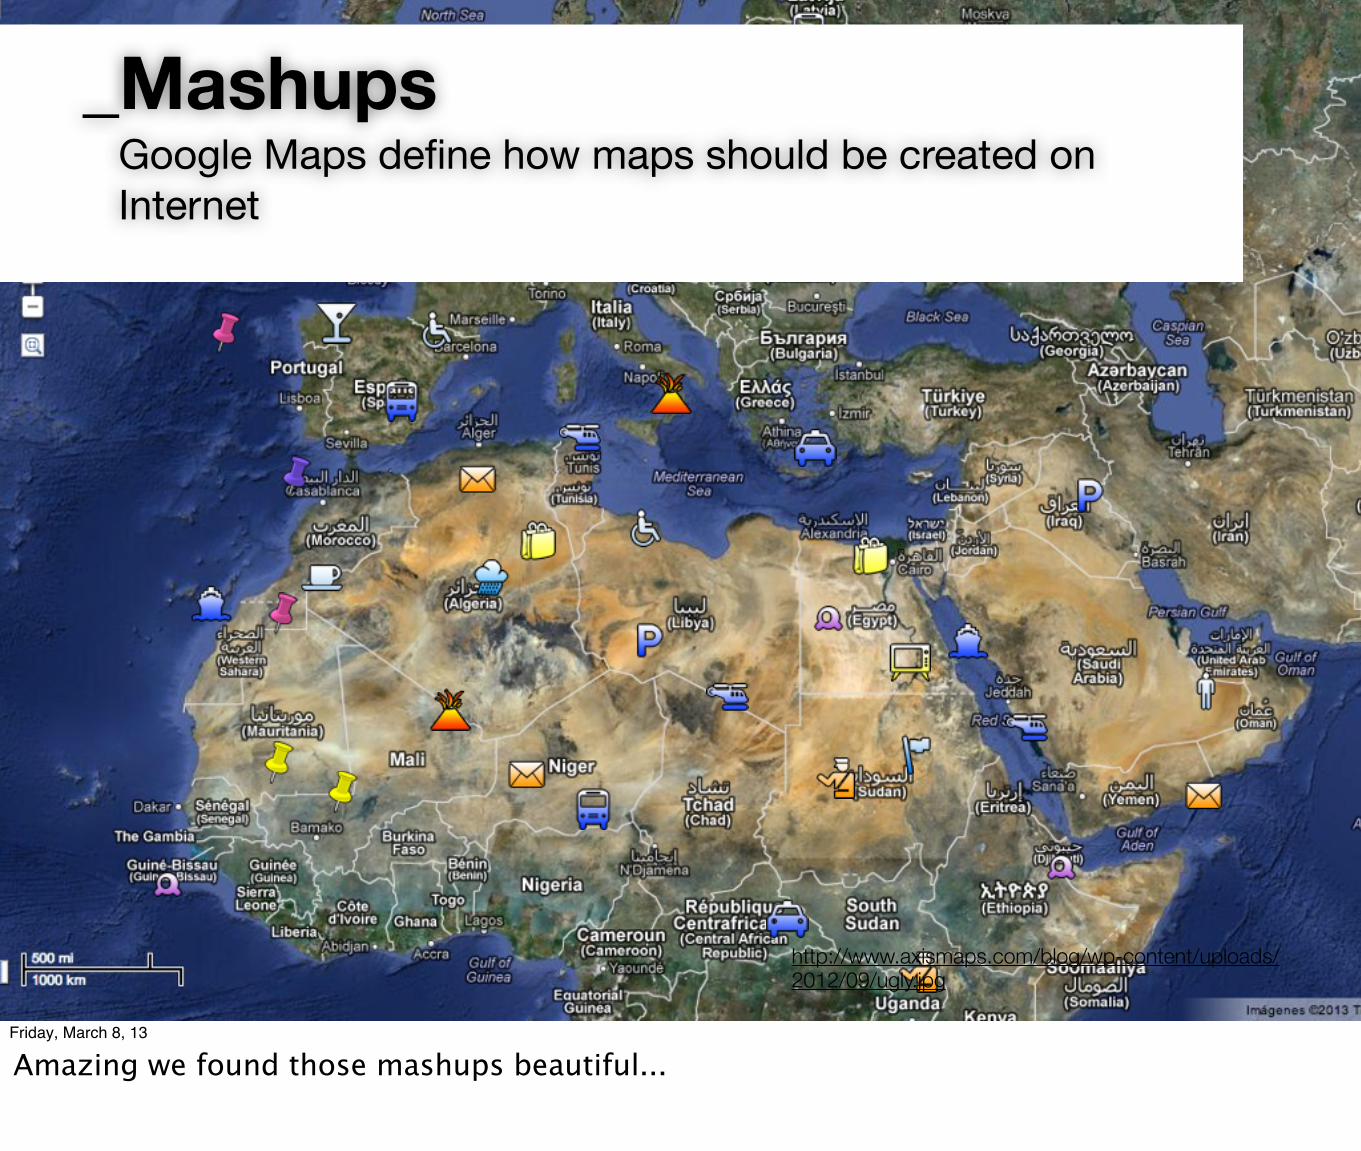
_MashupsGoogle Maps define how maps should be created on Internet
http://www.axismaps.com/blog/wp-content/uploads/2012/09/ugly.jpg
Friday, March 8, 13
Amazing we found those mashups beautiful...
Friday, March 8, 13
Love the volcano marker!
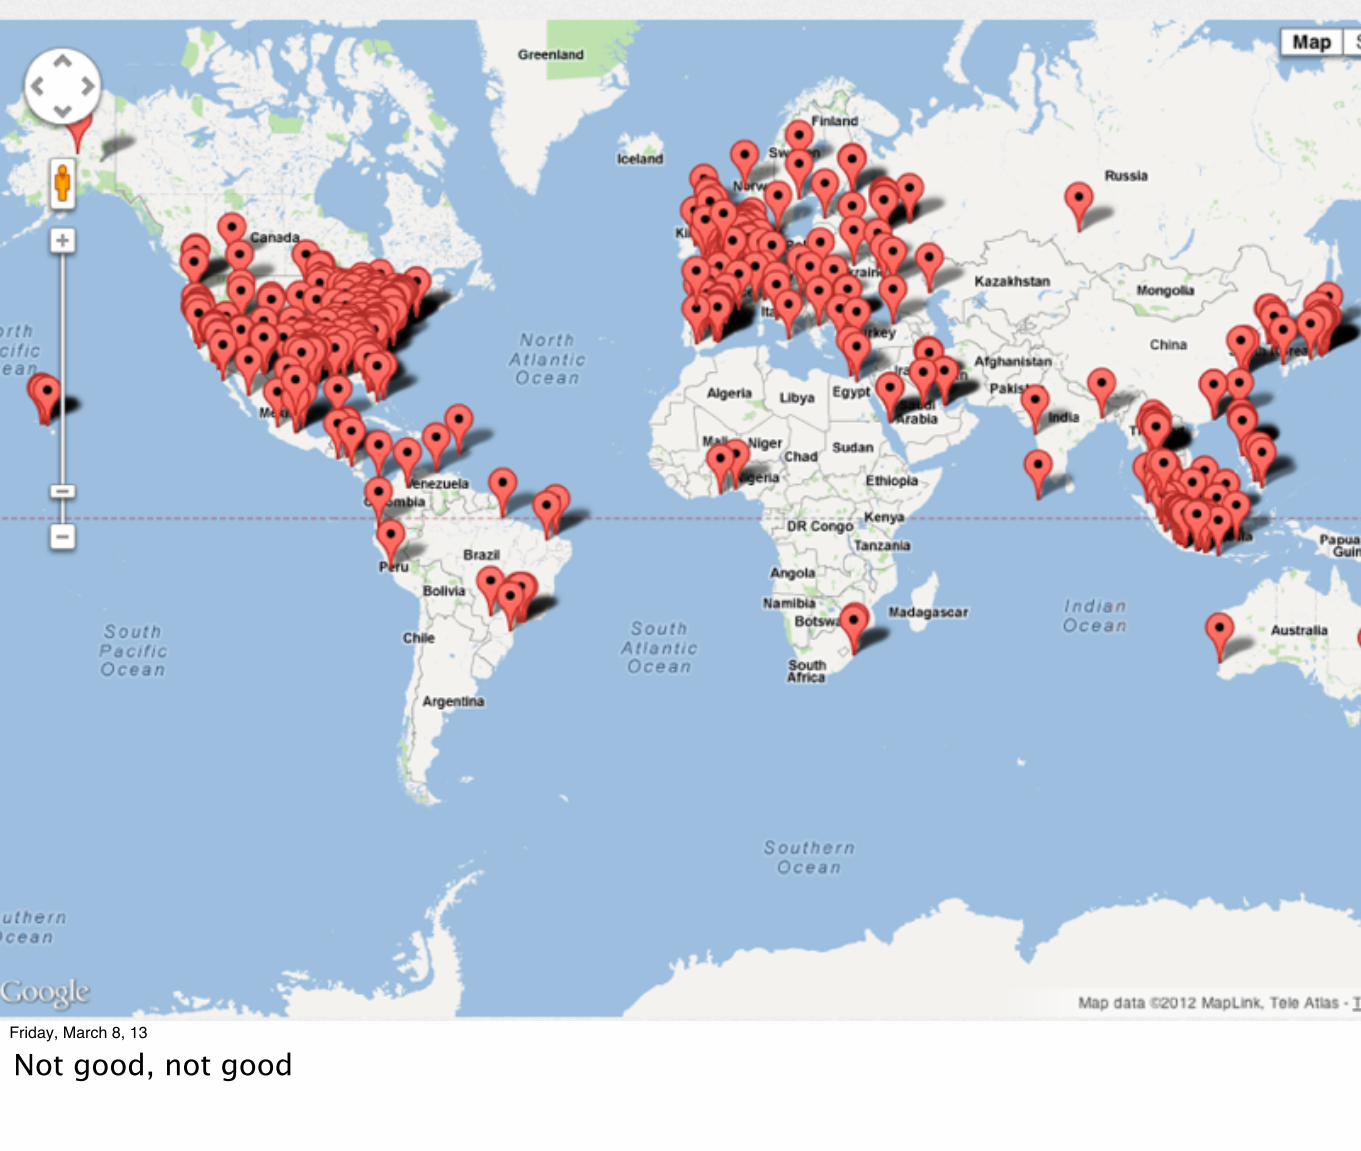
Friday, March 8, 13
Not good, not good
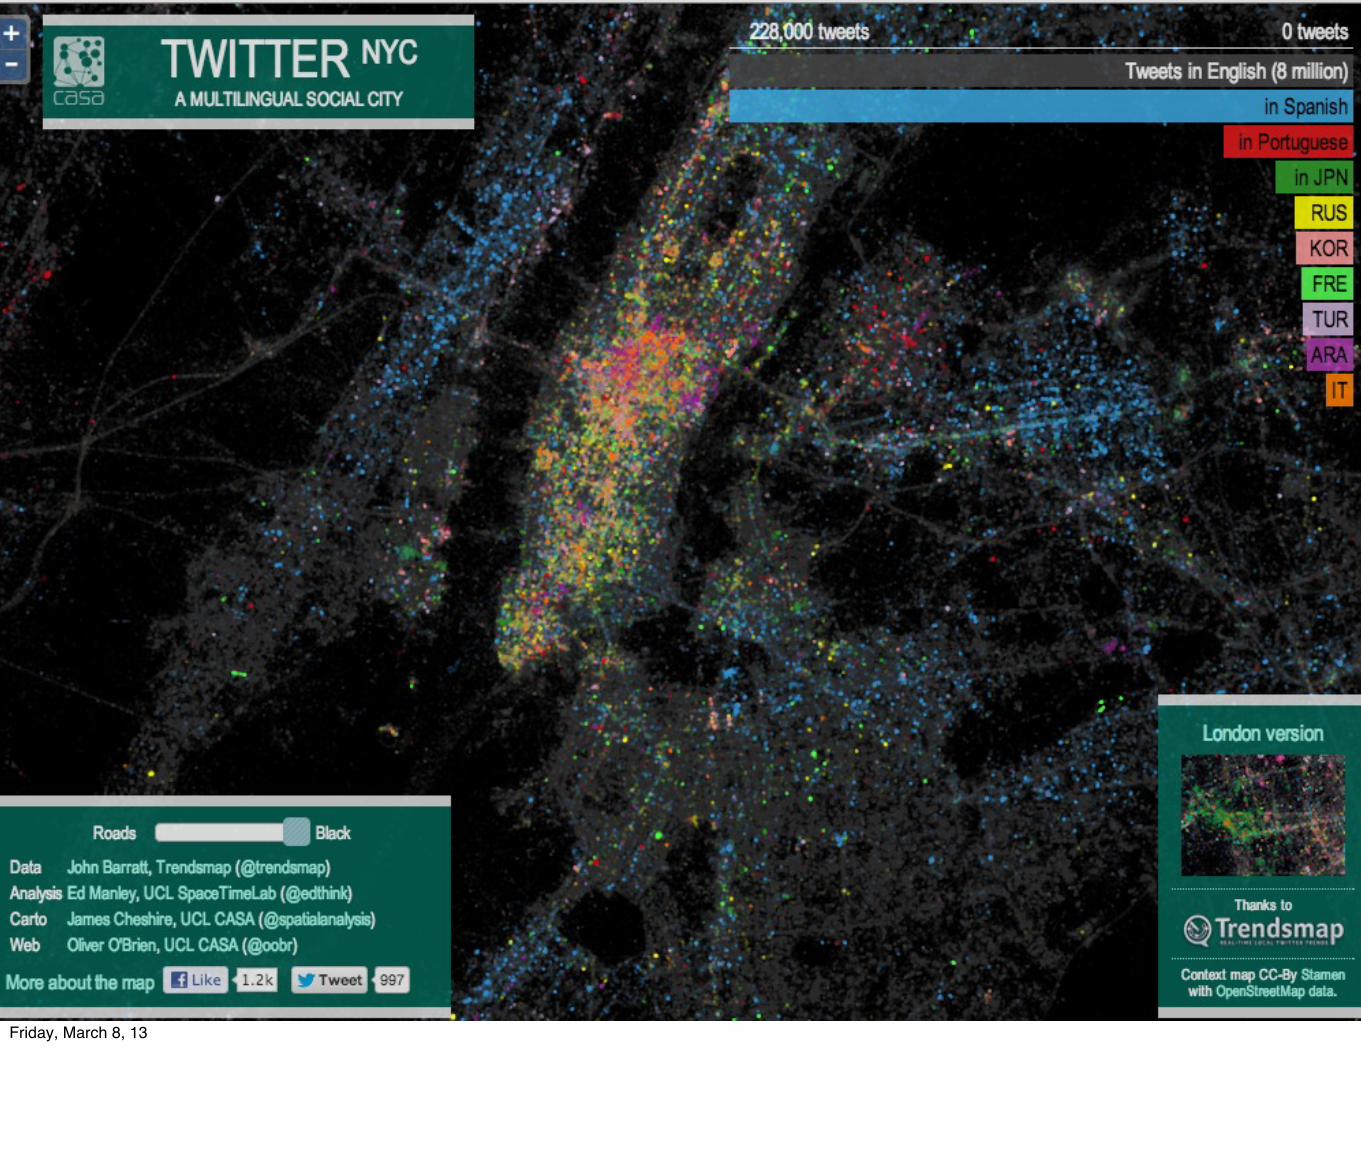
_Data visualizationGoogle Maps is getting old....
Friday, March 8, 13
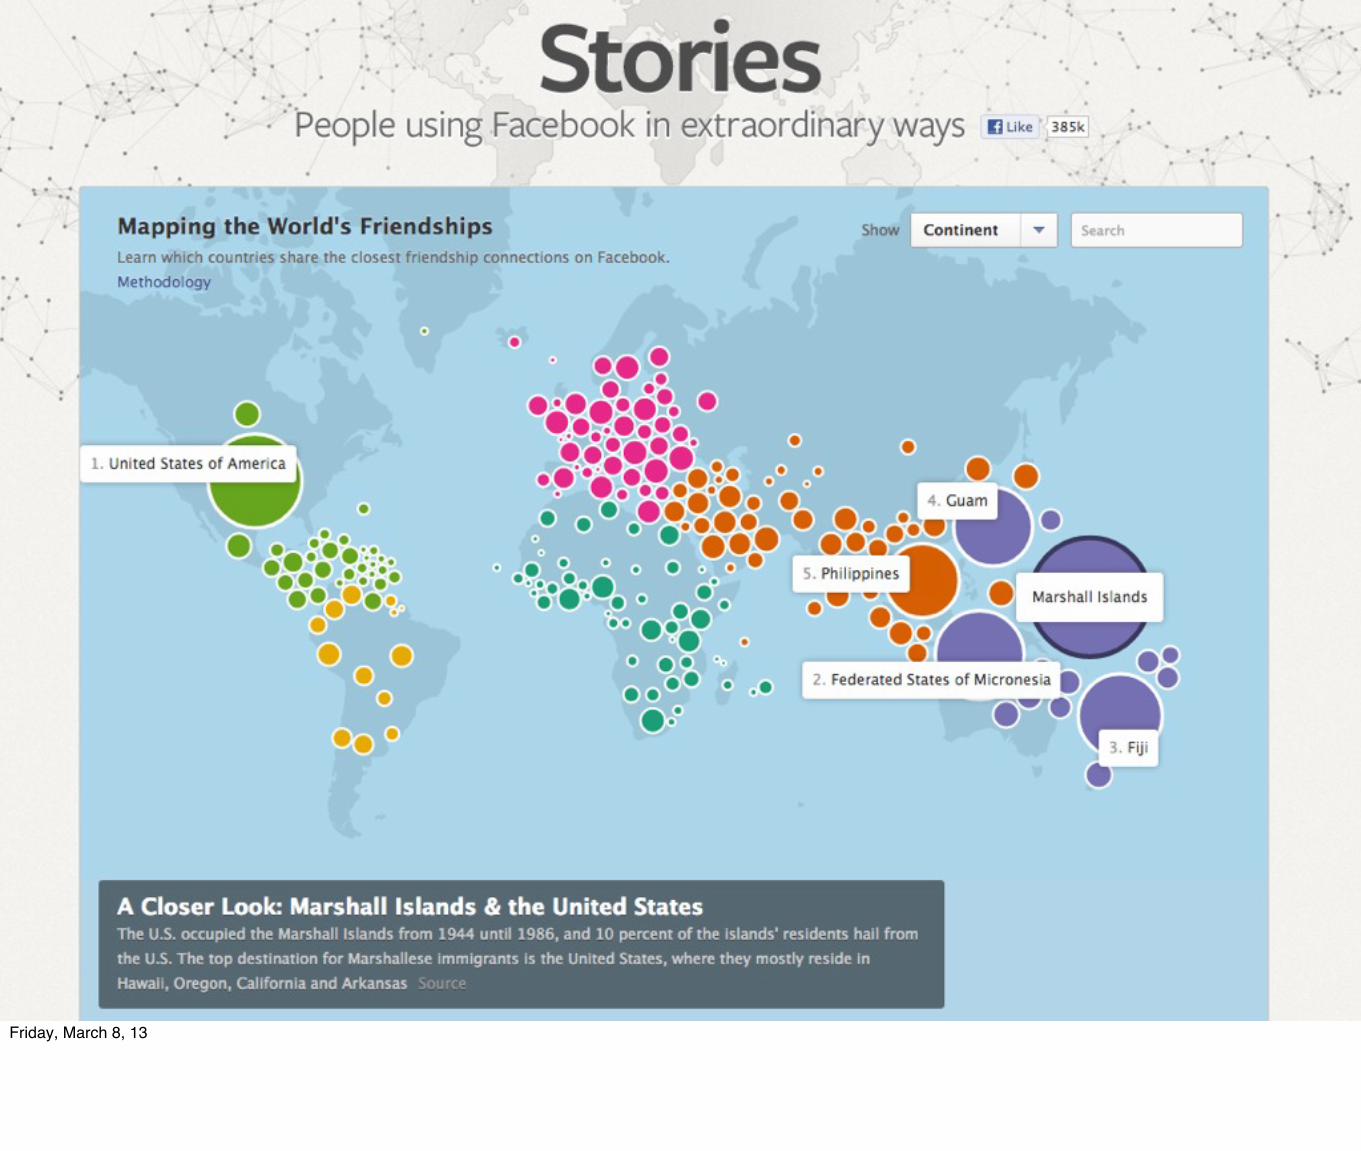
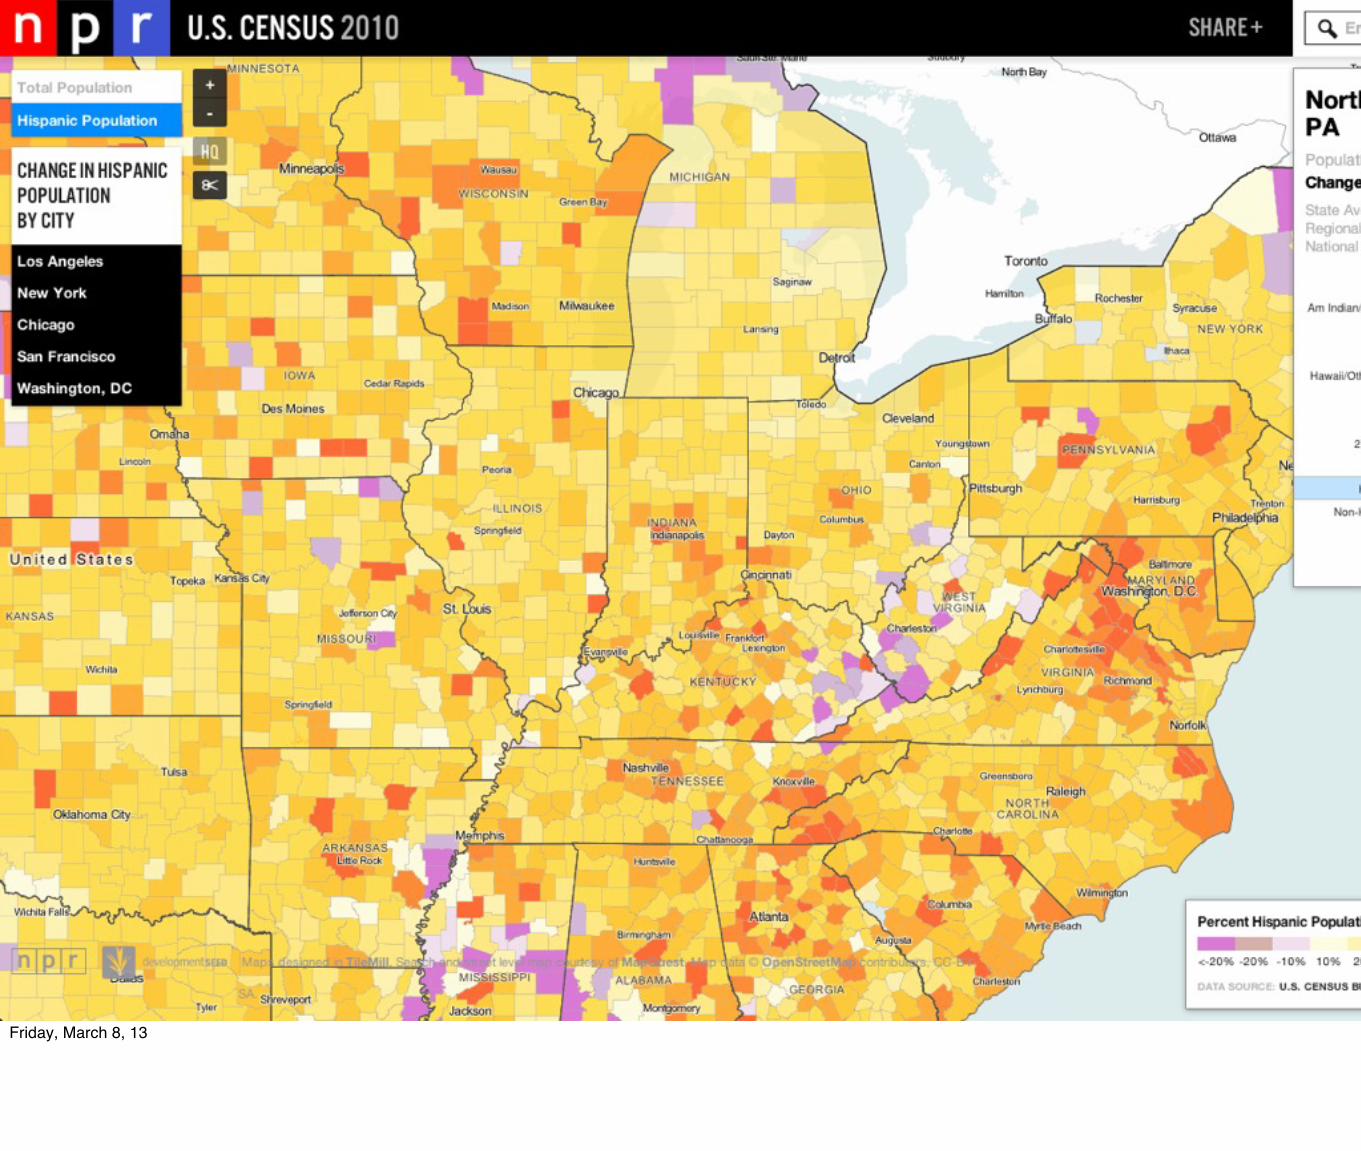
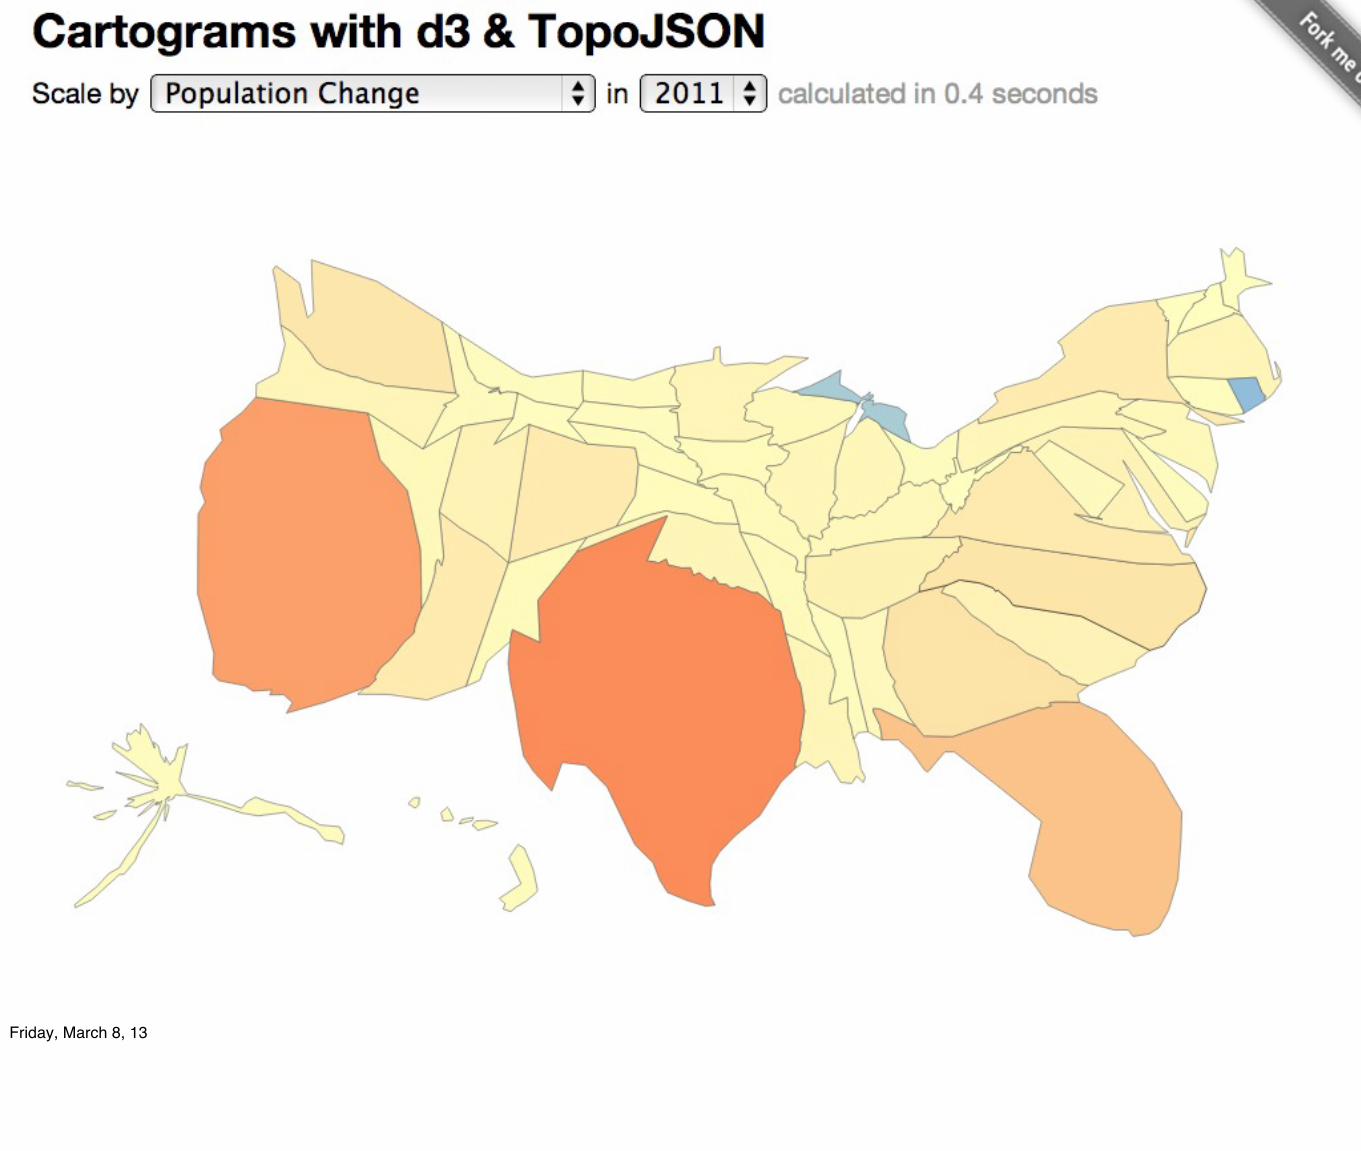
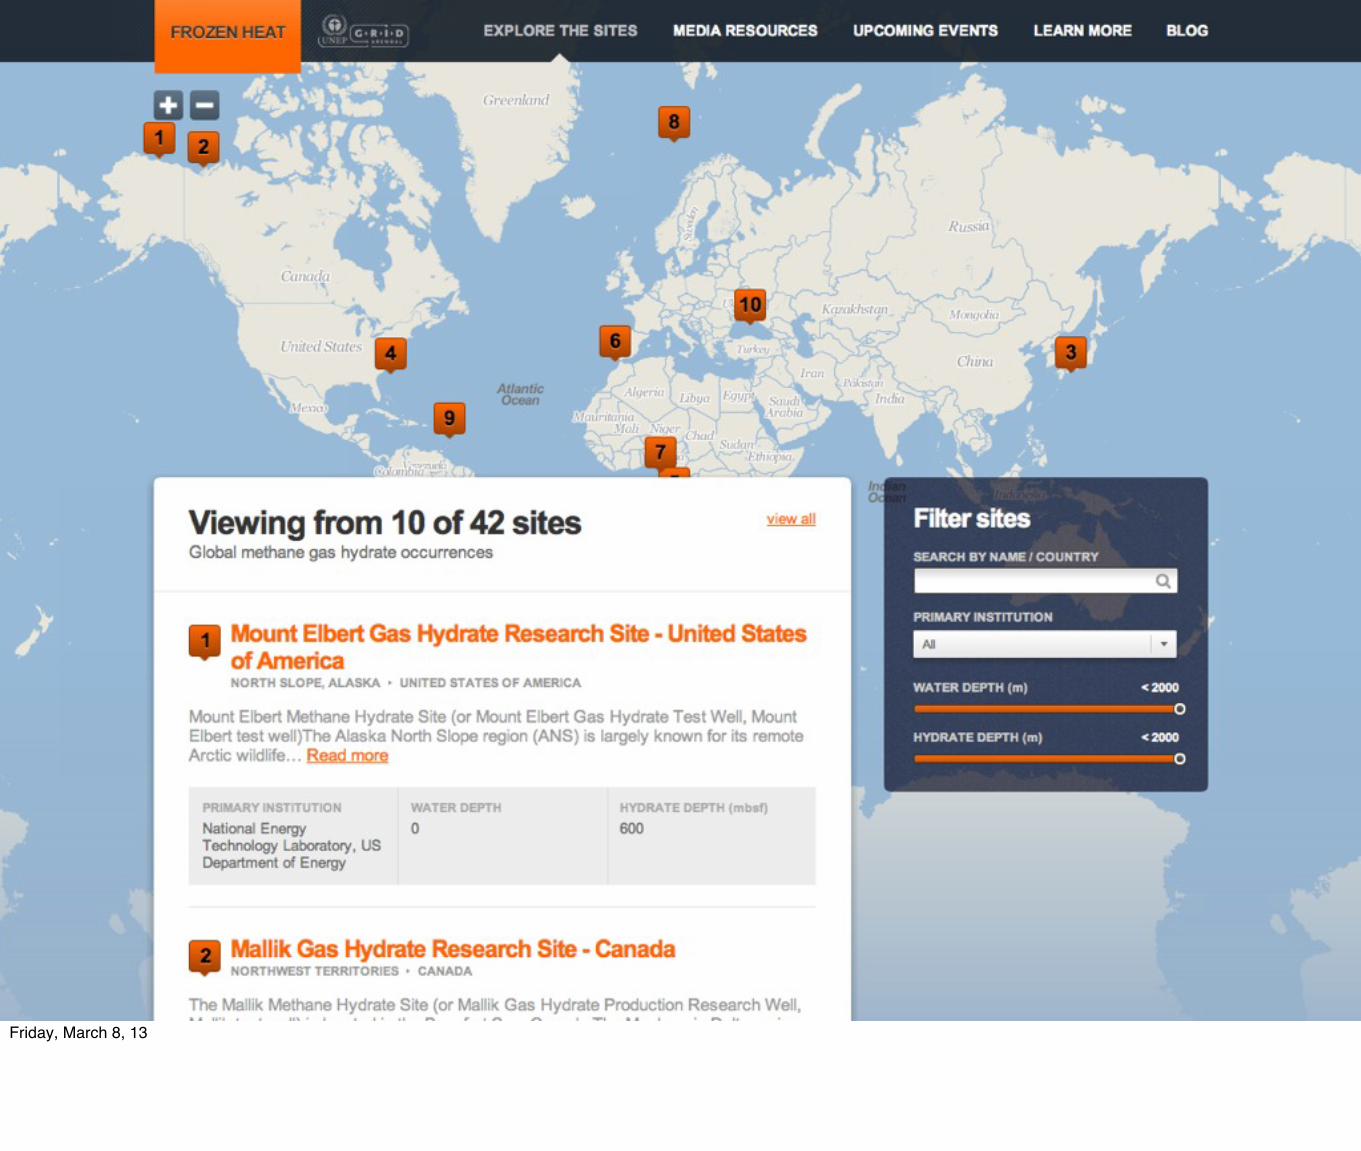
New tools are allowing for much better cartography. We call it more data visualization, as it connects with other fields...
Friday, March 8, 13
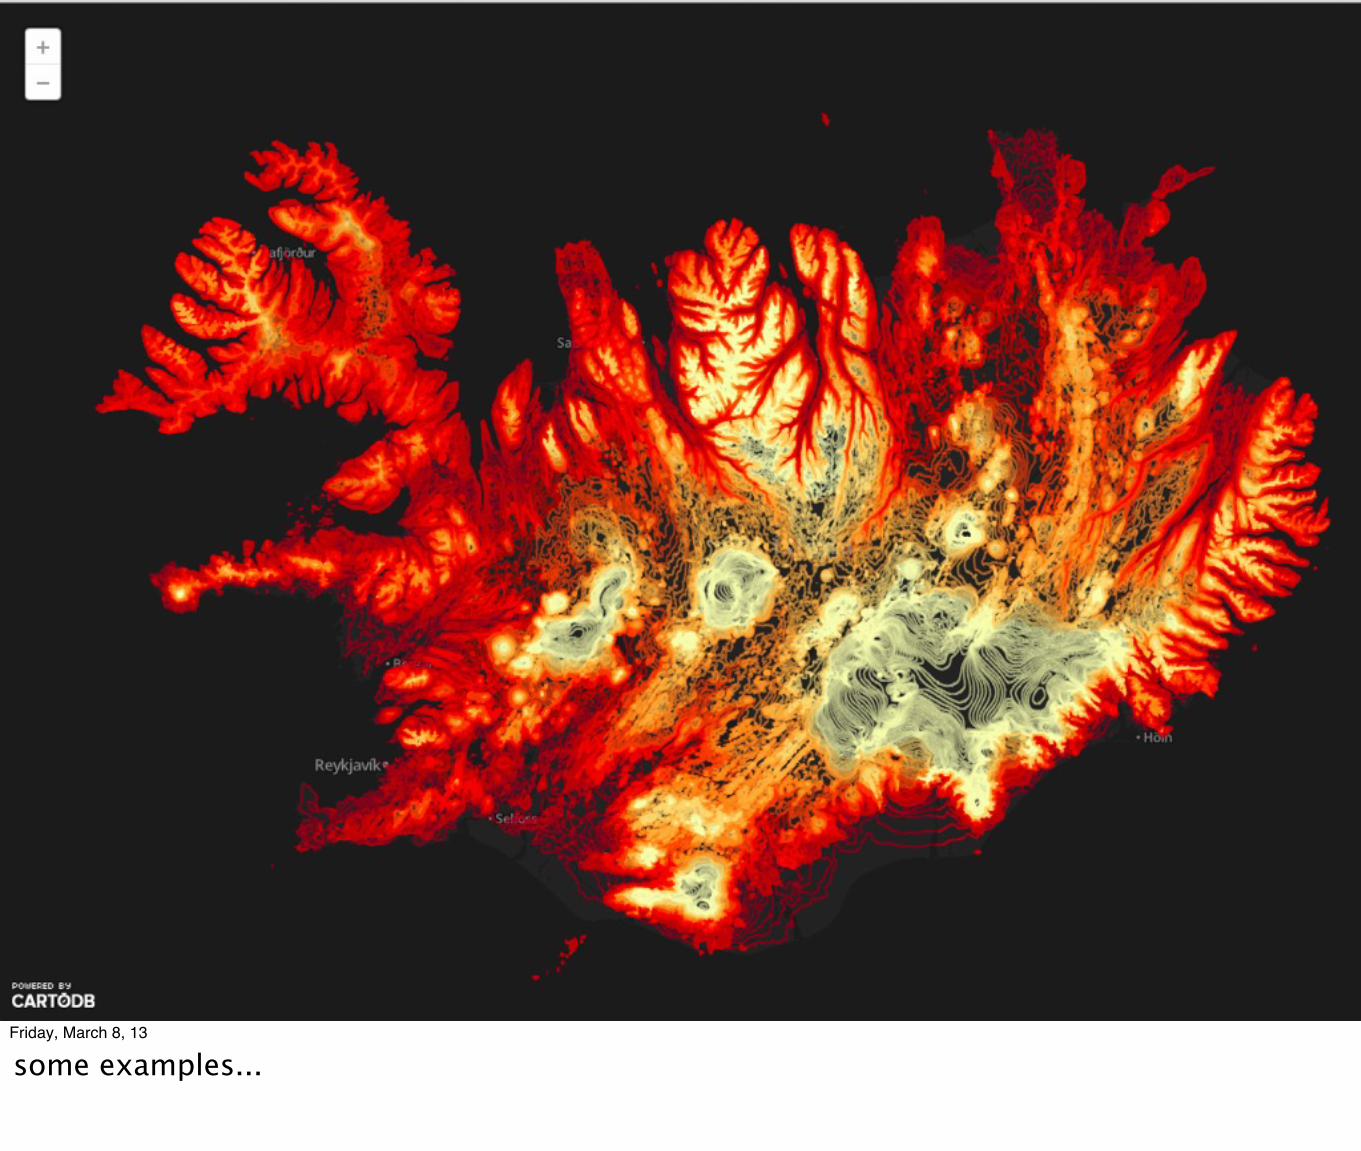
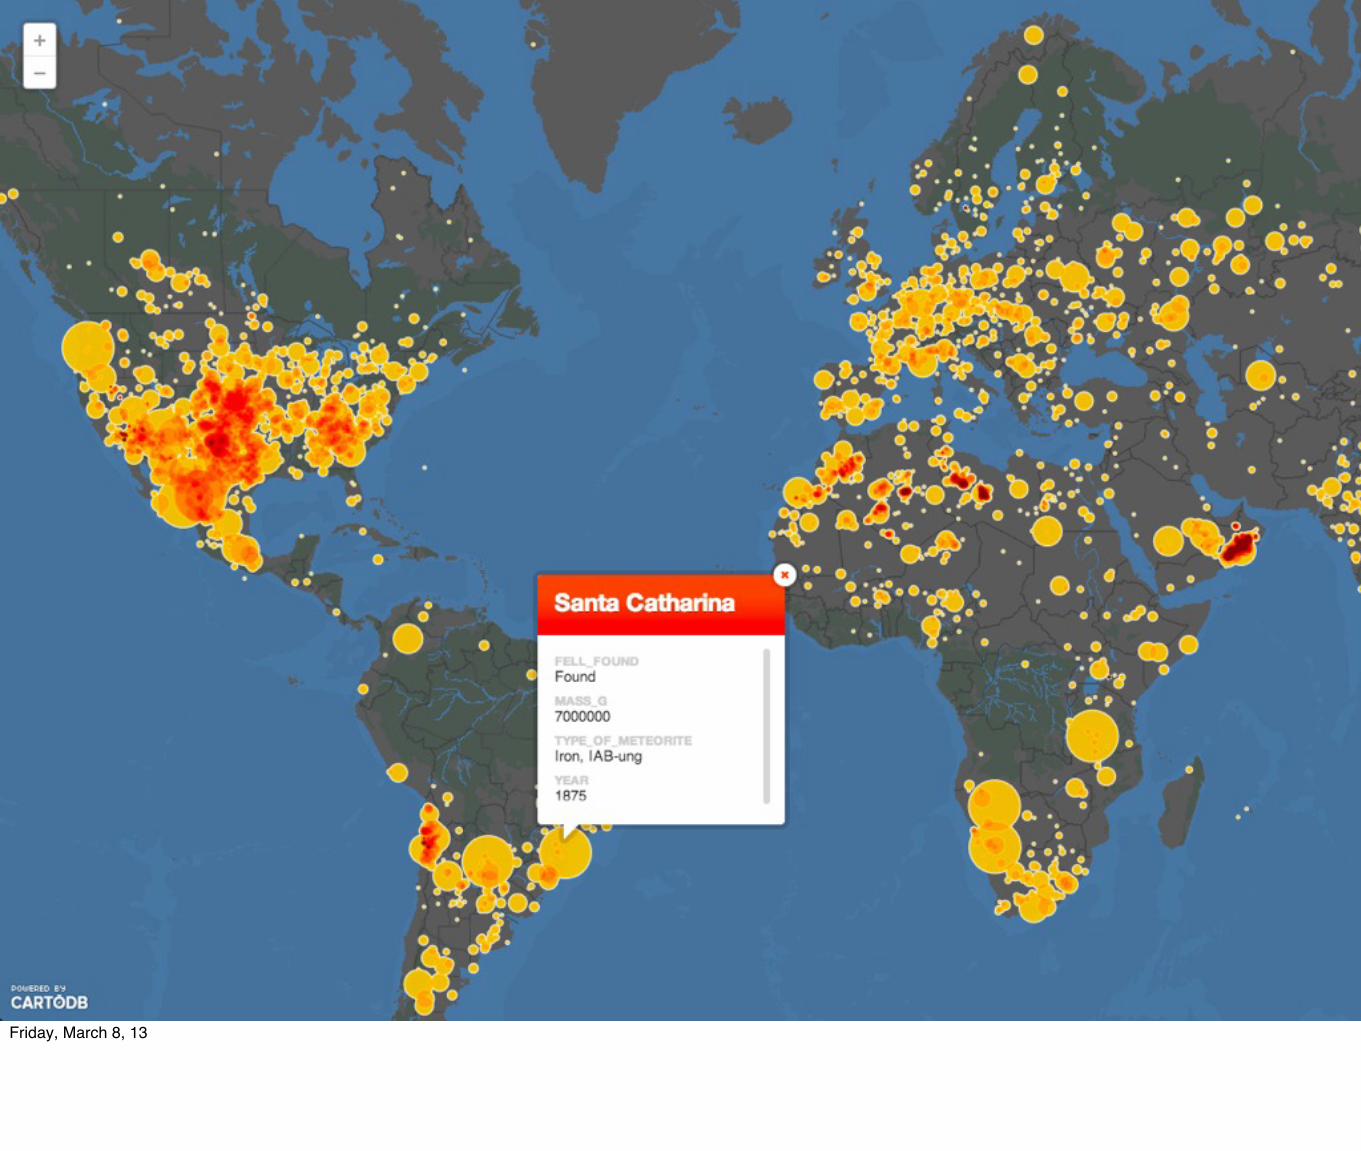
some examples...
Friday, March 8, 13
Friday, March 8, 13
Friday, March 8, 13
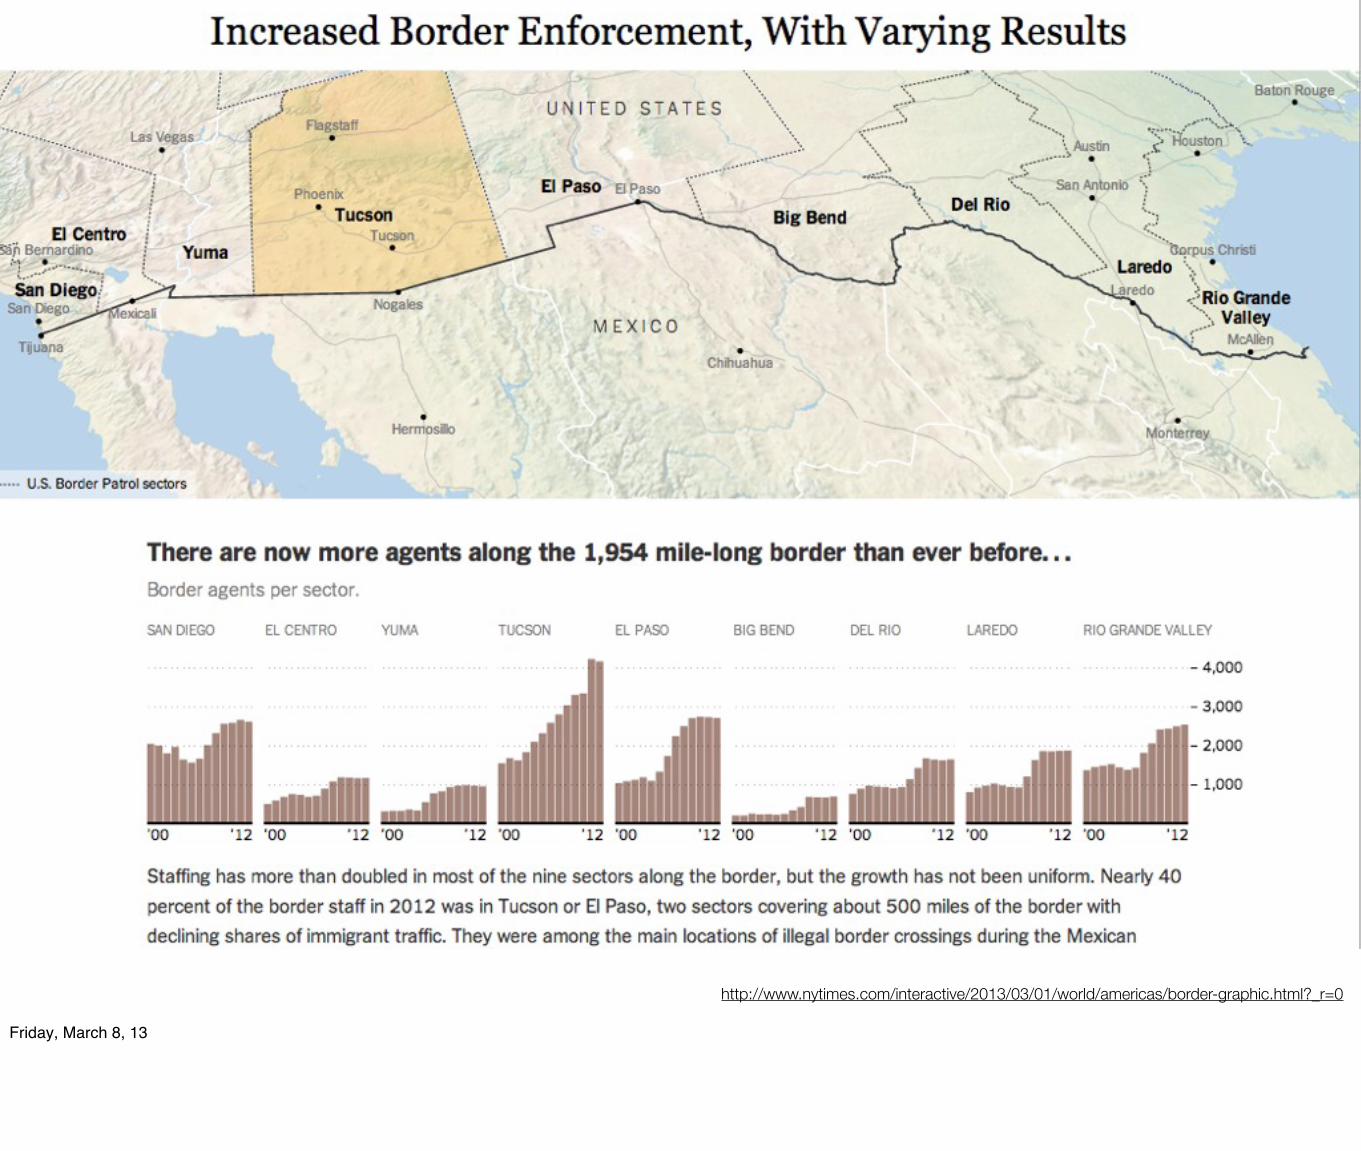
http://www.nytimes.com/interactive/2013/03/01/world/americas/border-graphic.html?_r=0
Friday, March 8, 13
Friday, March 8, 13
Friday, March 8, 13
Friday, March 8, 13
Friday, March 8, 13
Friday, March 8, 13
Friday, March 8, 13
Friday, March 8, 13
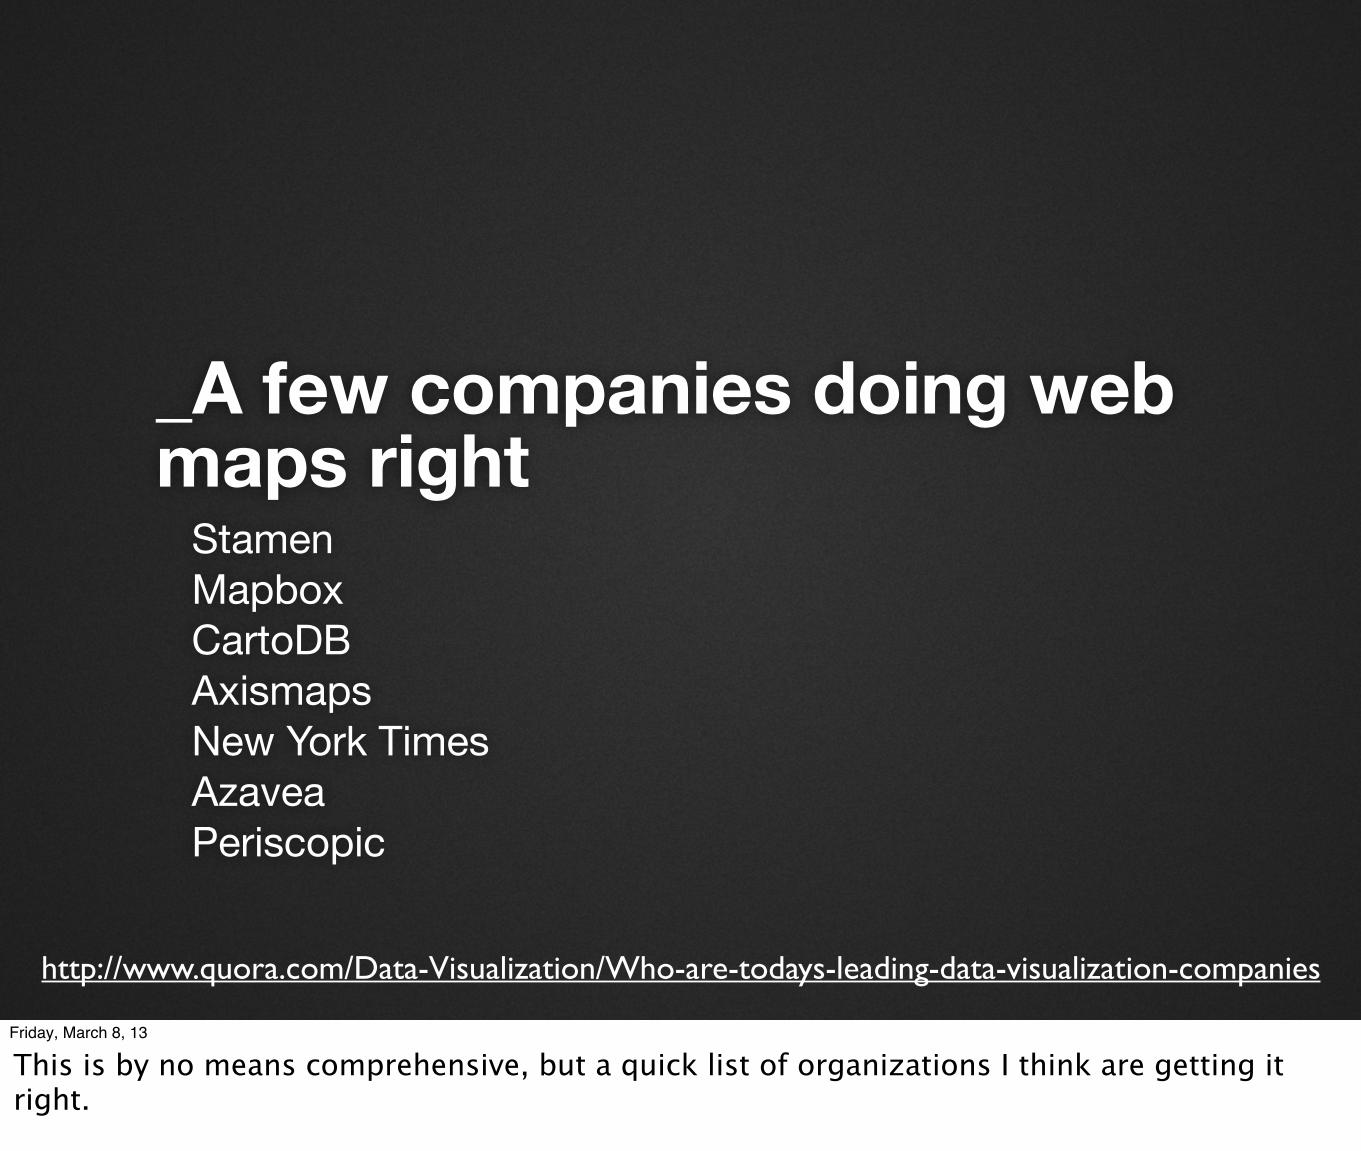
_A few companies doing web maps right
StamenMapboxCartoDBAxismapsNew York TimesAzaveaPeriscopic
http://www.quora.com/Data-Visualization/Who-are-todays-leading-data-visualization-companies
Friday, March 8, 13
This is by no means comprehensive, but a quick list of organizations I think are getting it right.
_Possibly best moment in history to work doing geo
...cartographers, geographers, developers...
Friday, March 8, 13
There is a new world to be invented! Prossibly best moment in history to work on the field
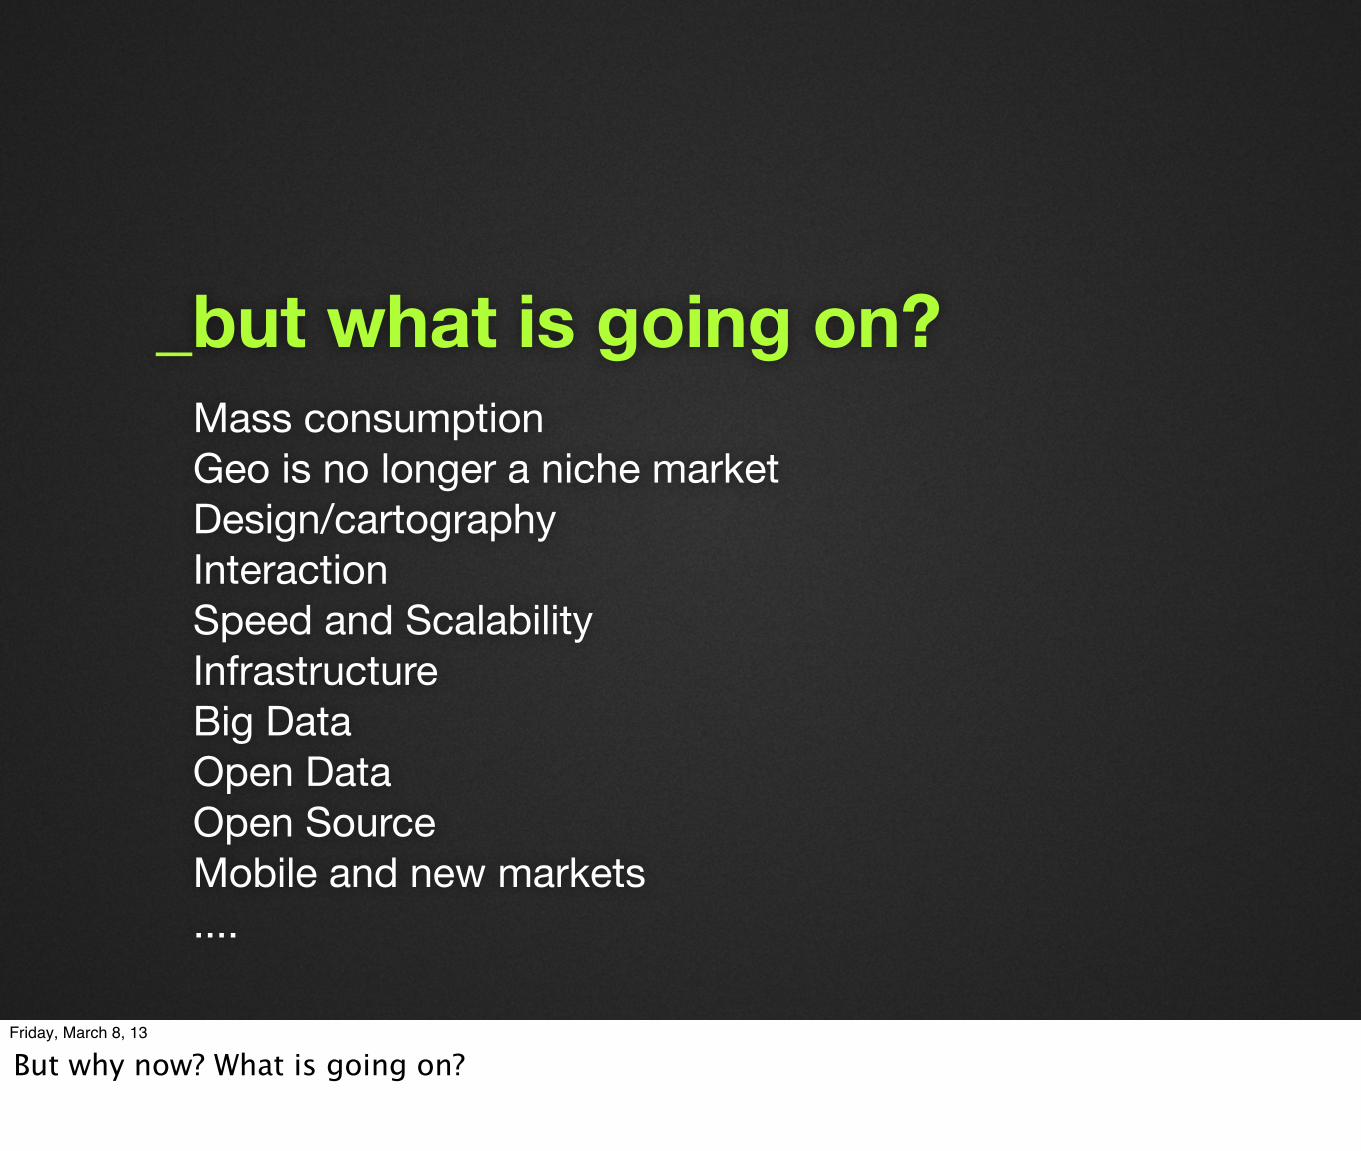
_but what is going on?Mass consumptionGeo is no longer a niche marketDesign/cartographyInteractionSpeed and ScalabilityInfrastructureBig DataOpen DataOpen SourceMobile and new markets....
Friday, March 8, 13
But why now? What is going on?
_Mass comsumptionEverybody wants to do maps and tell stories with data
Friday, March 8, 13
Maps had never been so popular... there are maps everywhere and people are starting to understand them. Google Maps concepts are now mainstream.
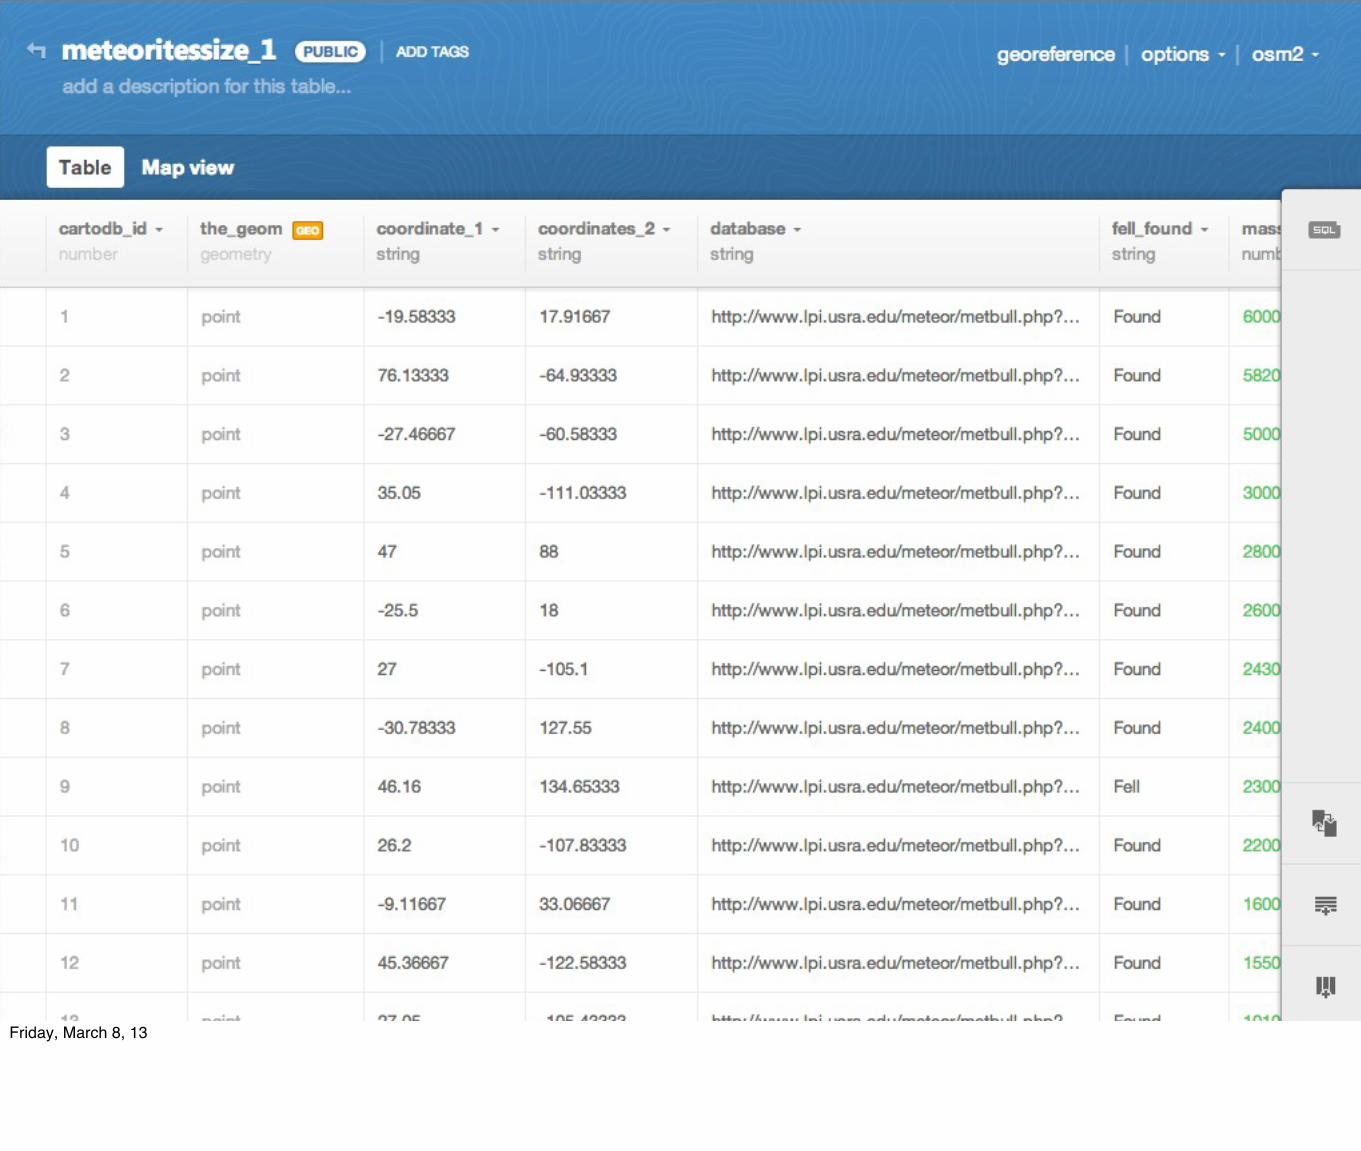
_the_geom is just another column
GIS is not the centre of the world, sorry.
Friday, March 8, 13
Geo is getting everywhere. Lot of developers are doing geo without realizing. Geo is no longer its own little niche, we are now a technology on everything. We are not the centre of the world, we are just one more column on the database.
Friday, March 8, 13
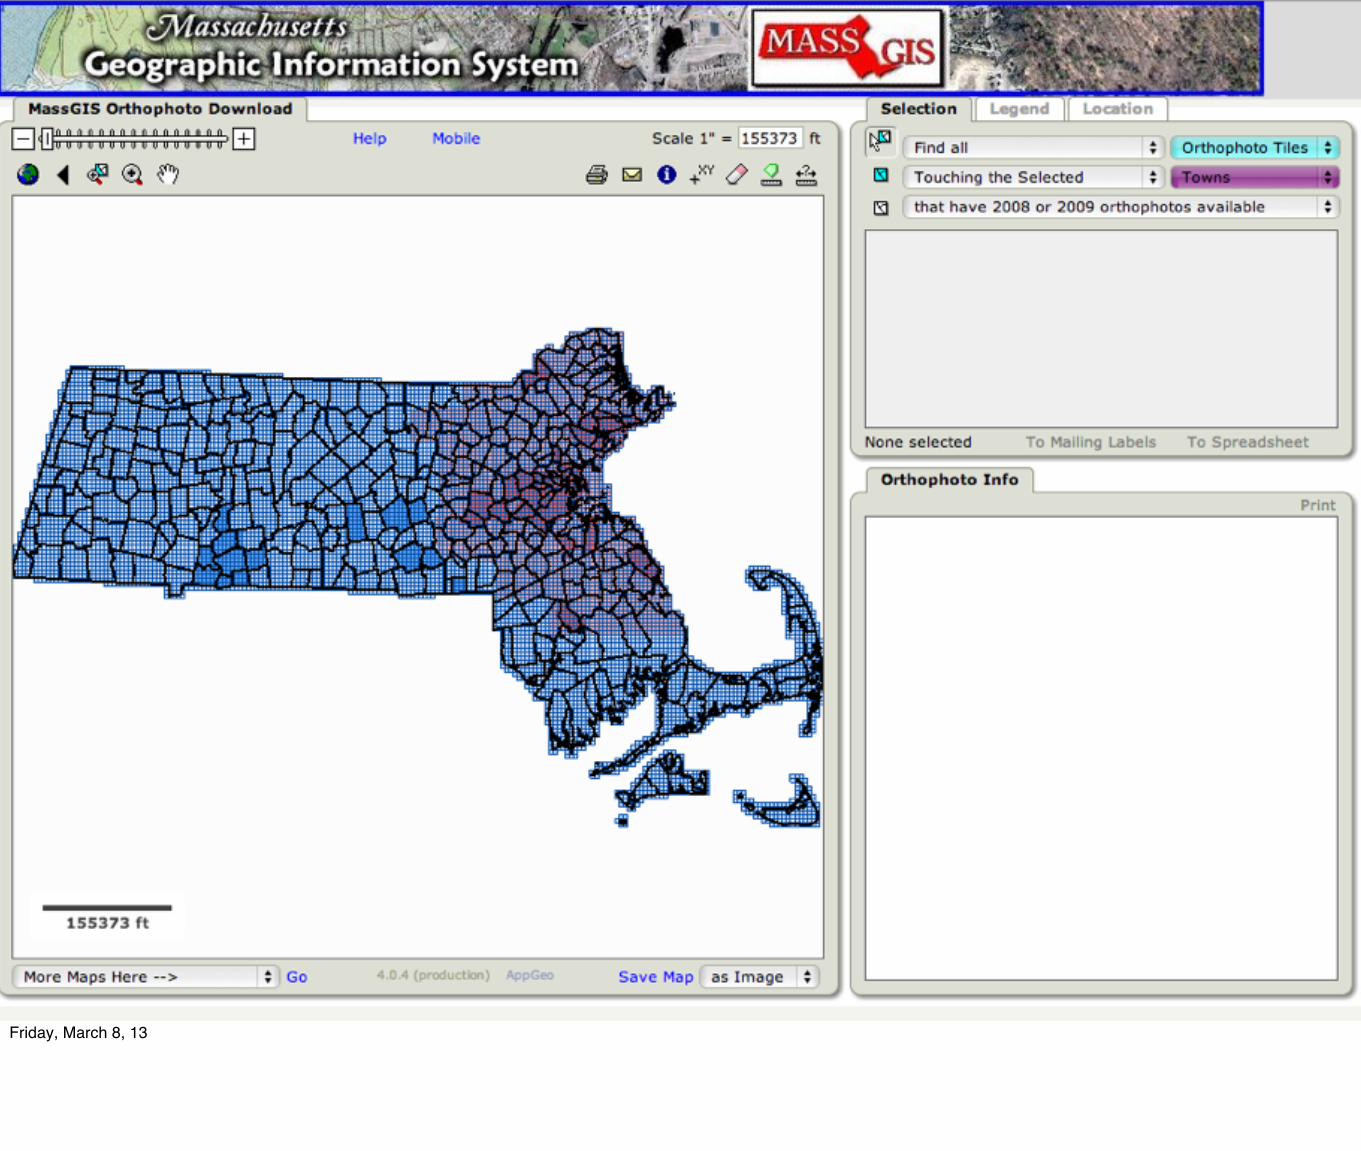
_design and usability is the only way
Let say NO to ugly and ususable GeoPortals that do not satisfy neither end users or professionals.
It is not about taking Desktop GIS to the web, wake up!
Friday, March 8, 13

Friday, March 8, 13
Friday, March 8, 13
Friday, March 8, 13
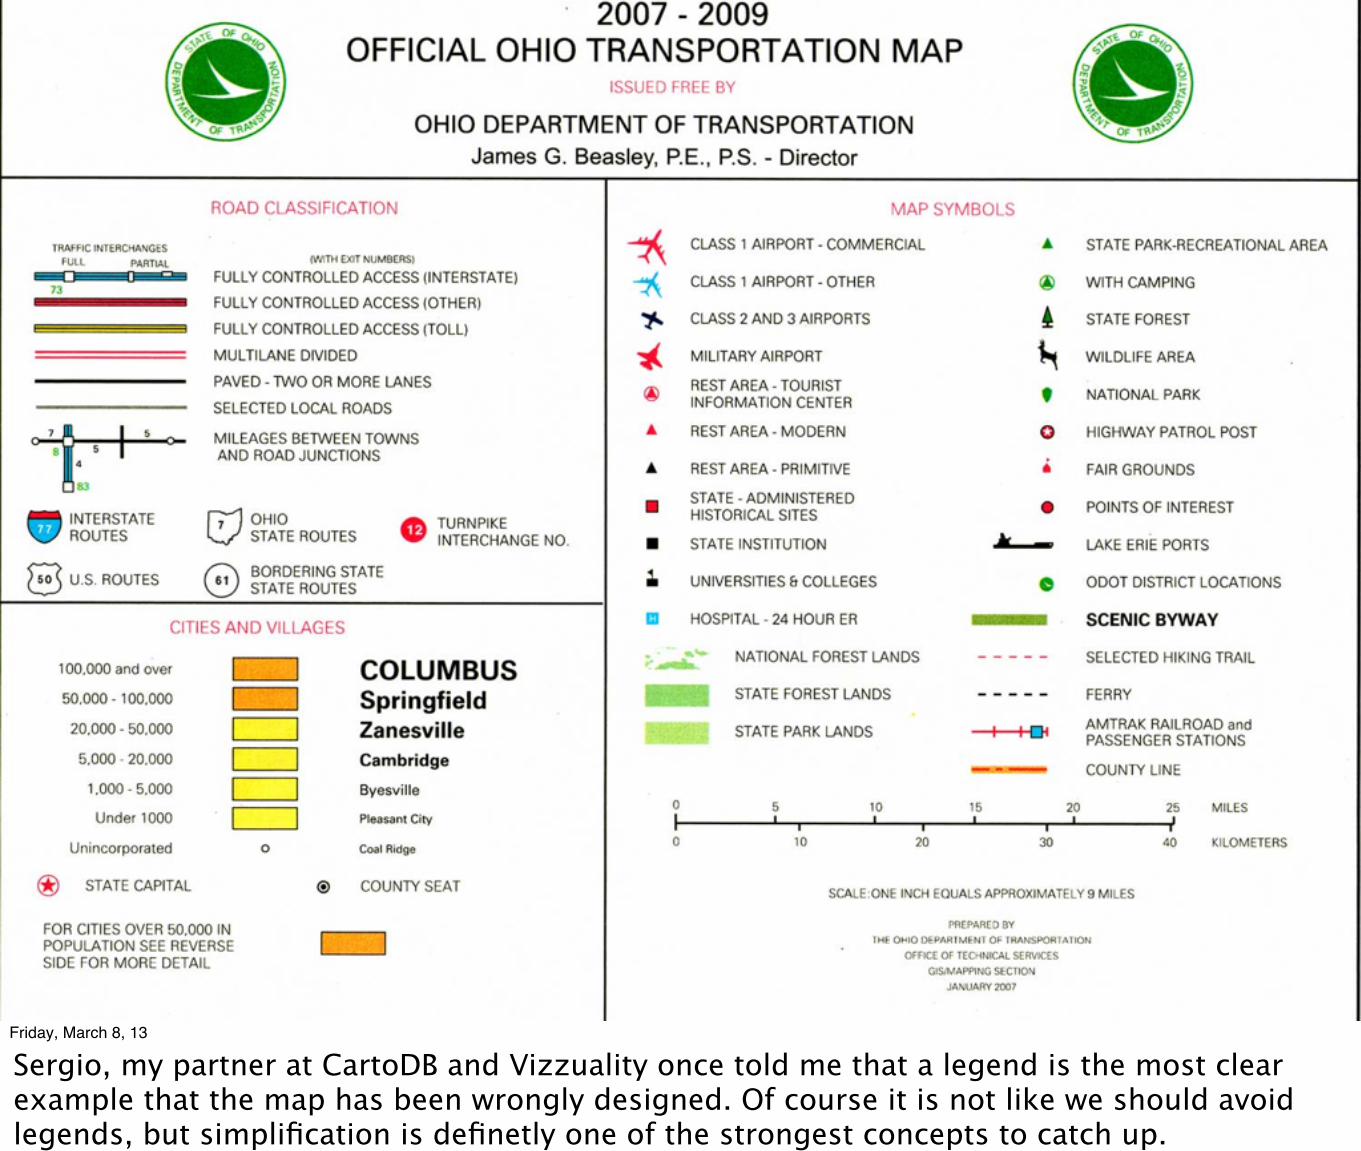
Sergio, my partner at CartoDB and Vizzuality once told me that a legend is the most clear example that the map has been wrongly designed. Of course it is not like we should avoid legends, but simplification is definetly one of the strongest concepts to catch up.
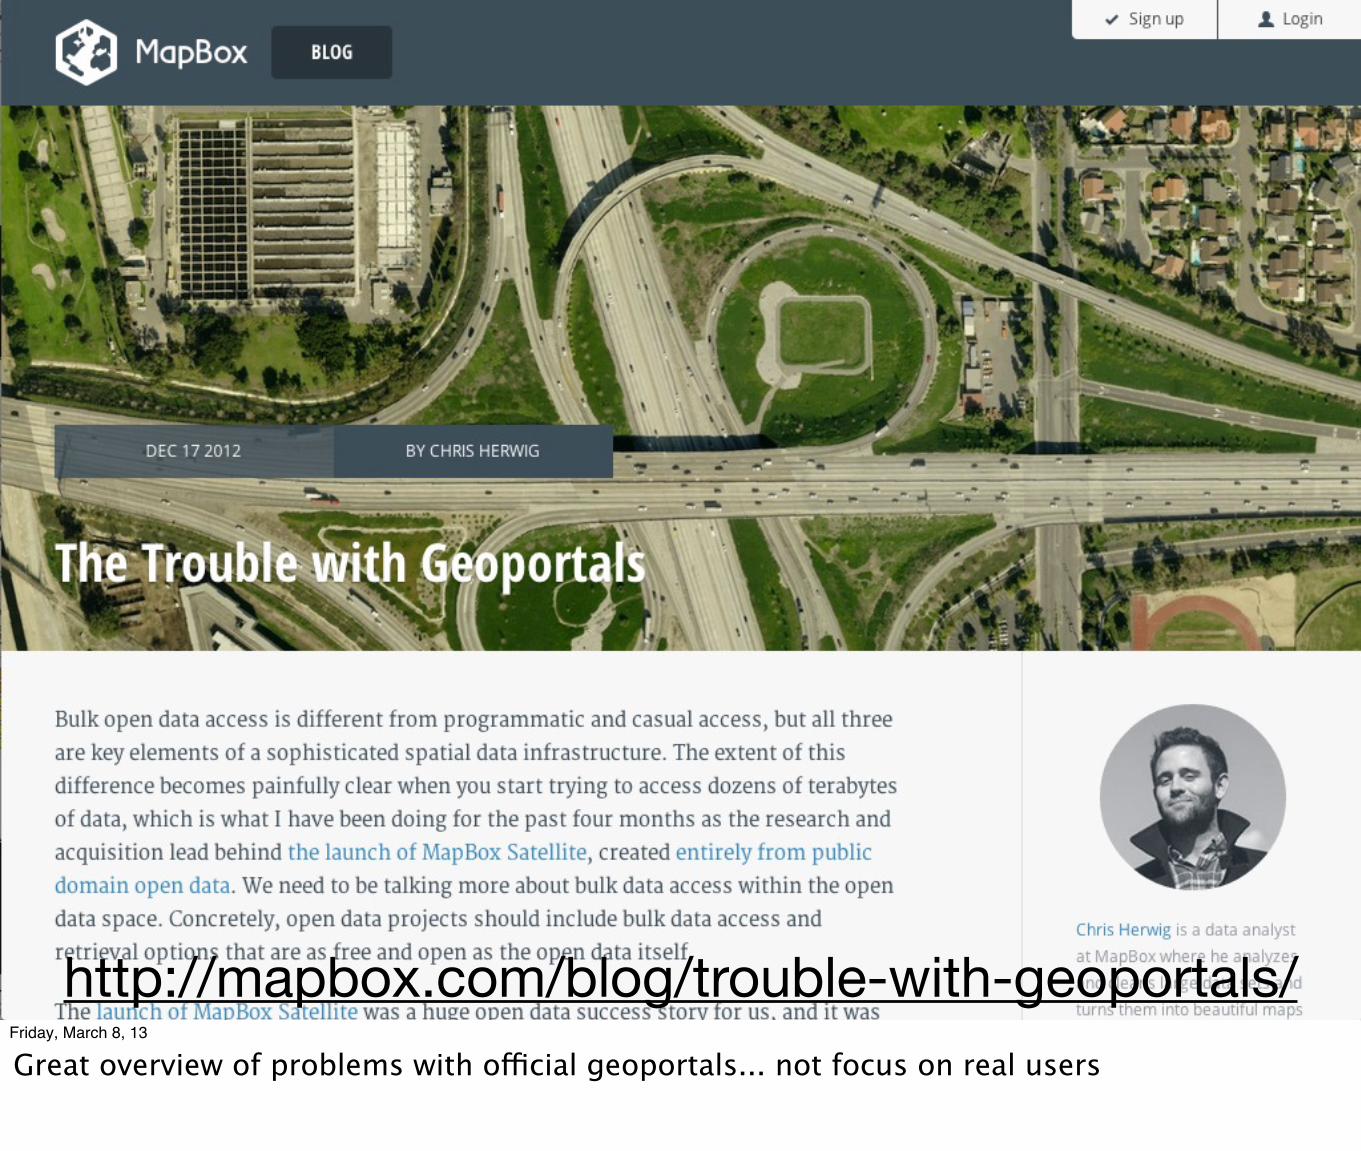
http://mapbox.com/blog/trouble-with-geoportals/Friday, March 8, 13
Great overview of problems with official geoportals... not focus on real users
Friday, March 8, 13
_New interaction concepts on maps
This is not in the books!! NEW NEW
Think on the map experience, not just how it looks like.
Friday, March 8, 13
The realization of the interactive map as an experience, not just a map design.
Friday, March 8, 13
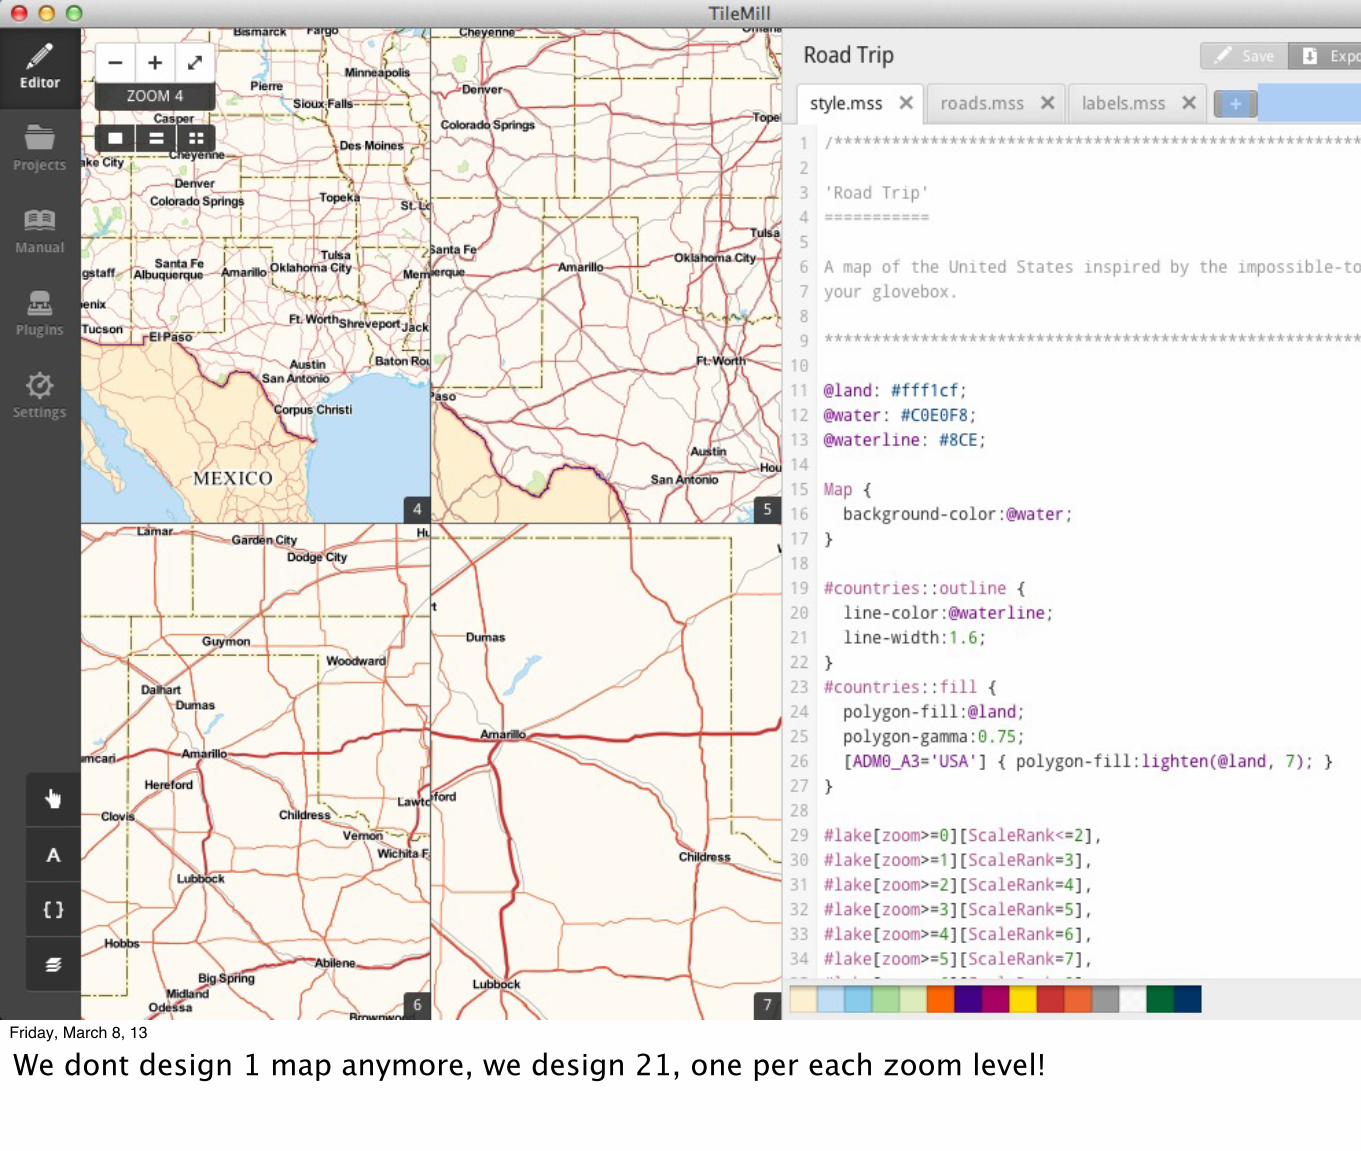
We dont design 1 map anymore, we design 21, one per each zoom level!
Friday, March 8, 13
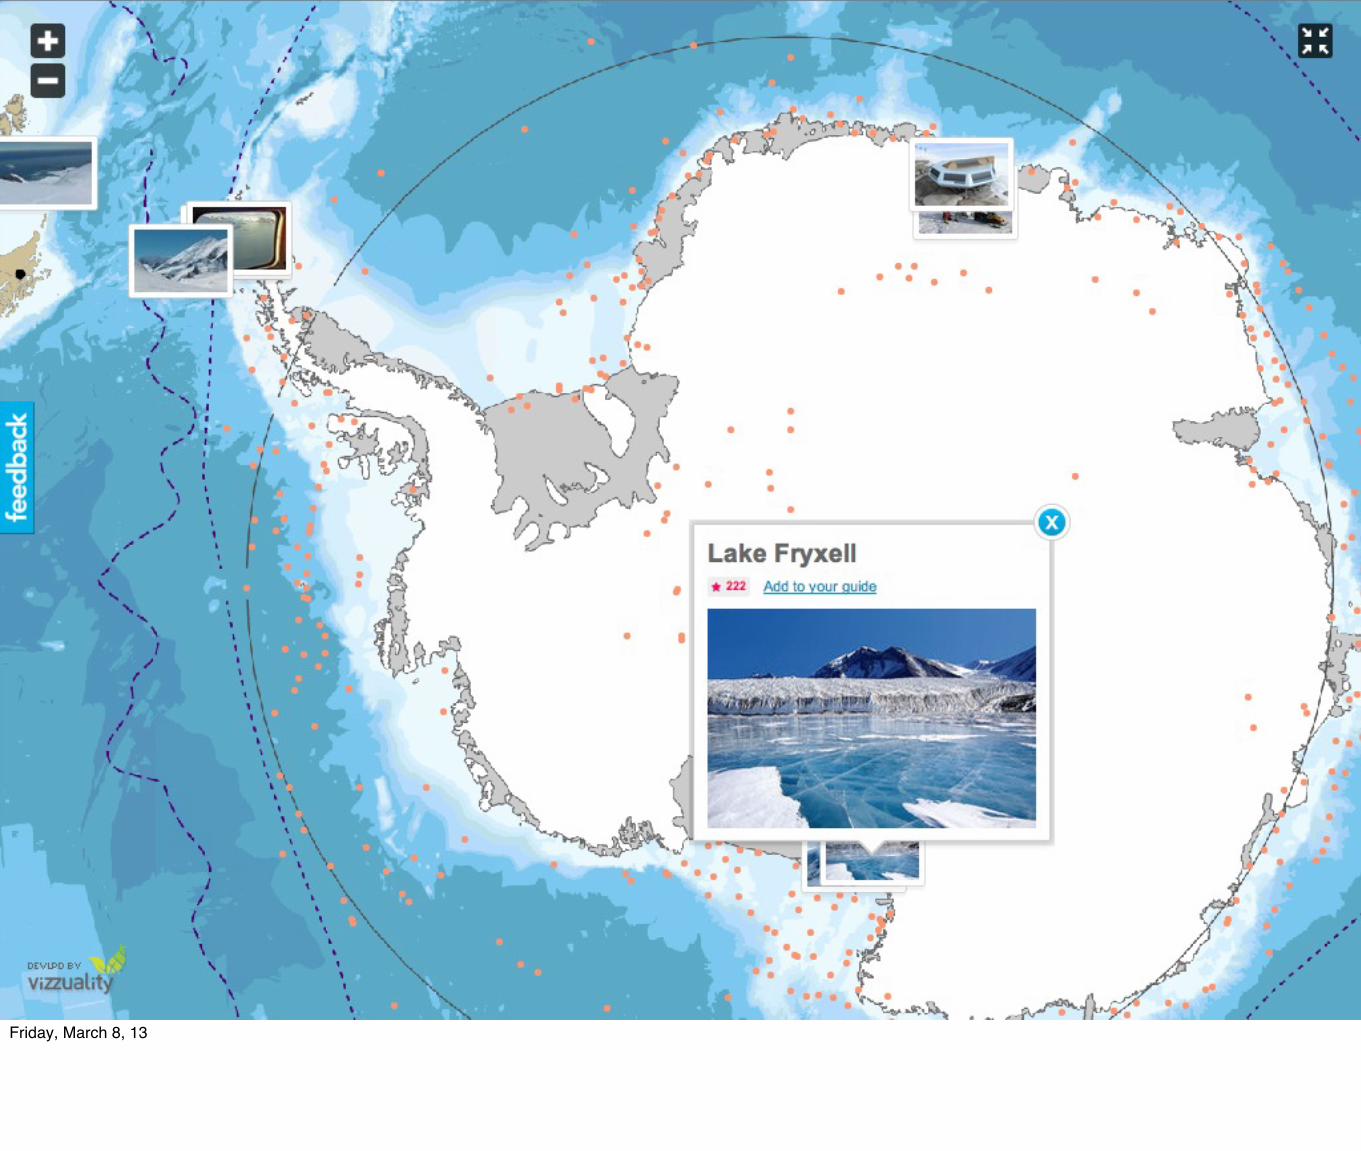
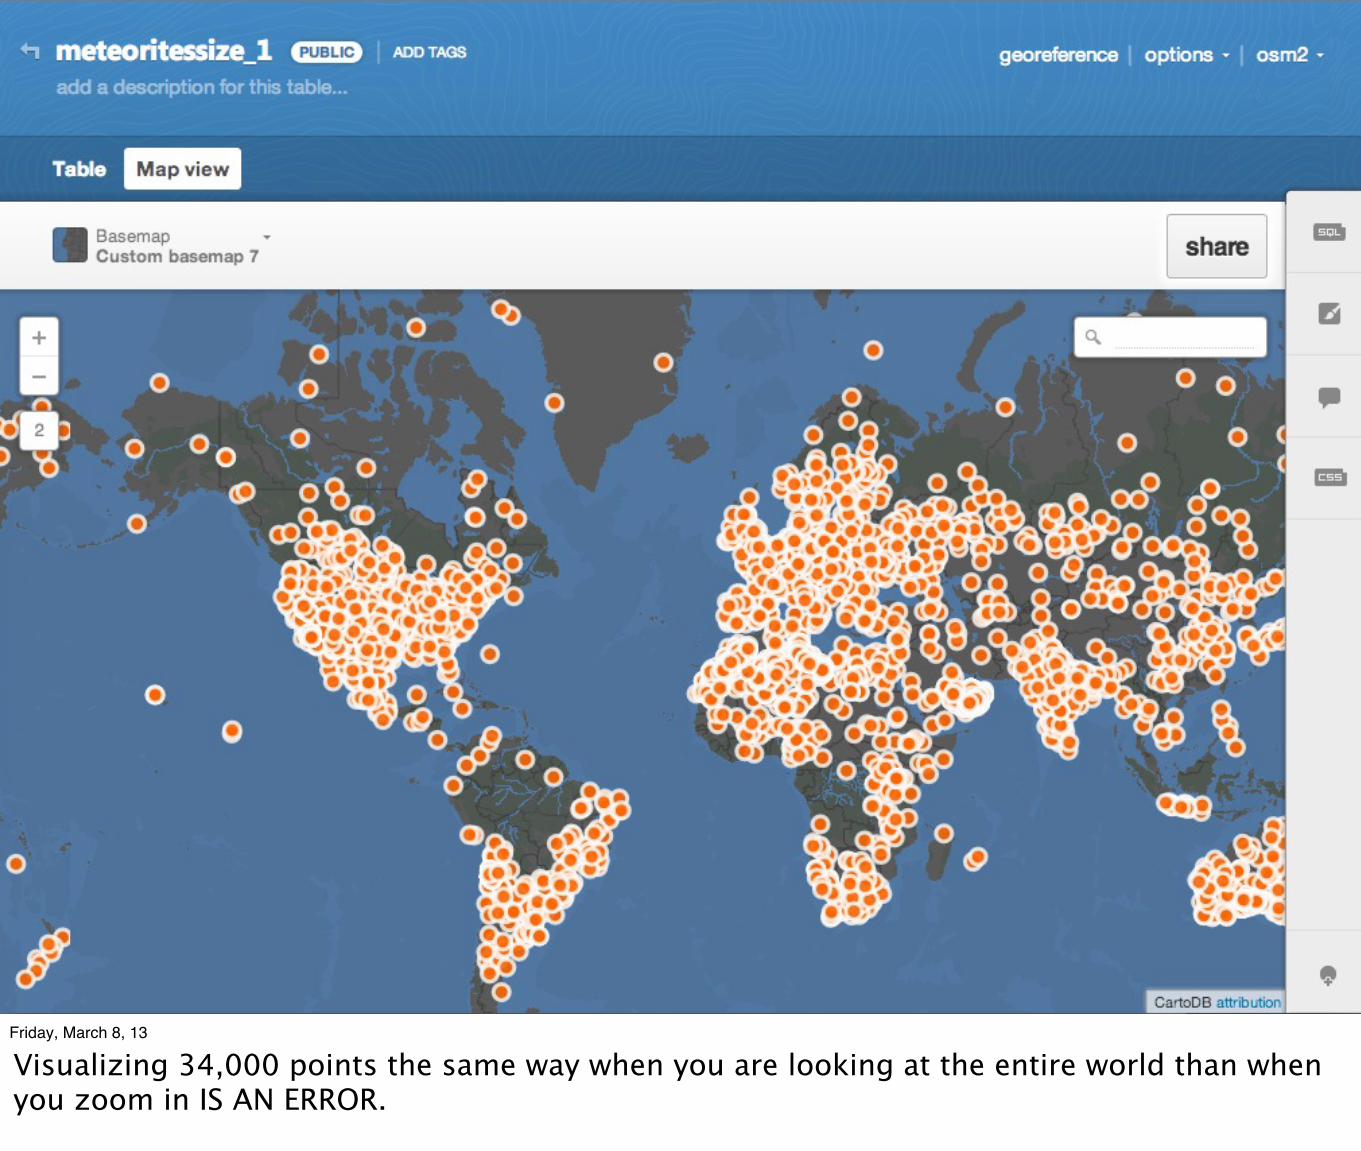
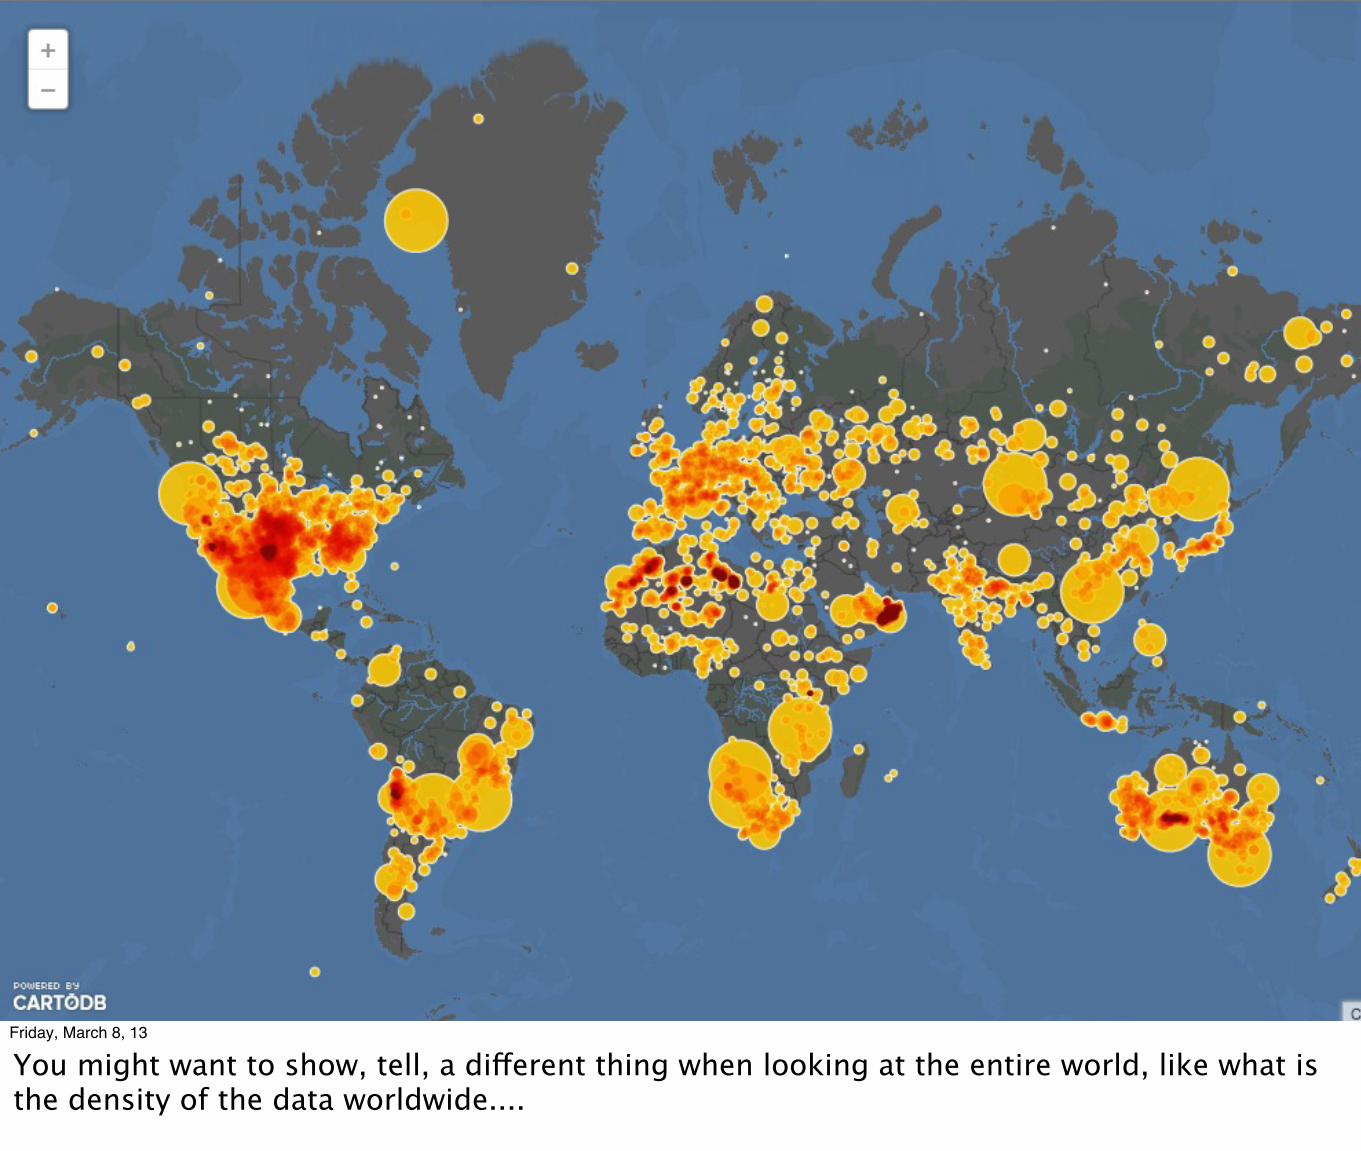
Visualizing 34,000 points the same way when you are looking at the entire world than when you zoom in IS AN ERROR.
Friday, March 8, 13
You might want to show, tell, a different thing when looking at the entire world, like what is the density of the data worldwide....
Friday, March 8, 13
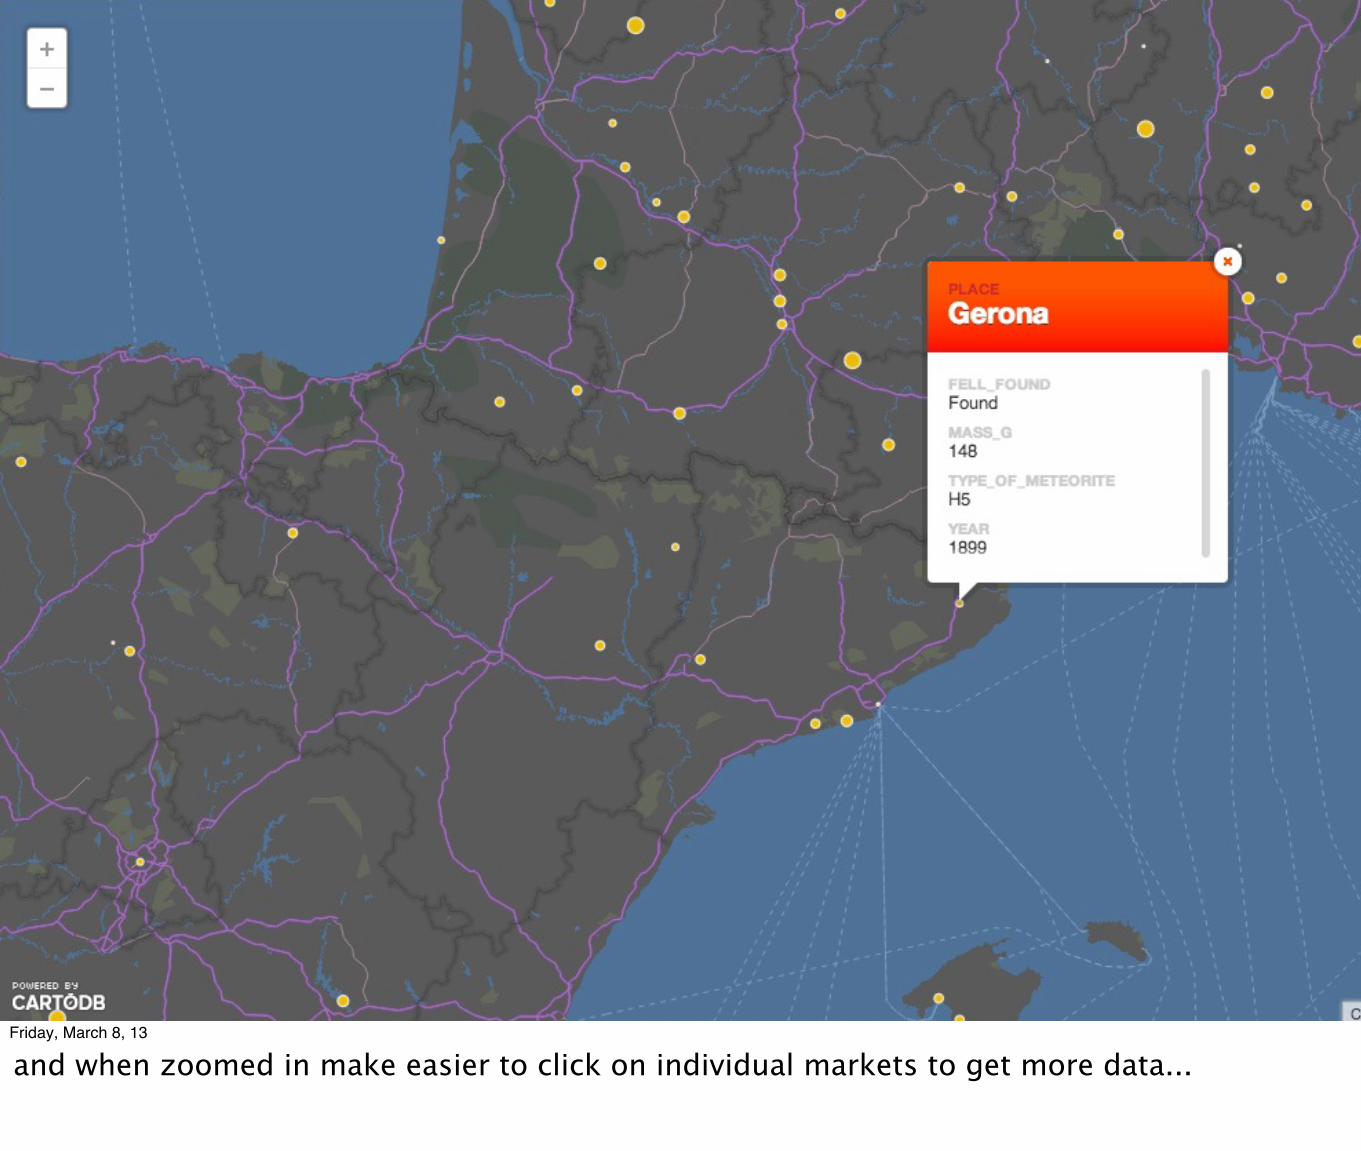
and when zoomed in make easier to click on individual markets to get more data...
Friday, March 8, 13
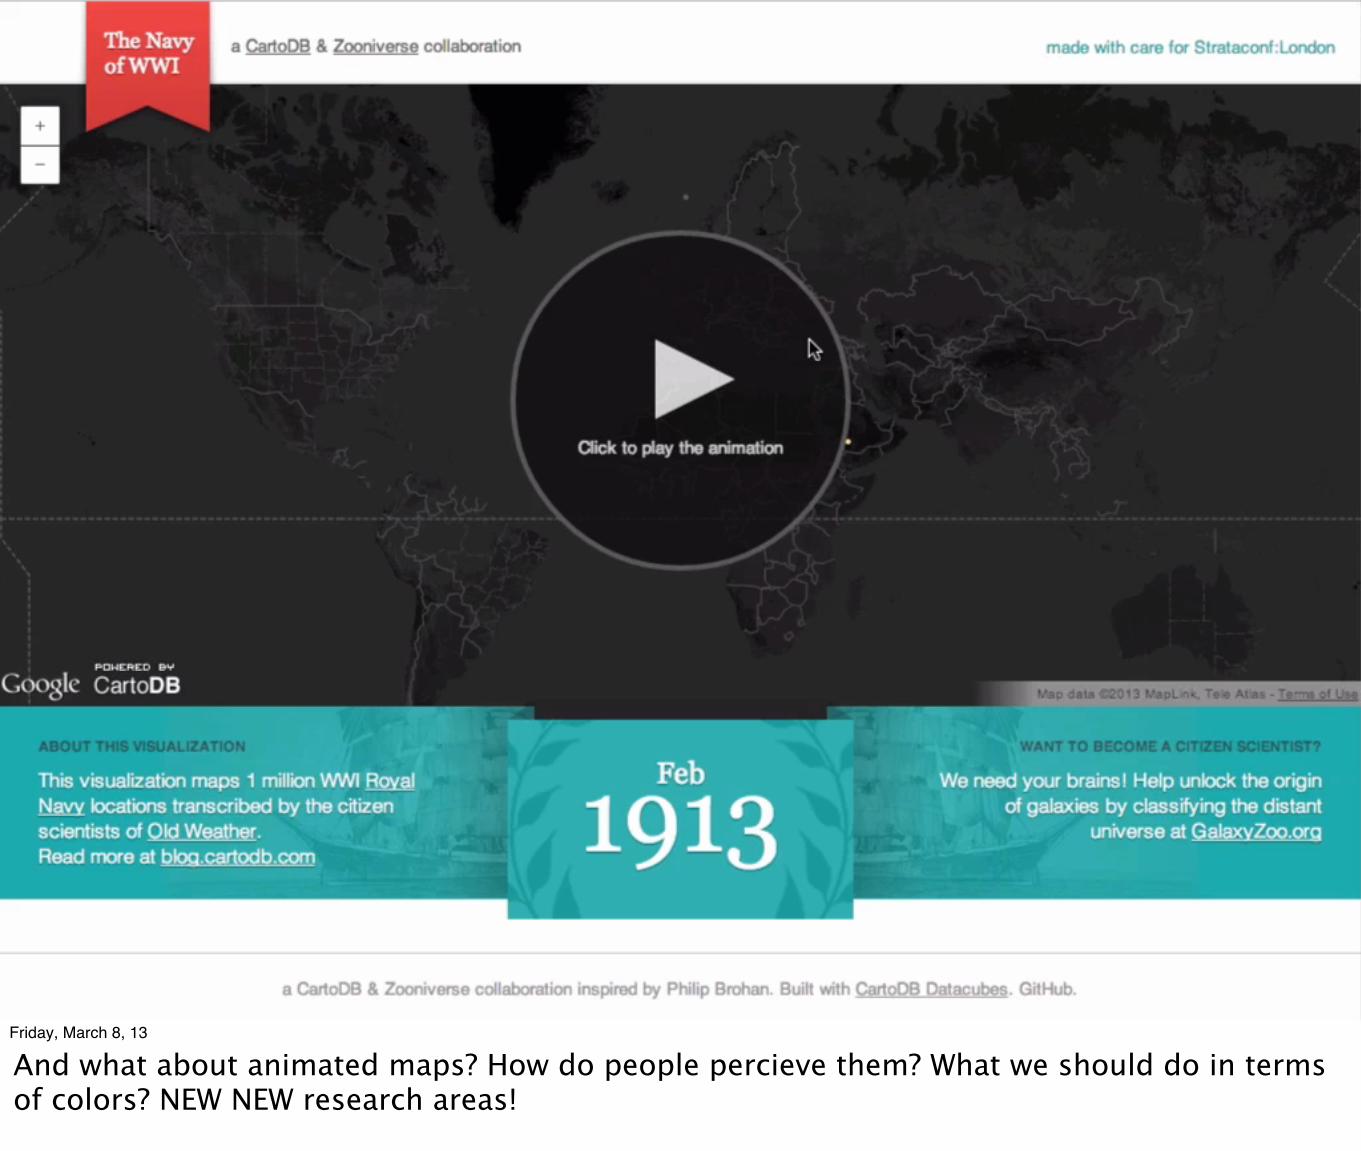
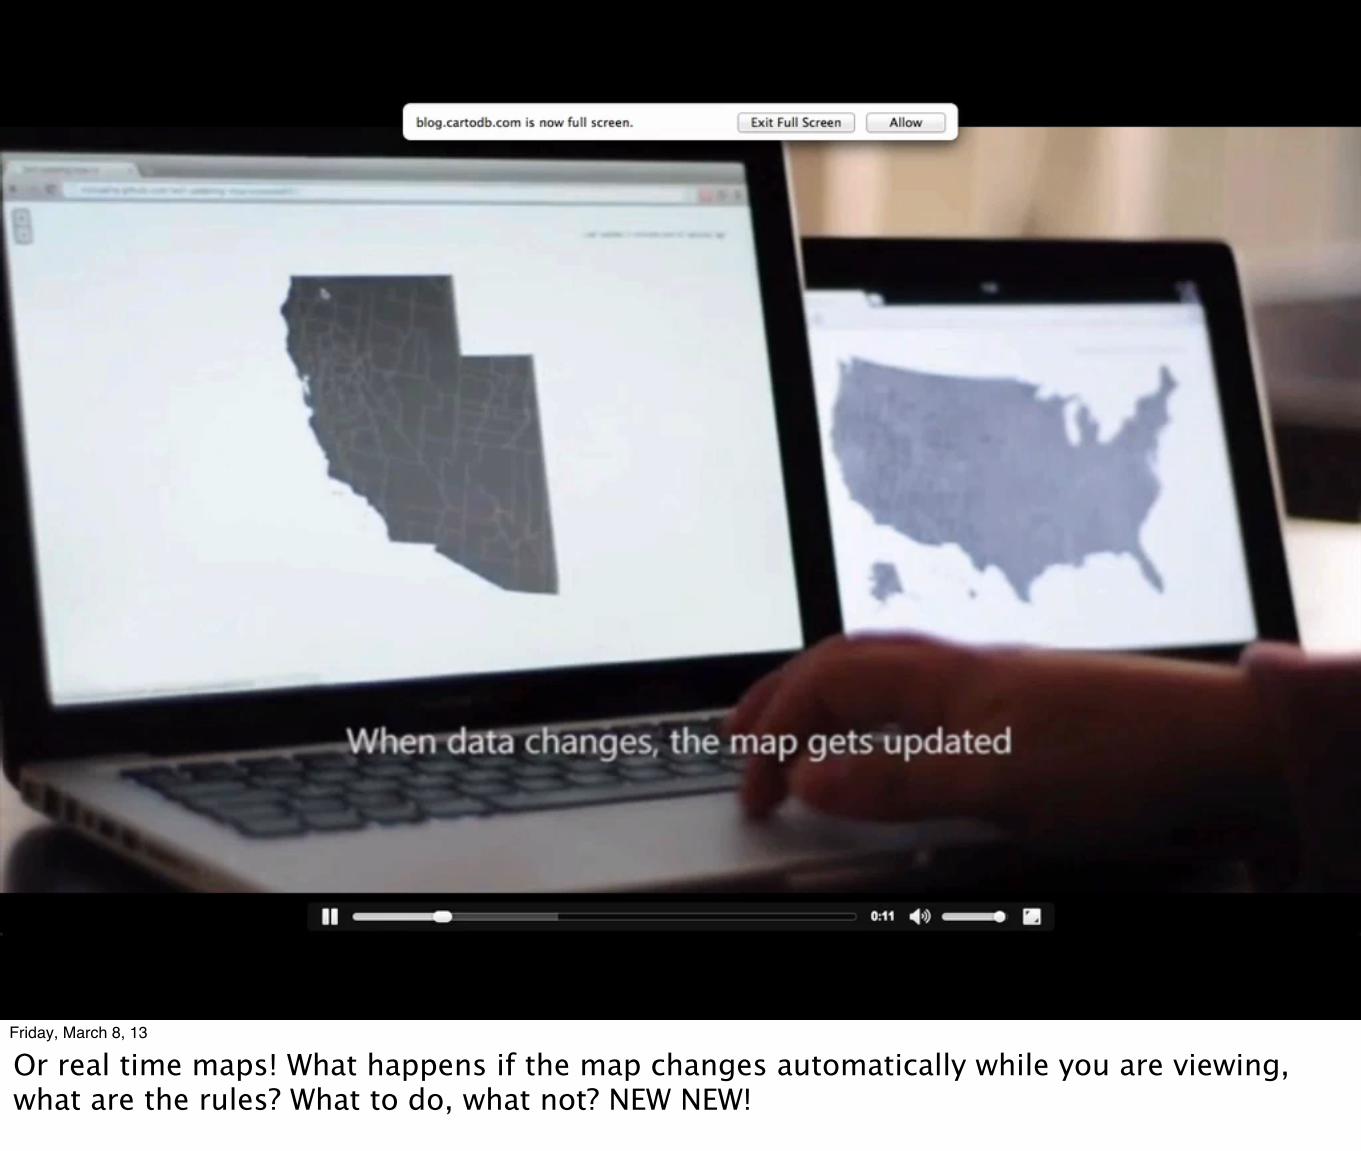
And what about animated maps? How do people percieve them? What we should do in terms of colors? NEW NEW research areas!
Friday, March 8, 13
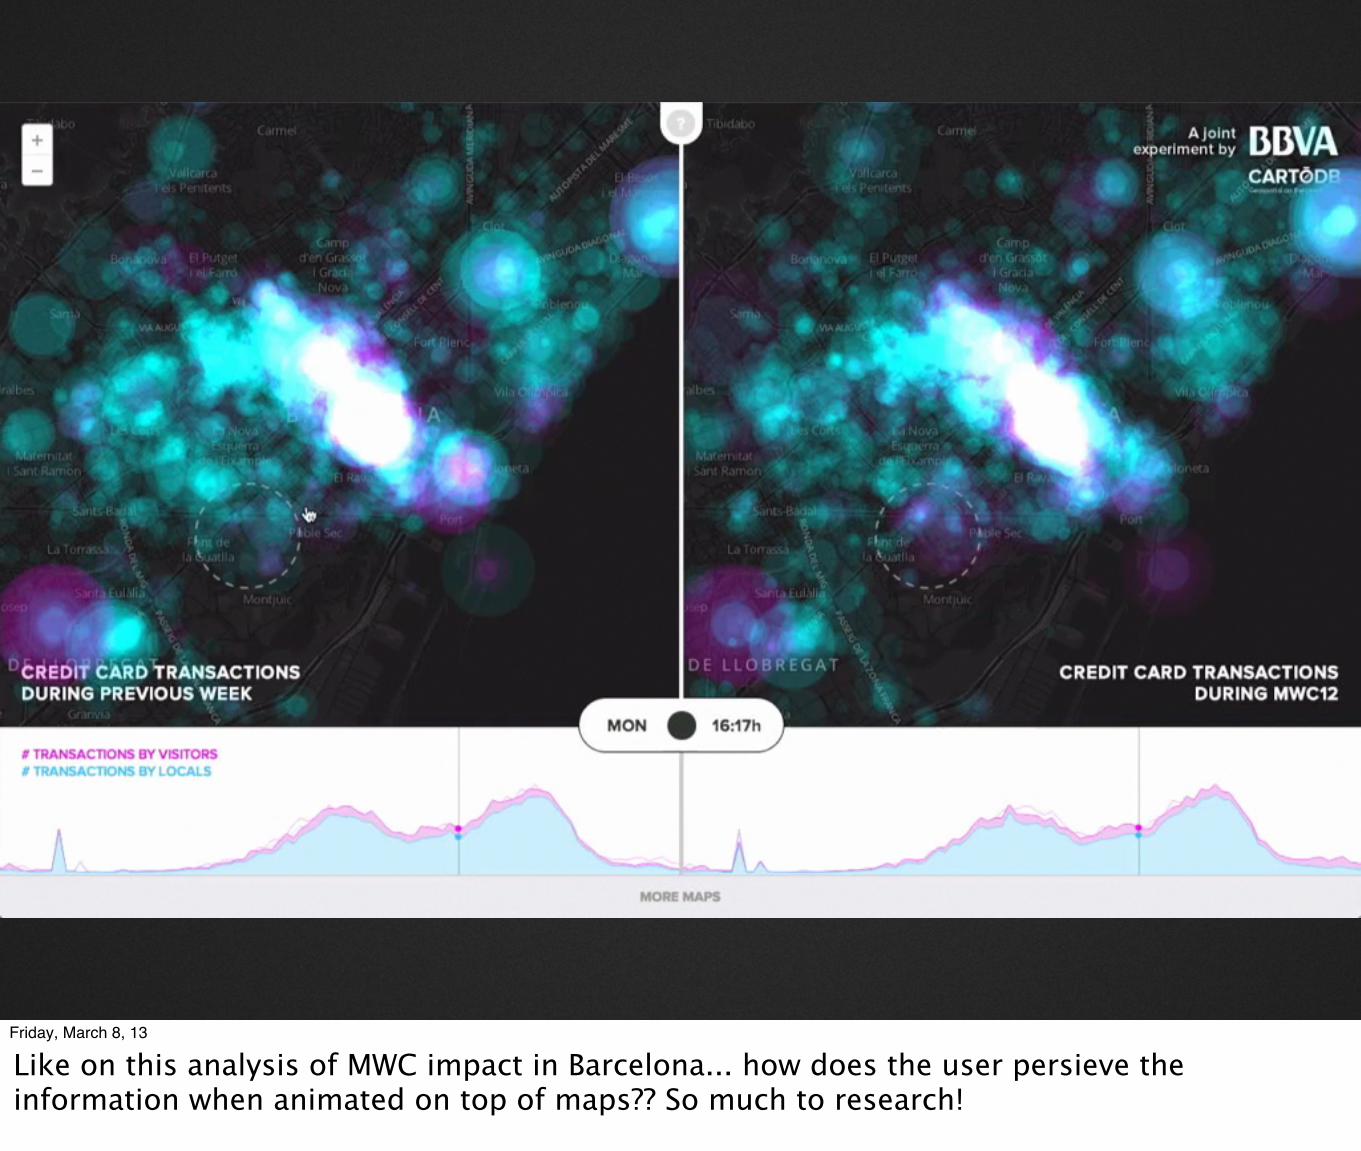
Like on this analysis of MWC impact in Barcelona... how does the user persieve the information when animated on top of maps?? So much to research!
Friday, March 8, 13
Or real time maps! What happens if the map changes automatically while you are viewing, what are the rules? What to do, what not? NEW NEW!
_A fast map is way more valuable
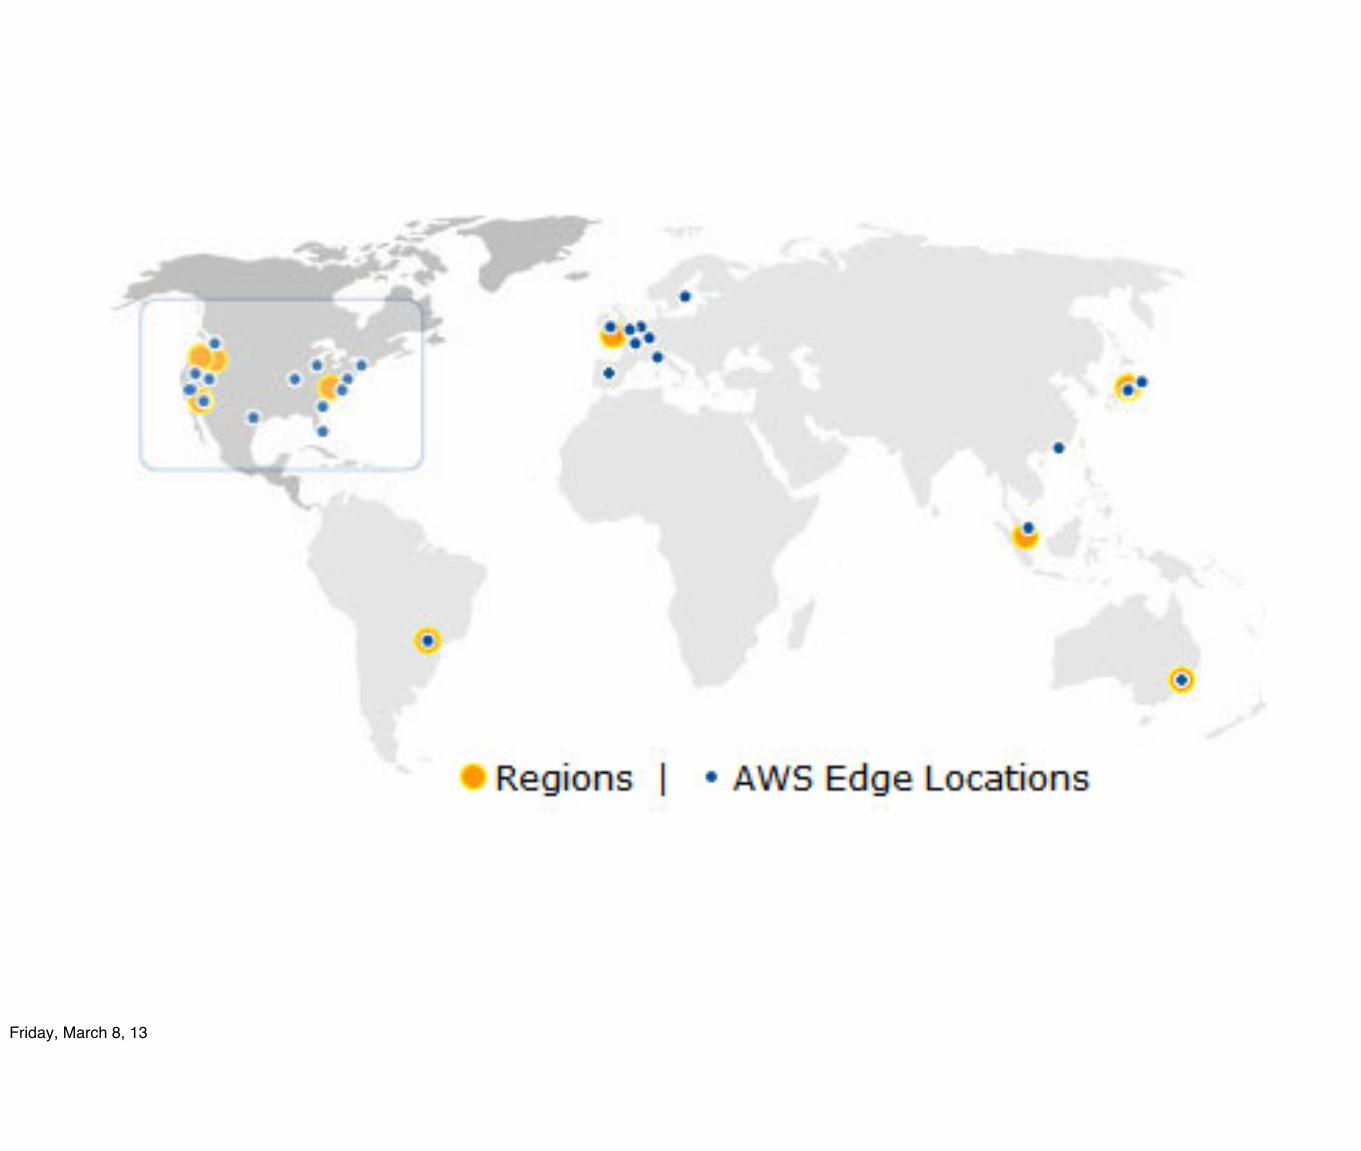
Maps need to scale: cachingMaps need to work globallyMaps need to perform in any device/browserSpeed is a fundamental part of the user experience.
Friday, March 8, 13
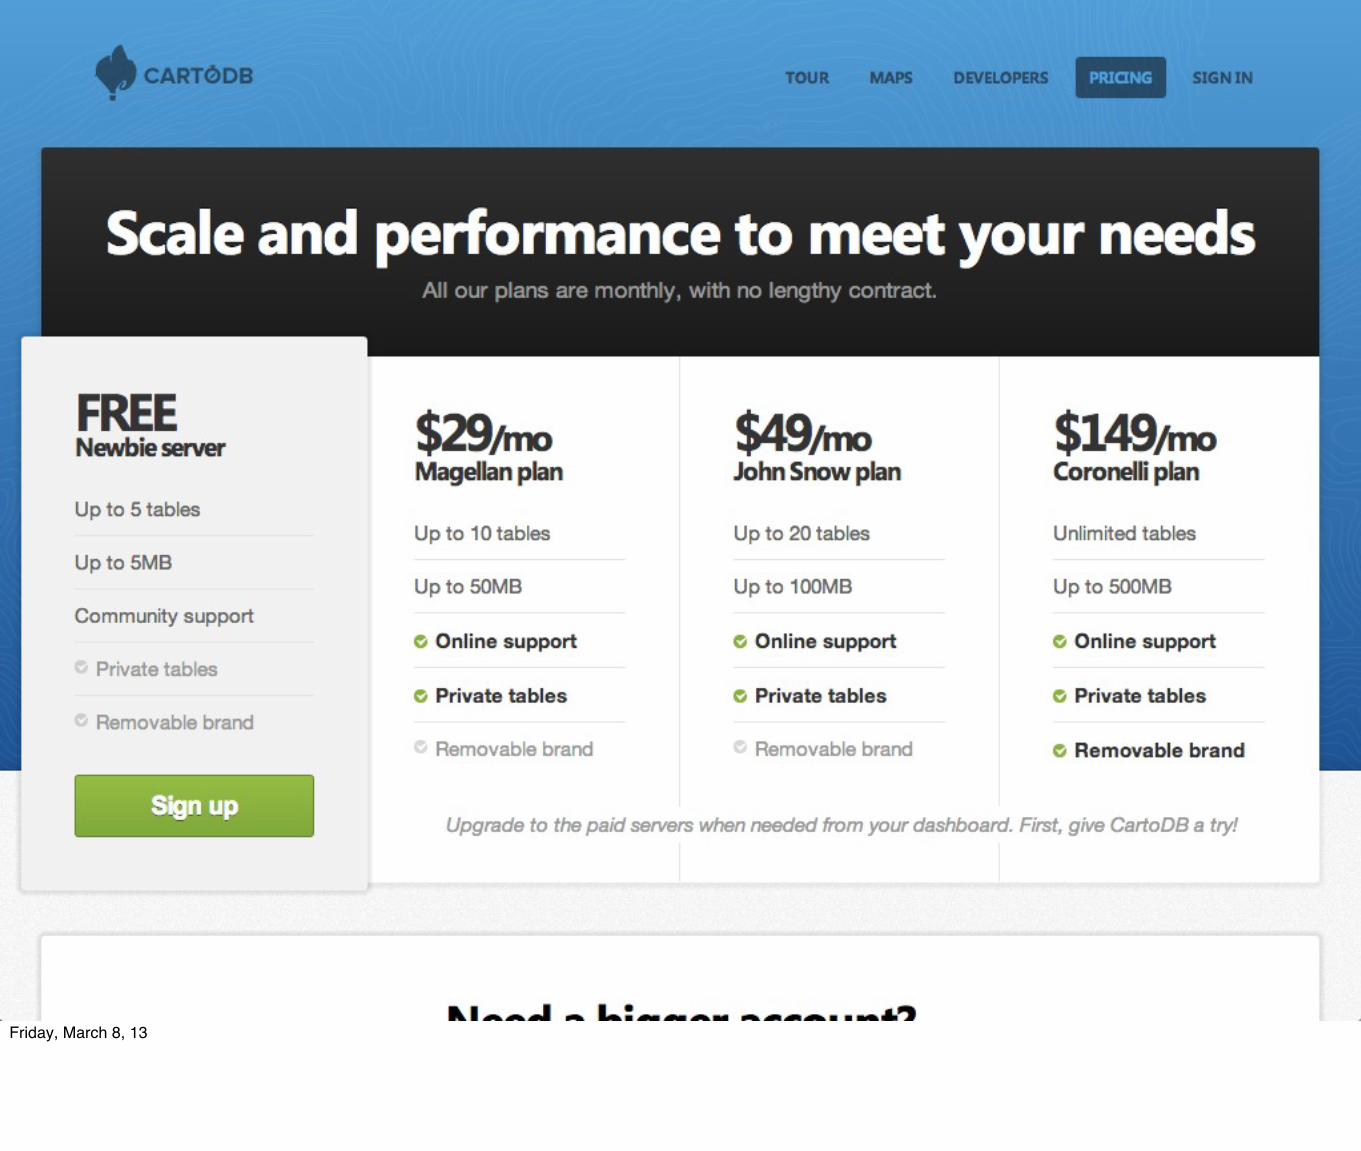
_Cloud servicesIs not just Hype!The democratization of Computing capacityEverybody can now compete with Google! Welll, kind of.
Friday, March 8, 13
Friday, March 8, 13
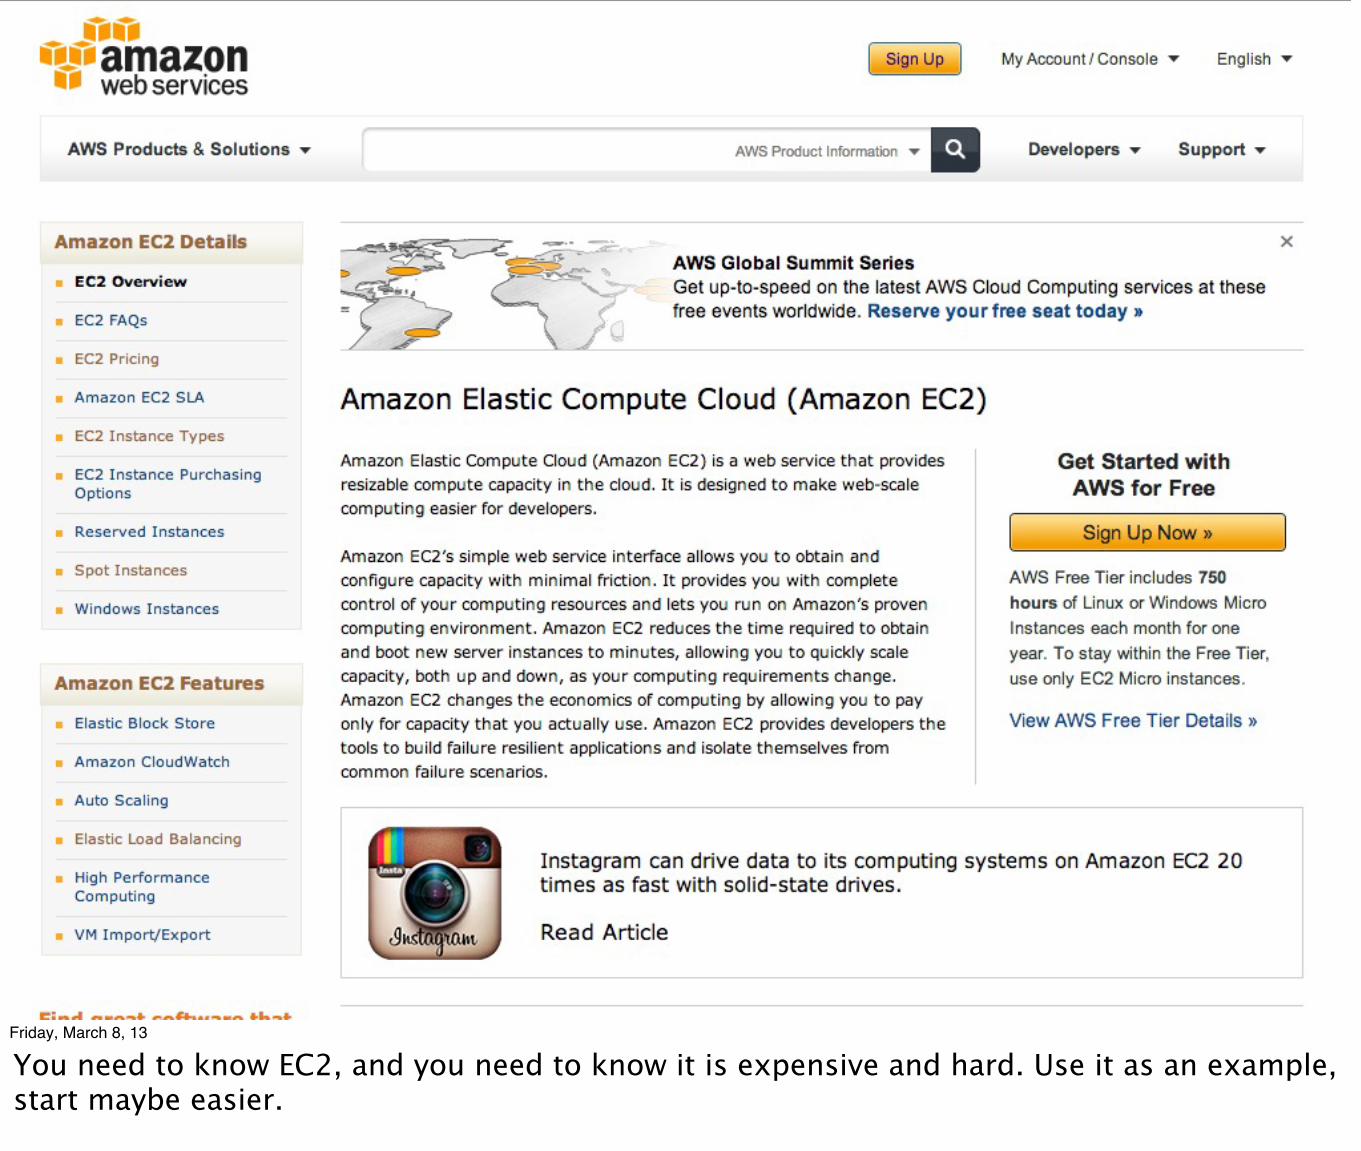
You need to know EC2, and you need to know it is expensive and hard. Use it as an example, start maybe easier.
Friday, March 8, 13
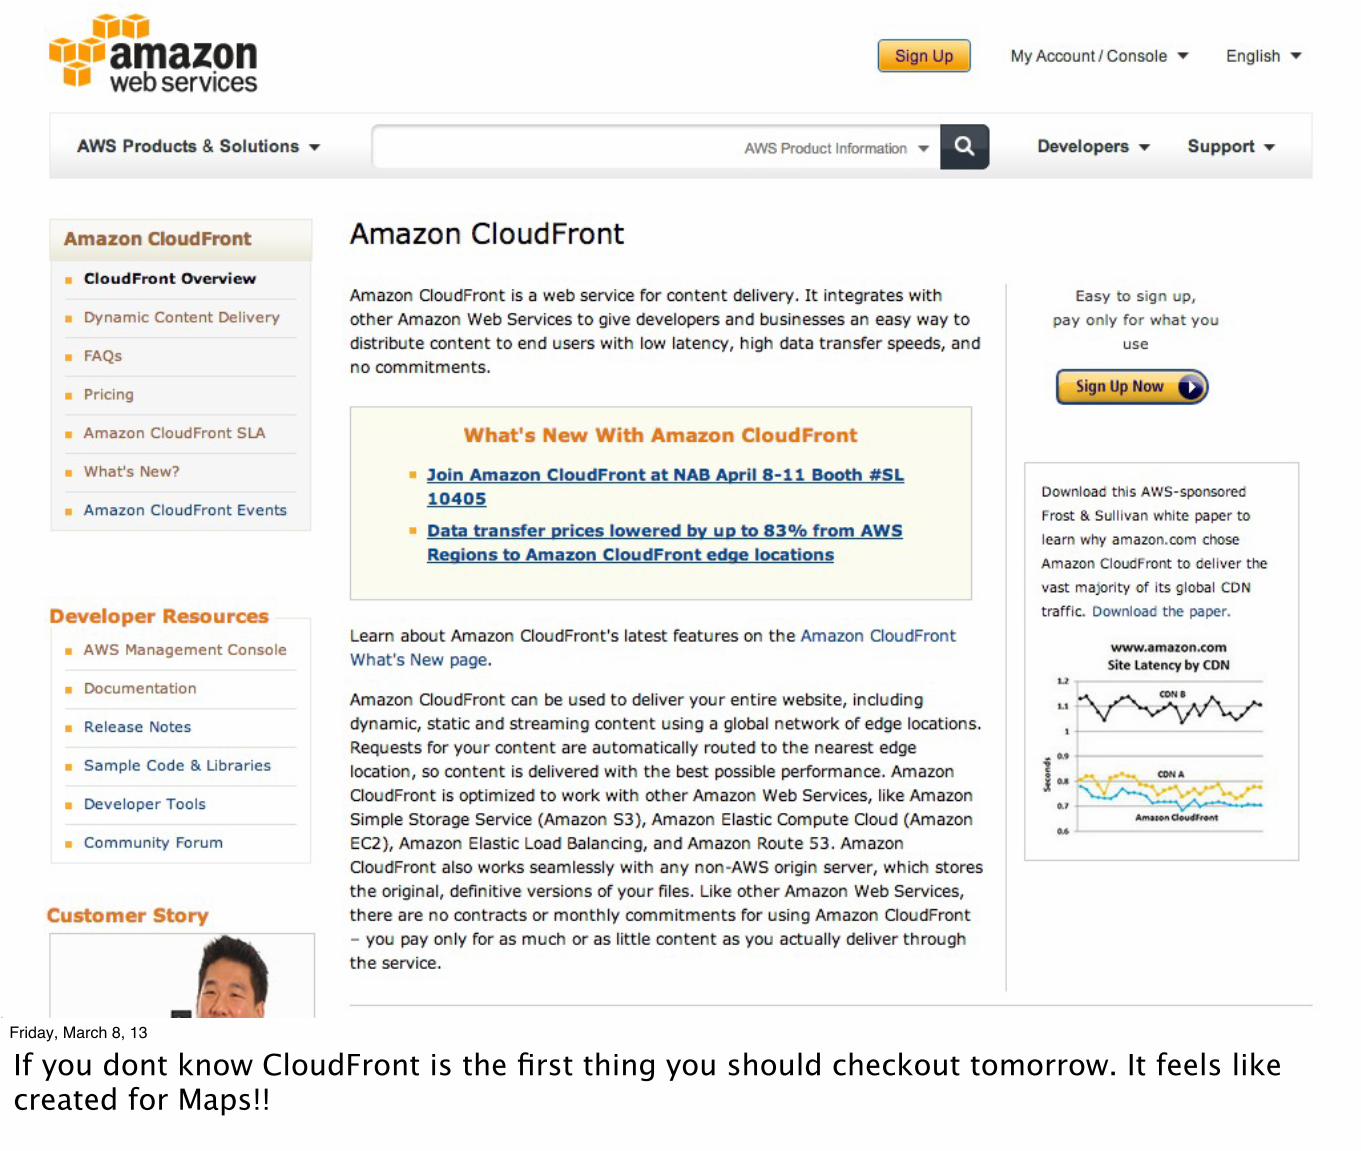
If you dont know CloudFront is the first thing you should checkout tomorrow. It feels like created for Maps!!
Friday, March 8, 13
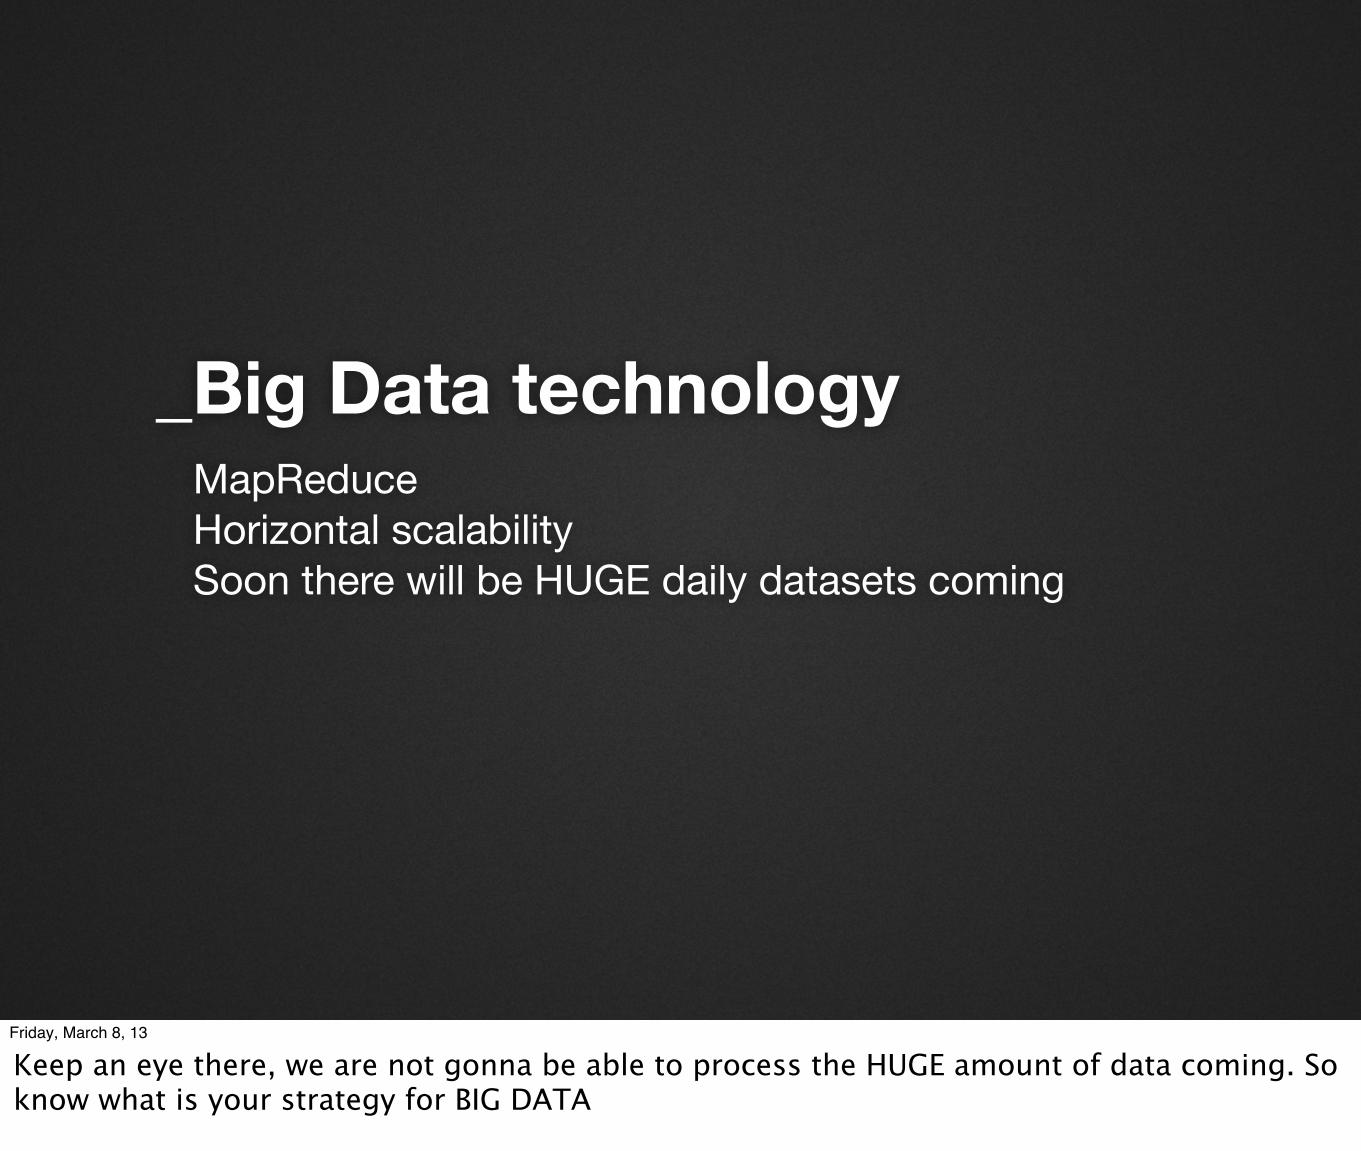
_Big Data technologyMapReduceHorizontal scalabilitySoon there will be HUGE daily datasets coming
Friday, March 8, 13
Keep an eye there, we are not gonna be able to process the HUGE amount of data coming. So know what is your strategy for BIG DATA
Friday, March 8, 13
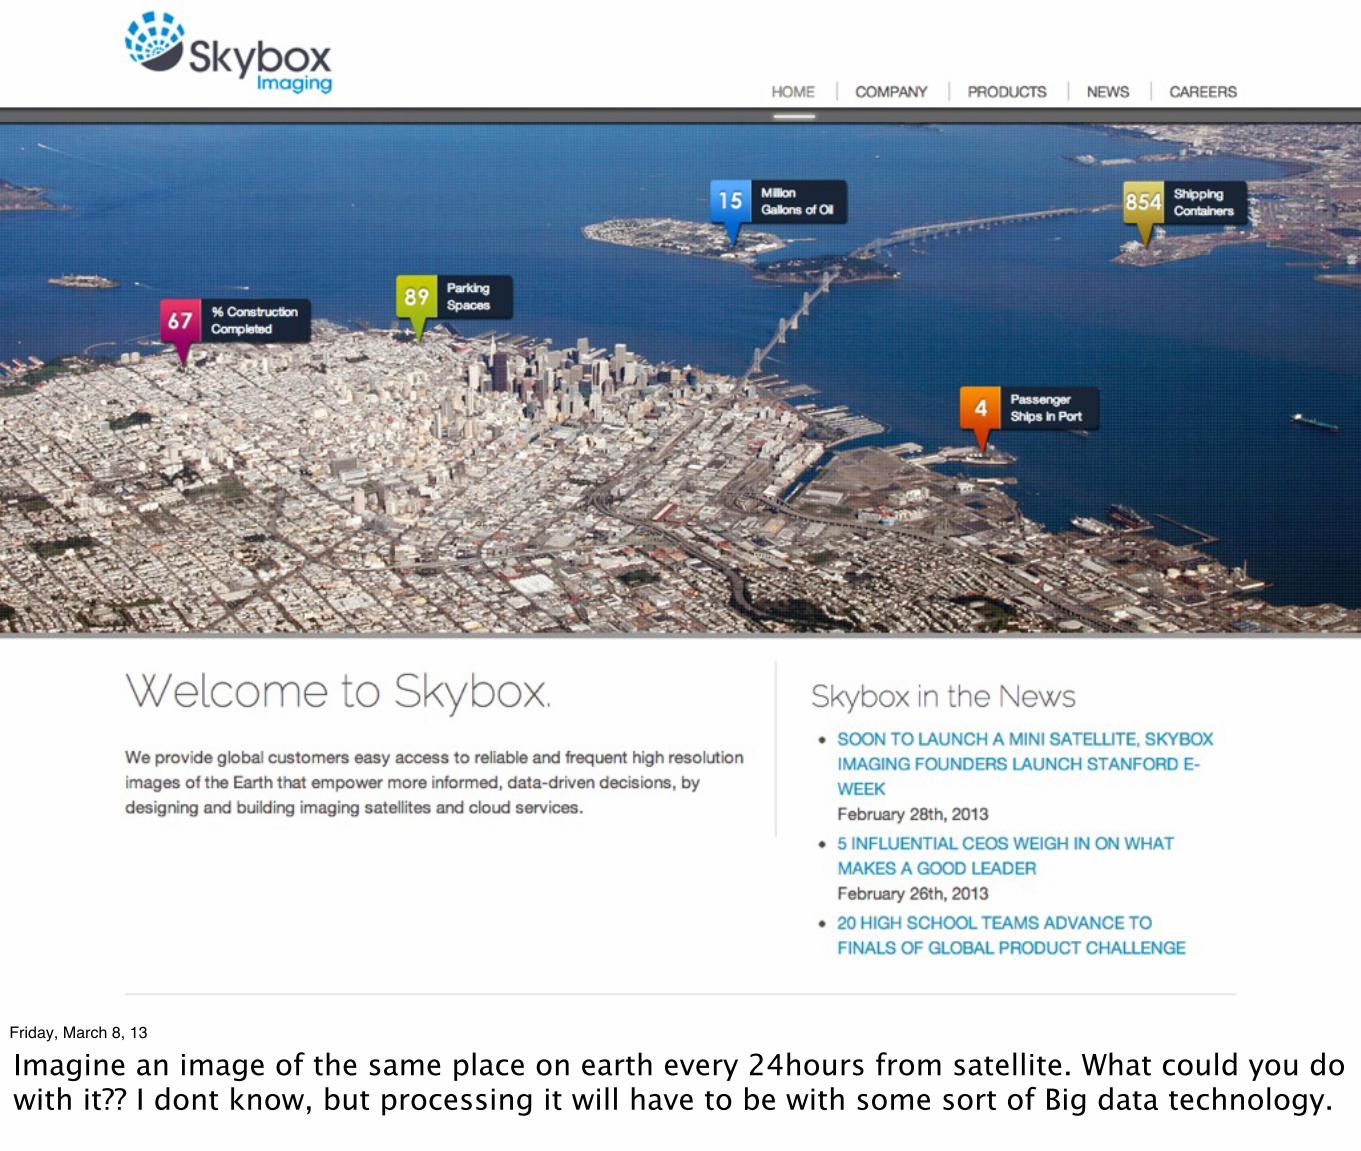
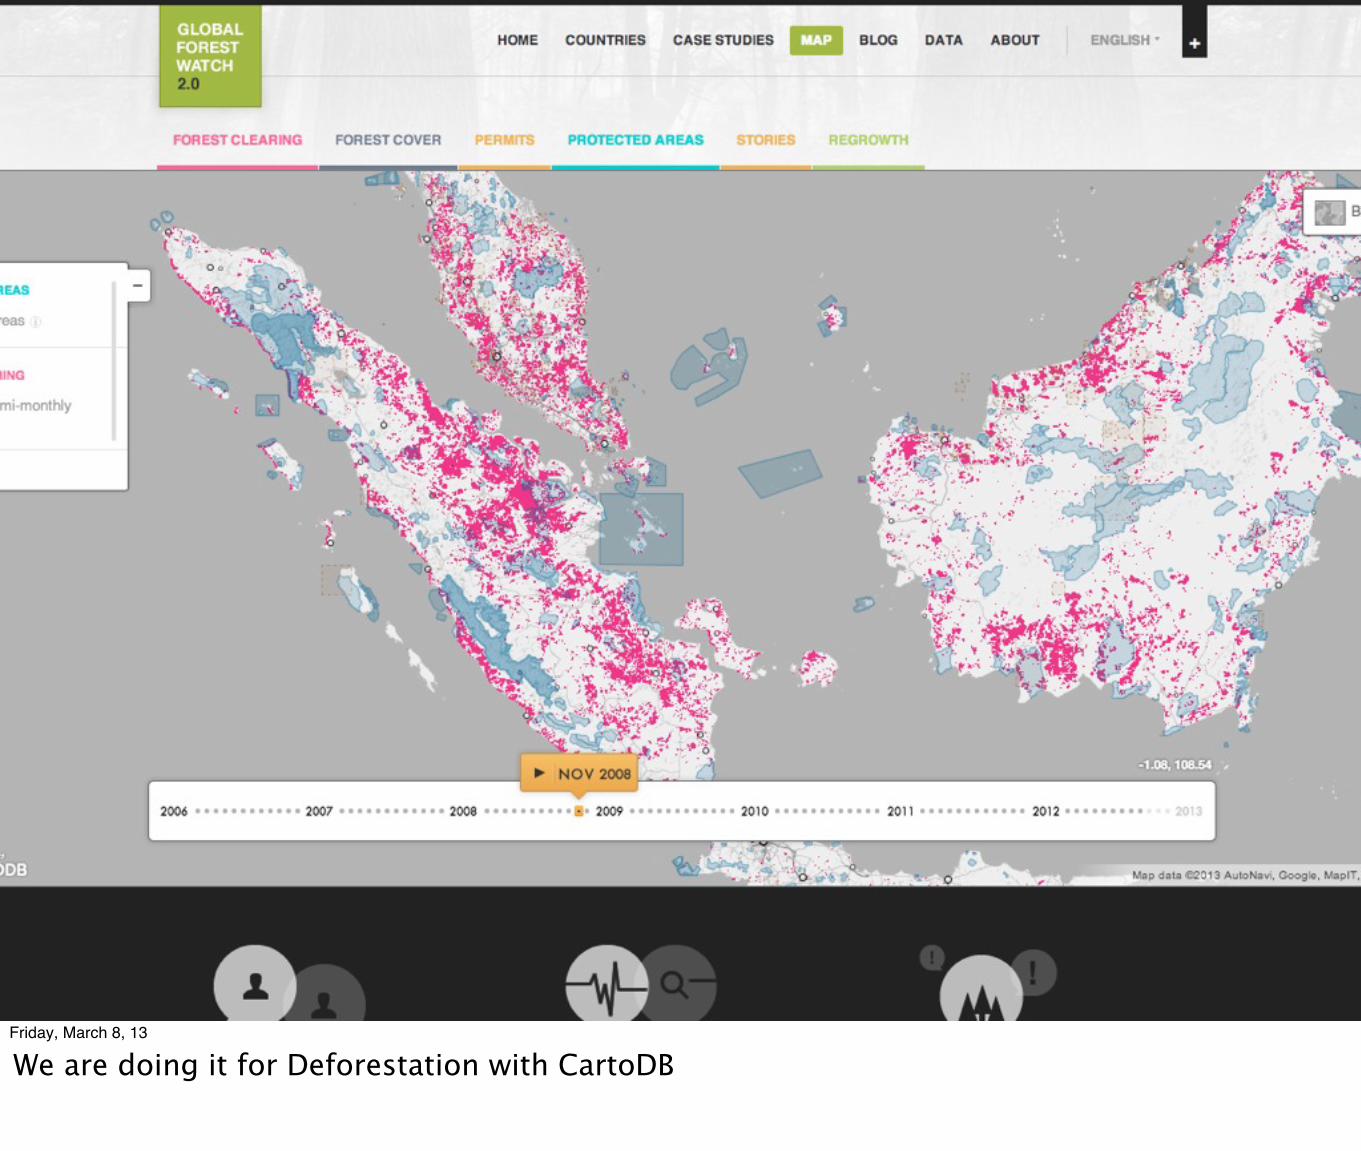
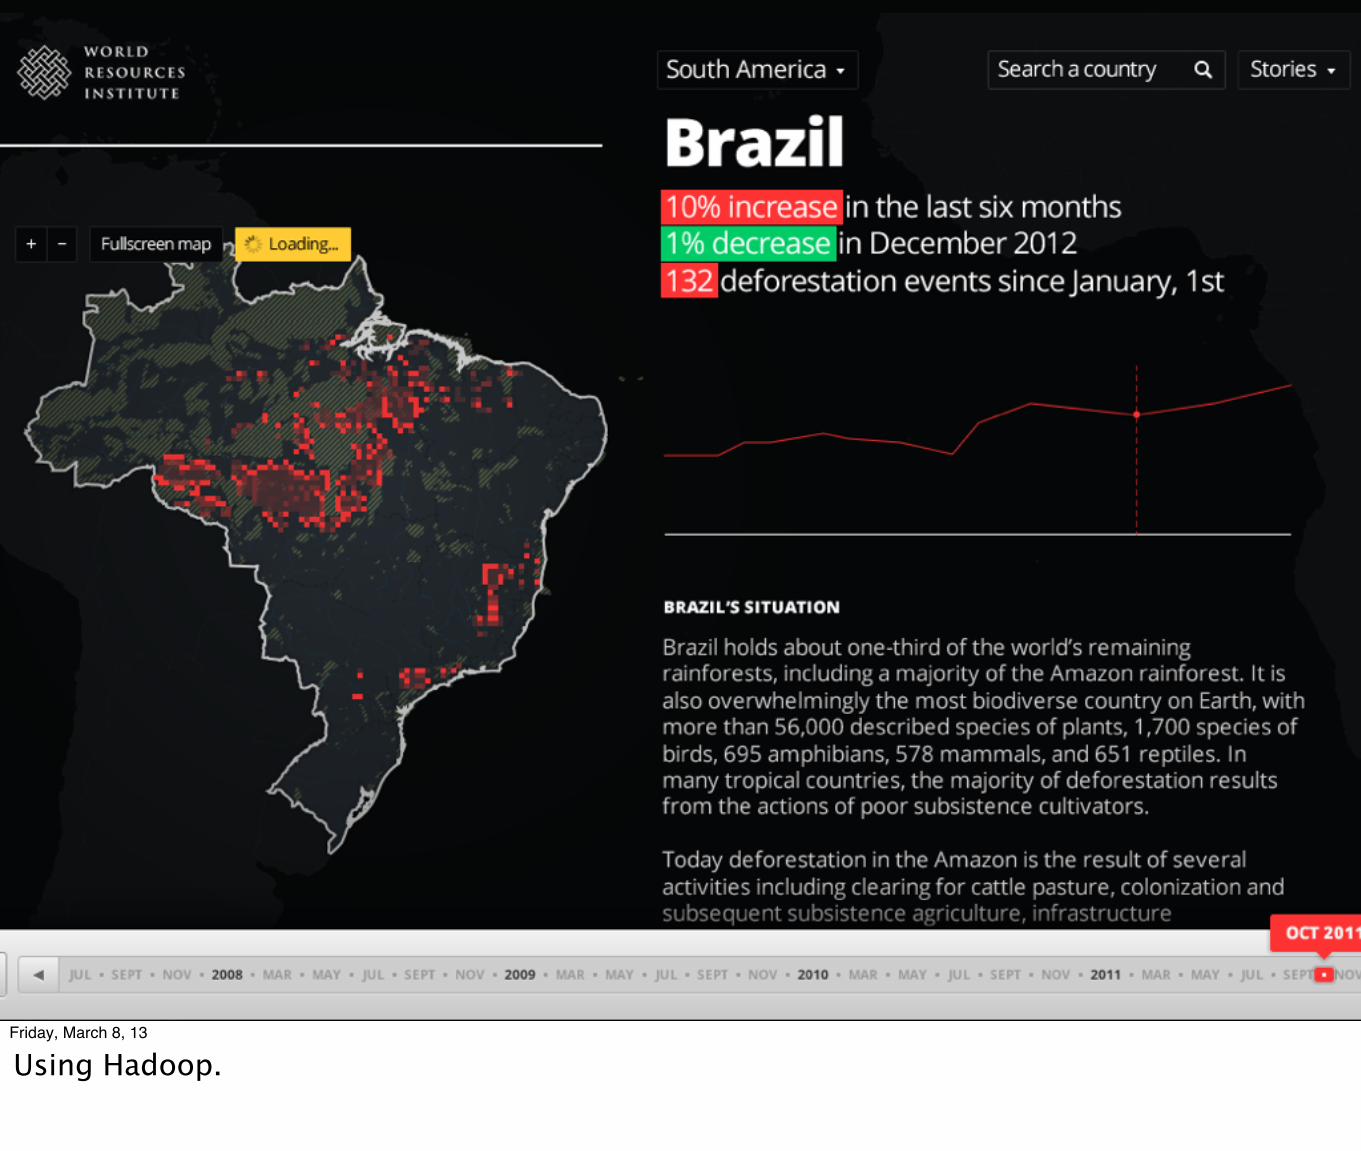
Imagine an image of the same place on earth every 24hours from satellite. What could you do with it?? I dont know, but processing it will have to be with some sort of Big data technology.
Friday, March 8, 13
We are doing it for Deforestation with CartoDB
Friday, March 8, 13
Using Hadoop.
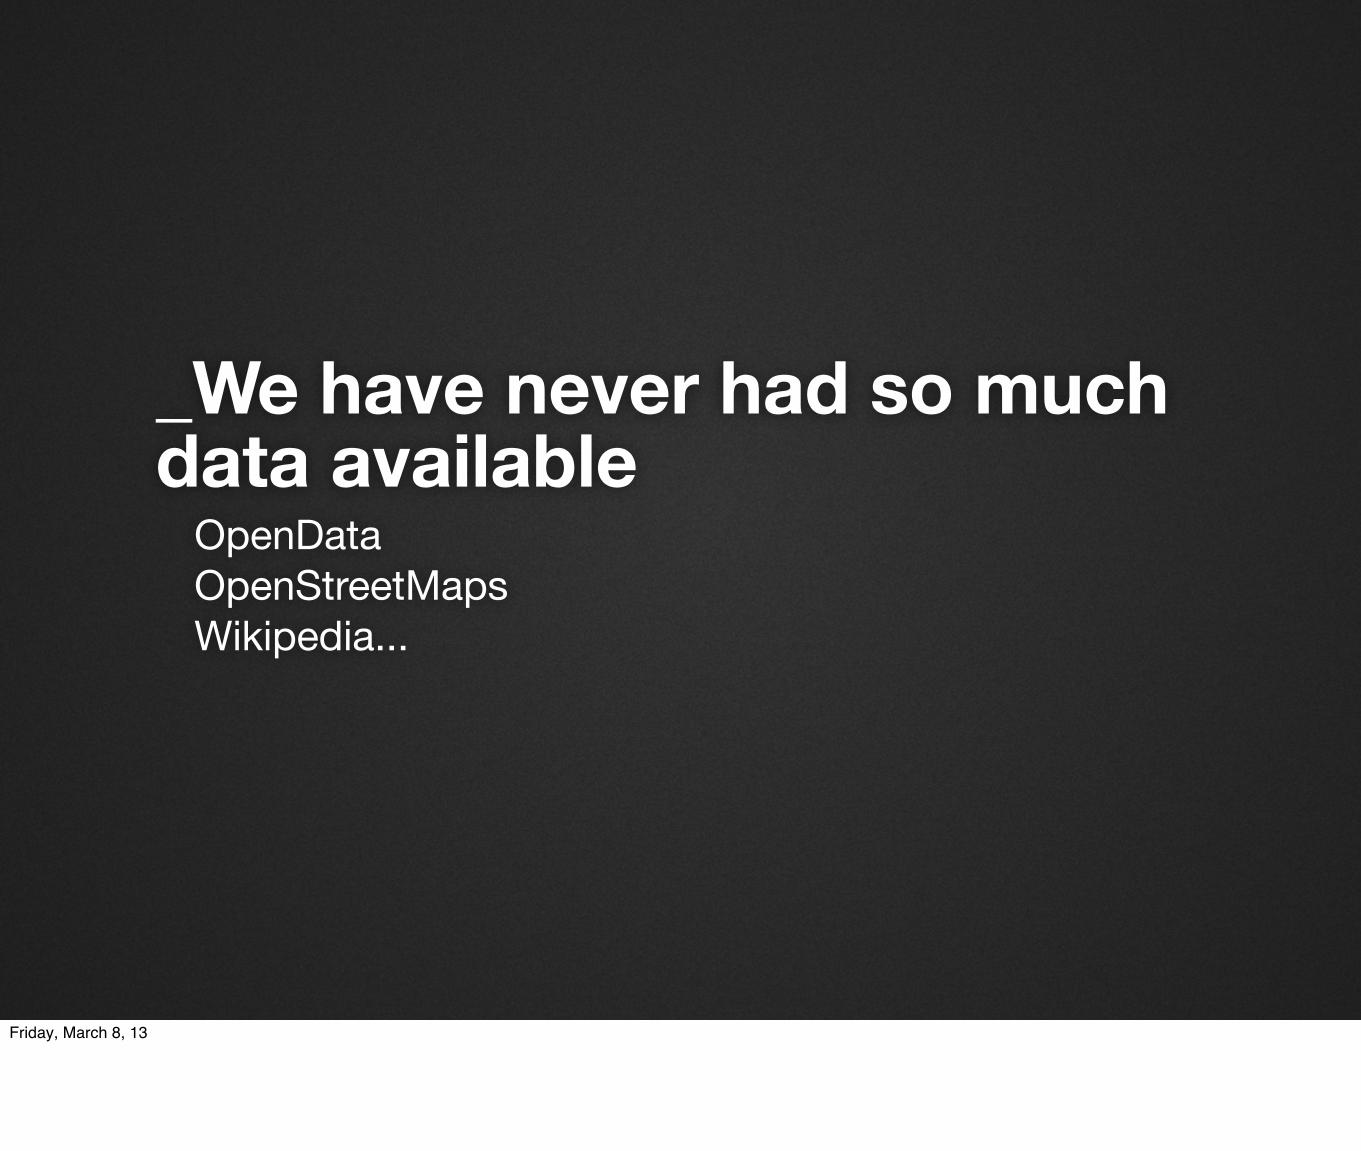
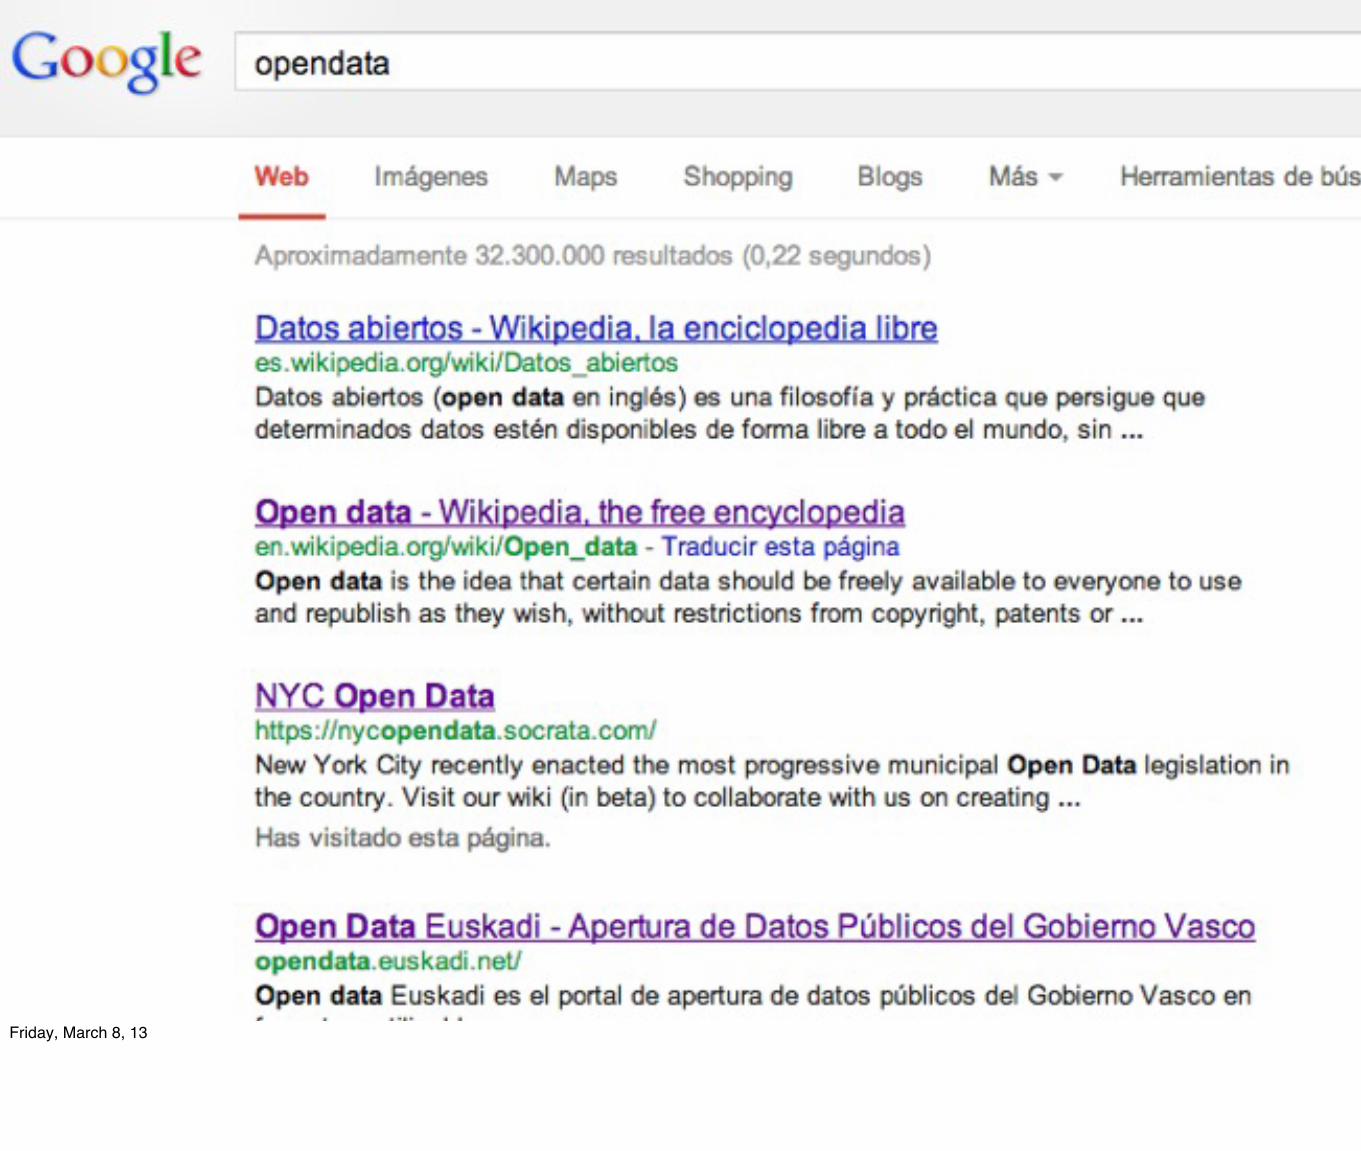
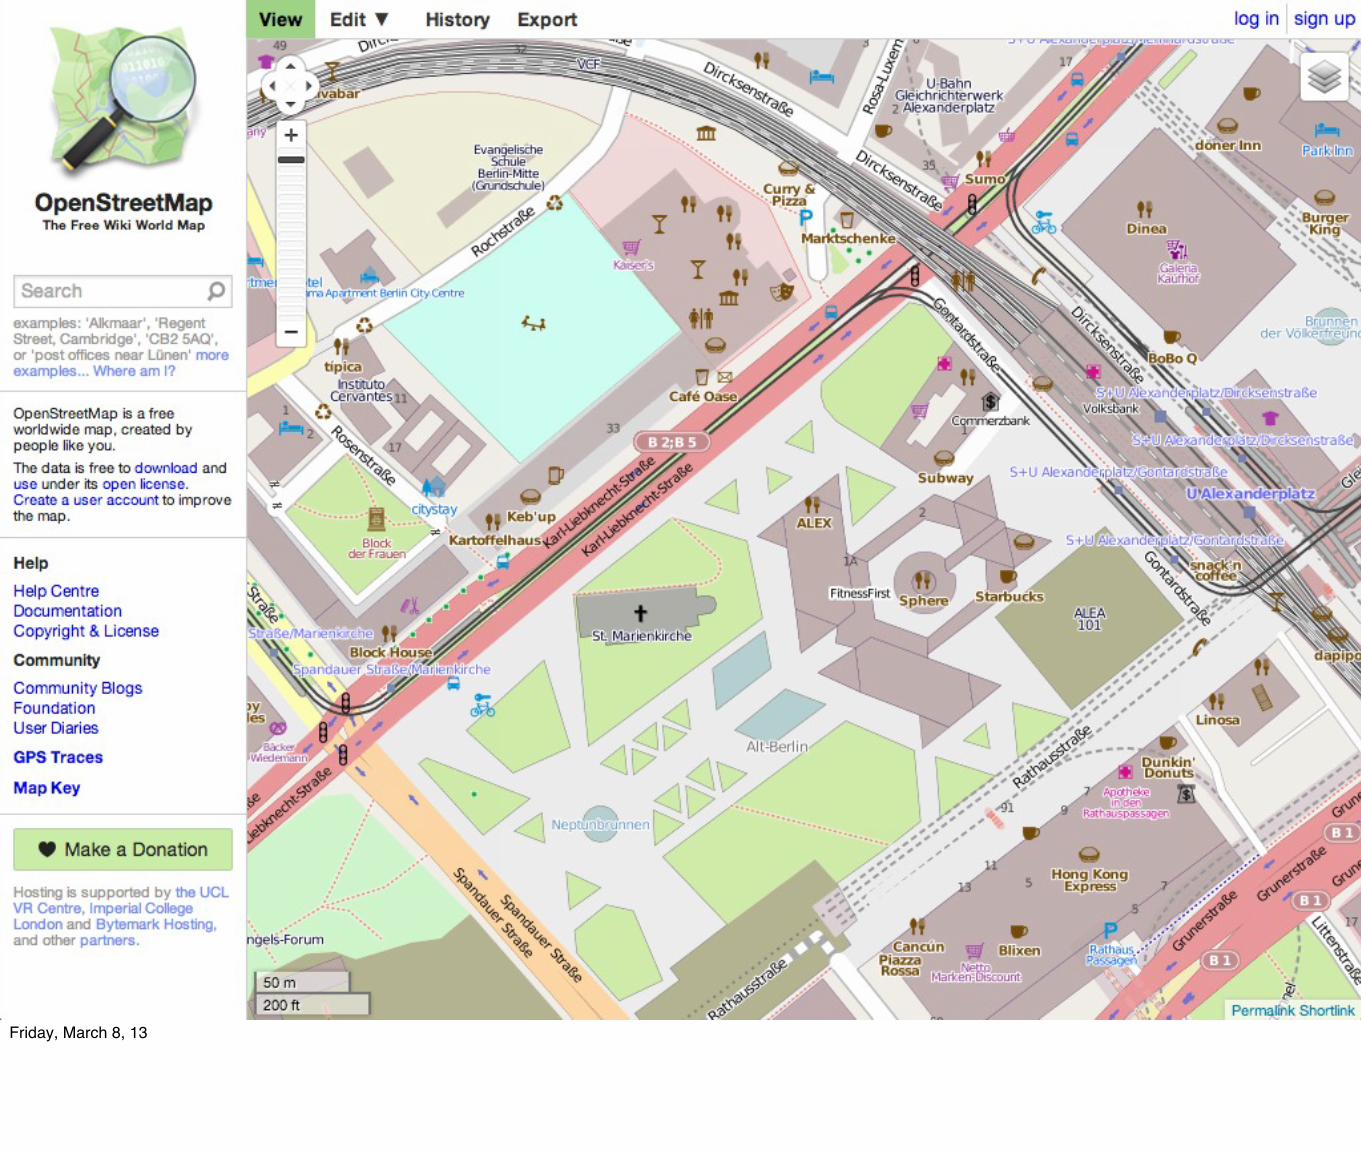
_We have never had so much data available
OpenDataOpenStreetMapsWikipedia...
Friday, March 8, 13
Friday, March 8, 13
Friday, March 8, 13

Friday, March 8, 13
Friday, March 8, 13
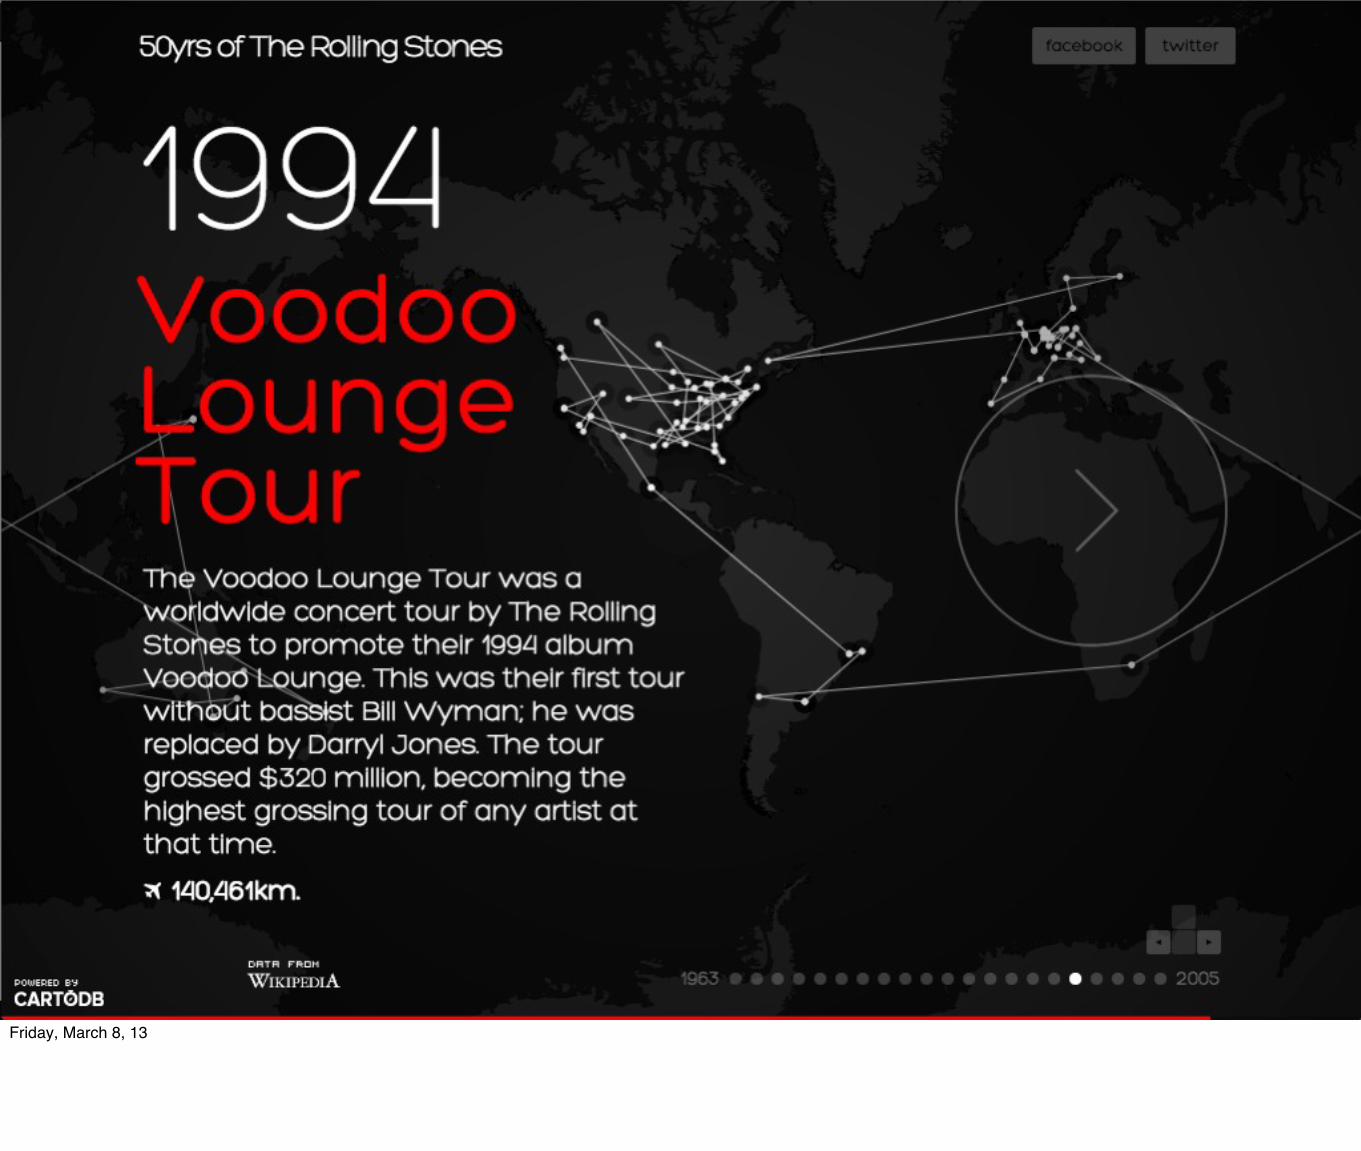
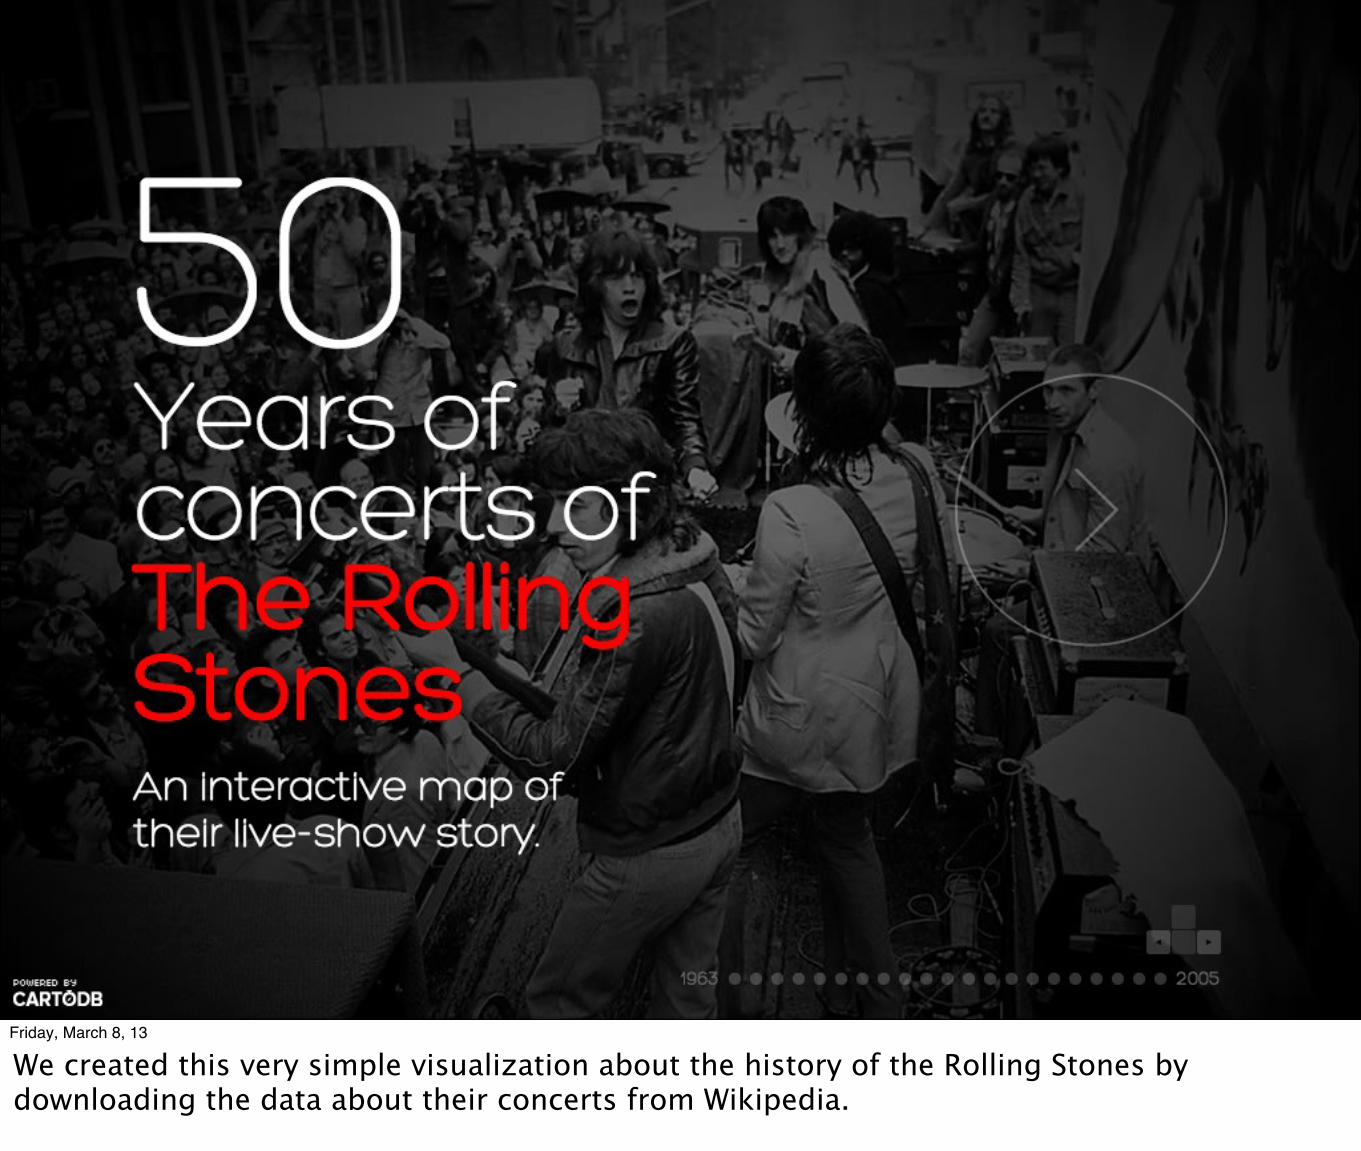
We created this very simple visualization about the history of the Rolling Stones by downloading the data about their concerts from Wikipedia.
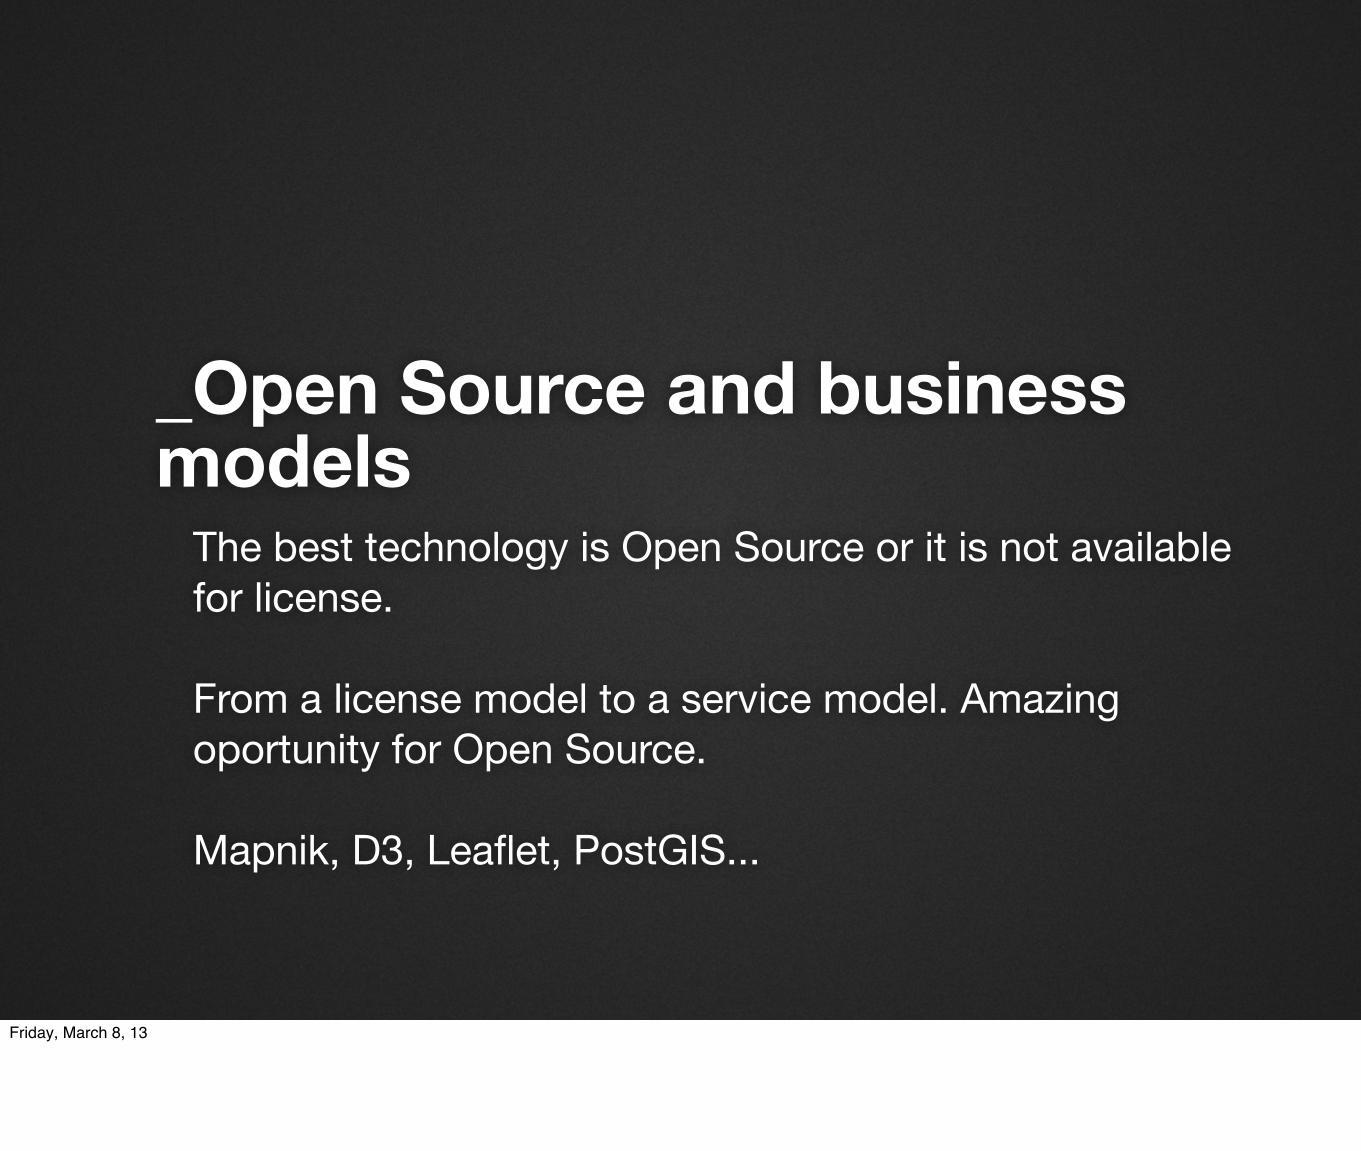
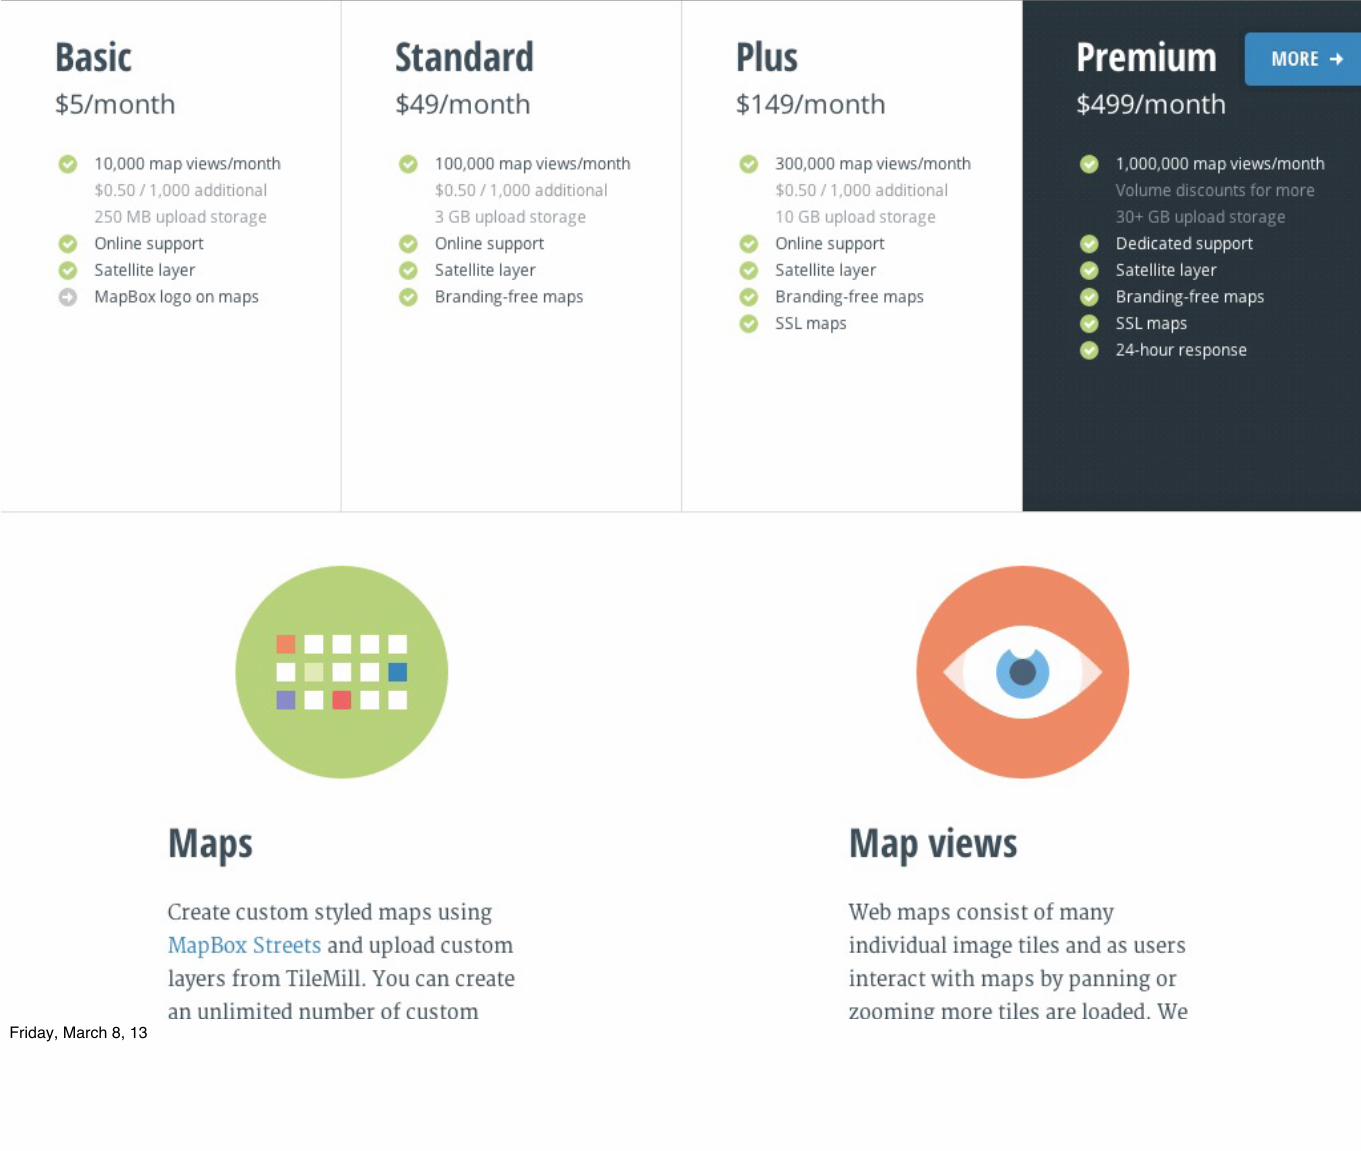
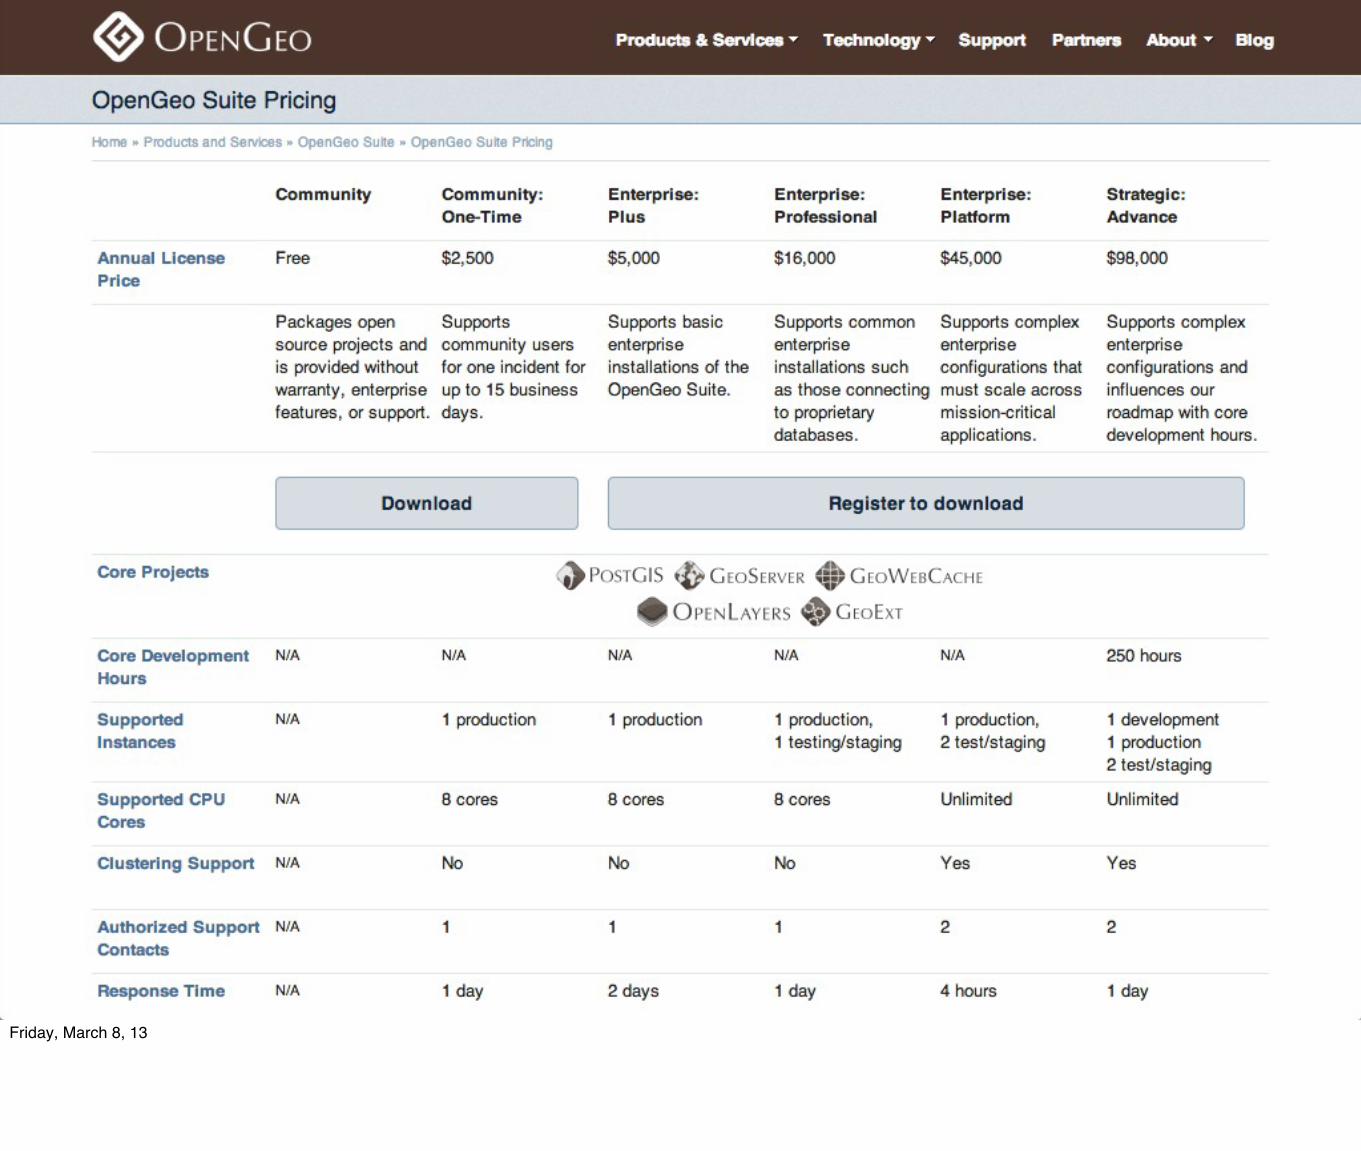
_Open Source and business models
The best technology is Open Source or it is not available for license.
From a license model to a service model. Amazing oportunity for Open Source.
Mapnik, D3, Leaflet, PostGIS...
Friday, March 8, 13
Friday, March 8, 13
Friday, March 8, 13
Friday, March 8, 13
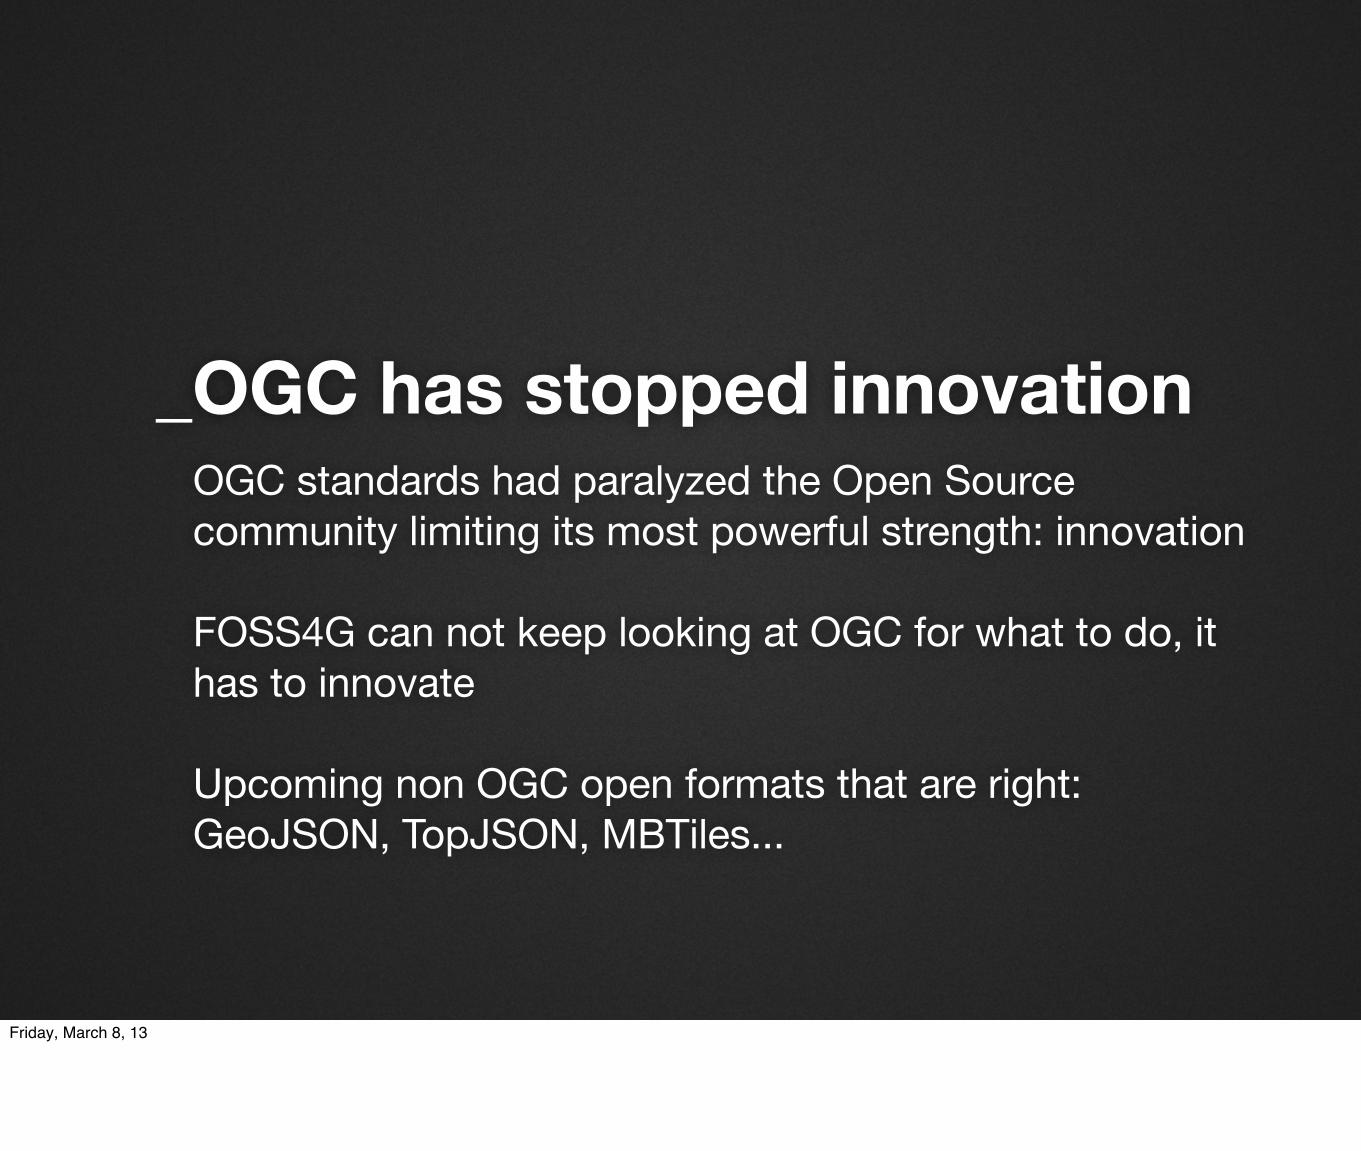
_OGC has stopped innovationOGC standards had paralyzed the Open Source community limiting its most powerful strength: innovation
FOSS4G can not keep looking at OGC for what to do, it has to innovate
Upcoming non OGC open formats that are right:GeoJSON, TopJSON, MBTiles...
Friday, March 8, 13
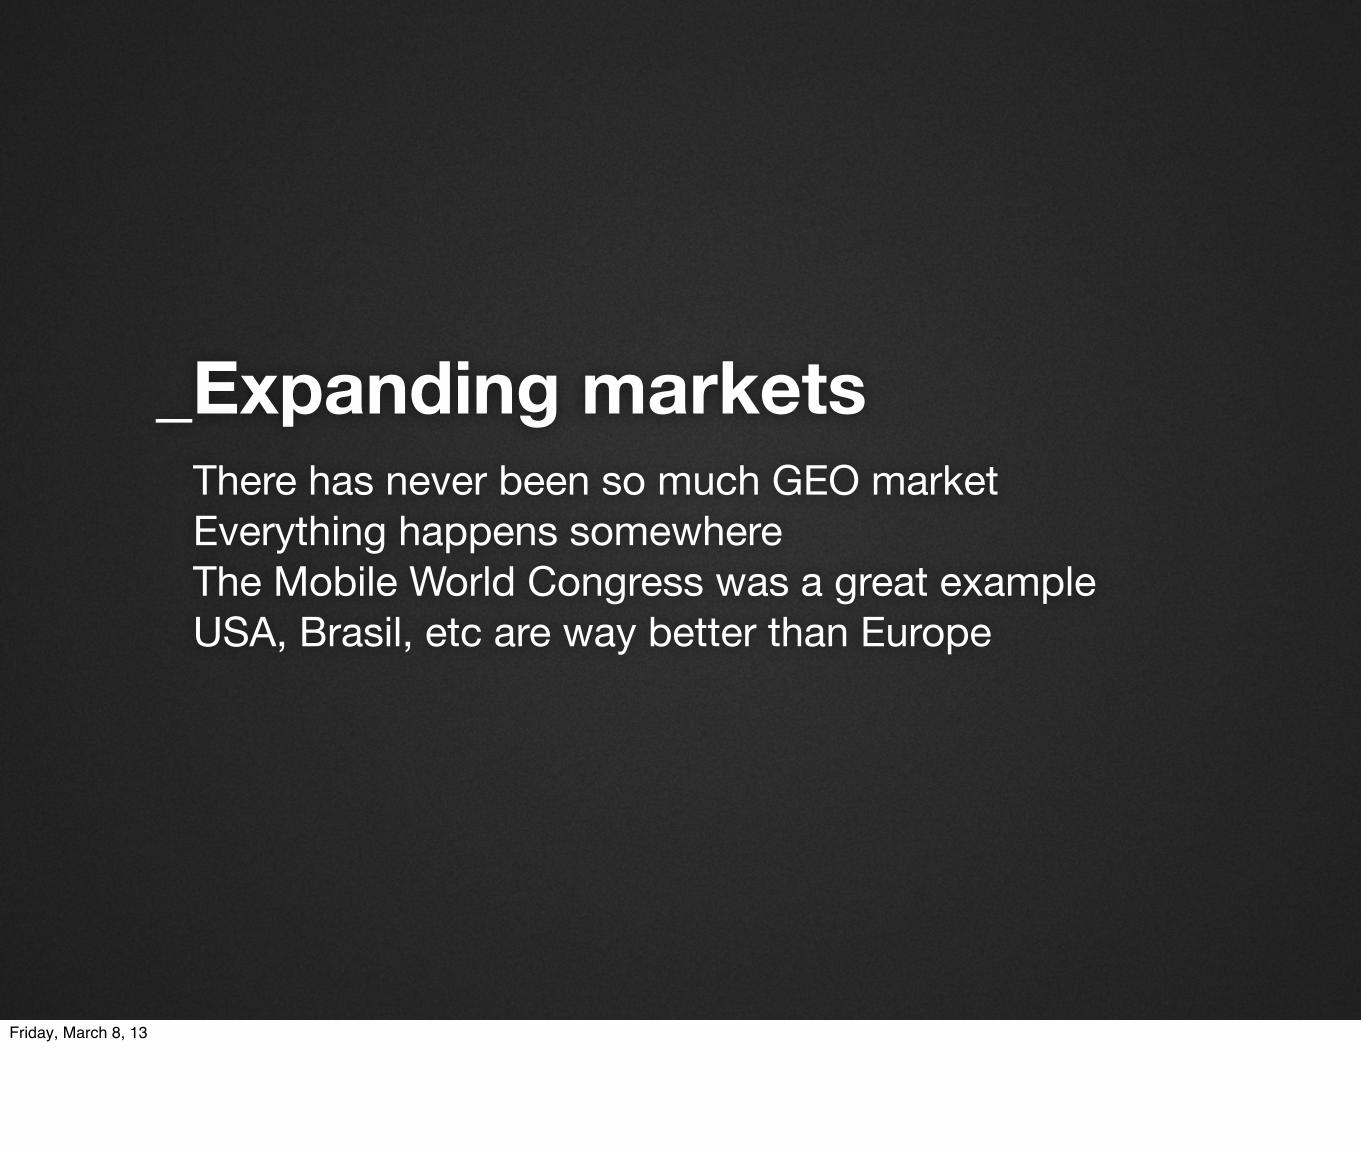
_Expanding marketsThere has never been so much GEO marketEverything happens somewhereThe Mobile World Congress was a great exampleUSA, Brasil, etc are way better than Europe
Friday, March 8, 13
_How to do GEO on the web today
http://www.axismaps.com/blog/2012/09/advice-to-the-aspiring-interactive-cartographer/
1) Be able to search for data and transform them.2) Web Design/Development: HTML,JS, CSS3) JS, lot of JS: CartoDB, MapBox, D3...
Friday, March 8, 13
Friday, March 8, 13
_How to NOT do GEO on the web today
Installing your own serversAdministering your own databaseProgramming/Designing in XMLCartographers should not be devops
Friday, March 8, 13

Javier de la Torre - [email protected], March 8, 13