Embed Size (px)
Citation preview

continued on page 3
A primary concern about climate change is its impact on the earth’s water cycle. A sci-entist in New Zealand is using Esri ArcGIS technology and the climate modeling tool SimCLIM to create climate change risk and resilience assessments. These assessments are helping her community create a resiliency plan that meets the community’s water needs through 2050. In Hawke’s Bay, New Zealand, drought is impacting industries that contribute to the region’s economy. The Hawke’s Bay Regional Council uses GIS to monitor and predict climate change and its impact on water resources. GIS-made maps are providing the Council with insight about the contribution of precipitation to water resources, the effects of evapotranspira-tion, and how these might change in the future. The Hawke’s Bay Regional Council manages the area’s water quality and quantity, air quality, land sustainability, and response to natural hazards. Drought impacts have compelled the Council to investigate the advantages of constructing a dam in the Tukituki catch-ment that would capture water in the summer. Hawke’s Bay Regional Council senior scientist Dr. Kathleen Kozyniak used GIS to forecast rainfall levels as far forward as 2050 and create a geographic scenario showing how these levels would affect the catchment. Kozyniak monitors air quality and assesses the impact and sustainability of
GIS Climate Model Improves Water ManagementLong-Term Forecast Helps Council Design Resiliency Plan
air discharges. She also provides informa-tion about the region’s climate, the im-plications of climate change, and climate trends and anomalies. She uses Esri’s ArcGIS to calculate rainfall averages. To evaluate risks from climate change on a regional to local scale, the scientist used CLIMsystems’ SimCLIM, which is a toolbar designed to work with ArcGIS. This add-in tool helped her assess images of climate change, produce impact models, and perform extreme event analysis.
Kozyniak quantified rainfall and temperatures across the region on an annual, seasonal, and monthly basis. The climate variables are minimum, mean, and maximum temperatures as well as precipitation. Using 1990 climate data for her baseline year, she calculated and mapped baseline regional rainfall within the Hawke’s Bay area. Rainfall ranged from 2,850 mm in the northwestern ranges to 760 mm on the eastern plains (figure 1).
Figure 1. A baseline (1990) map of Hawke’s Bay depicts annual rainfall across the region in millimeters.
for Environmental Management Summer 2014
Esri News
Summer 2014
Esri News for Envrionmental Management is a publication of the Environmental Solutions Group of Esri.
To contact the Esri Desktop Order Center, call 1-800-447-9778 within the United States or 909-793-2853, ext. 1-1235, outside the United States.
Visit the Esri website at esri.com.
View Esri News for Environmental Management online at esri.com/environment or scan the code below with your smartphone.
Advertise with UsE-mail [email protected].
Submit ContentTo submit articles for publication in Esri News for Environ-mental Management, contact Barbara Shields at bshields @esri.com.
Manage Your SubscriptionTo update your mailing address or subscribe or unsubscribe to Esri publications, visit esri.com/publications.
International customers should contact an Esri distributor to manage their subscriptions.
For a directory of distributors, visit esri.com/distributors.
Circulation ServicesFor back issues, missed issues, and other circulation servic-es, e-mail [email protected]; call 909-793-2853, extension 2778; or fax 909-798-0560.
2 Esri News for Environmental Management Summer 2014
Contents
Cover
1 GIS Climate Model Improves Water Management
Case Study
4 GIS Improves Safeguarding Marine Water Quality in
Abu Dhabi
6 WHRC Fights Climate Change and Preserves with
GIS and Lidar
9 On the Road
10 Understanding Trends Helps Romania Protect Biodiversity
11 Audubon ArcGIS Platform Drives Bird Habitat Policy
The information contained in this work is the exclusive property of Esri or its licensors. This work is protected under United States copyright law and other international copyright treaties and conventions. No part of this work may be reproduced or transmitted in any form or by any means, electronic or mechanical, including photocopying and recording, or by any information storage or retrieval system, except as expressly permitted in writing by Esri. All requests should be sent to Attention: Contracts and Legal Services Manager, Esri, 380 New York Street, Redlands, CA 92373-8100 USA.
The information contained in this work is subject to change without notice.
@esri.com, 3D Analyst, ACORN, Address Coder, ADF, AML, ArcAtlas, ArcCAD, ArcCatalog, ArcCOGO, ArcData, ArcDoc, ArcEdit, ArcEditor, ArcEurope, ArcExplorer, ArcExpress, ArcGIS, arcgis.com, ArcGlobe, ArcGrid, ArcIMS, ARC/INFO, ArcInfo, ArcInfo Librarian, ArcLessons, ArcLocation, ArcLogistics, ArcMap, ArcNetwork, ArcNews, ArcObjects, ArcOpen, ArcPad, ArcPlot, ArcPress, ArcPy, ArcQuest, ArcReader, ArcScan, ArcScene, ArcSchool, ArcScripts, ArcSDE, ArcSdl, ArcSketch, ArcStorm, ArcSurvey, ArcTIN, ArcToolbox, ArcTools, ArcUSA, ArcUser, ArcView, ArcVoyager, ArcWatch, ArcWeb, ArcWorld, ArcXML, Atlas GIS, AtlasWare, Avenue, BAO, Business Analyst, Business Analyst Online, BusinessMAP, CityEngine, Community, Community Analyst, CommunityInfo, Community Maps, Database Integrator, DBI Kit, EDN, Esri, esri.com, Esri—Team GIS, Esri—The GIS Company, Esri—The GIS People, Esri—The GIS Software Leader, FormEdit, GeoCollector, GeoEnrichment, Geographic Design System, Geography Matters, Geography Network, geographynetwork.com, Geoloqi, Geotrigger, GIS by Esri, gis.com, GISData Server, GIS Day, gisday.com, GIS for Everyone, JTX, MapIt, Maplex, MapObjects, MapStudio, ModelBuilder, MOLE, MPS—Atlas, PLTS, Rent-a-Tech, SDE, SML, Sourcebook•America, SpatiaLABS, Spatial Database Engine, StreetMap, Tapestry, the ARC/INFO logo, the ArcGIS Explorer logo, the ArcGIS logo, the ArcPad logo, the Esri globe logo, the Esri Press logo, The Geographic Advantage, The Geographic Approach, the GIS Day logo, the MapIt logo, The World’s Leading Desktop GIS, Water Writes, and Your Personal Geographic Information System are trademarks, service marks, or registered marks of Esri in the United States, the European Community, or certain other jurisdictions. CityEngine is a registered trademark of Procedural AG and is distributed under license by Esri.
Other companies and products or services mentioned herein may be trademarks, service marks, or registered marks of their respective mark owners.
Copyright © 2014 Esri.All rights reserved. Printed in the United States of America.
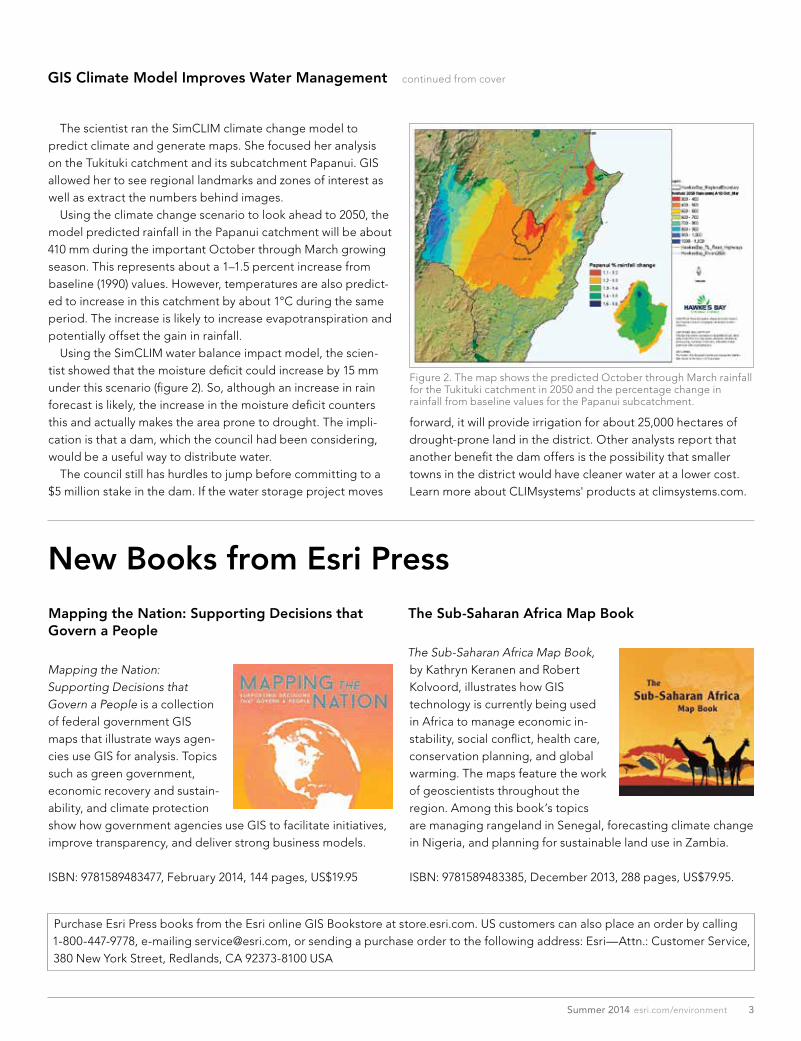
The scientist ran the SimCLIM climate change model to predict climate and generate maps. She focused her analysis on the Tukituki catchment and its subcatchment Papanui. GIS allowed her to see regional landmarks and zones of interest as well as extract the numbers behind images. Using the climate change scenario to look ahead to 2050, the model predicted rainfall in the Papanui catchment will be about 410 mm during the important October through March growing season. This represents about a 1–1.5 percent increase from baseline (1990) values. However, temperatures are also predict-ed to increase in this catchment by about 1°C during the same period. The increase is likely to increase evapotranspiration and potentially offset the gain in rainfall. Using the SimCLIM water balance impact model, the scien-tist showed that the moisture deficit could increase by 15 mm under this scenario (figure 2). So, although an increase in rain forecast is likely, the increase in the moisture deficit counters this and actually makes the area prone to drought. The impli-cation is that a dam, which the council had been considering, would be a useful way to distribute water. The council still has hurdles to jump before committing to a $5 million stake in the dam. If the water storage project moves
Figure 2. The map shows the predicted October through March rainfall for the Tukituki catchment in 2050 and the percentage change in rainfall from baseline values for the Papanui subcatchment.
forward, it will provide irrigation for about 25,000 hectares of drought-prone land in the district. Other analysts report that another benefit the dam offers is the possibility that smaller towns in the district would have cleaner water at a lower cost. Learn more about CLIMsystems' products at climsystems.com.
New Books from Esri Press
3Summer 2014 esri.com/environment
GIS Climate Model Improves Water Management continued from cover
Mapping the Nation: Supporting Decisions that Govern a People
Mapping the Nation: Supporting Decisions that Govern a People is a collection of federal government GIS maps that illustrate ways agen-cies use GIS for analysis. Topics such as green government, economic recovery and sustain-ability, and climate protection show how government agencies use GIS to facilitate initiatives, improve transparency, and deliver strong business models.
ISBN: 9781589483477, February 2014, 144 pages, US$19.95
The Sub-Saharan Africa Map Book
The Sub-Saharan Africa Map Book, by Kathryn Keranen and Robert Kolvoord, illustrates how GIS technology is currently being used in Africa to manage economic in-stability, social conflict, health care, conservation planning, and global warming. The maps feature the work of geoscientists throughout the region. Among this book’s topics are managing rangeland in Senegal, forecasting climate change in Nigeria, and planning for sustainable land use in Zambia.
ISBN: 9781589483385, December 2013, 288 pages, US$79.95.
Purchase Esri Press books from the Esri online GIS Bookstore at store.esri.com. US customers can also place an order by calling 1-800-447-9778, e-mailing [email protected], or sending a purchase order to the following address: Esri—Attn.: Customer Service,380 New York Street, Redlands, CA 92373-8100 USA
4 Esri News for Environmental Management Summer 2014
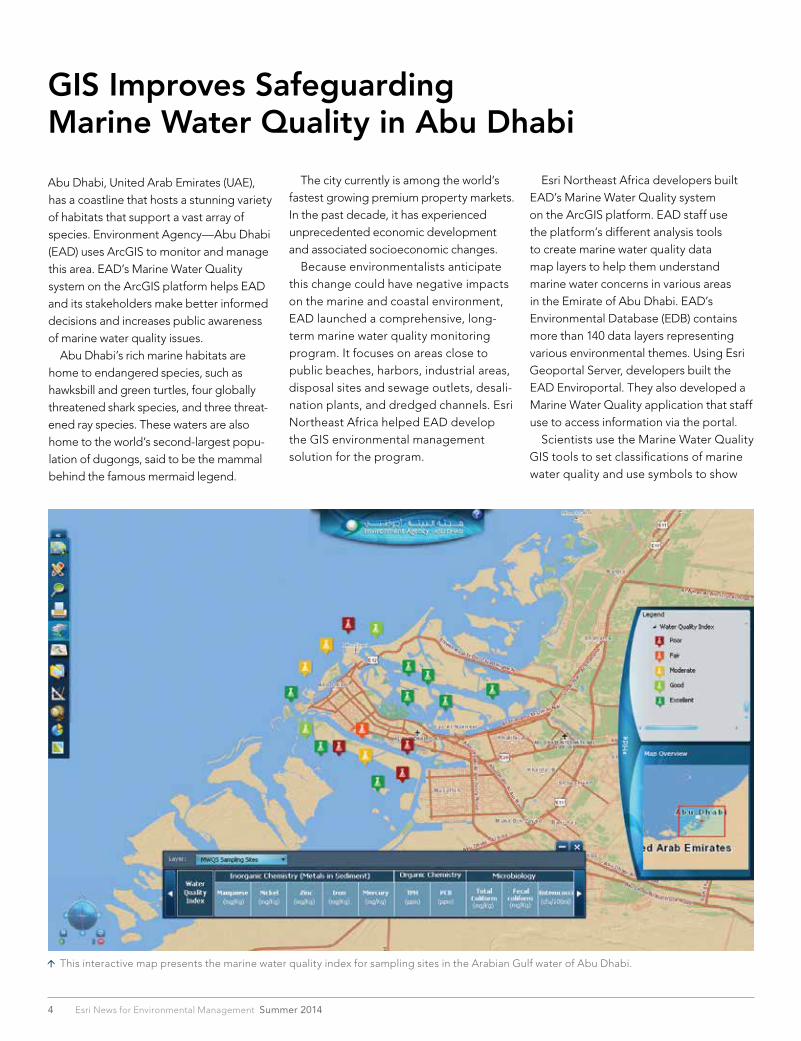
Abu Dhabi, United Arab Emirates (UAE), has a coastline that hosts a stunning variety of habitats that support a vast array of species. Environment Agency—Abu Dhabi (EAD) uses ArcGIS to monitor and manage this area. EAD’s Marine Water Quality system on the ArcGIS platform helps EAD and its stakeholders make better informed decisions and increases public awareness of marine water quality issues. Abu Dhabi’s rich marine habitats are home to endangered species, such as hawksbill and green turtles, four globally threatened shark species, and three threat-ened ray species. These waters are also home to the world’s second-largest popu-lation of dugongs, said to be the mammal behind the famous mermaid legend.
GIS Improves Safeguarding Marine Water Quality in Abu Dhabi
This interactive map presents the marine water quality index for sampling sites in the Arabian Gulf water of Abu Dhabi.
The city currently is among the world’s fastest growing premium property markets. In the past decade, it has experienced unprecedented economic development and associated socioeconomic changes. Because environmentalists anticipate this change could have negative impacts on the marine and coastal environment, EAD launched a comprehensive, long-term marine water quality monitoring program. It focuses on areas close to public beaches, harbors, industrial areas, disposal sites and sewage outlets, desali-nation plants, and dredged channels. Esri Northeast Africa helped EAD develop the GIS environmental management solution for the program.
Esri Northeast Africa developers built EAD’s Marine Water Quality system on the ArcGIS platform. EAD staff use the platform’s different analysis tools to create marine water quality data map layers to help them understand marine water concerns in various areas in the Emirate of Abu Dhabi. EAD’s Environmental Database (EDB) contains more than 140 data layers representing various environmental themes. Using Esri Geoportal Server, developers built the EAD Enviroportal. They also developed a Marine Water Quality application that staff use to access information via the portal. Scientists use the Marine Water Quality GIS tools to set classifications of marine water quality and use symbols to show

5Summer 2014 esri.com/environment
Ras Ghanada, the largest coral reef in the UAE and the Gulf region, supports a flourishing marine habitat for turtles, dugongs, sea snakes, and clownfish. (Credit: Edwin Grandcourt, ©EAD.)
ArcGIS workflow automation helps authorized labs add updated sample test results directly into the EDB. To do this, lab technicians use standardized tem-plates that EAD has carefully designed to accommodate all required sample details. Supervisors’ data review and validation workflow processes are supported as well. An automated process performs cross-checks of water quality parameters with configurable thresholds. Supervisors use an array of quality control tools and can open a bidirectional workflow with water data collectors in which the supervisor either accepts the sample or applies one of three rejection actions: resample, retest, or reject. The information management team controls dissemination levels for shar-ing sample test results depending on whether the information is for EAD internal use or for public use. Data access can be limited to one sampling site or opened to all sampling sites. “The sample workflow, especially the review period, has been slashed signifi-cantly,” Kumar noted. “Our employees are now able to focus on other valuable work.” Thanks to Anil Kumar and Nahla El Banhawy, Esri Northeast Africa, for providing the information in this article.
variations on a map. This helps anyone easily see areas where water quality is exceeding safety limits and by what amount. GIS automatically calculates marine water quality levels according to international standards and best prac-tices. By going to a public-facing website, citizens can see the results of these calculations as color-coded ranges on a map and easily understand the water quality levels along the beaches. Anil Kumar, director of the environ-ment information management division, explained, “Providing such easily under-stood water quality indicators inform beach visitors about the safety of beaches. The website is also gradually building the relation between the public and the environment.” UAE policy makers easily understand marine conditions on GIS-generated reports, which include charts, statistics, summary tables, and maps. They use the portal to access updated data about areas where water quality exceeds safety parameters, as well as find complete sample details, parameter variation trends, and annual summary of marine water quality status. Water quality changes over time are depicted on intuitive, multilevel, custom-izable charts. Interested citizens can track marine water quality by years, months, or
even weeks. Scientists review and com-pare the water quality meters at one or more sites as average annual, monthly, or weekly values. Users are able to identify threshold-violating samples through instantaneous color schemes and timely automatic alerts on the map. GIS maps make it easier for anyone to analyze data. They show areas with poor water quality and draw attention to the possible source of environmental viola-tions. Furthermore, by manipulating the different environment map layers, users can make correlations between at-risk water samples and findings with the neighboring environment. EAD’s GIS Marine Water Quality system improves the department’s marine water sampling workflow from the collection of samples to geospatial analysis to efficient dissemination of information. EAD uses its GIS to manage the entire water sampling workflow, including data analysis and dissemina-tion. The app helps staff manage and analyze relevant data, as well as publish this information as maps, charts, and reports. This information is disseminated to stakeholders such as decision makers, specialists, academia, and the public. The application will soon replace the ex-isting paper-based water sample process with an electronic workflow.
Case Study
Scientists at the Woods Hole Research Center (WHRC) investigate the drivers and impacts of climate change across the globe. They identify opportunities for conservation, restoration, and economic development. WHRC has been using Esri GIS software for more than 30 years. In a recent climate change study, WHRC researchers used lidar data and GIS to analyze biomass density and wildlife habitat corridors across the tropics. This efficient and balanced recycling process keeps the climate at a tem-perature for life to thrive. When human activities, such as fossil fuel burning and deforestation, interrupt the cycle, too much carbon is released into the atmosphere. The increased greenhouse gases in the atmosphere trap the sun’s heat, warming the earth’s surface and changing the climate. For many years, the United Nations Framework Convention on Climate Change (UNFCCC) has been working to stabilize the earth’s climate systems. It cites deforestation as a significant con-tributor to climate change, based largely on the work WHRC has conducted over the past three decades. Participating countries agree to UNFCCC protocols that limit and regulate the release of greenhouse gases. Through its initiative Programme on Reducing Emissions from Deforestation and Forest Degradation (REDD+), the convention works to protect forest carbon and maintain biodiversity while also sustaining human livelihoods. REDD+ provides developing countries with economic incentives to halt the destruction of their forests. In addition to this funding, many nongovernmental organizations (NGO) provide funding to establish conserva-tion lands to protect wildlife habitat. Roads, farms, towns, and ranches near these areas reduce and fragment
WHRC Fights Climate Change and Preserves with GIS and Lidar
habitats, creating islands of protected areas and parks. Many environmental organizations fund the protection of networks of wildlife corridors that allow species to migrate from one protected area to another. By combining government and industry funding provided by REDD+ with conservation funding from NGOs, participating nations can stimulate their economies while transitioning to sustain-able economic models. WHRC research-ers propose that governments and NGOs fund conservation of wildlife corridors through areas of high biomass connect-ing protected areas. This solution would stretch a country’s conservation funding dollars by reducing deforestation and protecting biodiversity. Locating corridor routes that satisfy the objectives of these various stakeholders
is a complex problem. The optimal conservation corridor that meets every-one’s requirements would contain high carbon density, high species richness and endemism, and have low economic opportunity costs. A paper written by Patrick Jantz, Scott Goetz, and Nadine Laporte titled
“Carbon stock corridors to mitigate climate change and promote biodiversity in the tropics” explains methods for de-fining and locating these dense carbon stock corridors and includes carbon stock corridor maps. These WHRC researchers measured biomass density and identified corridors. They created maps showing corridors that connect conservation areas. In addition, they created a decision tool that integrates and prioritizes various criteria. This gives them the information needed to propose
6 Esri News for Environmental Management Summer 2014

areas for conservation that meet multiple objectives. Measuring biomass density is an expensive and time-consuming under-taking if measurements are primarily taken in the field. Fortunately, biomass density can be measured more quickly over large areas using lidar data. Lidar, which stands for light detection and ranging, is a technology whereby a laser is shot from a satellite or aircraft, hits a surface, and bounces back to the source. The speed of bounce back is recorded as a measurement point and added to a point cloud that represents vegetation height, density, and structure. It can also measure the underlying topography. The National Snow and Ice Center (nsidc.org) distributes lidar data from the National Aeronautics and Space Administration’s (NASA) Ice, Cloud, and
Land Elevation Satellite (ICESat). Attached to the satellite is a sampling instrument called the Geoscience Laser Altimeter System (GLAS). It captures a 65-meter di-ameter lidar shot every 180 meters along the ICESat’s orbital track. As the satellite orbited around the globe in a polar orbit, with its orbital tracks separated by 150 kilometers, it gradually built up a data archive. This data has proved very useful to ecologists, foresters, and climate change scientists. To use the lidar data, the WHRC scientists first had to calibrate it with field measurements. To accomplish this over many locations, they enlisted the assistance of a network of scholars in 12 countries around the tropics, who col-lected tree measurements using a stand-ard protocol. The WHRC researchers then calibrated the lidar data by syncing
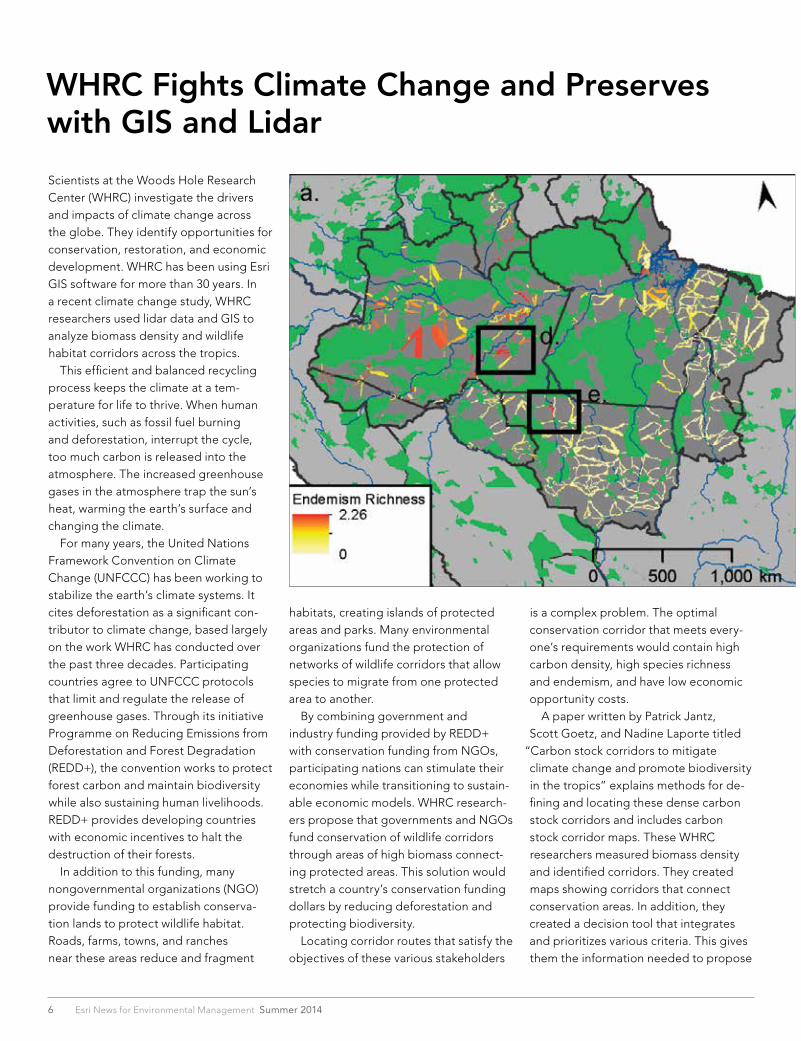
the three-dimensional lidar measure-ments with the field measurements of forest biomass. They sampled about 300 ground sites, incorporating measure-ments of thousands of trees. This was the basis for extending the field measure-ments to millions of samples around the tropics taken from the satellite lidar data. Researchers input the lidar datasets into a file geodatabase and used ArcGIS to build a satellite-derived map of pan-tropic biomass at ˜500-meter resolution. They then created a pantropic corridors map that included 16,257 corridors that connect 5,600 protected areas. Corridors covered 3.4 million square kilometers. Protected area boundaries data was pro-vided by the United Nations Environment Programme World Database on Protected Areas (protectedplanet.net). It is the largest assembly of data on the world’s terrestrial and marine-protected areas. ArcGIS easily executed the repetitive process of measuring corridor distance surfaces. Using its analysis tools, Jantz identified pairs of protected areas con-nected by corridors and then estimated the biomass content of both the corridors and the network of protected areas. The WHRC researchers mapped corridors in a variety of contexts including continuous forests (figure 2a), fragmented forests in biodiversity hot spots (figure 2b), and forests in areas with significant environ-mental gradients (figures 2c and 2d). The researchers used the Global Human Footprint dataset (WCS-CIESEN-Columbia University) to summarize and compare threat levels in corridors across the tropics. More detailed data was available for a regional analysis of Brazil’s Legal Amazon. The researchers demon-strated how biological and economic in-formation can be integrated to prioritize
Figure 1. Multicriteria scoring of corridors in the Brazilian Amazon across three dimensions: Biomass density, mammalian biodiversity, and deforestation threat. Biodiversity was measured as either (a) endemism richness or (b) species richness. Deforestation threat was represented as the fraction of corridor area projected to be deforested by the year 2030 under a business-as-usual (BAU) scenario.
continued on page 8
7Summer 2014 esri.com/environment
Case Study
corridors within a specific region relative to their carbon and biodiversity cobenefits. The researchers identified 721 corridors in the Legal Amazon and prioritized them to reveal a corridor network that yielded benefits for stabilizing climate and for wildlife conservation. To do this, they used a common multicriteria framework called the Technique for Order Preference by Similarity to Ideal Solution (TOPSIS).* The WHRC scientists used TOPSIS to incorporate various stakeholders’ objectives and to identify where desig-nated criteria fall in the ranking of these objectives. Criteria used for prioritizing corridors in the Legal Amazon included biomass density, mammalian species richness, end-emism richness, deforestation threat, and economic opportu-nity cost. Data from the International Union for Conservation of Nature and Natural Resources (IUCN) Red List was used for quantifying mammal biodiversity in corridors. Endemism analy-sis studies a specific species that thrives only in a specific area and nowhere else. Species with smaller ranges have greater
Lidar and GIS Used to Fight Climate Change and Preserve Tropical Forestscontinued from page 7
priority because of their unique contribution to biodiversity. Another important factor considered was the vulnerability of corridors to future deforestation. To determine deforestation threat, researchers used estimates of deforestation probability in the Legal Amazon from 2002 to 2030 for business-as-usual patterns of land use (Soares-Filho et al. 2006). Corridors with a higher fraction of projected forest loss were given higher prior-ity in the TOPSIS analysis. Combining biodiversity, biomass, and deforestation threat in the TOPSIS framework allowed the WHRC researchers to identify highly threatened corridors with high biodiversity and high biomass values. Dividing TOPSIS scores by economic opportunity cost scaled to units of US$10,000 per hectare-1 revealed priority corridors that could be conserved at lowest cost, helping to extend scarce conservation dollars. Economic opportunity cost is the dollar loss to local com-munities if they do not farm, log, or graze an area. This calcu-lation included values of soy, cattle, and timber rents over a
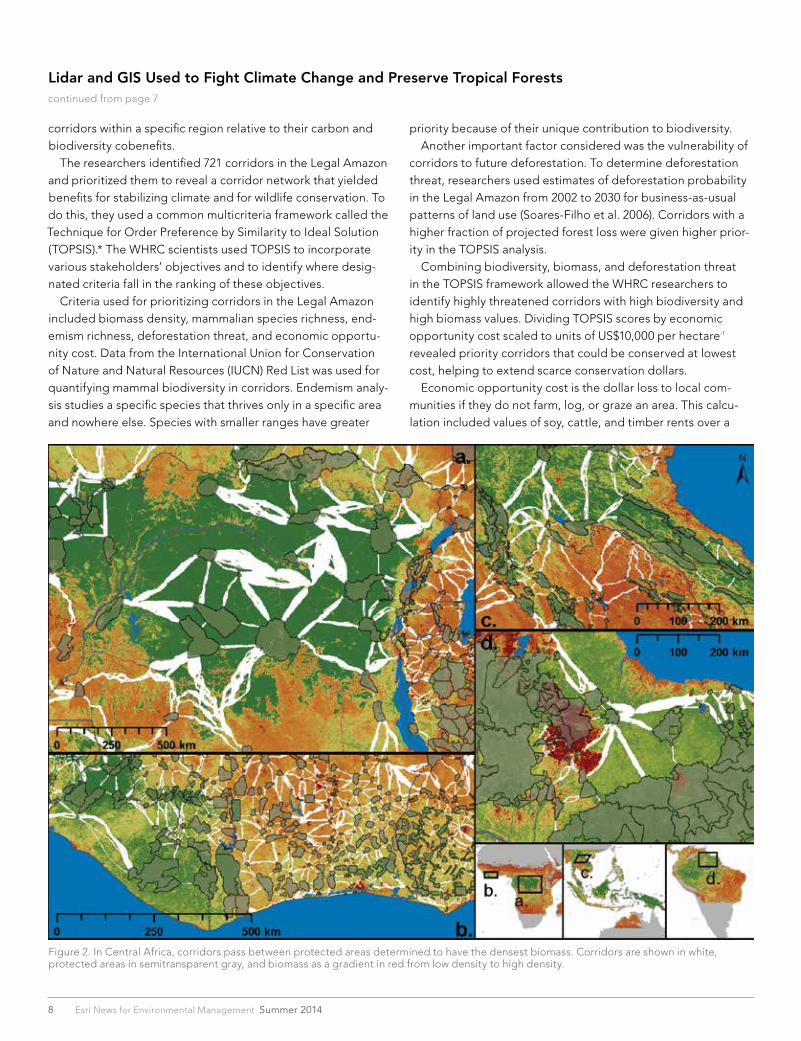
Figure 2. In Central Africa, corridors pass between protected areas determined to have the densest biomass. Corridors are shown in white, protected areas in semitransparent gray, and biomass as a gradient in red from low density to high density.
8 Esri News for Environmental Management Summer 2014

30-year time span and was adjusted by a 5 percent discount rate (Nepstad et al. 2009). Throughout this project, GIS proved invaluable for incorporating lidar data, satellite imagery, land use, biomass datasets, biodiversity information, deforestation risk indicators, economic costs, and statistical scoring methods. They were used to determine potential corridor areas that could efficiently promote biodiversity and climate change mitigation. Scientists, researchers, and others can access the biomass project dataset and maps on the WHRC website and the Esri ArcGIS Online platform. By combining these with other data-sets, they can study forest corridors that connect protected area ecosystems. They can also use wildlife conservation data to evaluate how corridors meet specific species’ needs and facilitate species migration. The carbon stock corridor data can be used within contexts of climate change mitigation and REDD+ cobenefits for conservation. Organizations can see on the maps where deforestation is impacting carbon emission, highlight hot spots of carbon emission, and point out locations needing intervention. This will help them allocate funding as well as find funding gaps. Experience the interactive biomass map at the Woods Hole Research Center website at http://whrc.org/mapping/pantropical /habitatcorridors/index.html. Learn about GIS and Esri at esri.com.
* In future studies, WHRC researchers are considering using the ArcGIS-TOPSIS tool. It aggregates the criterion layers and weights according to TOPSIS decision rules. The user inputs raster layers and runs the tool to display the analysis layer on a map. The user can either manually input weights or use the tool to calculate weights. As the user changes the weights, the tool recalculates the equation and instantly updates the map.
Jantz, P., S. Goetz, and N. Laporte, “Carbon stock corridors to mitigate climate change and promote biodiversity in the trop-ics,” Nature Climate Change 4, January 26, 2014, 138–42.
Nepstad, D. et al., “The end of deforestation in the Brazilian Amazon,” Science 326, 1350–51 (2009).
Soares-Filho, B. S. et al. “Modelling conservation in the Amazon basin,” Nature 440, 520–23 (2006).
Hazus User Conference
August 4–6, 2014Indianapolis, Indiana, USAhazusconference.com
National Wilderness Conference
October 15–19, 2014Albuquerque, New Mexico, USAwildernessalliance.org
Esri Health GIS Conference
November 3–5, 2014Colorado Springs, Colorado, USAesri.com/health
Esri Ocean GIS Forum
November 5–7, 2014Redlands, California, USAesri.com/oceans
UNFCCC COP 20
December 1–12, 2014Lima, Peruunfccc.int
Clean Gulf 2014
December 2–4, 2014San Antonio, Texas, USAcleangulf.org
On the Road
9Summer 2014 esri.com/environment
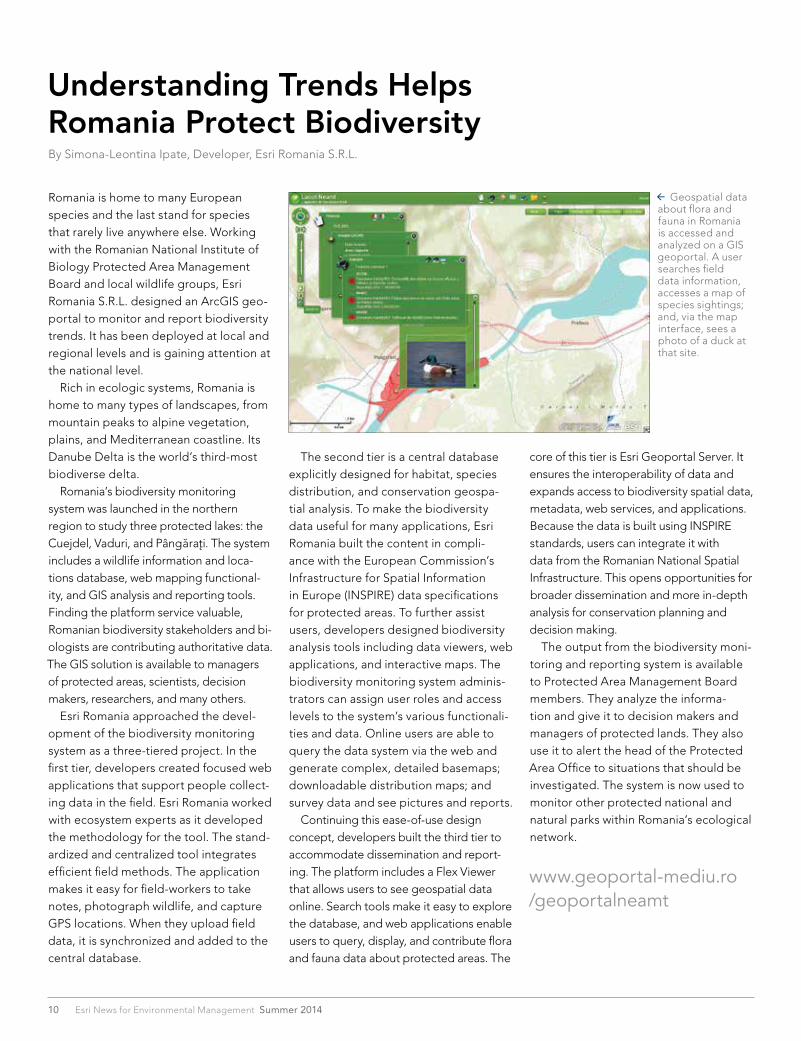
Romania is home to many European species and the last stand for species that rarely live anywhere else. Working with the Romanian National Institute of Biology Protected Area Management Board and local wildlife groups, Esri Romania S.R.L. designed an ArcGIS geo-portal to monitor and report biodiversity trends. It has been deployed at local and regional levels and is gaining attention at the national level. Rich in ecologic systems, Romania is home to many types of landscapes, from mountain peaks to alpine vegetation, plains, and Mediterranean coastline. Its Danube Delta is the world’s third-most biodiverse delta. Romania’s biodiversity monitoring system was launched in the northern region to study three protected lakes: the Cuejdel, Vaduri, and Pângarati. The system includes a wildlife information and loca-tions database, web mapping functional-ity, and GIS analysis and reporting tools. Finding the platform service valuable, Romanian biodiversity stakeholders and bi-ologists are contributing authoritative data. The GIS solution is available to managers of protected areas, scientists, decision makers, researchers, and many others. Esri Romania approached the devel-opment of the biodiversity monitoring system as a three-tiered project. In the first tier, developers created focused web applications that support people collect-ing data in the field. Esri Romania worked with ecosystem experts as it developed the methodology for the tool. The stand-ardized and centralized tool integrates efficient field methods. The application makes it easy for field-workers to take notes, photograph wildlife, and capture GPS locations. When they upload field data, it is synchronized and added to the central database.
Understanding Trends Helps Romania Protect BiodiversityBy Simona-Leontina Ipate, Developer, Esri Romania S.R.L.
The second tier is a central database explicitly designed for habitat, species distribution, and conservation geospa-tial analysis. To make the biodiversity data useful for many applications, Esri Romania built the content in compli-ance with the European Commission’s Infrastructure for Spatial Information in Europe (INSPIRE) data specifications for protected areas. To further assist users, developers designed biodiversity analysis tools including data viewers, web applications, and interactive maps. The biodiversity monitoring system adminis-trators can assign user roles and access levels to the system’s various functionali-ties and data. Online users are able to query the data system via the web and generate complex, detailed basemaps; downloadable distribution maps; and survey data and see pictures and reports. Continuing this ease-of-use design concept, developers built the third tier to accommodate dissemination and report-ing. The platform includes a Flex Viewer that allows users to see geospatial data online. Search tools make it easy to explore the database, and web applications enable users to query, display, and contribute flora and fauna data about protected areas. The
core of this tier is Esri Geoportal Server. It ensures the interoperability of data and expands access to biodiversity spatial data, metadata, web services, and applications. Because the data is built using INSPIRE standards, users can integrate it with data from the Romanian National Spatial Infrastructure. This opens opportunities for broader dissemination and more in-depth analysis for conservation planning and decision making. The output from the biodiversity moni-toring and reporting system is available to Protected Area Management Board members. They analyze the informa-tion and give it to decision makers and managers of protected lands. They also use it to alert the head of the Protected Area Office to situations that should be investigated. The system is now used to monitor other protected national and natural parks within Romania’s ecological network.
www.geoportal-mediu.ro /geoportalneamt
Geospatial data about flora and fauna in Romania is accessed and analyzed on a GIS geoportal. A user searches field data information, accesses a map of species sightings; and, via the map interface, sees a photo of a duck at that site.
10 Esri News for Environmental Management Summer 2014

11Summer 2014 esri.com/environment
The largest, longest-running animal census on the planet is the National Audubon Society’s annual Christmas Bird Count. Every winter, over 100,000 people join this famous citizen science project to compile and submit count data about local bird populations. For the first time, bird count data will be mapped with GIS and made available on an interactive website. GIS technology can be used to formulate effective, science-based policy and advance environmental progress. Therefore, Esri is helping Audubon by providing ArcGIS for Desktop and ArcGIS Online services. The offer extends to the entire Audubon network including geo-spatial data and map production abilities to Audubon’s 463 chapters, 44 education centers, and 22 US state offices. ArcGIS for Desktop users will perform sophisticated modeling and analysis. ArcGIS Online users can access a massive library of the latest authoritative data and scientific research about birds and other species. This data is hosted on the platform by government, academic, and wildlife protection organizations. The library includes years of data collected by Audubon scientists in the field. “Esri transformed the face—or rather, the map—of the conservation movement two years ago with its incredibly gener-ous donation worth of licenses, training, and desktop software to Audubon,” said Audubon president and CEO David Yarnold. “We couldn’t do what we do without Esri’s tools and support. From winning protection of 11 million acres in the National Petroleum Reserve-Alaska to bringing partners together to protect Pennsylvania’s Kittatinny Ridge, we rely on Esri’s tools to answer tough questions, democratize data, and create a culture of collaboration. And now, as we roll this technology out even more widely across the Audubon network, we know
Audubon ArcGIS Platform Drives Bird Habitat Policy
that conservation successes are going to increase significantly thanks to Esri’s partnership and generosity. Esri has been a dream partner.” All Audubon offices will soon easily sort through massive amounts of cloud-based data about bird and other spe-cies’ ranges, food sources, shifts in bird demographics, etc. Users will combine or overlay the information on top of spatial data such as habitat, water, geol-ogy, and landownership. They can then assess changes and study environmental impacts on bird populations at local, national, and even international levels. Audubon is embarking on a mission to democratize mapping—to provide geospatial data and map production abilities to members of Audubon’s network. Maps used in conservation and planning can tell interesting stories. By doing so, it will put mapmaking tools in the hands of community leaders in all 50 states, territories, and even Latin America, where many species of birds spend parts of their life cycle. Access to spatial data—on habitat, water, geol-ogy, landownership, and development permitting—will be combined with
Audubon’s own science infor-mation on bird ranges, food sources, and shifts in bird demograph-ics caused by current and pre-dicted climate change. When local citizens harness the power of geospatial data and make their own maps, they
will be able to influence local and state government decision making. This will help them to win conservation battles for birds and other animals and plants. For example, the Greater Sage-Grouse in Wyoming was about to be put on the Endangered Species List, setting off alarms for property owners and govern-ment officials. Once a species lands on that list, it’s virtually impossible to pick up a shovel without a permit from the federal government. The Wyoming governor brought together members of the energy industry; ranchers; federal and state agencies; and conservation groups, including Audubon, to develop a solution. Audubon mapped the habitat used by the grouse and found that protecting 23 percent of total habitat would preserve 83 percent of the birds. The Wyoming governor signed an executive order that resulted in 15 million acres of protection for the Greater Sage-Grouse. Using the same methodology across all 11 states where Greater Sage-Grouse are found, Audubon continues to work with partners to advance protection on nearly 57 million acres of bird habitat across the western United States.
The Greater Sage-Grouse. (Photo credit: Jeannie Stafford/USFWS/Flickr Creative Commons.)
Case Study

Presorted Standard
US Postage Paid Esri
380 New York Street Redlands, California 92373-8100 usa
142521 6/14sp
30-day free trial: esri.com/agol
Creating your own map from maps published by other users is just one of many ways to take
advantage of the rich collection of data and resources ArcGISSM Online makes available to you.
Welcome to the new frontier in geographic information systems.
ArcGIS Online
Maps made better.
Copyright © 2014 Esri. All rights reserved.
(Some assembly required.)
P_ArcGISOnline-Build_HH0812.indd 1 6/17/14 3:29 PM