Embed Size (px)
Citation preview
Modern Applied Science; Vol. 8, No. 4; 2014 ISSN 1913-1844 E-ISSN 1913-1852
Published by Canadian Center of Science and Education
50
GIS-Based Soil Erosion Modeling for Assessing Land Suitability in the Urban Watershed of Tallo River, South Sulawesi, Indonesia
Sumbangan Baja1, Nurmiaty2 & Samsu Arif3
1 Department of Soil Science, Faculty of Agriculture and Forestry Hasanuddin University, Makassar, Indonesia 2 Department of Estate Crops Cultivation, Pangkep State Polytechnic of Agriculture, Pangkep, Indonesia 3 Department of Geophysics, Faculty of Mathematics and Natural Sciences, Hasanuddin University, Indonesia
Correspondence: Sumbangan Baja, Department of Soil Science, Faculty of Agriculture and Forestry Hasanuddin University, Makassar, 90425, Indonesia. Tel: 62-812-426-2988. E-mail: [email protected]
Received: April 6, 2014 Accepted: April 22, 2014 Online Published: June 25, 2014
doi:10.5539/mas.v8n4p50 URL: http://dx.doi.org/10.5539/mas.v8n4p50
Abstract Urban watershed is a discrete and complex system where a diverse number of factors govern its quality and health. Soil erosion by water is the most dominant factor that determines a watershed quality, and considered as one of the most significant forms of land degradation that affects sustained productivity of land use. The principal aim of this paper is to utilise spatial-based soil erosion information to assess land suitability at a watershed level. The specific aim is three-fold: (i) to develop techniques based on a GIS in the parameterisation of a soil erosion model, which is designed for use at a large scale assessment; (ii) to assess and map the spatial distribution of average annual rate of soil losses in; (iii) to employ such related concept as soil loss tolerance to determine land suitability at a watershed level. An analytical procedure is used to analyse an urban watershed of Tallo River, in South Sulawesi, Indonesia, with a total area of 43,422 ha. The procedure is executed using RUSLE (Revised Universal Soil Loss Equation), in a GIS environment, utilising available information in the region (including climate, soil, slope, and land use and land conservation practices), and with the assistance of ground surveys. The results indicate that around 56.5% of the area experience annual soil loos of less than 1 ton/ha/year, while erosion rate of more than 25 ton/ha/year covers a total area of 8.9%. Due to a good ground cover in forested land, most of the slopping areas have actual soil losses of 1-5 ton/ha/year. This study reveals that areas categorized as high risk, where only forest cover allowed consist of 9.4%, and those with very low risk cover a total area of 5.4%. Most of the study region (around 84%) experience moderate and low erosion risk, and suitable for cropping with special management practices (CS) + perennial crops (PC) + grass (GR) + and forest (FR). This study suggests that the outputs of this modeling procedure can be used for the identification of land management units based on degradation levels, as well as the most suitable land use to be practiced on individual land units on a sustainable basis.
Keywords: land suitability, GIS, soil erosion, RUSLE, Tallo River Watershed
1. Introduction Urban watershed is a complex system where many different land use practices take place. The main subsystem of such system is land use type, which may occur naturally or by design through a careful planning. In essence, a long time practice of a particular land use type will give a different effect on, one to another, urban land degradation, especially erosion and sedimentation. As noted by Boyd et al. (1993) an urban area is basically made up of impervious, pervious, and semi-impervious surface. It can be categorised into three types: (i) impervious areas which are directly connected to the drainage system; (ii) additional impervious areas which are not directly connected, runoff from which flows over pervious surfaces before reaching the drainage system; (iii) the remainder, pervious or semi-pervious area consisting of lawns, gardens and parklands, forested land, agriculture area, etc. In a spatial context, the location of such land use and facilities will determine the rate of soil erosion and sedimentation (see von der Thannen et al., 2012).
Tallo River watershed is located within three administration regions: City of Makassar in the lower part, Maros Regency in the middle part, and Gowa Regency in the upper most section. Some parts of this region have recently subjected to flood (Nurmiaty & Baja, 2013, 2014), and to erosion and sedimentation. A very distinct

www.ccsenet.org/mas Modern Applied Science Vol. 8, No. 4; 2014
51
land use phenomenon can be found in this watershed area, where urban residential is located in the lower part and some swampy area around the mouth of the Tallo river, mixed agriculture in the middle part, and forested land in the upper watershed area. Recently, development tends to take place in the middle part, by converting agricultural land areas mainly for residential purposes. In this case land degradation thus becomes a crucial issue, especially when devising a sustainable land use scheme in the urban area.
In many land suitability evaluation guidelines, soil erosion is always considered in a general perspective, and is determined based only on a qualitative term (see for example Djaenuddin et al., 2003, FAO, 1976; CSR/FAO, 1983). While, soil erosion is complex phenomenon and is considered as one of the most significant forms of land degradation in the urban area (see da Silva et al., 2013), then a more precise soil loss value is crucial in devising an effective land suitability assessment. Important factors related to soil erosion by water include climate, soil, topography, and land use and types of land management (Gebel et al., 2014; Imamoglu et al., 2014; Jain et al., 2001; Kamaludin et al., 2013). Some of these may be manageable (mainly land use and soil), but others, such as climate and topography depend mainly on the natural phenomena. As most of these factors are dynamic, and changing in time and space, frequent updating of the rate and distribution of soil erosion is always required, particularly in the regions where intensive use of land exists. As mentioned earlier, as an urban watershed is a complex system where a number of factors govern its quality and health, a careful planning of the area is crucial to ensure that land degradation could be kept at a minimum level.
There are two approaches commonly in use in the estimation of soil erosion or soil loss. First is the assessment of soil erosion on the basis of a point or a single plot (see for example Kovar et al., 2011; Othman & Ismail, 2012; Peter et al., 2014), and second approach takes into account the geographical patterns of the area of interest (see for example Millick et al., 2014; Mutowo & Chikodzi, 2013; Parveen & Kumar, 2012). The limitation of first approach is the difficulty of understanding the erosion phenomena in terms of spatial patterns and relationships between units of the land under study, especially at the large area such as a watershed. Accordingly, in the planning perspective the second strategy is the preferred one, and remote sensing and GIS technologies play an important role as effective analytical tools (see Alexakis et al., 2012; Csafordi et al., 2012). This study employs the second approach in calculating soil loss and determining land suitability in the urban watershed.
In terms of modelling procedure, soil erosion modelling can be undertaken using deterministic (or physically-based), stochastic, or empirical approaches (see Alatorre et al., 2012). A physically-based model incorporates the laws of conservation of mass and energy using the continuity equation. Using this model it is thus possible to predict the spatial distribution of runoff, sediment movement, and hence soil loss over the land surface for individual storm occurrences. Examples of physically-based models are EUROSEM (Morgan et al., 1998) and WEPP (Laflen et al., 1991). Stochastic modelling is based on generating synthetic sequences of data employing statistical methods, and is also useful for generating input for physically-based and empirical models. In an empirical model, theoretically-based procedures are employed using the most significant parameters, e.g., Universal Soil Loss Equation (USLE) (Wischmeier & Smith, 1978) and its revision i.e., RUSLE (Revised USLE) (Renard et al., 1997) or its modifications and derivatives (see for instance Rosewell, 1993). In this study, the principles of RUSLE (see Agele et al., 2013; Kumar & Kushwaha, 2013; Prasannakumar et al., 2012) are employed to predict soil loss rate in the whole watershed area, and to assess land suitability for planning an effective land use in the watershed.
To ensure an effective decision on the development and management of the watershed, it requires better representation of spatial information on it, particularly that related to land degradation, and more specifically, soil erosion, land use, and the type of land management (Baja et al., 2002). The principal aim of this paper is to utilize spatial-based soil erosion information as land suitability parameter at a watershed level. The specific aim is three-fold: (i) to develop techniques based on a raster GIS in the parameterisation of a soil erosion model, which is designed for use at a watershed scale; (ii) to assess and map the spatial distribution of average annual rate of soil losses in the selected study area; (iii) to employ such related concept as soil loss tolerance and suitability analysis to regionalize suitable land use type in the watershed under study.
2. Materials and Methods 2.1 RUSLE Model
RUSLE parameters RUSLE is basically used to predict average annual soil losses due to sheet and rill erosion. Although sheet and rill processes are two different forms of erosion, they are usually considered together in the assessment procedure for soil losses. The main reason is that both types of erosion require similar farm management and conservation practices for controlling them (see Bellin et al., 2011). Such premise underlies the establishment of

www.ccsen
USLE (Wiequation a
where, A =factor (L =(support) f
Strengths As an empUSLE andinvolves adepositionspatialise establishmprinciples
On the othproceduresnot represeloss, and nsediment performanreason whdegradatio
2.2 Study AThe Tallo the capitalSulawesi IAgriculturForested larea is prooriginally around theassigned ablocks of considerab
Mean annumonths oc
net.org/mas
ischmeier & Sas follows:
= average annu= length, and factor.
and limitatiopirical model,
d thus RUSLE a large and comn takes place. Iin a GIS envi
ment of a numof RUSLE. It
her hand, RUSs. They includent the actual pnot for single deposition. In
nce and the achy the model on for land use
Area river watershel of South SuIsland. More tral productionand in the uppotected forest.from estuary
e coastal areasas recreation cresidential lan
ble urban/rural
ual rainfall recccurring from N
mith, 1978), a
ual soil loss (t/S = gradient)
ons of USLE USLE posses as follows: (i
mprehensive phIn addition, asironment. Its pmber of erosiois this, RUSLE
SLE has severade the followinphysical procestorm event; (n general, hoccuracy of ero
has to date bplanning and
ed covers an aulawesi Provinthan half of th
n from the waper watershed . Mangrove anecosystem. E
s. According torridor, which
nd exist mainlyl residential de
Figure 1.
corded in PanaNovember to M
Modern
and its revised
A = R/ha/y), R = ind), C = land co
sses some strei) it is simple thysical data bas each model pparameters areon prediction E appropriate
al limitations, wng (see Baja, 20esses of soil er(iii) it only estowever, most sion estimatesbeen employedmanagement a
area of approx.nce (see Figurhe watershed iatershed contiprovides habi
nd fish pondsEstuary vegetatthe Makassar h will escalate y along the m
evelopment has
Location of st
aikang Station March and the
n Applied Scienc
52
version, RUSL
R x K x LS dex of rain eroover and mana
engths and limto implement; ase; and (iv) itparameter conse also adaptab
technologies for use at a wa
which are ofte002): (i) the eqrosion; (ii) the timates sheet a
field practitios with USLE d for various at a watershed
. 43,400 ha anre 1). Its maiis agricultural inuously suppitat for numer
s can be foundtion, mainly nSpatial Planniutilization of
main roads, excs taken place.
tudy area (Tall
for the last 10driest from Ju
ce
LE (Renard et
x C x P osivity, K = indagement facto
mitations. Fost(ii) its parame
t can be appliesists of discret
ble to many diwhich incorp
atershed scale.
en viewed as pquation uses anequation is us
and rill erosiononers have b(Toy and Ostepurposes, esplevel.
nd includes mon river, Tallo land which p
plies some of rous plant specd around the mnipa sp can aling Scheme, t
f this river andcept in the mid
o river watersh
0 years is 2550uly to Septemb
t al., 1997) wit
dex of soil erodr, and P = con
ter (1982) noteeters are readi
ed to non-unifote variables, thifferent situatioporate all or
preconditions sn empirical apsed to predict an; and (iv) it teen satisfied erkamp, 1995)pecially as an
ost parts of theriver drains
provides rice af the Makassacies, and somemount of Talllso be found athe Tallo riverd its surroundinddle and lowe
hed)
0 mm in averagber. Considerab
Vol. 8, No. 4;
th the basic for
dibility, LS = snservation pra
ed the strengthily available; (orm areas whehe model is eaons, leading tosome parts o
set in the modepproach which average annuaakes no accouwith the mo
). This may bn indicator of
e City of Makainto west coa
and seasonal car’s fresh prode proportion olo river, whichalong the river has recently ng areas. Scat
er watershed w
ge, with the weble variation oc
2014
rm of
(1) slope actice
hs of iii) it re no
asy to o the f the
elling does
al soil unt of odel’s e the land
assar, ast of rops. duce.
of the h are
erside been
ttered where
ettest ccurs

www.ccsenet.org/mas Modern Applied Science Vol. 8, No. 4; 2014
53
in daily temperature. The complex nature of geology in the study region gives rise to various geomorphic and slope classes, as well as soil types. Slope class of 0 to 8% dominates the study area, covering about 73% in the middle and lower watershed. Soils were originally developed from five different orders: Alfisols, Inceptisols, Entisols, and Ultisols. Ultisol covers a total area of around 21.000 ha, or half of the study region.
2.3 Calculating Soil Loss from a GIS-Based Erosion Modeling Procedure
Soil loss estimation procedure in this study is performed using conventional GIS-based operations. Based on the RUSLE parameters in equation (1), GIS layers required for analysis include: (i) rainfall erosivity index ®, (ii) soil erodibility index (K), (iii) slope factors (LS), and (iv) cover and support practice factors (CP). It should be noted that each of these layers is derived from different sources, and scale and level of observation, as well as time of data acquisition. Therefore, resampling procedures provided in digital analysis packages are always required to make all data sets used conformable one to another (see Ai et al., 2013). In this study, the data sets are analysed and interchanged in two different GIS programs: raster and vector based. In addition, the data sets needed to be converted to the same format before performing overlay-based analyses.
Calculation of RUSLE parameters is made based on the available guidelines especially those recommended for tropical environment, including Rosewell (n.d) for rain erosivity, cover types, and conservation practices (see also Alatorre et al., 2012). LS factor is determined using the RUSLE guideline (Renards et al., 1998). With this guideline, LS factor values in this study is calculated using the GIS-based procedure developed by Baja (2002) (Figure 2), employing digital elevation model (DEM). Two layers are employed: slope gradient, s and slope length, Xh. To accommodate all forms of equation (see Figure 2), the grid cells of the slope layer are first subdivided into two layers: s < 9% and s > 9%. Both equations in Figure 2 are then applied to the respective slope layer before they are joined back to form a single s layer. In this map algebra analysis, the effect of rilling (B), and slope length exponent (m) are generated as separate layers from s in the calculation of slope length factor, L. The LS factor layer (Figure 2) is finally generated by overlaying/joining (with multiplicative function) both L and S layers.
Figure 2. Schematic procedure developed for calculating the LS-factor of RUSLE using a GIS
2.4 Land Suitability Analysis
Land suitability analysis at a watershed level can be undertaken using many different techniques (see Baja et al., 2001; Elhag, 2014; Feiziza & Blaschke, 2013). In this study, suitability analysis is performed based on the
Digital elevationmodel (DEM)
Slope aspect(continuous)
Slope gradient,s(continuous)
Aggregate/reclass
Slope aspect(8 classes)
Slope length, Xh Slope lengthexponent, m
(Xh/22.13)m
Slope lengthfactor, L
Overlay/multiply
Slope gradientfactor, S
LS factor
s > 9%(continuous)
Aggregate/reclass
s < 9%(continuous)
(Sin s/0.0896)(3.0 (Sin s) + 0.56)0.8
10.8 (Sin s) + 0.03 16.8 (Sin s) - 0.5
S factor fors > 9%
S factor fors < 9%
Overlay/join
Rill-to-interrillratio (B)
B/(1 + B)

www.ccsenet.org/mas Modern Applied Science Vol. 8, No. 4; 2014
54
premise to keep the average annual soil loss (A) to a certain level below the tolerance value (T-value). It is thus necessary to examine the relationship between land management factors (i.e., C and P) and the factor combination RKLS, with reference to a specified T-value. Such a relationship can be expressed as follows:
CPmax = T/RKLS (2) where CPmax is the maximum allowable CP factor value, T denotes T-value, and RKLS represents an index of potential erosion.
A T-value or soil loss tolerance has been defined as ‘the maximum rate of soil erosion that permits an optimum level of crop productivity to be sustained economically and indefinitely’ (ISSS, 1996). It is also sometimes called permissible soil loss (Kok et al., 1995) which is related to the average annual soil loss a given soil type may experience and still maintain its productivity over an extended period of time. In many situations, the establishment of T-value is intended to provide the basic information for the maintenance of soil productivity, which becomes one of the focuses of sustainability of agricultural land use (Smith & McDonald, 1998). For agricultural areas, the maximum tolerable rate of soil loss (or erosion tolerance, T-value) is varied, ranging from 1 to 10 t/ha/year (DLWC, 1997) or to 11.2 t/ha/year (USDA Soil Conservation Service, 1973). With available technology a rate of 2 to 4 times T-value may also be considered, however (Kraft & Toohill 1984). In this study, T-value is determined using the principles described in DLWC (1997), and this has been widely used in Indonesian environments.
The ratio T/RKLS in equation (2) can be used as a threshold value in deciding what types of land use and land management practices are most suitable on a given land unit, in order to maintain soil loss under the level of a given constraint. While R, K, and L factors are considered as constants, it is thus possible to classify the land area into different level of risks according to a pre-defined cover types and T-values.
To examine ‘which area is suitable for what land use’ based on Equation (2), it is necessary to establish conditions and assumptions:
Land use/land cover types which are generally found in the study region, are employed as land 54tilization types (LUTs) in the modeling procedure: forest (FR), shrubs (SH), grass (GR), cropping with special management practices (CM), conventional cropping (CC), and residential (RS).
The C values of land use/land cover types as recommended Graham (1989) are used as the basis for classifying the CPmax in Equation (2).
It is assumed that no additional soil conservation practices are adopted, so that P factor is set to 1.
Both data layers for T-value and RKLS are overlaid with a ‘divide’ function to produce a CPmax layer that signifies the maximum allowable index of C factor across the watershed, using the principles detailed in Baja (2002). The values of CPmax in Table 1 are used to determine the threshold level of risk.
Table 1. Values of CPmax and their corresponding suitable land use/land cover types
Category Value of CPmax The ‘only’ suitable land use type* 1: very high risk < 0.0041 Forest (FR) 2: high risk 0.0041 – 0.0050 Grass (GR)+FR 3: moderate risk 0.0051 – 0.0670 Perennial crops (PC)+GR+FR 4: low risk 0.0671 – 0.1500 Cropping with special management practices
(CS)** +PC+GR+FR 5: very low risk > 0.1500 Residential (RS)+ conventional cropping
(CC)+CS+PC+GR+FR *‘+’ denotes ‘and/or’; ** land cultivation that adopts some erosion control practices, or CP factor should be kept below 0.15.
3. Results and Discussion 3.1 Soil Loss Rate
Spatial distribution of soil loss information in GIS is given in continuous scale or on a cell-by-cell basis, but for

www.ccsen
display puactual eromaximum respectivel
Figure 3 frequency occupies 5(Table 2). t/ha/y. Thierosion ratand drylanRegulation30% from 70 fold insection of
Table 2. A
net.org/mas
urposes the estision rates is acceptable s
ly.
shows that vadistribution o
56.5% of the It is interestin
is is mainly dute occurs mostnd agriculture)n (Law No. 26the total area.
ncrease in soil the study area
Figu
Areal distributio
Cate1: <2: 13: 54: 105: >Tota
imated rates ofbased on that
soil loss (or e
arying levels f data cells, soarea, followed
ng to note fromue to the presetly on the area) occupies a to 2007), where Loch (2000) losses. Such
a.
ure 3. Spatial d
on of average a
egory : Soil los< 1 ton/ha/year .0 - 5.0 ton.0 – 10.0 ton/h0.0 - 25.0 ton
> 25.0 ton/ha/yeal Area
Modern
f annual soil lot suggested inerosion tolera
of potential eoil loss in the sd by class 2 (2
m Figure 3 thatence of dense fas with poor lanotal area of 32
the proportionfound that decexamples indi
distribution of
annual soil los
ss
n/ha/year ha/year n/ha/year ear
n Applied Scienc
55
osses are aggren Graham (19ance) for soil
erosion occur study area give26.5%), class t most of the sforest cover innd cover. As s
2%, and this stn of green areacreasing vegetaicate the impo
average annua
ss in the study
Area (ha) 24,548 11,486 2,291 1,254 3,843 43,422
ce
egated into 5 c989), where cls with shallo
in the study es the followin3 (5.3%), clalopping areas
n that part of tseen in Figure till complies wa for urban regation cover fro
ortance of main
al soil loss in th
area
Perce56.526.55.3 2.9 8.9 100.0
classes (Figurelasses 1, 2, anow, moderate,
area. Based ong figures: claass 4 (2.9%), ahave the actua
the study regio4, vegetated la
with Indonesiagion should be om 47% to 0%ntaining good
he study area
ntage (%)
0
Vol. 8, No. 4;
e 3). Subdivisiond 3 represen
and deep so
on the analysass 1 (< 1 t/ha/and class 5 (8al soil losses oon (Figure 4). and (forest, sh’s Spatial Planmaintained at
% resulted in a d land cover in
2014
on of nt the olum,
is of year)
8.9%) of 1-5 High
hrubs, nning least 60 to
n that

www.ccsen
Figure
3.2 Land S
Spatial dispresented maintain sessence sualso Table land areas suitable foand low rmanagemearea shoul
Two sets ouse and lanneed to beguideline olevel.
Figure 5
net.org/mas
e 4. Distributio
Suitability
stribution of lain Figure 5. E
soil loss belowuitable for the
1), to keep sowith a very h
or forest cover risk) compriseent practices dud be kept unde
of spatial infornd manageme
e properly manof what land u
. Distribution o
0
5000
10000
15000
20000
25000
n of land use tderi
and parcels shEach level of w a specified entire area, bu
oil losses belowigh risk categotype. Likewis
e about 22,99ue to their relaer 0.15 in order
rmation: erosiont, in every un
naged at the pruse practice or
of CPmax unit
Forest
Modern
the study area ived from Land
owing differenf risk assigns
tolerable leveut this land covw a tolerable leory comprise ase, land parcels96 ha or 53%atively higher vr to control ex
on rates (actuanit of land in tresent time to r
cover type su
ts in the study l
Shrubs DAgr
n Applied Scienc
56
(in ha) (data bdsat ETM+ im
nt levels of risthe most suitael. The legendver should certevel. Based onabout 4,068 has that are suita
% of the studyvalue of CPmax
cessive soil lo
al) and suitabilthe study area.reduce actual s
uitable in differ
area (refer Tabland use)
rylandriculture
Paddy
ce
based on calculmagery, 2013)
sk from soil loable types of d indicates thatainly exist in
n the analysis oa or 9.4% of thable for resideny area, but mx. As indicatedsses.
lity layer provi Erosion rate gsoil loss, whilerent zone to m
ble 3 for expla
y field Fish pon
lation of area o
osses in relatioland use/landat dense foresthe area with
of frequency dhe study regionntial and cropp
most of these ad in Table 3, th
ide the basis fgives an insighe suitability in
maintain erosion
anation on cate
nds Residentia
Vol. 8, No. 4;
of land use typ
on to the T-vald cover in ordst cover type very high risk
distribution of n. This area isping (i.e., veryareas need sp
he CP factor of
for appropriateht into which formation provn below a tole
egory and suita
al
2014
e
lue is der to
is in k (see cells, only
y low pecial f such
land areas vides rable
able
www.ccsenet.org/mas Modern Applied Science Vol. 8, No. 4; 2014
57
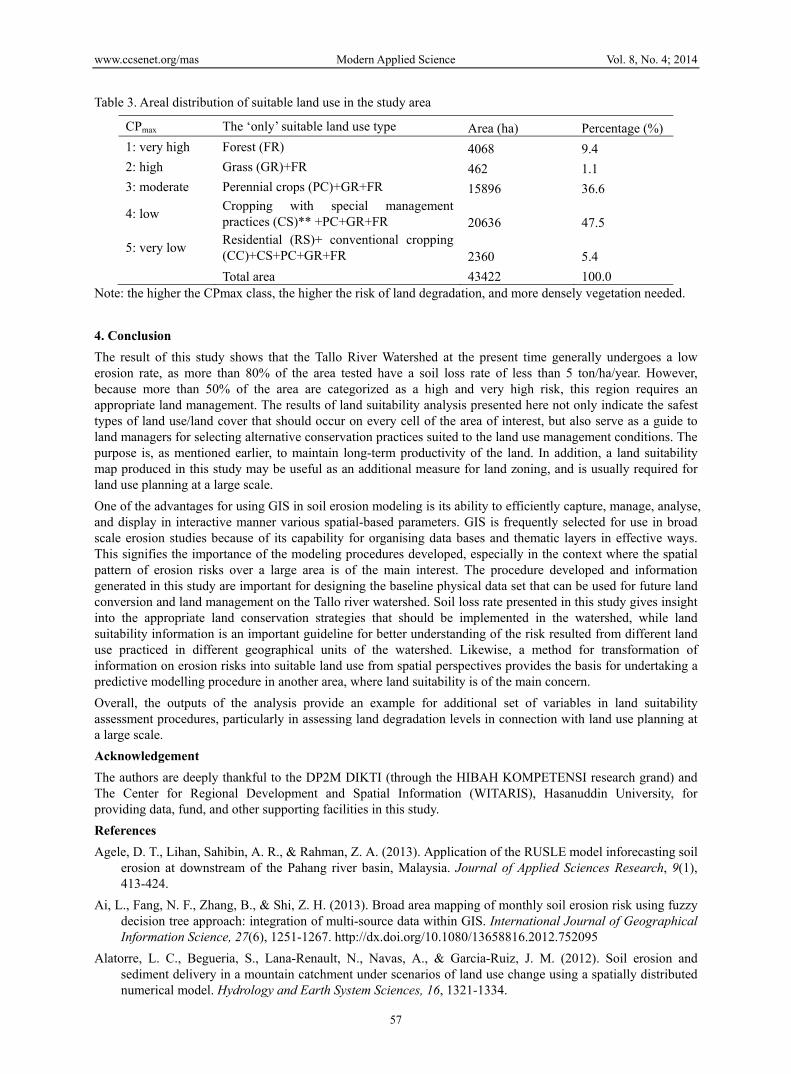
Table 3. Areal distribution of suitable land use in the study area
CPmax The ‘only’ suitable land use type Area (ha) Percentage (%)
1: very high Forest (FR) 4068 9.4 2: high Grass (GR)+FR 462 1.1 3: moderate Perennial crops (PC)+GR+FR 15896 36.6
4: low Cropping with special management practices (CS)** +PC+GR+FR 20636 47.5
5: very low Residential (RS)+ conventional cropping (CC)+CS+PC+GR+FR 2360 5.4
Total area 43422 100.0 Note: the higher the CPmax class, the higher the risk of land degradation, and more densely vegetation needed.
4. Conclusion The result of this study shows that the Tallo River Watershed at the present time generally undergoes a low erosion rate, as more than 80% of the area tested have a soil loss rate of less than 5 ton/ha/year. However, because more than 50% of the area are categorized as a high and very high risk, this region requires an appropriate land management. The results of land suitability analysis presented here not only indicate the safest types of land use/land cover that should occur on every cell of the area of interest, but also serve as a guide to land managers for selecting alternative conservation practices suited to the land use management conditions. The purpose is, as mentioned earlier, to maintain long-term productivity of the land. In addition, a land suitability map produced in this study may be useful as an additional measure for land zoning, and is usually required for land use planning at a large scale.
One of the advantages for using GIS in soil erosion modeling is its ability to efficiently capture, manage, analyse, and display in interactive manner various spatial-based parameters. GIS is frequently selected for use in broad scale erosion studies because of its capability for organising data bases and thematic layers in effective ways. This signifies the importance of the modeling procedures developed, especially in the context where the spatial pattern of erosion risks over a large area is of the main interest. The procedure developed and information generated in this study are important for designing the baseline physical data set that can be used for future land conversion and land management on the Tallo river watershed. Soil loss rate presented in this study gives insight into the appropriate land conservation strategies that should be implemented in the watershed, while land suitability information is an important guideline for better understanding of the risk resulted from different land use practiced in different geographical units of the watershed. Likewise, a method for transformation of information on erosion risks into suitable land use from spatial perspectives provides the basis for undertaking a predictive modelling procedure in another area, where land suitability is of the main concern.
Overall, the outputs of the analysis provide an example for additional set of variables in land suitability assessment procedures, particularly in assessing land degradation levels in connection with land use planning at a large scale.
Acknowledgement The authors are deeply thankful to the DP2M DIKTI (through the HIBAH KOMPETENSI research grand) and The Center for Regional Development and Spatial Information (WITARIS), Hasanuddin University, for providing data, fund, and other supporting facilities in this study.
References Agele, D. T., Lihan, Sahibin, A. R., & Rahman, Z. A. (2013). Application of the RUSLE model inforecasting soil
erosion at downstream of the Pahang river basin, Malaysia. Journal of Applied Sciences Research, 9(1), 413-424.
Ai, L., Fang, N. F., Zhang, B., & Shi, Z. H. (2013). Broad area mapping of monthly soil erosion risk using fuzzy decision tree approach: integration of multi-source data within GIS. International Journal of Geographical Information Science, 27(6), 1251-1267. http://dx.doi.org/10.1080/13658816.2012.752095
Alatorre, L. C., Begueria, S., Lana-Renault, N., Navas, A., & Garcia-Ruiz, J. M. (2012). Soil erosion and sediment delivery in a mountain catchment under scenarios of land use change using a spatially distributed numerical model. Hydrology and Earth System Sciences, 16, 1321-1334.

www.ccsenet.org/mas Modern Applied Science Vol. 8, No. 4; 2014
58
Alexakis, D. D., Hadjimitsis, D. G., Agapiou, A., Themistokleous, K., & Papoutsa, C. (2012). Assessing soil erosion rate in a catchment area in Cyprus using remote sensing and GIS. Advances in Geosciences, 187-194. http://dx.doi.org/10.5194/hess-16-1321-2012
Arsyad, S. (1989). Konservasi Tanah. Jurusan Tanah Fakultas Pertanian, IPB, Bogor.
Baja, S. (2002). Spatially-Integrated Models for Land Resource Assessment: An Application of Geographical Information Systems within Rural Land Use Perspectives. PhD Dissertation. The University of Sydney, Sydney. http://dx.doi.org/10.1080/10106040208542240
Baja, S., Chapman, D. M., & Dragovich, D. (2001). A conceptual model for assessing agricultural land suitability at a catchment level using a continuous approach in GIS. Pages 828-841. Proceedings of the Geospatial Information and Agriculture Conference, 17-19 July 2001, Sydney. NSW Department of Agriculture, Sydney.
Baja, S., Chapman, D. M., & Dragovich, D. (2002). Using GIS and remote sensing for assessing and mapping the present status of land use and land qualities in the lower Hawkesbury-Nepean Catchment, Australia. Geocarto International, 17, 15-24.
Bellin, N., Vanacker, V., B. van Wesemael, Solé-Benet, A., & Bakker, M. M. (2011). Natural and anthropogenic controls on soil erosion in the Internal Betic Cordillera (southeast Spain). Catena, 87, 190-200. Retrieved from www.elsevier.com/locate/catena. http://dx.doi.org/10.1016/j.catena.2011.05.022
Bols, P. L. (1978). The Isoerodent Map of Java and Madura. ATA 105. Lembaga Penelitian Tanah, Bogor.
Csáfordi, P., Pődör, A., Bug, J., & Gribovski, Z. (2012). Soil Erosion Analysis in a Small Forested Catchment Supported by ArcGIS Model Builder. Acta Silv. Lign. Hung., 8, 39-55. http://dx.doi.org/10.2478/v10303-012-0004-5
Da Silva R, M., G. Santos CA., C. de Lima Silva V., & P. e Silva L. (2013). Erosivity, surface runoff, and soil erosion estimation using GIS-coupled runoff-erosion model in the Mamuaba catchment, Brazil. Environ. Monit. Assess., 185(11), 8977-8990. http://dx.doi.org/10.1007/s10661-013-3228-x
de la Rosa, D., Mayol, F., Moreno, J. A., Bonson, T., & Lozano, S. (1999). An expert system/neural network model (ImpelERO) for evaluating agricultural soil erosion in Andalucia region, South Spain. Agriculture, Ecosystems and Environment, 73, 211-226. http://dx.doi.org/10.1016/S0167-8809(99)00050-X
DLWC. (1997). Soil and Landscape Issues in Environmental Impact Assessment. Technical Report No. 34, Department of Land and Water Conservation, New South Wales, Sydney, 68.
Elhag, M. (2014). Remotely Sensed Vegetation Indices and Spatial Decision Support System for Better Water Consumption Regime in Nile Delta. A case Study for Rice Cultivation Suitability Map. Life Science Journal, 1(1), 201-209.
Feizizadeh, B., & T. Blaschke. (2013). Land suitability analysis for Tabriz County, Iran: A multi-criteria evaluation approach using GIS. Journal of Environmental Planning and Management, 56(1), 1-23. http://dx.doi.org/10.1080/09640568.2011.646964.
Foster, G. R. (1982). Modelling the erosion process. In C. T. Haan, H. P. Johnson, & D. L. Brakensiek (Eds.), Hydrologic Modeling of Small Watersheds (pp. 297-380). American Society of Agricultural Engineers Monograph No. 5, St Joseph.
Gebel, M., Uhlig, M., Halbfass, S., Meissner, R., & Duan, S. (2014). Predicting erosion and sediment yield in a mesoscale basin in the semiarid monsoon region Miyun/China. Ecological Processes, 3(5). http://dx.doi.org/10.1186/2192-1709-3-5
Graham, O. P. (1989). Land Degradation Survey of NSW 1987-1988: Methodology. NSW Soil Conservation Service Technical Report No. 7, Sydney, 33.
Imamoglu, A., Turan, I. D., Dengiz, O., & Saygin, F. (2014). Soil Erosion Risk Evaluation: Application of Corine Methodology at Engiz Watershed, Samsun. Current Advances in Environmental Science (CAES), 2(1), 15-21.
ISSS (International Soil Science Society). (1996). Terminology for Soil Erosion and Conservation. Grafisch Service Centrum, Wageningen, 221.
Jain, S. K., Kumar, S., & Varghese, J. (2001). Estimation of soil erosion for a Himalayan Watershed using GIS technique. Water Resources Management, 15, 41–54. http://dx.doi.org/10.1023/A:1012246029263
www.ccsenet.org/mas Modern Applied Science Vol. 8, No. 4; 2014
59
Kamaludin, H., Lihan, T., Ali Rahman, Z., Mustapha, M. A., Idris, W. M. R., & Rahim, S. A. (2013). Integration of remote sensing, RUSLE and GIS to model potential soil loss and sediment yield (SY). Hydrology and Earth System Sciences, 10, 4567–4596. http://dx.doi.org/10.5194/hessd-10-4567-2013
Kok, K., Clavaux, M. B. W., Heerebout, W. M., & Bronveld, K. (1985). Land degradation and land cover change detection using low-resolution satellite images and the CORINE data base: A case study in Spain. ITC Journal, 3, 217-227.
Kovář, P., Vaššová, D., & Hrabalíková, M. (2011). Mitigation of surface runoff and erosion impacts on catchment by Stone Hedgerows. Soil & Water Res., 6(4), 5-16.
Kraft, S. E., & Toohill, T. E. (1984). Soil degradation and land use change: a representative farm analysis. Journal of Soil and Water Conservation, 39, 334-338.
Kumar, S., & Kushwaha, S. P. S. (2013). Modelling soil erosion risk based on RUSLE-3D using GIS in a Shivalik sub-watershed. Journal of Earth System Science, 122(2), 389-398. http://dx.doi.org/10.1007/s12040-013-0276-0
Mallick, J., Alashker, Y., Mohammad, S. A., Ahmed, M., & Hasan, M. A. (2014). Risk assessment of soil erosion in semi-arid mountainous watershed in Saudi Arabia by RUSLE model coupled with remote sensing and GIS. Geocarto International. http://dx.doi.org/10.1080/10106049.2013.868044
Morgan, R. P. C., Quinton, J. N., Smith, R. E., Govers, G., Poesen, J.W. A., Auerswald, K., … Styczen, M. E. (1998). The European Soil Erosion Model (EUROSEM): A dynamic approach for predicting sediment transport from fields and small catchments. Earth Surface Process, 23, 527-544. http://dx.doi.org/10.1002/(SICI)1096-9837(199806)23:6<527::AID-ESP868>3.0.CO;2-5
Nurmiaty, & Baja, S. (2013). Spatial Based Assessment of Land Suitability and Availability for Maize (Zea mays L.) Development in Maros Region, South Sulawesi, Indonesia. Open Journal of Soil Science, 3, 244-251. http://dx.doi.org/10.4236/ojss.2013.35029
Nurmiaty, U., & Baja, S. (2014). Using Fuzzy Set Approaches in a Raster GIS for Land Suitability Assessment at a Regional Scale: Case Study in Maros Region, Indonesia. Modern Applied Science (Accepted in press). http://dx.doi.org/10.5539/mas.v8n3p115
Othman, Z., & Ismail, W. R. (2012). Using environmental radionuclide, 137Cs to investigate soil re–distribution in an agricultural plot in Kalumpang, Selangor, Malaysia. Kajian Malaysia, 30(2), 45–70.
Parveen, R., & Kumar, U. (2012). Integrated approach of Universal Soil Loss Equation (USLE) and Geographical Information System (GIS) for soil loss risk assessment in Upper South Koel Basin, Jharkhand. Journal of Geographic Information System, 4, 588-596. http://dx.doi.org/10.4236/jgis.2012.46061
Peter, K. D., d'Oleire-Oltmanns, S., Ries, J., Marzolff, I., & Hssaine, A. A. (2014). Soil erosion in gully catchments affected by land-levelling measures in the Souss Basin, Morocco, analysed by rainfall simulation and UAV remote sensing data. Catena, 113, 24-40. Retrieved from www.elsevier.com/locate/catena. http://dx.doi.org/10.1016/j.catena.2013.09.004
Prasannakumar, V., Vijith, H., Abinod, S., & Geetha, N. (2012). Estimation of soil erosion risk within a small mountainous sub-watershed in Kerala, India, using Revised Universal Soil Loss Equation (RUSLE) and geo-information technology. Geoscience Frontiers, 3(2), 209-215. Retrieved from www.elsevier.com/locate/gsf. http://dx.doi.org/10.1016/j.gsf.2011.11.003
Renard, K. G., Foster, G. R., Weesies, G. A., McCool, D. K., & Yoder, D. C. (1997). Predicting Soil Erosion by Water: A guide to Conservation Planning with the Revised Universal Soil Loss Equation (RUSLE). USDA Agriculture Handbook No 703, Washington D.C.
Rosewell, C. J. (1993). SOILOSS: A Program to Assist in the Selection of Management Practices to Reduce Erosion. (SOILOSS Handbook, 2nd ed.). NSW Soil Conservation Service Technical Handbook No 11. NSW Soil Conservation Service, Sydney.
Smith, C. S., & McDonald, G. T. (1998). Assessing the sustainability of agriculture at the planning stage. Journal of Environmental Management , 52, 15-37. http://dx.doi.org/10.1006/jema.1997.0162
Toy, T. J., & Osterkamp, W. R. (1995). The applicability of RUSLE to geomorphic studies. Journal of Soil and Water Conservation, 50, 498-503.
USDA Soil Conservation Service. (1973). Advisory Notice. Soils-6. Washington DC, 21.

www.ccsenet.org/mas Modern Applied Science Vol. 8, No. 4; 2014
60
Von Der Thannen, M., Weissteiner, C., Rauch, H. P., Tilch, N., & Kohl, B. (2012). The influence of vegetation on processes of shallow soil erosion in subalpine catchment areas in Western Austria. Geophysical Research Abstracts, 14, EGU2012-10799-1.
Wischmeier, W. H., & Smith, D. D. (1978). Predicting Rainfall Erosion Losses: A Guide to Conservation Planning. USDA Agriculture Handbook No 537. U.S. Department of Agriculture, Washington D.C.
Copyrights Copyright for this article is retained by the author(s), with first publication rights granted to the journal.
This is an open-access article distributed under the terms and conditions of the Creative Commons Attribution license (http://creativecommons.org/licenses/by/3.0/).