Embed Size (px)
Citation preview
VNU Journal of Science, Earth Sciences 27 (2011) 199-207
199
Application of N-SPECT model and GIS for
Soil erosion assessment in Sapa district, Lao Cai province
Nguyen Hieu*, Dang Kinh Bac, Dang Van Bao
Faculty of Geography, VNU University of Science, 334 Nguyen Trai, Hanoi, Vietnam
Received 9 September 2011; received in revised form 10 October 2011
Abstract. Sapa is a mountainous district in the western of Lao Cai province. Most of the area is
mountainous terrain with steep slopes, annual precipitation of 1500 mm, plus the pressure of
development activities to landforms, especially the farming operations on slope land leveling and
infrastructure development, increasing the risk that the occurrence of natural disasters in this
growing, including soil erosion.
The erosion of longstanding research in general and a number of studies on the Sa Pa area is
largely based on the universal soil loss model of Wischmeier and Schmid (USLE) to calculate the
amount of land is separated from the rib, which not only place / space of the distribution of
material erosion and soil loss is real - the flow was sent. To address these limitations, the paper
used N-SPECT model combined with GIS technology to assess risk of soil erosion along the
stream basin system of Sa Pa. Evaluation results show that soil erosion in Sapa concentrated along
the Dum, Bo Rivers. Volume erosion can be up to over 1.5 t / (ha.year), concentrated in areas with
slopes greater length and poor vegetation cover, as areas in the west of San Sa Ho, Lao Chai, Su
Pan, the area in the south of Ban Ho commune.
Keywords: Soil erosion, GIS, N-Spect, Sa Pa.
1. Introduction∗∗∗∗
Sapa is a mountainous district in the
western of Lao Cai province, with 68,329.09 ha
of natural forest area, equivalent to 10.70% of
the province natural area. Most of the area is
mountainous terrain with the slope which is
more than 250, thick weathered crust,
topography which has been cleaved strongly,
was influenced of many faults was developed
from the northwestern to the southeastern.
_______ ∗
Corresponding author. Tel.: 84-986138289.
E-mail: [email protected]
Average annual rainfall in Sapa is very high,
average about 1500 mm per year, to over
3500mm rainfall in some years. Sapa’s natural
conditions create comfortable conditions for the
development of soil erosion issue. In addition,
Sapa is one of the famous eco-tourism places
with the rapid development in recent times. The
demands of agricultural and cultivated activities
on the high slope areas have been increased,
many new roads are opened or expanded, and
recently series of hydroelectric plants to be
deployed in this district, etc... This makes more
opportunities for the risk of soil erosion
becomes more serious.
N. Hieu et al. / VNU Journal of Science, Earth Sciences 27 (2011) 199-207
200
The erosion research in general and some
studies on the Sapa area mostly made paintings
which have been had general qualities about the
possibility of soil erosion. The results of those
assessments are based largely on the Universal
Soil Loss Equation of Wischmeier and Schmid
(USLE), calculated the amount of soil is
separated from the mountain-side, which did
not indicate or specializer the distribution of
soil eroded materials and did not calculate the
actually amount of soil lost - was flowed to
streams. In order to solve these limitations, this
report used N-SPECT model combined with
GIS technology to assess risk of soil erosion,
along the drainage basin system in Sa Pa which
is the basis for the prevention and minimize
damage from natural disasters in this district.
Research results are important scientific basis
for planning, using of natural resources,
protecting the local environment, particularly in
the context of the complex climate change.
2. Materials and Evaluation Model
2.1. Materials
The used data for research include: Terrain
data from the cadastral base map in 1:25,000
scale which was published from Department of
Survey and Mapping Vietnam, was built by
geodetic methods with airline documentation
which had taken in 1999, data have a very high
detail with basic contours are 20 m, the
coordinate system is WGS84, zone 48; Land
cover data was extracted and referenced from
land use map in 2007, aerial photographs
document, LANDSAT 7 ETM satellite image
was taken in 20/09/2007, resolution 30m;
Rainfall data of many stations in the district and
many stations surrounding Sapa was collected
by the Department of Meteorology, Hydrology
and Oceanography, Hanoi University of Sciences.
Rainfall data collected during the period from
1990 to 2006; Soil data from soil maps scale 1:
50,000, were established from the Ministry of
Natural Resources - Environment in 2005.
2.2. Evaluation model
N-SPECT model and GIS was used to
assess the risk of soil erosion in study area. N-
SPECT model is developed based on Universal
Soil Loss Equation of Wischmeier and Schmid
(USLE) and is integrated into the GIS software
- ArcGIS - which is based programming
language Visual Basic and ArcObjects (the
library tools in ArcGIS). The input data is the
main factor which control the soil erosion
process as the elements of weather, climate, the
basic properties of soil (such as floor thickness,
permeability or components of particle...), the
morphological characteristics and the land
cover as well as management processes, land
use of human. The special features of the N-
SPECT model is allow calculating the flow on
the surface by the rainfall precipitation curve
method (curve number) - the method has been
Natural and Resources Conservation Service
(NRCS) under the US. Department of
Agriculture (USDA) (USA) have been
developed to predict directly flow from the
beyond the limits of the rain (USDA, 1986).
This method is extended to predict the flow on
the surface from event storms, as well as
average annual rainfall. The number of rainfall
curve (also known as curve number, CN) is a
parameter related to the kind of soil and the
kind of land cover in the area.
N-SPECT is a complex tool, have been built
for the resource & environment management,
which is particularly effective for assessment of
soil erosion in drainage basin, streams with the
main function :

N. Hieu et al. / VNU Journal of Science, Earth Sciences 27 (2011) 199-207 201
- To estimate surface flow, accumulation
sediment
- Estimated amount of soil washed away
through erosion and sediment accumulation
rates, was calculated by the Revised Universal
Soil Loss Equation (Revised USLE) and
Modified Universal Soil Loss Equation
(Modified USLE).
- Identify the sensitive areas to soil erosion
by water
- Impact assessment of land use change
with the different scenarios.
In order to apply the calculation model to
soil erosion in Sapa, outside the standardized
parameters, the input data are important locally
which are necessary to build and estimates
include:
- Building DEM to calculate the slope
length (LS) and evaluate rainfall factor (R)
- Land covers data (raster format)
- Rainfall data (raster format)
- Soil data (shapefile format)
- Rainfall factor (R) of the local (raster): is
established from the relationship between
rainfall and topographic factors.
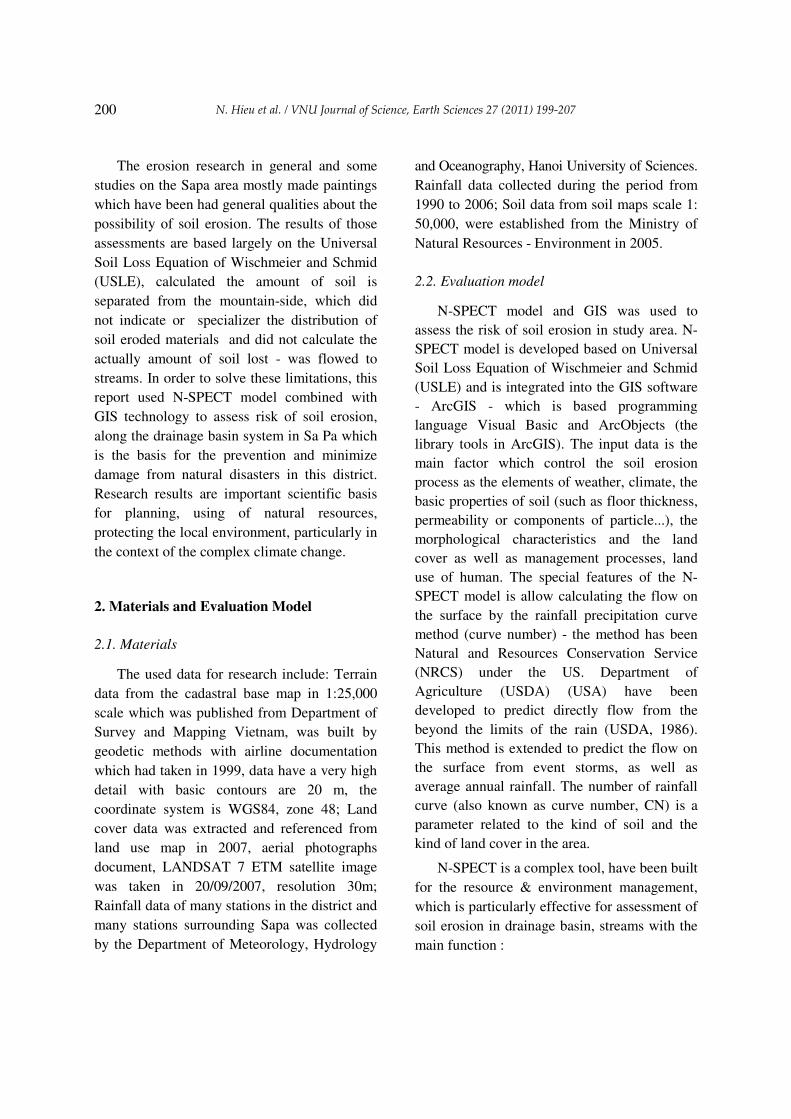
The detail evaluation process of N-SPCET
model is shown in figure 1.
3. Results and discussion
3.1. Evaluate the input parameters of the model
Soil erosion factor by the morphological
characteristics and slope length (LS)
L and S factor essentially is two separate
factors. L is the slope length factor and S is the
slope factor. Two factors are specific to the
influence of morphology and topography to
erosion and calculations in GIS have many
similarities for each other, so they are often
combined and called the LS factor.
LS factors are calculated by following
formula:
LS = [0065 + 0.0456 (slope) + 0.006541
(slope) 2] x (slope_length ÷ const) NN
In that: const = 1.22 m and NN are
calculated using table 1.
In the rain scenario building for Sapa area,
besides average annual rainfall data, N-SPECT
model also requires annual average number of
rainy days and rain type of study area. The
average number of rainy days for calculating
the total surface flow under the annual average
rainfall (Annual Precipitation) is 110 days Sa
Pa/year. Type of rain at Sapa is identified as
type II (most intense short duration rainfall) [1].
The results of rainfall interpolation show Sapa
area with mean annual rainfall over most of
1200 mm/year in the east, increases westward,
reaching over 2,000 mm/year. The distribution
of rainfall depends on the direction of the
terrain and has many changes from downstream
to upstream rivers. By analyzing the flow
direction, N-SPECT offers the distribution
maps of water after rain - this is necessary for
data to calculate a centralized location and not
concentrated in the wet season.
Erosion factors and soil cover (K)
These factors show the relationship between
coating and soil erosion or the possibility that
the vulnerability of land to erosion. Factor K
depends on the nature of the soil: the viscosity
of the soil particles, soil mechanical
composition, and ability to wet the soil, grain
diameter and organic content in soil.
N. Hieu et al. / VNU Journal of Science, Earth Sciences 27 (2011) 199-207
202
Fig. 1. The evaluation process of soil erosion N-SPECT [2].

N. Hieu et al. / VNU Journal of Science, Earth Sciences 27 (2011) 199-207 203
Table 1. Table NN values by the slope [3]
S < 1 1 < Slope < 3 3 < Slope < 5 > 5
NN 0.2 0.3 0.4 0.5
According Stroosnijder (1993), the organic
solution is key to reducing runoff, increasing
water permeability of the soil, reduce soil
erosion significantly. De Ploye J. et al (1993)
asserted that the land has severe mechanical
composition and organic content of soil is high,
the amount of erosion is very low.
In 1969, Wischmeier given formula
coefficient of soil erosion based on the physical
and mechanical soil:
100K = 2,1.10-4M1, 14 (12 - OS) + 3.25 (A
- 2) + 2.5 (D - 3)
Here: K - coefficient of soil erosion, M -
Weight particles, OS - concentration of organic
matter in soil, D - coefficient of permeability
depends of the ability to land, A - coefficient
depends on the form, arrangement and type of
structure.
To make ease to the calculations,
Wischmeier and Smith made nomograph
based on the above formula to investigate the
coefficient K. Thanks to the experimental
nomograph which, combined with studies of
Nguyen Quang My and many previous
authors [4,5], the corresponding coefficient K
for each soil type in the study area was
established based on the characteristics of
their constituent (Table 2).
Table 2. The soils in the area Sapa and the corresponding coefficient K [6]
Count Types of soil Symbol K factor
1 Crude peat humus soil on high mountain A 0.26
2 Yellow alit humus on granit Ha 0.12
3 Yellow alit humus on metamorphic Hj 0.12
4 Yellow – brown alit humus on limestone Hv 0.28
5 Gray – yellow humus on granit HFa 0.16
6 Gray – yellow humus on metamorphic HFj 0.16
7 Red – brown humus on limestone HFv 0.43
8 Red - yellow feralit soil on granit Fa 0.23
9 Red – yellow feralit soil on metamorphic Fj 0.22
10 Yellow – red soil changed by cutivation Fl 0.22
11 Multi-origin deluvial soil D 0.38
12 Deluvial soil on limestone Dv 0.17
13 Alluvial soil P 0.44

N. Hieu et al. / VNU Journal of Science, Earth Sciences 27 (2011) 199-207
204
Besides K factor, N-SPECT model requires
additional data about permeability of each soil
unit, is assessed according to four levels A, B,
C, D. Thus, the model will evaluate how the
water permeability for each soil type is fast,
accurate analysis to possibility of erosion for
each soil unit. Results of K factor mapping in
Sapa area shows the vulnerability of erosion at
the highest concentration near the rivers to flow
regularly irregular.
Erosion vegetation cover factor (C)
Sapa is a mountainous district with many
agricultural activities and tourism, a growing
diversity. This also makes the vegetation cover
in this quickly changing. The forest area is
declining due to deforestation of the people
during the 20th century, forest cover decreased
from 28.5% in 1987 down to 23.5% in 1990,
instead logging activities forest clearance for
agriculture, creating some vacant land, build
houses, cut mountain road... It is these activities
has increased the ability to destroy the earth as
rain. Direct raindrop impact on soil mantle
where there is no vegetation cover, and lead to
soil particle detachment occurs faster. At the
same time, reducing vegetation cover makes
the surface flow easily formed without any
encumbrance, to involve a multitude of soil
particles down slope. Although until now, the
area of forest cover has improved a lot but the
problem of erosion due to vegetation cover is
still a concern at many points in the study area.
According to the USLE equation,
vegetation cover data of Sa Pa is the value
calculated results NDVI (vegetation index)
from the Red and NIR channels of Landsat
ETM with 30m spatial resolution. Factor C is
calculated by the following empirical formula:
C = exp [(-α x NDVI) / (β - NDVI)]
Here: α = 2, β = 1. After calculation, the
map will be in the form factor C raster with the
distribution of values in the chart (Figure 2).
Factor values of C and NDVI values will fit
opposite relationship between erosion factors
by vegetation cover and vegetation cover factor.
Areas with greater vegetation cover, the ability
of this erosion in the lower and vice versa.
Thereby, the calculation results clearly factors
C are the areas with poor vegetation cover, bare
areas – concentrated downstream of the river
basin in Sapa the index high C, the remaining
area of primary forest in the mountains or forest
land is recovered by a low C values.
Landuse management factor (P)
In the assessment model of soil erosion, the
P characteristics for reducing the level of
erosion of farming practices. The P only mean
sharply with the agricultural sector. Table Patio
investigated by the International Soil Science
Society is shown in table 3.
The determination of the cultivation
methods for river basin in the study area is
difficult. The area of paddy land is not more
concentrated in the flat area along the streams.
Most of the lands for planting annual crops are
maize, cassava and some cash crops.
3.2. Assessment of soil erosion
The assessment process of N-SPECT made
by following process:
- Calculation of soil detachment from the
slopes through the Universal Soil Loss
Equation (USLE) is revised in the land use and
the slope length factors. Maps of actual soil
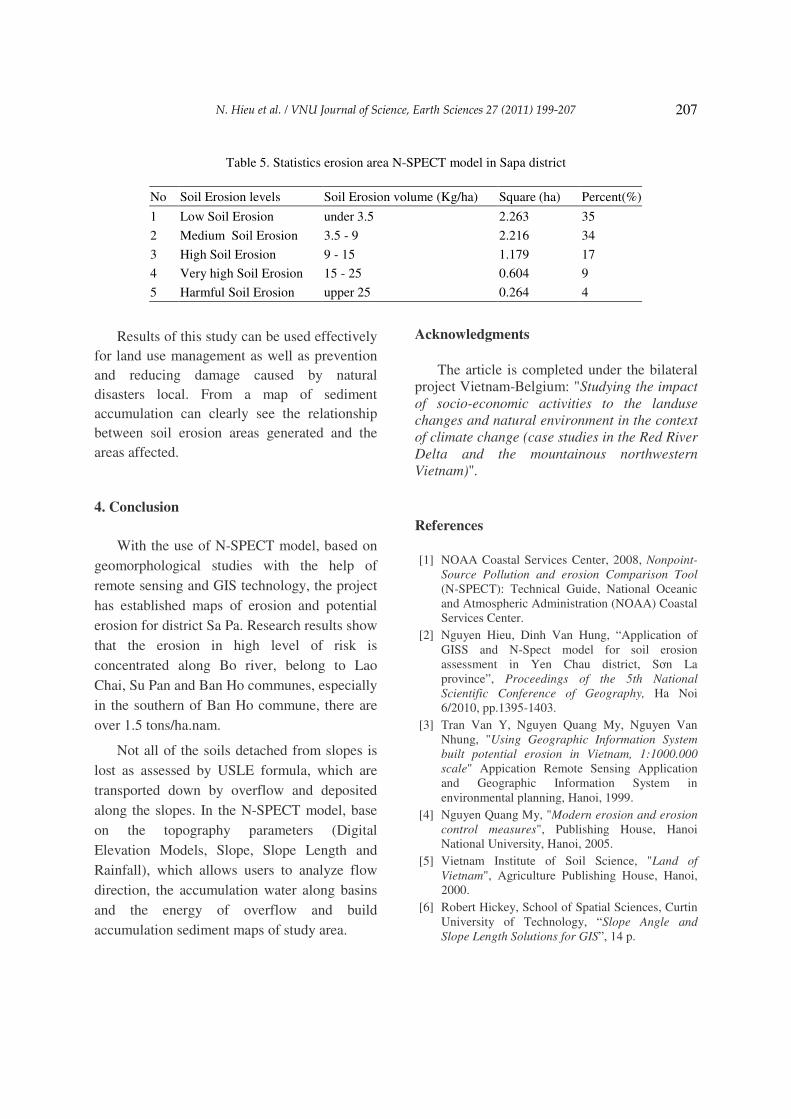
erosion (Fig. 2) and potential soil erosion (Fig. 3)
were built in this step.
N. Hieu et al. / VNU Journal of Science, Earth Sciences 27 (2011) 199-207 205
Table 3. Correlations with P values of terrain slope and the cultivation methods [1]
Slope (%) Cultivate due to contour Cultivate due to contour and plants on ice Cultivate due to bed
1 - 2 0.6 0.3 0.12
3 - 8 0.5 0.25 0.1
9 - 12 0.6 0.3 0.12
13 - 16 0.7 0.35 0.14
17 - 20 0.8 0.4 0.16
21 - 25 0.9 0.45 0.18
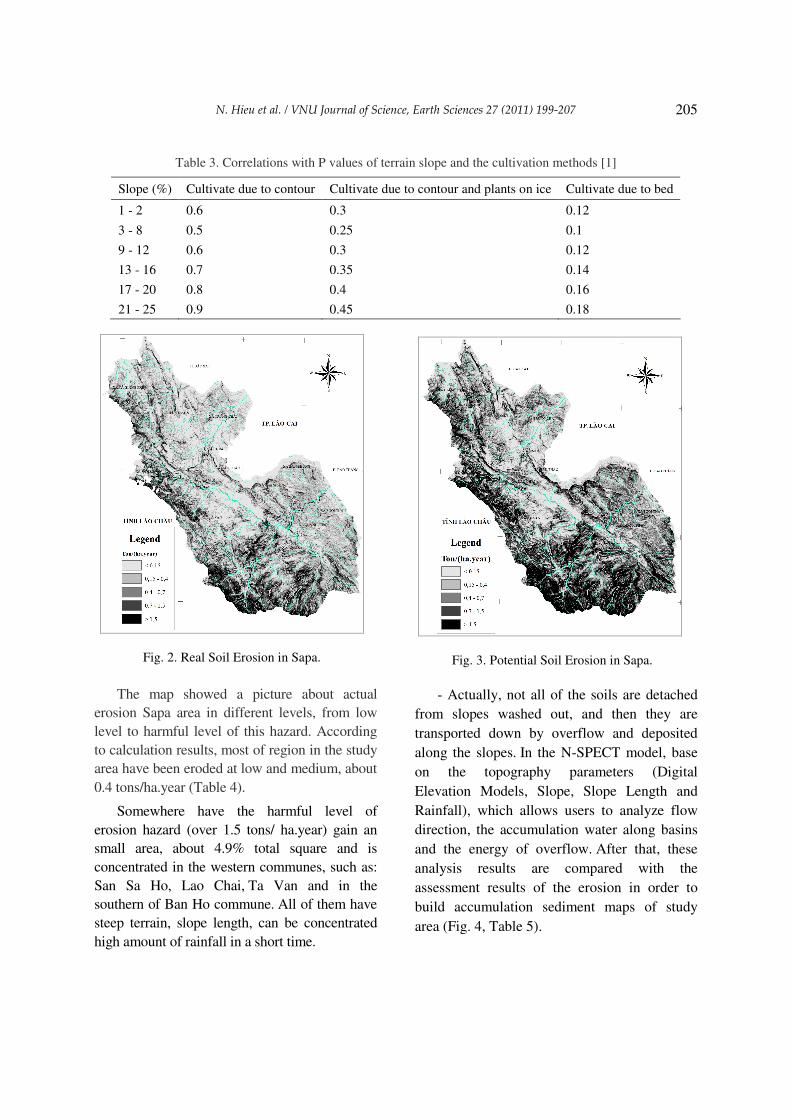
Fig. 2. Real Soil Erosion in Sapa.
Fig. 3. Potential Soil Erosion in Sapa.
The map showed a picture about actual
erosion Sapa area in different levels, from low
level to harmful level of this hazard. According
to calculation results, most of region in the study
area have been eroded at low and medium, about
0.4 tons/ha.year (Table 4).
Somewhere have the harmful level of
erosion hazard (over 1.5 tons/ ha.year) gain an
small area, about 4.9% total square and is
concentrated in the western communes, such as:
San Sa Ho, Lao Chai, Ta Van and in the
southern of Ban Ho commune. All of them have
steep terrain, slope length, can be concentrated
high amount of rainfall in a short time.
- Actually, not all of the soils are detached
from slopes washed out, and then they are
transported down by overflow and deposited
along the slopes. In the N-SPECT model, base
on the topography parameters (Digital
Elevation Models, Slope, Slope Length and
Rainfall), which allows users to analyze flow
direction, the accumulation water along basins
and the energy of overflow. After that, these
analysis results are compared with the
assessment results of the erosion in order to
build accumulation sediment maps of study
area (Fig. 4, Table 5).

N. Hieu et al. / VNU Journal of Science, Earth Sciences 27 (2011) 199-207
206
Table 4. Square of real soil erosion areas with the different levels in the Sapa district
by the USLE calculation
No Soil Erosion levels Soil Erosion volume
(ton/ha/year) Square (ha) Percent(%)
1 Low Soil Erosion under 0.15 2.395 35.43
2 Medium Soil Erosion 0.15 – 0.4 2.262 33.45
3 High Soil Erosion 0.4 – 0.7 1.013 14.97
4 Very high Soil Erosion 0.7 – 1.5 0.761 11.25
5 Harmful Soil Erosion upper 1.5 0.329 4.9
Fig. 4. Sediment accumulation map in Sapa district was calculated by N-SPECT model.
Sediment accumulation map calculated
from the N-SPECT model (Fig. 5), is the result
which represents a new perspective of soil
erosion. If in the previous of time, the
calculation results from the Universal Soil Loss
Equation of Wischmeier and Schmid (USLE)
only saw the potential soil loss at different
levels, then the calculated results by N-SPECT
model, we can identify clearly the movement
and re-deposit of eroded material in each small
basin. Some regions where have harmful level
(over 25 kg/ha) is only about 4% and is
concentrated in some communes, such as: Lao
Chai, Su Pan and Ban Ho, southern of the
Ban Khoang commune, especially in the
Southern of Ban Ho commune. These are just
some areas where land cover is poor, bad land
use.
N. Hieu et al. / VNU Journal of Science, Earth Sciences 27 (2011) 199-207 207
Table 5. Statistics erosion area N-SPECT model in Sapa district
No Soil Erosion levels Soil Erosion volume (Kg/ha) Square (ha) Percent(%)
1 Low Soil Erosion under 3.5 2.263 35
2 Medium Soil Erosion 3.5 - 9 2.216 34
3 High Soil Erosion 9 - 15 1.179 17
4 Very high Soil Erosion 15 - 25 0.604 9
5 Harmful Soil Erosion upper 25 0.264 4
Results of this study can be used effectively
for land use management as well as prevention
and reducing damage caused by natural
disasters local. From a map of sediment
accumulation can clearly see the relationship
between soil erosion areas generated and the
areas affected.
4. Conclusion
With the use of N-SPECT model, based on
geomorphological studies with the help of
remote sensing and GIS technology, the project
has established maps of erosion and potential
erosion for district Sa Pa. Research results show
that the erosion in high level of risk is
concentrated along Bo river, belong to Lao
Chai, Su Pan and Ban Ho communes, especially
in the southern of Ban Ho commune, there are
over 1.5 tons/ha.nam.
Not all of the soils detached from slopes is
lost as assessed by USLE formula, which are
transported down by overflow and deposited
along the slopes. In the N-SPECT model, base
on the topography parameters (Digital
Elevation Models, Slope, Slope Length and
Rainfall), which allows users to analyze flow
direction, the accumulation water along basins
and the energy of overflow and build
accumulation sediment maps of study area.
Acknowledgments
The article is completed under the bilateral
project Vietnam-Belgium: "Studying the impact
of socio-economic activities to the landuse
changes and natural environment in the context
of climate change (case studies in the Red River
Delta and the mountainous northwestern
Vietnam)".
References
[1] NOAA Coastal Services Center, 2008, Nonpoint-
Source Pollution and erosion Comparison Tool
(N-SPECT): Technical Guide, National Oceanic
and Atmospheric Administration (NOAA) Coastal
Services Center.
[2] Nguyen Hieu, Dinh Van Hung, “Application of
GISS and N-Spect model for soil erosion
assessment in Yen Chau district, Sơn La
province”, Proceedings of the 5th National
Scientific Conference of Geography, Ha Noi
6/2010, pp.1395-1403.
[3] Tran Van Y, Nguyen Quang My, Nguyen Van
Nhung, "Using Geographic Information System
built potential erosion in Vietnam, 1:1000.000
scale" Appication Remote Sensing Application
and Geographic Information System in
environmental planning, Hanoi, 1999.
[4] Nguyen Quang My, "Modern erosion and erosion
control measures", Publishing House, Hanoi
National University, Hanoi, 2005.
[5] Vietnam Institute of Soil Science, "Land of
Vietnam", Agriculture Publishing House, Hanoi,
2000.
[6] Robert Hickey, School of Spatial Sciences, Curtin
University of Technology, “Slope Angle and
Slope Length Solutions for GIS”, 14 p.