Embed Size (px)
Citation preview
This file is part of the following reference:
Gillen, David (2010) A study of IOCG-related hydrothermal fluids in the Wernecke Mountains, Yukon Territory, Canada.
PhD thesis, James Cook University.
Access to this file is available from:
http://eprints.jcu.edu.au/11620
Chapter 4
_________________________________________________________________________
4-1
4 Fluid inclusions: Paragenesis and characterisation
4.1 Introduction
Hydrothermal breccias and widespread metasomatism are such key features of the
Wernecke IOCG terrane, that the role hydrothermal fluids played in the formation of IOCG
prospects in the region cannot be overstated. A key step towards understanding IOCG
genesis is the determination of the properties and sources of hydrothermal fluids, and the
most direct way to explore fluid character is by analysing preserved samples of these
fluids.
In order to gain information about the fluids associated with the formation of IOCG
prospects in the Wernecke Mountains, fluid inclusions were studied in samples from six
prospects in the region. This chapter provides an outline of the geology and mineral
paragenesis of each prospect; details of the samples chosen for study; the types and timing
of fluid inclusions observed; and methods and results for fluid inclusion microthermometry
experiments. The main goals of these analyses were to determine fluid salinities and major
salt components as well as fluid inclusion trapping temperatures and pressures.
Previous work
Limited fluid inclusion petrography and thermometry were performed on WSG samples by
Hunt (2005). The study identified mostly two and three phase aqueous inclusions (liquid +
vapour ± halite) and rare opaque-bearing inclusions. The major outcomes of thermometry
experiments were the identification of fluids with moderate to high salinity (24 to 42 wt%
NaCl equivalent) that were variably calcic, with moderate homogenisation temperatures
between 120 and 245 °C. The number of inclusions analysed however was small, between
one and six inclusions were analysed for most samples (up to 11) for a total of 55
inclusions. These data have been added to Appendix D, which contains the new
thermometry data obtained in the present study. Four of the fluid inclusion samples
documented by Hunt (2005) were selected as the subject of further analysis in this study
(Slab SW, OY94-3-24.70m, JH01-5-7A, and STF-95-1-20.30m; described below). They
Chapter 4
_________________________________________________________________________
4-2
were chosen to enable greater coverage of samples from prospects not accessed during the
field campaign (Hoover, Olympic, STF) and because they contained fluid inclusions
amenable to detailed analyses.
Sample selection
The locations of the six IOCG prospects chosen for the present fluid inclusion study are
shown in Figure 3.3. The prospects were chosen from many in the region based on their
varied stratigraphic locations within the WSG (Fig. 3.2), their association with extensive
sodic or potassic metasomatism, and accessibility of drillcore for study (Hunt, 2005).
Within each prospect, samples from outcrop and/or drillcore were chosen for their quartz
content (or the presence of alternate minerals appropriate for fluid inclusion analysis such
as fluorite, calcite or barite), association with mineralisation, and their ability to be placed
paragenetically within the prospect, in particular their timing with respect to brecciation
and associated mineralisation.
Criteria for fluid inclusion paragenesis and classification
Fluid inclusions were classified firstly according to their paragenesis, based on the criteria
described by Roedder (1984). This system is based on the identification of primary,
pseudo-secondary and secondary inclusions. Under this scheme, primary inclusions are
those trapped during the primary growth of a mineral. They commonly form along the
growth planes of the crystal, and are sometimes found in isolated groups, or as large
solitary inclusions. These inclusions provide information relating to fluids and conditions
during mineral formation. Secondary inclusions are those trapped by healing of
microfractures after the host mineral formed. They form in planar arrays which often
appear as trails in thin section, and which cut across growth zones and grain boundaries.
Such inclusions provide information on fluid conditions postdating formation of the host
mineral, and can provide insights into fluid evolution. Pseudo-secondary inclusions are
also trapped by healed fractures, but ones that healed before the host mineral had stopped
growing, and therefore do not cut across all growth zones. They can be recognised when
multiple inclusion trails terminate against a growth zone, and as with primary inclusions,
they represent fluids related to host mineral formation. The inclusions have also been
Chapter 4
_________________________________________________________________________
4-3
classified by identification of the phases present at room temperature (e.g. Shepherd et al.,
1985). The most common phases; liquid, vapour, solid halite, other daughter crystals, and
CO2, are represented in this chapter by L, V, H, S, and CO2 respectively and are listed in
order of abundance by volume (e.g. L+V, L+V±S or LV, LVH etc). The approach outlined
here differs slightly from the fluid inclusion assemblage (FIA) approach of Goldstein and
Reynolds (1994). Their approach groups inclusions trapped at the same time (i.e.
representing a single fluid event) into assemblages, though an assemblage may include
inclusions with variable characteristics (Goldstein, 2001).
4.2 Geological setting and description of samples and fluid inclusions
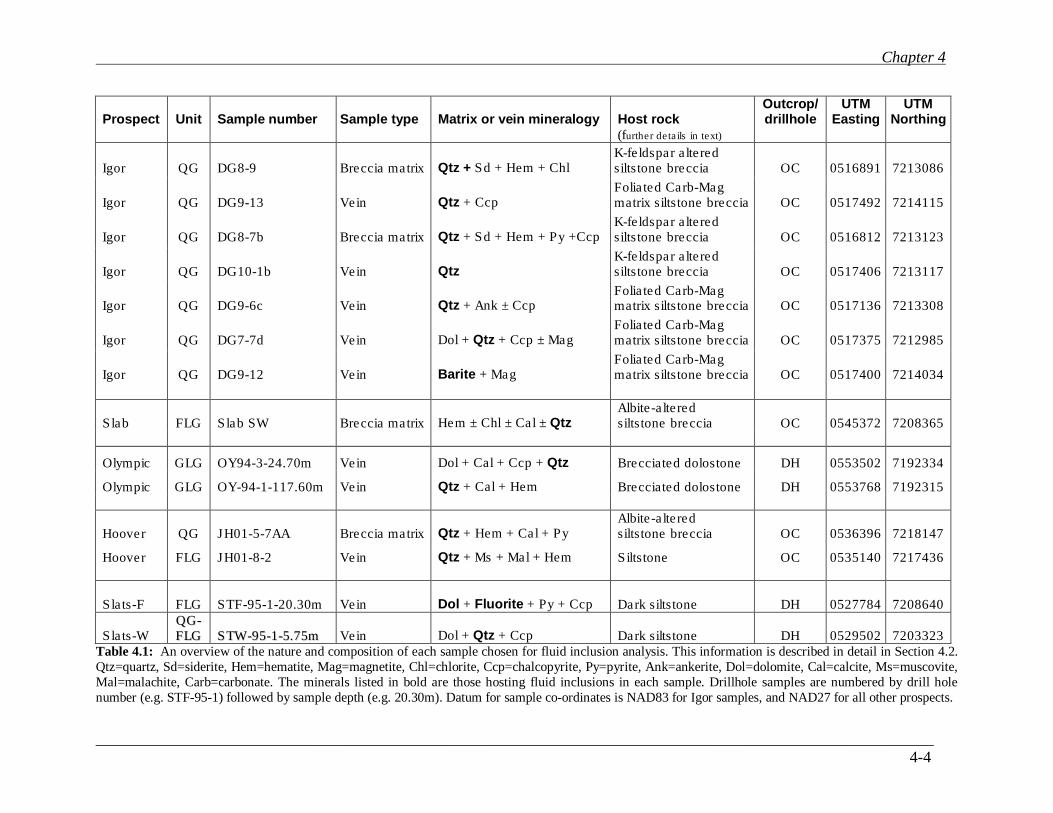
The geological setting and mineralogy of samples are described in detail below and
summarised in Table 4.1. Geology of individual prospects is sourced mainly from Hunt
(2005), which contains the most comprehensive discussion of these particular prospects.
Further insights were provided by field mapping and logging of drill core samples from the
Igor prospect (Appendix C), and by petrographic study of all fluid inclusion samples. A
summary of the fluid inclusion types characterised in WSG samples is presented in Table
4.2.
Chapter 4
_________________________________________________________________________________________________________
4-4
Prospect Unit Sample number Sample type Matrix or vein mineralogy Host rock Outcrop/ drillhole
UTM Easting
UTM Northing
(further details in text)
Igor QG DG8-9 Breccia matrix Qtz + Sd + Hem + Chl K-feldspar altered siltstone breccia OC 0516891 7213086
Igor QG DG9-13 Vein Qtz + Ccp Foliated Carb-Mag matrix siltstone breccia OC 0517492 7214115
Igor QG DG8-7b Breccia matrix Qtz + Sd + Hem + Py +Ccp K-feldspar altered siltstone breccia OC 0516812 7213123
Igor QG DG10-1b Vein Qtz K-feldspar altered siltstone breccia OC 0517406 7213117
Igor QG DG9-6c Vein Qtz + Ank ± Ccp Foliated Carb-Mag matrix siltstone breccia OC 0517136 7213308
Igor QG DG7-7d Vein Dol + Qtz + Ccp ± Mag Foliated Carb-Mag matrix siltstone breccia OC 0517375 7212985
Igor QG DG9-12 Vein Barite + Mag Foliated Carb-Mag matrix siltstone breccia OC 0517400 7214034
Slab FLG Slab SW Breccia matrix Hem ± Chl ± Cal ± Qtz Albite-altered siltstone breccia OC 0545372 7208365
Olympic GLG OY94-3-24.70m Vein Dol + Cal + Ccp + Qtz Brecciated dolostone DH 0553502 7192334
Olympic GLG OY-94-1-117.60m Vein Qtz + Cal + Hem Brecciated dolostone DH 0553768 7192315
Hoover QG JH01-5-7AA Breccia matrix Qtz + Hem + Cal + Py Albite-altered siltstone breccia OC 0536396 7218147
Hoover FLG JH01-8-2 Vein Qtz + Ms + Mal + Hem Siltstone OC 0535140 7217436
Slats-F FLG STF-95-1-20.30m Vein Dol + Fluorite + Py + Ccp Dark siltstone DH 0527784 7208640
Slats-W QQGG--FFLLGG SSTTWW--9955--11--55..7755mm Vein Dol + Qtz + Ccp Dark siltstone DH 0529502 7203323
Table 4.1: An overview of the nature and composition of each sample chosen for fluid inclusion analysis. This information is described in detail in Section 4.2.
Qtz=quartz, Sd=siderite, Hem=hematite, Mag=magnetite, Chl=chlorite, Ccp=chalcopyrite, Py=pyrite, Ank=ankerite, Dol=dolomite, Cal=calcite, Ms=muscovite,
Mal=malachite, Carb=carbonate. The minerals listed in bold are those hosting fluid inclusions in each sample. Drillhole samples are numbered by drill hole
number (e.g. STF-95-1) followed by sample depth (e.g. 20.30m). Datum for sample co-ordinates is NAD83 for Igor samples, and NAD27 for all other prospects.
Chapter 4
_________________________________________________________________________
4-5
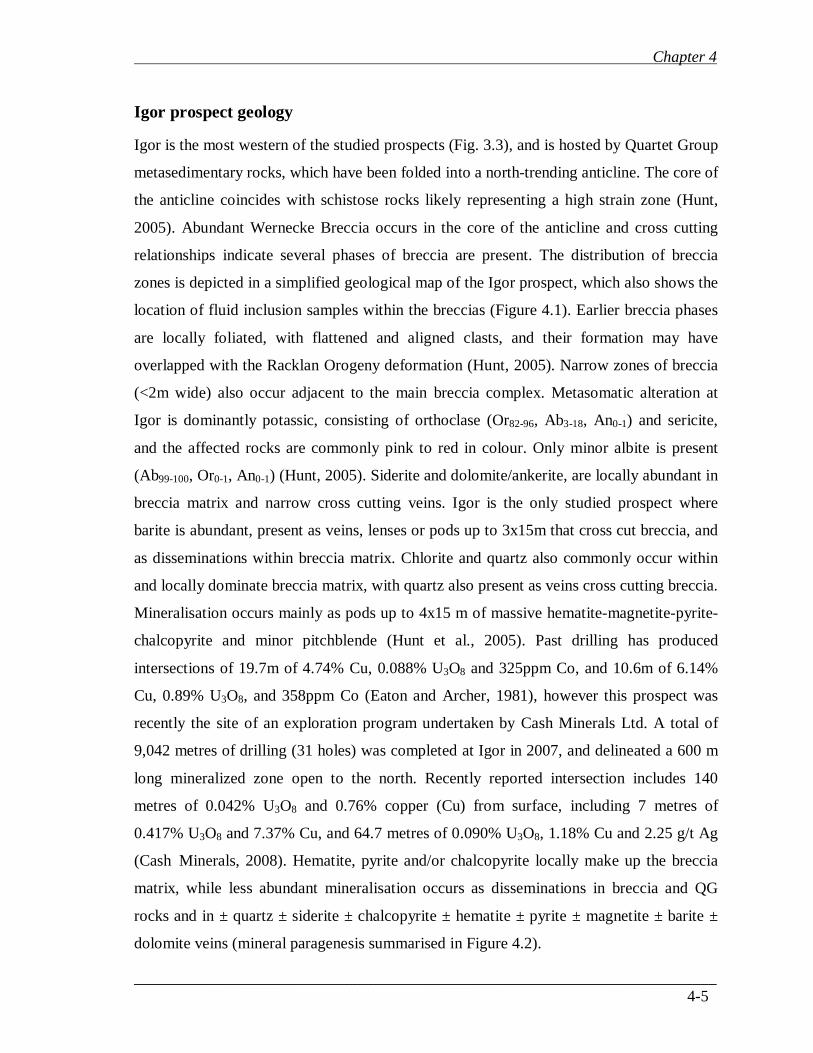
Igor prospect geology
Igor is the most western of the studied prospects (Fig. 3.3), and is hosted by Quartet Group
metasedimentary rocks, which have been folded into a north-trending anticline. The core of
the anticline coincides with schistose rocks likely representing a high strain zone (Hunt,
2005). Abundant Wernecke Breccia occurs in the core of the anticline and cross cutting
relationships indicate several phases of breccia are present. The distribution of breccia
zones is depicted in a simplified geological map of the Igor prospect, which also shows the
location of fluid inclusion samples within the breccias (Figure 4.1). Earlier breccia phases
are locally foliated, with flattened and aligned clasts, and their formation may have
overlapped with the Racklan Orogeny deformation (Hunt, 2005). Narrow zones of breccia
(<2m wide) also occur adjacent to the main breccia complex. Metasomatic alteration at
Igor is dominantly potassic, consisting of orthoclase (Or82-96, Ab3-18, An0-1) and sericite,
and the affected rocks are commonly pink to red in colour. Only minor albite is present
(Ab99-100, Or0-1, An0-1) (Hunt, 2005). Siderite and dolomite/ankerite, are locally abundant in
breccia matrix and narrow cross cutting veins. Igor is the only studied prospect where
barite is abundant, present as veins, lenses or pods up to 3x15m that cross cut breccia, and
as disseminations within breccia matrix. Chlorite and quartz also commonly occur within
and locally dominate breccia matrix, with quartz also present as veins cross cutting breccia.
Mineralisation occurs mainly as pods up to 4x15 m of massive hematite-magnetite-pyrite-
chalcopyrite and minor pitchblende (Hunt et al., 2005). Past drilling has produced
intersections of 19.7m of 4.74% Cu, 0.088% U3O8 and 325ppm Co, and 10.6m of 6.14%
Cu, 0.89% U3O8, and 358ppm Co (Eaton and Archer, 1981), however this prospect was
recently the site of an exploration program undertaken by Cash Minerals Ltd. A total of
9,042 metres of drilling (31 holes) was completed at Igor in 2007, and delineated a 600 m
long mineralized zone open to the north. Recently reported intersection includes 140
metres of 0.042% U3O8 and 0.76% copper (Cu) from surface, including 7 metres of
0.417% U3O8 and 7.37% Cu, and 64.7 metres of 0.090% U3O8, 1.18% Cu and 2.25 g/t Ag
(Cash_Minerals, 2008). Hematite, pyrite and/or chalcopyrite locally make up the breccia
matrix, while less abundant mineralisation occurs as disseminations in breccia and QG
rocks and in ± quartz ± siderite ± chalcopyrite ± hematite ± pyrite ± magnetite ± barite ±
dolomite veins (mineral paragenesis summarised in Figure 4.2).
Chapter 4
_________________________________________________________________________
4-6
Figure 4.1: Simplified geology map modified from Hunt and Baker (2002), showing breccia zones and
sample locations at the Igor prospect. Co-ordinates are UTM (zone 8). See text for further description of rock types.
Chapter 4
_________________________________________________________________________
4-7
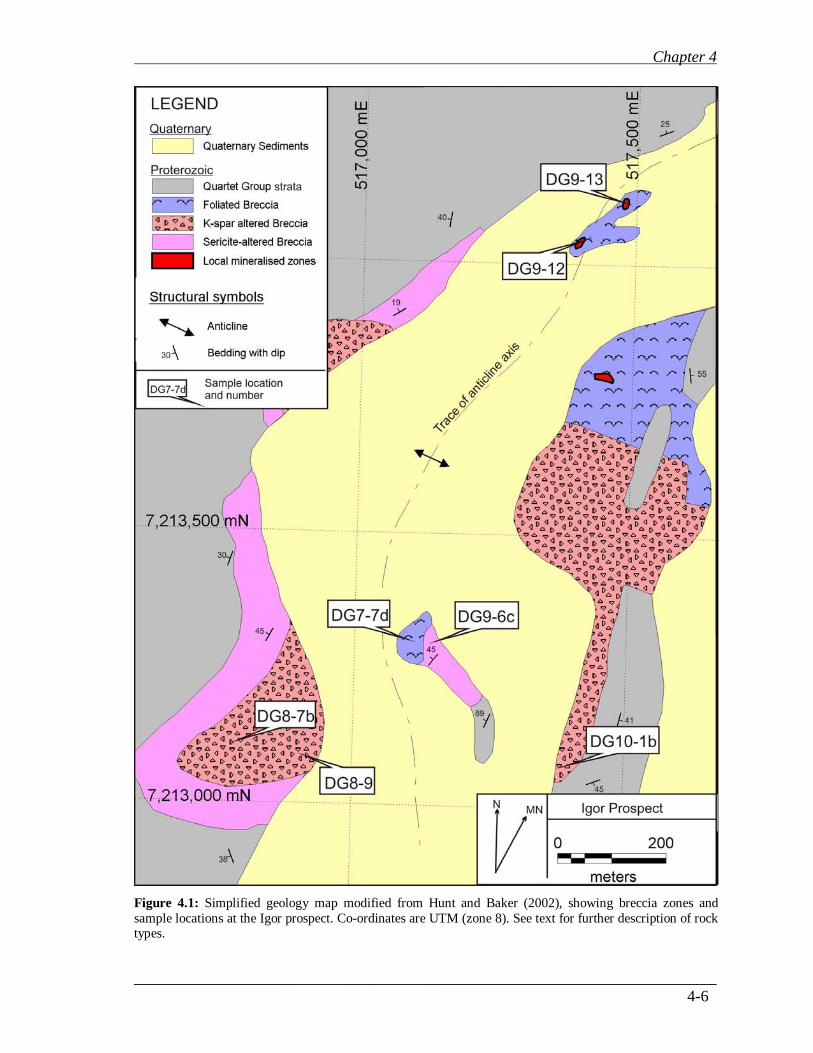
Figure 4.2: Simplified mineral paragenesis at the Igor prospect, modified from Hunt (2005). Quartz timing is
further specified for individual samples, and blue ellipses denote the timing of preserved fluid inclusion populations in each sample. Note the post- vs syn-quartz timing of some fluids.
4.2.1 Igor samples and fluid inclusions
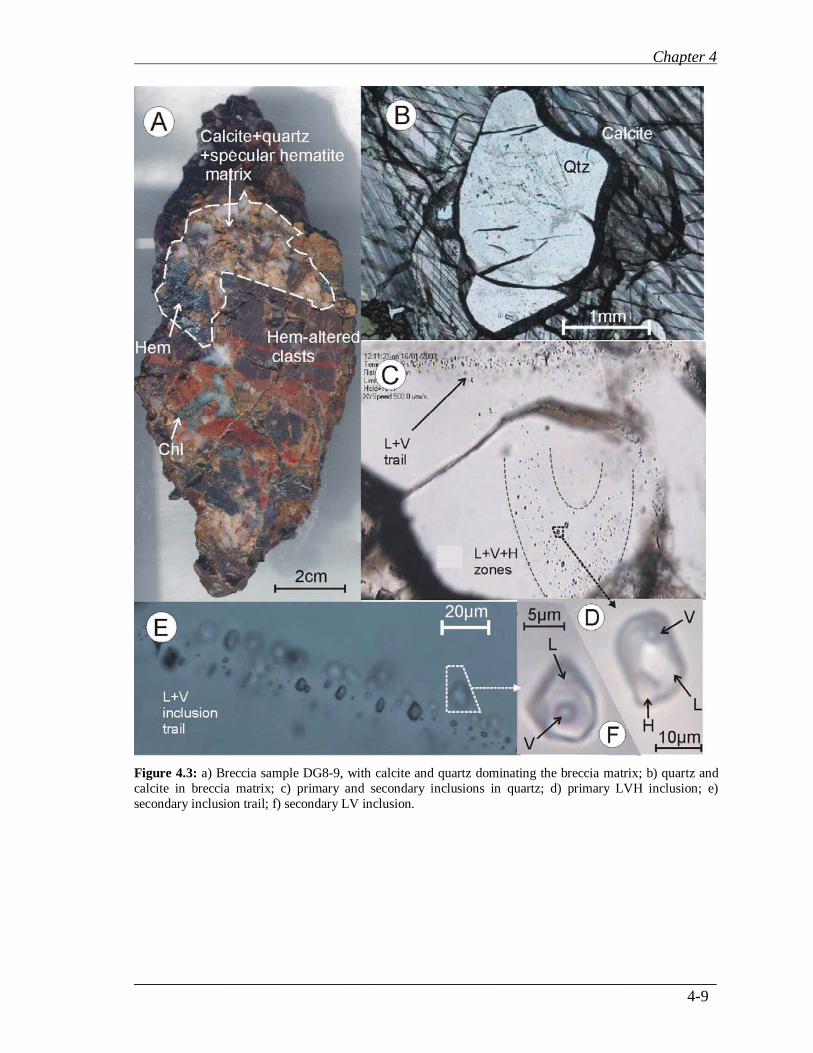
Sample DG8-9 was collected from the middle of a large breccia zone to the west of the
anticline axis at the Igor prospect (Figure 4.1). This breccia sample is clast supported, with
pink K-feldspar altered siltstone clasts with additional red-brown hematite alteration, and a
matrix fill composed of specular hematite, calcite, quartz, K-feldspar and chlorite (Figure
4.3a). Red-pink hematite and K-feldspar alteration occurred early in the brecciation event
and pervasively altered clasts along fractures and clast boundaries. Precipitation of the
matrix-infilling minerals followed during brecciation (Figure 4.2), with the formation of
calcite and quartz infill (Figure 4.3b), while specular hematite and chlorite subsequently
overprinted these earlier matrix minerals. This breccia type and mineralogy is typical for
this breccia zone, although clast to matrix ratio varies.
Chapter 4
_________________________________________________________________________
4-8
Abundant primary and secondary fluid inclusions are hosted in quartz (Figure 4.3c). The
primary inclusions are three phase inclusions up to 20µm in diameter, containing liquid
(~80% by volume), vapour (~10%) and halite (~10%) (Figure 4.3d), and are classified as
primary since they are confined to distinct isolated zones containing only this inclusion
type. These primary inclusions were trapped during precipitation of the breccia matrix. The
majority of inclusions however are two phase (liquid ~85%, vapour ~15%) inclusions
occurring in well defined, continuous trails. They are smaller in size (up to 10µm) and
clearly secondary in origin (Figure 4.3c, e and f), and more likely to have formed after the
main period of brecciation (Figure 4.2).
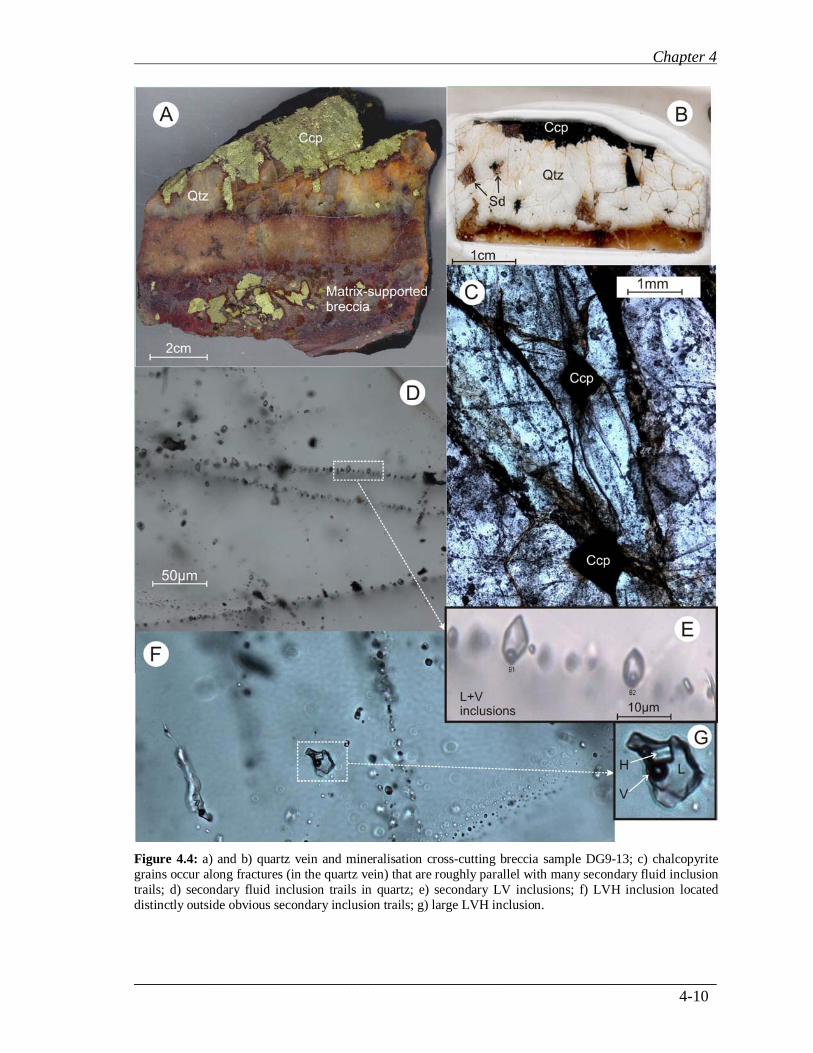
Sample DG9-13 was collected from a zone of foliated, siderite + magnetite ± hematite
matrix siltstone breccia at the northern end of the Igor prospect, close to the core of the
anticline (Figure 4.1). The breccia is coloured orange by weathering of iron-oxides, and is
cross cut by a 1-2 cm quartz vein (Figure 4.4a & b), which is overprinted by minor siderite
(weathered). Chalcopyrite overprints the quartz, siderite, and the breccia (Figure 4.4a & b).
Additional small chalcopyrite grains occur along the abundant fractures that occur
throughout the quartz (Figure 4.4c), particularly at junctions where two or more fractures
meet.
Abundant fluid inclusions are hosted by the vein quartz. The vast majority occur in linear,
well defined trails (Figure 4.4d) which crosscut grain boundaries, indicating that these are
secondary inclusions. Inclusions are two phase liquid (~85%) + vapour (~15%), and are up
to 20 µm in diameter (Figure 4.4e & f). Very rarely inclusions contained a small orange
hematite crystal (observed in two inclusions). Halite-bearing inclusions are far less
common, but were observed in an isolated zone of inclusions occurring outside of the
obvious secondary trails (Figure 4.4f). One of these inclusions also contained a hematite
phase. The secondary nature of fluid inclusion trails further constrains the timing of fluids,
indicating they were trapped after quartz formation (Figure 4.2). The post-quartz formation
of chalcopyrite in fractures roughly parallel to many fluid inclusion trails suggests that the
preserved fluids may be related to mineralisation (Figure 4.4c).
Chapter 4
_________________________________________________________________________
4-9
Figure 4.3: a) Breccia sample DG8-9, with calcite and quartz dominating the breccia matrix; b) quartz and
calcite in breccia matrix; c) primary and secondary inclusions in quartz; d) primary LVH inclusion; e)
secondary inclusion trail; f) secondary LV inclusion.
Chapter 4
_________________________________________________________________________
4-10
Figure 4.4: a) and b) quartz vein and mineralisation cross-cutting breccia sample DG9-13; c) chalcopyrite
grains occur along fractures (in the quartz vein) that are roughly parallel with many secondary fluid inclusion
trails; d) secondary fluid inclusion trails in quartz; e) secondary LV inclusions; f) LVH inclusion located
distinctly outside obvious secondary inclusion trails; g) large LVH inclusion.
Chapter 4
_________________________________________________________________________
4-11
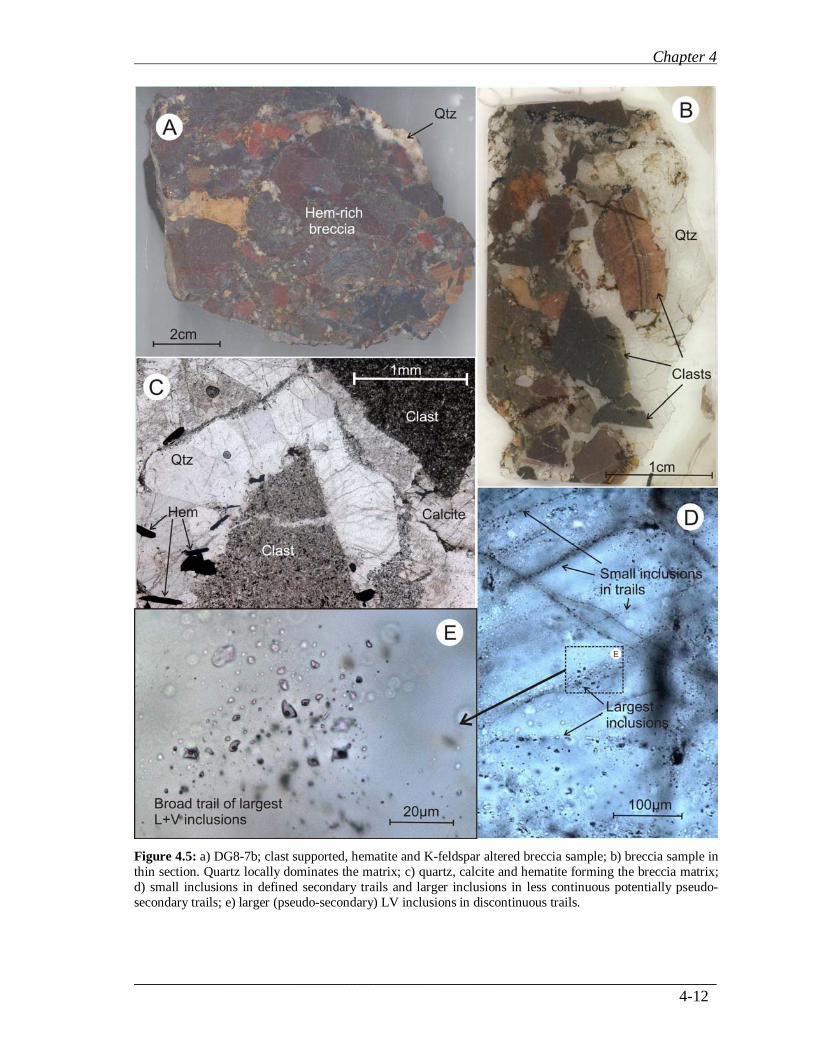
Sample DG8-7b was collected from the middle of the same breccia zone as DG8-9,
described above, and is similar to that breccia sample. It is clast supported, with clasts of
dark hematite-dusted siltstone, and pale pink K-feldspar altered clasts exhibiting partial to
complete alteration (Figure 4.5a & b). The breccia matrix is made up mostly from quartz
and calcite, and minor overprinting specular hematite associated with secondary fractures
that cross-cut both clasts and matrix (Fig. 4.5b & c). The quartz is also locally overprinted
by tiny blebs of pyrite and chalcopyrite.
Quartz contains very small (<5µm) secondary L+V inclusions in narrow, defined trails
cross cutting grain boundaries (Fig. 4.5d). Larger two phase (L~90%, V~10%) inclusions
(up to 8µm) (Fig. 4.5e) occur in broader trails (Fig. 4.5d & e) that are less continuous and
may represent pseudo-secondary inclusions. Abundant small inclusions (<5µm), also occur
outside of obvious trails, usually in non-distinct patterns, and occasionally lie in isolated
groups within polygonal crystals and are more likely to be primary inclusions. Primary and
pseudo-secondary inclusions likely preserved fluids that were responsible for formation of
quartz in the breccia matrix.
Chapter 4
_________________________________________________________________________
4-12
Figure 4.5: a) DG8-7b; clast supported, hematite and K-feldspar altered breccia sample; b) breccia sample in
thin section. Quartz locally dominates the matrix; c) quartz, calcite and hematite forming the breccia matrix;
d) small inclusions in defined secondary trails and larger inclusions in less continuous potentially pseudo-
secondary trails; e) larger (pseudo-secondary) LV inclusions in discontinuous trails.
Chapter 4
_________________________________________________________________________
4-13
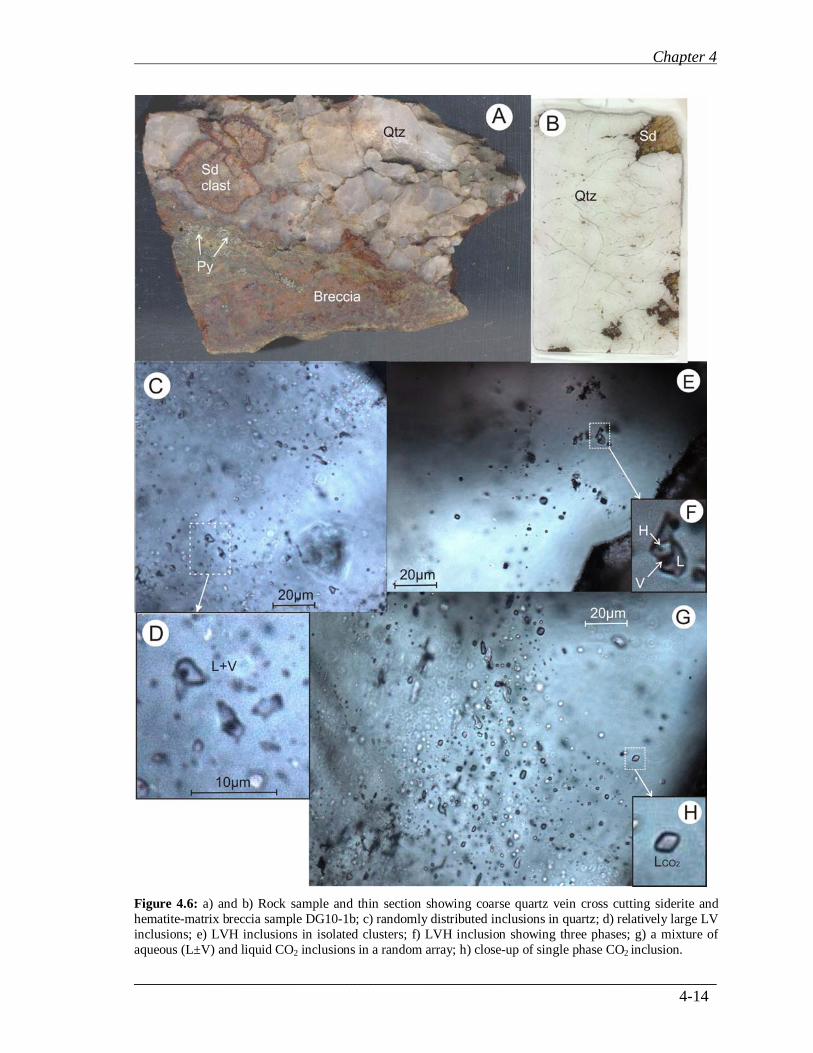
Sample DG10-1b is made up of predominantly coarse quartz (Figure 4.6a & b) occurring
as a vein cross cutting a breccia type equivalent to breccia occurring in samples DG8-9 and
DG8-7b (K-feldspar altered clasts, with matrix of specular hematite ± chlorite ± quartz ±
siderite) but which outcrops on the eastern side of the Igor prospect (Figure 4.1). This
breccia sample is weathered but dominated by a siderite + hematite matrix which is
overprinted by pyrite blebs. The cross-cutting nature of the quartz vein, and presence of
(weathered) siderite clasts within the quartz (Fig. 4.6a), indicate that quartz either formed
late in the brecciation event or is a post brecciation feature (Figure 4.2).
This sample contains densely populated, very small inclusions in quartz, occurring with a
mostly random distribution, and some in poorly defined trails. Larger than average, two
phase (L+V) (90% liquid, 10% vapour) inclusions (up to 6 µm) were also observed (Fig.
4.6c & d), as well as rare halite-bearing inclusions (Fig. 4.6e & f), however, these did not
lie in distinct zones or trails and their paragenesis is uncertain (potentially primary). Six
single phase liquid CO2 inclusions smaller than 5µm were found in a small area,
distributed randomly amongst the more common aqueous inclusions (Fig. 4.6g). These
were thought to be aqueous initially but were identified as CO2 by their melting
temperatures during microthermometry (Section 4.4).
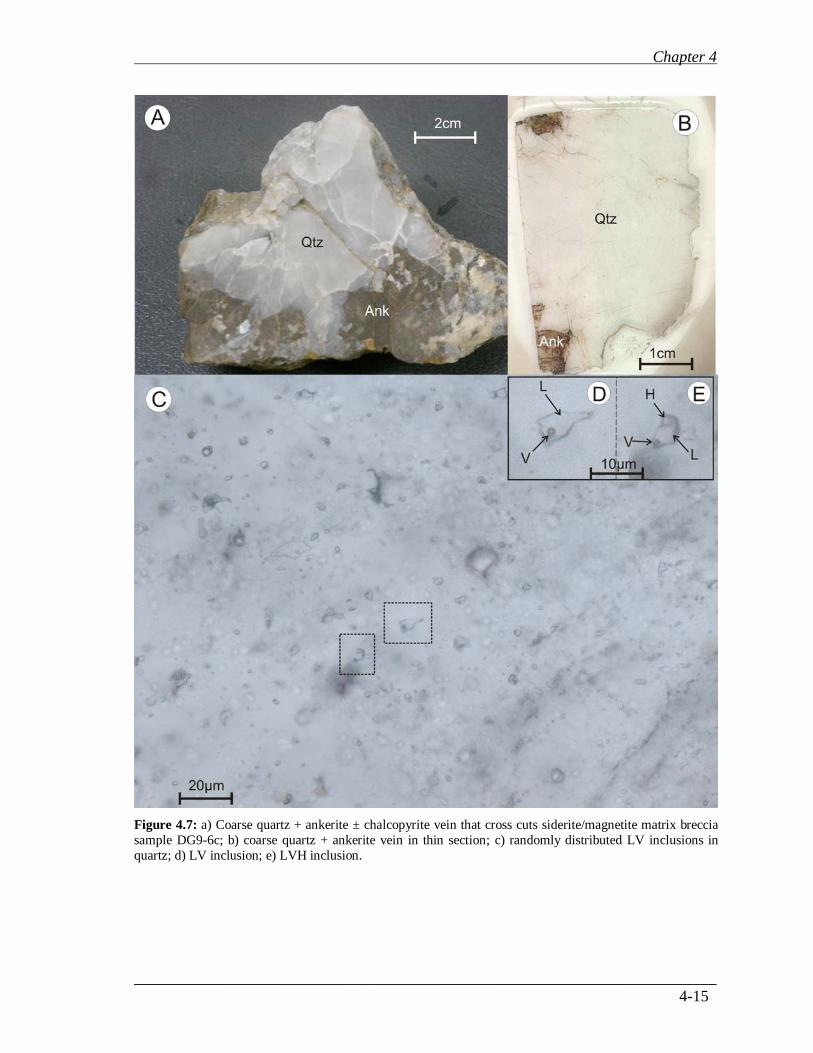
Sample DG9-6c was collected from within foliated, carbonate (siderite) matrix breccia
with magnetite crystals and sparse flattened (aligned) siltstone clasts, located in the centre
of the Igor prospect and close to the anticline axis. The sample is composed of a coarse
quartz + ankerite ± chalcopyrite vein cross cutting the breccia (Figure 4.7a & b). Vein
formation occurred either late in the brecciation event or post-brecciation (Figure 4.2).
In this sample quartz contains very abundant inclusions which are mostly randomly
distributed, while very small inclusions (mostly <5µm) occur in secondary trails cross-
cutting grain boundaries. The largest inclusions are two phase (L+V) inclusions (liquid 90-
95%, vapour 5-10%) up to 12µm (Fig. 4.7c & d). These are randomly distributed, with no
apparent relation to any trails, and include rare halite-bearing inclusions (Fig. 4.7e). Since
the host quartz formed late to post brecciation, these inclusions represent late to post
brecciation fluids, but may be related to mineralisation that occurs within the vein (Figure
4.2).
Chapter 4
_________________________________________________________________________
4-14
Figure 4.6: a) and b) Rock sample and thin section showing coarse quartz vein cross cutting siderite and
hematite-matrix breccia sample DG10-1b; c) randomly distributed inclusions in quartz; d) relatively large LV
inclusions; e) LVH inclusions in isolated clusters; f) LVH inclusion showing three phases; g) a mixture of
aqueous (L±V) and liquid CO2 inclusions in a random array; h) close-up of single phase CO2 inclusion.
Chapter 4
_________________________________________________________________________
4-15
Figure 4.7: a) Coarse quartz + ankerite ± chalcopyrite vein that cross cuts siderite/magnetite matrix breccia
sample DG9-6c; b) coarse quartz + ankerite vein in thin section; c) randomly distributed LV inclusions in
quartz; d) LV inclusion; e) LVH inclusion.
Chapter 4
_________________________________________________________________________
4-16
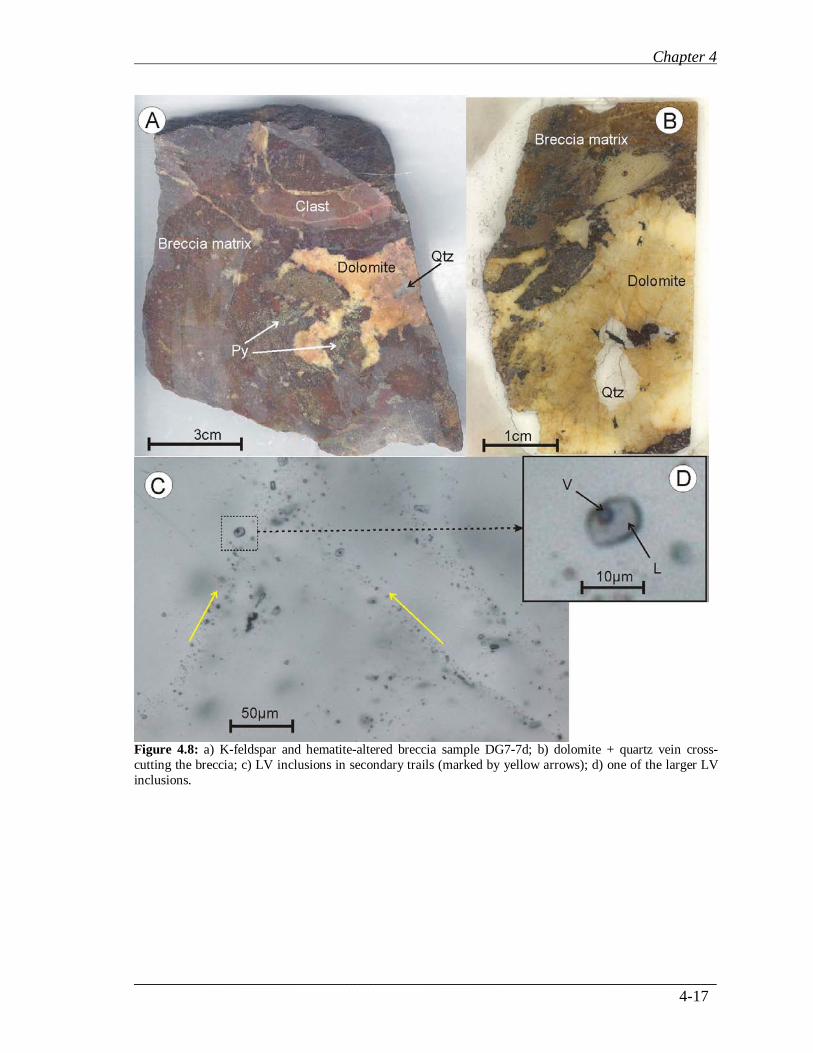
Sample DG7-7d was sampled from within foliated siderite matrix breccia near DG9-6c,
though foliation is not obvious in Figure 4.8. It is clast supported and the majority of clasts
are partially K-feldspar and/or hematite altered siltstone (Figure 4.8a) and locally sericite
altered. The matrix is reddish in colour and rich in hematite and siderite, with abundant
overprinting pyrite blebs which dominate in small zones. Quartz occurs in the centre of a
dolomite vein cross cutting the breccia (Fig. 4.8b), and is the later formed of these two
minerals. The vein dolomite is also overprinted by rare blebs of chalcopyrite ± magnetite,
and locally pyrite. Pyrite also locally overprints the quartz. As with sample DG9-6c the
vein may have formed after or in the latter stages of brecciation.
Quartz in this sample contains very abundant, generally small (L+V) inclusions (<5µm)
occurring as well defined trails of secondary inclusions (Fig. 4.8c). Some trails contained
larger (up to 10µm) two phase inclusions (liquid 85%, vapour 15%) (Fig. 4.8d). The host-
quartz postdates breccia formation, and secondary fluid inclusions postdate quartz
formation and may be related to late sulphide mineralisation (Figure 4.2).
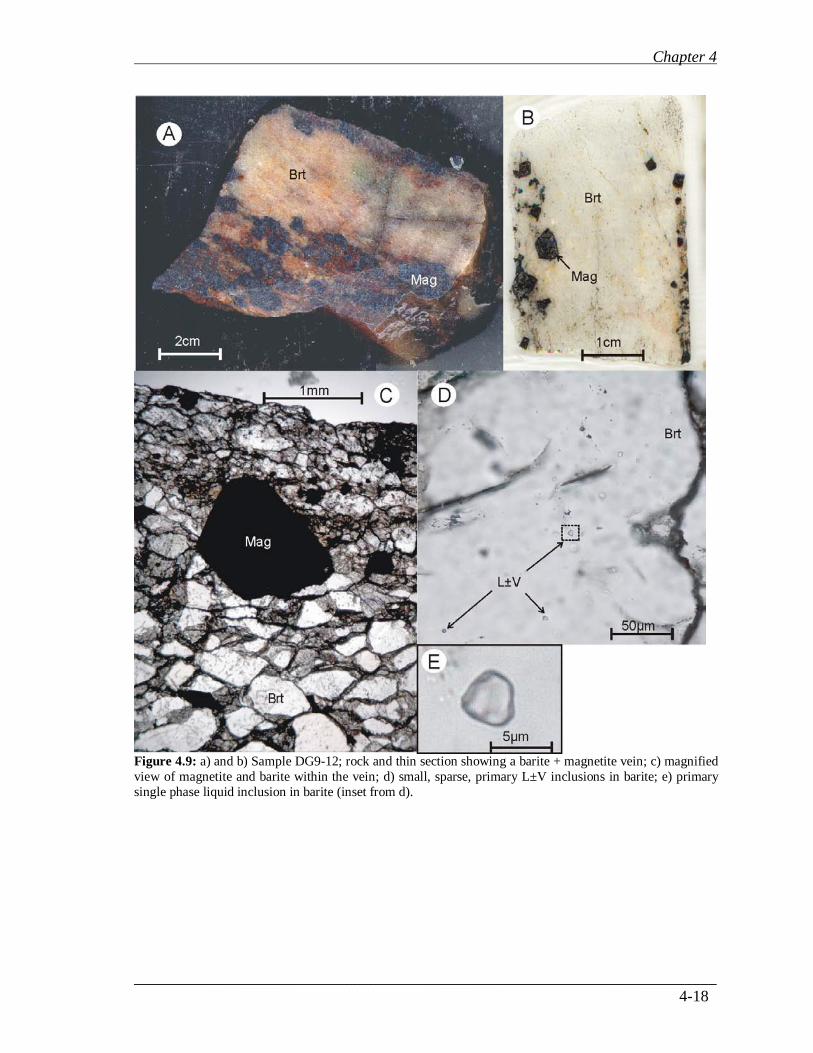
Sample DG 9-12 was collected from a magnetite-rich zone at the northern end of the Igor
prospect, within the zone of foliated, siderite + magnetite ± hematite matrix breccia that
hosted DG9-13. The sample is part of a cross cutting barite + (euhedral) magnetite vein
(Figure 4.9a, b, and c) which corresponds with the last Igor paragenetic stage (Figure 4.2)
and which locally grades into massive magnetite.
Small (<5µm), mostly single phase liquid primary inclusions, occur within barite grains
(<1mm) in sample DG9-12 (Fig. 4.9c, d and e). Less common two phase L+V inclusions
are also present. The primary inclusions represent fluids that post-date breccia formation,
and that are responsible for late stage barite precipitation (Figure 4.2).
Chapter 4
_________________________________________________________________________
4-17
Figure 4.8: a) K-feldspar and hematite-altered breccia sample DG7-7d; b) dolomite + quartz vein cross-
cutting the breccia; c) LV inclusions in secondary trails (marked by yellow arrows); d) one of the larger LV
inclusions.
Chapter 4
_________________________________________________________________________
4-18
Figure 4.9: a) and b) Sample DG9-12; rock and thin section showing a barite + magnetite vein; c) magnified
view of magnetite and barite within the vein; d) small, sparse, primary L±V inclusions in barite; e) primary
single phase liquid inclusion in barite (inset from d).
Chapter 4
_________________________________________________________________________
4-19
4.2.2 Slab prospect geology
The Slab prospect lies within upper FLG strata, which hosts meta-evaporites as discussed
in Chapter 3 (see Fig. 3.2). The prospect occurs 28km east of Igor, on the eastern limb of a
large anticlinal structure and is cut by a NW-trending zone of schist and phyllite, which is
interpreted to be a high strain zone, and hosts minor outcrops of BPRI (Thorkelson, 2000;
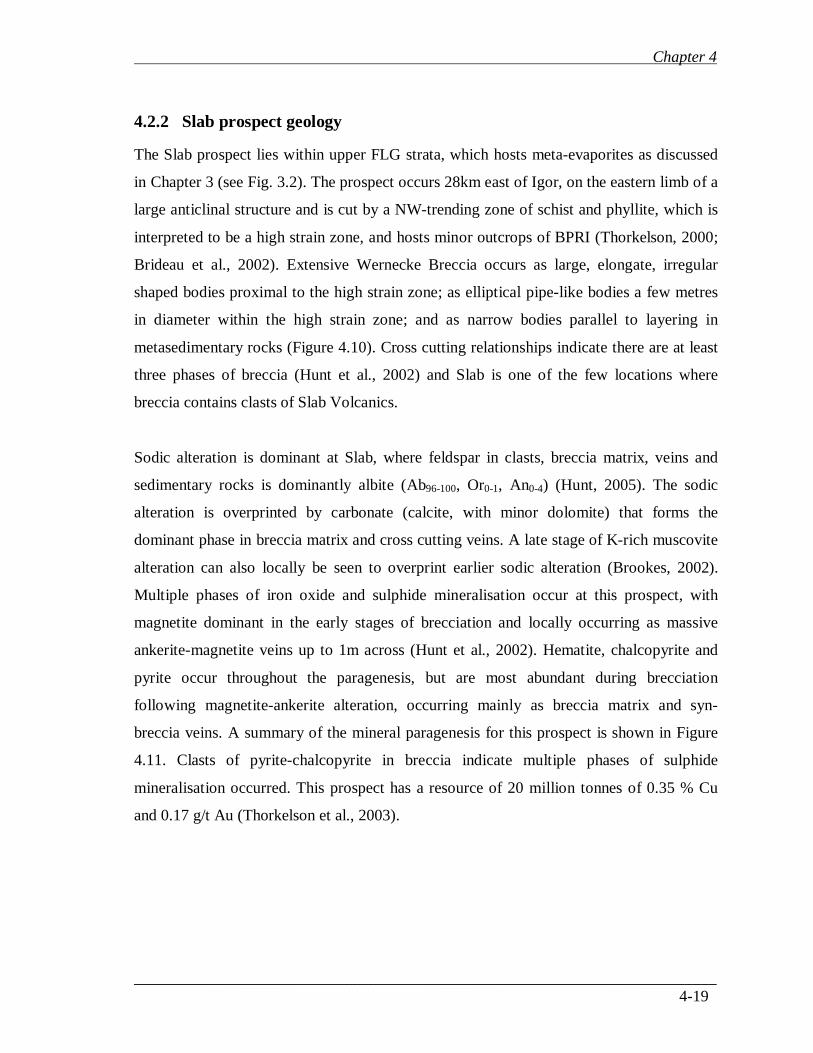
Brideau et al., 2002). Extensive Wernecke Breccia occurs as large, elongate, irregular
shaped bodies proximal to the high strain zone; as elliptical pipe-like bodies a few metres
in diameter within the high strain zone; and as narrow bodies parallel to layering in
metasedimentary rocks (Figure 4.10). Cross cutting relationships indicate there are at least
three phases of breccia (Hunt et al., 2002) and Slab is one of the few locations where
breccia contains clasts of Slab Volcanics.
Sodic alteration is dominant at Slab, where feldspar in clasts, breccia matrix, veins and
sedimentary rocks is dominantly albite (Ab96-100, Or0-1, An0-4) (Hunt, 2005). The sodic
alteration is overprinted by carbonate (calcite, with minor dolomite) that forms the
dominant phase in breccia matrix and cross cutting veins. A late stage of K-rich muscovite
alteration can also locally be seen to overprint earlier sodic alteration (Brookes, 2002).
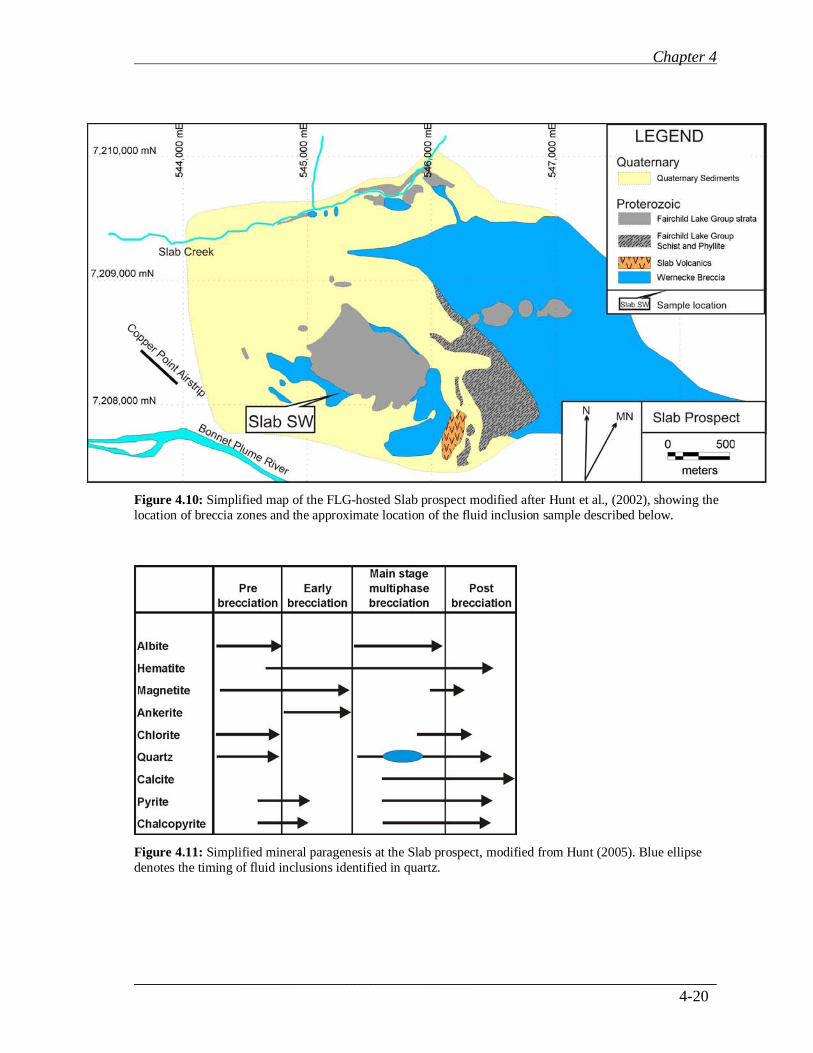
Multiple phases of iron oxide and sulphide mineralisation occur at this prospect, with
magnetite dominant in the early stages of brecciation and locally occurring as massive
ankerite-magnetite veins up to 1m across (Hunt et al., 2002). Hematite, chalcopyrite and
pyrite occur throughout the paragenesis, but are most abundant during brecciation
following magnetite-ankerite alteration, occurring mainly as breccia matrix and syn-
breccia veins. A summary of the mineral paragenesis for this prospect is shown in Figure
4.11. Clasts of pyrite-chalcopyrite in breccia indicate multiple phases of sulphide
mineralisation occurred. This prospect has a resource of 20 million tonnes of 0.35 % Cu
and 0.17 g/t Au (Thorkelson et al., 2003).
Chapter 4
_________________________________________________________________________
4-20
Figure 4.10: Simplified map of the FLG-hosted Slab prospect modified after Hunt et al., (2002), showing the
location of breccia zones and the approximate location of the fluid inclusion sample described below.
Figure 4.11: Simplified mineral paragenesis at the Slab prospect, modified from Hunt (2005). Blue ellipse
denotes the timing of fluid inclusions identified in quartz.
Chapter 4
_________________________________________________________________________
4-21
4.2.3 Slab samples and fluid inclusions
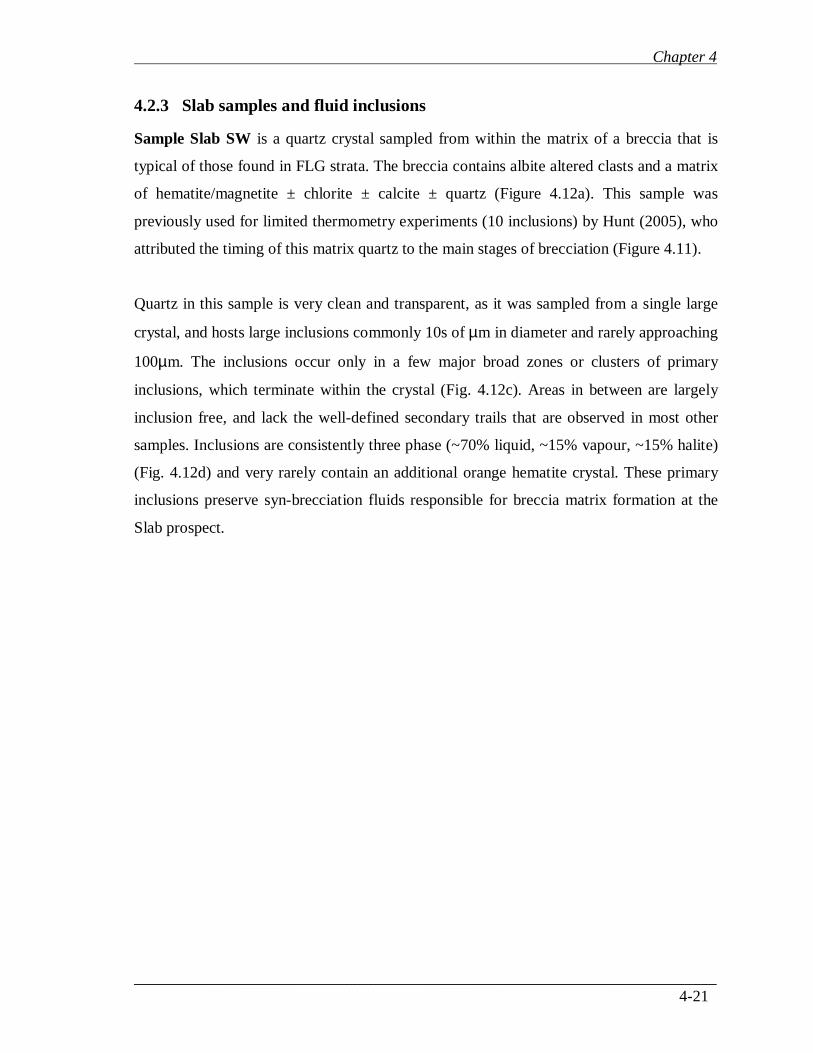
Sample Slab SW is a quartz crystal sampled from within the matrix of a breccia that is
typical of those found in FLG strata. The breccia contains albite altered clasts and a matrix
of hematite/magnetite ± chlorite ± calcite ± quartz (Figure 4.12a). This sample was
previously used for limited thermometry experiments (10 inclusions) by Hunt (2005), who
attributed the timing of this matrix quartz to the main stages of brecciation (Figure 4.11).
Quartz in this sample is very clean and transparent, as it was sampled from a single large
crystal, and hosts large inclusions commonly 10s of µm in diameter and rarely approaching
100µm. The inclusions occur only in a few major broad zones or clusters of primary
inclusions, which terminate within the crystal (Fig. 4.12c). Areas in between are largely
inclusion free, and lack the well-defined secondary trails that are observed in most other
samples. Inclusions are consistently three phase (~70% liquid, ~15% vapour, ~15% halite)
(Fig. 4.12d) and very rarely contain an additional orange hematite crystal. These primary
inclusions preserve syn-brecciation fluids responsible for breccia matrix formation at the
Slab prospect.
Chapter 4
_________________________________________________________________________
4-22
Figure 4.12: a) Albite-altered breccia from Slab, in which quartz locally formed the matrix; b) quartz crystal
collected from within breccia matrix; c) broad zone of large, primary LVH inclusions in quartz; d) large LVH
inclusion.
Chapter 4
_________________________________________________________________________
4-23
4.2.4 Olympic prospect geology
Located approximately 15km southeast of Slab (Fig. 3.3), the Olympic prospect occurs in
the upper part of the WSG and is underlain by GLG dolostone and BPRI. Wernecke
Breccia occurs as irregular shaped bodies of intraformational dolostone breccia that locally
contain abundant clasts of BPRI anorthosite. Sparse clasts of earlier breccia indicate that
multiple phases of brecciation have occurred. Potassic alteration is dominant at Olympic,
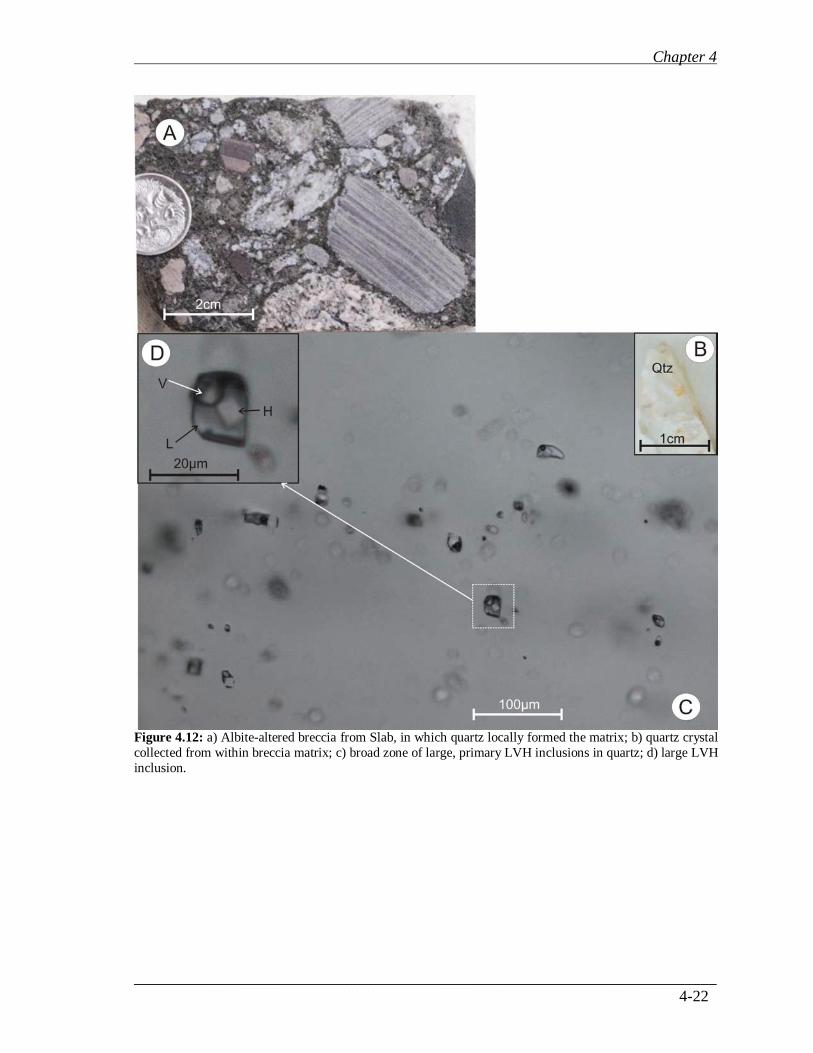
where feldspar is dominantly orthoclase (Or88-100, Ab0-9, An0-6) (Hunt, 2005). Dolomite and
ankerite form the majority of the overprinting carbonate phase which dominates the breccia
matrix and cross cutting veins (paragenesis summarised in Figure 4.13). IOCG
mineralisation at Olympic is low grade and not abundant; the best reported intersection is
11m of 1593 ppm Cu, 40 ppm Co and 23 ppb Au (Caulfield, 1994). The observed
mineralisation consists of chalcopyrite and pyrite on fractures at siltstone-breccia contacts,
euhedral pyrite + chalcopyrite in ankerite-quartz veins cutting crackle brecciated siltstone,
and sparse chalcopyrite porphyroblasts that overprint breccia matrix and clasts.
Figure 4.13: Simplified mineral paragenesis at the Olympic prospect, modified from Hunt (2005). Blue
ellipse denotes the timing of fluid inclusions identified in quartz samples from this prospect.
Chapter 4
_________________________________________________________________________
4-24
4.2.5 Olympic samples and fluid inclusions
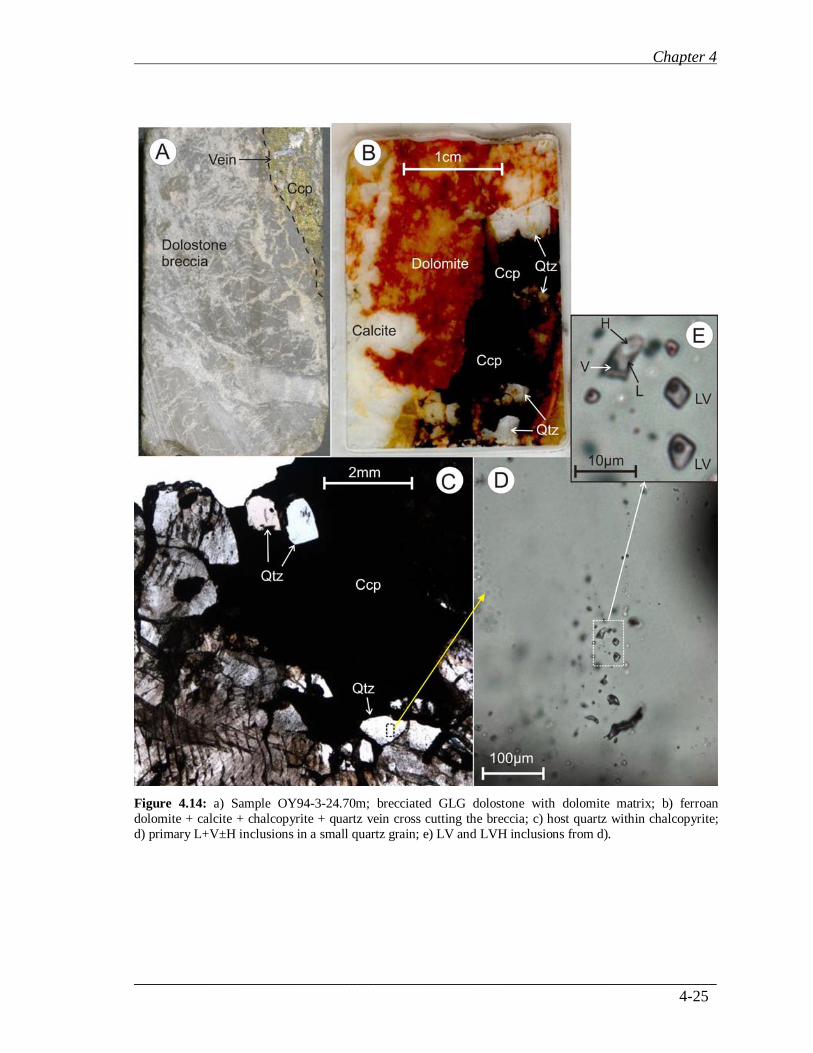
Sample OY94-3-24.70m features a vein cross cutting brecciated GLG dolostone with a
dolomite matrix (Figure 4.14a). The vein is composed of ferroan dolomite, calcite,
chalcopyrite, and quartz (Fig. 4.14b). The calcite occurs as a smaller vein cross cutting the
dolomite. Hunt (2005) previously performed thermometry experiments on 11 inclusions in
this sample, and suggested the dolomite formed in one of the latest paragenetic stages (Fig.
4.13), and quartz and chalcopyrite formed as post-dolomite infill (Fig. 4.14c). Rare tiny
(<1mm) late stage pyrite blebs also overprint the orange dolomite.
Small clusters of fluid inclusions occur isolated within small (<3mm) grains of late-formed
quartz and have been classified as primary (Fig. 4.14c and d). These inclusions are two and
three phase (70-85% liquid, 15% vapour, ±15% halite) and up to 15µm in diameter (Fig.
4.14e). Preserved fluids post-date the main stage of brecciation at the Olympic prospect,
and may represent later fluids than those preserved in other samples given that Hunt (2005)
classified this vein as having formed relatively late in the paragenesis of the Olympic
prospect. The close association of quartz with sulphides in this sample suggests that fluids
preserved in primary inclusions may represent mineralising fluids.
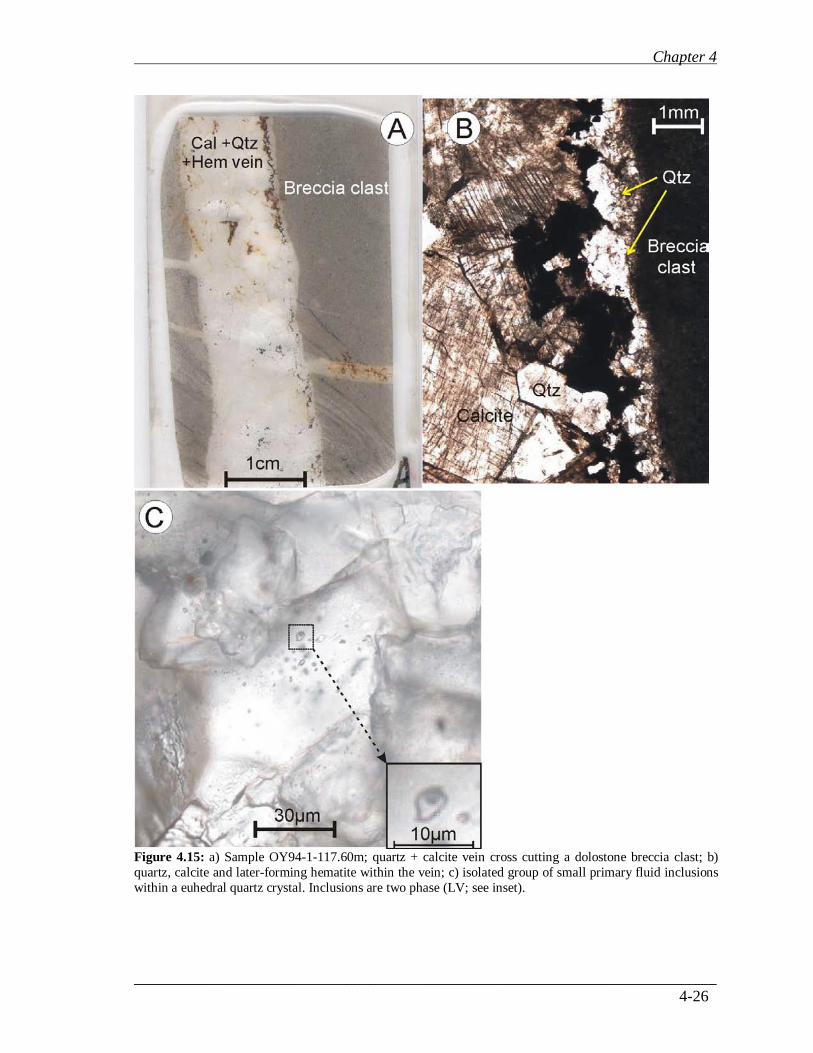
Sample OY94-1-117.60mA represents a clast from brecciated dolostone. Small calcite +
quartz veins (1-3mm) cross cut the breccia clast, and a larger quartz + calcite vein cross
cuts the breccia and earlier veins (Figure 4.15a). Quartz lines the outer margins of the vein,
representing an early stage of vein growth (Fig. 4.15b). Calcite has subsequently infilled
the centre of the vein and hematite has grown along fractures and particularly along the
quartz-calcite boundary. This cross cutting vein postdates the main stages of brecciation
(Figure 4.13).
Primary inclusions occur in isolated zones within euhedral quartz crystals (Fig. 4.15c).
These inclusions are small, two phase inclusions (80% liquid, 20% vapour), smaller than
5µm in diameter. Primary inclusions represent post-breccia fluids trapped during formation
of the vein.
Chapter 4
_________________________________________________________________________
4-25
Figure 4.14: a) Sample OY94-3-24.70m; brecciated GLG dolostone with dolomite matrix; b) ferroan
dolomite + calcite + chalcopyrite + quartz vein cross cutting the breccia; c) host quartz within chalcopyrite;
d) primary L+V±H inclusions in a small quartz grain; e) LV and LVH inclusions from d).
Chapter 4
_________________________________________________________________________
4-26
Figure 4.15: a) Sample OY94-1-117.60m; quartz + calcite vein cross cutting a dolostone breccia clast; b)
quartz, calcite and later-forming hematite within the vein; c) isolated group of small primary fluid inclusions
within a euhedral quartz crystal. Inclusions are two phase (LV; see inset).
Chapter 4
_________________________________________________________________________
4-27
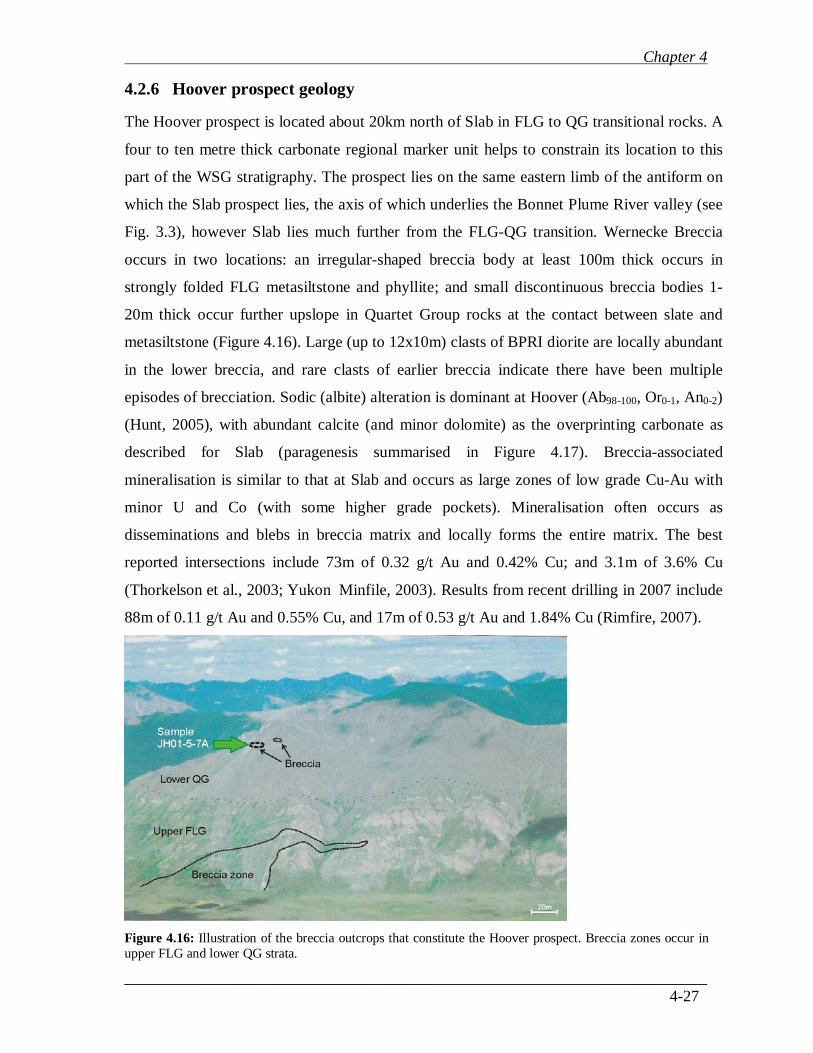
4.2.6 Hoover prospect geology
The Hoover prospect is located about 20km north of Slab in FLG to QG transitional rocks. A
four to ten metre thick carbonate regional marker unit helps to constrain its location to this
part of the WSG stratigraphy. The prospect lies on the same eastern limb of the antiform on
which the Slab prospect lies, the axis of which underlies the Bonnet Plume River valley (see
Fig. 3.3), however Slab lies much further from the FLG-QG transition. Wernecke Breccia
occurs in two locations: an irregular-shaped breccia body at least 100m thick occurs in
strongly folded FLG metasiltstone and phyllite; and small discontinuous breccia bodies 1-
20m thick occur further upslope in Quartet Group rocks at the contact between slate and
metasiltstone (Figure 4.16). Large (up to 12x10m) clasts of BPRI diorite are locally abundant
in the lower breccia, and rare clasts of earlier breccia indicate there have been multiple
episodes of brecciation. Sodic (albite) alteration is dominant at Hoover (Ab98-100, Or0-1, An0-2)
(Hunt, 2005), with abundant calcite (and minor dolomite) as the overprinting carbonate as
described for Slab (paragenesis summarised in Figure 4.17). Breccia-associated
mineralisation is similar to that at Slab and occurs as large zones of low grade Cu-Au with
minor U and Co (with some higher grade pockets). Mineralisation often occurs as
disseminations and blebs in breccia matrix and locally forms the entire matrix. The best
reported intersections include 73m of 0.32 g/t Au and 0.42% Cu; and 3.1m of 3.6% Cu
(Thorkelson et al., 2003; Yukon_Minfile, 2003). Results from recent drilling in 2007 include
88m of 0.11 g/t Au and 0.55% Cu, and 17m of 0.53 g/t Au and 1.84% Cu (Rimfire, 2007).
Figure 4.16: Illustration of the breccia outcrops that constitute the Hoover prospect. Breccia zones occur in
upper FLG and lower QG strata.

Chapter 4
_________________________________________________________________________
4-28
Figure 4.17: Simplified mineral paragenesis at the Hoover prospect, modified from Hunt (2005). Blue
ellipses denote the timing of fluids in quartz samples described in this section. A=JH01-5-7A, B=JH01-8-2.
4.2.7 Hoover samples and fluid inclusions
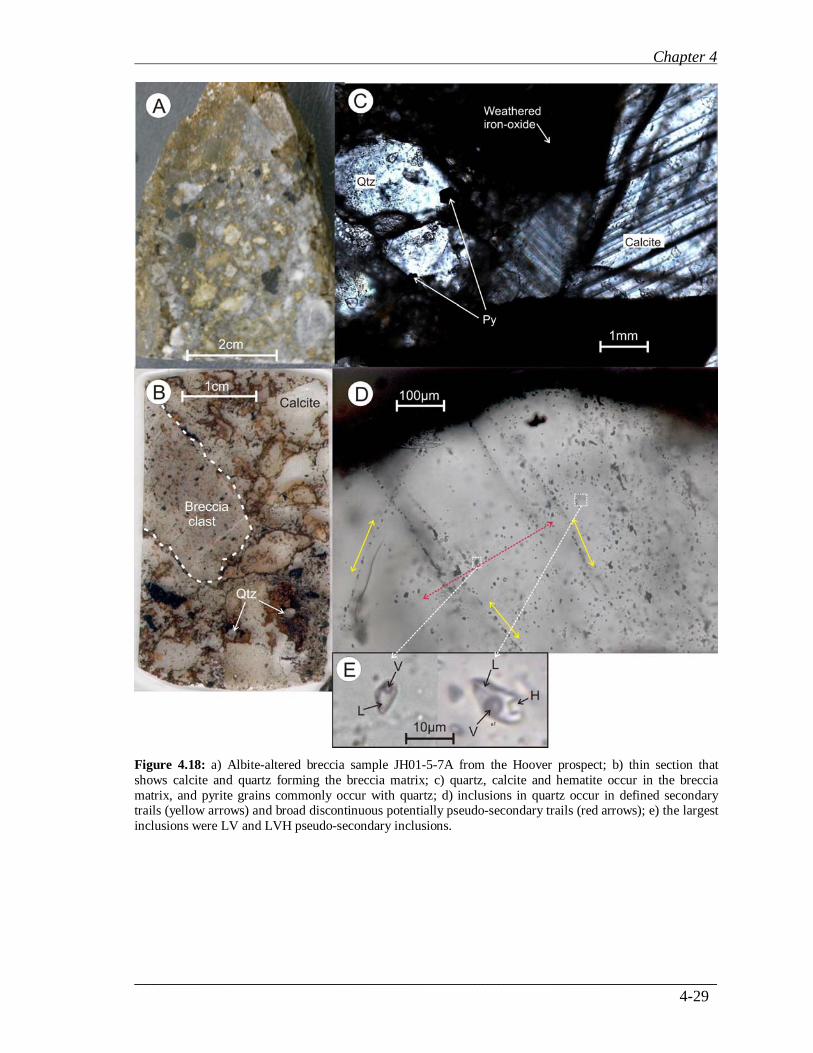
Sample JH01-5-7A was collected from within a small breccia outcrop in the Quartet
Group, just above the contact with the Fairchild Lake Group (see Figure 4.16). It is a clast
supported breccia with lithic (siltstone) albite altered clasts (up to 2cm) (Figure 4.18a). The
matrix, is dominated by quartz, specular hematite (locally weathered) and minor calcite,
and formed during the main brecciation stage (Figure 4.17) (Fig. 4.18b & c). Abundant
small (<1mm), commonly euhedral pyrite grains occur along the main fractures within the
breccia and throughout the matrix (Fig. 4.18c). This sample was previously part of the
study of Hunt (2005), who performed thermometry on 8 fluid inclusions in quartz.
Small fluid inclusions are present in defined trails, broader pseudo-secondary trails and
with random distributions in quartz (Fig. 4.18d). Those in secondary trails appeared to be
mostly two phase (LV) however their small size (<5µm) prevented confident identification
of fluid inclusion types. Three phase and rare two phase (liquid 60-85%, vapour 15-25% ±
halite 15%) inclusions up to 10µm in diameter (Fig. 4.18e) were identified in broad, non-
continuous potentially pseudo-secondary trails occurring separate from the distinct
secondary trails. Pseudo-secondary inclusions represent syn-brecciation fluids that were
responsible for breccia matrix formation (Figure 4.17).
Chapter 4
_________________________________________________________________________
4-29
Figure 4.18: a) Albite-altered breccia sample JH01-5-7A from the Hoover prospect; b) thin section that
shows calcite and quartz forming the breccia matrix; c) quartz, calcite and hematite occur in the breccia
matrix, and pyrite grains commonly occur with quartz; d) inclusions in quartz occur in defined secondary trails (yellow arrows) and broad discontinuous potentially pseudo-secondary trails (red arrows); e) the largest
inclusions were LV and LVH pseudo-secondary inclusions.
Chapter 4
_________________________________________________________________________
4-30
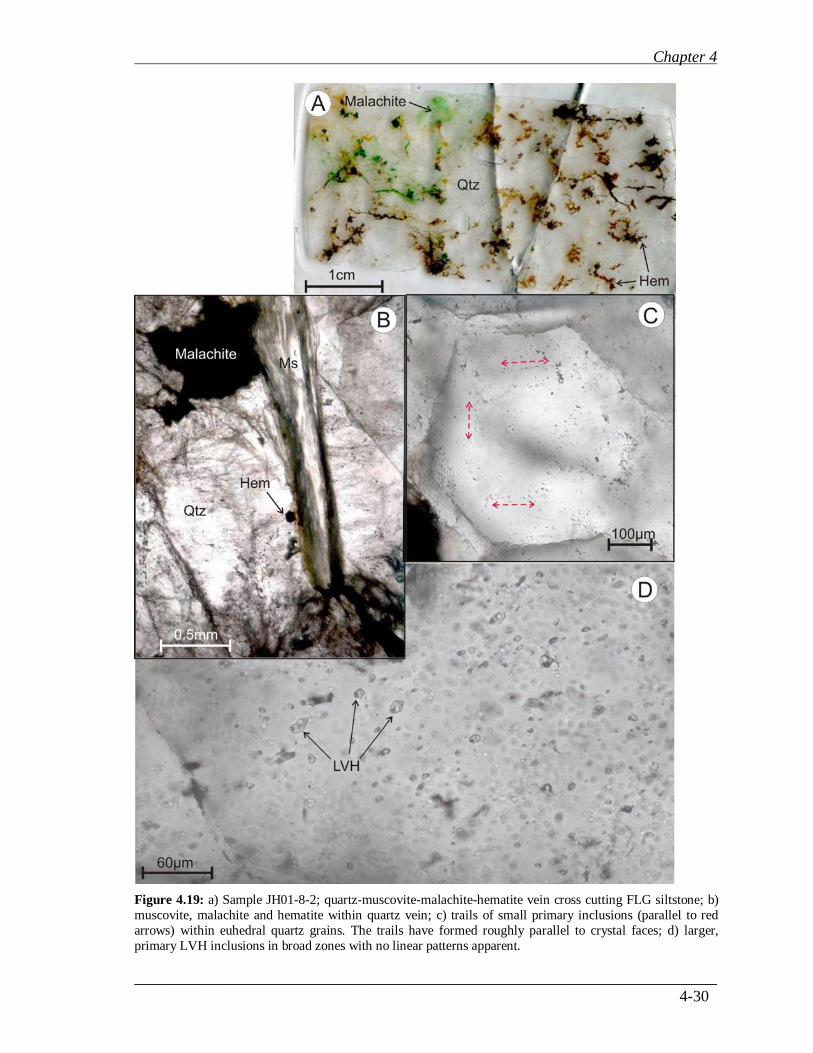
Figure 4.19: a) Sample JH01-8-2; quartz-muscovite-malachite-hematite vein cross cutting FLG siltstone; b)
muscovite, malachite and hematite within quartz vein; c) trails of small primary inclusions (parallel to red
arrows) within euhedral quartz grains. The trails have formed roughly parallel to crystal faces; d) larger,
primary LVH inclusions in broad zones with no linear patterns apparent.
Chapter 4
_________________________________________________________________________
4-31
Sample JH01-8-2 is part of a quartz-muscovite-malachite-hematite vein about 0.5m thick
cutting siltstone of the Fairchild Lake Group (Figure 4.19a) (from the collection of Julie
Hunt). It is composed mostly of quartz which forms abundant (sometimes zoned) euhedral
grains. Occasional muscovite grains have grown within the quartz, and green malachite is
locally abundant, while dark hematite blebs are abundant throughout (Fig. 4.19b).
Hematite formed syn- to post-quartz, while malachite formed later as a product of
weathering of chalcopyrite. While no chalcopyrite is present in this sample, malachite is
invariably associated with chalcopyrite in the field.
Small three phase (L+V+H) inclusions (<5µm) occur within euhedral quartz grains, and
commonly form primary trails parallel to crystal faces (Fig. 4.19c). Larger potentially
primary three phase inclusions (70% liquid, 10% vapour, 20% halite) up to 10µm in
diameter occur in broad groups with no linear patterns (Fig. 4.19d), and rarely contain an
additional orange hematite crystal. Continuous secondary inclusion trails are rare in this
sample. Primary inclusions represent vein-forming fluids, however their timing with
respect to brecciation at this prospect is uncertain, and may be syn- to post-brecciation
(Figure 4.17).
4.2.8 Slats-Frosty prospect geology
Slats-Frosty is located about 15km west of Slab and is underlain by the FLG, which is also
cut by abundant BPRI dykes in this area (Hunt, 2005) (Fig. 3.3). While the stratigraphic
setting is not as well constrained, the prospect is located on the east side of a large
northeast trending overturned antiform, and (similar to Hoover) lies close to the FLG-QG
transition. Breccia occurs as numerous discontinuous narrow bands up to 1.5m thick
emplaced parallel to layering in the FLG, and less commonly as narrow zones parallel to
prominent jointing. Potassic (orthoclase) alteration is abundant (Or94-99, Ab0-6, An0-1)
(Hunt, 2005), and dolomite and ankerite compose the major overprinting carbonates
(Figure 4.20). Copper ± gold ± cobalt mineralisation is widely distributed and low grade,
with sporadic higher grade occurrences (Thorkelson et al., (2003) reported a grab sample
with 1380 ppb Au and 9650 ppm Cu). Chalcopyrite occurs as disseminations in breccia
and in veins and fractures. Pods and veins of massive hematite or massive magnetite-
coarsely crystalline hematite-ankerite-quartz of up to 2x4m occur locally in breccia zones.
Chapter 4
_________________________________________________________________________
4-32
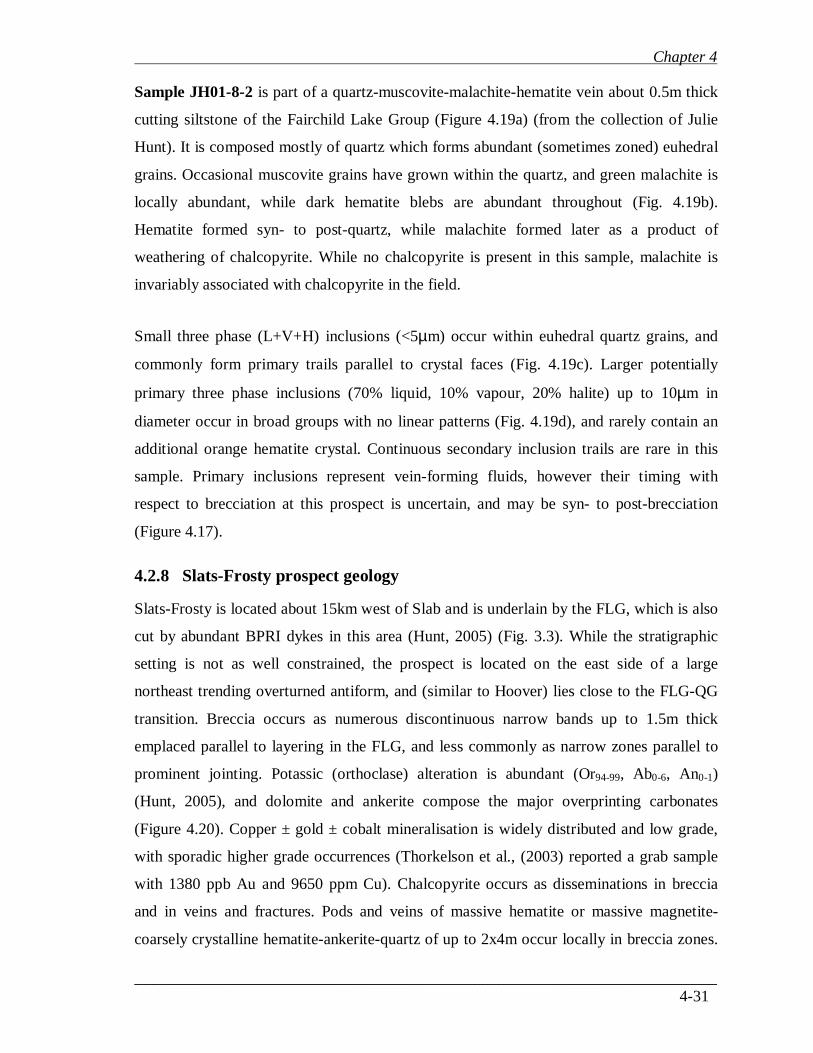
Figure 4.20: Simplified mineral paragenesis at the Slats-Frosty prospect, modified from Hunt (2005). Blue
ellipses denote the timing of fluids in fluorite and dolomite samples described in this section.
4.2.9 Slats-Frosty samples and fluid inclusions
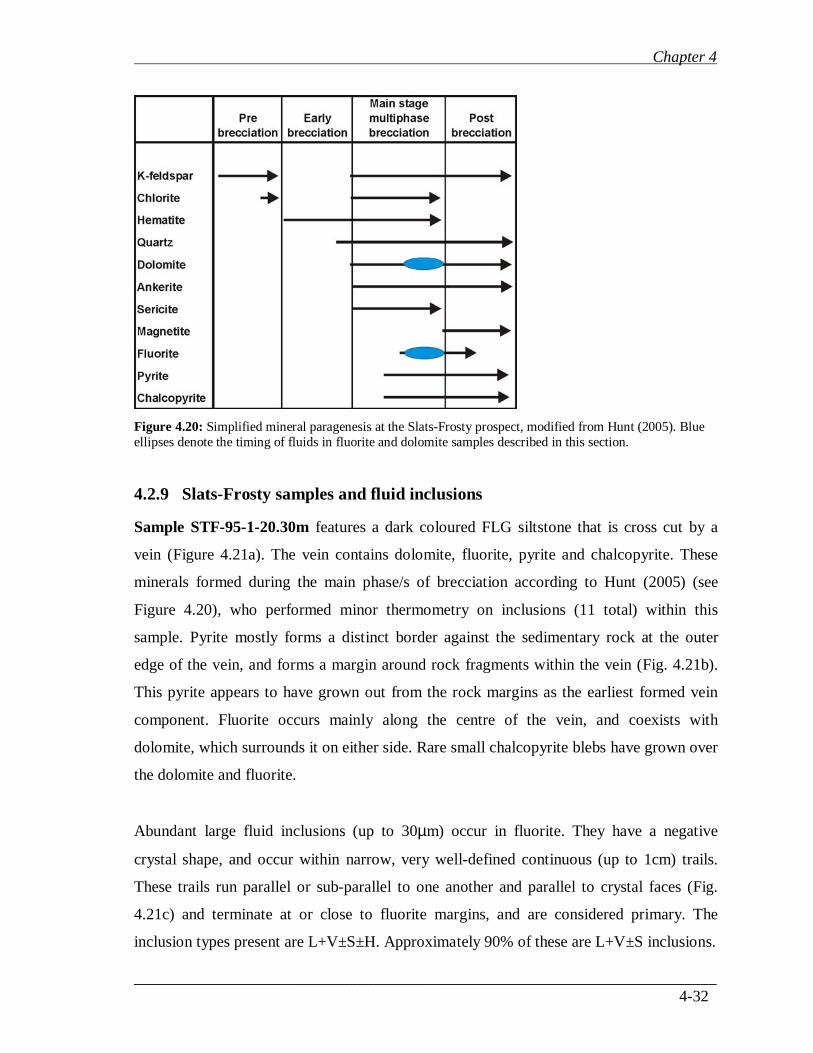
Sample STF-95-1-20.30m features a dark coloured FLG siltstone that is cross cut by a
vein (Figure 4.21a). The vein contains dolomite, fluorite, pyrite and chalcopyrite. These
minerals formed during the main phase/s of brecciation according to Hunt (2005) (see
Figure 4.20), who performed minor thermometry on inclusions (11 total) within this
sample. Pyrite mostly forms a distinct border against the sedimentary rock at the outer
edge of the vein, and forms a margin around rock fragments within the vein (Fig. 4.21b).
This pyrite appears to have grown out from the rock margins as the earliest formed vein
component. Fluorite occurs mainly along the centre of the vein, and coexists with
dolomite, which surrounds it on either side. Rare small chalcopyrite blebs have grown over
the dolomite and fluorite.
Abundant large fluid inclusions (up to 30µm) occur in fluorite. They have a negative
crystal shape, and occur within narrow, very well-defined continuous (up to 1cm) trails.
These trails run parallel or sub-parallel to one another and parallel to crystal faces (Fig.
4.21c) and terminate at or close to fluorite margins, and are considered primary. The
inclusion types present are L+V±S±H. Approximately 90% of these are L+V±S inclusions.
Chapter 4
_________________________________________________________________________
4-33
Figure 4.21: a) Sample STF95-1-20.30m; vein in dark FLG siltstone; b) fluorite, dolomite, and pyrite within
the vein; c) primary inclusion trails in fluorite. Trails are parallel to each other and to fluorite crystal faces; d)
L+V+carbonate inclusion in fluorite; e) L+V+H+carbonate inclusion; f) randomly distributed single phase
liquid inclusions in dolomite.
Around half of these are two phase (liquid 90-95%, vapour 5-10%) however many
inclusions contain a small (<1% by volume) solid phase which could not be identified
petrographically (Fig. 4.21d). This carbonate phase is present as a very consistent
proportion of inclusion volume (consistent size). Around 10% of inclusions contained
L+V+H±S (liquid ~70%, vapour 15%, halite 15%, carbonate <2%) (Fig. 4.21e). Based on
the primary nature of fluid inclusions, and the syn-breccia timing of fluorite identified by
Hunt (2005) in multiple samples the preserved fluids represent syn-brecciation fluids that
were responsible for vein fluorite formation. Abundant, randomly distributed, probably
Chapter 4
_________________________________________________________________________
4-34
primary, single phase inclusions (L), up to 20µm in size were found in dolomite co-
existing in the same vein (Fig. 4.21f).
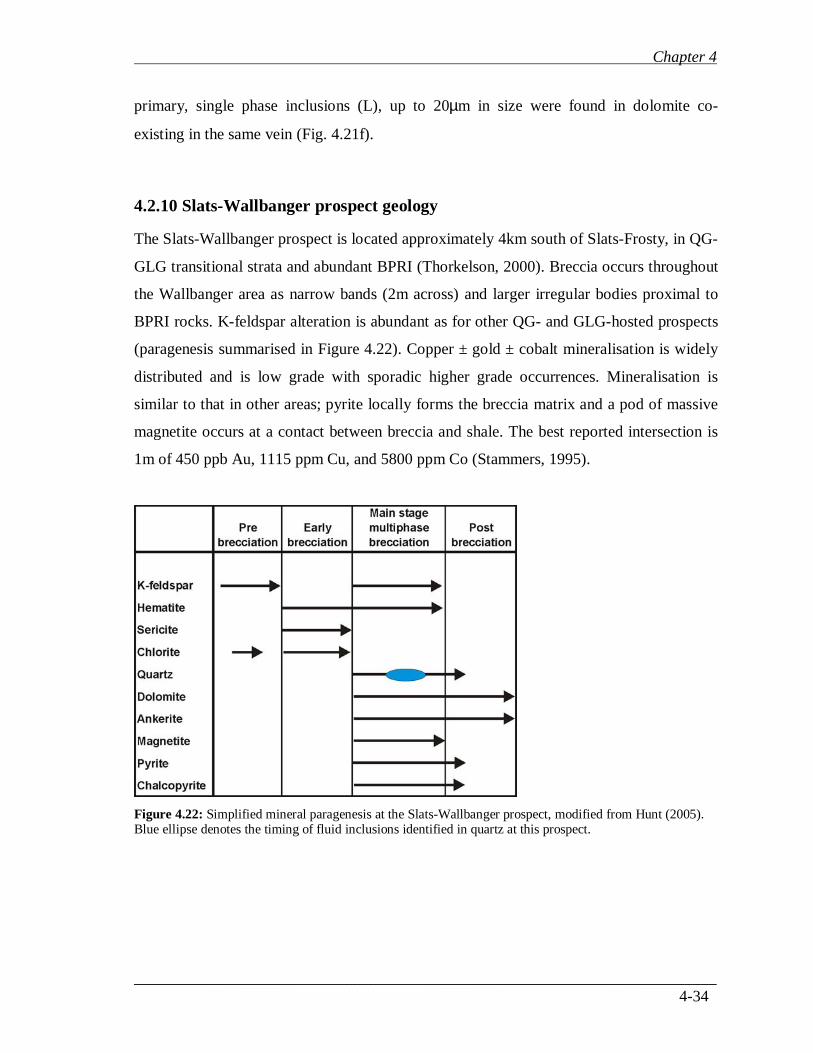
4.2.10 Slats-Wallbanger prospect geology
The Slats-Wallbanger prospect is located approximately 4km south of Slats-Frosty, in QG-
GLG transitional strata and abundant BPRI (Thorkelson, 2000). Breccia occurs throughout
the Wallbanger area as narrow bands (2m across) and larger irregular bodies proximal to
BPRI rocks. K-feldspar alteration is abundant as for other QG- and GLG-hosted prospects
(paragenesis summarised in Figure 4.22). Copper ± gold ± cobalt mineralisation is widely
distributed and is low grade with sporadic higher grade occurrences. Mineralisation is
similar to that in other areas; pyrite locally forms the breccia matrix and a pod of massive
magnetite occurs at a contact between breccia and shale. The best reported intersection is
1m of 450 ppb Au, 1115 ppm Cu, and 5800 ppm Co (Stammers, 1995).
Figure 4.22: Simplified mineral paragenesis at the Slats-Wallbanger prospect, modified from Hunt (2005). Blue ellipse denotes the timing of fluid inclusions identified in quartz at this prospect.
Chapter 4
_________________________________________________________________________
4-35
4.2.11 Slats-Wallbanger samples and fluid inclusions
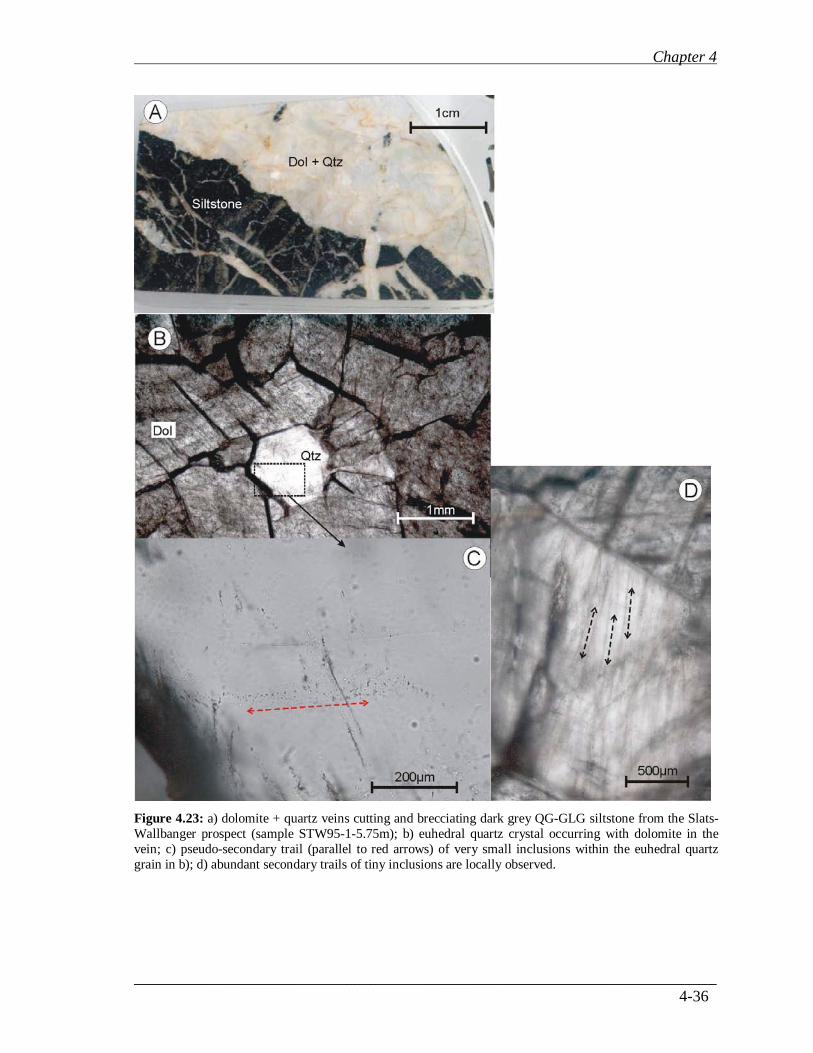
Sample STW-95-1-5.75m contains dolomite + quartz ± chalcopyrite veins cutting and
brecciating dark grey siltstone in QG-GLG transitional strata, with angular rock fragments
occurring in and around the vein (Figure 4.23a) (sample from the collection of Julie Hunt).
The vein formed during the main stages of breccia formation (Figure 4.22) and its
mineralogy is equivalent to breccia matrix elsewhere at this prospect.
Very small (<5µm) inclusions occur in non-continuous pseudo-secondary trails contained
within euhedral quartz grains (Fig. 4.22b & c). Most inclusions are two phase L+V, and
less commonly halite bearing. Abundant narrow secondary trails containing tiny (<3µm)
inclusions are also locally observed (Fig. 4.22d). The pseudo-secondary inclusions contain
syn-brecciation fluids which were trapped in this sample during vein formation.
Chapter 4
_________________________________________________________________________
4-36
Figure 4.23: a) dolomite + quartz veins cutting and brecciating dark grey QG-GLG siltstone from the Slats-
Wallbanger prospect (sample STW95-1-5.75m); b) euhedral quartz crystal occurring with dolomite in the
vein; c) pseudo-secondary trail (parallel to red arrows) of very small inclusions within the euhedral quartz
grain in b); d) abundant secondary trails of tiny inclusions are locally observed.
Chapter 4
_________________________________________________________________________
4-37
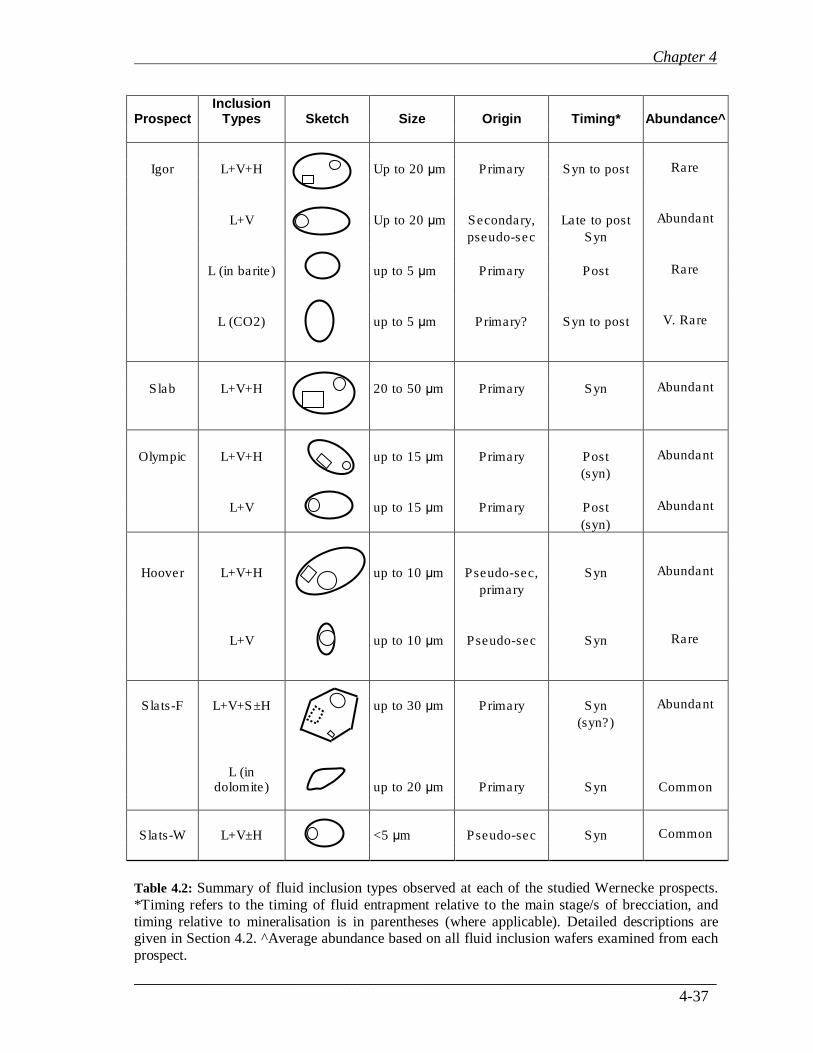
Table 4.2: Summary of fluid inclusion types observed at each of the studied Wernecke prospects.
*Timing refers to the timing of fluid entrapment relative to the main stage/s of brecciation, and
timing relative to mineralisation is in parentheses (where applicable). Detailed descriptions are given in Section 4.2. ^Average abundance based on all fluid inclusion wafers examined from each
prospect.
Prospect Inclusion
Types Sketch Size Origin Timing*
Abundance^
Igor L+V+H Up to 20 µm Primary Syn to post Rare
L+V Up to 20 µm Secondary, Late to post Abundant
pseudo-sec Syn
L (in barite) up to 5 µm Primary Post Rare
L (CO2) up to 5 µm Primary? Syn to post V. Rare
Slab L+V+H 20 to 50 µm Primary Syn Abundant
Olympic L+V+H up to 15 µm Primary Post Abundant
(syn)
L+V up to 15 µm Primary Post Abundant
(syn)
Hoover L+V+H up to 10 µm Pseudo-sec, Syn Abundant
primary
L+V up to 10 µm Pseudo-sec Syn Rare
Slats-F L+V+S±H up to 30 µm Primary Syn Abundant
(syn?)
L (in
dolomite) up to 20 µm Primary Syn
Common
Slats-W L+V±H <5 µm Pseudo-sec Syn Common
Chapter 4
_________________________________________________________________________
4-38
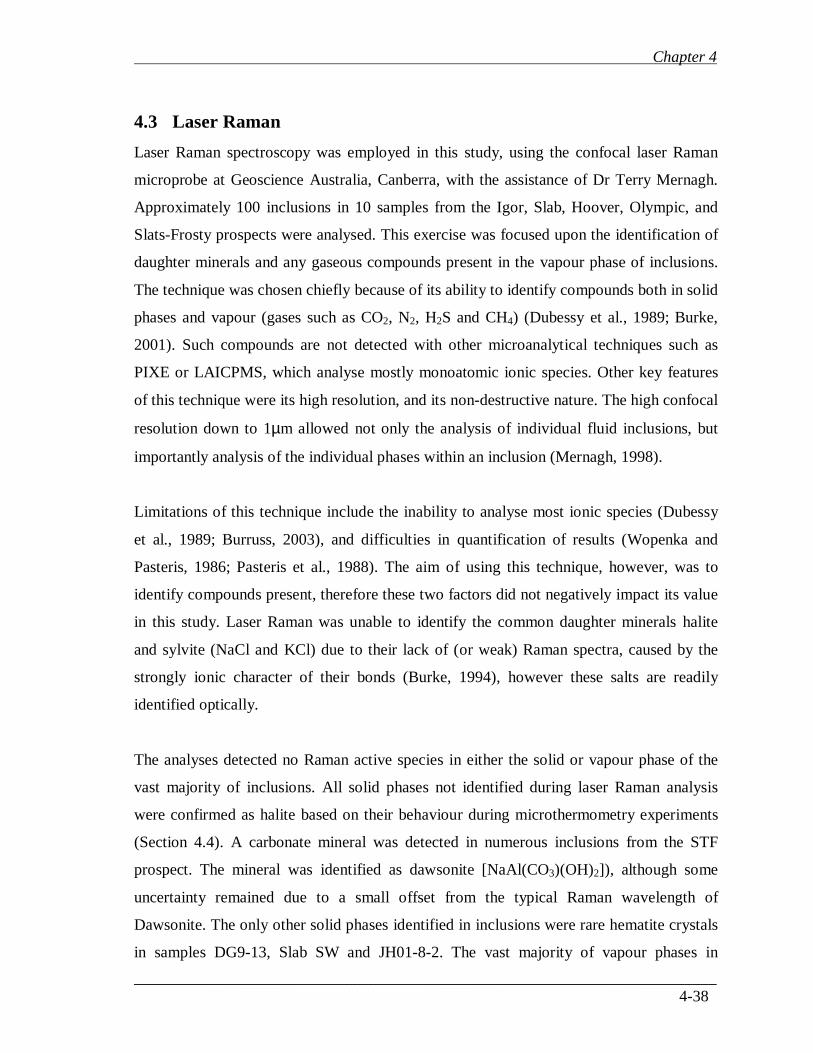
4.3 Laser Raman
Laser Raman spectroscopy was employed in this study, using the confocal laser Raman
microprobe at Geoscience Australia, Canberra, with the assistance of Dr Terry Mernagh.
Approximately 100 inclusions in 10 samples from the Igor, Slab, Hoover, Olympic, and
Slats-Frosty prospects were analysed. This exercise was focused upon the identification of
daughter minerals and any gaseous compounds present in the vapour phase of inclusions.
The technique was chosen chiefly because of its ability to identify compounds both in solid
phases and vapour (gases such as CO2, N2, H2S and CH4) (Dubessy et al., 1989; Burke,
2001). Such compounds are not detected with other microanalytical techniques such as
PIXE or LAICPMS, which analyse mostly monoatomic ionic species. Other key features
of this technique were its high resolution, and its non-destructive nature. The high confocal
resolution down to 1µm allowed not only the analysis of individual fluid inclusions, but
importantly analysis of the individual phases within an inclusion (Mernagh, 1998).
Limitations of this technique include the inability to analyse most ionic species (Dubessy
et al., 1989; Burruss, 2003), and difficulties in quantification of results (Wopenka and
Pasteris, 1986; Pasteris et al., 1988). The aim of using this technique, however, was to
identify compounds present, therefore these two factors did not negatively impact its value
in this study. Laser Raman was unable to identify the common daughter minerals halite
and sylvite (NaCl and KCl) due to their lack of (or weak) Raman spectra, caused by the
strongly ionic character of their bonds (Burke, 1994), however these salts are readily
identified optically.
The analyses detected no Raman active species in either the solid or vapour phase of the
vast majority of inclusions. All solid phases not identified during laser Raman analysis
were confirmed as halite based on their behaviour during microthermometry experiments
(Section 4.4). A carbonate mineral was detected in numerous inclusions from the STF
prospect. The mineral was identified as dawsonite [NaAl(CO3)(OH)2]), although some
uncertainty remained due to a small offset from the typical Raman wavelength of
Dawsonite. The only other solid phases identified in inclusions were rare hematite crystals
in samples DG9-13, Slab SW and JH01-8-2. The vast majority of vapour phases in
Chapter 4
_________________________________________________________________________
4-39
inclusions were void of Raman-active gases, and therefore deemed to consist of water
vapour, with a few exceptions. Six inclusions from the Igor prospect (sample DG10-1b)
were confirmed as liquid CO2, in agreement with thermometric experiments which
identified them as pure CO2 (Section 4.4). Analysis of inclusions from the Olympic
prospect (sample OY94-3-24.70mA) revealed five containing N2 in the vapour phase,
while two of these five contained a small additional component of CO2. These vapour
components were not found in inclusions from any of the other prospects. Raman spectra
are presented in Appendix E for inclusions in which Raman-active compounds were
identified.
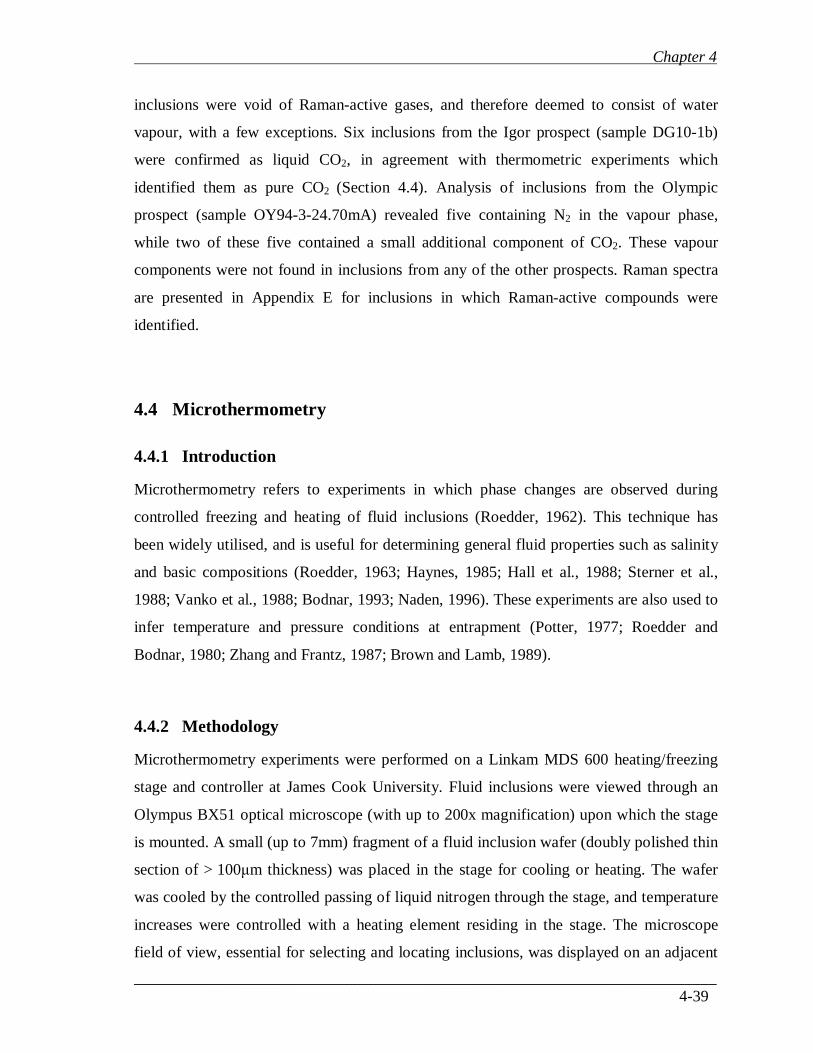
4.4 Microthermometry
4.4.1 Introduction
Microthermometry refers to experiments in which phase changes are observed during
controlled freezing and heating of fluid inclusions (Roedder, 1962). This technique has
been widely utilised, and is useful for determining general fluid properties such as salinity
and basic compositions (Roedder, 1963; Haynes, 1985; Hall et al., 1988; Sterner et al.,
1988; Vanko et al., 1988; Bodnar, 1993; Naden, 1996). These experiments are also used to
infer temperature and pressure conditions at entrapment (Potter, 1977; Roedder and
Bodnar, 1980; Zhang and Frantz, 1987; Brown and Lamb, 1989).
4.4.2 Methodology
Microthermometry experiments were performed on a Linkam MDS 600 heating/freezing
stage and controller at James Cook University. Fluid inclusions were viewed through an
Olympus BX51 optical microscope (with up to 200x magnification) upon which the stage
is mounted. A small (up to 7mm) fragment of a fluid inclusion wafer (doubly polished thin
section of > 100µm thickness) was placed in the stage for cooling or heating. The wafer
was cooled by the controlled passing of liquid nitrogen through the stage, and temperature
increases were controlled with a heating element residing in the stage. The microscope
field of view, essential for selecting and locating inclusions, was displayed on an adjacent
Chapter 4
_________________________________________________________________________
4-40
computer monitor, along with an interface for temperature control, sample movement, and
inclusion photography, run by the computer program Linksys V2.38. The stage was
calibrated by measuring synthetic inclusions containing pure H2O and H2O-CO2 with triple
points of 0.0 and -56.6 °C respectively. These calibrations allowed accuracies of ±0.2 °C to
be achieved in larger inclusions (±0.5 °C for inclusions smaller than 5µm due to decreased
visibility). Results were reproducible to ±0.2 °C for freezing experiments and ±2 °C for
homogenisation temperatures. Exceptions were Tfm (temperature of first melting) values,
which were often subject to greater uncertainties due to the difficulties of observing small
amounts of antarcticite melting in small inclusions; and homogenisation temperatures
which in some cases were not reproducible due to stretching of inclusions.
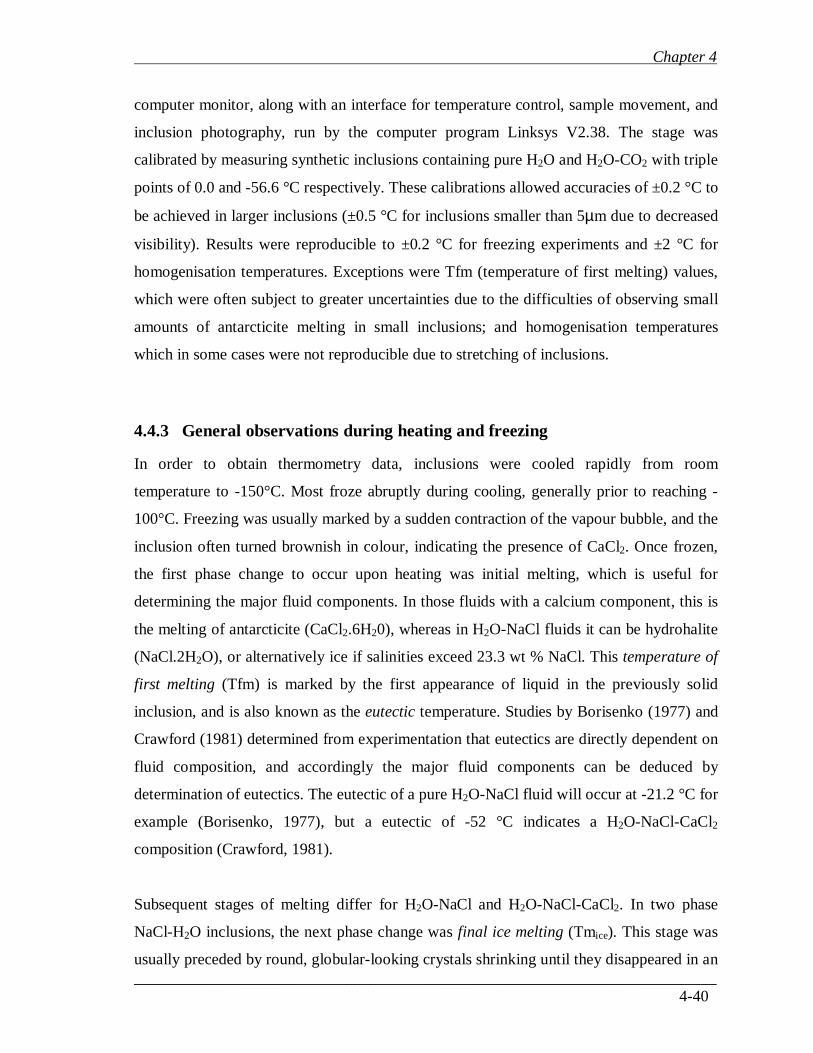
4.4.3 General observations during heating and freezing
In order to obtain thermometry data, inclusions were cooled rapidly from room
temperature to -150°C. Most froze abruptly during cooling, generally prior to reaching -
100°C. Freezing was usually marked by a sudden contraction of the vapour bubble, and the
inclusion often turned brownish in colour, indicating the presence of CaCl2. Once frozen,
the first phase change to occur upon heating was initial melting, which is useful for
determining the major fluid components. In those fluids with a calcium component, this is
the melting of antarcticite (CaCl2.6H20), whereas in H2O-NaCl fluids it can be hydrohalite
(NaCl.2H2O), or alternatively ice if salinities exceed 23.3 wt % NaCl. This temperature of
first melting (Tfm) is marked by the first appearance of liquid in the previously solid
inclusion, and is also known as the eutectic temperature. Studies by Borisenko (1977) and
Crawford (1981) determined from experimentation that eutectics are directly dependent on
fluid composition, and accordingly the major fluid components can be deduced by
determination of eutectics. The eutectic of a pure H2O-NaCl fluid will occur at -21.2 °C for
example (Borisenko, 1977), but a eutectic of -52 °C indicates a H2O-NaCl-CaCl2
composition (Crawford, 1981).
Subsequent stages of melting differ for H2O-NaCl and H2O-NaCl-CaCl2. In two phase
NaCl-H2O inclusions, the next phase change was final ice melting (Tmice). This stage was
usually preceded by round, globular-looking crystals shrinking until they disappeared in an
Chapter 4
_________________________________________________________________________
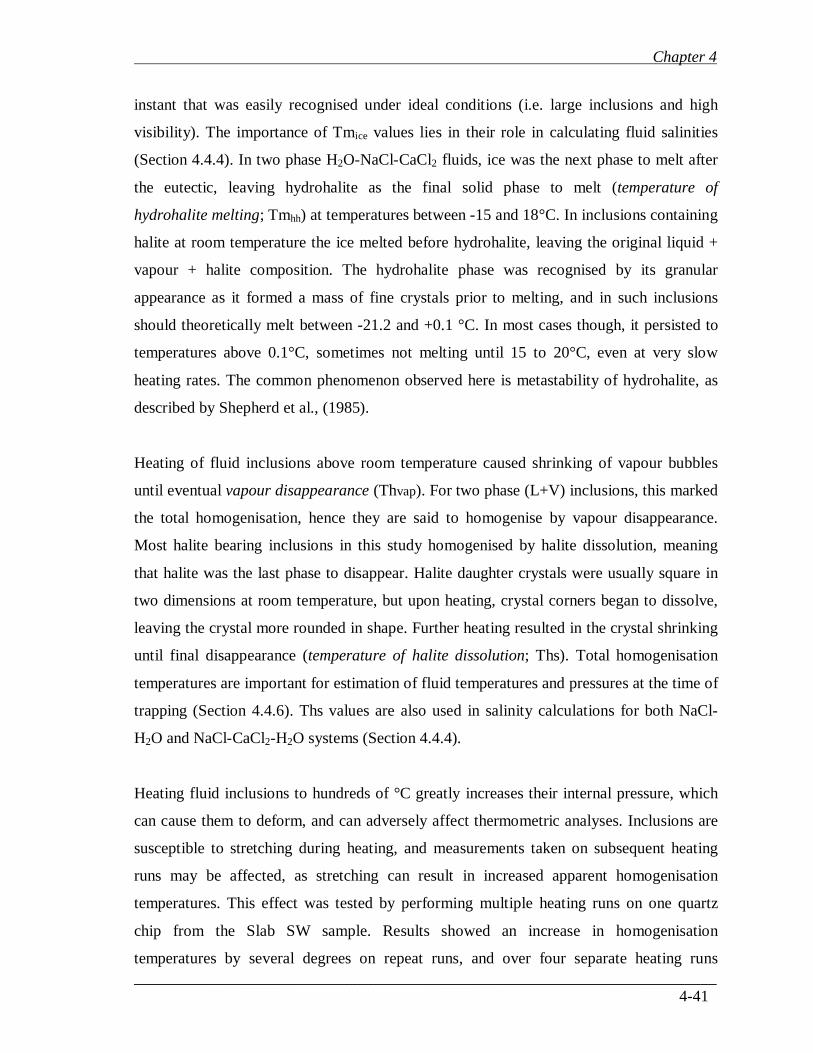
4-41
instant that was easily recognised under ideal conditions (i.e. large inclusions and high
visibility). The importance of Tmice values lies in their role in calculating fluid salinities
(Section 4.4.4). In two phase H2O-NaCl-CaCl2 fluids, ice was the next phase to melt after
the eutectic, leaving hydrohalite as the final solid phase to melt (temperature of
hydrohalite melting; Tmhh) at temperatures between -15 and 18°C. In inclusions containing
halite at room temperature the ice melted before hydrohalite, leaving the original liquid +
vapour + halite composition. The hydrohalite phase was recognised by its granular
appearance as it formed a mass of fine crystals prior to melting, and in such inclusions
should theoretically melt between -21.2 and +0.1 °C. In most cases though, it persisted to
temperatures above 0.1°C, sometimes not melting until 15 to 20°C, even at very slow
heating rates. The common phenomenon observed here is metastability of hydrohalite, as
described by Shepherd et al., (1985).
Heating of fluid inclusions above room temperature caused shrinking of vapour bubbles
until eventual vapour disappearance (Thvap). For two phase (L+V) inclusions, this marked
the total homogenisation, hence they are said to homogenise by vapour disappearance.
Most halite bearing inclusions in this study homogenised by halite dissolution, meaning
that halite was the last phase to disappear. Halite daughter crystals were usually square in
two dimensions at room temperature, but upon heating, crystal corners began to dissolve,
leaving the crystal more rounded in shape. Further heating resulted in the crystal shrinking
until final disappearance (temperature of halite dissolution; Ths). Total homogenisation
temperatures are important for estimation of fluid temperatures and pressures at the time of
trapping (Section 4.4.6). Ths values are also used in salinity calculations for both NaCl-
H2O and NaCl-CaCl2-H2O systems (Section 4.4.4).
Heating fluid inclusions to hundreds of °C greatly increases their internal pressure, which
can cause them to deform, and can adversely affect thermometric analyses. Inclusions are
susceptible to stretching during heating, and measurements taken on subsequent heating
runs may be affected, as stretching can result in increased apparent homogenisation
temperatures. This effect was tested by performing multiple heating runs on one quartz
chip from the Slab SW sample. Results showed an increase in homogenisation
temperatures by several degrees on repeat runs, and over four separate heating runs
Chapter 4
_________________________________________________________________________
4-42
homogenisation temperatures increased by up to 25°C. Inclusions can also leak and in
extreme cases they were seen to decrepitate, rendering them unusable for further analysis.
Analyses performed on fluorite and carbonate hosted inclusions were more vulnerable to
these effects than quartz-hosted inclusions. This was demonstrated by lower decrepitation
temperatures in these minerals. These effects were minimised by performing all freezing
experiments before heating, and collecting the homogenisation data in as few heating runs
as possible (i.e. collecting multiple measurements on each heating run), and heating to the
minimum temperatures necessary for homogenisation.
4.4.4 Salinity Determinations
Salinity is one of the major pieces of information gained from thermometric analyses.
There are a number of different ways in which salinity is calculated, and the appropriate
method for a given fluid inclusion depends on the apparent fluid composition or chemical
system, the phases present, and which phase changes are observed during thermometry.
Each method relies on the choice of a chemical system on which to model the fluid, (e.g.
NaCl-H2O, NaCl-CaCl2-H2O, NaCl-KCl-H2O). The chosen system is only an
approximation of fluid composition since most hydrothermal fluids have complex
compositions with multiple dissolved salts (see Chapter 5). Despite the presence of
additional salts causing deviations from the ideal behaviour described by equations, such
salinity calculations offer useful approximations that are further relied upon in fluid studies
(e.g. for PIXE and LAICPMS analysis; Chapter 5).
NaCl-H2O
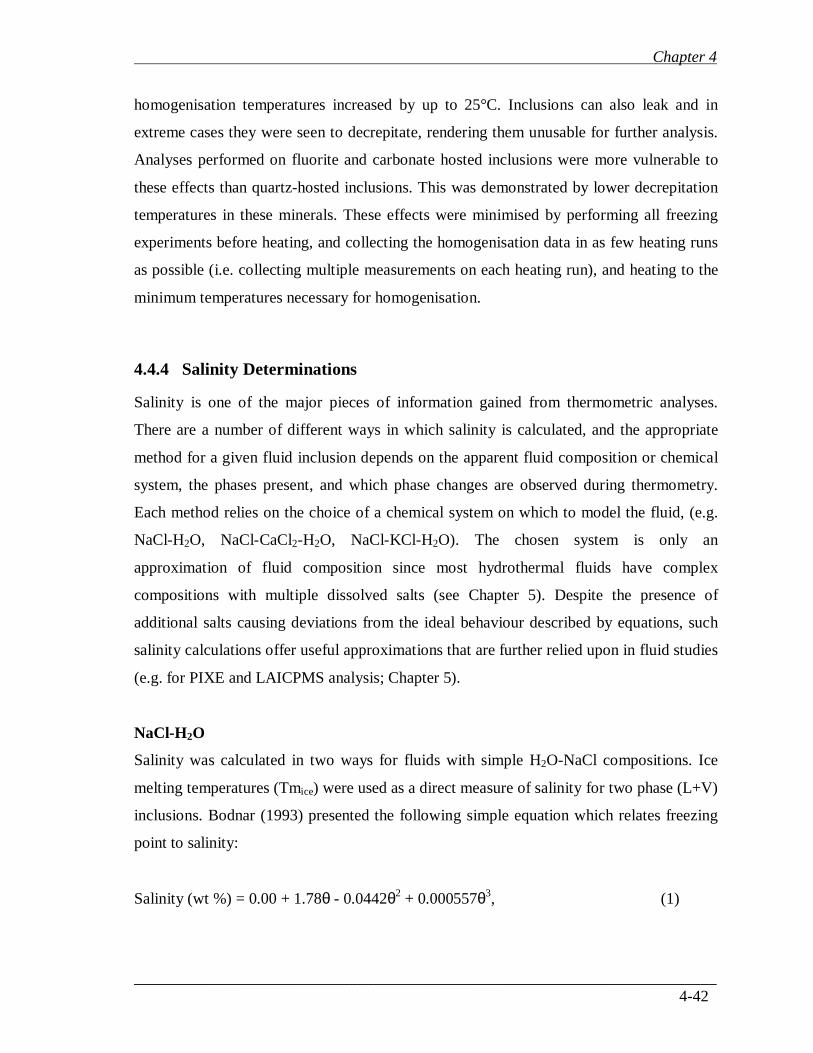
Salinity was calculated in two ways for fluids with simple H2O-NaCl compositions. Ice
melting temperatures (Tmice) were used as a direct measure of salinity for two phase (L+V)
inclusions. Bodnar (1993) presented the following simple equation which relates freezing
point to salinity:
Salinity (wt %) = 0.00 + 1.78θ - 0.0442θ2 + 0.000557θ
3, (1)
Chapter 4
_________________________________________________________________________
4-43
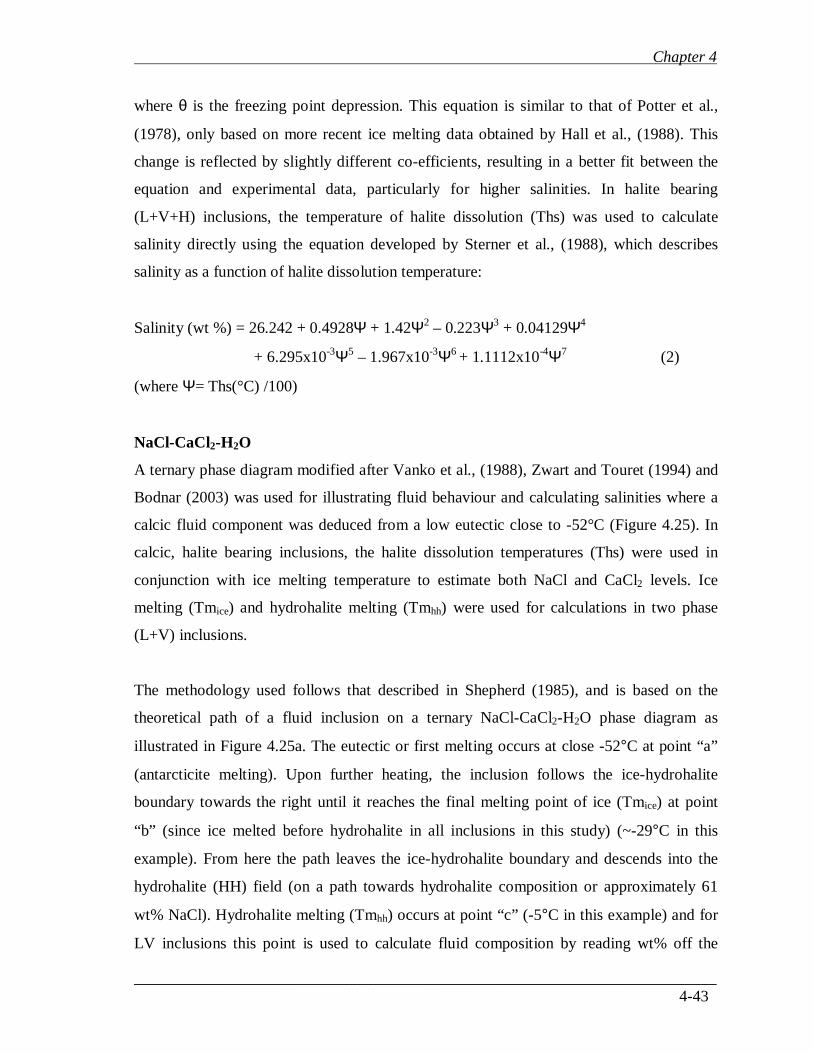
where θ is the freezing point depression. This equation is similar to that of Potter et al.,
(1978), only based on more recent ice melting data obtained by Hall et al., (1988). This
change is reflected by slightly different co-efficients, resulting in a better fit between the
equation and experimental data, particularly for higher salinities. In halite bearing
(L+V+H) inclusions, the temperature of halite dissolution (Ths) was used to calculate
salinity directly using the equation developed by Sterner et al., (1988), which describes
salinity as a function of halite dissolution temperature:
Salinity (wt %) = 26.242 + 0.4928Ψ + 1.42Ψ2 – 0.223Ψ
3 + 0.04129Ψ
4
+ 6.295x10⁻³
Ψ5 – 1.967x10
-3Ψ
6 + 1.1112x10
-4Ψ
7 (2)
(where Ψ= Ths(°C) /100)
NaCl-CaCl2-H2O
A ternary phase diagram modified after Vanko et al., (1988), Zwart and Touret (1994) and
Bodnar (2003) was used for illustrating fluid behaviour and calculating salinities where a
calcic fluid component was deduced from a low eutectic close to -52°C (Figure 4.25). In
calcic, halite bearing inclusions, the halite dissolution temperatures (Ths) were used in
conjunction with ice melting temperature to estimate both NaCl and CaCl2 levels. Ice
melting (Tmice) and hydrohalite melting (Tmhh) were used for calculations in two phase
(L+V) inclusions.
The methodology used follows that described in Shepherd (1985), and is based on the
theoretical path of a fluid inclusion on a ternary NaCl-CaCl2-H2O phase diagram as
illustrated in Figure 4.25a. The eutectic or first melting occurs at close -52°C at point “a”
(antarcticite melting). Upon further heating, the inclusion follows the ice-hydrohalite
boundary towards the right until it reaches the final melting point of ice (Tmice) at point
“b” (since ice melted before hydrohalite in all inclusions in this study) (~-29°C in this
example). From here the path leaves the ice-hydrohalite boundary and descends into the
hydrohalite (HH) field (on a path towards hydrohalite composition or approximately 61
wt% NaCl). Hydrohalite melting (Tmhh) occurs at point “c” (-5°C in this example) and for
LV inclusions this point is used to calculate fluid composition by reading wt% off the
Chapter 4
_________________________________________________________________________
4-44
NaCl and CaCl2 axes. For a LVH inclusion, the path diverts at “c” towards the NaCl apex
and moves into the halite field. It remains on this course until the temperature of halite
dissolution (Ths) at point “d” (about 220°C in this example), which is used to calculate the
composition of LVH inclusions by reading from the NaCl and CaCl2 axes.
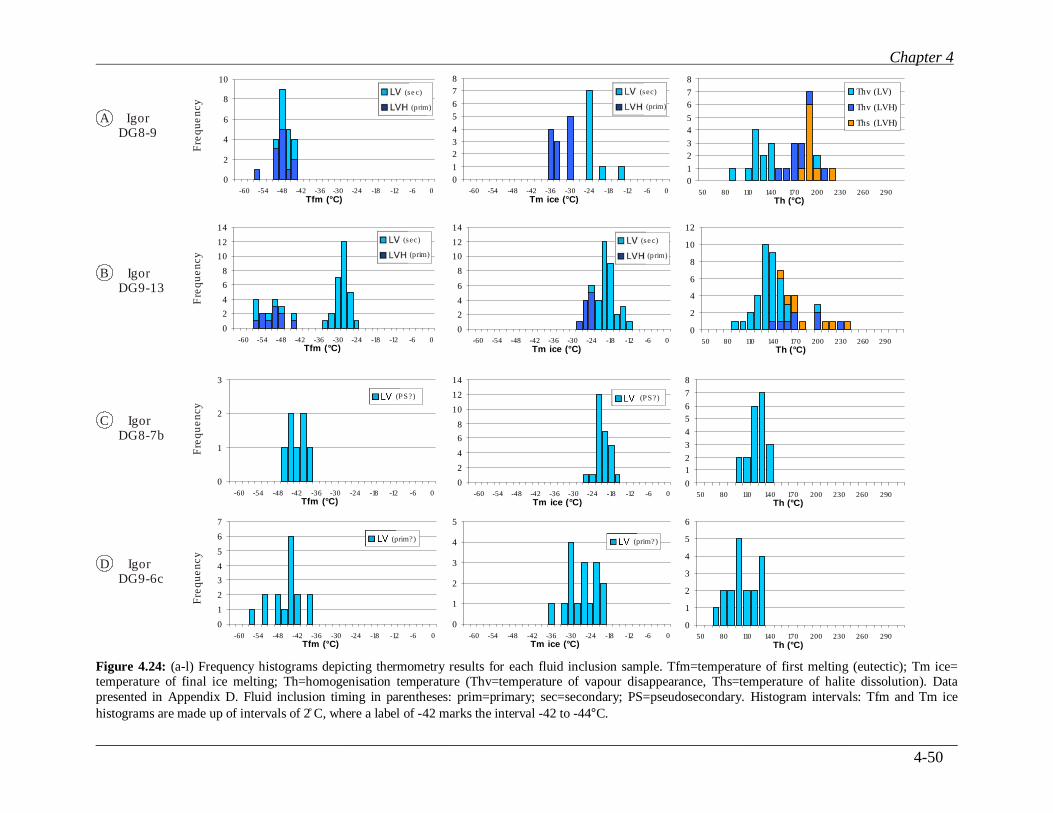
Full results of microthermometry experiments are presented in Appendix D and are
described below in detail. Melting and homogenisation temperatures are summarised in
frequency histograms in Figure 4.24a-l, and an overview of results is presented in Table
4.3.
4.4.5 Results
Igor
DG8-9
The 34 analysed inclusions from this sample froze between -60 and -90°C (turning a
brownish colour). Tfm values were consistent, with most lying between -50 and -47°C (Fig.
4.24a). Tmice occurred between -38 and -31°C in LVH inclusions and in the narrow range
of -24.5 to -24.3°C in nearly all LV inclusions. Solid hydrohalite (NaCl.2H2O) remained (+
liquid ± NaCl) after the melting of ice. Hydrohalite acted metastably, melting at
temperatures above 0.1°C for all inclusions (up to 16.8°C). During heating above room
temperature, vapour bubbles shrank until disappearing (Thvap) between 81 and 136°C
representing total homogenisation for 2 phase inclusions. Thvap for LVH inclusions
occurred between 150 and 202°C, and homogenisation by halite dissolution subsequently
occurred between 175 and 220°C (Fig. 4.24a).
DG9-13
Thermometric measurements were carried out on 50 inclusions in this sample, most were
two phase (LV), and 10 were halite-bearing. Eutectic temperatures for LV inclusions fell
mostly between -32 and -25°C (Figure 4.24b). Ice melted between -23 and -14°C in LV
inclusions but values were strongly clustered in a narrow range between -21 and -19°C
Chapter 4
_________________________________________________________________________
4-45
(Fig. 4.24b). Hydrohalite melting was observed in only a few inclusions and mostly
displayed metastable behaviour. LVH inclusions had eutectics between -56 and -45 °C and
Tmice values between -29 and -25°C. Hydrohalite acted metastably, with all values above
0.1°C. During heating, the LV inclusions homogenised by vapour disappearance at
temperatures ranging from 85 to 159°C (Fig. 4.24b). Halite-bearing inclusions had Thvap of
137 to 222°C and underwent total homogenisation by halite dissolution at temperatures
slightly above vapour disappearance (150 to 235°C).
DG8-7b
A total of 29 two phase pseudo-secondary inclusions were analysed in this sample.
Eutectic temperatures ranged from -46 to -39°C (Fig. 4.24c), but were reliably recorded for
only 7 inclusions due to the difficulty in observing phase changes in small inclusions.
Hydrohalite melting was observed in some inclusions, at temperatures between -15 and -
2°C. Inclusions homogenised by vapour disappearance upon heating to temperatures
between 95 and 138°C.
DG10-1b
The majority of the 41 fluid inclusions measured from this sample were two phase aqueous
inclusions (LV), with fewer singe phase (L), and halite-bearing (LVH) inclusions, and 6
contained liquid CO2. The small inclusions in this sample again rendered observations
difficult, and this is reflected in the range of melting temperatures recorded, with recorded
eutectics of aqueous inclusions ranging from -55 to -23°C (Fig. 4.24d). Tmice values vary
from -27 to -10 °C. Homogenisation temperatures were marked by vapour disappearance
between 97 and 137°C.
Frozen CO2 inclusions melted abruptly between -57.5 and -56.9°C, leaving liquid and a
vapour bubble. These melting temperatures indicate that the inclusions contain CO2. The
close proximity of these values to the melting point of pure CO2 (-56.6°C) suggested that
the inclusions contain pure CO2, without any other detectable components, and this was
confirmed by laser Raman analysis. They homogenised by vapour disappearance between -
23 and -6°C, equating to CO2 densities of 0.98 to 1.04 g/cc.
Chapter 4
_________________________________________________________________________
4-46
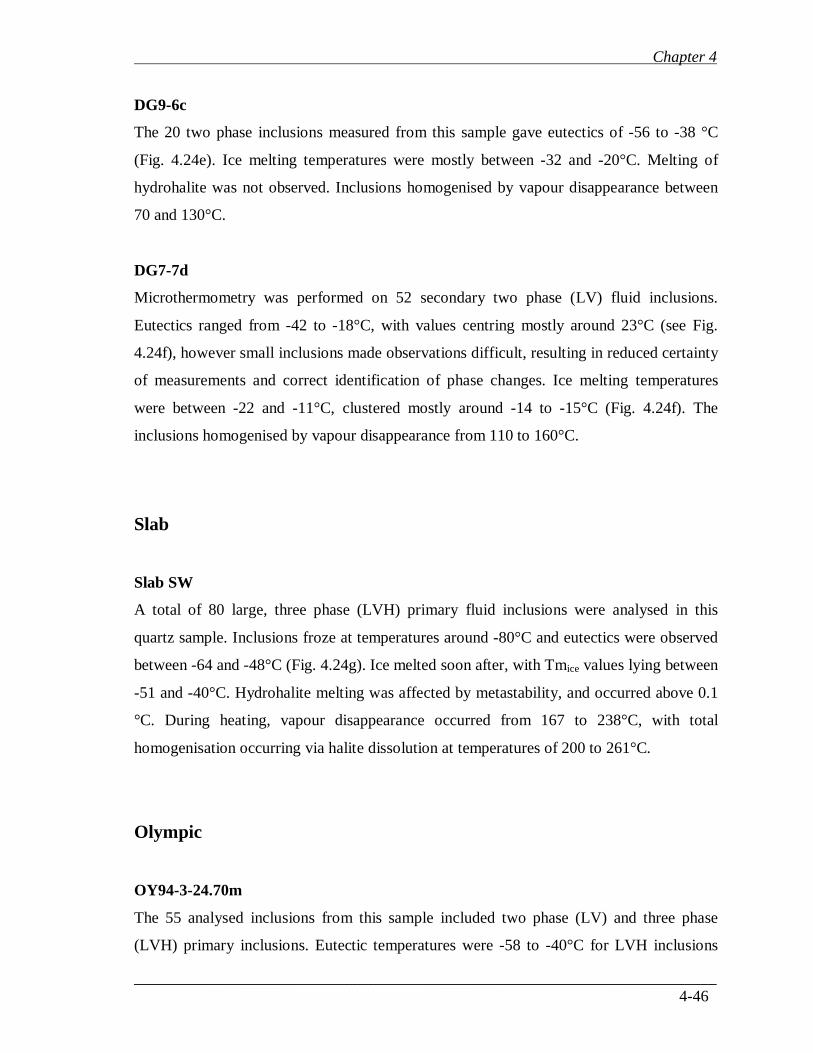
DG9-6c
The 20 two phase inclusions measured from this sample gave eutectics of -56 to -38 °C
(Fig. 4.24e). Ice melting temperatures were mostly between -32 and -20°C. Melting of
hydrohalite was not observed. Inclusions homogenised by vapour disappearance between
70 and 130°C.
DG7-7d
Microthermometry was performed on 52 secondary two phase (LV) fluid inclusions.
Eutectics ranged from -42 to -18°C, with values centring mostly around 23°C (see Fig.
4.24f), however small inclusions made observations difficult, resulting in reduced certainty
of measurements and correct identification of phase changes. Ice melting temperatures
were between -22 and -11°C, clustered mostly around -14 to -15°C (Fig. 4.24f). The
inclusions homogenised by vapour disappearance from 110 to 160°C.
Slab
Slab SW
A total of 80 large, three phase (LVH) primary fluid inclusions were analysed in this
quartz sample. Inclusions froze at temperatures around -80°C and eutectics were observed
between -64 and -48°C (Fig. 4.24g). Ice melted soon after, with Tmice values lying between
-51 and -40°C. Hydrohalite melting was affected by metastability, and occurred above 0.1
°C. During heating, vapour disappearance occurred from 167 to 238°C, with total
homogenisation occurring via halite dissolution at temperatures of 200 to 261°C.
Olympic
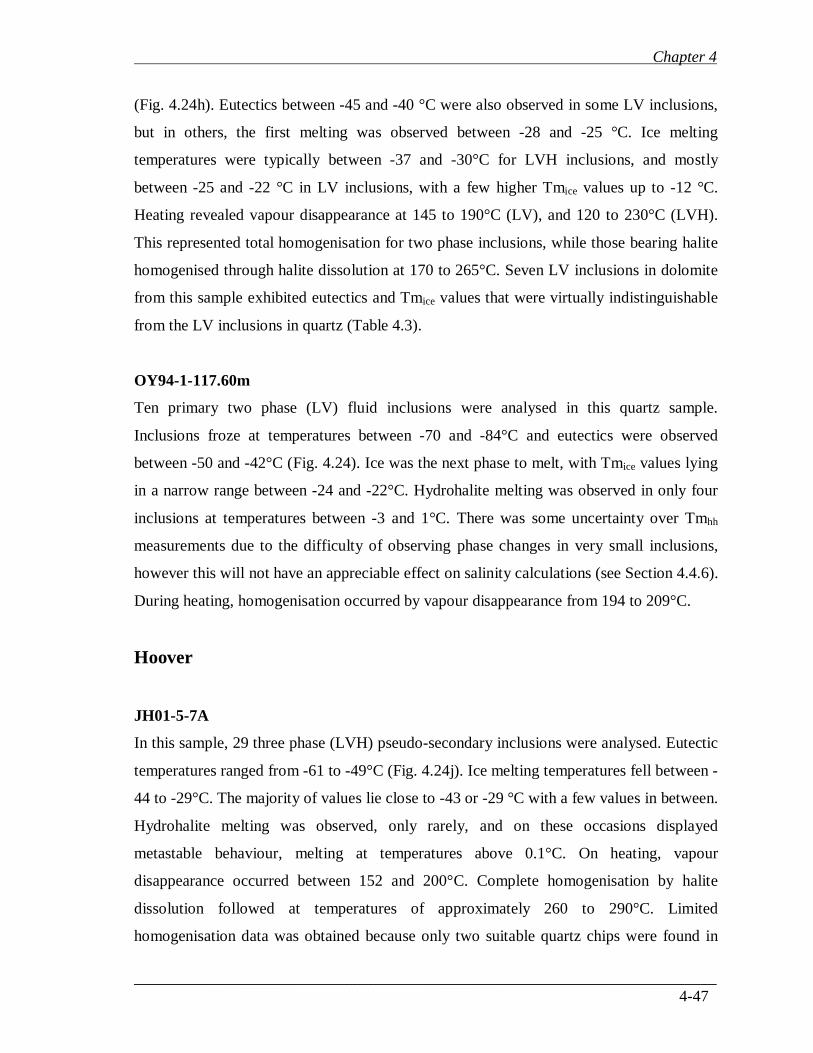
OY94-3-24.70m
The 55 analysed inclusions from this sample included two phase (LV) and three phase
(LVH) primary inclusions. Eutectic temperatures were -58 to -40°C for LVH inclusions
Chapter 4
_________________________________________________________________________
4-47
(Fig. 4.24h). Eutectics between -45 and -40 °C were also observed in some LV inclusions,
but in others, the first melting was observed between -28 and -25 °C. Ice melting
temperatures were typically between -37 and -30°C for LVH inclusions, and mostly
between -25 and -22 °C in LV inclusions, with a few higher Tmice values up to -12 °C.
Heating revealed vapour disappearance at 145 to 190°C (LV), and 120 to 230°C (LVH).
This represented total homogenisation for two phase inclusions, while those bearing halite
homogenised through halite dissolution at 170 to 265°C. Seven LV inclusions in dolomite
from this sample exhibited eutectics and Tmice values that were virtually indistinguishable
from the LV inclusions in quartz (Table 4.3).
OY94-1-117.60m
Ten primary two phase (LV) fluid inclusions were analysed in this quartz sample.
Inclusions froze at temperatures between -70 and -84°C and eutectics were observed
between -50 and -42°C (Fig. 4.24). Ice was the next phase to melt, with Tmice values lying
in a narrow range between -24 and -22°C. Hydrohalite melting was observed in only four
inclusions at temperatures between -3 and 1°C. There was some uncertainty over Tmhh
measurements due to the difficulty of observing phase changes in very small inclusions,
however this will not have an appreciable effect on salinity calculations (see Section 4.4.6).
During heating, homogenisation occurred by vapour disappearance from 194 to 209°C.
Hoover
JH01-5-7A
In this sample, 29 three phase (LVH) pseudo-secondary inclusions were analysed. Eutectic
temperatures ranged from -61 to -49°C (Fig. 4.24j). Ice melting temperatures fell between -
44 to -29°C. The majority of values lie close to -43 or -29 °C with a few values in between.
Hydrohalite melting was observed, only rarely, and on these occasions displayed
metastable behaviour, melting at temperatures above 0.1°C. On heating, vapour
disappearance occurred between 152 and 200°C. Complete homogenisation by halite
dissolution followed at temperatures of approximately 260 to 290°C. Limited
homogenisation data was obtained because only two suitable quartz chips were found in
Chapter 4
_________________________________________________________________________
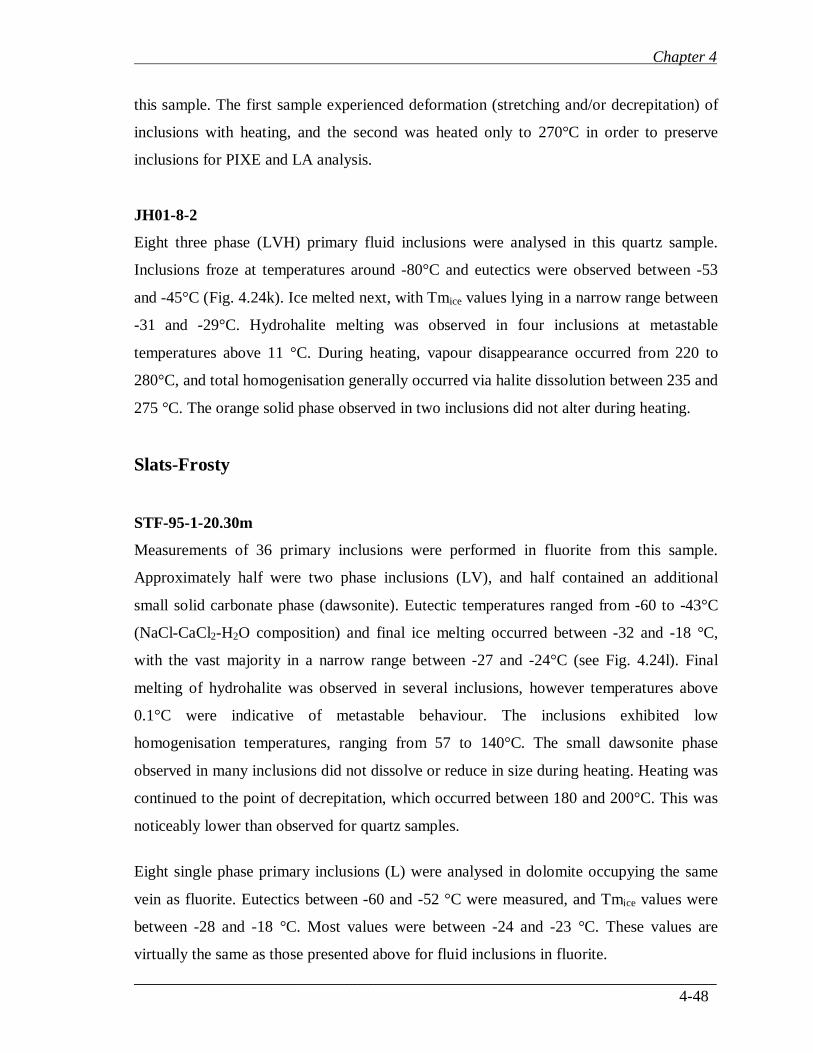
4-48
this sample. The first sample experienced deformation (stretching and/or decrepitation) of
inclusions with heating, and the second was heated only to 270°C in order to preserve
inclusions for PIXE and LA analysis.
JH01-8-2
Eight three phase (LVH) primary fluid inclusions were analysed in this quartz sample.
Inclusions froze at temperatures around -80°C and eutectics were observed between -53
and -45°C (Fig. 4.24k). Ice melted next, with Tmice values lying in a narrow range between
-31 and -29°C. Hydrohalite melting was observed in four inclusions at metastable
temperatures above 11 °C. During heating, vapour disappearance occurred from 220 to
280°C, and total homogenisation generally occurred via halite dissolution between 235 and
275 °C. The orange solid phase observed in two inclusions did not alter during heating.
Slats-Frosty
STF-95-1-20.30m
Measurements of 36 primary inclusions were performed in fluorite from this sample.
Approximately half were two phase inclusions (LV), and half contained an additional
small solid carbonate phase (dawsonite). Eutectic temperatures ranged from -60 to -43°C
(NaCl-CaCl2-H2O composition) and final ice melting occurred between -32 and -18 °C,
with the vast majority in a narrow range between -27 and -24°C (see Fig. 4.24l). Final
melting of hydrohalite was observed in several inclusions, however temperatures above
0.1°C were indicative of metastable behaviour. The inclusions exhibited low
homogenisation temperatures, ranging from 57 to 140°C. The small dawsonite phase
observed in many inclusions did not dissolve or reduce in size during heating. Heating was
continued to the point of decrepitation, which occurred between 180 and 200°C. This was
noticeably lower than observed for quartz samples.
Eight single phase primary inclusions (L) were analysed in dolomite occupying the same
vein as fluorite. Eutectics between -60 and -52 °C were measured, and Tmice values were
between -28 and -18 °C. Most values were between -24 and -23 °C. These values are
virtually the same as those presented above for fluid inclusions in fluorite.
Chapter 4
____________________________________________________________________________________________________________
4-49
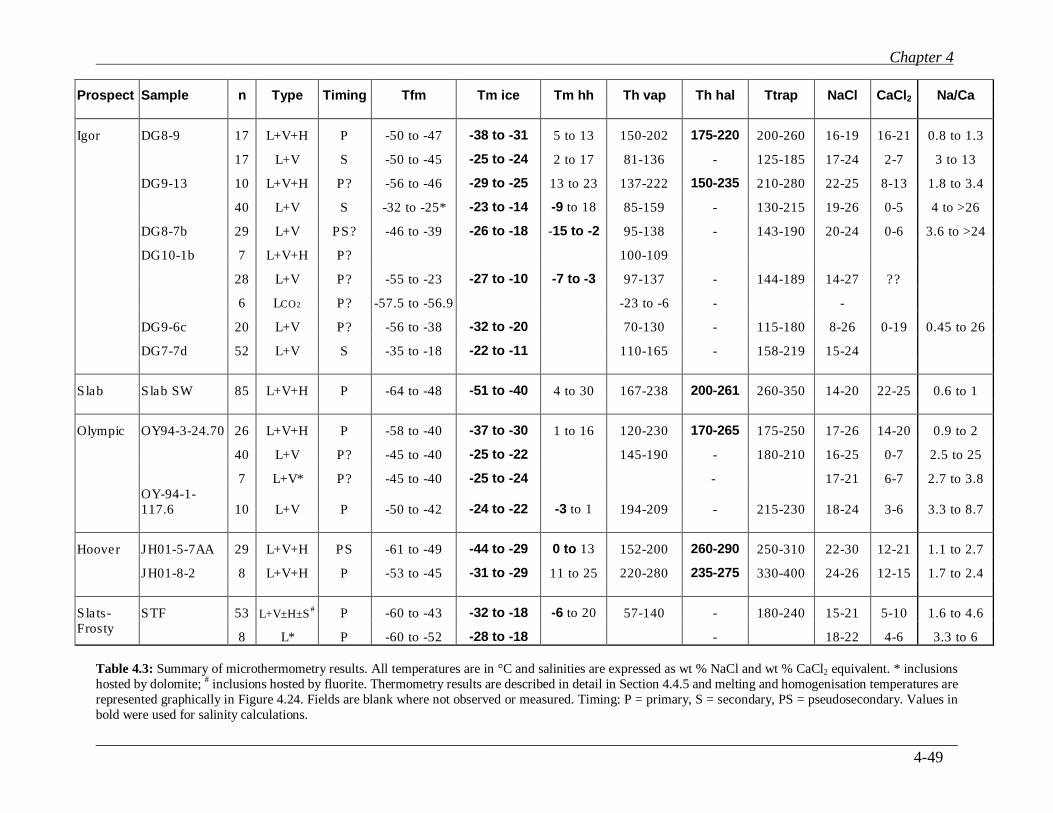
Table 4.3: Summary of microthermometry results. All temperatures are in °C and salinities are expressed as wt % NaCl and wt % CaCl2 equivalent. * inclusions
hosted by dolomite; # inclusions hosted by fluorite. Thermometry results are described in detail in Section 4.4.5 and melting and homogenisation temperatures are
represented graphically in Figure 4.24. Fields are blank where not observed or measured. Timing: P = primary, S = secondary, PS = pseudosecondary. Values in
bold were used for salinity calculations.
Prospect Sample n Type Timing Tfm Tm ice Tm hh Th vap Th hal Ttrap NaCl CaCl2 Na/Ca
Igor DG8-9 17 L+V+H P -50 to -47 -38 to -31 5 to 13 150-202 175-220 200-260 16-19 16-21 0.8 to 1.3
17 L+V S -50 to -45 -25 to -24 2 to 17 81-136 - 125-185 17-24 2-7 3 to 13
DG9-13 10 L+V+H P? -56 to -46 -29 to -25 13 to 23 137-222 150-235 210-280 22-25 8-13 1.8 to 3.4
40 L+V S -32 to -25* -23 to -14 -9 to 18 85-159 - 130-215 19-26 0-5 4 to >26
DG8-7b 29 L+V PS? -46 to -39 -26 to -18 -15 to -2 95-138 - 143-190 20-24 0-6 3.6 to >24
DG10-1b 7 L+V+H P? 100-109
28 L+V P? -55 to -23 -27 to -10 -7 to -3 97-137 - 144-189 14-27 ??
6 LCO2 P? -57.5 to -56.9 -23 to -6 - -
DG9-6c 20 L+V P? -56 to -38 -32 to -20 70-130 - 115-180 8-26 0-19 0.45 to 26
DG7-7d 52 L+V S -35 to -18 -22 to -11 110-165 - 158-219 15-24
Slab Slab SW 85 L+V+H P -64 to -48 -51 to -40 4 to 30 167-238 200-261 260-350 14-20 22-25 0.6 to 1
Olympic OY94-3-24.70 26 L+V+H P -58 to -40 -37 to -30 1 to 16 120-230 170-265 175-250 17-26 14-20 0.9 to 2
40 L+V P? -45 to -40 -25 to -22 145-190 - 180-210 16-25 0-7 2.5 to 25
7 L+V* P? -45 to -40 -25 to -24 - 17-21 6-7 2.7 to 3.8
OY-94-1-117.6 10 L+V P -50 to -42 -24 to -22 -3 to 1 194-209 - 215-230 18-24 3-6 3.3 to 8.7
Hoover JH01-5-7AA 29 L+V+H PS -61 to -49 -44 to -29 0 to 13 152-200 260-290 250-310 22-30 12-21 1.1 to 2.7
JH01-8-2 8 L+V+H P -53 to -45 -31 to -29 11 to 25 220-280 235-275 330-400 24-26 12-15 1.7 to 2.4
Slats-Frosty
STF 53 L+V±H±S# P -60 to -43 -32 to -18 -6 to 20 57-140 - 180-240 15-21 5-10 1.6 to 4.6
8 L* P -60 to -52 -28 to -18 - 18-22 4-6 3.3 to 6
Chapter 4
____________________________________________________________________________________________________________
4-50
A Igor DG8-9
Fre
que
ncy
0
1
2
3
4
5
6
7
8
0-6-12-18-24-30-36-42-48-54-60
Tm ice (°C)
LV
LVH
0
2
4
6
8
10
12
14
0-6-12-18-24-30-36-42-48-54-60
Tfm (°C)
0
2
4
6
8
10
12
14
0-6-12-18-24-30-36-42-48-54-60
Tm ice (°C)
0
2
4
6
8
10
12
50 80 110 140 170 200 230 260 290
Th (°C)
0
1
2
3
0-6-12-18-24-30-36-42-48-54-60
Tfm (°C)
0
2
4
6
8
10
12
14
0-6-12-18-24-30-36-42-48-54-60
Tm ice (°C)
0
1
2
3
4
5
6
7
8
50 80 110 140 170 200 230 260 290
Th (°C)
0
1
2
3
4
5
6
7
0-6-12-18-24-30-36-42-48-54-60
Tfm (°C)
0
1
2
3
4
5
0-6-12-18-24-30-36-42-48-54-60
Tm ice (°C)
0
1
2
3
4
5
6
50 80 110 140 170 200 230 260 290
Th (°C)
B Igor DG9-13
C Igor DG8-7b
D Igor DG9-6c
Fre
quency
Fre
qu
ency
Fre
qu
ency
0
2
4
6
8
10
0-6-12-18-24-30-36-42-48-54-60
Tfm (°C)
LV
LVH
0
1
2
3
4
5
6
7
8
50 80 110 140 170 200 230 260 290
Th (°C)
Thv (LV)
Thv (LVH)
Ths (LVH)
(sec)
(prim)
(sec)
(prim)
(sec)
(prim)
(sec)
(prim)
(prim?)
(PS?) (PS?)
(prim?)
Figure 4.24: (a-l) Frequency histograms depicting thermometry results for each fluid inclusion sample. Tfm=temperature of first melting (eutectic); Tm ice= temperature of final ice melting; Th=homogenisation temperature (Thv=temperature of vapour disappearance, Ths=temperature of halite dissolution). Data
presented in Appendix D. Fluid inclusion timing in parentheses: prim=primary; sec=secondary; PS=pseudosecondary. Histogram intervals: Tfm and Tm ice
histograms are made up of intervals of 2̊ C, where a label of -42 marks the interval -42 to -44°C.
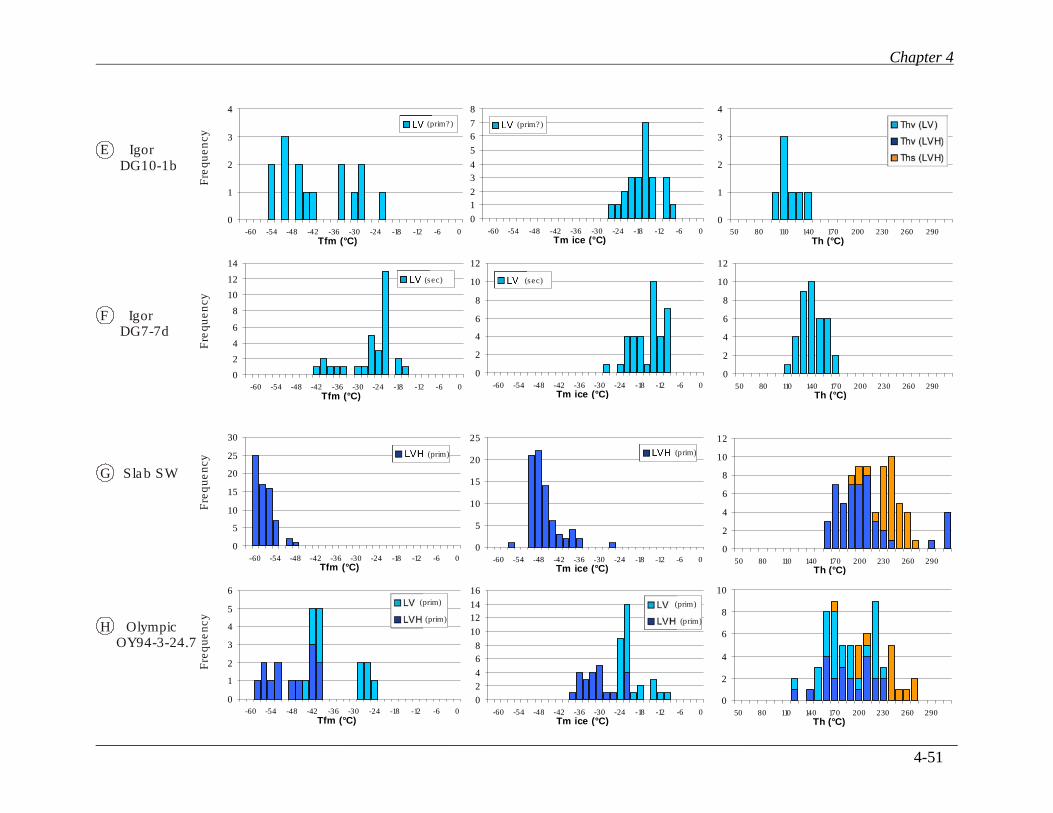
Chapter 4
____________________________________________________________________________________________________________
4-51
E Igor DG10-1b
Fre
qu
en
cy
F Igor DG7-7d
G Slab SW
H Olympic OY94-3-24.7
Fre
que
ncy
Fre
que
ncy
Fre
qu
en
cy
0
1
2
3
4
0-6-12-18-24-30-36-42-48-54-60
Tfm (°C)
0
1
2
3
4
5
6
7
8
0-6-12-18-24-30-36-42-48-54-60
Tm ice (°C)
0
1
2
3
4
50 80 110 140 170 200 230 260 290
Th (°C)
0
2
4
6
8
10
12
14
0-6-12-18-24-30-36-42-48-54-60
Tfm (°C)
0
2
4
6
8
10
12
0-6-12-18-24-30-36-42-48-54-60
Tm ice (°C)
0
2
4
6
8
10
12
50 80 110 140 170 200 230 260 290
Th (°C)
0
5
10
15
20
25
30
0-6-12-18-24-30-36-42-48-54-60
Tfm (°C)
0
1
2
3
4
5
6
0-6-12-18-24-30-36-42-48-54-60
Tfm (°C)
0
2
4
6
8
10
12
14
16
0-6-12-18-24-30-36-42-48-54-60
Tm ice (°C)
0
5
10
15
20
25
0-6-12-18-24-30-36-42-48-54-60
Tm ice (°C)
0
2
4
6
8
10
12
50 80 110 140 170 200 230 260 290
Th (°C)
0
2
4
6
8
10
50 80 110 140 170 200 230 260 290
Th (°C)
(prim?) (prim?)
(sec) (sec)
(prim) (prim)
(prim)
(prim)
(prim)
(prim)
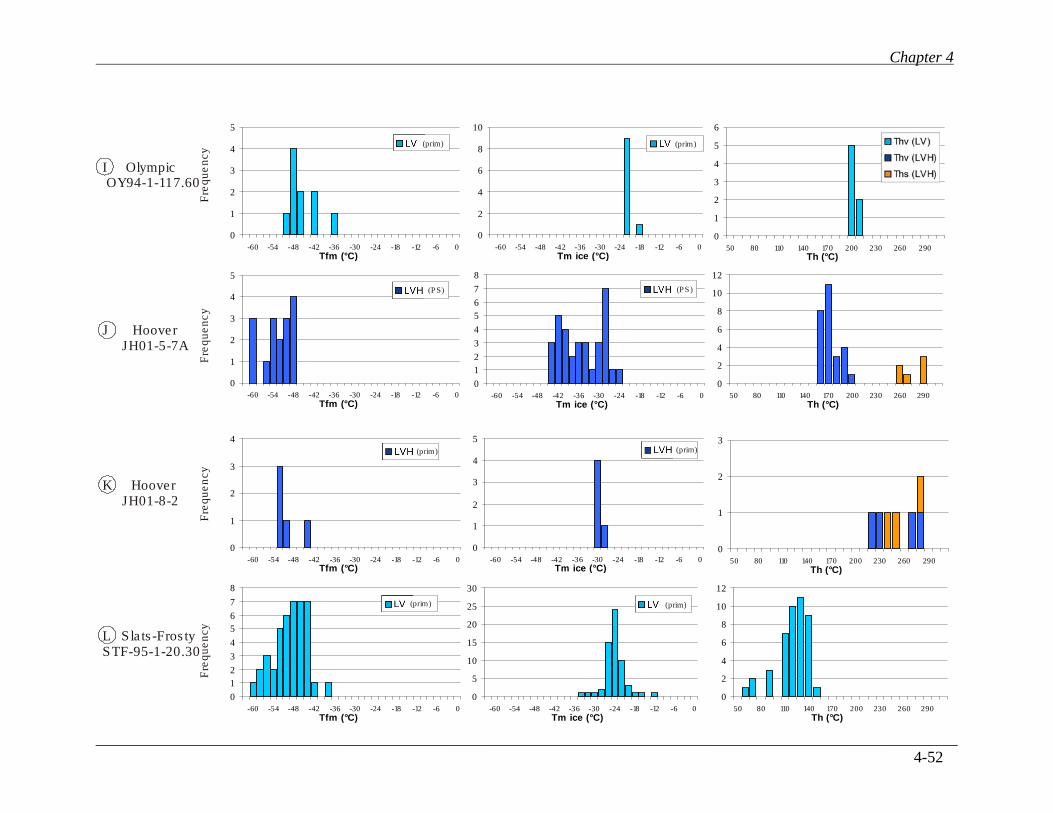
Chapter 4
____________________________________________________________________________________________________________
4-52
I Olympic OY94-1-117.60
Fre
que
ncy
J Hoover JH01-5-7A
K Hoover JH01-8-2
L Slats-FrostySTF-95-1-20.30
Fre
quency
Fre
quen
cy
Fre
quency
0
1
2
3
4
5
0-6-12-18-24-30-36-42-48-54-60
Tfm (°C)
0
2
4
6
8
10
0-6-12-18-24-30-36-42-48-54-60
Tm ice (°C)
0
1
2
3
4
5
6
50 80 110 140 170 200 230 260 290Th (°C)
0
1
2
3
4
5
0-6-12-18-24-30-36-42-48-54-60
Tfm (°C)
0
1
2
3
4
0-6-12-18-24-30-36-42-48-54-60Tfm (°C)
0
1
2
3
4
5
0-6-12-18-24-30-36-42-48-54-60Tm ice (°C)
0
1
2
3
4
5
6
7
8
0-6-12-18-24-30-36-42-48-54-60
Tfm (°C)
0
1
2
3
50 80 110 140 170 200 230 260 290
Th (°C)
0
2
4
6
8
10
12
50 80 110 140 170 200 230 260 290
Th (°C)
0
1
2
3
4
5
6
7
8
0-6-12-18-24-30-36-42-48-54-60
Tm ice (°C)
0
2
4
6
8
10
12
50 80 110 140 170 200 230 260 290
Th (°C)
0
5
10
15
20
25
30
0-6-12-18-24-30-36-42-48-54-60
Tm ice (°C)
(prim) (prim)
(PS) (PS)
(prim) (prim)
(prim) (prim)
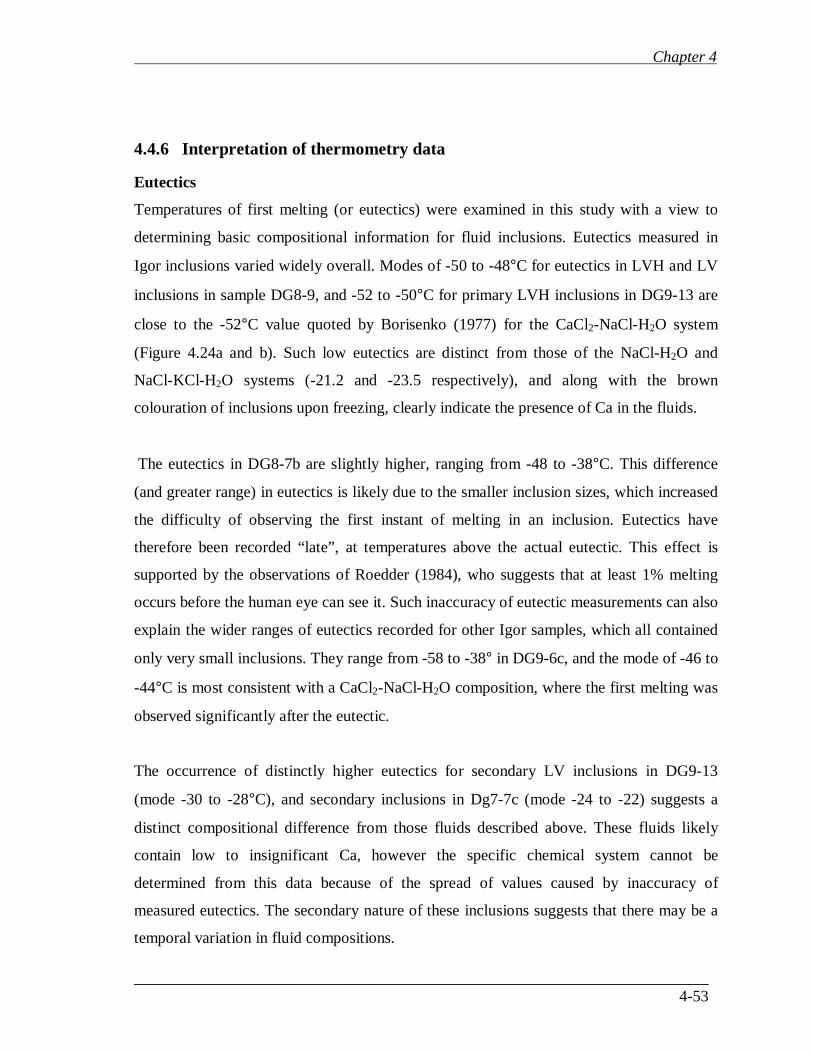
Chapter 4
________________________________________________________________________
4-53
4.4.6 Interpretation of thermometry data
Eutectics
Temperatures of first melting (or eutectics) were examined in this study with a view to
determining basic compositional information for fluid inclusions. Eutectics measured in
Igor inclusions varied widely overall. Modes of -50 to -48°C for eutectics in LVH and LV
inclusions in sample DG8-9, and -52 to -50°C for primary LVH inclusions in DG9-13 are
close to the -52°C value quoted by Borisenko (1977) for the CaCl2-NaCl-H2O system
(Figure 4.24a and b). Such low eutectics are distinct from those of the NaCl-H2O and
NaCl-KCl-H2O systems (-21.2 and -23.5 respectively), and along with the brown
colouration of inclusions upon freezing, clearly indicate the presence of Ca in the fluids.
The eutectics in DG8-7b are slightly higher, ranging from -48 to -38°C. This difference
(and greater range) in eutectics is likely due to the smaller inclusion sizes, which increased
the difficulty of observing the first instant of melting in an inclusion. Eutectics have
therefore been recorded “late”, at temperatures above the actual eutectic. This effect is
supported by the observations of Roedder (1984), who suggests that at least 1% melting
occurs before the human eye can see it. Such inaccuracy of eutectic measurements can also
explain the wider ranges of eutectics recorded for other Igor samples, which all contained
only very small inclusions. They range from -58 to -38° in DG9-6c, and the mode of -46 to
-44°C is most consistent with a CaCl2-NaCl-H2O composition, where the first melting was
observed significantly after the eutectic.
The occurrence of distinctly higher eutectics for secondary LV inclusions in DG9-13
(mode -30 to -28°C), and secondary inclusions in Dg7-7c (mode -24 to -22) suggests a
distinct compositional difference from those fluids described above. These fluids likely
contain low to insignificant Ca, however the specific chemical system cannot be
determined from this data because of the spread of values caused by inaccuracy of
measured eutectics. The secondary nature of these inclusions suggests that there may be a
temporal variation in fluid compositions.
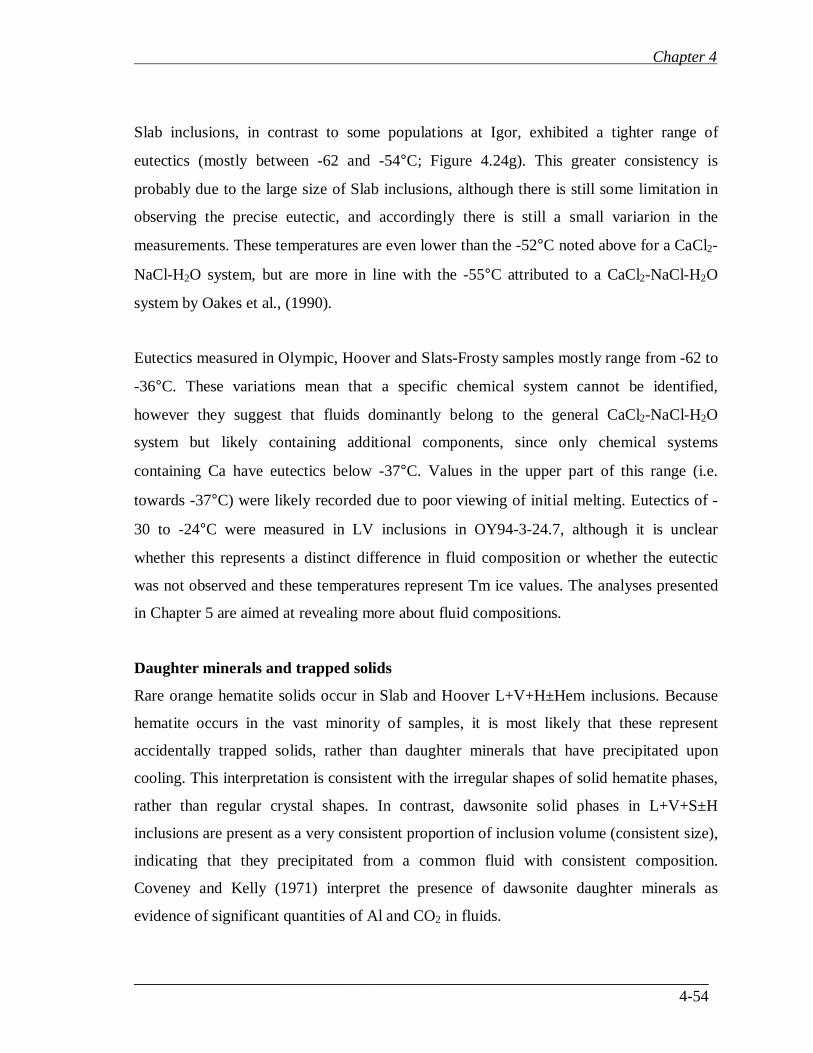
Chapter 4
________________________________________________________________________
4-54
Slab inclusions, in contrast to some populations at Igor, exhibited a tighter range of
eutectics (mostly between -62 and -54°C; Figure 4.24g). This greater consistency is
probably due to the large size of Slab inclusions, although there is still some limitation in
observing the precise eutectic, and accordingly there is still a small variarion in the
measurements. These temperatures are even lower than the -52°C noted above for a CaCl2-
NaCl-H2O system, but are more in line with the -55°C attributed to a CaCl2-NaCl-H2O
system by Oakes et al., (1990).
Eutectics measured in Olympic, Hoover and Slats-Frosty samples mostly range from -62 to
-36°C. These variations mean that a specific chemical system cannot be identified,
however they suggest that fluids dominantly belong to the general CaCl2-NaCl-H2O
system but likely containing additional components, since only chemical systems
containing Ca have eutectics below -37°C. Values in the upper part of this range (i.e.
towards -37°C) were likely recorded due to poor viewing of initial melting. Eutectics of -
30 to -24°C were measured in LV inclusions in OY94-3-24.7, although it is unclear
whether this represents a distinct difference in fluid composition or whether the eutectic
was not observed and these temperatures represent Tm ice values. The analyses presented
in Chapter 5 are aimed at revealing more about fluid compositions.
Daughter minerals and trapped solids
Rare orange hematite solids occur in Slab and Hoover L+V+H±Hem inclusions. Because
hematite occurs in the vast minority of samples, it is most likely that these represent
accidentally trapped solids, rather than daughter minerals that have precipitated upon
cooling. This interpretation is consistent with the irregular shapes of solid hematite phases,
rather than regular crystal shapes. In contrast, dawsonite solid phases in L+V+S±H
inclusions are present as a very consistent proportion of inclusion volume (consistent size),
indicating that they precipitated from a common fluid with consistent composition.
Coveney and Kelly (1971) interpret the presence of dawsonite daughter minerals as
evidence of significant quantities of Al and CO2 in fluids.
Chapter 4
________________________________________________________________________
4-55
Salinity calculations
Most salinity calculations were performed graphically using a NaCl-CaCl2-H2O ternary
phase diagram because inclusions in the majority of samples were interpreted to have a
CaCl2 component (based on eutectics as discussed above). These ternary diagrams are
presented in Figure 4.25a-e, and each inclusion is plotted according to the methods
described in Section 4.4.4. Calculated salinities for each fluid inclusion population are
expressed as wt% NaCl and CaCl2 in Table 4.3, and the values used to calculate them are
in bold (generally Tmice with Thhal, or Tmice with Tmhh, or Tmice alone). The equation of
Bodnar (1993) presented in Section 4.4.4 was used only for LV inclusions with no
apparent Ca component, and the equation of Sterner et al., (1988) was not used because all
LVH inclusion populations were interpreted to have a CaCl2 component and their salinities
were determined graphically.
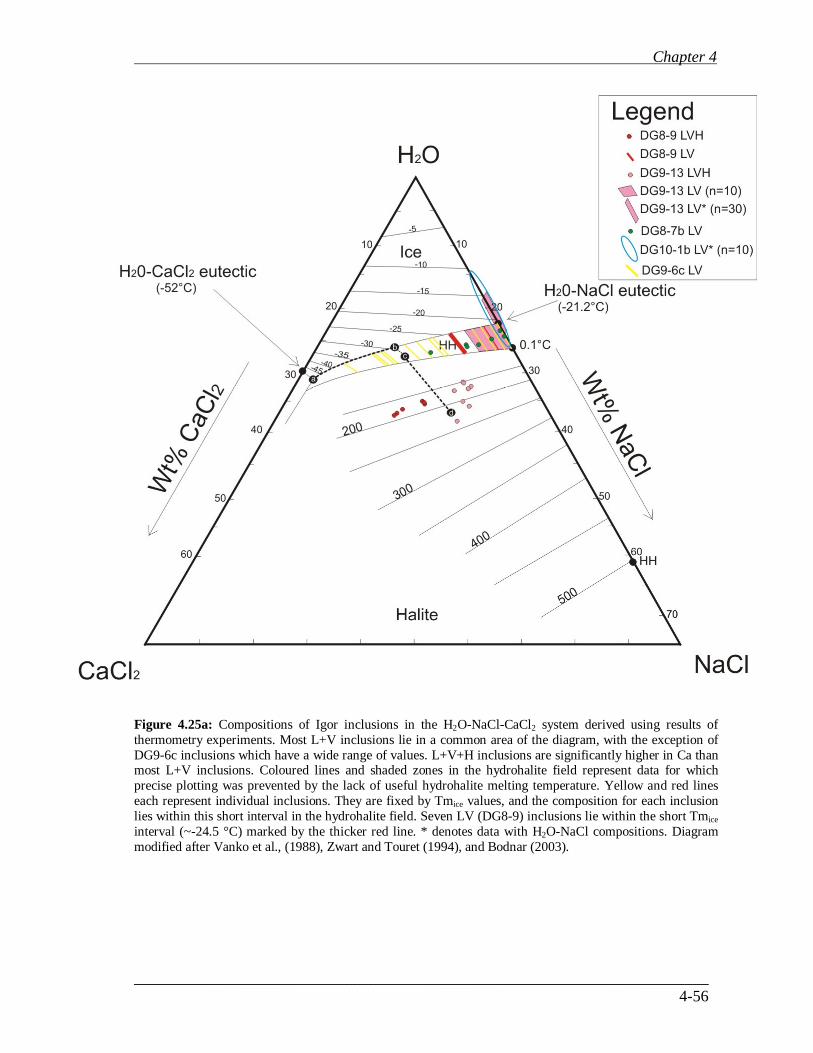
Chapter 4
________________________________________________________________________
4-56
Figure 4.25a: Compositions of Igor inclusions in the H2O-NaCl-CaCl2 system derived using results of
thermometry experiments. Most L+V inclusions lie in a common area of the diagram, with the exception of
DG9-6c inclusions which have a wide range of values. L+V+H inclusions are significantly higher in Ca than most L+V inclusions. Coloured lines and shaded zones in the hydrohalite field represent data for which
precise plotting was prevented by the lack of useful hydrohalite melting temperature. Yellow and red lines
each represent individual inclusions. They are fixed by Tmice values, and the composition for each inclusion
lies within this short interval in the hydrohalite field. Seven LV (DG8-9) inclusions lie within the short Tmice
interval (~-24.5 °C) marked by the thicker red line. * denotes data with H2O-NaCl compositions. Diagram
modified after Vanko et al., (1988), Zwart and Touret (1994), and Bodnar (2003).
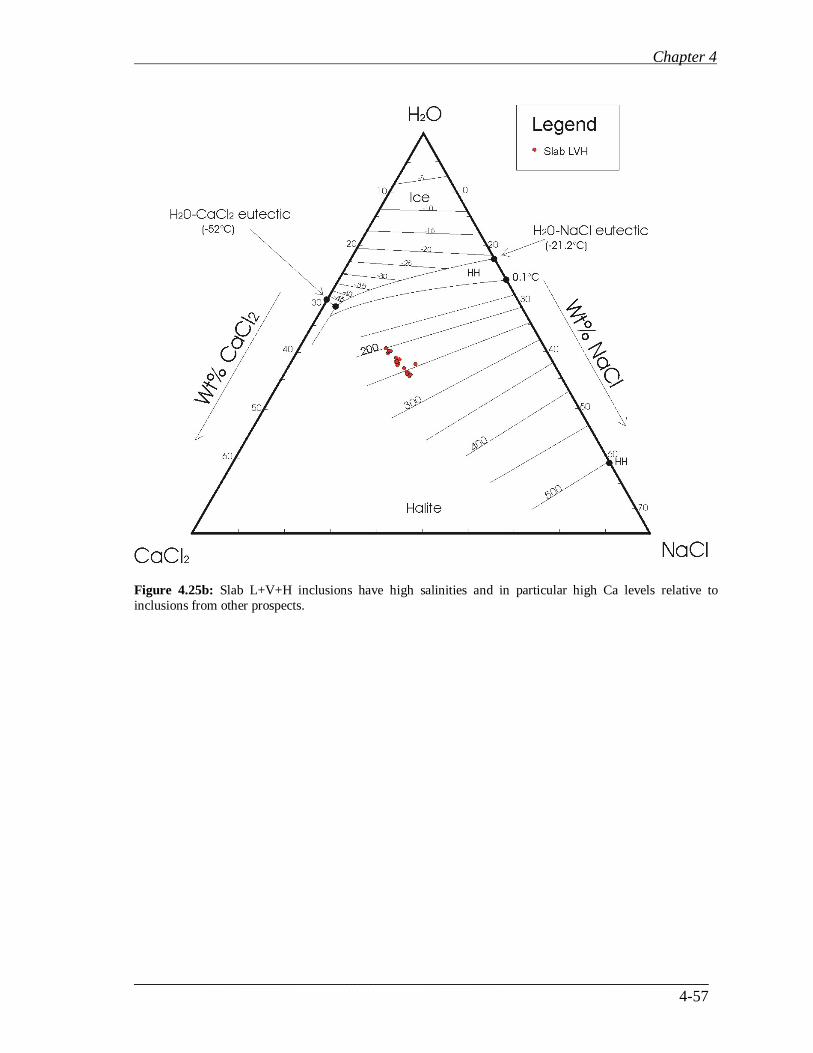
Chapter 4
________________________________________________________________________
4-57
Figure 4.25b: Slab L+V+H inclusions have high salinities and in particular high Ca levels relative to
inclusions from other prospects.
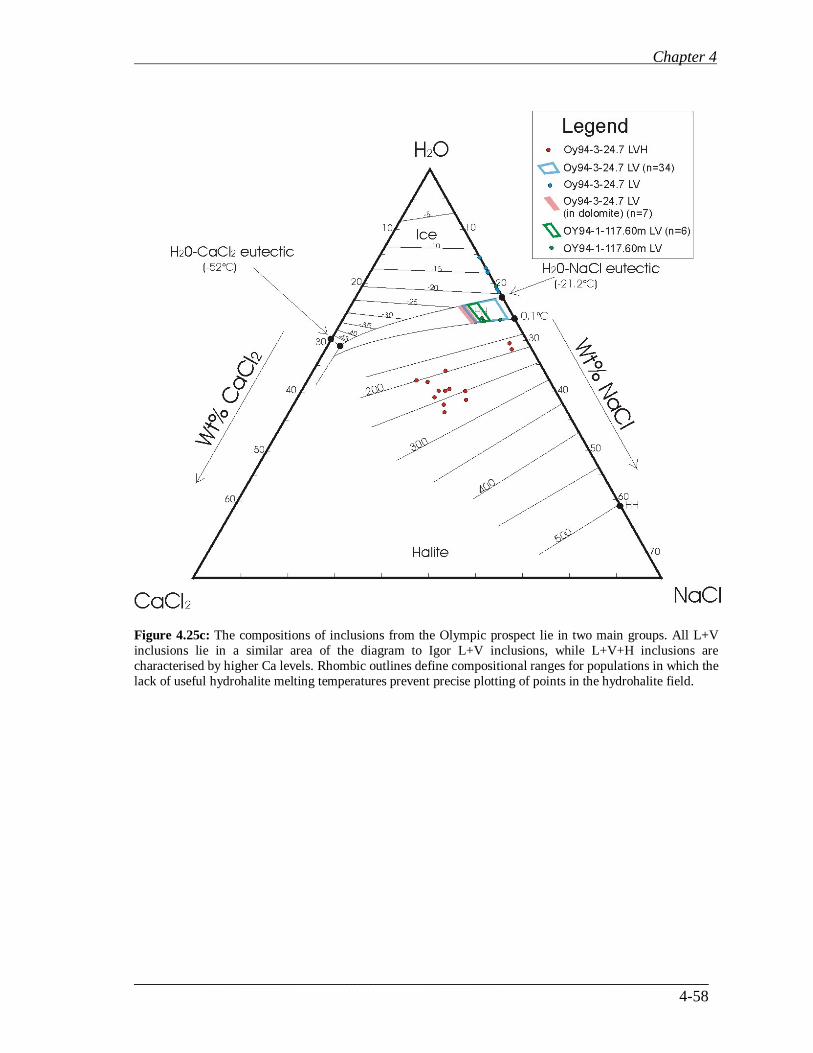
Chapter 4
________________________________________________________________________
4-58
Figure 4.25c: The compositions of inclusions from the Olympic prospect lie in two main groups. All L+V
inclusions lie in a similar area of the diagram to Igor L+V inclusions, while L+V+H inclusions are
characterised by higher Ca levels. Rhombic outlines define compositional ranges for populations in which the
lack of useful hydrohalite melting temperatures prevent precise plotting of points in the hydrohalite field.
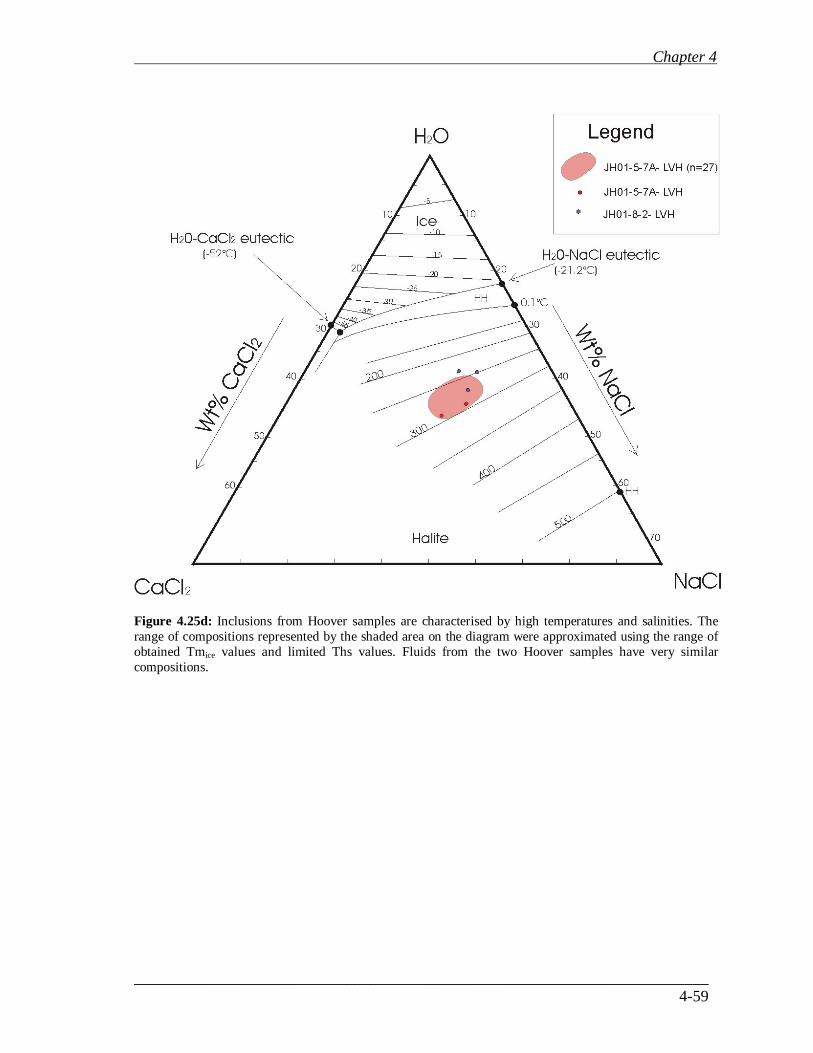
Chapter 4
________________________________________________________________________
4-59
Figure 4.25d: Inclusions from Hoover samples are characterised by high temperatures and salinities. The
range of compositions represented by the shaded area on the diagram were approximated using the range of
obtained Tmice values and limited Ths values. Fluids from the two Hoover samples have very similar
compositions.
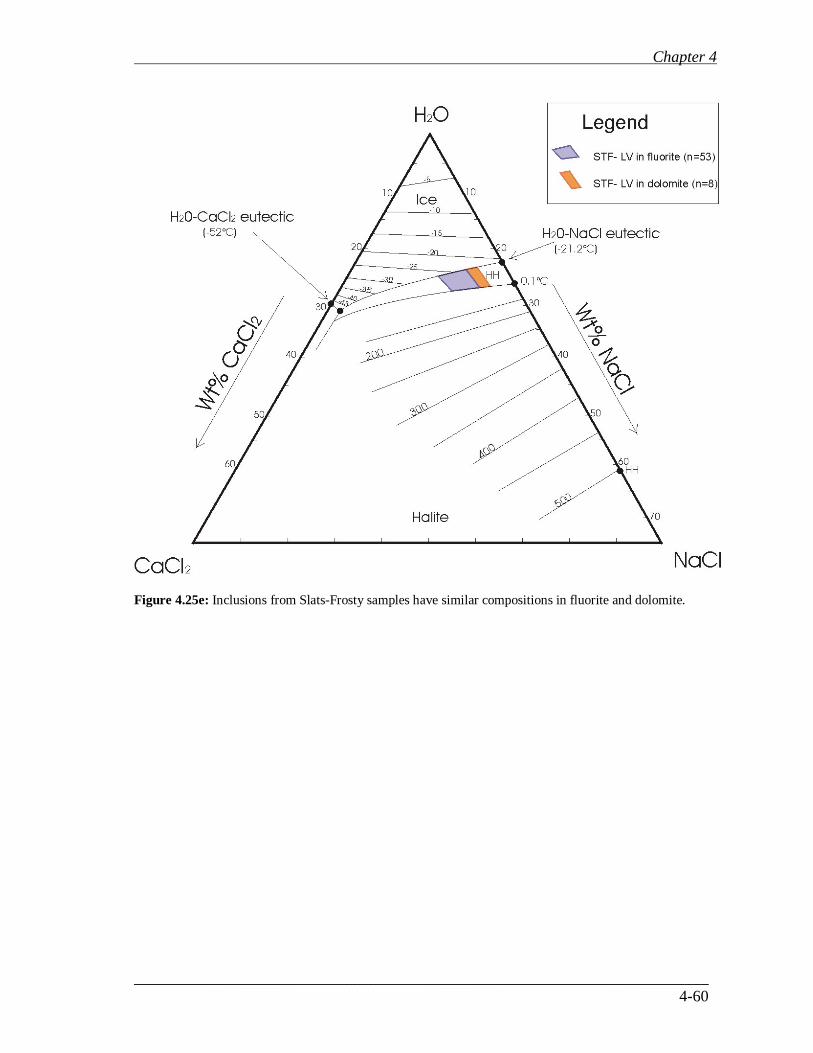
Chapter 4
________________________________________________________________________
4-60
Figure 4.25e: Inclusions from Slats-Frosty samples have similar compositions in fluorite and dolomite.
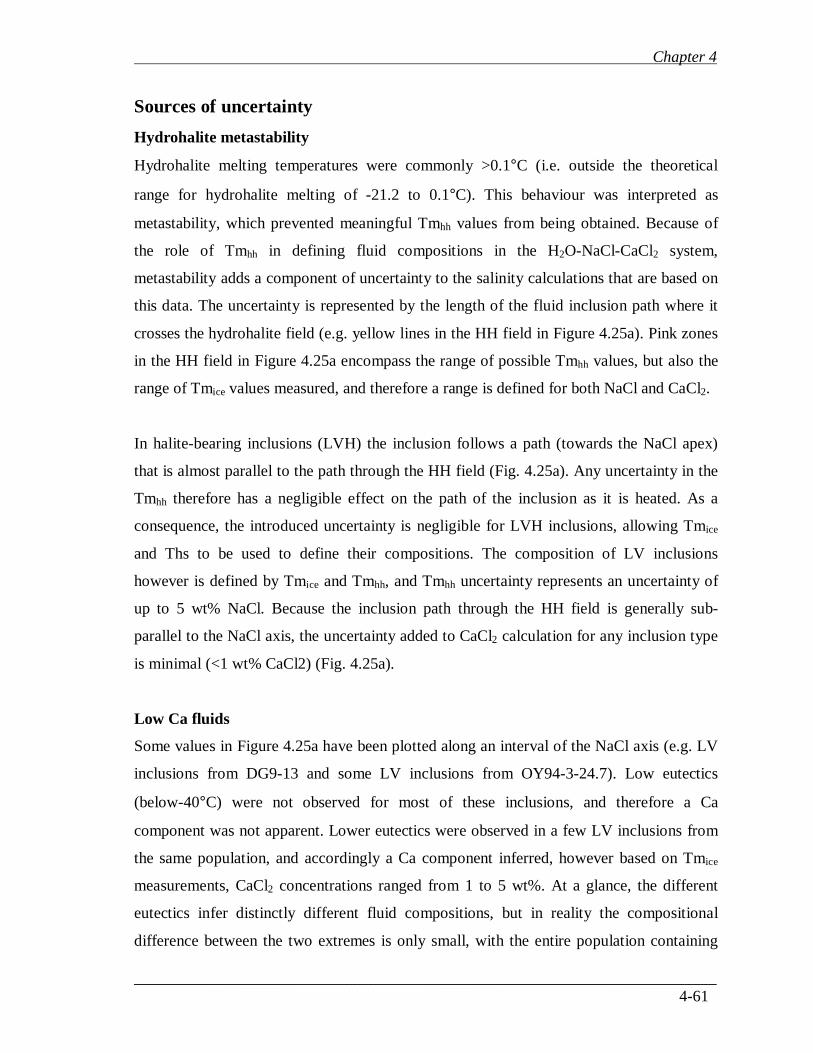
Chapter 4
_________________________________________________________________________
4-61
Sources of uncertainty
Hydrohalite metastability
Hydrohalite melting temperatures were commonly >0.1°C (i.e. outside the theoretical
range for hydrohalite melting of -21.2 to 0.1°C). This behaviour was interpreted as
metastability, which prevented meaningful Tmhh values from being obtained. Because of
the role of Tmhh in defining fluid compositions in the H2O-NaCl-CaCl2 system,
metastability adds a component of uncertainty to the salinity calculations that are based on
this data. The uncertainty is represented by the length of the fluid inclusion path where it
crosses the hydrohalite field (e.g. yellow lines in the HH field in Figure 4.25a). Pink zones
in the HH field in Figure 4.25a encompass the range of possible Tmhh values, but also the
range of Tmice values measured, and therefore a range is defined for both NaCl and CaCl2.
In halite-bearing inclusions (LVH) the inclusion follows a path (towards the NaCl apex)
that is almost parallel to the path through the HH field (Fig. 4.25a). Any uncertainty in the
Tmhh therefore has a negligible effect on the path of the inclusion as it is heated. As a
consequence, the introduced uncertainty is negligible for LVH inclusions, allowing Tmice
and Ths to be used to define their compositions. The composition of LV inclusions
however is defined by Tmice and Tmhh, and Tmhh uncertainty represents an uncertainty of
up to 5 wt% NaCl. Because the inclusion path through the HH field is generally sub-
parallel to the NaCl axis, the uncertainty added to CaCl2 calculation for any inclusion type
is minimal (<1 wt% CaCl2) (Fig. 4.25a).
Low Ca fluids
Some values in Figure 4.25a have been plotted along an interval of the NaCl axis (e.g. LV
inclusions from DG9-13 and some LV inclusions from OY94-3-24.7). Low eutectics
(below-40°C) were not observed for most of these inclusions, and therefore a Ca
component was not apparent. Lower eutectics were observed in a few LV inclusions from
the same population, and accordingly a Ca component inferred, however based on Tmice
measurements, CaCl2 concentrations ranged from 1 to 5 wt%. At a glance, the different
eutectics infer distinctly different fluid compositions, but in reality the compositional
difference between the two extremes is only small, with the entire population containing
Chapter 4
_________________________________________________________________________
4-62
between 0 and 5 wt% CaCl2 (and 19 to 26% NaCl). This level of variation is common
within a fluid inclusion population as evidenced by most populations in this study. It is
also likely that those inclusions with no apparent Ca component do in fact contain a small
amount of Ca (0-2%) with the amounts of antarcticite present in these inclusions (when
frozen) ranging from barely detectable to undetectable. These small variations in Ca
content may account for the observation of very different eutectics within the dataset. The
low Ca nature of these inclusions is distinct from high-Ca LVH inclusions observed at Igor
and Olympic, as well as other prospects.
Small inclusions
The accuracy of measurements was clearly affected by the small size of the inclusions in
some populations. As noted above, the spread of values for Tfm and Tmice was greater in
populations with smaller inclusions (particularly in DG9-6c, DG10-1b, and DG7-7d) in
which observations were more difficult. In DG10-1b and DG7-7d, mis-identification of
melting stages also likely occurred. This occurred because fine details such as crystal
shapes were not discernible, and therefore gross changes in the appearance of the inclusion
were relied upon. In particular eutectics were not observed in some inclusions, and no
doubt a few eutectic measurements were erroneously based on later stages of melting.
Total uncertainty in salinity estimations
The largest source of error in freezing experiments was inaccuracy in the observation of
melting phases, while the stretching of inclusions during heating runs introduced error to
Ths values. The biggest errors are associated with eutectics, but fortunately the information
obtained from eutectics is qualitative and should only be used as a guide to fluid
compositions. These errors therefore did not impact on salinity calculations (except in the
choosing of the most appropriate chemical system). The calculated salinities for most
inclusion populations typically show a 5 wt% total variation in NaCl (and CaCl2). These
variations are no doubt partly due to natural variations in fluid composition, but are also a
result of the inaccuracies in Tmice, Tmhh, and Ths described above. The lack of populations
displaying greater variation than this (except for DG9-6c) suggests that the uncertainty of
individual calculated salinities is likely to be no greater than ±2.5 wt%. This represents an
uncertainty ranging from 5 to 12% of total salinity, however the experimental error may be
Chapter 4
_________________________________________________________________________
4-63
lower given that there is likely a significant natural variation of fluid inclusion
compositions.
Pressure and temperature estimations
Fluid inclusions are usually homogeneous when trapped, and the additional phases
commonly observed at room temperature form later during cooling. Differential
contraction between the fluid and host mineral results in the formation of a vapour bubble,
and saturation of the fluid with solute components can cause precipitation of daughter
minerals (Shepherd et al., 1985). Heating of a fluid inclusion reverses these processes to a
point where the inclusion is once again homogeneous, and the temperature of
homogenisation represents a minimum estimate of trapping temperature. Further
information is required however to gain a closer approximation of the actual trapping
conditions. To illustrate this concept, Figure 4.26a shows a liquid-vapour curve for a L+V
inclusion. With heating, the inclusion follows the L+V curve until, at the point of
homogenisation (Thv) it branches off, following a line of constant density (an isochore).
The slope (i.e. density) of this isochore is dependent on the salinity of the inclusion (e.g.
Brown and Lamb, 1989; Bakker, 2003). The true trapping conditions lie at some point
along this isochore, and to locate this point, independent information about either
temperature or pressure is needed. Using this plot, an independent temperature estimate
can be used to approximate pressures, or conversely independent pressure estimates can be
used to give a closer approximation to actual trapping temperatures. The latter technique is
known as a pressure correction and is routinely applied to homogenisation temperatures.
Homogenisation temperatures and salinities of LV inclusions were used in conjunction
with the BULK and ISOC programs within the FLUIDS computer package (Bakker, 2003)
to construct isochores. These isochores were then used together with lithostatic pressure
estimates, which were calculated based on unit thicknesses and stratigraphic settings of the
prospects (as represented in Figure 3.2), allowing a temperature correction to be applied to
all inclusions. This process is demonstrated for a typical LV inclusion from Igor sample
DG8-9 in Figure 4.26a. The average temperature correction for L+V inclusions in this
sample was +50 °C, which provided more accurate estimates of trapping temperature than
the minimum estimates provided by homogenisation temperatures. Typical isochores for
Chapter 4
_________________________________________________________________________
4-64
all samples are presented in Appendix F, and pressure-corrected trapping temperatures are
included with homogenisation data in Appendix D. Any references to trapping
temperatures determined for fluid inclusions in this study refer to these values (e.g. see
Ttrap in Tables 4.3 and 4.4).
A similar procedure was applied to LVH inclusions, as illustrated in Figure 4.26b. This
procedure is relatively straight forward for LVH inclusions which homogenise by vapour
disappearance (i.e. where Ths < Thvap). Most equations of state, including those utilised in
the FLUIDS package (Bakker, 2003), and other computer programs, have been calculated
for inclusions in which Ths < Thvap, however almost all the inclusions in this study
homogenised via halite dissolution. There is a lack of experimental data defining isochores
for inclusions exhibiting this behaviour, and the most useful guide is provided by the study
of Bodnar (1994), which determined slopes of isochores for 40 wt% NaCl fluids that
homogenise by halite dissolution. His study showed that the gradient of the isochore
changes at the halite liquidus (Ths) and is slightly lower in the single phase (L) field than
in the L+V field. The illustration in Figure 4.26b shows the isochore with a constant
gradient, which was used for calculations in this study because the practical difference
between the two methods is not significant, as discussed below.
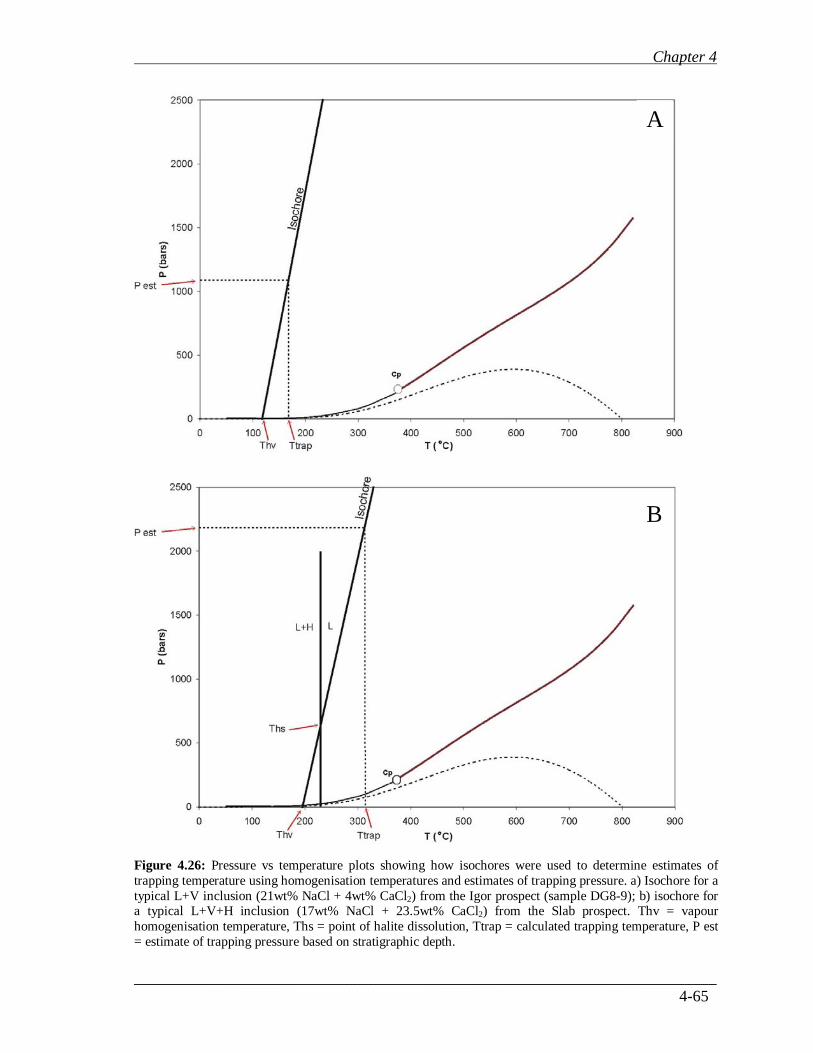
Chapter 4
_________________________________________________________________________
4-65
Figure 4.26: Pressure vs temperature plots showing how isochores were used to determine estimates of
trapping temperature using homogenisation temperatures and estimates of trapping pressure. a) Isochore for a
typical L+V inclusion (21wt% NaCl + 4wt% CaCl2) from the Igor prospect (sample DG8-9); b) isochore for a typical L+V+H inclusion (17wt% NaCl + 23.5wt% CaCl2) from the Slab prospect. Thv = vapour
homogenisation temperature, Ths = point of halite dissolution, Ttrap = calculated trapping temperature, P est
= estimate of trapping pressure based on stratigraphic depth.
B
A
Chapter 4
_________________________________________________________________________
4-66
Isochore slopes from Bodnar (1994) were used to construct isochores for inclusions in this
study for the purpose of estimating trapping temperatures. These isochores were compared
with those calculated using the FLUIDS package in order to assess the level of inaccuracy
introduced by the false assumption that Ths < Thvap. This comparison revealed that the
difference in isochore slope between the two methods was typically about 1 bar/°C or less.
This difference in gradient translated to disparities in trapping temperature of 5 °C or less
for inclusions from the Slab, Hoover and STF prospects (at 2200 bars), 3 °C or less for
Igor (at 1080 bars), and <1°C for Olympic inclusions (at 400 bars), with the Bodnar (1994)
isochores reporting the lower temperatures. The FLUIDS package was deemed suitable for
estimation of trapping temperatures in this study for the following reasons: 1) efficiency.
The FLUIDS package was more useful for calculating trapping temperatures for large
numbers of inclusions (presented in Appendix D); 2) inaccuracies of up to 5°C were
acceptable given the natural variation in Th of tens of degrees in all samples; and 3) there
is no guarantee that the uncertainty of isochores from Bodnar (1994) would be better than
5°C given that his isochores are modelled on a 40 wt% NaCl fluid as opposed to the 30 to
45 wt% NaCl + CaCl2 (plus other minor components) of L+V+H inclusions in this study.
This point in fact highlights a major strength of the FLUIDS package for use in this study.
Integration of the calculations of Naden (1996), allowed the isochors to be modelled using
NaCl + CaCl2 compositions rather than simplified wt% NaCl equivalents.
This third point above also relates to the more recent methodology devised by Becker et
al., (2008). Their study refines calculation of P-T data for a wider range of inclusions that
homogenise by halite disappearance, but uses equations that are valid for Thvap > 200 °C
and Ths > 300 °C. The vast majority of LVH inclusions in the present study have
homogenisation temperatures below these values, and therefore an improvement in
accuracy would not be guaranteed with this newer methodology. Furthermore, when
applied to fluid inclusions (from past studies) with homogenisation temperatures within the
valid range, the method of Becker et al., (2008) resulted in only minor adjustments in
trapping temperatures/pressures.
Independent temperature estimates were obtained at Igor and Slab by Hunt (2005) using
stable isotope data from co-existing mineral pairs at two prospects. At Slab, a co-existing
Chapter 4
_________________________________________________________________________
4-67
dolomite-calcite pair from an early paragenetic stage indicated formation at approximately
300°C, while late-stage barite-chalcopyrite pairs at Igor provided two approximate
temperatures of 240 and 350°C. The temperature estimate of 300 °C at the Slab prospect,
although its timing is not strictly equivalent to analysed fluid inclusions, agrees closely
with trapping temperatures determined from thermometry results and depth estimates,
which have a mean of 300°C. This agreement lends support to the assumed pressure
conditions used for the pressure correction, and therefore supports a depth of formation of
approximately 8km. Stable isotope temperature estimates of 240 and 350 °C are higher
than most fluid inclusion trapping temperatures calculated for Igor fluid inclusions,
however mean Ttrap for L+V+H inclusions (samples DG8-9 and DG9-13) are
approximately 225-230 °C. This suggests that the 240 °C estimate above may be the most
relevant to trapping conditions, although the mineral pairs sampled were paragenetically
later than analysed fluid inclusions.
Isochores constructed for Olympic L+V+H inclusions (Appendix F) suggest that trapping
pressures were at least 900 bars, corresponding to a minimum depth of 3.3 km This depth
is greater than the 0.4 to 1.5 km estimates of Hunt (2005) based on stratigraphic sections of
Delaney, (1981) but is consistent with formation nearer to the surface than other prospects.
These results suggest that at the time of fluid entrapment and IOCG formation, the GLG
was perhaps 2 km thicker than the currently preserved interval. This is a possibility given
the unconformity at the contact between the GLG and the overlying Pinguicula Group.
Similarly, mean homogenisation temperatures of Hoover L+V+H inclusions suggest
trapping pressures slightly above those estimated from stratigraphy. The lower range of
Ths values however are consistent with previous depth estimates of approximately 8 km.
Chapter 4
_________________________________________________________________________
4-68
4.5 Summary
Fluid inclusion petrography and thermometry results have revealed that the vast majority
of fluid inclusions across all studied WSG-hosted IOCG prospects are 2 to 3 phase (LVH
or LV) inclusions with moderate to high temperatures and salinities. Upon closer
inspection however, there are variations in salinity, temperature, pressure, and Ca content
between prospects that may be related to differences in depth of entrapment and/or host-
rock compositions.
Igor
Aqueous LV and LVH inclusions are the dominant types observed at the Igor prospect.
LVH inclusions (most abundant in samples DG8-9 and DG9-13) are most commonly
preserved as primary inclusions which were trapped syn to post brecciation. Salinities
ranged from 16-25 wt% NaCl + 8-21 wt% CaCl2 equivalent. These fluids therefore are rich
in Ca, and are characterised by low mean Na/Ca ratios (~1.5). Trapping temperatures for
these inclusions range from 190 to 280 °C.
LV inclusions are more abundant overall, have lower salinities of 14-27 wt% NaCl + 0-7
wt% CaCl2 equivalent, and are mostly present in secondary inclusion trails (e.g. DG8-9,
DG9-13, DG7-7d). In at least one sample (DG9-13) these inclusions appear to be
intimately related to mineralisation, and they are generally absent amongst inclusion
populations clearly identified as primary or pseudo-secondary. The chemistry of LV
inclusions is similar in all Igor samples except for DG9-6c inclusions, which are highly
variable (Fig. 4.25a). Calcium is less abundant in LV inclusions than in LVH inclusions,
and accordingly mean Na/Ca ratios are much higher (~9). The difference in Na/Ca ratios
between primary LVH and secondary LV fluid inclusion populations is well supported by
further analysis presented in Chapter 5, and suggests there is a temporal variation in
salinity and Ca content. Trapping temperatures are also significantly lower in LV
inclusions, ranging from 110 to 210 °C. CO2 inclusions occur in one Igor sample (DG10-
1b), and these are the only CO2 inclusions observed at any prospect. Calculated pressure
estimates correspond with realistic trapping depths of approximately 6.5km, which are
consistent with estimated stratigraphic depths.
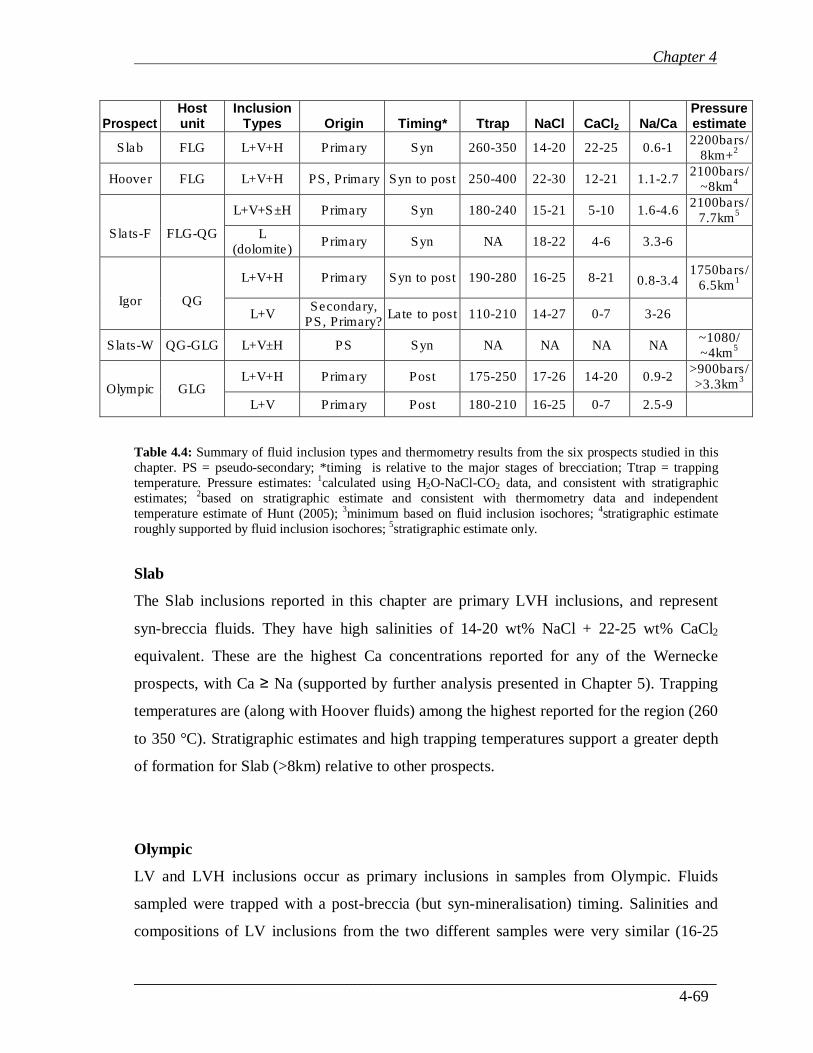
Chapter 4
_________________________________________________________________________
4-69
Table 4.4: Summary of fluid inclusion types and thermometry results from the six prospects studied in this
chapter. PS = pseudo-secondary; *timing is relative to the major stages of brecciation; Ttrap = trapping
temperature. Pressure estimates: 1calculated using H2O-NaCl-CO2 data, and consistent with stratigraphic
estimates; 2based on stratigraphic estimate and consistent with thermometry data and independent
temperature estimate of Hunt (2005); 3minimum based on fluid inclusion isochores; 4stratigraphic estimate
roughly supported by fluid inclusion isochores; 5stratigraphic estimate only.
Slab
The Slab inclusions reported in this chapter are primary LVH inclusions, and represent
syn-breccia fluids. They have high salinities of 14-20 wt% NaCl + 22-25 wt% CaCl2
equivalent. These are the highest Ca concentrations reported for any of the Wernecke
prospects, with Ca ≥ Na (supported by further analysis presented in Chapter 5). Trapping
temperatures are (along with Hoover fluids) among the highest reported for the region (260
to 350 °C). Stratigraphic estimates and high trapping temperatures support a greater depth
of formation for Slab (>8km) relative to other prospects.
Olympic
LV and LVH inclusions occur as primary inclusions in samples from Olympic. Fluids
sampled were trapped with a post-breccia (but syn-mineralisation) timing. Salinities and
compositions of LV inclusions from the two different samples were very similar (16-25
Prospect Host unit
Inclusion Types Origin Timing*
Ttrap
NaCl CaCl2
Na/Ca
Pressure estimate
Slab FLG L+V+H Primary Syn 260-350 14-20 22-25 0.6-1 2200bars/
8km+2
Hoover FLG L+V+H PS, Primary Syn to post 250-400 22-30 12-21 1.1-2.7 2100bars/
~8km4
Slats-F
FLG-QG
L+V+S±H Primary Syn 180-240 15-21 5-10 1.6-4.6 2100bars/
7.7km5
L (dolomite)
Primary Syn NA 18-22 4-6 3.3-6
Igor
QG
L+V+H Primary Syn to post 190-280 16-25 8-21
0.8-3.4 1750bars/
6.5km1
L+V Secondary,
PS, Primary? Late to post 110-210 14-27 0-7 3-26
Slats-W QG-GLG L+V±H PS Syn NA NA NA NA ~1080/ ~4km
5
Olympic GLG L+V+H Primary Post 175-250 17-26 14-20 0.9-2
>900bars/ >3.3km
3
L+V Primary Post 180-210 16-25 0-7 2.5-9
Chapter 4
_________________________________________________________________________
4-70
wt% NaCl + 0-7 wt% CaCl2 equivalent) including inclusions in quartz and dolomite Fig.
4.25c). LVH inclusions are more saline with higher Ca contents (17-26 wt% NaCl + 14-20
wt% CaCl2 equivalent), and accordingly (in a similar pattern to Igor fluids), Na/Ca ratios
are much higher for LV inclusions (up to 9) than for LVH inclusions (~1.2). Isochores
constructed from fluid inclusion data suggest the Olympic prospect formed at a minimum
depth of 3.3km, which is suggestive of a slightly thicker GLG than was estimated in
previous stratigraphic reconstructions, but is consistent with Olympic forming at a
shallower depth than all other prospects.
Hoover
Inclusions observed in Hoover samples were dominantly primary and pseudo-secondary
LVH inclusions, with a syn- to post-breccia timing. These inclusions have low eutectics
(H2O-NaCl-CaCl2 system), and salinities higher than all other prospects (22-30 wt% NaCl
+ 12-21 wt% CaCl2 equivalent). They are Ca-rich with mean Na/Ca ratios of around 1.5,
and there was a good correlation of results from different samples. Trapping temperatures
are high, ranging from 250 to 400 °C, similar to those at Slab. These high temperatures
supported the significant depth of formation (~8km) suggested by stratigraphic estimates.
Slats-Frosty
Primary LVS±H inclusions in fluorite and L inclusions in dolomite were trapped during
the main stages of brecciation. They have very similar compositions, with moderate
salinities of 15-22 wt% NaCl + 4-10 wt% CaCl2 equivalent. Trapping temperatures are
also moderate in relation to other prospects (180 to 240 °C). Dawsonite daughter crystals
infer high concentrations of dissolved Al and CO2, however no CO2 inclusions have been
found at this prospect.


![11620 Biscayne Blvd - LoopNet · Sale Conditions : [object Object] No. Lots : 1 Zoning Description : Commercial 11620 Biscayne Blvd $8,950,000 Prime development site of 5 folios totaling](https://img.pdfslide.us/doc/110x75/5f0c17917e708231d433b3a2/11620-biscayne-blvd-loopnet-sale-conditions-object-object-no-lots-1-zoning.jpg)