Embed Size (px)
Citation preview
ISSN: 2732-3781 DOI: 10.52398/gjsd.2021.v1.i1.pp37-49
GJSD Vol. 1 No. 1 (2021)
GiLE Journal of Skills Development
Getting closer to the needs of the labour market: a system measuring soft skills at a Hungarian rural
university
Zsuzsanna Tóth
Budapest Business School, Hungary
Marietta Balázsné Lendvai
University of Pannonia, Hungary
Judit Beke
Budapest Business School, Hungary
Abstract
A key measure of higher education’s success is the extent to which it can provide the labour
market with graduates that excel not only in terms of their professional training but also in terms
of their soft skills. To that end, the competences of students entering university must first be
diagnosed. This paper presents a pilot study of such a measurement system, together with first-
year results obtained by a rural university faculty. Equipped with better information about its
freshman students, such a university can begin to address the revealed competence deficiencies
actively, and, over the course of an entire training cycle, further improve the labour market
value of the young people when they come to graduate. Provisional recommendations are made
at the end of this paper; however, further data analysis, once undertaken, may lend further
support to the practical approach outlined here.
Keywords: competences, competence development, employability, soft skills, student success,
training needs diagnosis
38 GJSD Vol. 1 No. 1 (2021)
1. Introduction
In order to deliver a competitive higher education system in today’s knowledge-based world
economy, a higher education action plan for 2016-2020 was introduced by the Hungarian
government (1359/2017: Mid-term Policy Strategy of Gear Shift in Higher Education, Action
Plan 2016-2020). One of the key pillars of this plan has been to support the success of
students. The top targets have been to improve the competence level of enrolled students, and
to urge the adoption of programmes aimed at reducing dropout, e.g. extracurricular courses
aiming at language and professional skills improvement (Action plan, 2016-2020). Thus, in line
with the trends of a rapidly changing world, higher education institutions face an ever-
increasing challenge concerning soft competency development that goes beyond boosting
students’ employability and labour market value by the development of professional (hard)
competencies.
In response to the Mid-term Policy Strategy of Gear Shift in Higher Education, the shift to ‘a
Higher Gear’ in higher education was elaborated in the Hungarian Human Resources
Development Operative Program Application (EFOP in Hungarian) titled EFOP 3.4.3-16
‘Innovative Solutions for Improving the Quality of and Access to the Higher Educational
Training Courses of Budapest Business School’. Within its framework - as a pilot study - the
following actions were taken at the Zalaegerszeg campus of Budapest Business School that is
a faculty located in Western Hungary:
1. diagnosing the existing competences of first year full-time students and preparing
personal competence maps for them;
2. recommending improvement programmes to the students based on the diagnosis; and
3. measuring the competences of full-time students directly before graduation.
The programme provides opportunities for the students to improve their competence levels and
in addition, it increases their chances of graduation, their labour market prospects and
potentially, also their labour market value. It is not without reason that the smallest faculty of
the university has been selected to develop and test the measurement system, as the whole range
of the first-year students are more easily accessible and could be involved in the study at such
a small faculty. As part of the pilot programme, the last query was conducted in 2020-2021.
This study presents both the system approach and the results of competence measurements of
students entering university taken in Academic Year 2017/2018. This paper will now present a
“best practice” competence measurement framework, one informed by both the researchers’
practical experience and known labour market expectations.
Within the framework of a pilot programme, we have developed measurement instruments that
focus on the soft skills of students in one higher education institution, with a view to assisting
companies' recruitment, selection, competence, and career management activities. Key
competences such as creativity, problem solving, stress management etc. have been analysed
using these instruments. Following completion of the pilot research, data will be collected for
all five years, after which a final measurement system and methodology will be extended to all
faculties of the university. A further widening of the research will involve studying the way soft
skills are measured by both domestic and international universities.
39 GJSD Vol. 1 No. 1 (2021)
2. Methods & Materials
2.1. Models and systems forming the basis of a questionnaire focusing on the soft
competences
Before establishing the framework system of competence measuring, we studied international
and domestic trends and reviewed various models and assessment systems which are not
primarily related to the Detailed Project Reports (DPR-based career tracking practices of
universities) which focus less on soft skills. In developing the pilot system, we relied on
solutions that are in line with the expectations of the labour market and within that, are
increasingly focusing on soft skill competencies.
a) In this section, we present the most important of the sources that we used to develop
our own measurement system that can be used by our university faculty.
b) The key factors of emotional intelligence that were presented in the book of Stephen R.
Covey titled ‘The 8th Habit: from Effectiveness to Greatness’ (Covey, 1999). These key
factors are summarised in Table 1.
TABLE 1. FIVE KEY COMPONENTS OF EMOTIONAL INTELLIGENCE THROUGH THE SEVEN HABITS
Key components of emotional intelligence Habits
Self-awareness 1. Be proactive
Personal motivation 2. Begin with the end in mind
Self-regulation 3. Put first things first
7. Sharpen the saw
Empathy 5. Seek first to understand, then to be understood
Social and communication skills 4. Think win/win 5. Seek first to understand, then to be understood
6. Synergize Source: own compilation, based on Covey, 2004, p. 346
c) The soft skills cube of André Moritz (Moritz, n.d.), containing 6 competence fields,
within which there are 26 key competences. We chose to highlight the following factors
from the cube model: empathy, resourcefulness, moderating and visualisation skills,
presentation skills, self-promotion skills, knowledge of human nature, persuasion skills,
conflict management skills, critical thinking, motivation skills, creativity, decision-
making skills, and time management.
d) Thomas-Kilmann conflict mode questionnaire containing 30 statement pairs (Thomas
and Kilmann,1970).
e) The mindset model of Carol S. Dweck published in 2015, in which she suggested that
if we look at ourselves and the world with a growth mindset, it will motivate us to
hunger knowledge and be steadfast, due to which we will be accomplish more in every
area of our life. The growth mindset therefore means that despite the difficulties
(actually more in a difficult situation) we are determined to grow and develop. (Dweck,
2015, p. 19) This new approach also highlights the role of creativity, perseverance and
flexibility.
f) The 2014 competence system of digital citizenship, which “incorporates the model of
digital communication and use of equipment in harmony with the 21st century,
value creating activity performed on online forums and its impacts, as well as the
ethical, legal, mental and physical health status related aspects of the activity performed
with digital equipment.” (Racsko, 2016, p. 46.).
40 GJSD Vol. 1 No. 1 (2021)
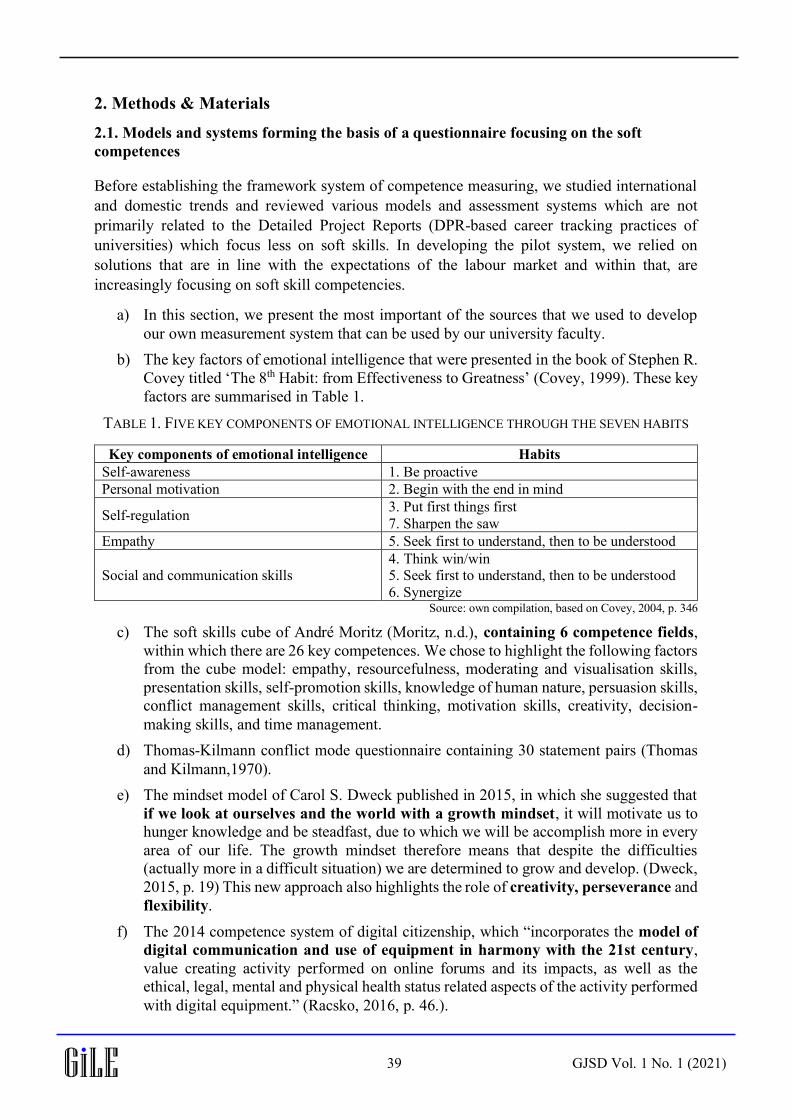
g) The most important skills published by the World Economic Forum in 2017 can be seen
in Figure 1.
FIGURE 1. TOP 10 SKILLS
Source: World Economic Forum (2017/3)
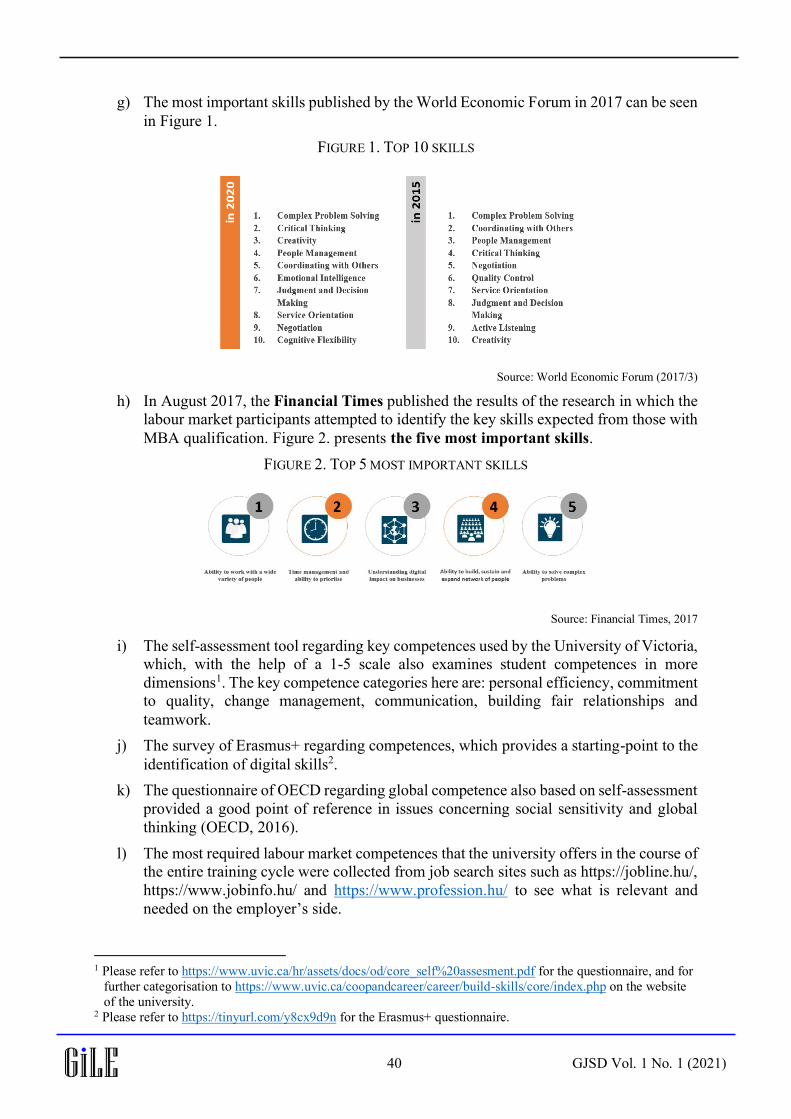
h) In August 2017, the Financial Times published the results of the research in which the
labour market participants attempted to identify the key skills expected from those with
MBA qualification. Figure 2. presents the five most important skills.
FIGURE 2. TOP 5 MOST IMPORTANT SKILLS
Source: Financial Times, 2017
i) The self-assessment tool regarding key competences used by the University of Victoria,
which, with the help of a 1-5 scale also examines student competences in more
dimensions1. The key competence categories here are: personal efficiency, commitment
to quality, change management, communication, building fair relationships and
teamwork.
j) The survey of Erasmus+ regarding competences, which provides a starting-point to the
identification of digital skills2.
k) The questionnaire of OECD regarding global competence also based on self-assessment
provided a good point of reference in issues concerning social sensitivity and global
thinking (OECD, 2016).
l) The most required labour market competences that the university offers in the course of
the entire training cycle were collected from job search sites such as https://jobline.hu/,
https://www.jobinfo.hu/ and https://www.profession.hu/ to see what is relevant and
needed on the employer’s side.
1 Please refer to https://www.uvic.ca/hr/assets/docs/od/core_self%20assesment.pdf for the questionnaire, and for
further categorisation to https://www.uvic.ca/coopandcareer/career/build-skills/core/index.php on the website
of the university. 2 Please refer to https://tinyurl.com/y8cx9d9n for the Erasmus+ questionnaire.
41 GJSD Vol. 1 No. 1 (2021)
2.2. Focal areas of the competence measurement system
We established the competence measurement system after having revised the above detailed
studies in which we focused on the soft skill factors. These include all skills, which, in addition
to the professional knowledge (hard skills) fundamentally specify the adapting, motivation,
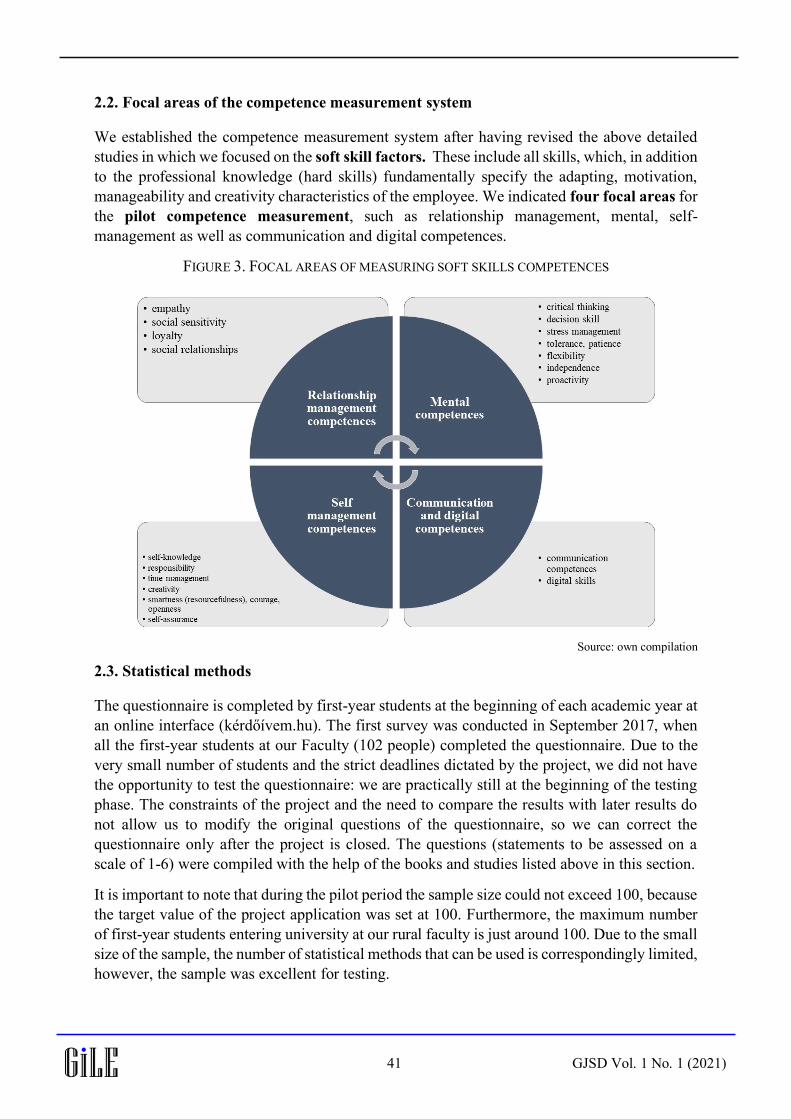
manageability and creativity characteristics of the employee. We indicated four focal areas for
the pilot competence measurement, such as relationship management, mental, self-
management as well as communication and digital competences.
FIGURE 3. FOCAL AREAS OF MEASURING SOFT SKILLS COMPETENCES
Source: own compilation
2.3. Statistical methods
The questionnaire is completed by first-year students at the beginning of each academic year at
an online interface (kérdőívem.hu). The first survey was conducted in September 2017, when
all the first-year students at our Faculty (102 people) completed the questionnaire. Due to the
very small number of students and the strict deadlines dictated by the project, we did not have
the opportunity to test the questionnaire: we are practically still at the beginning of the testing
phase. The constraints of the project and the need to compare the results with later results do
not allow us to modify the original questions of the questionnaire, so we can correct the
questionnaire only after the project is closed. The questions (statements to be assessed on a
scale of 1-6) were compiled with the help of the books and studies listed above in this section.
It is important to note that during the pilot period the sample size could not exceed 100, because
the target value of the project application was set at 100. Furthermore, the maximum number
of first-year students entering university at our rural faculty is just around 100. Due to the small
size of the sample, the number of statistical methods that can be used is correspondingly limited,
however, the sample was excellent for testing.
42 GJSD Vol. 1 No. 1 (2021)
We did not find any studies looking at the soft skills of higher education students, so we do not
have the opportunity to reflect on existing international or even specifically Hungarian
experiences in our research. In this article, we can only present the results and connections we
discovered in the case of the first-year students of our faculty. During the compilation of the
questions and the development of the analysis methodology, it was a limitation that we did not
find any description or existing questionnaire specifically related to the assessment of soft skills,
and the project is primarily about analysing students' individual competencies (this specifically
means soft skills). This means that a short description was prepared for each student
individually, based on their answers to the questions of the questionnaire. The general analysis
and assessment of the questionnaire is an additional benefit of the project implementation.
Based on the 21st century expectations and labour market trends described above, we finally
created a questionnaire of 147 variables, 30 of which examine the student’s demographic
background and progress to date, and 117 statements relate to soft skills. We hope that as the
number of items increases getting closer to the end of the project, we will get more accurate
and generalizable results. This study describes our experiments and the results of the analysis
for one single group of students started their studies in 2017.
In addition to this, our main aim was to identify the impacts of the different factors that have
an influence on first year students’ competence levels. We found that these influencing factors
are: the impacts of previous studies, family background and certain character traits;
The questionnaire has two parts. There are questions regarding the background variables in the
first part and questions examining the competences in the second part.
The background variables can be categorised in five groups:
• basic demographic data;
• questions regarding previous studies, existing professional competences;
• questions regarding family background, parents;
• questions regarding activity, attitude in community.
We provided a total of 100 items for the examination of competences, which the students had
to assess in a scale of 1-6. The scale used in the questionnaire has the following characteristics:
• we used a balanced scale;
• we established an even scale to avoid there being a middle value;
• compelling scale: we did not provide ‘I do not know’ or ‘I do not remember’ options.
In the interest of achieving the research targets we used one-, two- and multiple-variable
statistical methods.
2.3.1. One-variable statistics
Among our tools used for the presentation of the changes in the background variables there is
only the calculation of the distributions and mode, as the majority of these variables are not of
metric measurement level (e.g. residence, qualification, post). A smaller number of variables
are metric: here, in addition to the distribution and mode it is also possible to calculate averages
and dispersion indicators.
43 GJSD Vol. 1 No. 1 (2021)
In the course of competence examination, we calculated competence indexes in order to clean
the analysis and make it clear: the four examined competence sets each include different
numbers of partial competences and items.
In the interest of balancing the examination we worked with average scores within the different
categories, which actually means the following averages:
• 19 partial indexes for the top competence areas (empathy, social sensitivity, loyalty);
• 4 complex indexes for the competence factors: average of the competence areas
belonging to the different competence sets (relationship management, mental
competence, self-management, communication and digital competences);
• 1 summary index: the average of the four competence sets.
The value of the partial indexes thus calculated can be between 1 and 6 points. Based on the 19
partial indexes and the 4 complex indexes the following factors can be examined:
• What points were scored by the majority of the students within the different categories?
• What average score is typical of the first-year students?
• Do the majority of the students have over or under average skills?
The answer to these questions requires mode, average and asymmetry calculations in the
different areas. In the analyses, the given year is also worth examining with quantiles, with the
partial indexes taken into account. Based on the terciles, the typical point values scored by the
lowest third of the students showing a very weak performance, the points scored by the
‘average’ third and the top third of the students can be established providing a more overall
picture of the attitude and skills of the examined year.
2.3.2. Two- and multiple-variable statistics
To test the statements of the questionnaire and to reduce the present variable set of relatively
large number, we performed exploratory factor analysis. In addition to this, the purpose of the
analysis is also to establish the competences with the biggest influence on the final, composite
competence index. To establish it, we also used multi-variable regression analysis.
Factor analysis is a method, the essence of which is to produce factors from the original variable
structure, which do not correlate with each other. The data are standardised as the first step to
allow factor extraction based on the principle of the unweighted least squares. The advantage
of this method is that the distribution of the variables is unimportant in this case. (Sajtos-Mitev,
2007).
To meet the KMO conditions and achieve 60% explanatory force, the low communality
variables were eliminated in the first step, after which the low factor weight variables were
discarded. We used the Varimax method in the course of factor rotation, thereby maximising
the variance explained by the factors. The advantage of this method is the better separation of
the factors during the rotation, by which the interpretation of the factors becomes easier (Sajtos-
Mitev, 2007).
While categorising the students it must also be considered that if in the case of any partial index
a student has ‘average’ skills in total, however, his/her answers given to the different items are
more scattered. This problem can be managed with cluster analysis, where grouping is
performed on the basis of several variables, by which a more realistic picture can be received
44 GJSD Vol. 1 No. 1 (2021)
about the different student groups. The procedure is performed with the C-centroid method.
With the help of this relations, connection or even contradictions may be revealed between the
different questions.
Further purpose of the analysis is to reveal the social factors, which may influence the students’
competences, i.e. it must be examined whether there is any relation between the background
variables and the different competences. We performed χ2 tests with the help of cross tables in
this interest, where the independent variables were given by the background factors and the
dependent variables by the competence partial indexes. If we find significant connections, we
calculate the strength of association appropriate for the scale of the variables. In addition, the
analyses also include variance analysis to compare the average competence scores of student
groups of different background and characteristics. We calculate with 95% reliability level in
the course of analysing the connections between variables.
3. Results and discussion
The results gained from the answers given by the full-time students entering university and
enrolled in autumn of the 2017/18 academic year are summarised in this section.
3.1. Key characteristics of the students involved in the survey.
The questionnaire was completed by 102 full-time first year student, 60 females and 42 males.
The majority of those filling in the questionnaire live in towns, among them nearly 50% in the
county seat town, 12% in other towns in the region or county that are not a county seat, one
person resides in the capital, and 40% of those filling in the questionnaire live in settlements
or villages. Only 25.5% of the students involved in the questionnaire live in boarding. 31% of
the first-year students filling in the questionnaire study in higher educational vocational training
and 69% are in training leading to university degree. 11 persons of the latter group attend the
business informatics faculty. 19 persons (18.6%) of the 102 interviewed students participate
in the dual-training system (the so-called dual training is a special form of training in higher
education. Our University is part of this system where the student has a job at a company that
has a contract with the university. In this way, the student receives academic and corporate
training in parallel).
The averages were between the value of 4 - 4.5 in every examined competence group, which is
a clear indication of the need for competency development or improvement. The interviewed
students mostly found their following competences the weakest, requiring most development:
• Relationship management: work in team, social relationships, contact building,
corporate and management skills.
• Mental competences: stress and conflict management, stubbornness, self-control,
problem solving, analysing skill, patience, calmness, resoluteness, punctuality, memory,
solid power of conception.
• Self-management competences: resourcefulness, forgetfulness, self-assurance,
scheduling, sense of time, time management, self-assessment, creativity, diligence
• Communication and digital competences: communication, command of language,
public performance, written communication, composition, English language,
information technology and digital skills.
45 GJSD Vol. 1 No. 1 (2021)
3.2. Impact of the student background on the competences
In the case of students who started their university studies in 2017, we found differences
originating from some socialisation and demographic phenomena, factors in four particular
competency areas. These differences appear in the area of proactivity, social sensitivity,
empathy and flexibility.
3.2.1. Proactivity
Difference in the area of proactivity (statements of question No. 34) were shown in two
background variables: on the one hand, the women typically described themselves with higher
scores in answer to the questions regarding mental competence proactivity. There was even
more significant difference among the students in connection with a question regarding the
future (In what job can you envisage yourself?): the relatively realistic self-assessment of the
students is indicated by the fact that those preferring to work in the background have lower
level if initiative and reaction skills, than those more willing to work in the front line.
3.2.2. Social sensitivity
Between the average of the points scored to statements regarding social sensitivity within the
relationship management competence (statements of question No. 29), there are significant
differences based on two demographic factors: type of residence and the highest education of
the mother. On the basis of the averages, it can be established that the social sensitivity of our
only one student from the capital is significantly higher than that of the rest of the students,
followed by the students coming from other towns, settlements, villages, and finally from the
county seat (mostly from Zalaegerszeg) with the lowest sensitivity level.
This conclusion definitively deserves attention as nearly 50 per cent of our students are from
Zalaegerszeg. In the course of the training and development it would be worth paying attention
to this area to be improved, too. It would not be rejectable to make sure that these students
participate in some sensitising training. It is interesting to note that the highest educational
achievement of the mother is also influential, insofar as that the children of less educated
mothers have been shown to be more sensitive than those whose mother has higher level of
education.
Social sensitivity - based on the calculations - is also influenced by the pass mark of the
students. As opposed to our previous assumptions higher mark does not automatically mean a
higher level of social sensitivity. Although the students enrolled with the highest marks were
proven most tolerant, they were followed by students with average and lower performance.
There have been further differences in the social sensitivity based on the training the student
presently participates in: it is interesting that the highest points were scored by students in the
higher educational vocational training in the business administration and management faculty,
and the finance and accounting faculty students in training leading to university degree. It is
less surprising, though, that the least sensitive students study business informatics.
3.2.3. Empathy
We found significant differences in three areas of empathy (statements of question No. 28).
According to this the pass mark and the sports activity affects empathy and the degree of
empathy also differs according to the envisaged work area of the person in the future. Data did
46 GJSD Vol. 1 No. 1 (2021)
not cause surprise in terms of the work area to be chosen: the more empathic students and those
more sensitive to others would like to work with people in the front line.
It is an interesting result that based on the regularity of the sports activity and the deepness of
the commitment to sports there are significant differences among the students. Professional
sportspersons and those who regularly go in for sports are more empathic, pay more attention
to their fellow beings than those who do not perform such activity. This confirms the ideas
concerning sports related personality development. As before, the results based on pass mark
are not wholly unequivocal, and we cannot specify a ‘rule of thumb’ for this connection: a
higher level of empathy is not the result of either an outstanding or a low pass mark. However,
it can be observed that the students with very low and outstanding pass marks are the most
empathic ones.
3.2.4. Flexibility, independence
Within mental competence, in the statements regarding flexibility and independence (question
No. 33), we can observe that the extent to which a student is active in the community and/or
undertakes study tasks in addition to the mandatory ones has a large impact on these
characteristics. The students often participating in academic competitions and willing to
perform community tasks assessed themselves as more flexible, independent than the more
passive students. In connection with the work area to be chosen, the “more resourceful” students
would – by nature – be more willing to work in the front line, where independent decision-
making and adaptability are important.
3.3. Latent structure and student groups
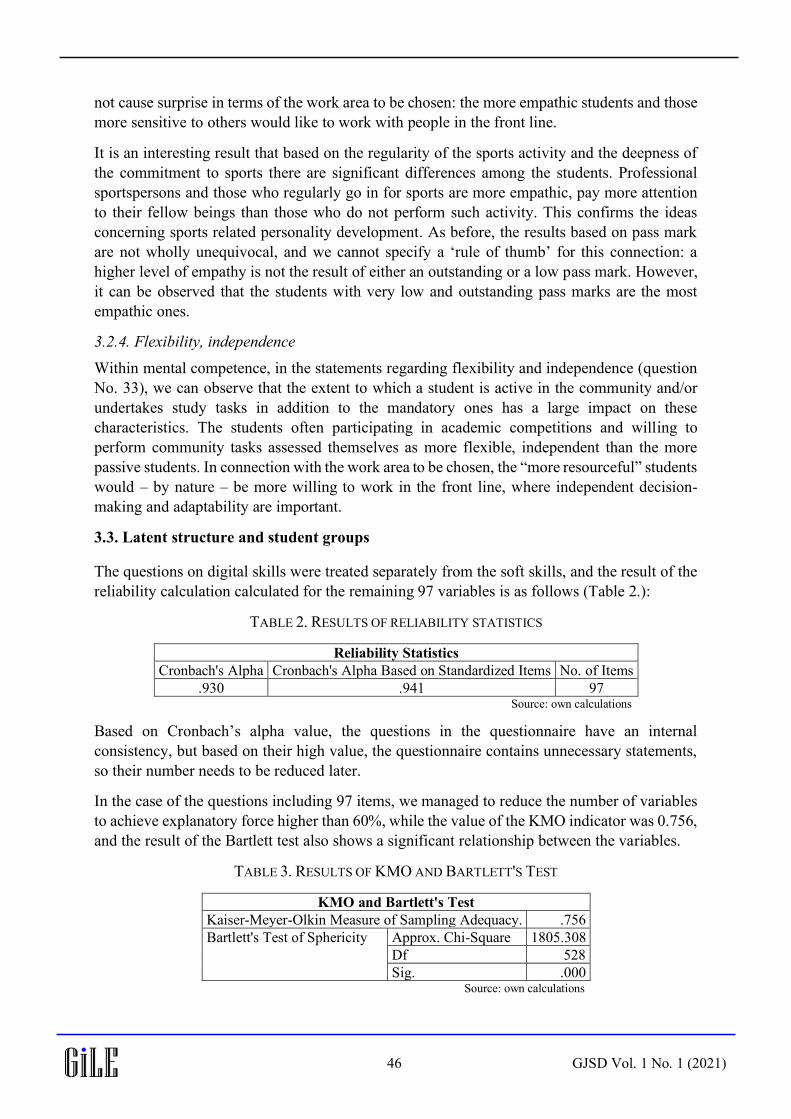
The questions on digital skills were treated separately from the soft skills, and the result of the
reliability calculation calculated for the remaining 97 variables is as follows (Table 2.):
TABLE 2. RESULTS OF RELIABILITY STATISTICS
Reliability Statistics
Cronbach's Alpha Cronbach's Alpha Based on Standardized Items No. of Items
.930 .941 97 Source: own calculations
Based on Cronbach’s alpha value, the questions in the questionnaire have an internal
consistency, but based on their high value, the questionnaire contains unnecessary statements,
so their number needs to be reduced later.
In the case of the questions including 97 items, we managed to reduce the number of variables
to achieve explanatory force higher than 60%, while the value of the KMO indicator was 0.756,
and the result of the Bartlett test also shows a significant relationship between the variables.
TABLE 3. RESULTS OF KMO AND BARTLETT'S TEST
KMO and Bartlett's Test
Kaiser-Meyer-Olkin Measure of Sampling Adequacy. .756
Bartlett's Test of Sphericity Approx. Chi-Square 1805.308
Df 528
Sig. .000 Source: own calculations
47 GJSD Vol. 1 No. 1 (2021)
The questions “remaining” in the course of the procedure and the factors defined by us on this
basis were the following: Flexibility and adaptability, Firmness, consistency, Self-confidence,
resoluteness, Purposiveness, consistency, Stress management, tolerance, and Time
management, punctuality.
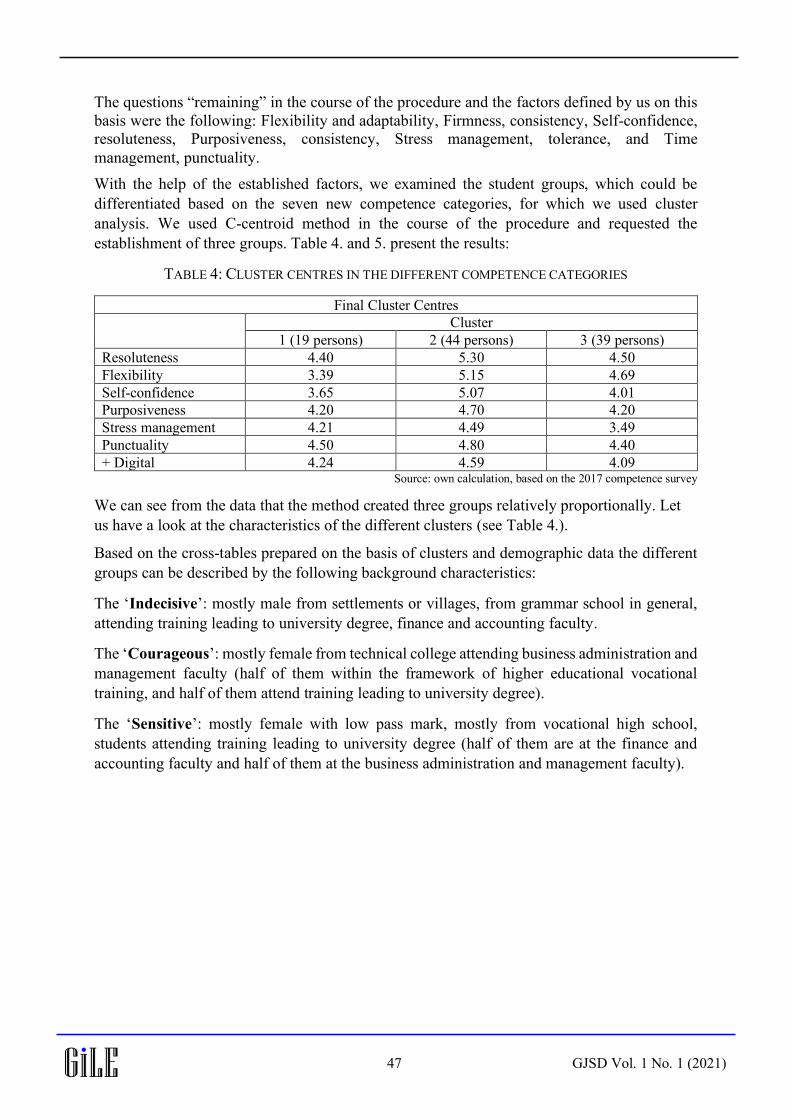
With the help of the established factors, we examined the student groups, which could be
differentiated based on the seven new competence categories, for which we used cluster
analysis. We used C-centroid method in the course of the procedure and requested the
establishment of three groups. Table 4. and 5. present the results:
TABLE 4: CLUSTER CENTRES IN THE DIFFERENT COMPETENCE CATEGORIES
Final Cluster Centres
Cluster
1 (19 persons) 2 (44 persons) 3 (39 persons)
Resoluteness 4.40 5.30 4.50
Flexibility 3.39 5.15 4.69
Self-confidence 3.65 5.07 4.01
Purposiveness 4.20 4.70 4.20
Stress management 4.21 4.49 3.49
Punctuality 4.50 4.80 4.40
+ Digital 4.24 4.59 4.09 Source: own calculation, based on the 2017 competence survey
We can see from the data that the method created three groups relatively proportionally. Let
us have a look at the characteristics of the different clusters (see Table 4.).
Based on the cross-tables prepared on the basis of clusters and demographic data the different
groups can be described by the following background characteristics:
The ‘Indecisive’: mostly male from settlements or villages, from grammar school in general,
attending training leading to university degree, finance and accounting faculty.
The ‘Courageous’: mostly female from technical college attending business administration and
management faculty (half of them within the framework of higher educational vocational
training, and half of them attend training leading to university degree).
The ‘Sensitive’: mostly female with low pass mark, mostly from vocational high school,
students attending training leading to university degree (half of them are at the finance and
accounting faculty and half of them at the business administration and management faculty).
48 GJSD Vol. 1 No. 1 (2021)
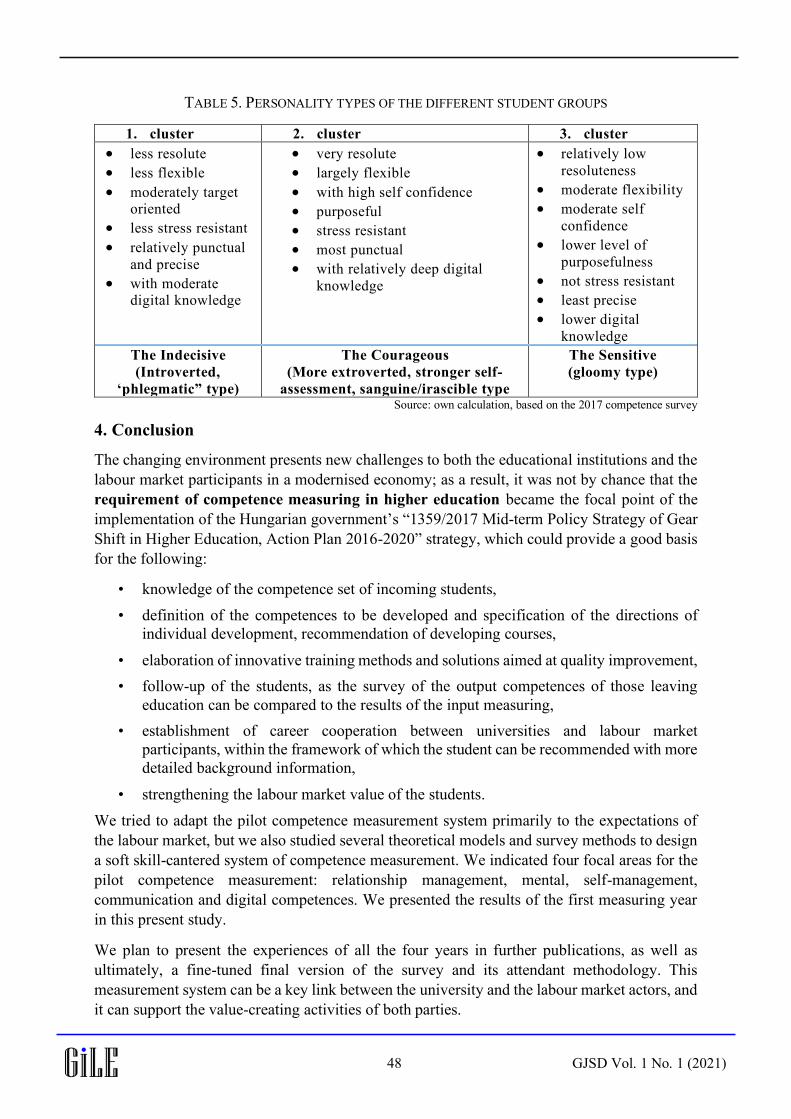
TABLE 5. PERSONALITY TYPES OF THE DIFFERENT STUDENT GROUPS
1. cluster 2. cluster 3. cluster
• less resolute
• less flexible
• moderately target oriented
• less stress resistant
• relatively punctual
and precise
• with moderate digital knowledge
• very resolute
• largely flexible
• with high self confidence
• purposeful
• stress resistant
• most punctual
• with relatively deep digital
knowledge
• relatively low
resoluteness
• moderate flexibility
• moderate self
confidence
• lower level of
purposefulness
• not stress resistant
• least precise
• lower digital
knowledge
The Indecisive
(Introverted,
‘phlegmatic” type)
The Courageous
(More extroverted, stronger self-
assessment, sanguine/irascible type
The Sensitive
(gloomy type)
Source: own calculation, based on the 2017 competence survey
4. Conclusion
The changing environment presents new challenges to both the educational institutions and the
labour market participants in a modernised economy; as a result, it was not by chance that the
requirement of competence measuring in higher education became the focal point of the
implementation of the Hungarian government’s “1359/2017 Mid-term Policy Strategy of Gear
Shift in Higher Education, Action Plan 2016-2020” strategy, which could provide a good basis
for the following:
• knowledge of the competence set of incoming students,
• definition of the competences to be developed and specification of the directions of
individual development, recommendation of developing courses,
• elaboration of innovative training methods and solutions aimed at quality improvement,
• follow-up of the students, as the survey of the output competences of those leaving
education can be compared to the results of the input measuring,
• establishment of career cooperation between universities and labour market
participants, within the framework of which the student can be recommended with more
detailed background information,
• strengthening the labour market value of the students.
We tried to adapt the pilot competence measurement system primarily to the expectations of
the labour market, but we also studied several theoretical models and survey methods to design
a soft skill-cantered system of competence measurement. We indicated four focal areas for the
pilot competence measurement: relationship management, mental, self-management,
communication and digital competences. We presented the results of the first measuring year
in this present study.
We plan to present the experiences of all the four years in further publications, as well as
ultimately, a fine-tuned final version of the survey and its attendant methodology. This
measurement system can be a key link between the university and the labour market actors, and
it can support the value-creating activities of both parties.
49 GJSD Vol. 1 No. 1 (2021)
References
Balázsné, M. - Tóth, Zs. (2017). Hallgatói
kompetenciamérés rendszere, EFOP-3.4.3-16-2016-
00020 „Felsőoktatási intézményi fejlesztések a felsőfokú
oktatás minőségének és hozzáférésének együttes javítása
érdekében”. Project documentation, Zalaegerszeg,
Budapest Business School
Balázsné, M. -Tóth, Zs. (2018). Kutatási jelentés a
bemeneti kompetenciamérésről 2017/18-as tanév, EFOP-
3.4.3-16-2016-00020 „Felsőoktatási intézményi
fejlesztések a felsőfokú oktatás minőségének és
hozzáférésének együttes javítása érdekében”. Project
documentation, Zalaegerszeg, Budapest Business School.
Covey, S. R. (1999). The 7 Habits of Highly Effective
People. New York. Simon & Schuster.
Covey, S. R. (2004). The 8th Habit: from Effectiveness to
Greatness. New York: Free Press.
Dweck, C. S. (2015). Szemléletváltás– A siker új
pszichológiája. Budapest: HVG Kiadó Zrt.
Financial Times (2017). What employers want from
MBA graduates - and what they don’t.
https://www.ft.com/content/3c380c00-80fc-11e7-94e2-
c5b903247afd?mhq5j=e6 (Retrieved: 20 October 2020)
Fokozatváltás a felsőoktatásban középtávú szakpolitikai
stratégia 2016:
http://www.kormany.hu/download/b/fa/11000/EMMI%2
0fokozatv%C3%A1lt%C3%A1s%20fels%C5%91oktat%
C3%A1s%20cselekv%C3%A9si%20terv%20Sajt%C3%
B3%20%C3%A9s%20Kommunik%C3%A1ci%C3%B3s
%20F%C5%91oszt%C3%A1ly%2020170627.pdf
(Retrieved: 10 October 2017)
Megvalósíthatósági Tanulmány (2016). Emberi Erőforrás
Fejlesztési Operatív Program, Felsőoktatási intézményi
fejlesztések a felsőfokú oktatás minőségének és
hozzáférhetőségének együttes javítása érdekében c.
pályázati felhívás, EFOP-3.4.3-16 kódszámú projekt:
„Innovatív megoldásokkal a BGE felsőfokú képzései
minőségének és hozzáférhetőségének javításáért”
Moritz, A. (n.d.). Der Soft Skills Würfel im Überblick.
https://www.soft-skills.com/soft-skills-wuerfel/
(Retrieved: 15 October 2020)
OECD (2016). Global Competency for an Inclusive
World; https://www.oecd.org/education/Global-
competency-for-an-inclusive-world.pdf (Retrieved: 24
October 2017)
Racsko, R. (2016). Összehasonlító vizsgálatok a digitális
átállás módszertani megalapozásáról. Eger: Eszterházy
Károly Egyetem Neveléstudományi doktori Iskola, PhD-
értekezés. https://doi.org/10.15773/EKF.2017.002.
Sajtos, L - Mitev, A. (2007). SPSS kutatási és
adatelemzési kézikönyv; Budapest: Alinea Kiadó
Thomas, K. W. - Kilmann, Ralph H. (1970). The Thomas
Kilmann Conflict Mode Instrument Test:
https://careerassessmentsite.com/tests/thomas-kilmann-
tki-tests/about-the-thomas-kilmann-conflict-mode-
instrument-tki/ (Retrieved: 22 October 2017)
World Economic Forum (2017). These countries are
facing the greatest skills shortages
https://www.weforum.org/agenda/2016/07/countries-
facing-greatest-skills-shortages/ (Retrieved: 24 October
2017.)