Embed Size (px)
Citation preview
Gigatechnology: Developing Sustainable Urban Infrastructure to Solve Gigaton
ProblemsChangjiang River Scientific Research
Institute (CRSRI)Wuhan, China, June 4, 2018
John C. Crittenden, Ph.D., P.E., N.A.E. (US & China) Director of the Brook Byers Institute of Sustainable
SystemsGeorgia Research Alliance Eminent Scholar of
Sustainable SystemsHightower Chair of Civil and Environmental
Engineering
Brook Byers Institute for Sustainable Systems, Georgia Institute of Technology, Atlanta, GA
E-Mail: [email protected]
The largest systems in which humans manipulate mass and energy
Outline• What is Sustainability and the
Gigaton Problem?
• How to Create More Sustainable and Resilient Urban Infrastructure:
– Infrastructure Ecology
– Emergent Properties
• The Hyper Nexus of Water, Energy, Land Use, Transport, Buildings, Citizens, etc., and Technological Options
• Managing Complexity and Putting It All Together
• Summary
Sustainable Systems We need to recreate the anthroposphere
to exist within the means of nature. That is, use renewable resources that nature provides and generate waste nature can assimilate without overwhelming natural cycles. We also need to generate knowledge and technology to improve the environment and the human condition.
This will require us to examine the interactions between the natural, engineered, social and economic systems.
First Premise of ‘Sustainability’
• Generate waste that nature can assimilate without overwhelming natural cycles.
• Need to look at fate of toxics, Nitrogen, Phosphorus, Water, and Carbon cycles and more.
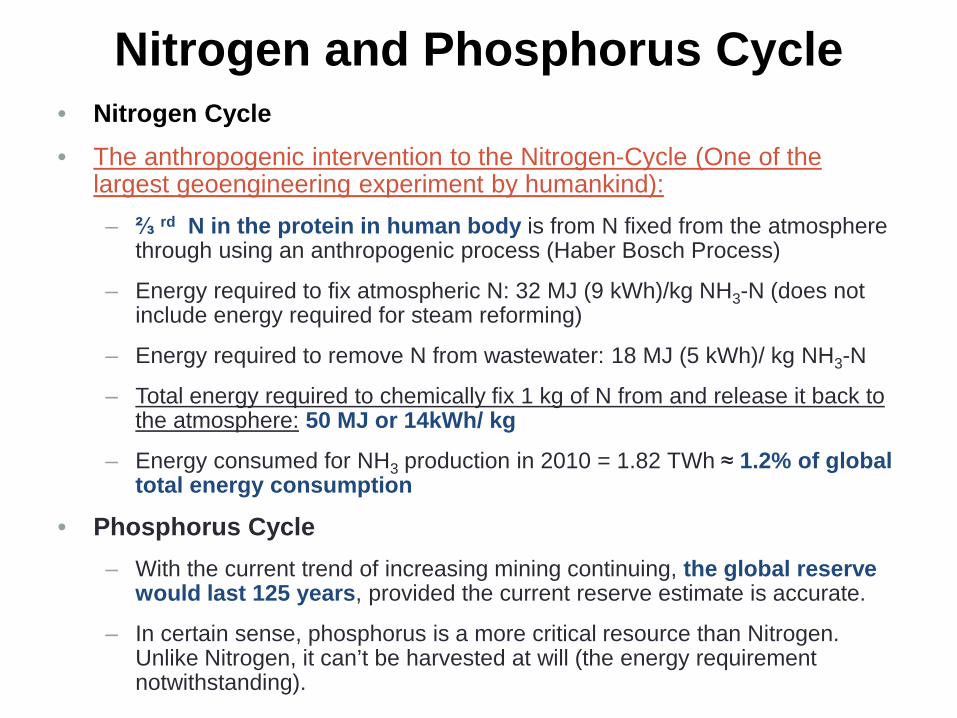
Nitrogen and Phosphorus Cycle• Nitrogen Cycle• The anthropogenic intervention to the Nitrogen-Cycle (One of the
largest geoengineering experiment by humankind):– ⅔ rd N in the protein in human body is from N fixed from the atmosphere
through using an anthropogenic process (Haber Bosch Process)
– Energy required to fix atmospheric N: 32 MJ (9 kWh)/kg NH3-N (does not include energy required for steam reforming)
– Energy required to remove N from wastewater: 18 MJ (5 kWh)/ kg NH3-N
– Total energy required to chemically fix 1 kg of N from and release it back to the atmosphere: 50 MJ or 14kWh/ kg
– Energy consumed for NH3 production in 2010 = 1.82 TWh ≈ 1.2% of global total energy consumption
• Phosphorus Cycle– With the current trend of increasing mining continuing, the global reserve
would last 125 years, provided the current reserve estimate is accurate.
– In certain sense, phosphorus is a more critical resource than Nitrogen. Unlike Nitrogen, it can’t be harvested at will (the energy requirement notwithstanding).
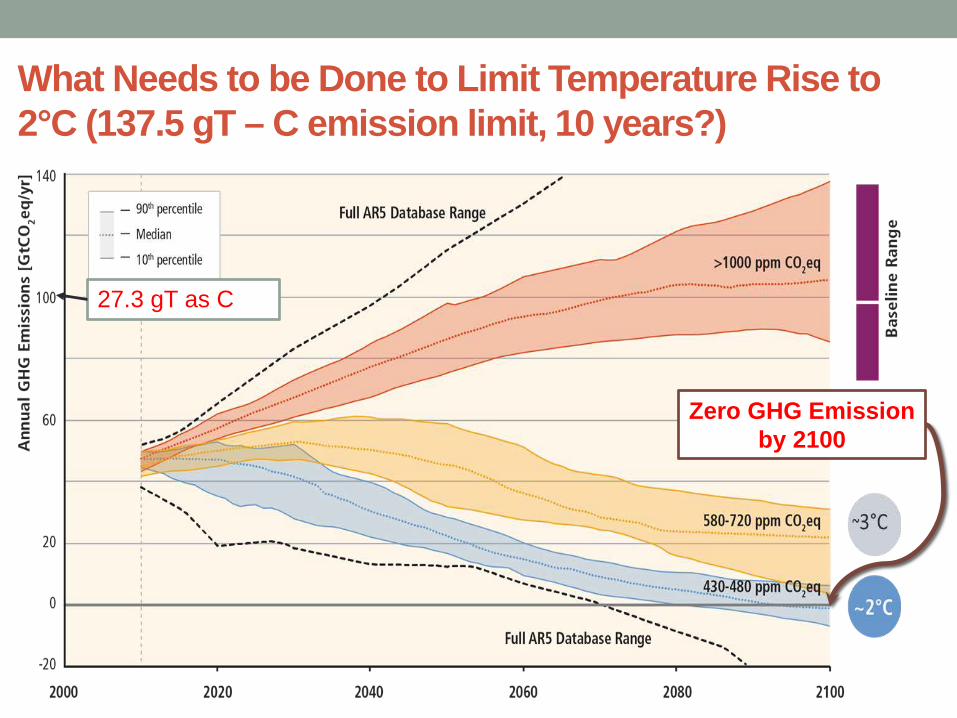
What Needs to be Done to Limit Temperature Rise to 2°C (137.5 gT – C emission limit, 10 years?)
Zero GHG Emission by 2100
27.3 gT as C
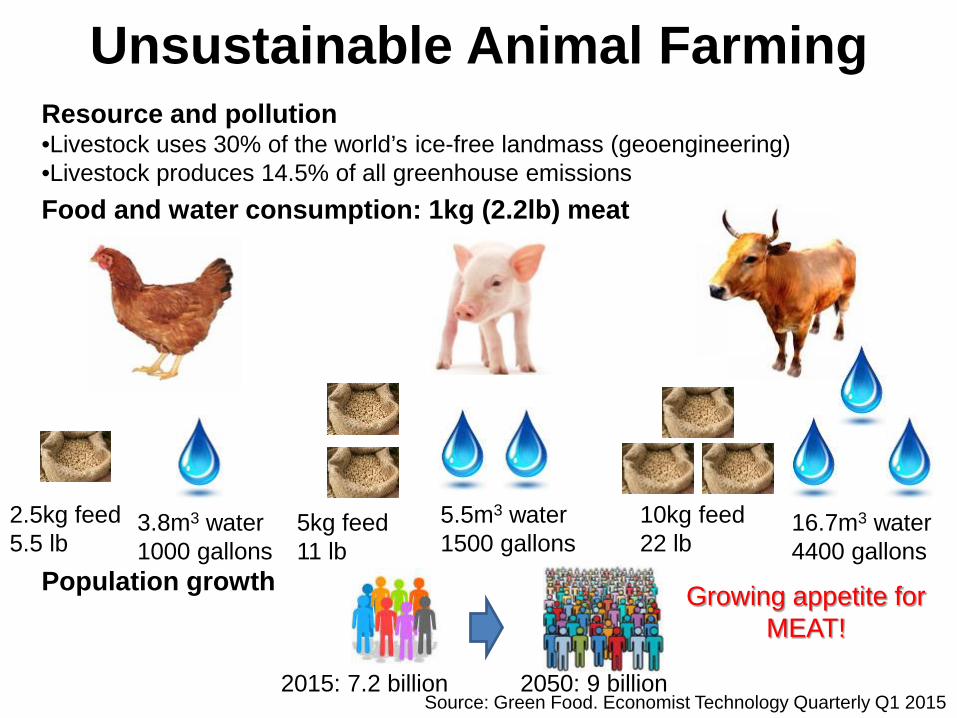
Unsustainable Animal FarmingResource and pollution•Livestock uses 30% of the world’s ice-free landmass (geoengineering)•Livestock produces 14.5% of all greenhouse emissionsFood and water consumption: 1kg (2.2lb) meat
Population growth
2.5kg feed5.5 lb
5kg feed11 lb
10kg feed22 lb
2015: 7.2 billion 2050: 9 billion
Growing appetite for MEAT!
Source: Green Food. Economist Technology Quarterly Q1 2015
16.7m3 water4400 gallons
5.5m3 water1500 gallons
3.8m3 water1000 gallons
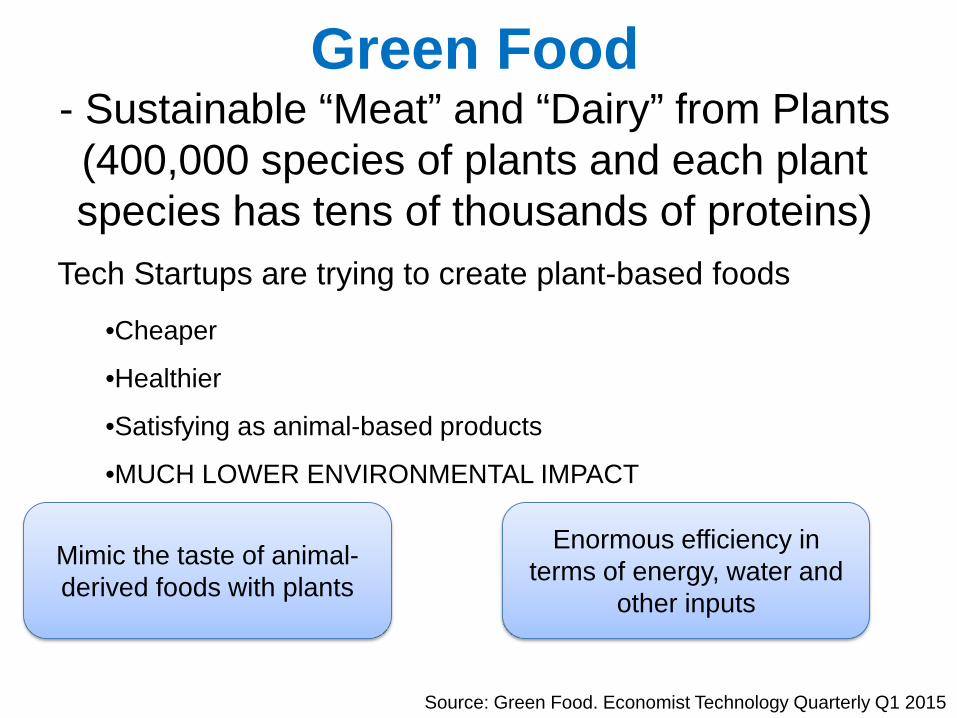
Green Food- Sustainable “Meat” and “Dairy” from Plants (400,000 species of plants and each plant species has tens of thousands of proteins)
Tech Startups are trying to create plant-based foods
•Cheaper
•Healthier
•Satisfying as animal-based products
•MUCH LOWER ENVIRONMENTAL IMPACT
Enormous efficiency in terms of energy, water and
other inputs
Mimic the taste of animal-derived foods with plants
Source: Green Food. Economist Technology Quarterly Q1 2015
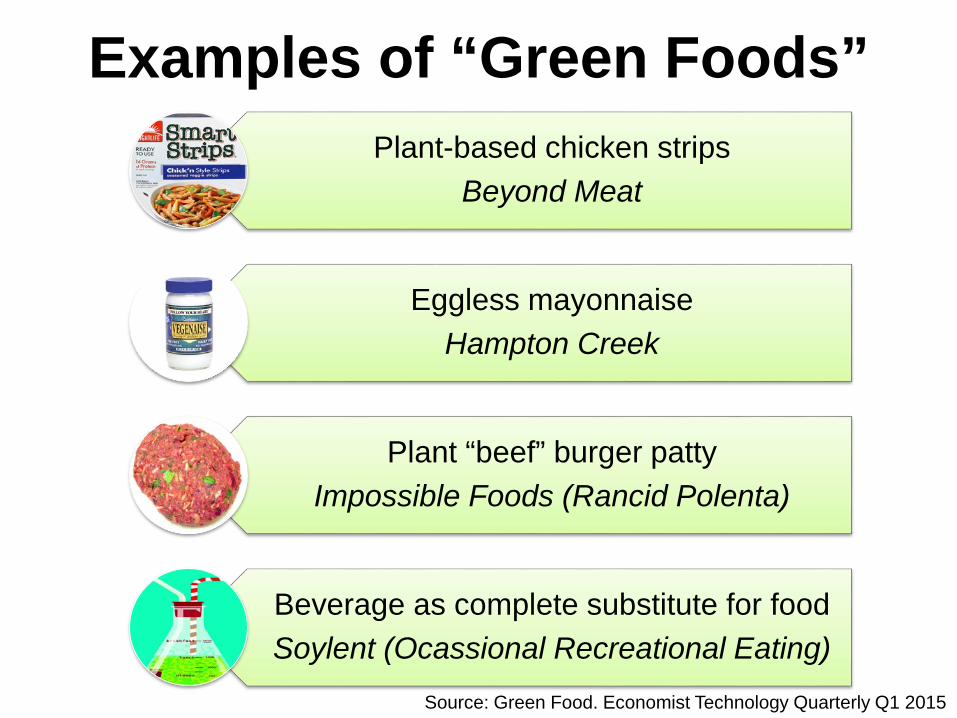
Examples of “Green Foods”Plant-based chicken strips
Beyond Meat
Eggless mayonnaiseHampton Creek
Plant “beef” burger pattyImpossible Foods (Rancid Polenta)
Beverage as complete substitute for foodSoylent (Ocassional Recreational Eating)
Source: Green Food. Economist Technology Quarterly Q1 2015
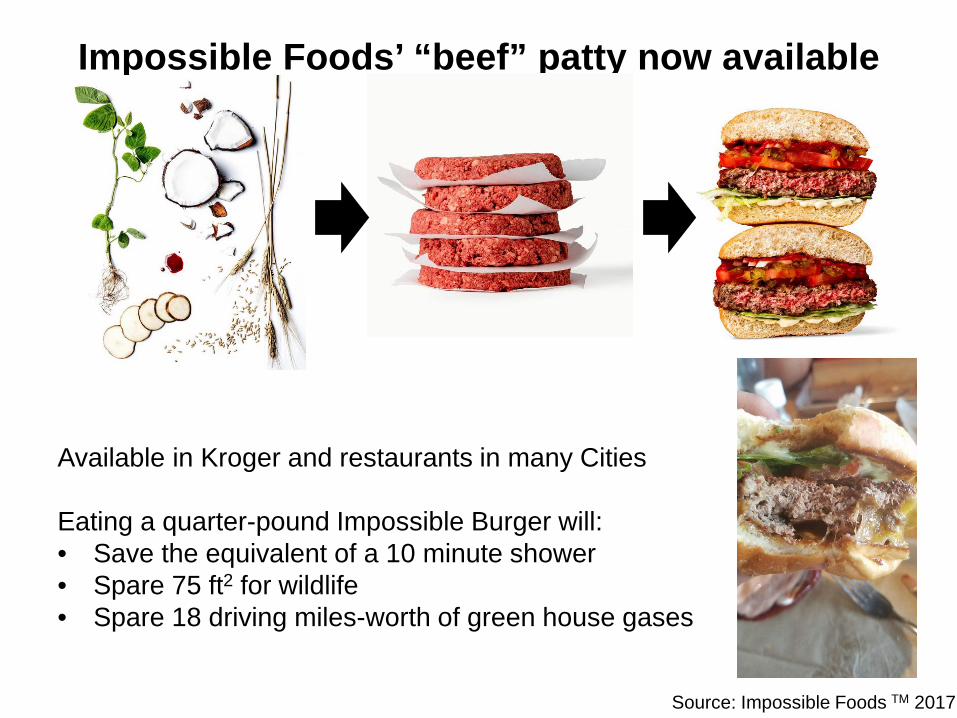
Impossible Foods’ “beef” patty now available
Source: Impossible Foods TM 2017
Available in Kroger and restaurants in many Cities
Eating a quarter-pound Impossible Burger will:• Save the equivalent of a 10 minute shower• Spare 75 ft2 for wildlife• Spare 18 driving miles-worth of green house gases
Second Premise of ‘Sustainability’• Use renewable resources/ recycle materials in
commerce– Look at Materials in Commerce not including
food and fuels– Look at all materials
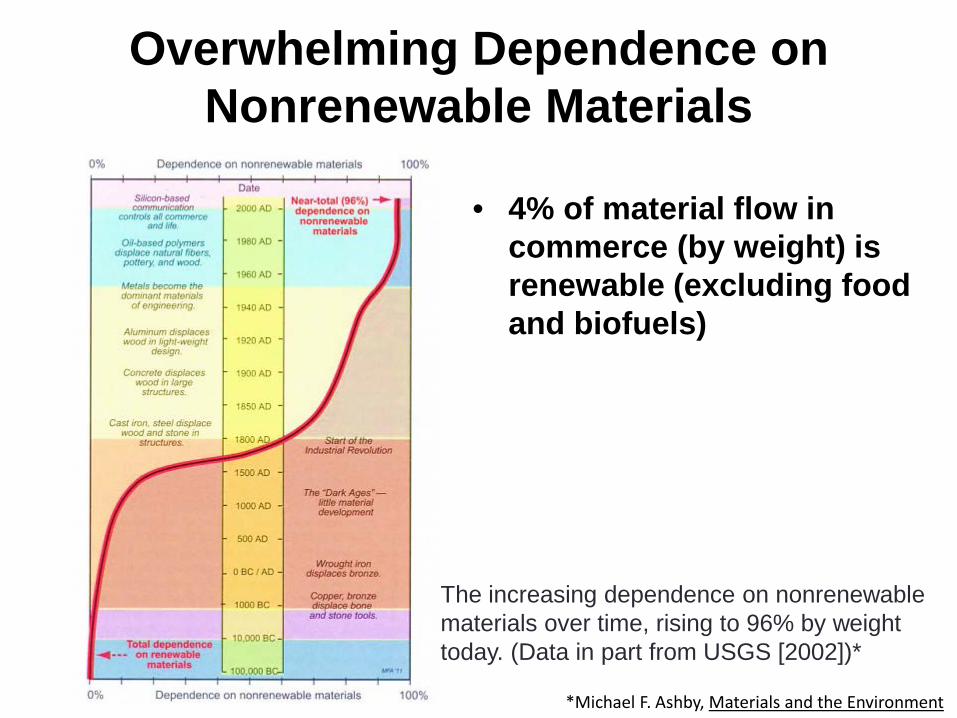
*Michael F. Ashby, Materials and the Environment
The increasing dependence on nonrenewable materials over time, rising to 96% by weight today. (Data in part from USGS [2002])*
Overwhelming Dependence on Nonrenewable Materials
• 4% of material flow in commerce (by weight) is renewable (excluding food and biofuels)
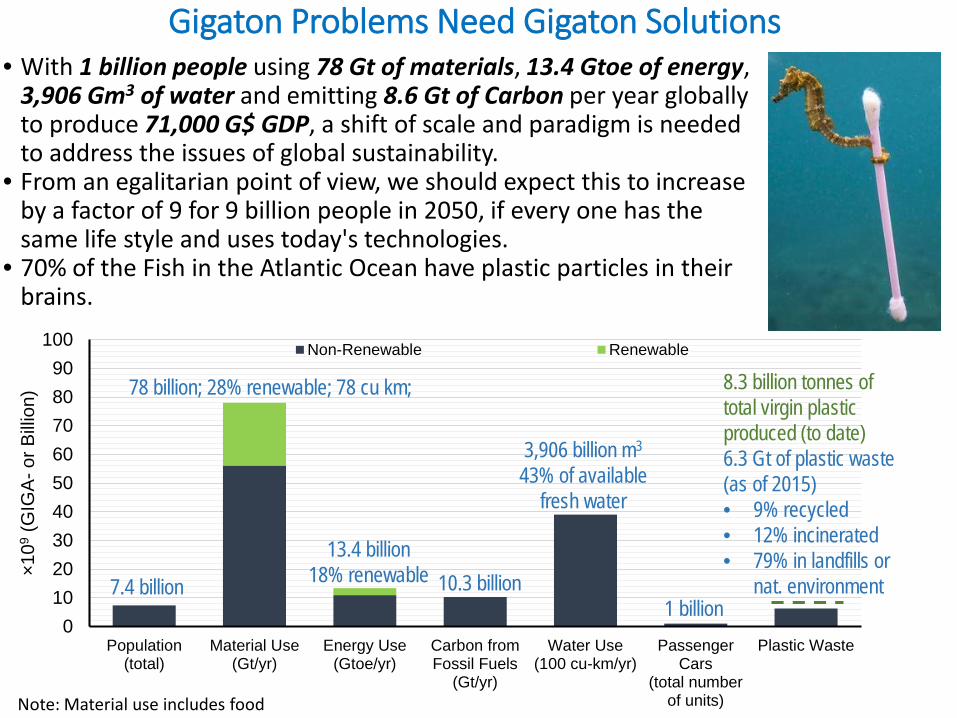
Gigaton Problems Need Gigaton Solutions• With 1 billion people using 78 Gt of materials, 13.4 Gtoe of energy,
3,906 Gm3 of water and emitting 8.6 Gt of Carbon per year globally to produce 71,000 G$ GDP, a shift of scale and paradigm is needed to address the issues of global sustainability.
• From an egalitarian point of view, we should expect this to increase by a factor of 9 for 9 billion people in 2050, if every one has the same life style and uses today's technologies.
• 70% of the Fish in the Atlantic Ocean have plastic particles in their brains.
Note: Material use includes food
0102030405060708090
100
Population(total)
Material Use(Gt/yr)
Energy Use(Gtoe/yr)
Carbon fromFossil Fuels
(Gt/yr)
Water Use(100 cu-km/yr)
PassengerCars
(total numberof units)
Plastic Waste
×109
(GIG
A-or
Billi
on)
Non-Renewable Renewable
7.4 billion
78 billion; 28% renewable; 78 cu km;
13.4 billion18% renewable 10.3 billion
3,906 billion m3
43% of available fresh water
1 billion
8.3 billion tonnes of total virgin plastic produced (to date)6.3 Gt of plastic waste (as of 2015)• 9% recycled• 12% incinerated• 79% in landfills or
nat. environment
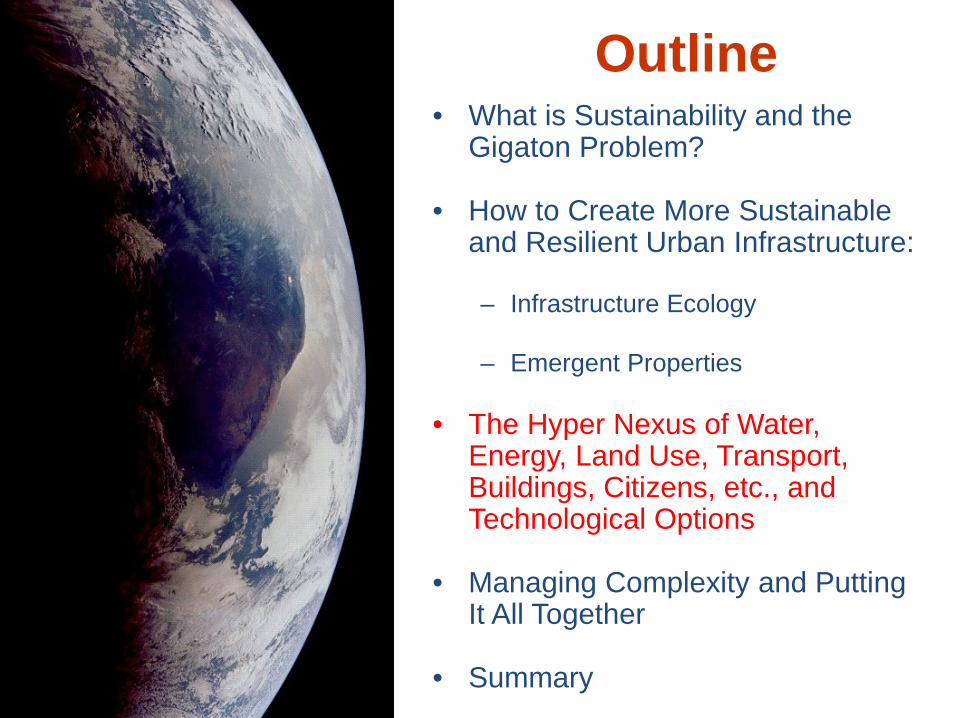
Outline• What is Sustainability and the
Gigaton Problem?
• How to Create More Sustainable and Resilient Urban Infrastructure:
– Infrastructure Ecology
– Emergent Properties
• The Hyper Nexus of Water, Energy, Land Use, Transport, Buildings, Citizens, etc., and Technological Options
• Managing Complexity and Putting It All Together
• Summary
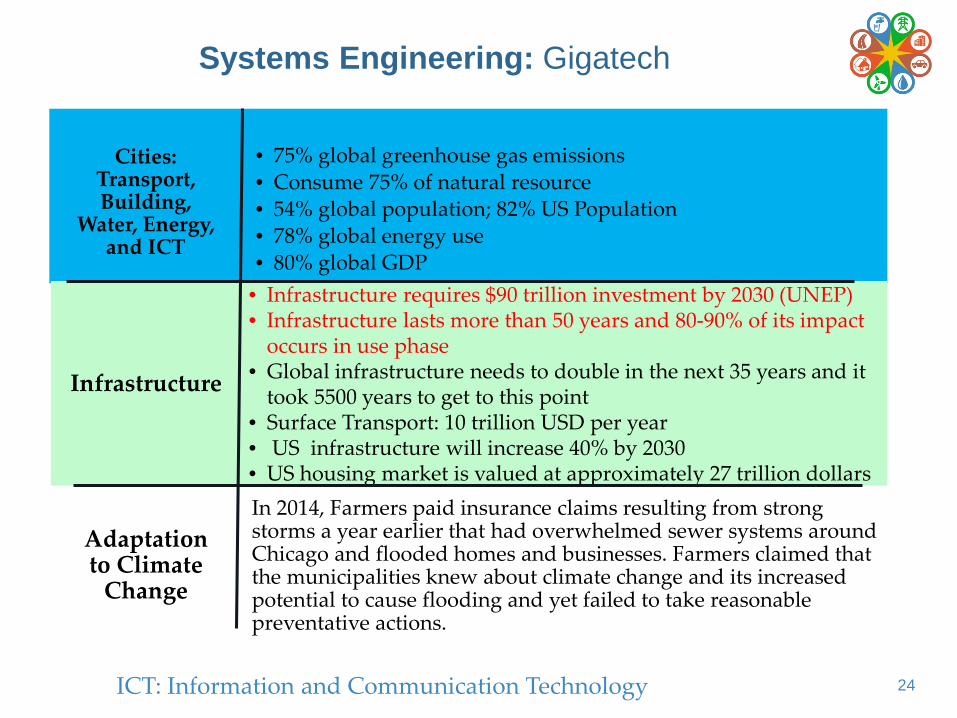
Systems Engineering: Gigatech
24
Cities: Transport, Building,
Water, Energy, and ICT
Infrastructure
Adaptationto Climate
Change
ICT: Information and Communication Technology
• Infrastructure requires $90 trillion investment by 2030 (UNEP)• Infrastructure lasts more than 50 years and 80-90% of its impact
occurs in use phase• Global infrastructure needs to double in the next 35 years and it
took 5500 years to get to this point• Surface Transport: 10 trillion USD per year• US infrastructure will increase 40% by 2030• US housing market is valued at approximately 27 trillion dollarsIn 2014, Farmers paid insurance claims resulting from strong storms a year earlier that had overwhelmed sewer systems around Chicago and flooded homes and businesses. Farmers claimed that the municipalities knew about climate change and its increased potential to cause flooding and yet failed to take reasonable preventative actions.
• 75% global greenhouse gas emissions• Consume 75% of natural resource• 54% global population; 82% US Population• 78% global energy use• 80% global GDP
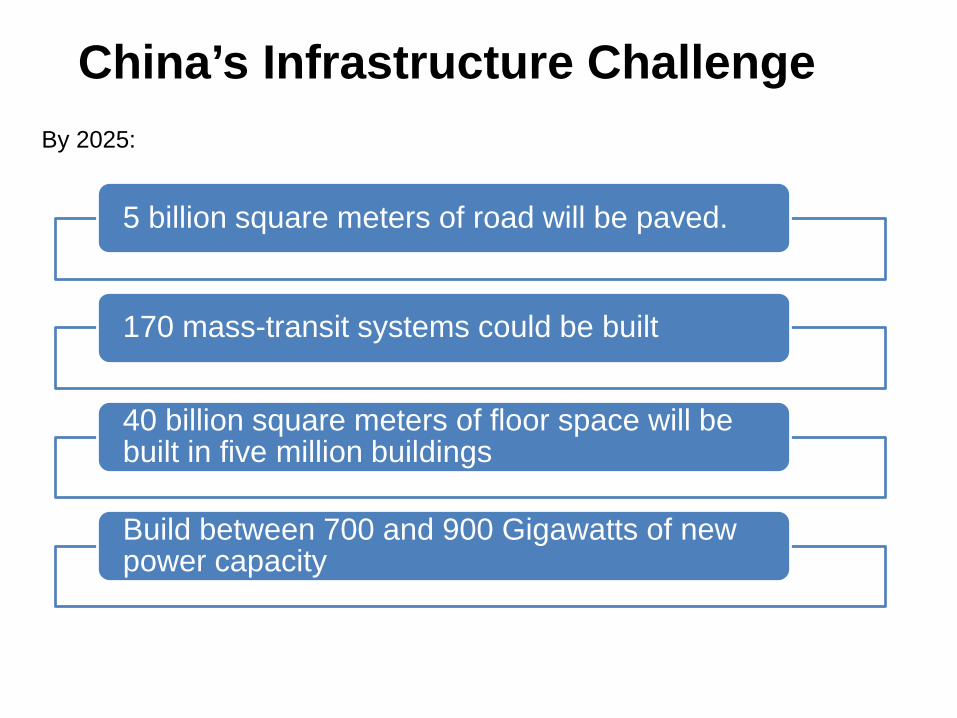
China’s Infrastructure Challenge
5 billion square meters of road will be paved.
170 mass-transit systems could be built
40 billion square meters of floor space will be built in five million buildings
Build between 700 and 900 Gigawatts of new power capacity
By 2025:
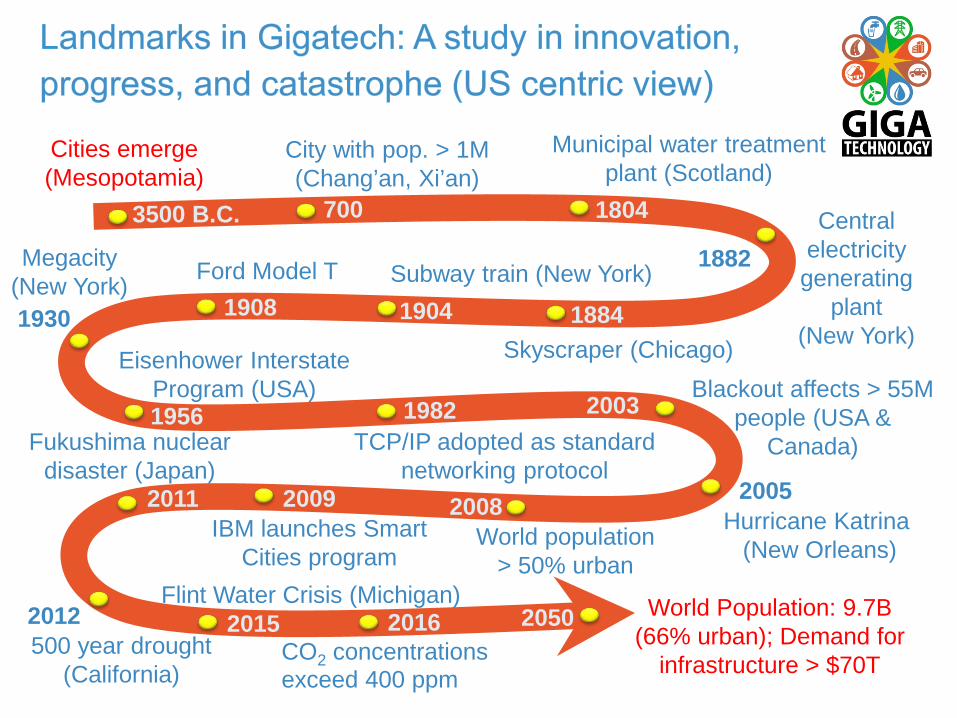
Subway train (New York)
Cities emerge(Mesopotamia)
Municipal water treatment plant (Scotland)
Central electricity
generating plant
(New York)Skyscraper (Chicago)
Ford Model T
Eisenhower Interstate Program (USA)
City with pop. > 1M (Chang’an, Xi’an)
Blackout affects > 55M people (USA &
Canada)Fukushima nuclear disaster (Japan)
500 year drought (California)
3500 B.C. 700 1804
1904 1884
1956
1882
1930
20092011
1982TCP/IP adopted as standard
networking protocol
World Population: 9.7B(66% urban); Demand for
infrastructure > $70T
2016CO2 concentrations exceed 400 ppm
Megacity(New York)
2008World population
> 50% urban
2012
IBM launches Smart Cities program
2050
1908
2003
2005Hurricane Katrina
(New Orleans)
2015Flint Water Crisis (Michigan)
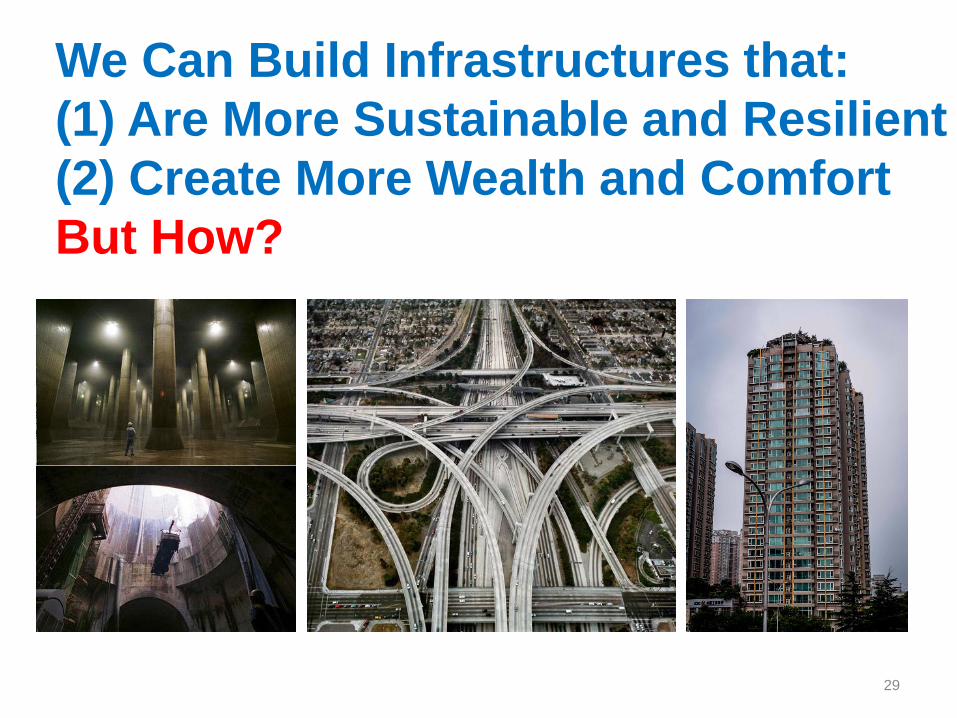
We Can Build Infrastructures that: (1) Are More Sustainable and Resilient(2) Create More Wealth and ComfortBut How?
29
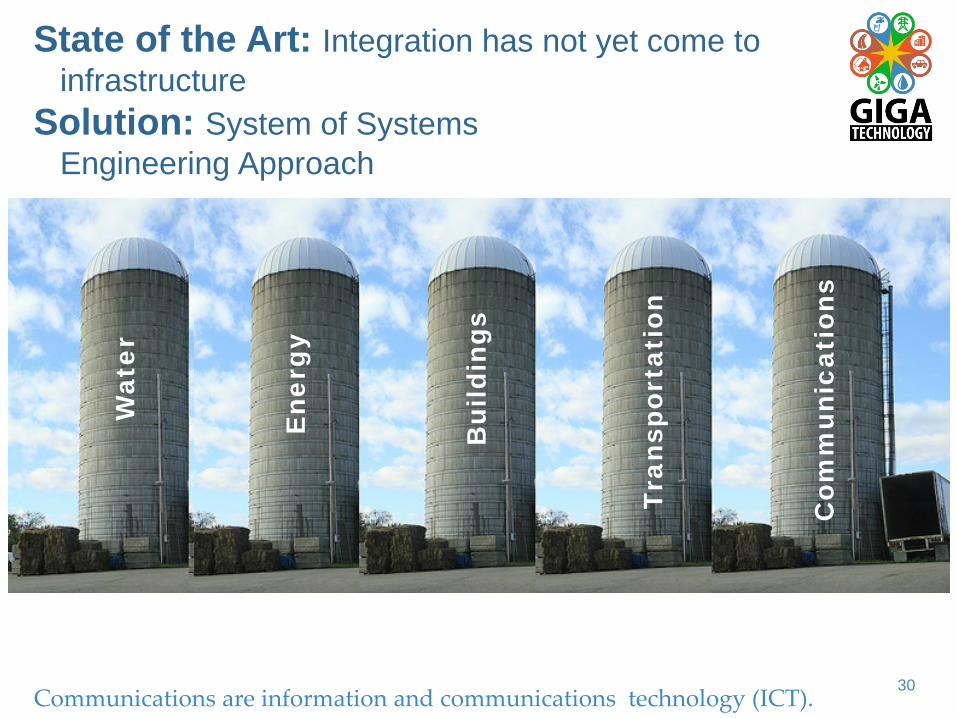
State of the Art: Integration has not yet come to infrastructure
Solution: System of Systems Engineering Approach
30
Ene
rgy
Tran
spor
tati
on
Bui
ldin
gs
Wat
er
Com
mun
icat
ions
Communications are information and communications technology (ICT).
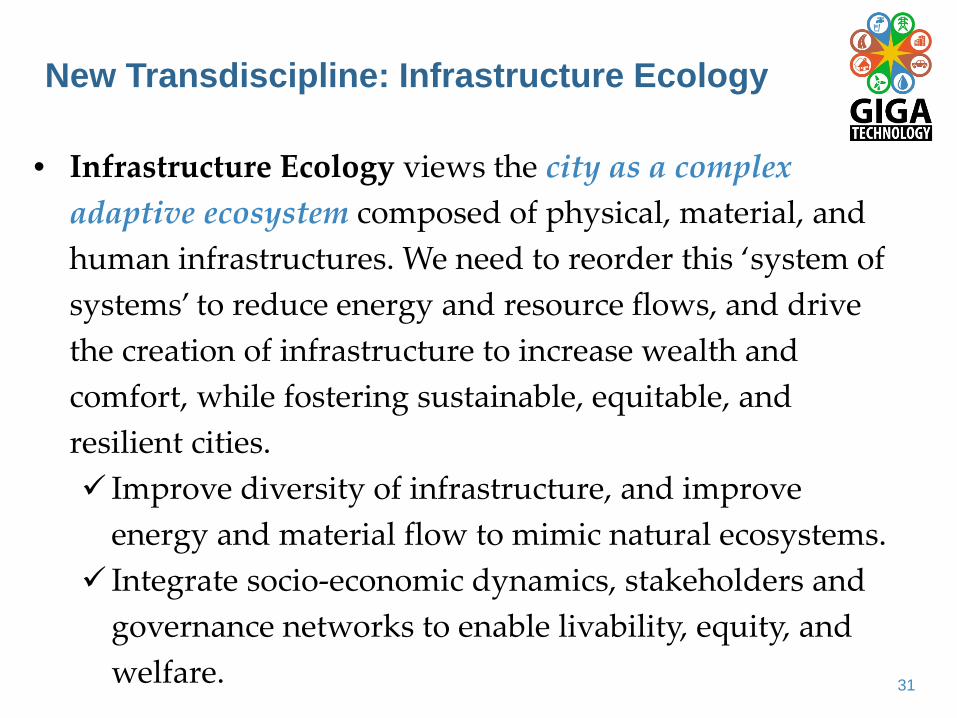
• Infrastructure Ecology views the city as a complex adaptive ecosystem composed of physical, material, and human infrastructures. We need to reorder this ‘system of systems’ to reduce energy and resource flows, and drive the creation of infrastructure to increase wealth and comfort, while fostering sustainable, equitable, and resilient cities. Improve diversity of infrastructure, and improve
energy and material flow to mimic natural ecosystems. Integrate socio-economic dynamics, stakeholders and
governance networks to enable livability, equity, and welfare.
New Transdiscipline: Infrastructure Ecology
31
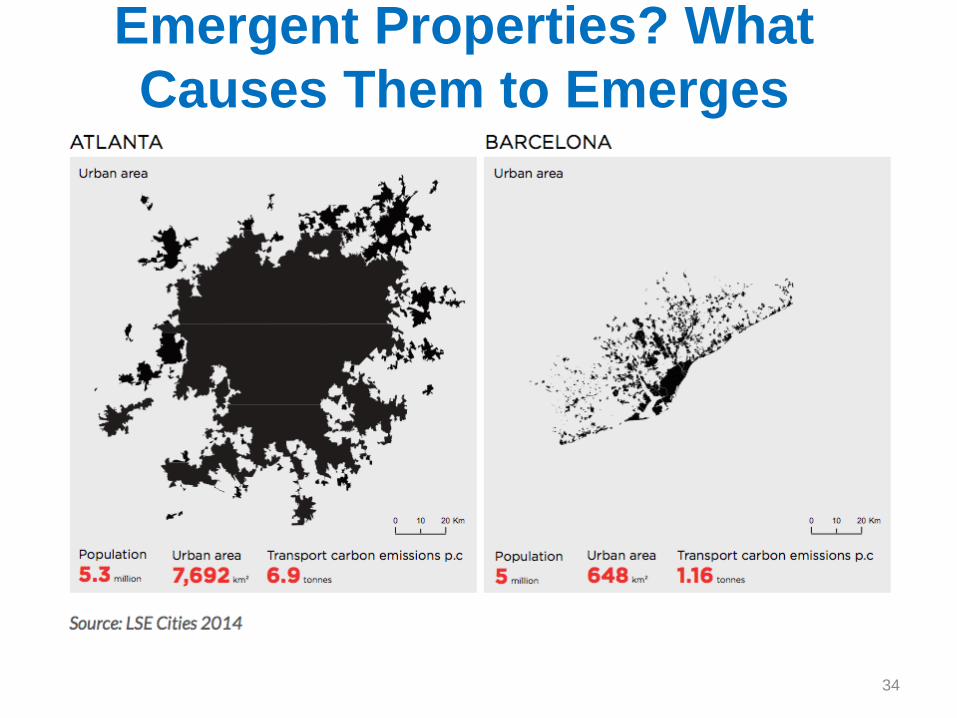
Emergent Properties? What Causes Them to Emerges
34
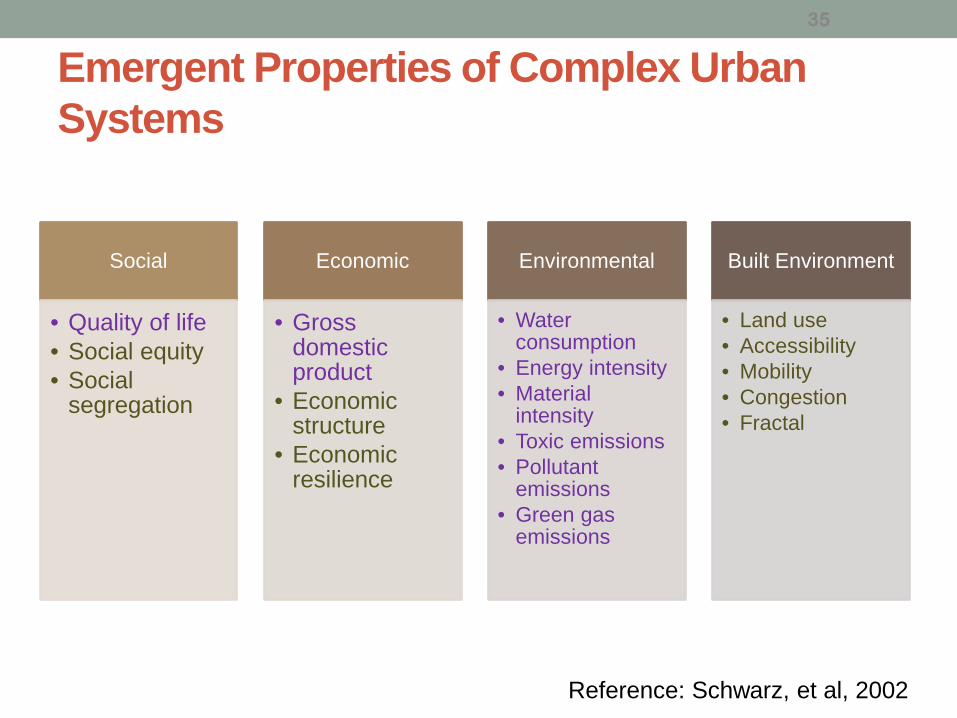
Emergent Properties of Complex Urban Systems
Social
• Quality of life• Social equity• Social
segregation
Economic
• Gross domestic product
• Economic structure
• Economic resilience
Environmental
• Water consumption
• Energy intensity• Material
intensity• Toxic emissions• Pollutant
emissions• Green gas
emissions
Built Environment
• Land use• Accessibility• Mobility• Congestion• Fractal
35
Reference: Schwarz, et al, 2002
11/7/2016 ● 36
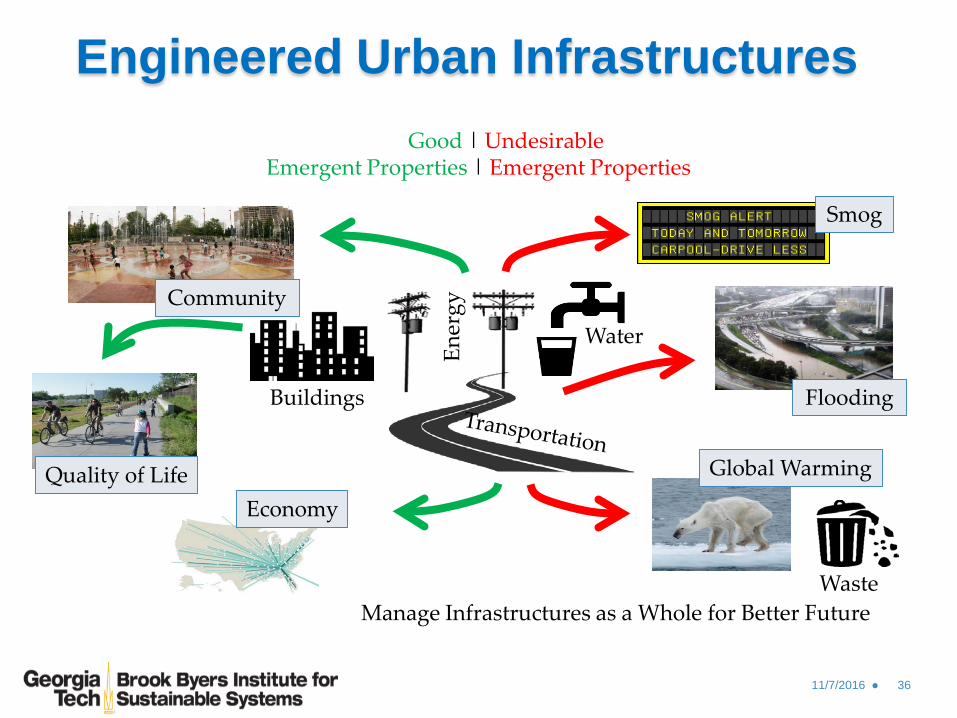
Engineered Urban Infrastructures
Buildings
Ener
gy
Water
Smog
Global Warming
Community
EconomyQuality of Life
Good | UndesirableEmergent Properties | Emergent Properties
Flooding
WasteManage Infrastructures as a Whole for Better Future
Outline• What is Sustainability and the
Gigaton Problem?
• How to Create More Sustainable and Resilient Urban Infrastructure:
– Infrastructure Ecology
– Emergent Properties
• The Hyper Nexus of Water, Energy, Land Use, Transport, Buildings, Citizens, etc., and Technological Options
• Managing Complexity and Putting It All Together
• Summary

Energy and Water
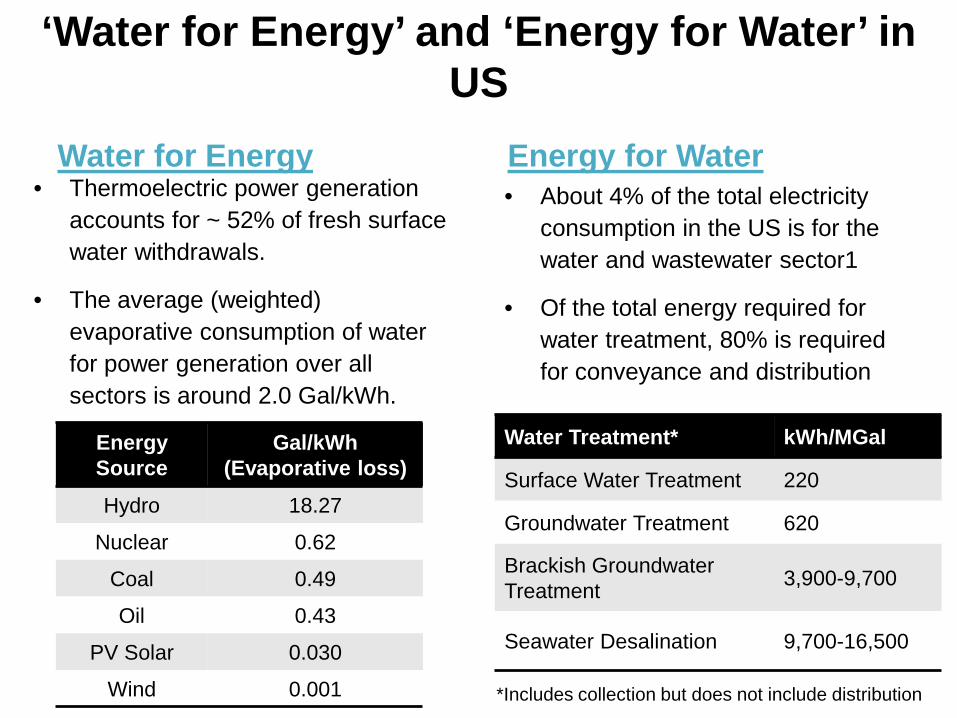
‘Water for Energy’ and ‘Energy for Water’ in US
Water for Energy• Thermoelectric power generation
accounts for ~ 52% of fresh surface water withdrawals.
• The average (weighted) evaporative consumption of water for power generation over all sectors is around 2.0 Gal/kWh.
Energy for Water• About 4% of the total electricity
consumption in the US is for the water and wastewater sector1
• Of the total energy required for water treatment, 80% is required for conveyance and distribution
Energy Source
Gal/kWh (Evaporative loss)
Hydro 18.27
Nuclear 0.62
Coal 0.49
Oil 0.43
PV Solar 0.030
Wind 0.001
Water Treatment* kWh/MGal
Surface Water Treatment 220
Groundwater Treatment 620
Brackish Groundwater Treatment 3,900-9,700
Seawater Desalination 9,700-16,500
*Includes collection but does not include distribution
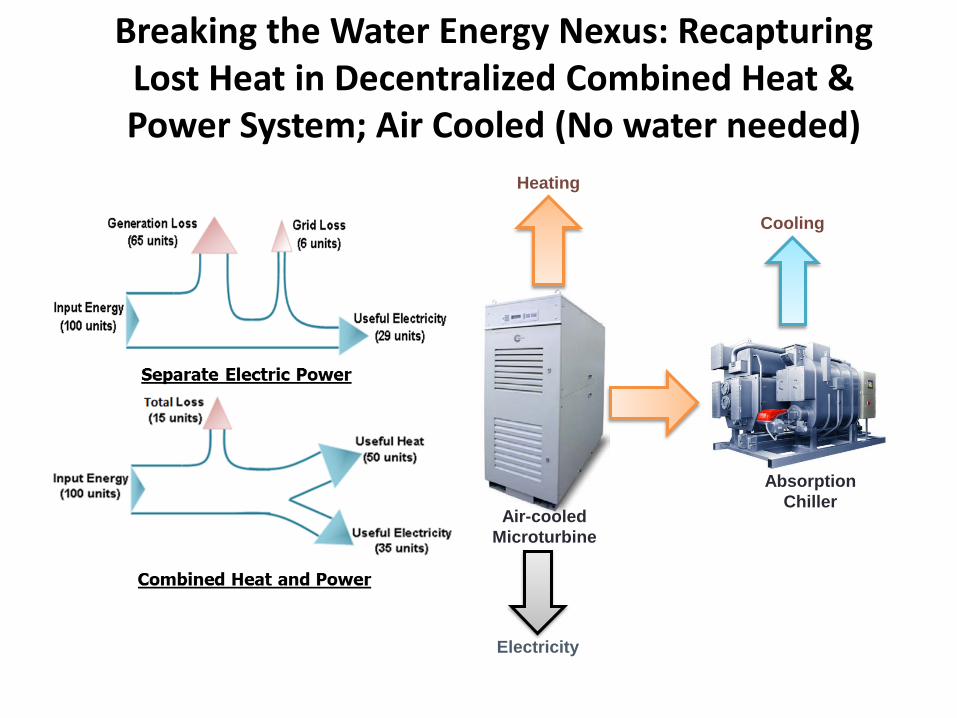
Breaking the Water Energy Nexus: Recapturing Lost Heat in Decentralized Combined Heat & Power System; Air Cooled (No water needed)
Air-cooled Microturbine
Absorption Chiller
Electricity
Heating
Cooling
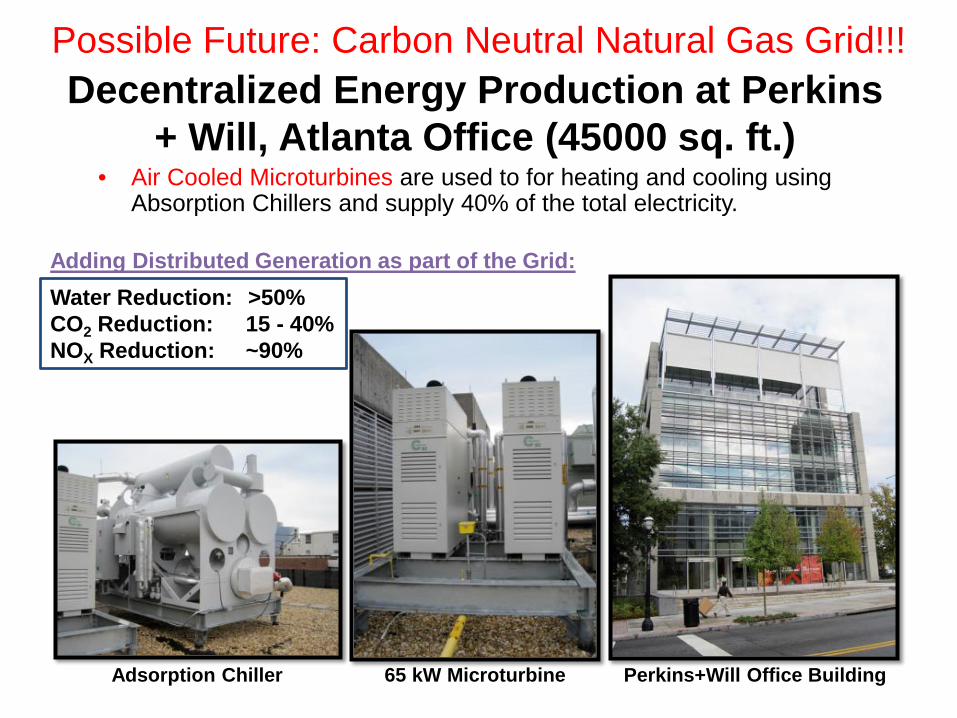
Decentralized Energy Production at Perkins + Will, Atlanta Office (45000 sq. ft.)
• Air Cooled Microturbines are used to for heating and cooling using Absorption Chillers and supply 40% of the total electricity.
Adsorption Chiller 65 kW Microturbine Perkins+Will Office Building
Water Reduction: >50%CO2 Reduction: 15 - 40%NOX Reduction: ~90%
Adding Distributed Generation as part of the Grid:
Possible Future: Carbon Neutral Natural Gas Grid!!!
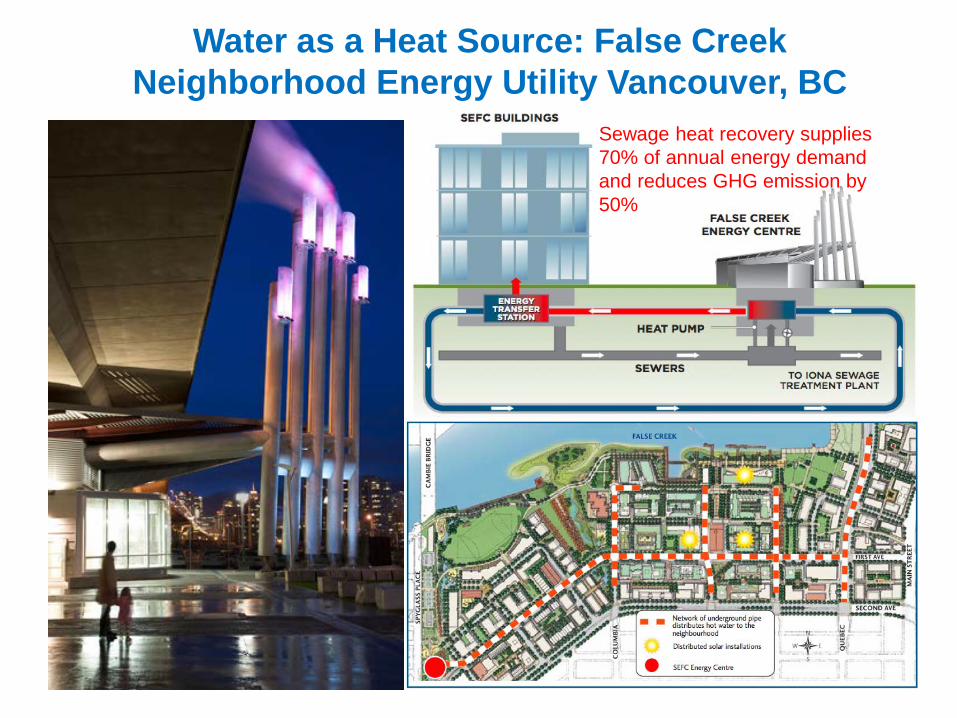
Water as a Heat Source: False Creek Neighborhood Energy Utility Vancouver, BC
Sewage heat recovery supplies 70% of annual energy demand and reduces GHG emission by 50%
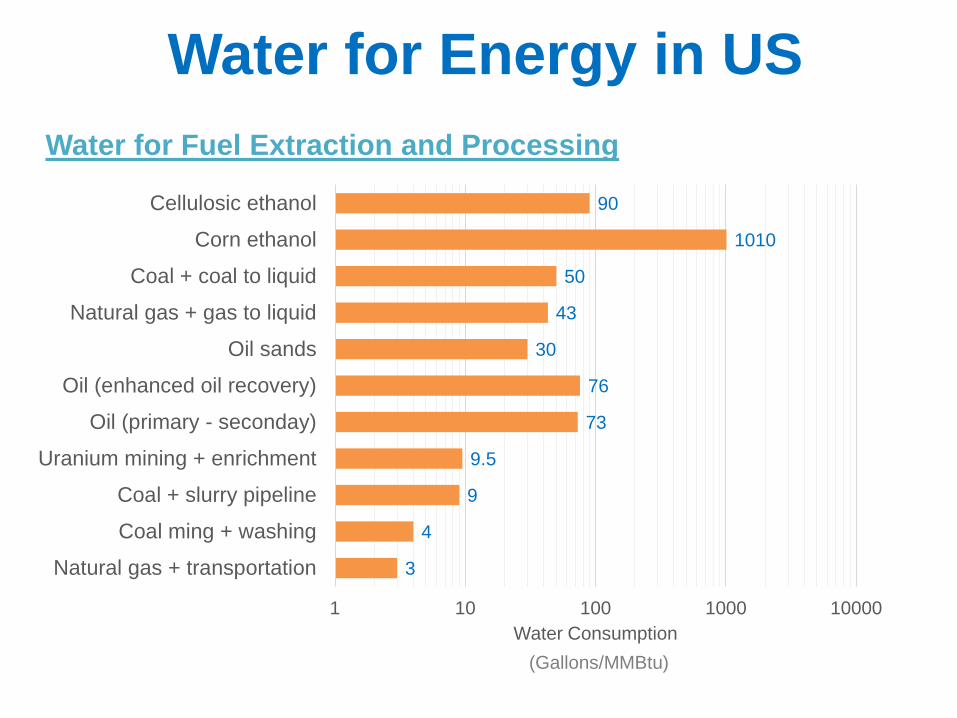
Water for Energy in USWater for Fuel Extraction and Processing
3
4
9
9.5
73
76
30
43
50
1010
90
1 10 100 1000 10000
Natural gas + transportation
Coal ming + washing
Coal + slurry pipeline
Uranium mining + enrichment
Oil (primary - seconday)
Oil (enhanced oil recovery)
Oil sands
Natural gas + gas to liquid
Coal + coal to liquid
Corn ethanol
Cellulosic ethanol
Water Consumption(Gallons/MMBtu)
Transportation, Energy, Land Use, Water, Air Quality
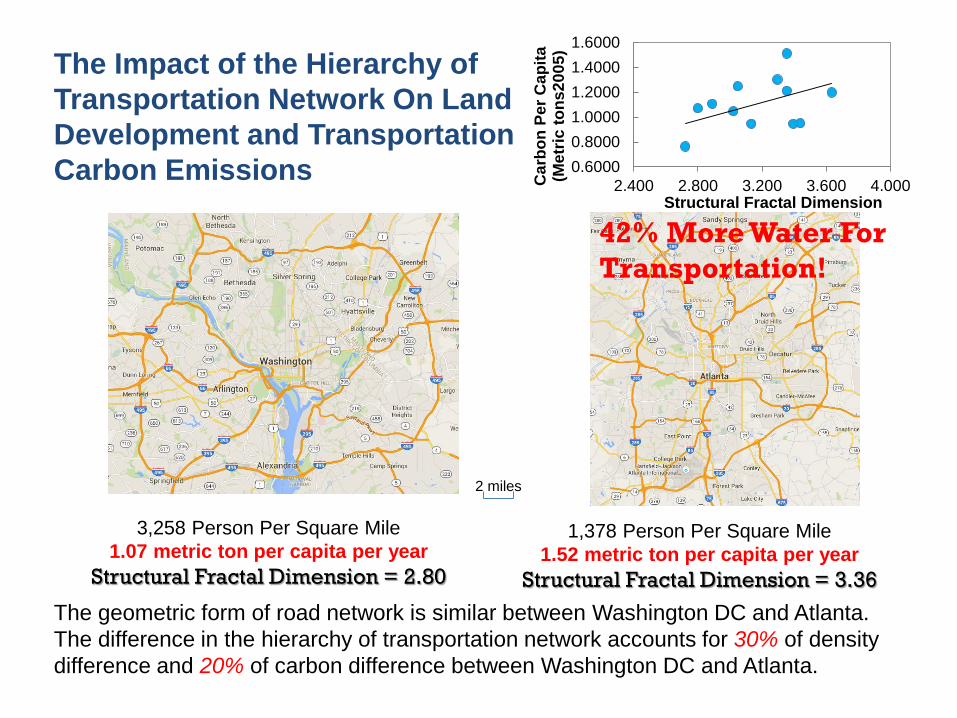
The Impact of the Hierarchy of Transportation Network On Land Development and Transportation Carbon Emissions
3,258 Person Per Square Mile1.07 metric ton per capita per year
Structural Fractal Dimension = 2.80
1,378 Person Per Square Mile1.52 metric ton per capita per year
Structural Fractal Dimension = 3.36
The geometric form of road network is similar between Washington DC and Atlanta. The difference in the hierarchy of transportation network accounts for 30% of density difference and 20% of carbon difference between Washington DC and Atlanta.
0.60000.80001.00001.20001.40001.6000
2.400 2.800 3.200 3.600 4.000Car
bon
Per C
apita
(M
etric
tons
2005
)
Structural Fractal Dimension
2 miles
42% More Water For Transportation!
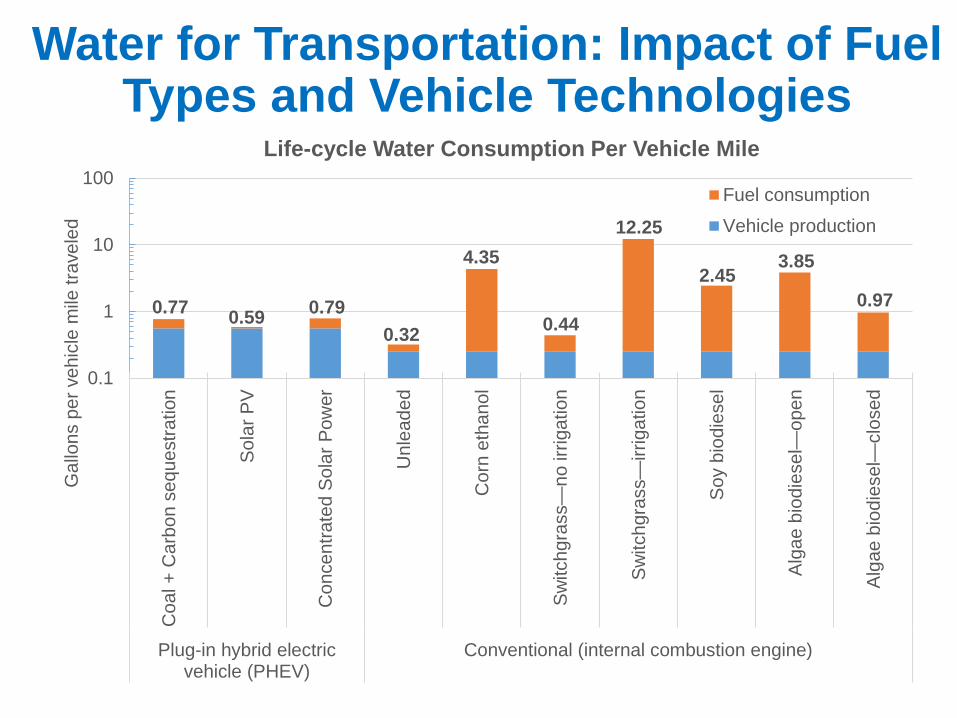
Water for Transportation: Impact of Fuel Types and Vehicle Technologies
0.1
1
10
100C
oal +
Car
bon
sequ
estra
tion
Sola
r PV
Con
cent
rate
d So
lar P
ower
Unl
eade
d
Cor
n et
hano
l
Switc
hgra
ss—
no ir
rigat
ion
Switc
hgra
ss—
irrig
atio
n
Soy
biod
iese
l
Alga
e bi
odie
sel—
open
Alga
e bi
odie
sel—
clos
ed
Plug-in hybrid electricvehicle (PHEV)
Conventional (internal combustion engine)
Gal
lons
per
veh
icle
mile
trav
eled
Life-cycle Water Consumption Per Vehicle Mile
Fuel consumptionVehicle production
0.77 0.59 0.790.32
4.35
0.44
12.25
2.453.85
0.97
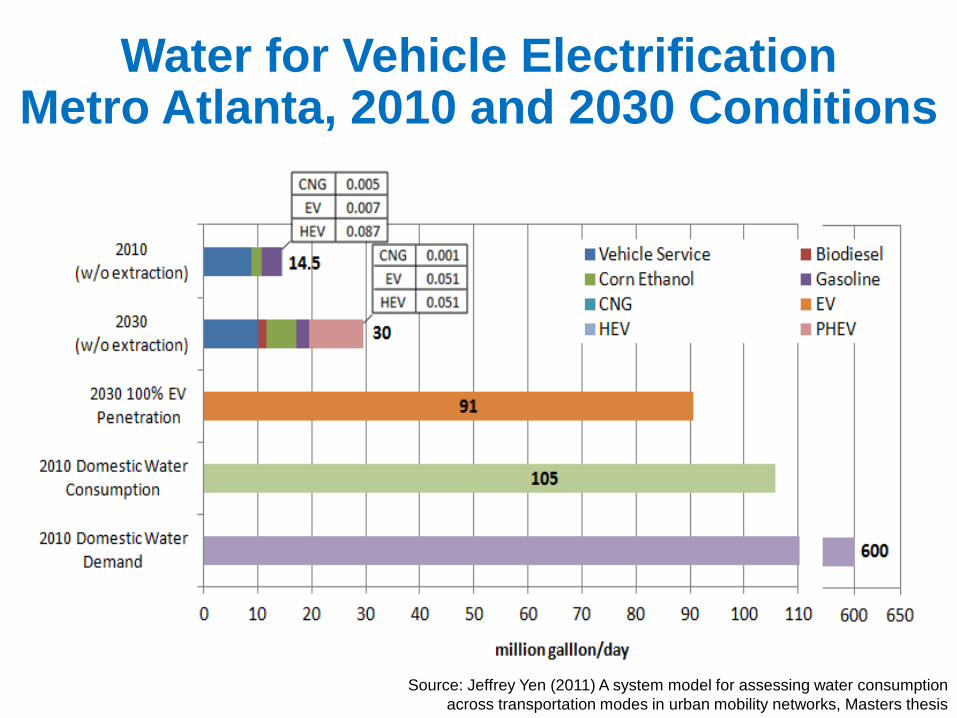
Source: Jeffrey Yen (2011) A system model for assessing water consumption across transportation modes in urban mobility networks, Masters thesis
Water for Vehicle Electrification Metro Atlanta, 2010 and 2030 Conditions
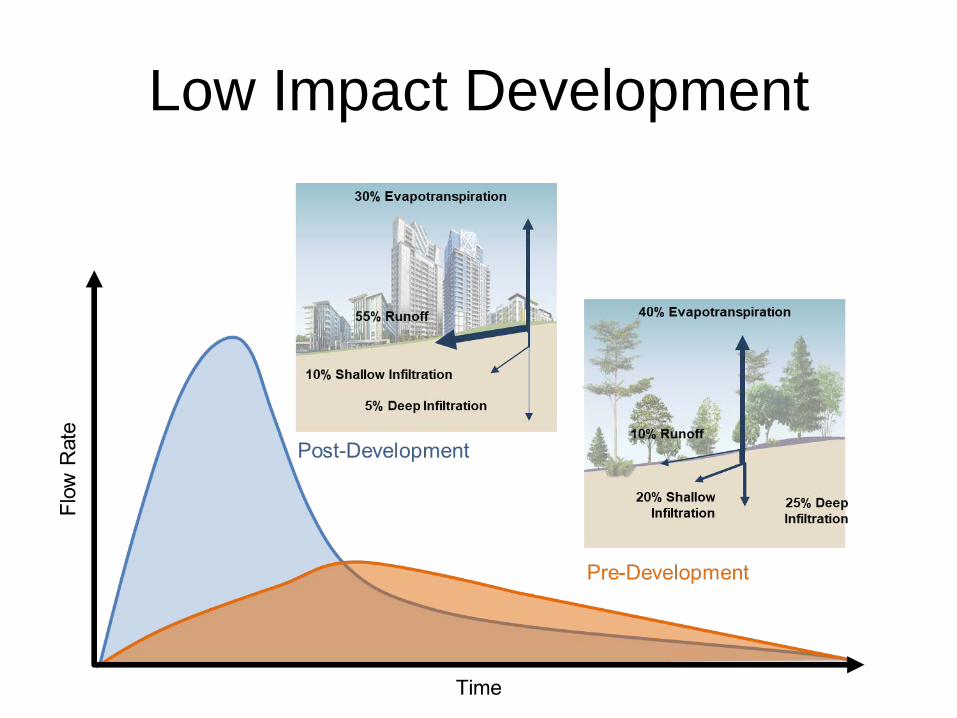
Low Impact Development
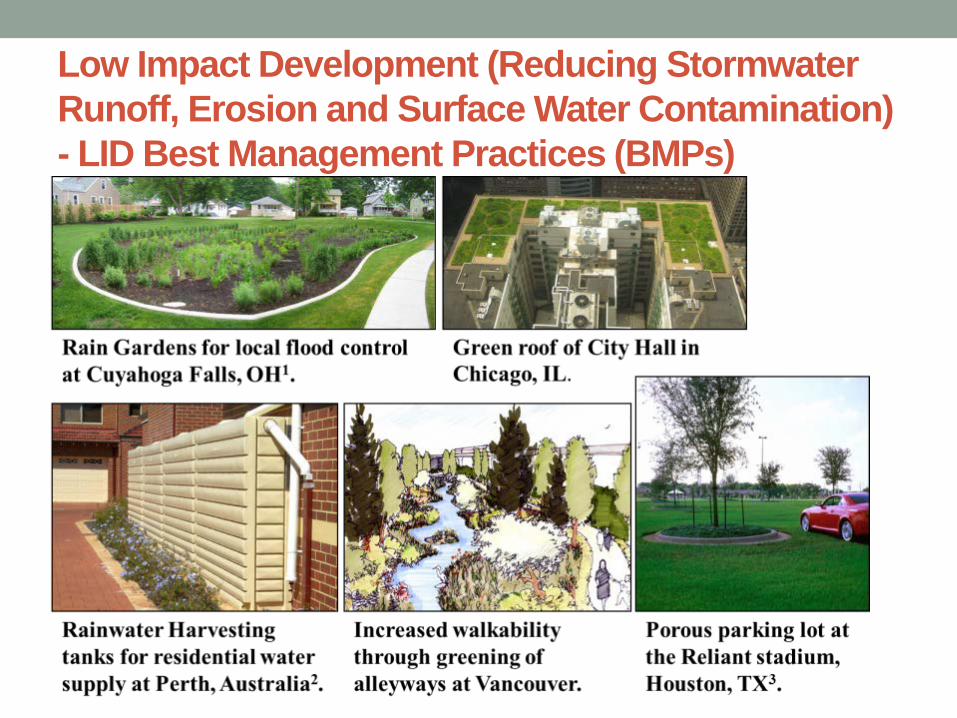
Low Impact Development (Reducing Stormwater Runoff, Erosion and Surface Water Contamination) - LID Best Management Practices (BMPs)
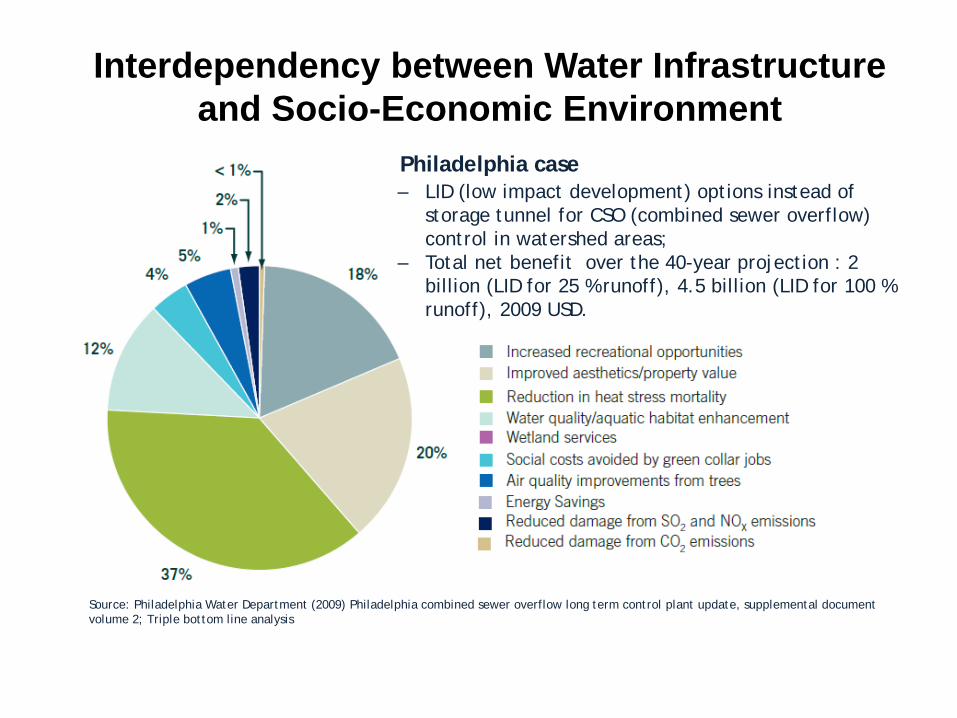
Interdependency between Water Infrastructure and Socio-Economic Environment
Source: Philadelphia Water Department (2009) Philadelphia combined sewer overflow long term control plant update, supplemental document volume 2; Triple bottom line analysis
Philadelphia case– LID (low impact development) options instead of
storage tunnel for CSO (combined sewer overflow) control in watershed areas;
– Total net benefit over the 40-year projection : 2 billion (LID for 25 % runoff), 4.5 billion (LID for 100 % runoff), 2009 USD.
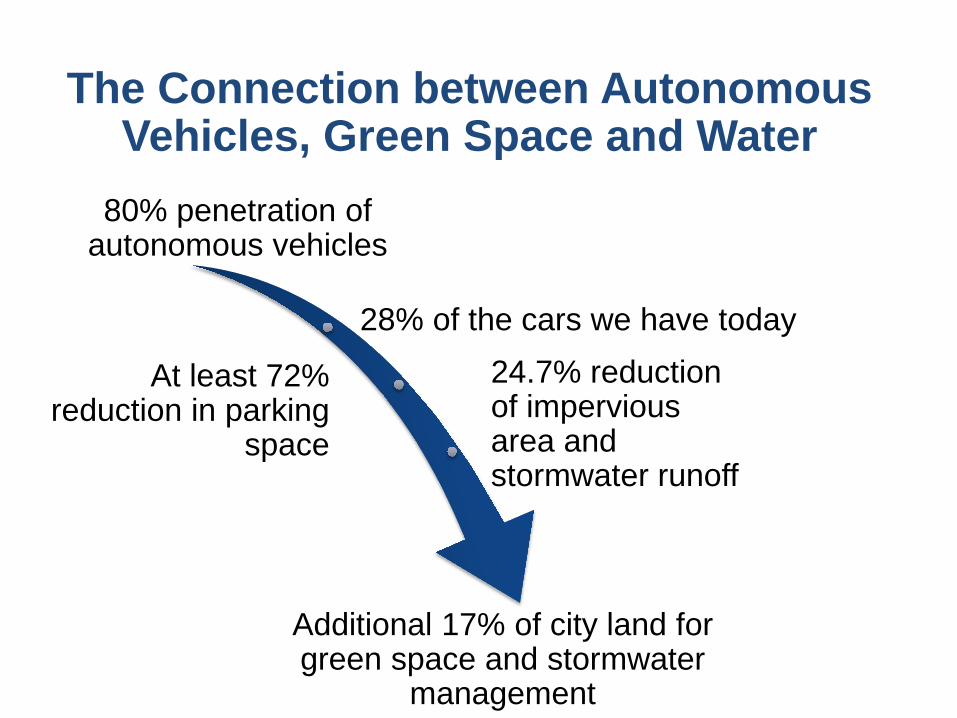
The Connection between Autonomous Vehicles, Green Space and Water
80% penetration of autonomous vehicles
28% of the cars we have today
At least 72% reduction in parking
space
24.7% reduction of impervious area and stormwater runoff
Additional 17% of city land for green space and stormwater
management
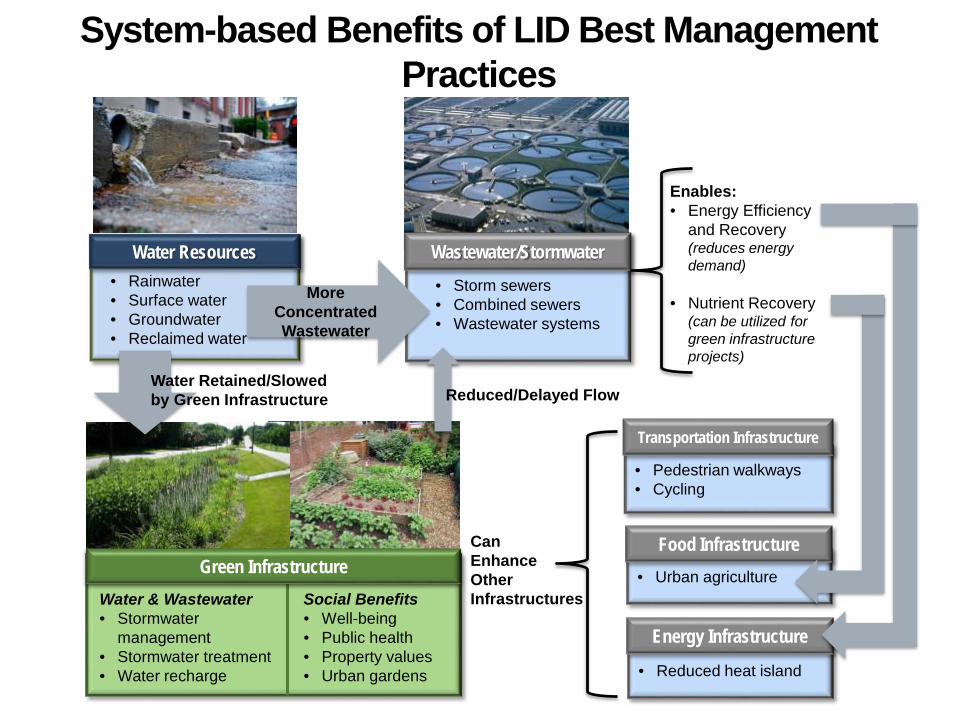
Water & Wastewater• Stormwater
management• Stormwater treatment• Water recharge
Social Benefits• Well-being• Public health• Property values• Urban gardens
Green Infrastructure
• Rainwater• Surface water• Groundwater• Reclaimed water
Water Resources• Storm sewers• Combined sewers• Wastewater systems
Wastewater/Stormwater
System-based Benefits of LID Best Management Practices
Reduced/Delayed FlowWater Retained/Slowedby Green Infrastructure
Enables:• Energy Efficiency
and Recovery (reduces energy demand)
• Nutrient Recovery (can be utilized for green infrastructure projects)
More Concentrated Wastewater
• Pedestrian walkways• Cycling
Transportation Infrastructure
Can EnhanceOther Infrastructures
• Urban agriculture
Food Infrastructure
• Reduced heat island
Energy Infrastructure
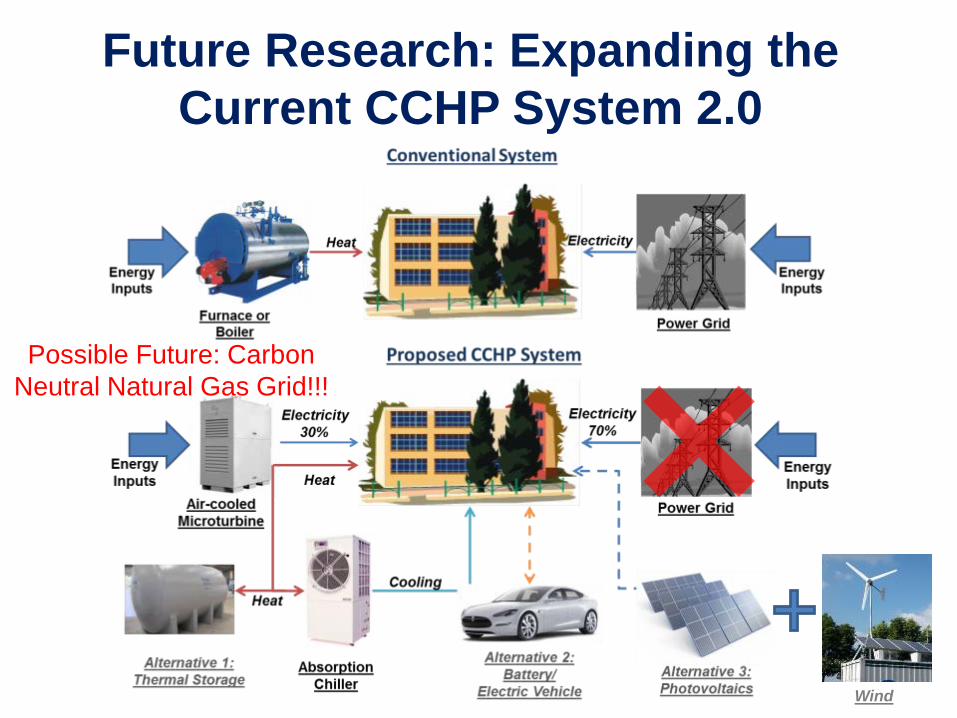
Future Research: Expanding the Current CCHP System 2.0
Wind
Possible Future: Carbon Neutral Natural Gas Grid!!!

Transit-oriented Development (TOD)• Creation of compact, walkable, mixed-use
communities centered on high quality public transit services
• Affordable house• Walkable community• Mixed land use• Reasonable density• Multiple modes of transport
56

Buildings and Communities
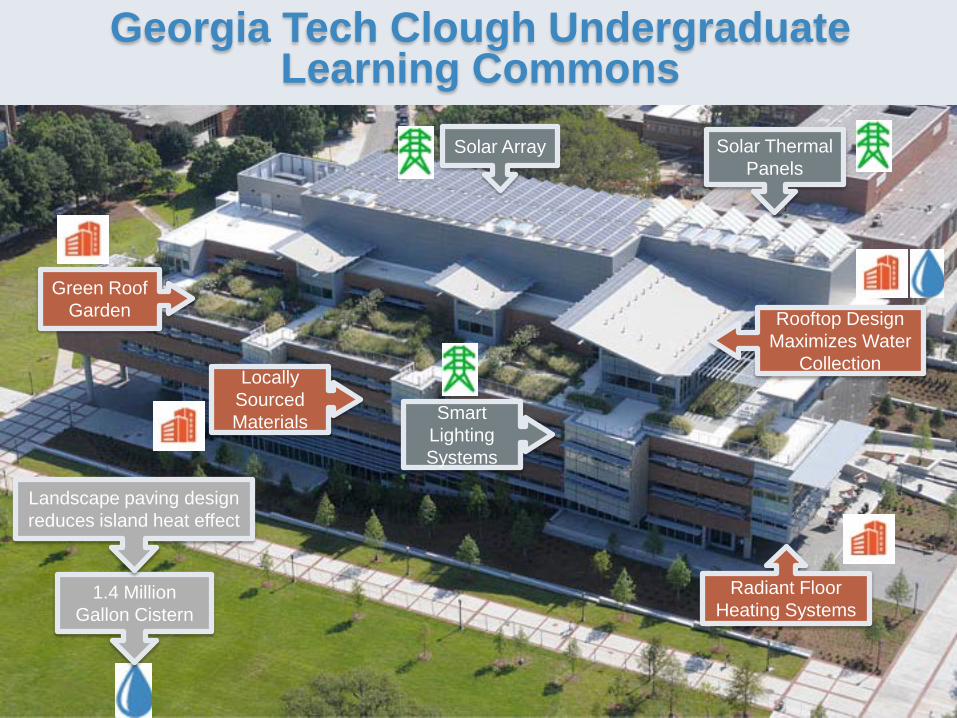
Georgia Tech Clough Undergraduate Learning Commons
1.4 Million Gallon Cistern
Green Roof Garden
Solar Array Solar Thermal Panels
Locally Sourced Materials
Rooftop Design Maximizes Water
Collection
Radiant Floor Heating Systems
Landscape paving design reduces island heat effect
Smart Lighting Systems
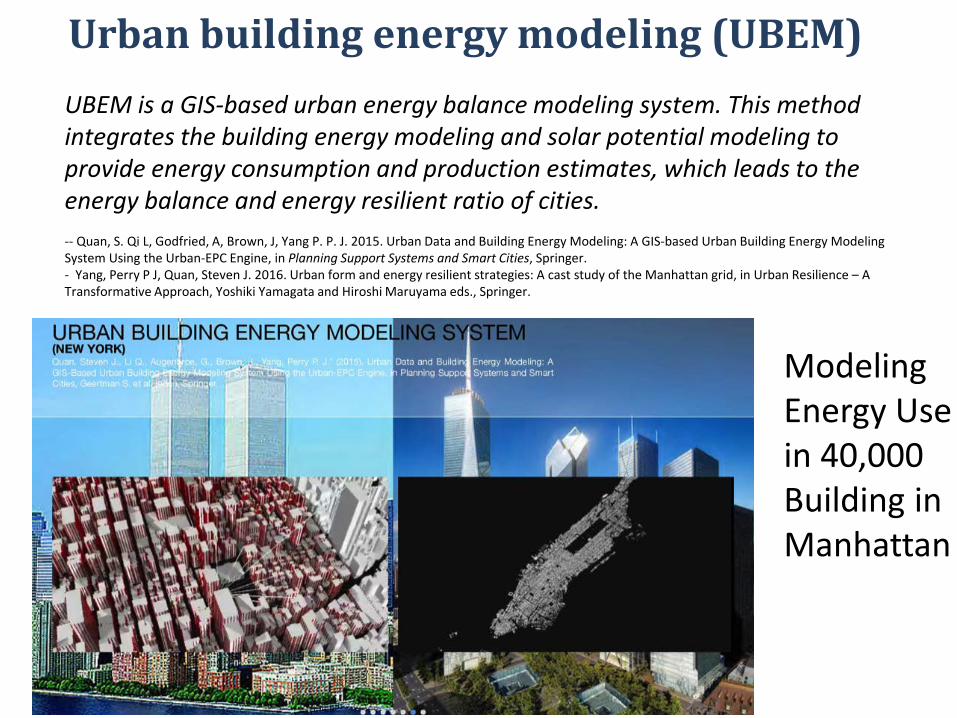
Urban building energy modeling (UBEM)UBEM is a GIS-based urban energy balance modeling system. This method integrates the building energy modeling and solar potential modeling to provide energy consumption and production estimates, which leads to the energy balance and energy resilient ratio of cities. -- Quan, S. Qi L, Godfried, A, Brown, J, Yang P. P. J. 2015. Urban Data and Building Energy Modeling: A GIS-based Urban Building Energy Modeling System Using the Urban-EPC Engine, in Planning Support Systems and Smart Cities, Springer.- Yang, Perry P J, Quan, Steven J. 2016. Urban form and energy resilient strategies: A cast study of the Manhattan grid, in Urban Resilience – A Transformative Approach, Yoshiki Yamagata and Hiroshi Maruyama eds., Springer.
Modeling Energy Use in 40,000 Building in Manhattan
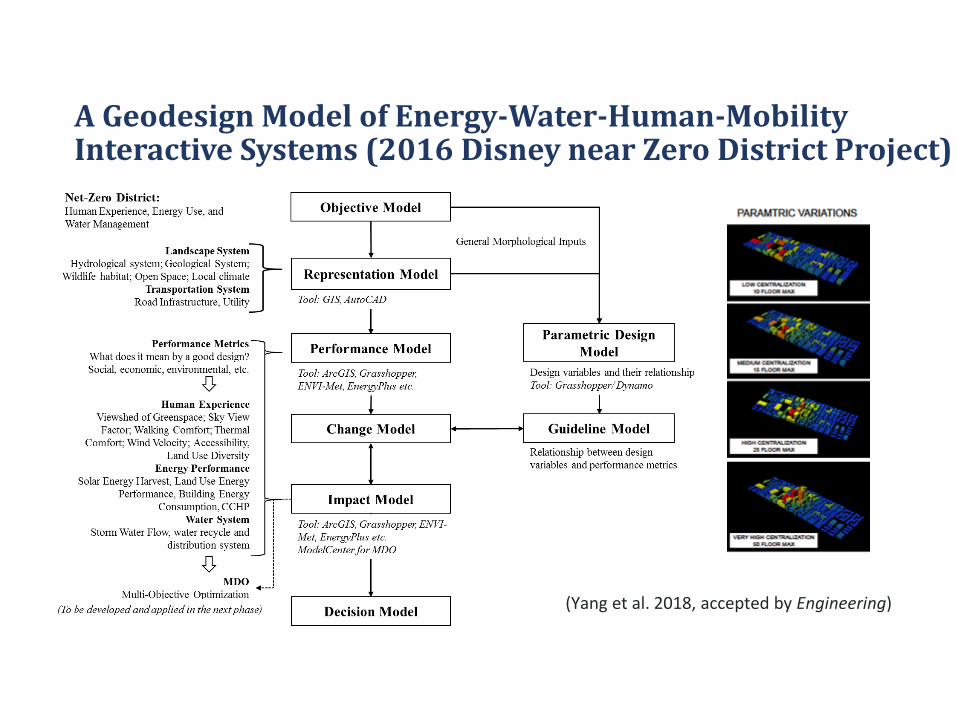
A Geodesign Model of Energy-Water-Human-Mobility Interactive Systems (2016 Disney near Zero District Project)
(Yang et al. 2018, accepted by Engineering)
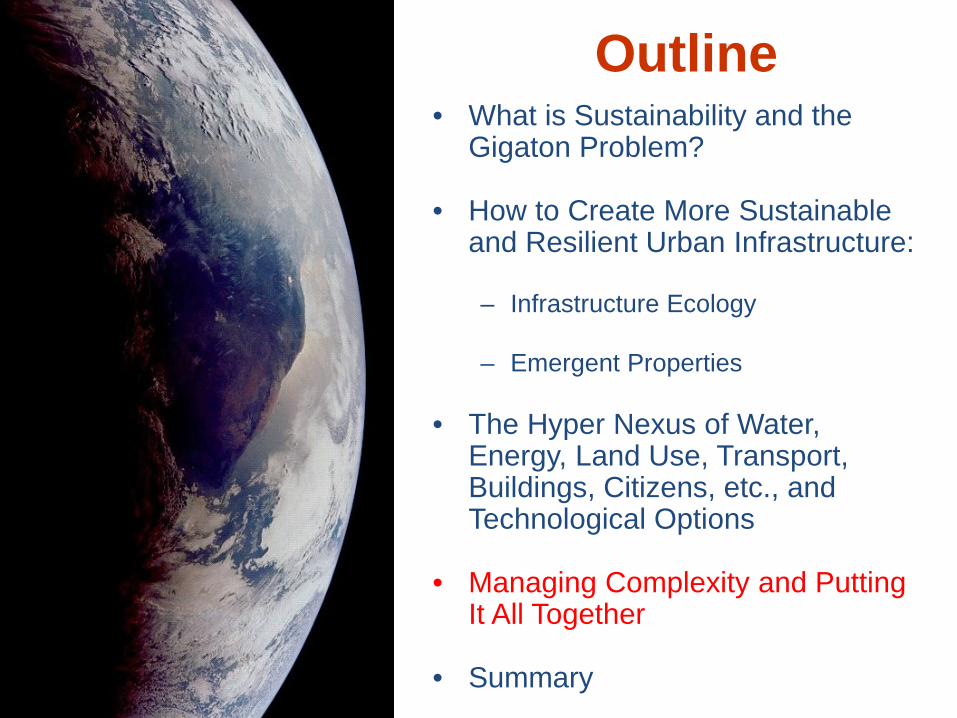
Outline• What is Sustainability and the
Gigaton Problem?
• How to Create More Sustainable and Resilient Urban Infrastructure:
– Infrastructure Ecology
– Emergent Properties
• The Hyper Nexus of Water, Energy, Land Use, Transport, Buildings, Citizens, etc., and Technological Options
• Managing Complexity and Putting It All Together
• Summary
69
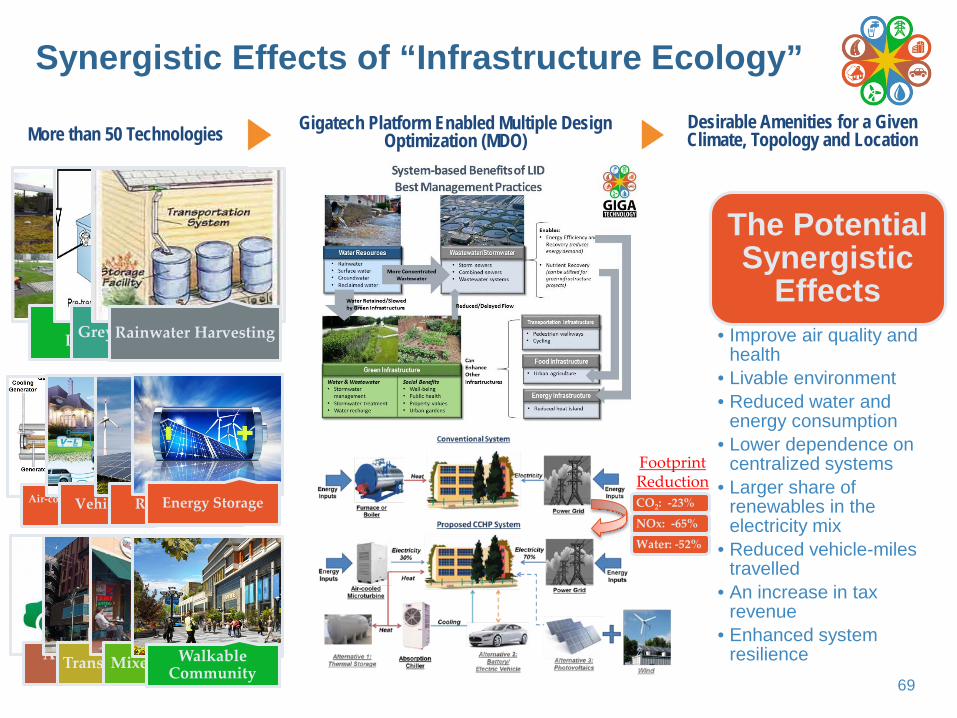
Synergistic Effects of “Infrastructure Ecology”
More than 50 Technologies Gigatech Platform Enabled Multiple Design Optimization (MDO)
Desirable Amenities for a Given Climate, Topology and Location
Autonomous VehiclesTransit-OrientedMixed Land UseWalkable
Community
Low Impact DevelopmentGrey Water RecyclingRainwater Harvesting
Air-cooled Microturbine plus Chiller
The Potential Synergistic
Effects • Improve air quality and
health• Livable environment• Reduced water and
energy consumption• Lower dependence on
centralized systems • Larger share of
renewables in the electricity mix
• Reduced vehicle-miles travelled
• An increase in tax revenue
• Enhanced system resilience
Vehicle to GridRenewablesEnergy Storage CO2: -23%
NOx: -65%
Water: -52%
Footprint Reduction
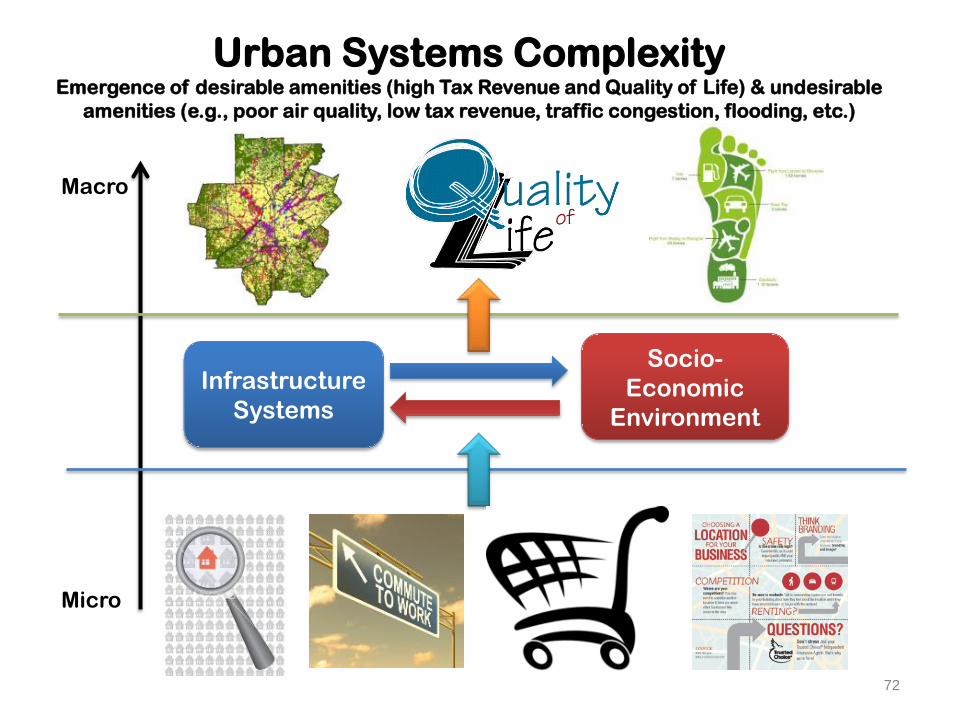
Urban Systems Complexity Emergence of desirable amenities (high Tax Revenue and Quality of Life) & undesirable
amenities (e.g., poor air quality, low tax revenue, traffic congestion, flooding, etc.)
Macro
Micro
Infrastructure Systems
Socio-Economic
Environment
72
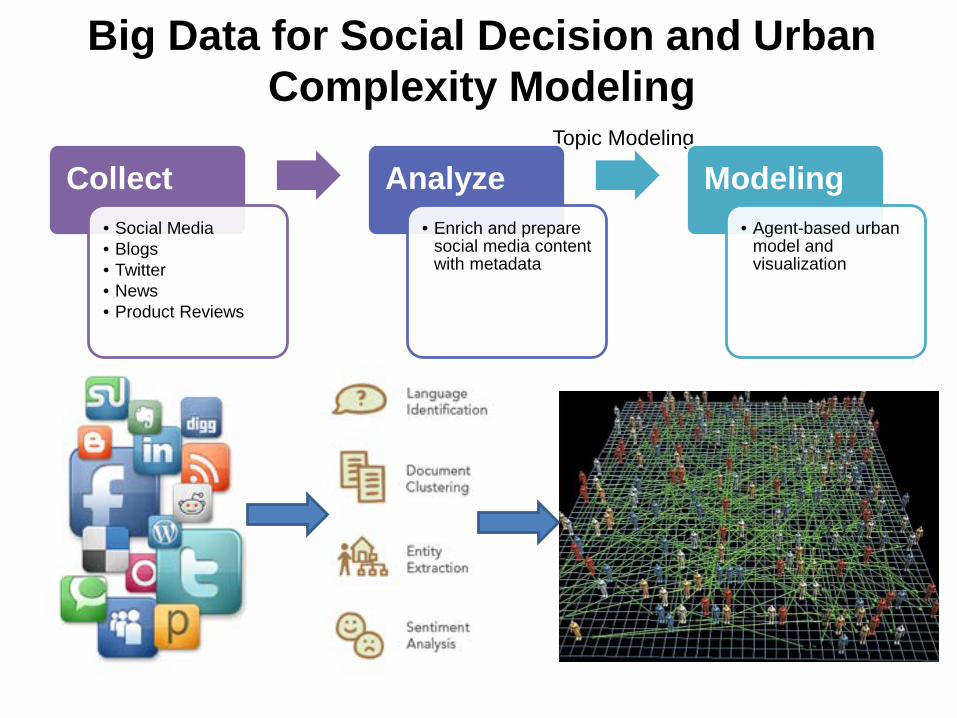
Big Data for Social Decision and Urban Complexity Modeling
Topic Modeling
Collect• Social Media• Blogs• Twitter• News• Product Reviews
Analyze• Enrich and prepare
social media content with metadata
Modeling• Agent-based urban
model and visualization
Water, Energy, Cost and Air Quality
RESIN Meeting Sept. 24, 2009
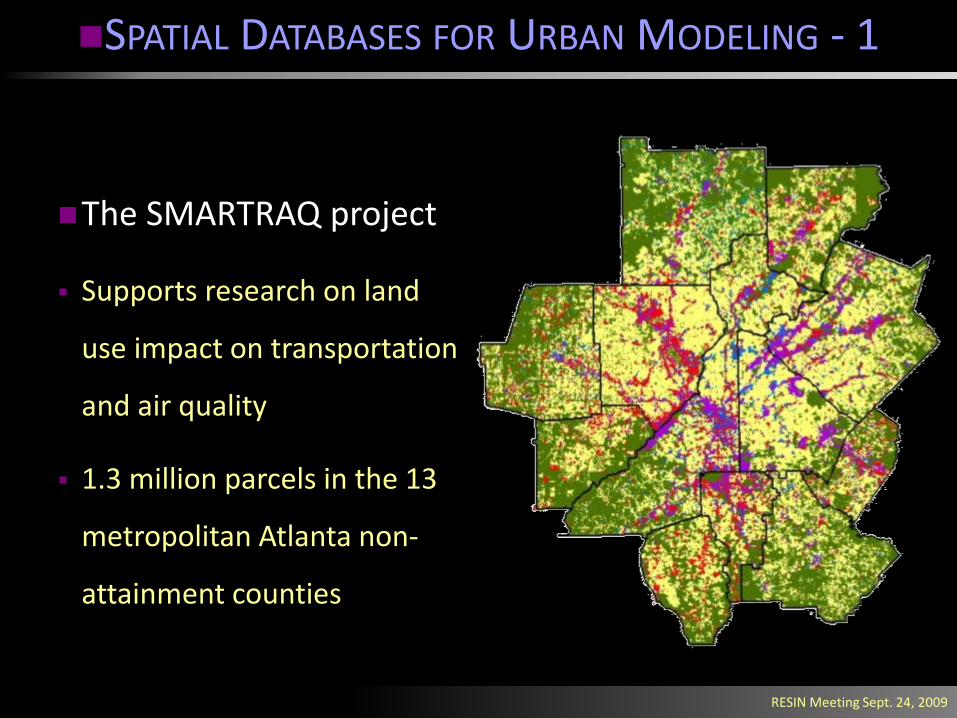
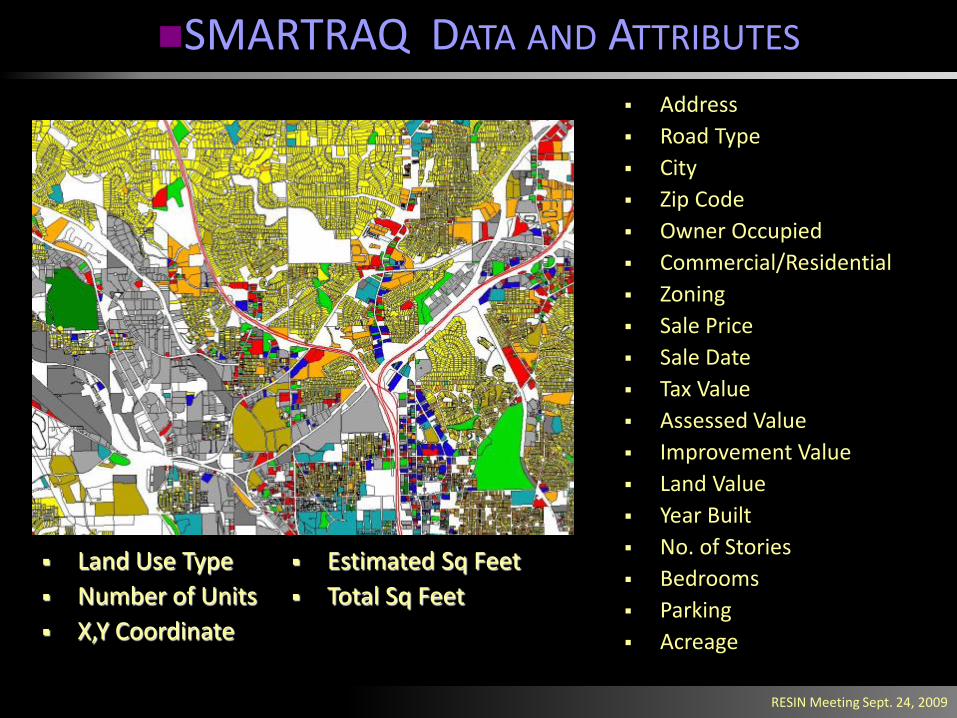
SPATIAL DATABASES FOR URBAN MODELING - 1
The SMARTRAQ project
Supports research on land
use impact on transportation
and air quality
1.3 million parcels in the 13
metropolitan Atlanta non-
attainment counties
RESIN Meeting Sept. 24, 2009
SMARTRAQ DATA AND ATTRIBUTES
Address Road Type City Zip Code Owner Occupied Commercial/Residential Zoning Sale Price Sale Date Tax Value Assessed Value Improvement Value Land Value Year Built No. of Stories Bedrooms Parking Acreage
Land Use Type Number of Units X,Y Coordinate
Estimated Sq Feet Total Sq Feet
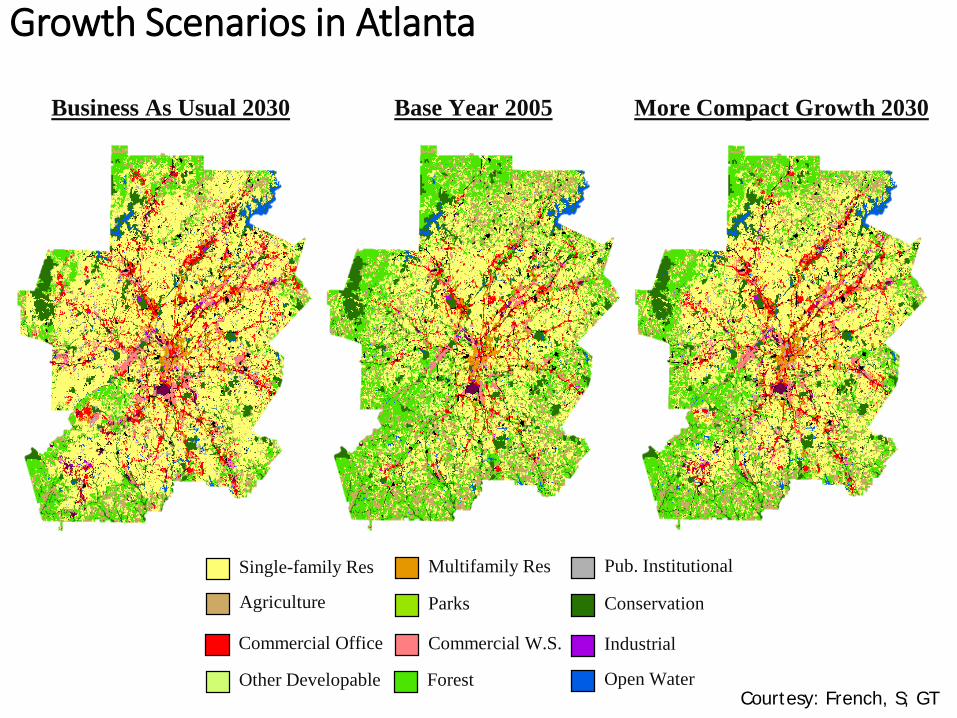
Growth Scenarios in Atlanta
Courtesy: French, S; GT
More Compact Growth 2030Base Year 2005Business As Usual 2030
Single-family Res Multifamily Res Pub. Institutional
Commercial Office Commercial W.S. Industrial
Agriculture Parks Conservation
ForestOther Developable Open Water
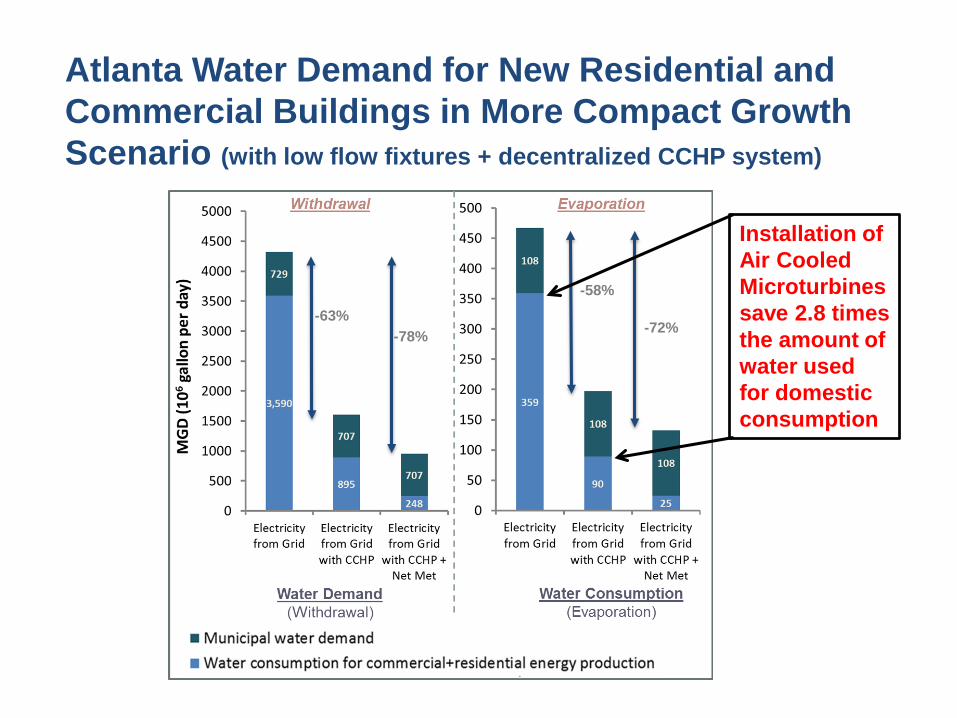
Atlanta Water Demand for New Residential and Commercial Buildings in More Compact Growth Scenario (with low flow fixtures + decentralized CCHP system)
Installation of Air Cooled Microturbines save 2.8 times the amount of water used for domestic consumption
-63%-78%
-58%
-72%
12.1
11.0
9.99.0
10.7
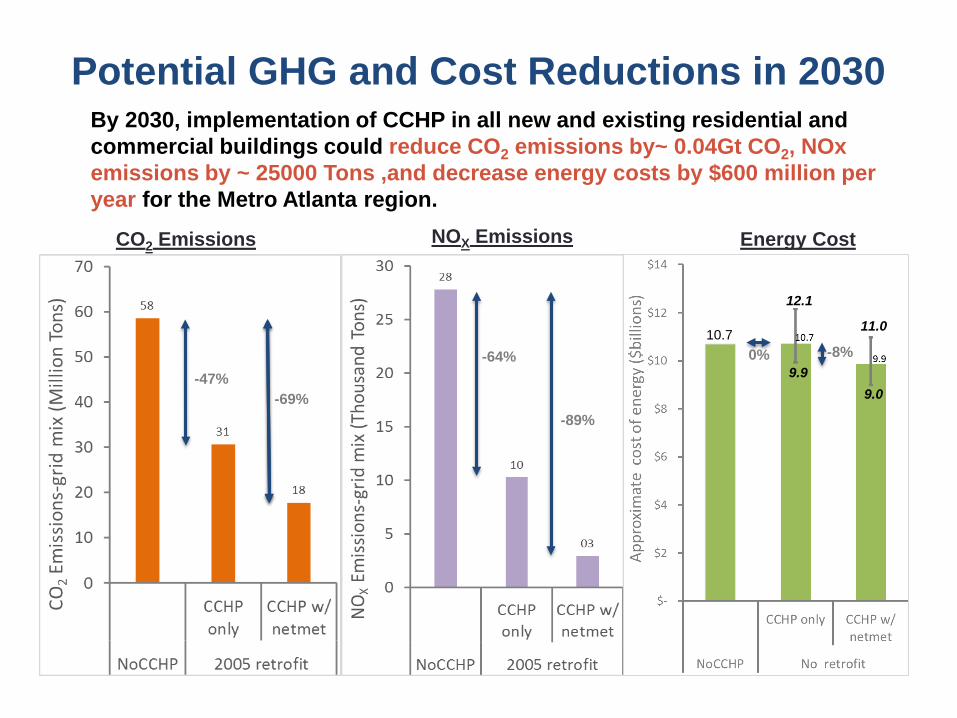
Potential GHG and Cost Reductions in 2030By 2030, implementation of CCHP in all new and existing residential and commercial buildings could reduce CO2 emissions by~ 0.04Gt CO2, NOx emissions by ~ 25000 Tons ,and decrease energy costs by $600 million per year for the Metro Atlanta region.
Energy Cost
-47%
CO2 Emissions
-69%
NOX Emissions
-89%
-64% 0% -8%
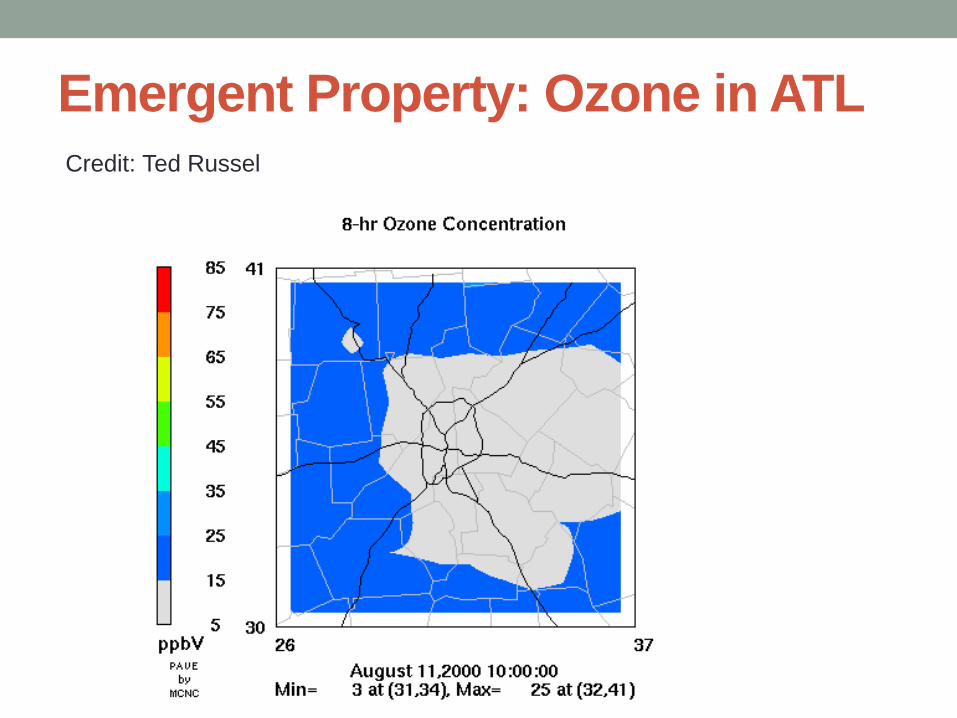
Emergent Property: Ozone in ATLCredit: Ted Russel
Outline• What is Sustainability and the
Gigaton Problem?
• How to Create More Sustainable and Resilient Urban Infrastructure:
– Infrastructure Ecology
– Emergent Properties
• The Hyper Nexus of Water, Energy, Land Use, Transport, Buildings, Citizens, etc., and Technological Options
• Managing Complexity and Putting It All Together
• Summary
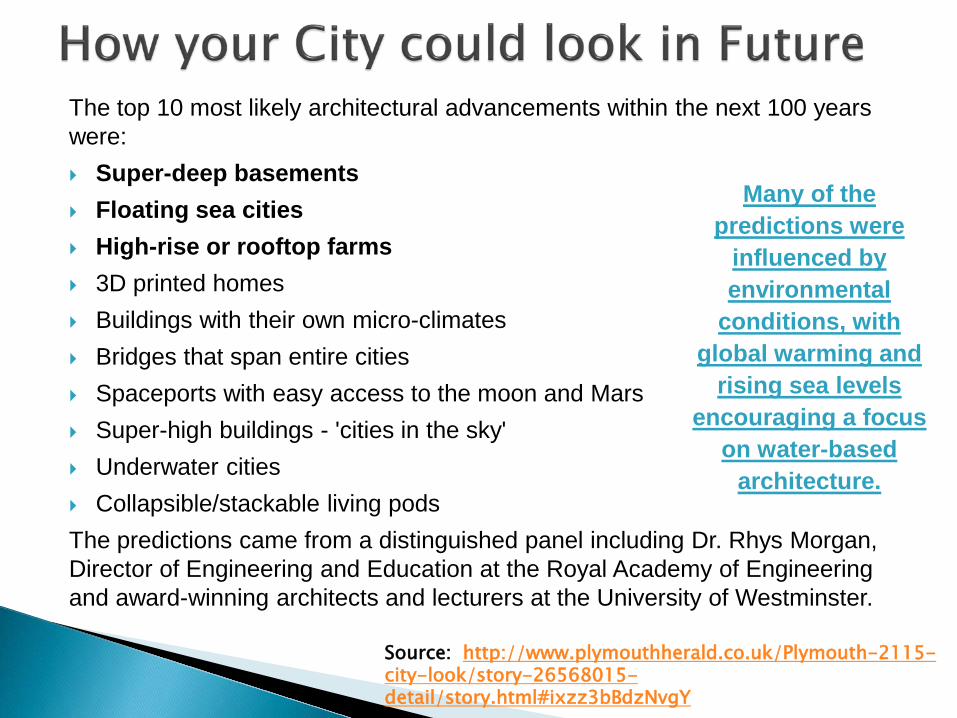
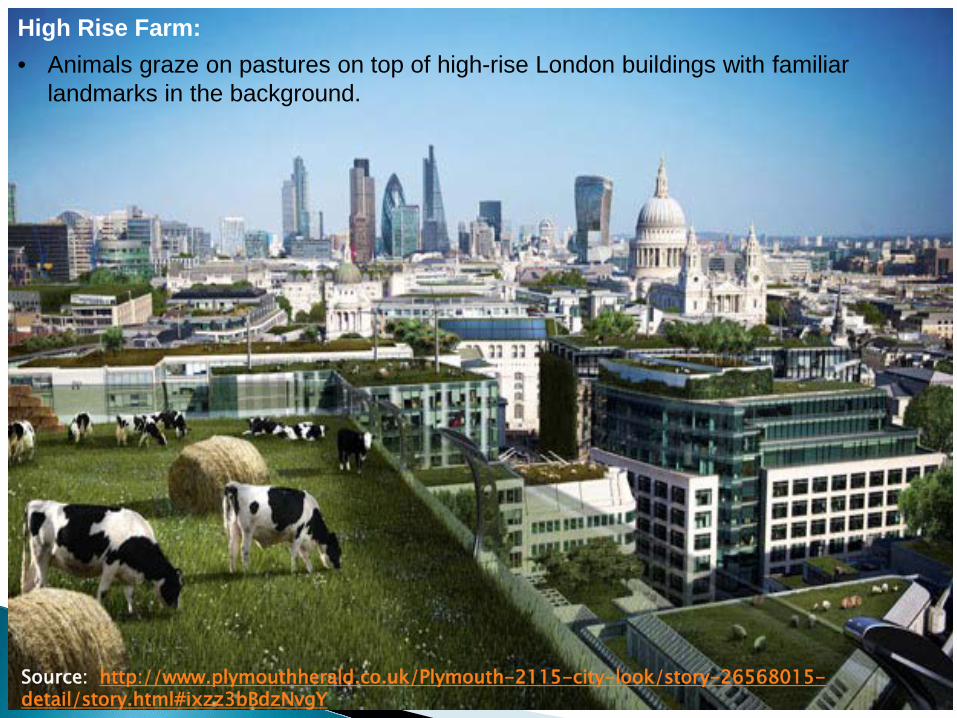
The top 10 most likely architectural advancements within the next 100 years were: Super-deep basements Floating sea cities High-rise or rooftop farms 3D printed homes Buildings with their own micro-climates Bridges that span entire cities Spaceports with easy access to the moon and Mars Super-high buildings - 'cities in the sky' Underwater cities Collapsible/stackable living podsThe predictions came from a distinguished panel including Dr. Rhys Morgan, Director of Engineering and Education at the Royal Academy of Engineering and award-winning architects and lecturers at the University of Westminster.
Source: http://www.plymouthherald.co.uk/Plymouth-2115-city-look/story-26568015-detail/story.html#ixzz3bBdzNvgY
Many of the predictions were
influenced by environmental
conditions, with global warming and
rising sea levels encouraging a focus
on water-based architecture.
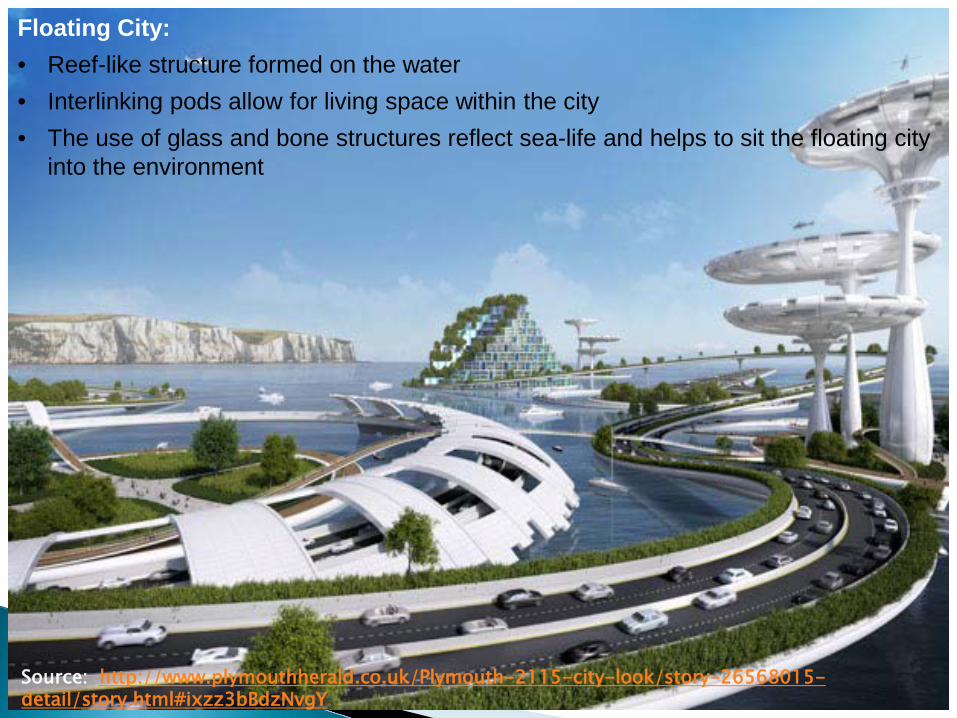
Floating City:• Reef-like structure formed on the water• Interlinking pods allow for living space within the city• The use of glass and bone structures reflect sea-life and helps to sit the floating city
into the environment
Source: http://www.plymouthherald.co.uk/Plymouth-2115-city-look/story-26568015-detail/story.html#ixzz3bBdzNvgY
Source: http://www.plymouthherald.co.uk/Plymouth-2115-city-look/story-26568015-detail/story.html#ixzz3bBdzNvgY
High Rise Farm:• Animals graze on pastures on top of high-rise London buildings with familiar
landmarks in the background.
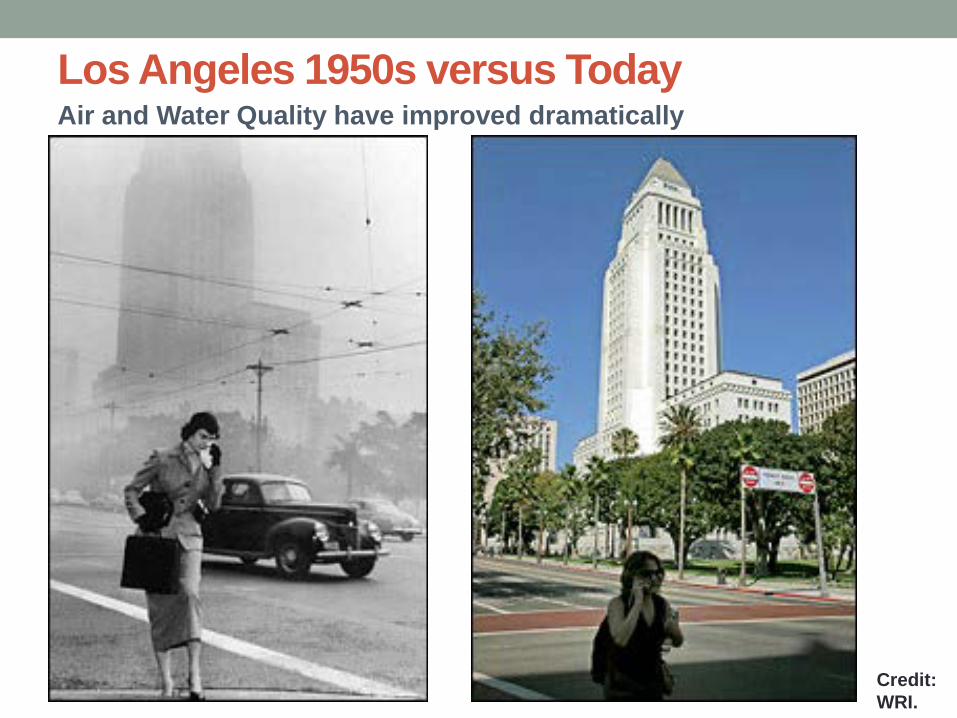
Los Angeles 1950s versus TodayAir and Water Quality have improved dramatically
Credit: WRI.
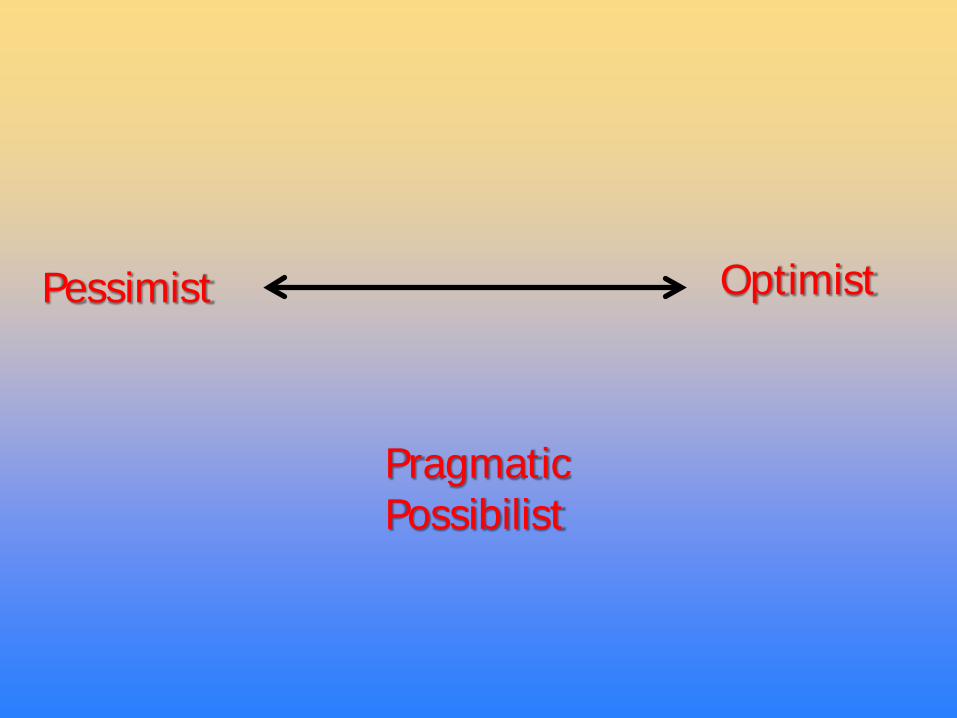
Pessimist Optimist
Pragmatic Possibilist
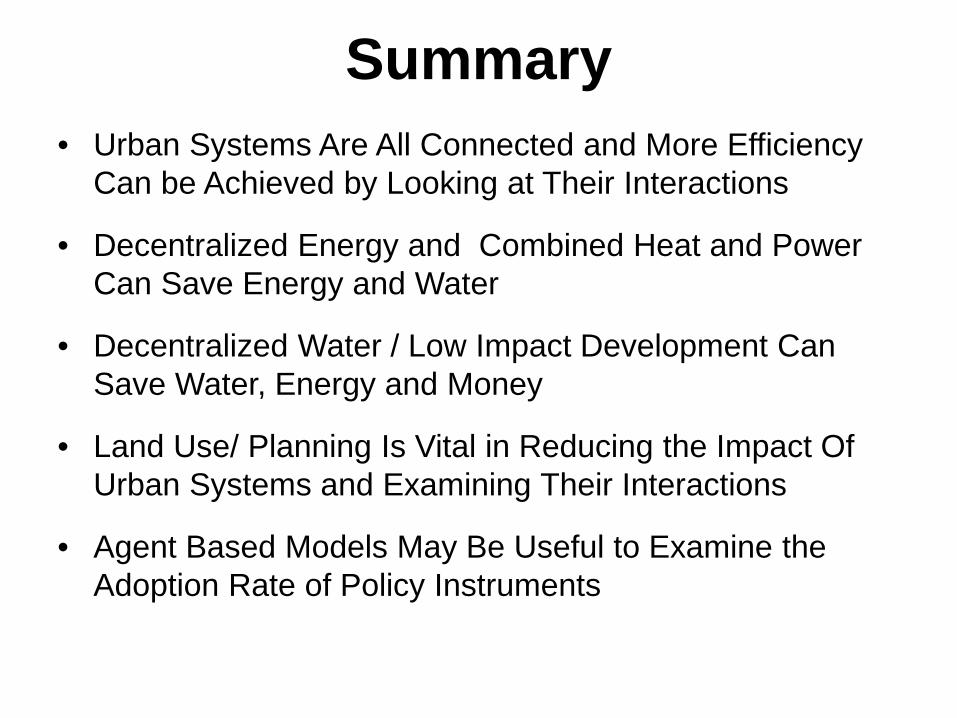
Summary• Urban Systems Are All Connected and More Efficiency
Can be Achieved by Looking at Their Interactions
• Decentralized Energy and Combined Heat and Power Can Save Energy and Water
• Decentralized Water / Low Impact Development Can Save Water, Energy and Money
• Land Use/ Planning Is Vital in Reducing the Impact Of Urban Systems and Examining Their Interactions
• Agent Based Models May Be Useful to Examine the Adoption Rate of Policy Instruments
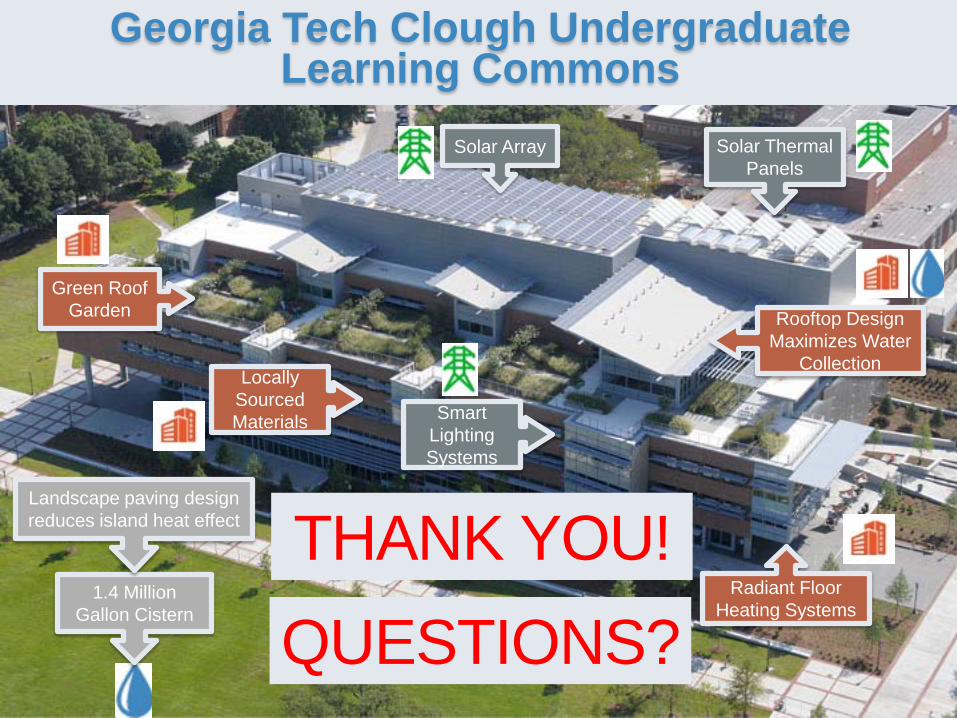
Georgia Tech Clough Undergraduate Learning Commons
THANK YOU!1.4 Million
Gallon Cistern
Green Roof Garden
Solar Array Solar Thermal Panels
Locally Sourced Materials
Rooftop Design Maximizes Water
Collection
Radiant Floor Heating Systems
Landscape paving design reduces island heat effect
Smart Lighting Systems
QUESTIONS?
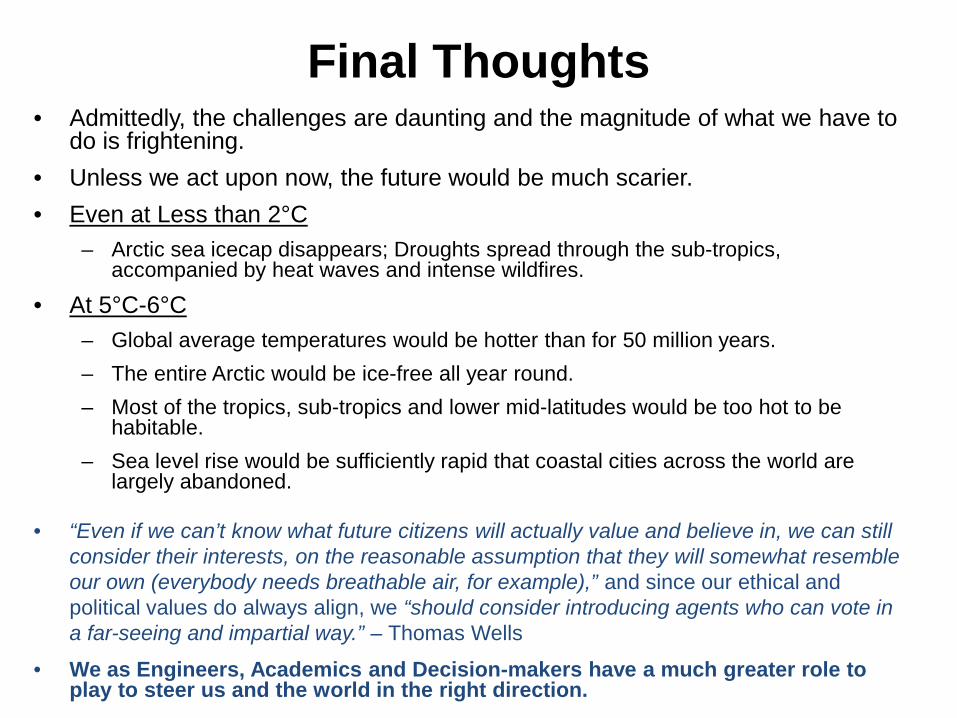
Final Thoughts• Admittedly, the challenges are daunting and the magnitude of what we have to
do is frightening.• Unless we act upon now, the future would be much scarier.• Even at Less than 2°C
– Arctic sea icecap disappears; Droughts spread through the sub-tropics, accompanied by heat waves and intense wildfires.
• At 5°C-6°C– Global average temperatures would be hotter than for 50 million years. – The entire Arctic would be ice-free all year round. – Most of the tropics, sub-tropics and lower mid-latitudes would be too hot to be
habitable. – Sea level rise would be sufficiently rapid that coastal cities across the world are
largely abandoned.
• “Even if we can’t know what future citizens will actually value and believe in, we can still consider their interests, on the reasonable assumption that they will somewhat resemble our own (everybody needs breathable air, for example),” and since our ethical and political values do always align, we “should consider introducing agents who can vote in a far-seeing and impartial way.” – Thomas Wells
• We as Engineers, Academics and Decision-makers have a much greater role to play to steer us and the world in the right direction.
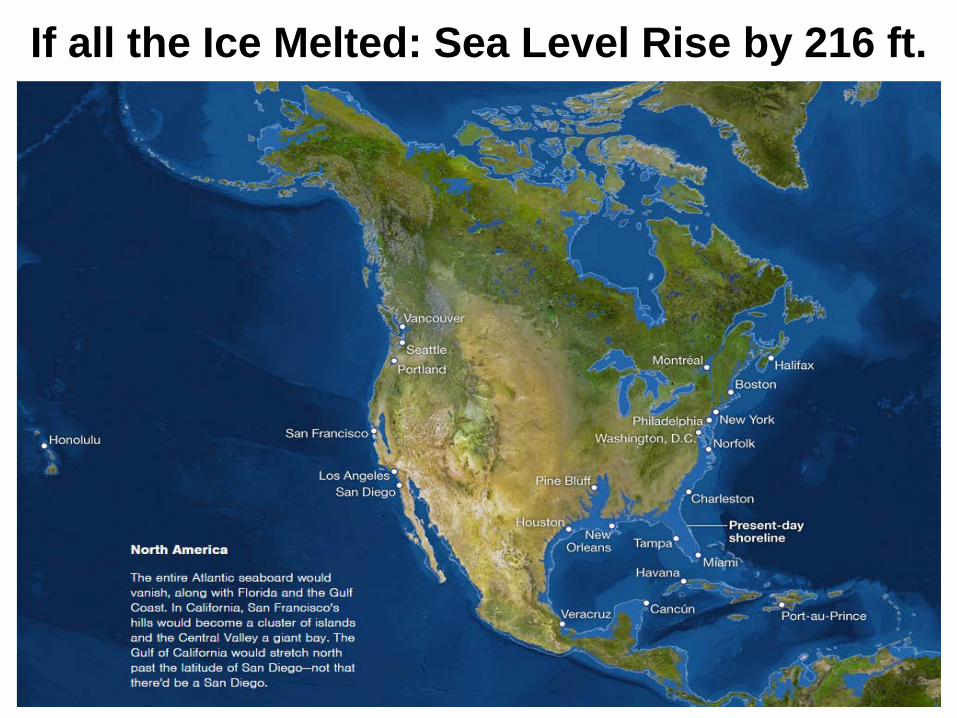
If all the Ice Melted: Sea Level Rise by 216 ft.
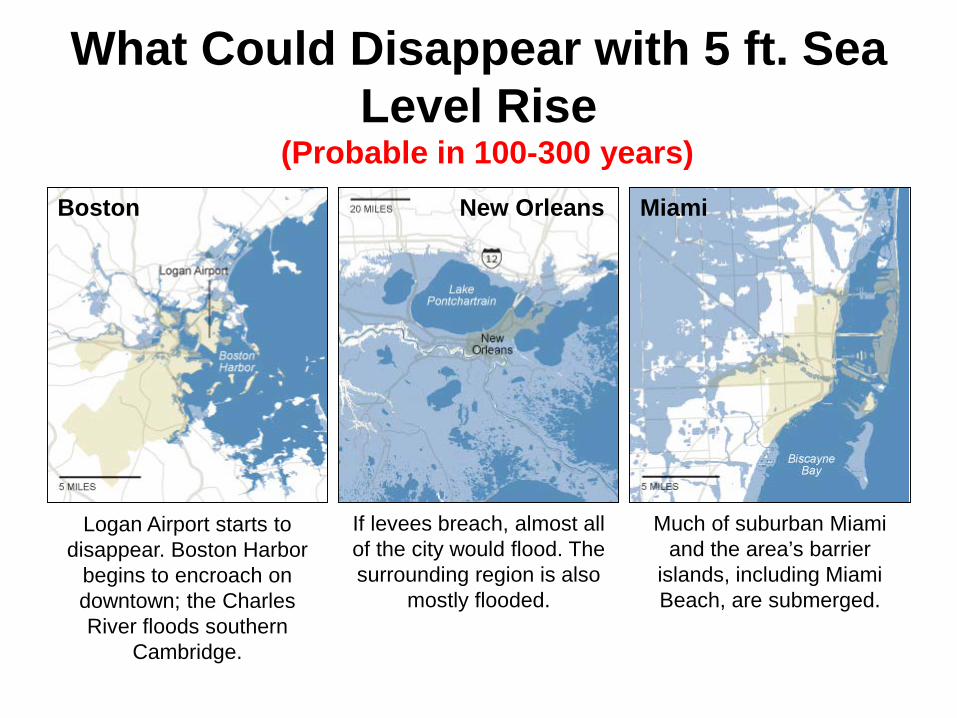
What Could Disappear with 5 ft. Sea Level Rise
If levees breach, almost all of the city would flood. The surrounding region is also
mostly flooded.
Much of suburban Miami and the area’s barrier
islands, including Miami Beach, are submerged.
Logan Airport starts to disappear. Boston Harbor
begins to encroach on downtown; the Charles River floods southern
Cambridge.
(Probable in 100-300 years)Boston New Orleans Miami

Reminder of the Past: Cuyahoga River (Ohio) on Fire November 4, 1952
Acknowledgements• Brook Byers Institute for
Sustainable Systems– Dr. Michael Chang– Dr. Arka Pandit– Dr. Zhongming Lu– Dr. Hyunju Jeong– Dr. ELizabeth Minne– Dr. Jean-Ann James– Dr. Xuewei Yu– Susan Ryan– Brent Verrill– Kathryn Jonell– Gay Burchfield– Martha Lindsay (retired)
• Georgia Institute of Technology
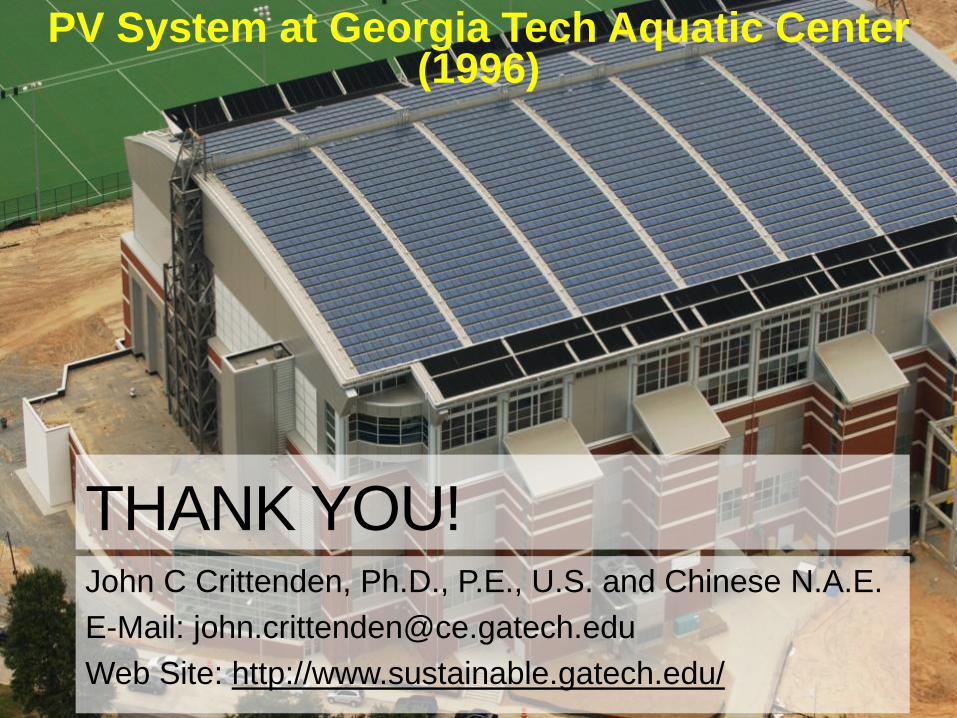
PV System at Georgia Tech Aquatic Center (1996)
THANK YOU!John C Crittenden, Ph.D., P.E., U.S. and Chinese N.A.E.E-Mail: [email protected] Web Site: http://www.sustainable.gatech.edu/
Lets Look at CARBON Cycle in Detail
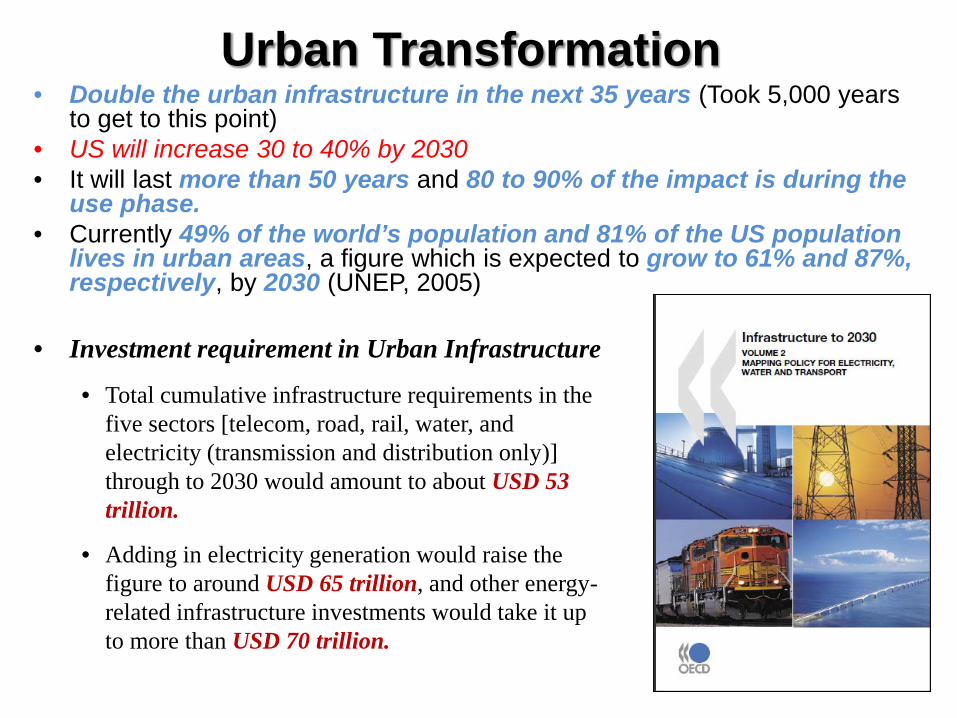
Urban Transformation• Double the urban infrastructure in the next 35 years (Took 5,000 years
to get to this point)• US will increase 30 to 40% by 2030• It will last more than 50 years and 80 to 90% of the impact is during the
use phase.• Currently 49% of the world’s population and 81% of the US population
lives in urban areas, a figure which is expected to grow to 61% and 87%, respectively, by 2030 (UNEP, 2005)
• Investment requirement in Urban Infrastructure
• Total cumulative infrastructure requirements in the five sectors [telecom, road, rail, water, and electricity (transmission and distribution only)] through to 2030 would amount to about USD 53 trillion.
• Adding in electricity generation would raise the figure to around USD 65 trillion, and other energy-related infrastructure investments would take it up to more than USD 70 trillion.
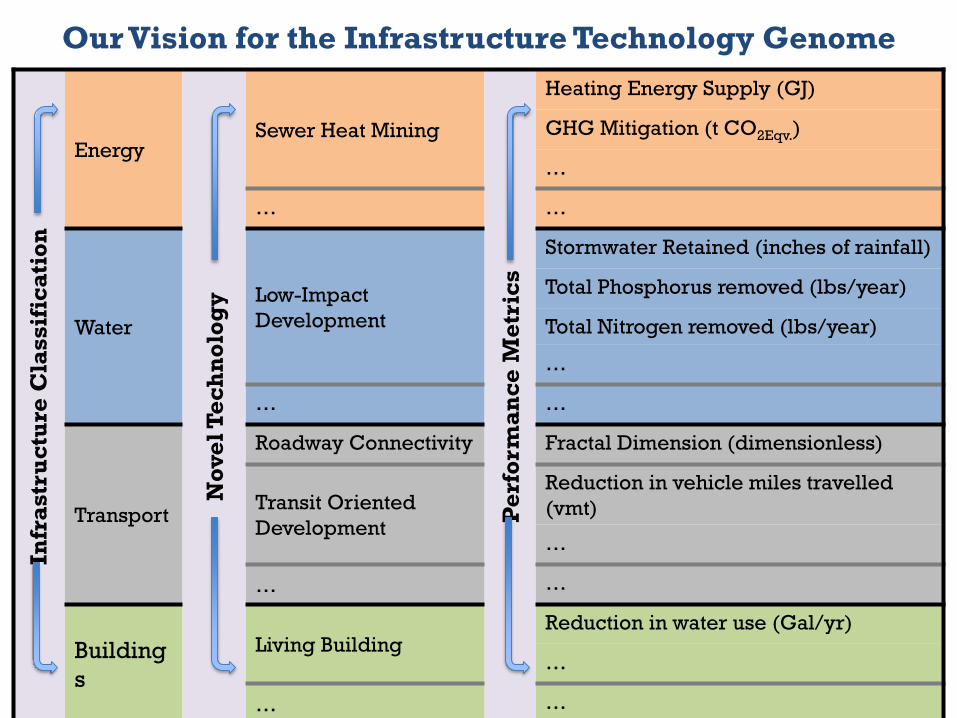
Our Vision for the Infrastructure Technology GenomeIn
fras
tru
ctu
re C
lass
ific
atio
n
Energy
Nov
el T
ech
nol
ogy
Sewer Heat Mining
Per
form
ance
Met
rics
Heating Energy Supply (GJ)
GHG Mitigation (t CO2Eqv.)
…
… …
Water
Low-Impact Development
Stormwater Retained (inches of rainfall)
Total Phosphorus removed (lbs/year)
Total Nitrogen removed (lbs/year)
…
… …
Transport
Roadway Connectivity Fractal Dimension (dimensionless)
Transit Oriented Development
Reduction in vehicle miles travelled (vmt)
…
… …
Buildings
Living BuildingReduction in water use (Gal/yr)
…
… …