Embed Size (px)
Citation preview
Giant Kelp Canopy Cover and Biomass from High Resolution SPOT Imagery for the Santa
Barbara Channel
Kyle C Cavanaugh, David A Siegel, Brian P Kinlan, Dan C Reed
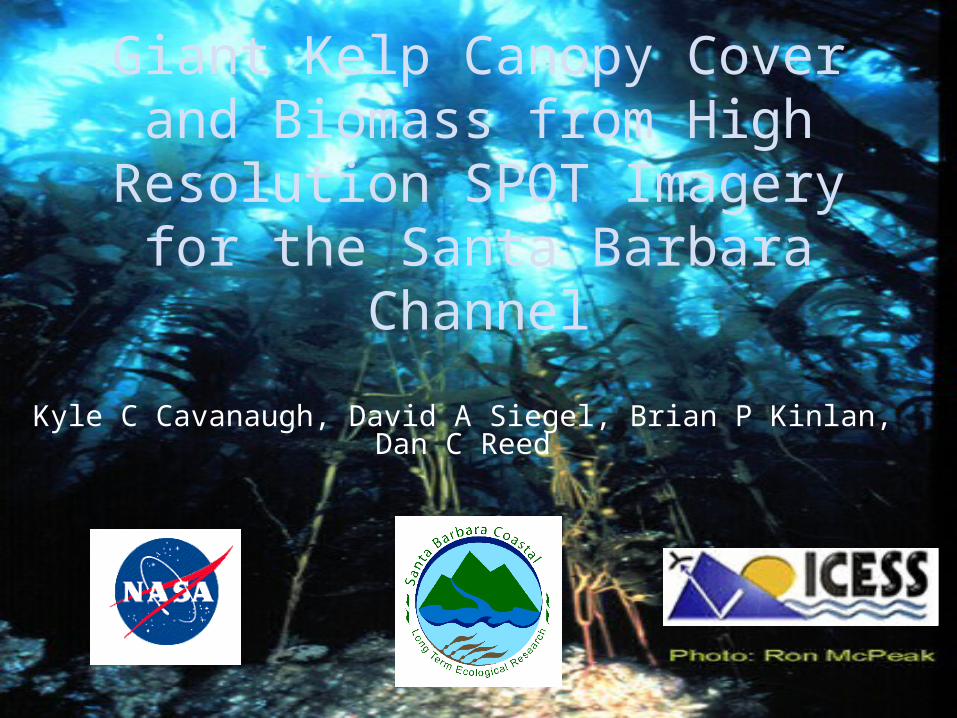
Macrocystis pyrifera
• High economic and ecologic importance– “ecosystem engineer”
• Kelp abundance highly dynamic– Avg. frond life: 3-5 months– Ave. plant life: 2-3 years– Growth rates up to 0.5 m/day
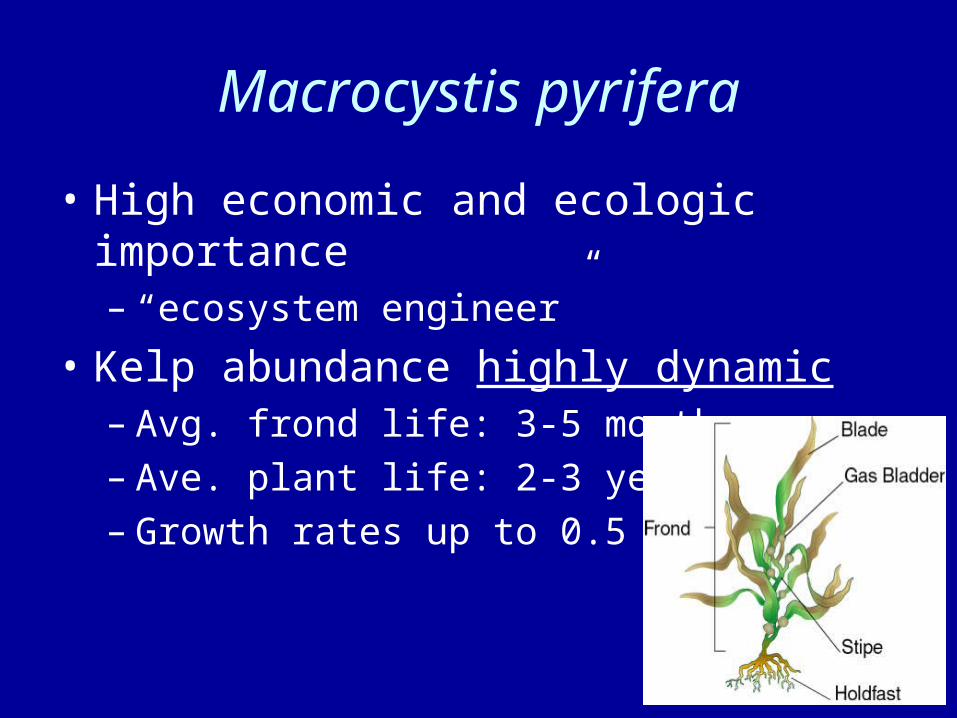
Macrocystis growth and mortality
• Growth and mortality regulated by water temp, nutrients, depth, bottom type, predation, wave action
• Nice model system for the study of a number of interesting ecological theories
Kelp biomass data from Kelco visual estimates; Fish observations from Brooks et al 2002
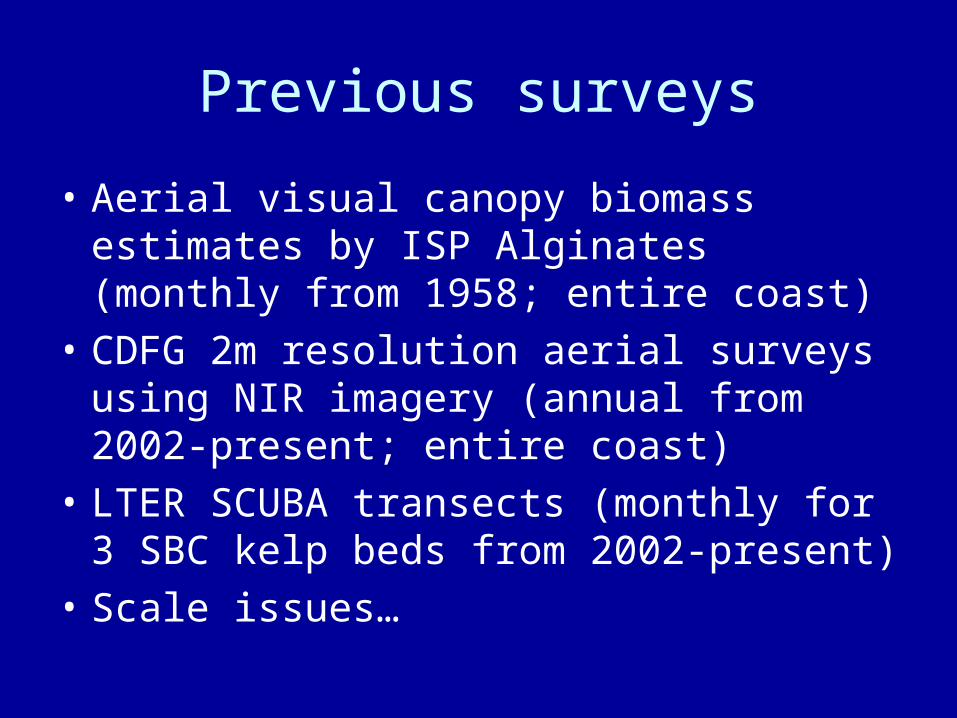
Previous surveys
• Aerial visual canopy biomass estimates by ISP Alginates (monthly from 1958; entire coast)
• CDFG 2m resolution aerial surveys using NIR imagery (annual from 2002-present; entire coast)
• LTER SCUBA transects (monthly for 3 SBC kelp beds from 2002-present)
• Scale issues…
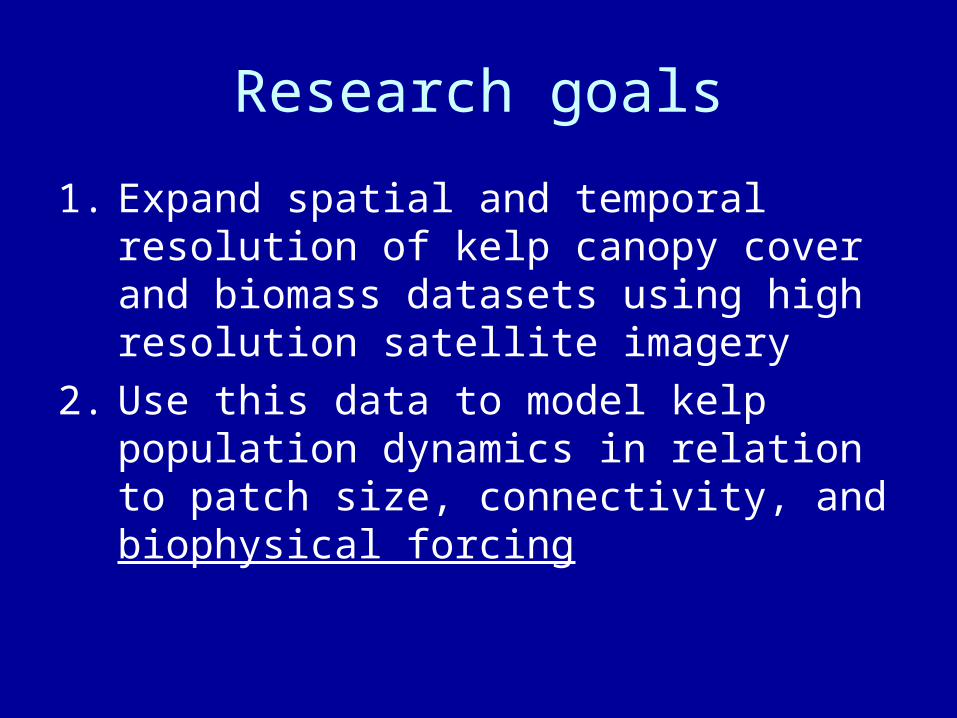
Research goals
1. Expand spatial and temporal resolution of kelp canopy cover and biomass datasets using high resolution satellite imagery
2. Use this data to model kelp population dynamics in relation to patch size, connectivity, and biophysical forcing
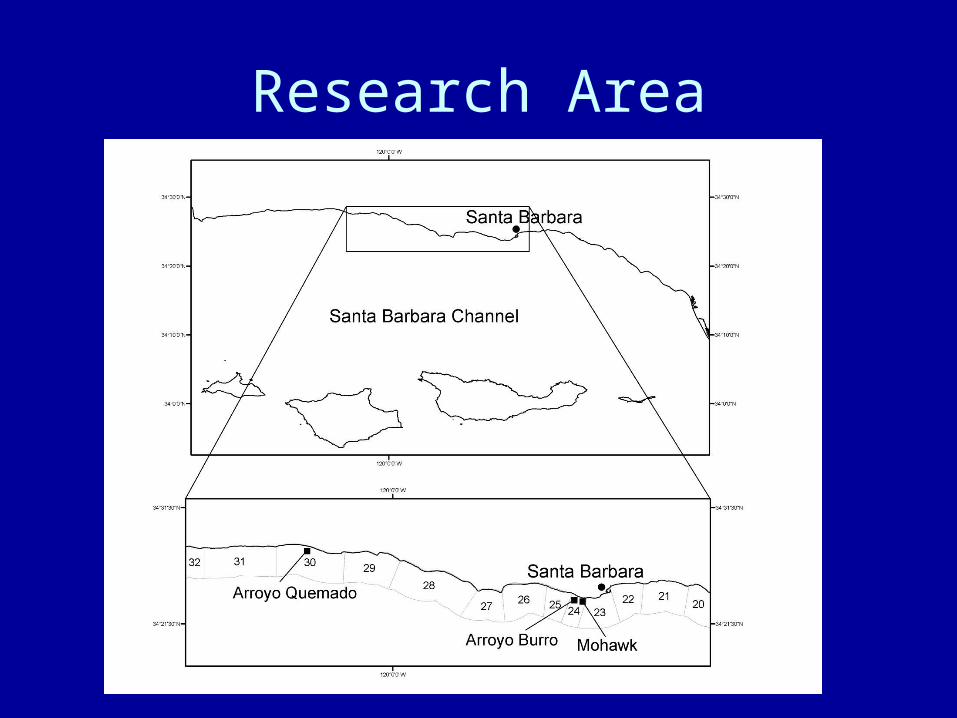
Research Area
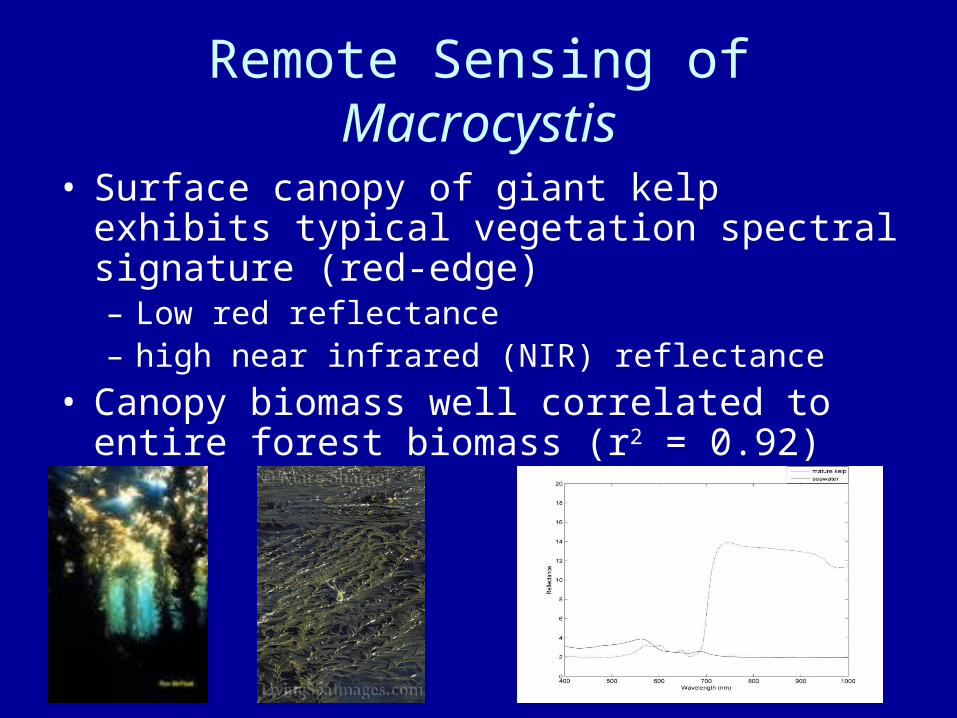
Remote Sensing of Macrocystis
• Surface canopy of giant kelp exhibits typical vegetation spectral signature (red-edge)– Low red reflectance– high near infrared (NIR) reflectance
• Canopy biomass well correlated to entire forest biomass (r2 = 0.92)
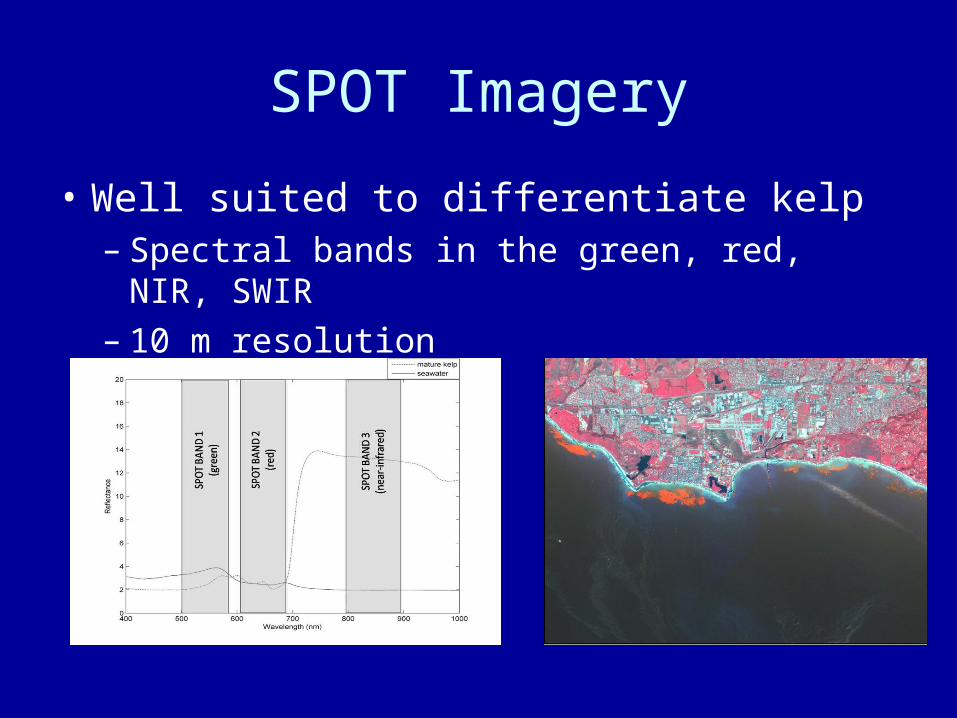
SPOT Imagery
• Well suited to differentiate kelp– Spectral bands in the green, red, NIR, SWIR– 10 m resolution
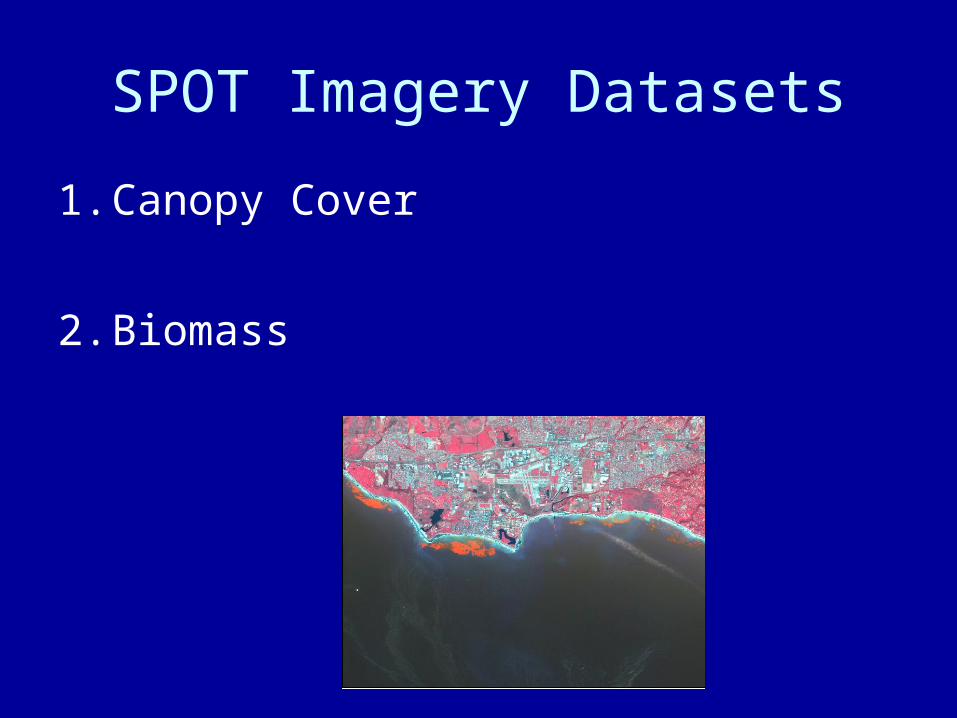
SPOT Imagery Datasets
1. Canopy Cover
2. Biomass
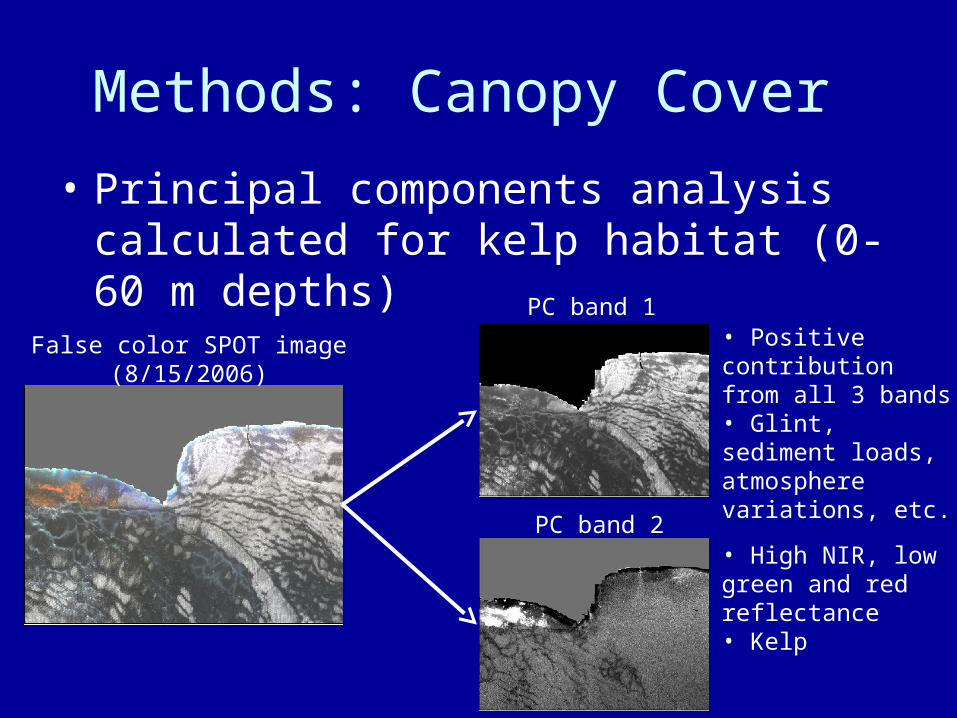
Methods: Canopy Cover
• Principal components analysis calculated for kelp habitat (0-60 m depths)
PC band 1
PC band 2
False color SPOT image(8/15/2006)
• Positive contribution from all 3 bands• Glint, sediment loads, atmosphere variations, etc.
• High NIR, low green and red reflectance• Kelp
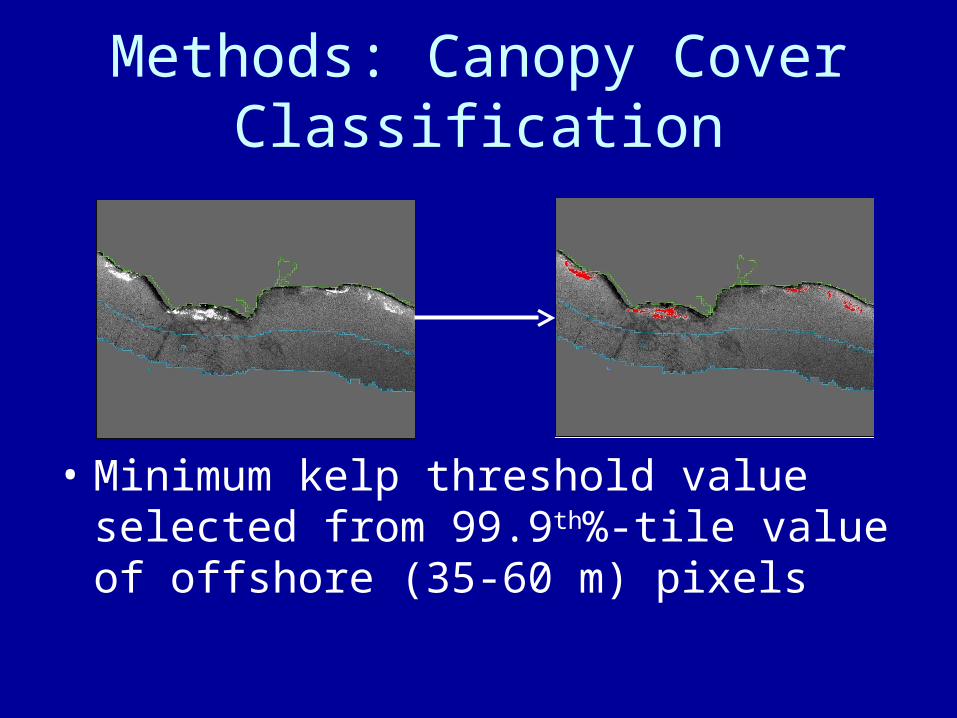
Methods: Canopy Cover Classification
• Minimum kelp threshold value selected from 99.9th%-tile value of offshore (35-60 m) pixels
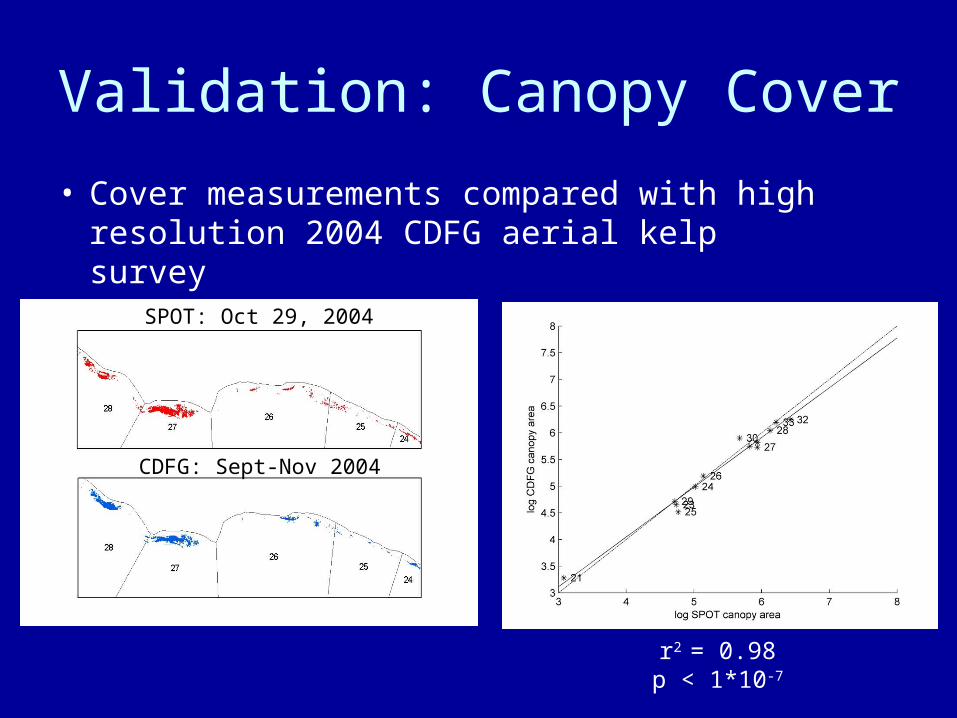
Validation: Canopy Cover
• Cover measurements compared with high resolution 2004 CDFG aerial kelp survey
SPOT: Oct 29, 2004
CDFG: Sept-Nov 2004
r2 = 0.98p < 1*10-7
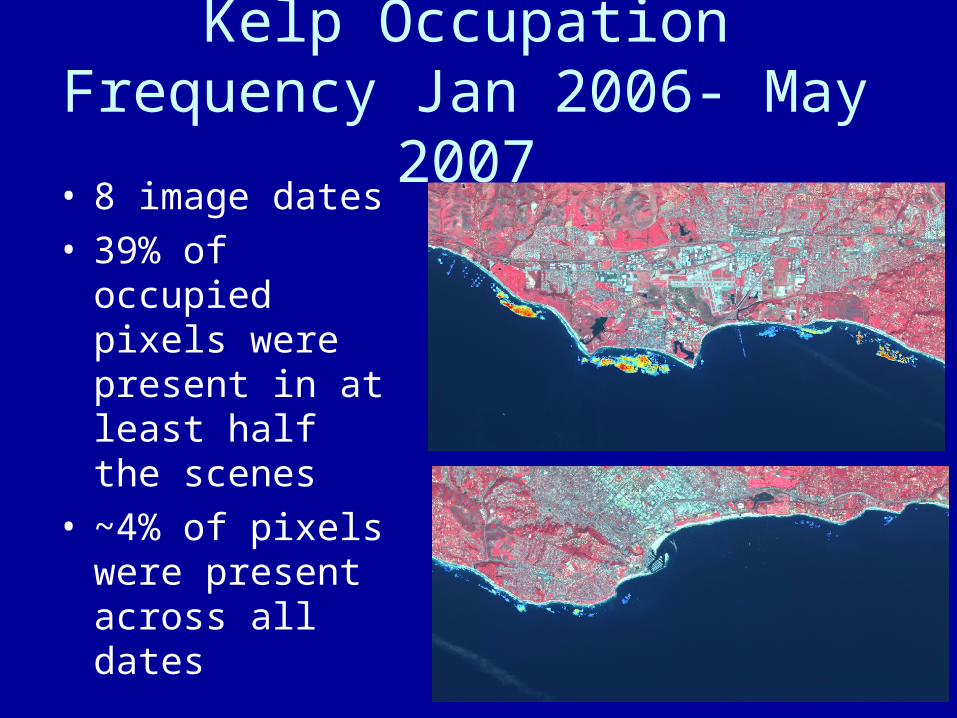
Kelp Occupation Frequency Jan 2006- May 2007
• 8 image dates• 39% of occupied
pixels were present in at least half the scenes
• ~4% of pixels were present across all dates
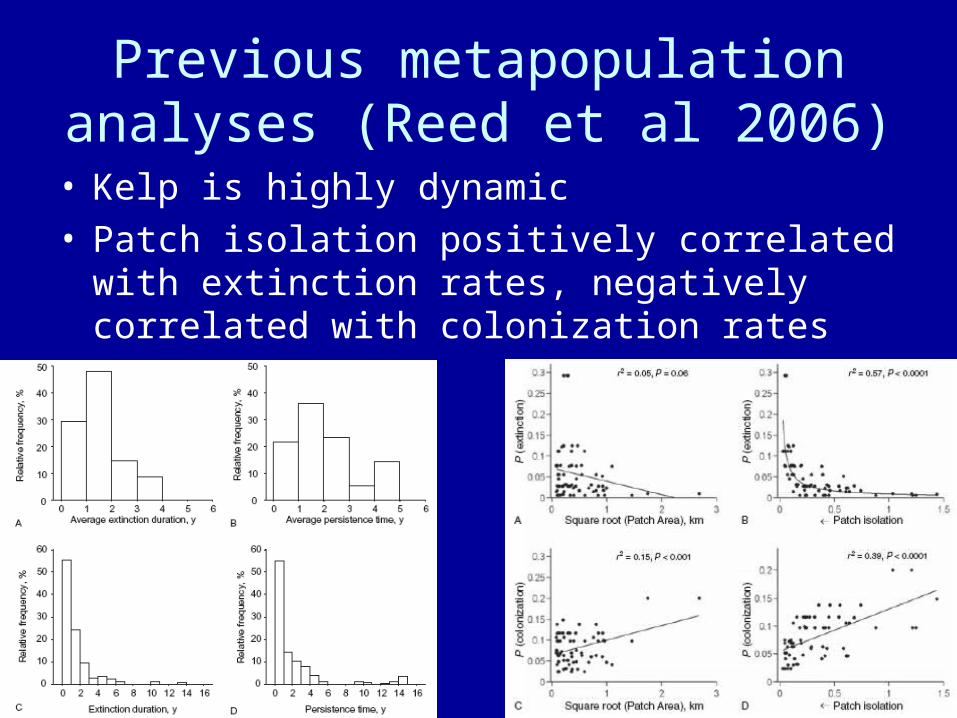
Previous metapopulation analyses (Reed et al 2006)
• Kelp is highly dynamic • Patch isolation positively correlated with
extinction rates, negatively correlated with colonization rates
Biomass Data
• More useful for understanding and modeling ecosystem interactions– Turnover rates, export, NPP, etc.
• Difficult to measure directly– Time and effort intensive
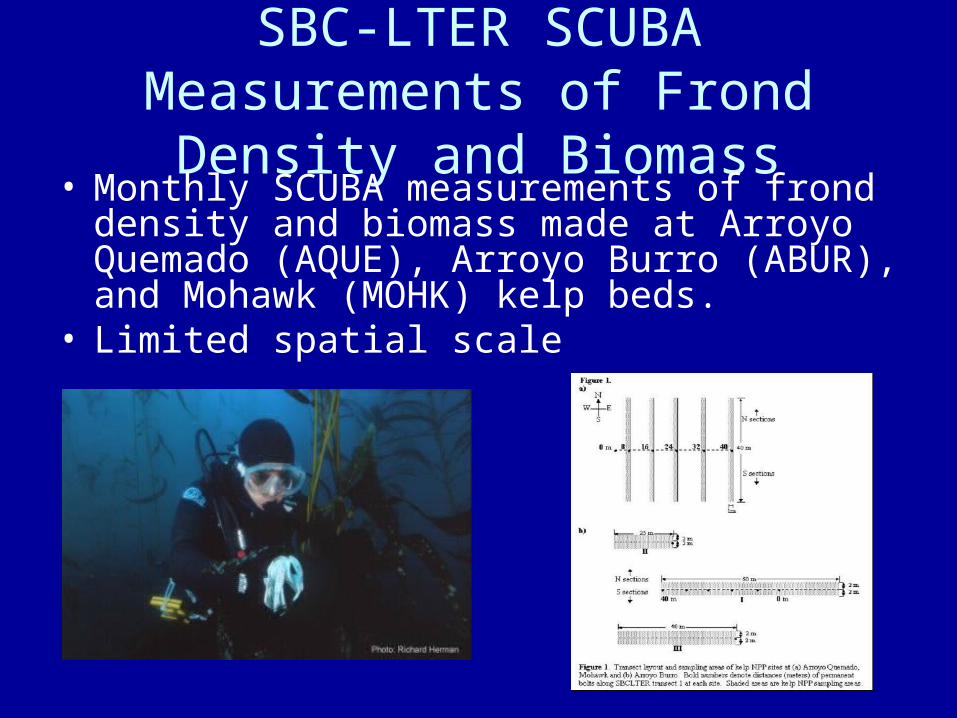
SBC-LTER SCUBA Measurements of Frond Density and Biomass
• Monthly SCUBA measurements of frond density and biomass made at Arroyo Quemado (AQUE), Arroyo Burro (ABUR), and Mohawk (MOHK) kelp beds.
• Limited spatial scale
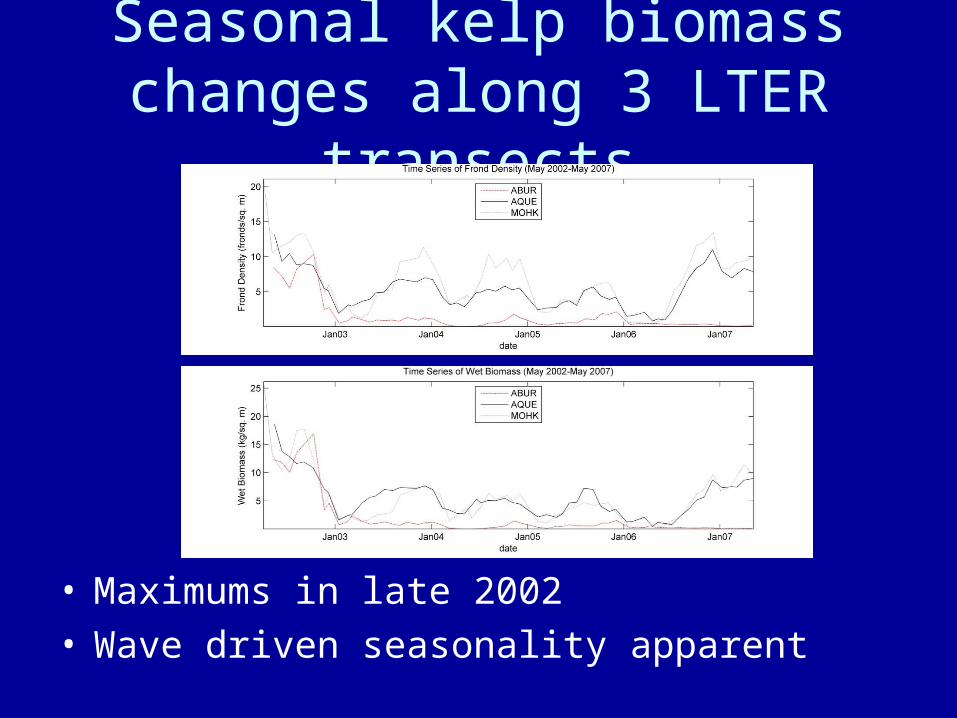
Seasonal kelp biomass changes along 3 LTER transects
• Maximums in late 2002• Wave driven seasonality apparent
Role of Biomass in NPP
• Reed et al (in press): initial biomass explains 63% of inter-annual variation in net primary production (NPP)
• Surprisingly, growth rate was insignificant in explaining variation in NPP
• Remote measures of biomass would be valuable for making regional estimates of NPP
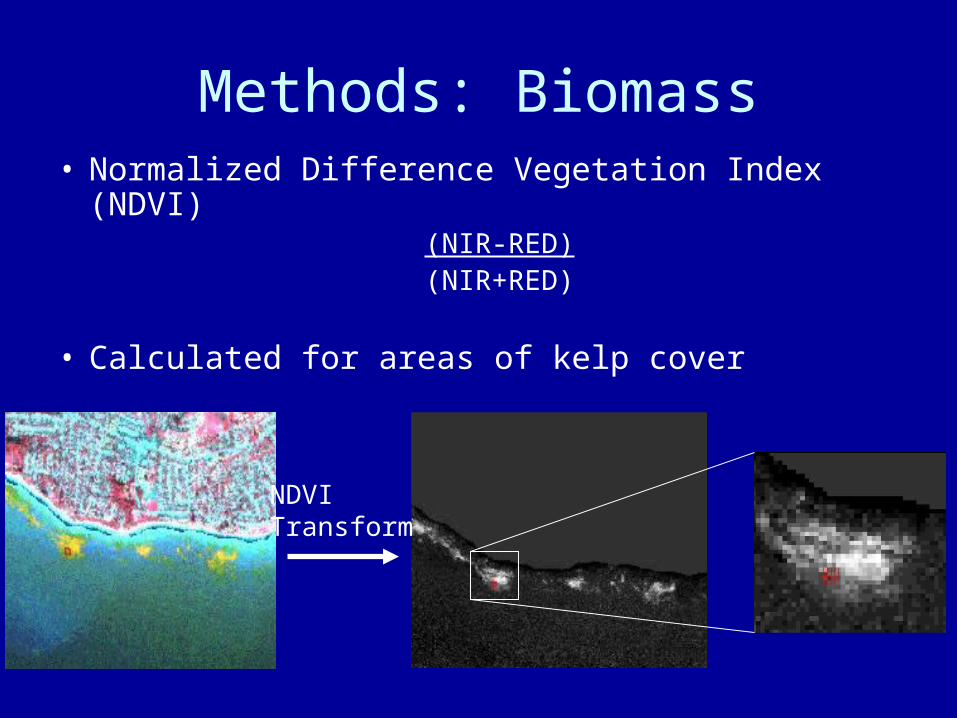
Methods: Biomass• Normalized Difference Vegetation Index (NDVI)
(NIR-RED)(NIR+RED)
• Calculated for areas of kelp cover
NDVITransform
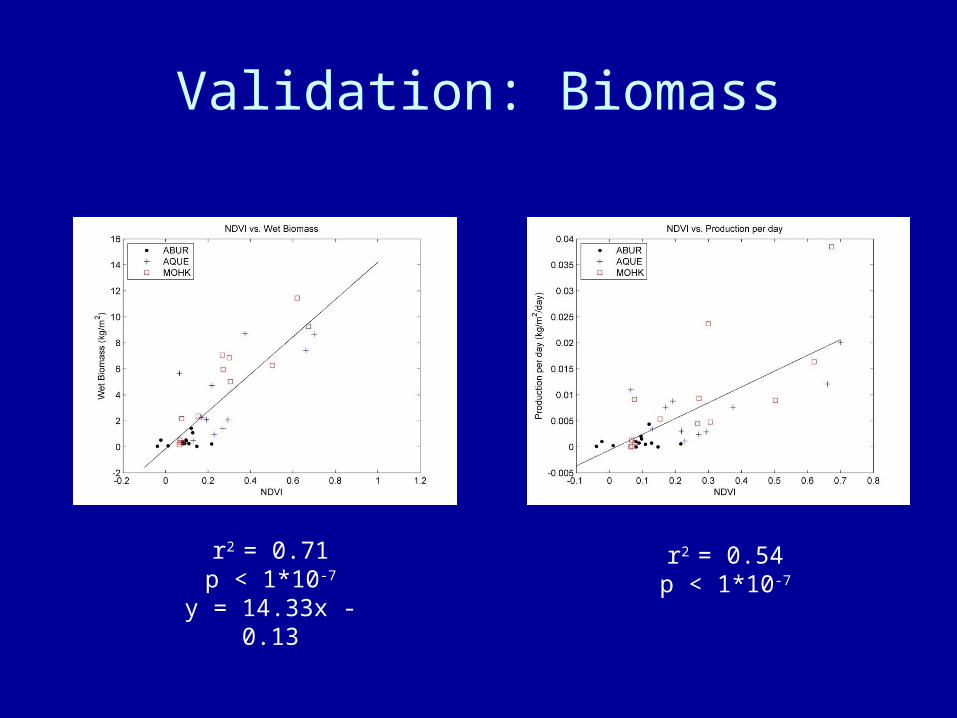
Validation: Biomass
r2 = 0.71p < 1*10-7
y = 14.33x - 0.13
r2 = 0.54p < 1*10-7
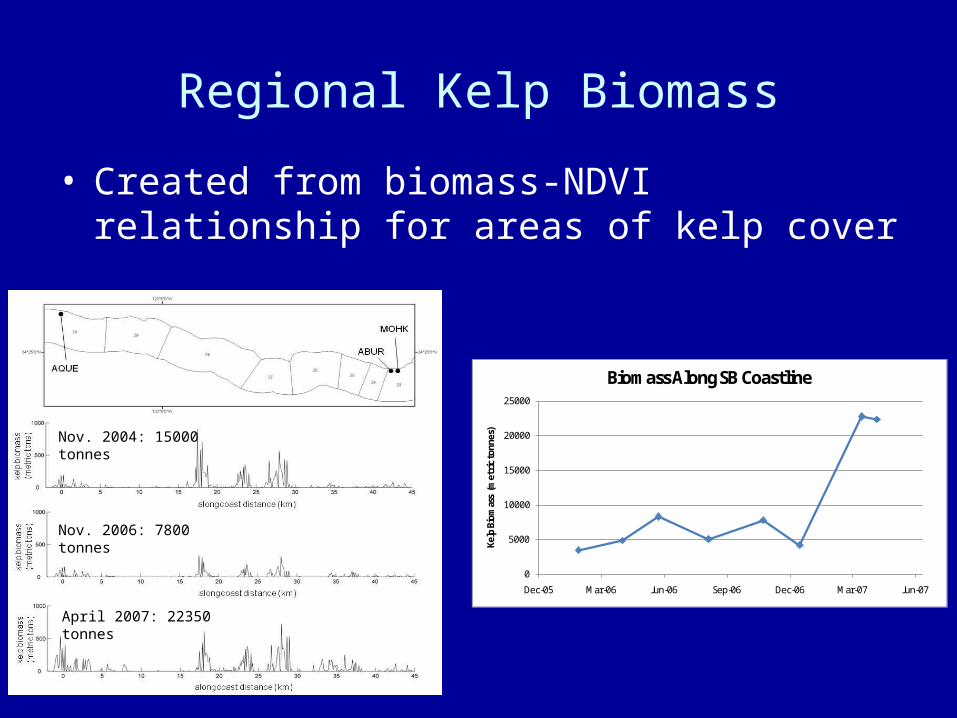
Regional Kelp Biomass
• Created from biomass-NDVI relationship for areas of kelp cover
Nov. 2004: 15000 tonnes
Nov. 2006: 7800 tonnes
April 2007: 22350 tonnes
0
5000
10000
15000
20000
25000
Dec-05 Mar-06 Jun-06 Sep-06 Dec-06 Mar-07 Jun-07
Kelp
Bio
mas
s (m
etri
c to
nnes
)
Biomass Along SB Coastline
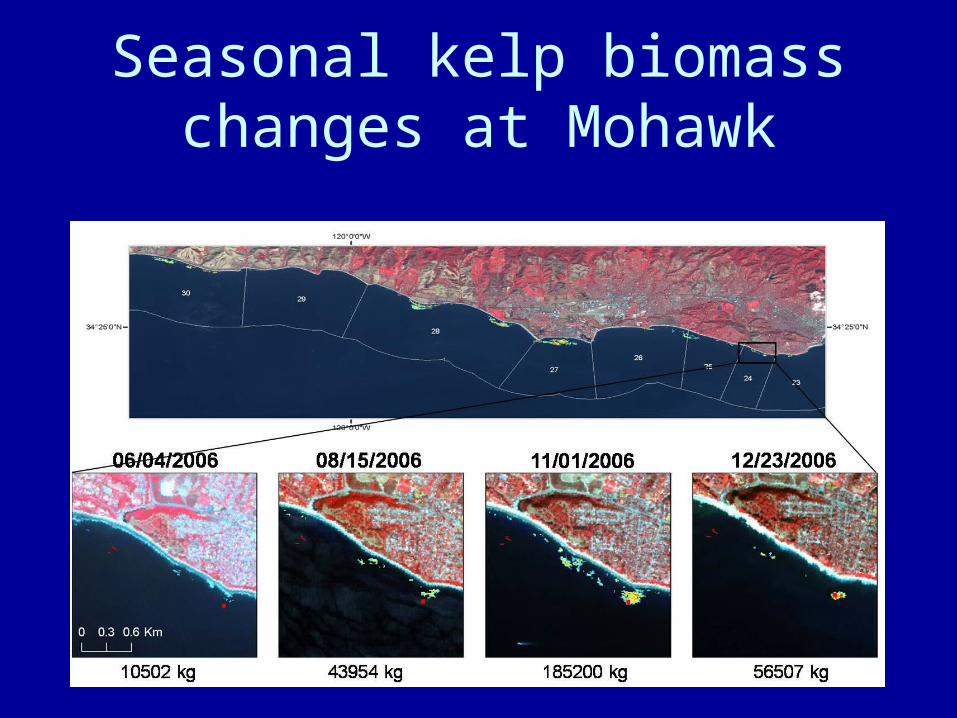
Seasonal kelp biomass changes at Mohawk
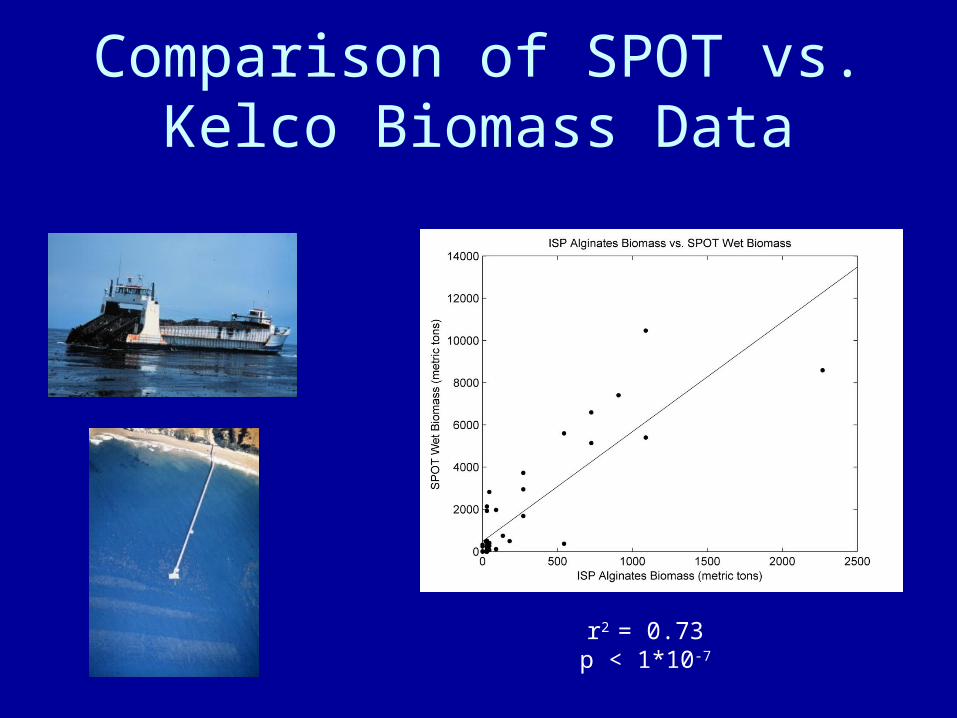
Comparison of SPOT vs. Kelco Biomass Data
r2 = 0.73p < 1*10-7
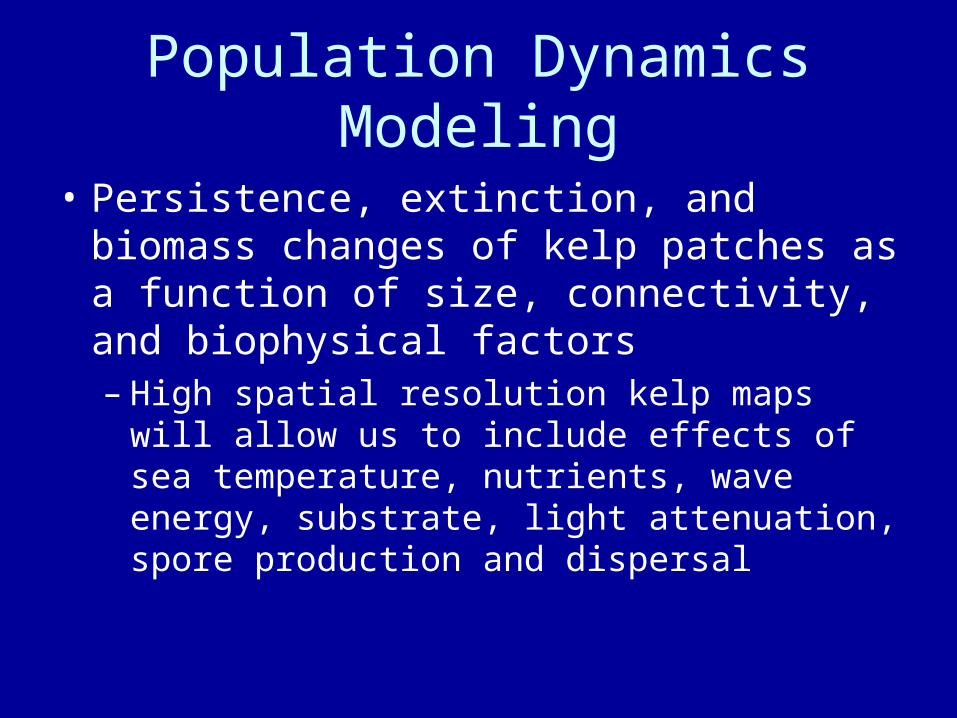
Population Dynamics Modeling
• Persistence, extinction, and biomass changes of kelp patches as a function of size, connectivity, and biophysical factors– High spatial resolution kelp maps will allow us
to include effects of sea temperature, nutrients, wave energy, substrate, light attenuation, spore production and dispersal
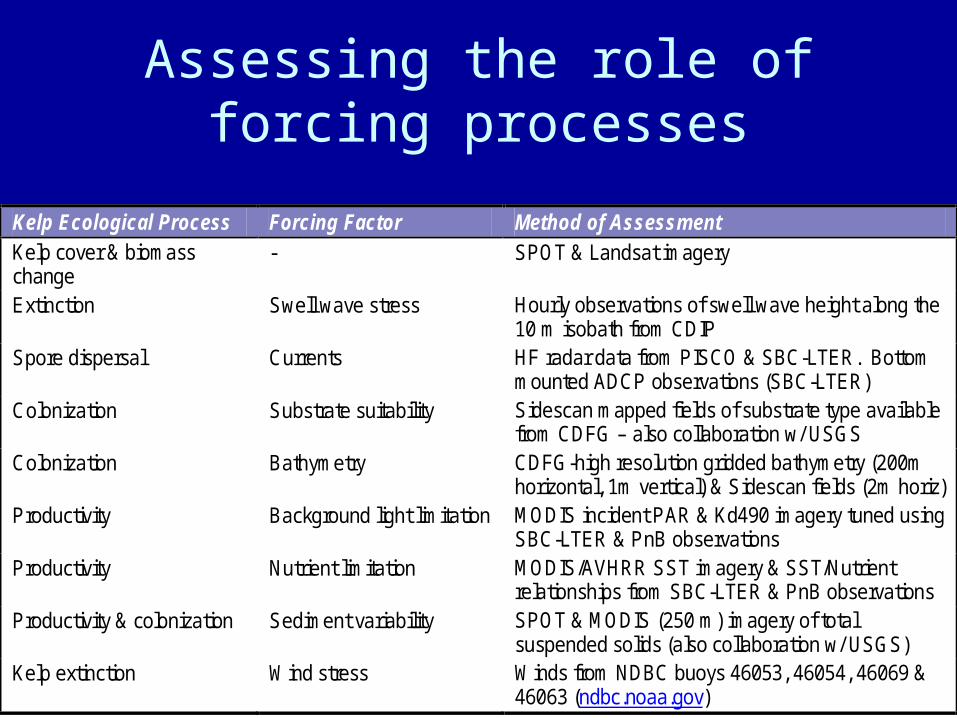
Assessing the role of forcing processes
Kelp Ecological Process Forcing Factor Method of Assessment Kelp cover & biomass change
- SPOT & Landsat imagery
Extinction Swell wave stress Hourly observations of swell wave height along the 10 m isobath from CDIP
Spore dispersal Currents HF radar data from PISCO & SBC-LTER. Bottom mounted ADCP observations (SBC-LTER)
Colonization Substrate suitability Sidescan mapped fields of substrate type available from CDFG – also collaboration w/ USGS
Colonization Bathymetry CDFG-high resolution gridded bathymetry (200m horizontal, 1m vertical) & Sidescan fields (2m horiz)
Productivity Background light limitation MODIS incident PAR & Kd490 imagery tuned using SBC-LTER & PnB observations
Productivity Nutrient limitation MODIS/AVHRR SST imagery & SST/Nutrient relationships from SBC-LTER & PnB observations
Productivity & colonization Sediment variability SPOT & MODIS (250 m) imagery of total suspended solids (also collaboration w/ USGS)
Kelp extinction Wind stress Winds from NDBC buoys 46053, 46054, 46069 & 46063 (ndbc.noaa.gov)