Embed Size (px)
Citation preview

1
GGDC 10-Sector Database: Contents, Sources and Methods
This version: January 2015
Prepared by
Gaaitzen de Vries, Klaas de Vries, Reitze Gouma, Stefan Pahl, and Marcel Timmer
Groningen Growth and Development Centre,
Faculty of Economics and Business,
University of Groningen
The Netherlands
Contact e-mail address: [email protected]

2
1. Introduction
Comparative studies of growth have been hampered by the lack of a large-scale international
database on output and productivity trends by sector in developing countries. We present the
updated and extended GGDC 10 Sector database which is the first database to provide long-term
series on sectoral developments. The database is constructed on the basis of an in-depth study of
available statistical sources on a country-by-country basis. This background document discusses
the contents of the database, the selection procedure of the sources used, the main datasources and
linking procedures, as well as the methods employed to ensure intertemporal, international and
internal consistency. Compliance with consistency requirements is important to ensure the
usefulness of the database in long-term analyses of growth and productivity.
1.1 Contents of the data set
Below, Table 1 gives an overview of the contents of the GGDC 10 Sector database. The data set
currently includes eleven Asian, nine Latin American, two countries from the Middle East and North
Africa, and eleven African countries. We have also incorporated time series data for the USA and a
set of European countries. The dataset includes annual data on gross value added at current, and
constant prices from 1950 onwards. In addition, annual data on persons employed is available,
which allows the derivation of labour productivity (value added per worker) trends. The database
covers the ten main sectors of the economy as defined in the International Standard Industrial
Classification, Revision 3.1 (ISIC rev. 3.1). These ten sectors cover the total economy.

3
Table 1. Overview of the GGDC 10 Sector Database
Economic activities
distinguished
(ISIC rev. 3.1 code):
1. Agriculture, hunting, forestry and fishing (AtB);
2. Mining and quarrying (C);
3. Manufacturing (D);
4. Electricity, gas and water supply (E);
5. Construction (F);
6. Wholesale and retail trade, hotels and restaurants (GtH);
7. Transport, storage, and communication (I);
8. Finance, insurance, real estate and business services (JtK);
9. Government services (LtN);
10. Community, social and personal services (OtP)
Variables included: Persons engaged;
Gross value added at current national prices;
Gross value added at constant 2005 national prices;
Countries included: Sub-Saharan Africa:
Botswana, Ethiopia, Ghana, Kenya, Malawi, Mauritius,
Nigeria, Senegal, South Africa, Tanzania, and Zambia
Middle East and North Africa:
Egypt, Morocco
Asia:
China, Hong Kong (China), India, Indonesia, Japan, Korea
(Rep. of), Malaysia, Philippines, Singapore, Taiwan, Thailand
Latin America:
Argentina, Bolivia, Brazil, Chile, Colombia, Costa Rica, Mexico,
Peru, Venezuela
North America:
United States of America
Europe:
West Germany, Denmark, Spain, France, United Kingdom,
Italy, the Netherlands, and Sweden
Time period: 1950 – 2013
Notes: starting date of time series varies across variables and countries depending on data
availability.
4
1.2 Construction of variables
Gross value added in current and constant prices is taken from the National Accounts of the various
countries. As these have all been compiled according to the UN System of National Accounts,
international comparability is high, in principle. However, national statistical institutes frequently
change their methodologies. Within the National Accounts, GDP series are periodically revised
which includes changes in the coverage of activities (for example after a full economic census has
been carried out and “new” activities have been discovered), changes in the methods of calculation
(for example the inclusion of software expenditures as investment rather than intermediate
consumption), and changes in base year of the prices used for calculating volume growth rates.1 For
sectoral GDP our general approach is to start with GDP levels for the most recent available
benchmark year, expressed in that year’s prices, from the National Accounts provided by the
National Statistical Institute or Central Bank. Historical national accounts series were subsequently
linked to this benchmark year.2 This linking procedure ensures that growth rates of individual
series are retained although absolute levels are adjusted according to the most recent information
and methods.
Employment in our data set is defined as ‘all persons employed’, thus including all paid employees,
but also self-employed and family workers. Labour input is normally not available from a country’s
national accounts as they are not part of the System of National Accounts. Two different primary
sources of employment data exist, namely labour force surveys (LFS) with data collected at the
household level, and business surveys which are based on firm-level questionnaires. Both have
their advantages and disadvantages as a source for annual sectoral employment trends.
The LFS are a comprehensive and well-established source with substantive international
harmonization of concepts because they use definitions set out by the International Labour
Organization (ILO), although sampling size and techniques may still differ substantially between
countries. The LFS cover employees as well as self-employed and family-labour. The main problem
with LFS is the limited consistency with output data from the national accounts, especially at the
1 In most developing countries a fixed-base Laspeyres volume index is used and this base is usually updated
every 5 or 10 years.
2 Because of the application of fixed-base Laspeyres volume indexes by most statistical offices, linked sectoral
GDP does not add up to total GDP for earlier periods. We aggregate sectoral GDP data.

5
sectoral level due the relatively small sample size. In addition, the sample is sometimes restricted to
particular regional areas, such as urban areas.
Information from business surveys is often more consistent with value added measures in the
national accounts, because output series for the national accounts are also based on this source.
However, while the coverage by business surveys is reasonably accurate for goods producing
industries, this is not always the case for services. Moreover business surveys typically only cover
firms who surpass a certain threshold (for example, >20 employees or above a certain turnover
level). This excludes smaller firms, which are especially abundant in developing countries. Another
limitation is that data on self-employed and unpaid family members are usually not collected. This
is problematic for sectors like agriculture and informal parts of the economy, where these
categories make up a significant share of total employment. Business surveys are therefore not well
suited to provide employment statistics by sectors that cover the total economy.
Therefore we often use an alternative source based on household questionnaires but with a much
larger coverage than the samples of the LFS: the population census. This ensures full coverage of
the working population and a much more reliable sectoral breakdown than from the LFS.3
However, typically population censuses are quinquennial or decennial and cannot be used to derive
annual trends. Therefore we use the population census to indicate absolute levels of employment,
and use LFS and business surveys to indicate trends in between. This is the general strategy
followed for most countries, but not for all.4
1.3 Consistency
In constructing the database, we paid careful attention to three checks on consistency, namely
intertemporal consistency, international consistency, and internal consistency. Our time series of
gross value added and employment are consistent over time (that is, intertemporal consistency).
Through the linking procedure described above, major breaks in the series have been repaired.
International consistency of the cross-country sectoral data is ensured through the system of
national accounts for value added, the employment concept of persons engaged and the use of a
3 Official population censuses data for 1950, 1960 and 1970 appear to be unreliable in Latin America. In order
to remedy this problem we used the harmonized population census results published by PREALC (1982). This
study makes adjustments in order for the population censuses to be reliable and comparable within and
between countries (for example correcting for age limitations, reference periods, ISIC revisions, workers
entering the labour market, unspecified workers and on the underestimation of agricultural workers).
4 The sources and methods document available at http://www.ggdc.net/dseries/10-sector.html provides a
detailed discussion of the construction of the employment and value added series on a country-by-country
basis.

6
harmonized sectoral classification. We classify activities into ten sectors, using the International
Standard Industrial Classification (ISIC), Revision 3.1. The industrial classification used in the
national primary data sources is based on this classification or is directly related to it.
Finally, for the derivation of meaningful productivity measures, the labour input and output
measures should cover the same activities (i.e. being internally consistent). As we use persons
employed as our employment concept rather than employees, and base our employment numbers
on large-scale surveys, overlap in coverage of the employment statistics and value added from the
National Accounts is maximized. However, a notable exception is the own-account production of
housing services by owner-occupiers. For this an imputation of rent is made and added to GDP in
many countries, according to the System of National Accounts. This imputed production does not
have an employment equivalent and should preferably not be included in output for the purposes of
labour productivity comparisons.5 Therefore, the GGDC Sector database excludes imputed rents.
1.4 Reliability
A note of caution on the data is warranted. Recently, scholars have pointed out anew that the
statistical foundations underlying GDP and employment estimates in many developing countries,
notably but not exclusively Africa and China, are subject to substantial measurement error
(Devarajan, 2013; Jerven, 2013). The low quality of statistics is related to a weak capacity to collect,
manage, and disseminate data; inadequate funding of statistical offices; diffuse responsibilities on
who is collecting what; and fragmentation in surveys and gathering exercises. Young (2012) argues
that many African countries do not have a well-established statistical system, not even reporting
national accounts data on a consistent basis. He therefore explores alternative sources of
information on national income using demographic and health survey data. Likewise, GDP and
employment estimates in large developing countries such as India and China might have substantial
measurement errors (de Vries et al. 2012). However, most countries included in the Sector
database do have a considerable history of collecting national accounts data and in conducting
labour and household surveys.
5 Typically, imputed rents are included in the output of the financial and business services sector and
frequently increase output in this sector by 50 per cent or more without any labour input equivalent. Worse,
this percentage varies over time and across countries.

7
Country by country description of the sources and methods

8
AFRICA

9
Botswana
Synopsis of the main points
• Use of SNA93 for recent years in official statistics.
• Gaps in the GDP data for the first decade after 1966. We use linear interpolation.
• Continuous official GDP data in current and constant prices is available for the period from
1974-1988 and 1989-2010. For the period 1988-1989 we use sectoral trends from UN
estimates.
• Consistency problems in vintages of LFS and census rounds for agricultural employment.
We use FAO data.
Introduction
Background to the National Accounts statistics of Botswana
The first national accounts estimates for Botswana were prepared around independence in 1966.
There are several gaps in the series for the first decade after independence.6 However, from 1974
onwards the NSI estimated GDP annually, with the exception of 1988/1989 for which no
overlapping year exists between NA series. Recently, GDP has been revised, taking 2006 as the new
base year. The rebasing caused total GDP to decline by roughly 10 per cent in 2006. The economic
structure has also been affected; in particular the share of the mining sector in total economy value
added dropped from 43 to 32 per cent (NSI 2012).
Estimating subsistence agriculture in employment
For the compilation of historical sectoral employment statistics for Botswana, the main challenge
has been to obtain reliable employment statistics for agriculture that include subsistence farming.
The primary sources used are the population censuses and the last Labour Force Survey (LFS), held
in 2005/2006. The 1964 and 1971 census figures for agricultural employment are not comparable
with the 1981, 1991 and 2001 census data, because the timing and reference period of the last
three do not take seasonal workers into account. There are also consistency problems for the last
two LFS, conducted in 1995/1996 and 2005/2006. The first survey was held during off-peak
season, while the second was held during peak season.
Sectoral Value Added
This section describes the methods used to obtain continuous series of nominal sectoral value
added (VA) and the corresponding price developments in the sector. Volumes of VA in the ASD are
implicitly derived from these series by deflating the nominal data with the price deflator,
expressing the volumes in 2005 base year prices. Different sectoral data sources have been used for
different periods, according to the availability and quality of the data.
0 shows the sectoral data sources that are used for each time period. We start in the most recent
years for which the level data is used as the benchmark source for nominal VA. For earlier periods
growth rates from the sectoral data sources are used to link the series to the benchmark level data.
6 See Jerven (2010) for a discussion on Botswanan GDP data.

10
Data on sectoral price developments is taken from the same source as the nominal data, unless
otherwise indicated. In cases where data for detailed sectors is missing, growth rates of aggregate
sectors are applied, as indicated in the table.

11
Sectoral VA data sources
Period Sectoral data source Notes
1994-
2010
Quarterly GDP bulletin (NSI, 2012) Level data used for nominal VA.
1989-
1994
UN Official Country Data (UN OCD) Trend used.
1988-
1989
UN Official Estimates (UN E) Trend used. GDP by 7 sectors: Agriculture (AtB),
Manufacturing (D), Mining/Utilities (C+E),
Construction (F), Trade services (G+H), Other
Services (J-P).
1974-
1988
UN OCD Trend used.
1971-
1974
UN E Trend used. GDP by 7 sectors: Agriculture (AtB),
Manufacturing (D), Mining/Utilities (C+E),
Construction (F), Trade services (G+H), Other
Services (J-P).
1965-
1971
African Statistical Yearbook 1974
(ASYB)
Trend used. No data for Mining (C); Manufacturing
(D) growth rate is applied. No split of Services (J-P).
No information on prices available prior to 1967. No
data available for 1969 and 1970. Data for this
period has been linearly interpolated.
1964-
1965
UN National Accounts Yearbook 1970
(UN YB)
Trend used. No information on prices available.
Construction notes on Value Added Series
- The NSI benchmark series do not use the ISIC Rev. 3.1 sector codes. Data for the sector
‘General government services’ is mapped to the Government services sector (L,M,N); data
for the sector ‘Social and personal services’ is mapped to the social and Personal services
sector (O,P). The descriptions for the other sectors perfectly match the ISIC descriptions.
- Values for Dwellings (70) are missing for the entire period. In the ASD values for Dwellings
(70) are estimated using the yearly share of dwellings in Financial services (J+K) from
Mauritius. Data from Mauritius is used because it has a similar country size and economic
structure compared to Botswana. Furthermore, the Mauritian level of statistical capacity is
relatively developed as compared to other African countries.
- The source data for Trade services (G+H) for the years 1993 and 1994, taken from the UN
OCD, shows an implausible increase of 100%. This jump has been smoothed by applying the
1994/1995 growth rate.

12
- GDP deflator growth rates for Trade Services (G+H) for the years 1980/81 and 1987/88
show implausible figures of +104% and -75%. We replaced these deflator growth rates by
the aggregate growth rates.
- Overlapping data for the two UN OCD data series for 1974-1988 and 1989-1994 is missing.
Therefore sectoral data for 1988-1989 from the UN OE series is used to bridge the gap and
link the series.
- For the period 1968-1973 continuous national accounts data is lacking from official sources.
o For the period 1971-1973 we fill the gap by using UN E data.
o For the period 1965-1971, data from the ASYB (1974) is used. There is a gap
between 1968 and 1971, which is filled by linear interpolation. See Equation (6),
then θt denotes the VA data at time t.
- The UN YB of 1970 provides continuous sectoral GDP estimates for 1964-1966 and is linked
using growth rates to estimate 1964 figures. Price information is not available from this
source.
Employment
This section provides detailed information on the sources used to estimate the employment time
series. 0 shows an overview of the years for which census data (PC), Labour Force Surveys (LFS) or
additional surveys are used as the benchmark level data. Interpolation methods between the
benchmark years are discussed in the construction notes.
Employment sources
Year Primary sources Source publication
2006 Sectoral employment levels from the 2005/2006 LFS ILO Laborsta
2001 Sectoral employment levels from the 2001 PC ILO Laborsta
1991 Sectoral employment levels from the 1991 PC NSI (1995)
1981 Sectoral employment levels from the 1981 PC NSI (1987)
1971 Sectoral employment levels from the 1971 PC NSI (1972)
1964 Sectoral employment levels from the 1964 PC ILO YB (1966)
1996 and
2006
Total number of agricultural workers from McCaig et al. (2011) based
on the LFS 1995/96 and 2005/06
1964-
2010
Trend data used from FAO Economically active population in
Agriculture series
FAO
1971-
2006
Sectoral trend from the Survey of Employment and Employees (ES) ILO Laborsta
13
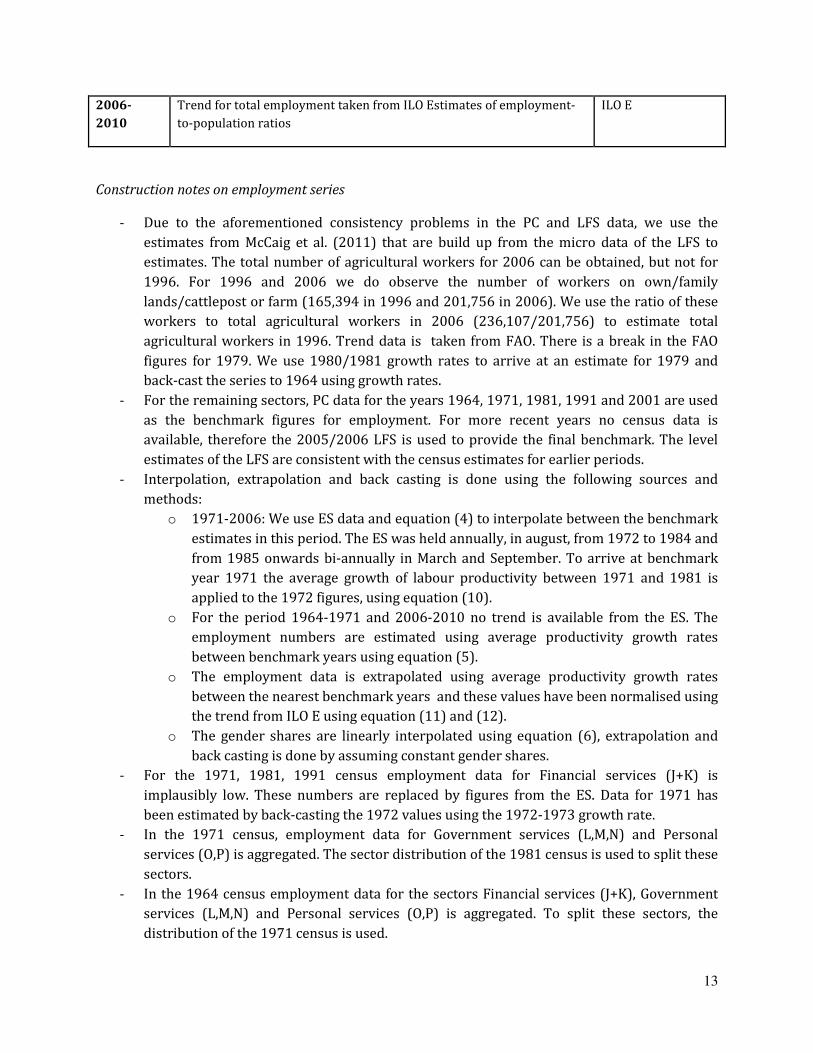
2006-
2010
Trend for total employment taken from ILO Estimates of employment-
to-population ratios
ILO E
Construction notes on employment series
- Due to the aforementioned consistency problems in the PC and LFS data, we use the
estimates from McCaig et al. (2011) that are build up from the micro data of the LFS to
estimates. The total number of agricultural workers for 2006 can be obtained, but not for
1996. For 1996 and 2006 we do observe the number of workers on own/family
lands/cattlepost or farm (165,394 in 1996 and 201,756 in 2006). We use the ratio of these
workers to total agricultural workers in 2006 (236,107/201,756) to estimate total
agricultural workers in 1996. Trend data is taken from FAO. There is a break in the FAO
figures for 1979. We use 1980/1981 growth rates to arrive at an estimate for 1979 and
back-cast the series to 1964 using growth rates.
- For the remaining sectors, PC data for the years 1964, 1971, 1981, 1991 and 2001 are used
as the benchmark figures for employment. For more recent years no census data is
available, therefore the 2005/2006 LFS is used to provide the final benchmark. The level
estimates of the LFS are consistent with the census estimates for earlier periods.
- Interpolation, extrapolation and back casting is done using the following sources and
methods:
o 1971-2006: We use ES data and equation (4) to interpolate between the benchmark
estimates in this period. The ES was held annually, in august, from 1972 to 1984 and
from 1985 onwards bi-annually in March and September. To arrive at benchmark
year 1971 the average growth of labour productivity between 1971 and 1981 is
applied to the 1972 figures, using equation (10).
o For the period 1964-1971 and 2006-2010 no trend is available from the ES. The
employment numbers are estimated using average productivity growth rates
between benchmark years using equation (5).
o The employment data is extrapolated using average productivity growth rates
between the nearest benchmark years and these values have been normalised using
the trend from ILO E using equation (11) and (12).
o The gender shares are linearly interpolated using equation (6), extrapolation and
back casting is done by assuming constant gender shares.
- For the 1971, 1981, 1991 census employment data for Financial services (J+K) is
implausibly low. These numbers are replaced by figures from the ES. Data for 1971 has
been estimated by back-casting the 1972 values using the 1972-1973 growth rate.
- In the 1971 census, employment data for Government services (L,M,N) and Personal
services (O,P) is aggregated. The sector distribution of the 1981 census is used to split these
sectors.
- In the 1964 census employment data for the sectors Financial services (J+K), Government
services (L,M,N) and Personal services (O,P) is aggregated. To split these sectors, the
distribution of the 1971 census is used.

14
- The 1964 and 1971 PC include persons aged 10 years and above as employed, whereas the
other censuses and survey’s only consider persons aged 12 years and above. These tables
do not provide sufficient detail to correct the age level to include employment of 15 years
and older.
15
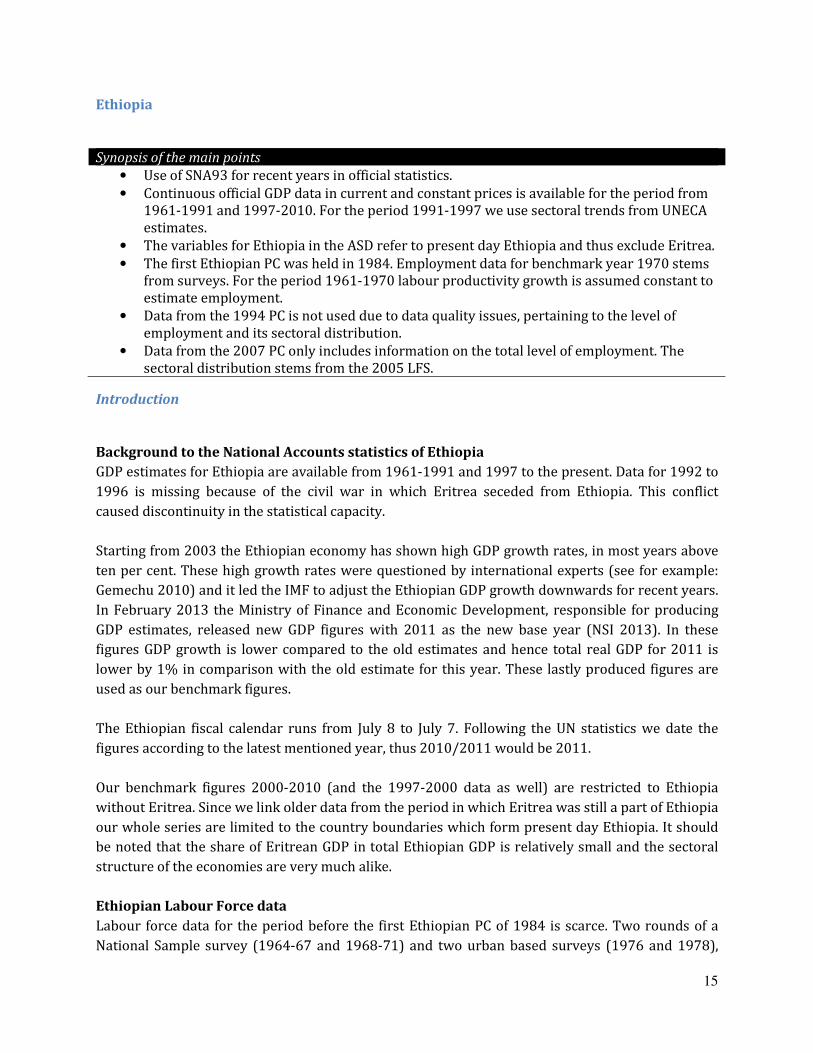
Ethiopia
Synopsis of the main points
• Use of SNA93 for recent years in official statistics.
• Continuous official GDP data in current and constant prices is available for the period from
1961-1991 and 1997-2010. For the period 1991-1997 we use sectoral trends from UNECA
estimates.
• The variables for Ethiopia in the ASD refer to present day Ethiopia and thus exclude Eritrea.
• The first Ethiopian PC was held in 1984. Employment data for benchmark year 1970 stems
from surveys. For the period 1961-1970 labour productivity growth is assumed constant to
estimate employment.
• Data from the 1994 PC is not used due to data quality issues, pertaining to the level of
employment and its sectoral distribution.
• Data from the 2007 PC only includes information on the total level of employment. The
sectoral distribution stems from the 2005 LFS.
Introduction
Background to the National Accounts statistics of Ethiopia
GDP estimates for Ethiopia are available from 1961-1991 and 1997 to the present. Data for 1992 to
1996 is missing because of the civil war in which Eritrea seceded from Ethiopia. This conflict
caused discontinuity in the statistical capacity.
Starting from 2003 the Ethiopian economy has shown high GDP growth rates, in most years above
ten per cent. These high growth rates were questioned by international experts (see for example:
Gemechu 2010) and it led the IMF to adjust the Ethiopian GDP growth downwards for recent years.
In February 2013 the Ministry of Finance and Economic Development, responsible for producing
GDP estimates, released new GDP figures with 2011 as the new base year (NSI 2013). In these
figures GDP growth is lower compared to the old estimates and hence total real GDP for 2011 is
lower by 1% in comparison with the old estimate for this year. These lastly produced figures are
used as our benchmark figures.
The Ethiopian fiscal calendar runs from July 8 to July 7. Following the UN statistics we date the
figures according to the latest mentioned year, thus 2010/2011 would be 2011.
Our benchmark figures 2000-2010 (and the 1997-2000 data as well) are restricted to Ethiopia
without Eritrea. Since we link older data from the period in which Eritrea was still a part of Ethiopia
our whole series are limited to the country boundaries which form present day Ethiopia. It should
be noted that the share of Eritrean GDP in total Ethiopian GDP is relatively small and the sectoral
structure of the economies are very much alike.
Ethiopian Labour Force data
Labour force data for the period before the first Ethiopian PC of 1984 is scarce. Two rounds of a
National Sample survey (1964-67 and 1968-71) and two urban based surveys (1976 and 1978),

16
which pertain to questions on the situation of the employed, were conducted. Abegaz (1983, p.49)
deems the second survey to be a reliable estimate of the situation of the urban employed. The first
LFS was conducted in 1981/82, but is restricted to rural Ethiopia. The first Ethiopian population
census was held in 1984, but covered an estimated 80% of the total population (NSI, 1991, pp. 2-3).
The employment figures presented in the report are not upwardly adjusted. This adjustment was
done by the ILO, presented in the ILO Yearbook of Labour Statistics (1991). Employment figures
from the 1994 PC are not used because of reliability issues. The figures for total employment and
sectoral shares from this PC are not reconcilable with the other sources on employment data.
Sectoral Value Added
This section describes the methods used to obtain continuous series of nominal sectoral value
added (VA) and the corresponding price developments in the sector. Volumes of VA in the ASD are
implicitly derived from these series by deflating the nominal data with the price deflator,
expressing the volumes in 2005 base year prices. Different sectoral data sources have been used for
different periods, according to the availability and quality of the data.
0 shows the sectoral data sources that are used for each time period. We start in the most recent
years for which the level data is used as the benchmark source for nominal VA. For earlier periods
growth rates from the sectoral data sources are used to link the series to the benchmark level data.
Data on sectoral price developments is taken from the same source as the nominal data, unless
otherwise indicated. In cases where data for detailed sectors is missing, growth rates of aggregate
sectors are applied, as indicated in the table.
Sectoral VA data sources
Period Sectoral data source Notes
2000-
2010
Ministry of Finance and Economic Development (NSI, 2013) Level data used.
1997-
2000
UN Official Country Data (UN OCD) Trend used.
1991-
1997
African Statistical Yearbook 2000 (ASYB) Trend used. ‘UNECA estimates’,
no official data is available for
this period.
1970-
1991
UN OCD Trend used.
1967-
1970
UN National Accounts Yearbook 1975 (UN YB) Trend used.
1961-
1967
UN YB 1970 Trend used.
17
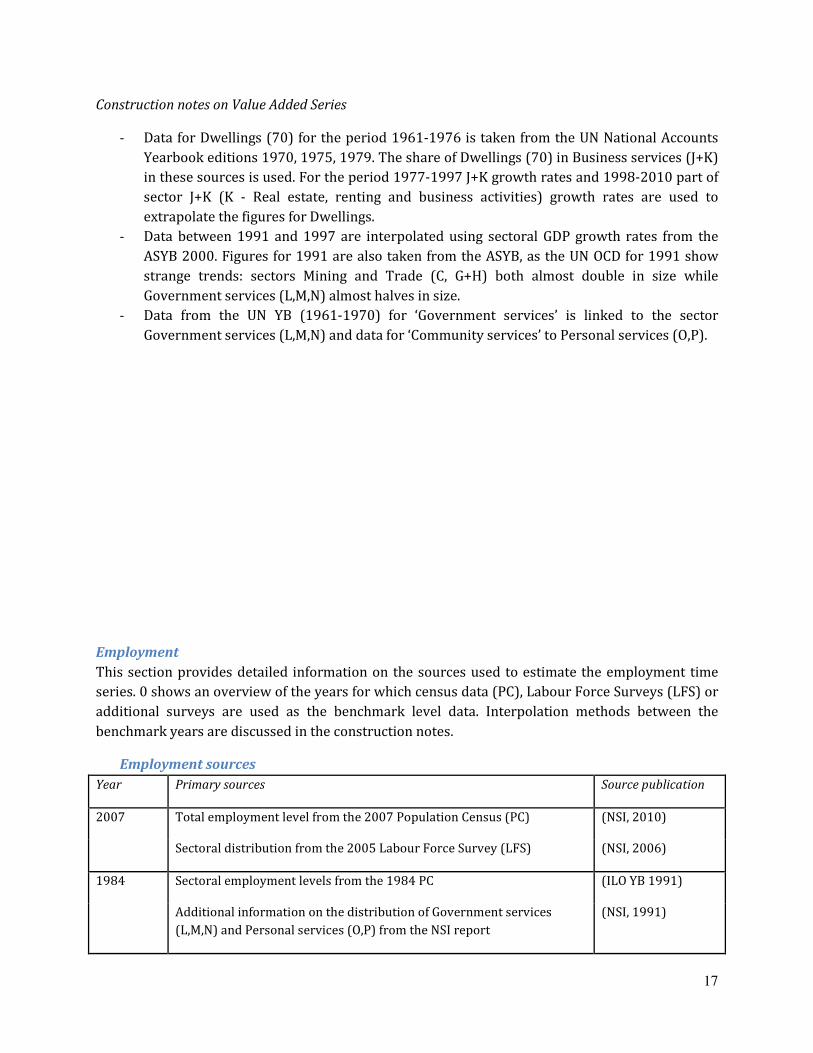
Construction notes on Value Added Series
- Data for Dwellings (70) for the period 1961-1976 is taken from the UN National Accounts
Yearbook editions 1970, 1975, 1979. The share of Dwellings (70) in Business services (J+K)
in these sources is used. For the period 1977-1997 J+K growth rates and 1998-2010 part of
sector J+K (K - Real estate, renting and business activities) growth rates are used to
extrapolate the figures for Dwellings.
- Data between 1991 and 1997 are interpolated using sectoral GDP growth rates from the
ASYB 2000. Figures for 1991 are also taken from the ASYB, as the UN OCD for 1991 show
strange trends: sectors Mining and Trade (C, G+H) both almost double in size while
Government services (L,M,N) almost halves in size.
- Data from the UN YB (1961-1970) for ‘Government services’ is linked to the sector
Government services (L,M,N) and data for ‘Community services’ to Personal services (O,P).
Employment
This section provides detailed information on the sources used to estimate the employment time
series. 0 shows an overview of the years for which census data (PC), Labour Force Surveys (LFS) or
additional surveys are used as the benchmark level data. Interpolation methods between the
benchmark years are discussed in the construction notes.
Employment sources
Year Primary sources Source publication
2007 Total employment level from the 2007 Population Census (PC) (NSI, 2010)
Sectoral distribution from the 2005 Labour Force Survey (LFS) (NSI, 2006)
1984 Sectoral employment levels from the 1984 PC (ILO YB 1991)
Additional information on the distribution of Government services
(L,M,N) and Personal services (O,P) from the NSI report
(NSI, 1991)

18
1970 Total, rural and urban employment totals from Abegaz (1985) (Abegaz, 1985)
Sectoral distribution for the urban employed from the Survey of 17
medium-size towns (1978)
(Abegaz, 1983)
Sectoral distribution for the rural employed from the Rural LFS 1981/82 (NSI, 1985)
1961-2010 Trend used from FAO Economically active population in Agriculture
series
FAO
2007-2010 Trend for total employment taken from ILO Estimates of employment-
to-population ratios
ILO E
Construction notes on employment series
- The 2007 PC did not include questions pertaining to the sectoral distribution of the
employed population. The total employment figure from this census is consistent with total
employment figures from the other two benchmark years. The sectoral distribution is
derived from the 2005 LFS.
- The 1984 PC employment data are derived from the ILO and supplemented with shares for
Government services (L,M,N) and Personal services (O,P) derived from the census report.
- For benchmark year 1970 various sources are combined.
o Total employment for 1970 is calculated from the total employment to population
ratio as reported by Abegaz (1985). Abegaz calculated this ratio by making
adjustments to the figures of the second round of the national sample survey (1968-
71). This ratio is multiplied by the total population figure for 1970 as reported by
the African Development Indicators Database (august 2011).7
o The sectoral distribution is derived from an urban and rural labour force survey.
These are the survey of 17 medium-size towns (1978) for urban sectoral
employment, derived from Abegaz (1983), and the rural labour force survey of
1981/82, derived from the NSI report, for rural sectoral employment. Because the
reports only present percentages, absolute figures for urban and rural total
employment are calculated from Abegaz (1985). Sectoral shares are multiplied by
these totals. Sectoral urban and rural employment is aggregated to form total
sectoral employment. Finally these sectoral shares are multiplied by our total
employment value for 1970.
7 We deviate from our normal approach because Maddison reports historical population figures for Ethiopia and Eritrea combined.

19
- Interpolation, extrapolation and back casting is done using the following sources and
methods:
o The employment data in between the benchmark years are estimated using average
productivity growth rates between benchmark years using equation (5).
o The employment data is back casted for the period 1961-1969 using average
productivity growth rates between the nearest benchmarks using equation (10).
Volume values for sector Mining (C) show unusual jumps and hence labour
productivity for this sector is assumed constant for 1961-1970.
o The employment data is extrapolated using average productivity growth rates
between the nearest benchmark years using equation (9) and these values have
been normalised using the trend from ILO E using equation (11) and equation (12).
o The trend from FAO data on the economically active population in agriculture is
used for interpolation (using equation (4) ), back casting (using equation (8)) and
extrapolation (using equation (7) ) of the agricultural employment figures.
o The gender shares are linearly interpolated using equation (6), extrapolation and
back casting is done by assuming constant gender shares.
- The employed population refers to persons aged 10 years and older.
20
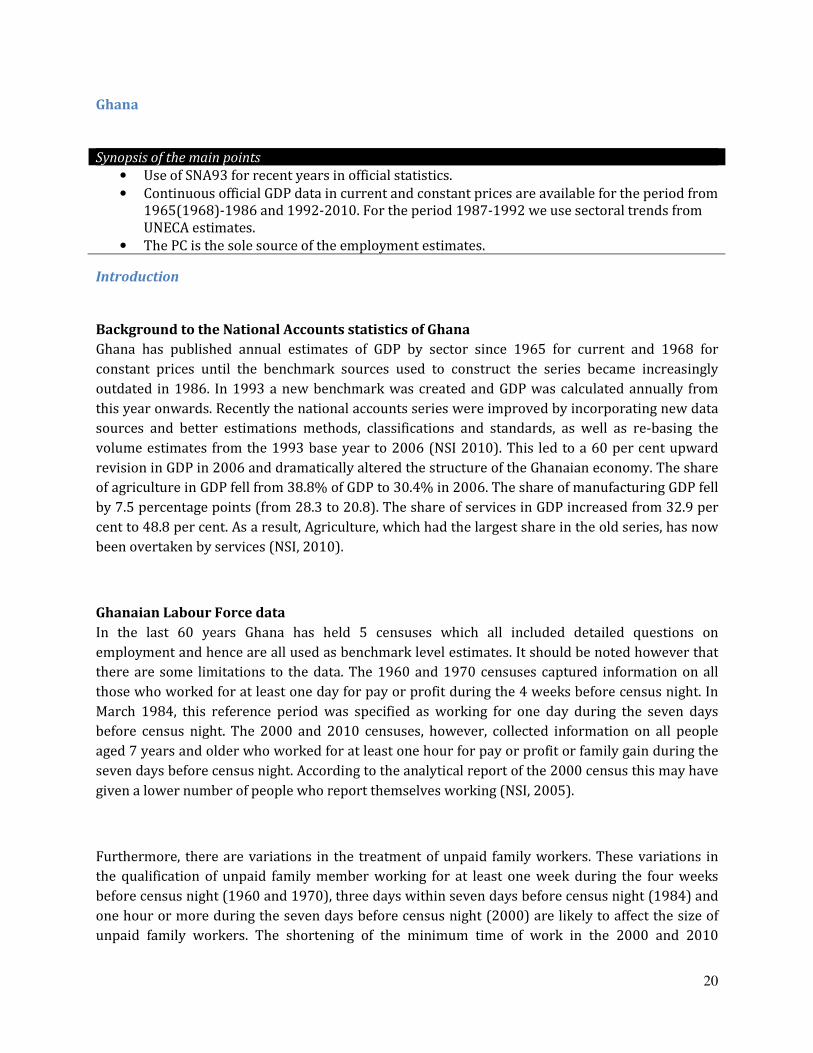
Ghana
Synopsis of the main points
• Use of SNA93 for recent years in official statistics.
• Continuous official GDP data in current and constant prices are available for the period from
1965(1968)-1986 and 1992-2010. For the period 1987-1992 we use sectoral trends from
UNECA estimates.
• The PC is the sole source of the employment estimates.
Introduction
Background to the National Accounts statistics of Ghana
Ghana has published annual estimates of GDP by sector since 1965 for current and 1968 for
constant prices until the benchmark sources used to construct the series became increasingly
outdated in 1986. In 1993 a new benchmark was created and GDP was calculated annually from
this year onwards. Recently the national accounts series were improved by incorporating new data
sources and better estimations methods, classifications and standards, as well as re-basing the
volume estimates from the 1993 base year to 2006 (NSI 2010). This led to a 60 per cent upward
revision in GDP in 2006 and dramatically altered the structure of the Ghanaian economy. The share
of agriculture in GDP fell from 38.8% of GDP to 30.4% in 2006. The share of manufacturing GDP fell
by 7.5 percentage points (from 28.3 to 20.8). The share of services in GDP increased from 32.9 per
cent to 48.8 per cent. As a result, Agriculture, which had the largest share in the old series, has now
been overtaken by services (NSI, 2010).
Ghanaian Labour Force data
In the last 60 years Ghana has held 5 censuses which all included detailed questions on
employment and hence are all used as benchmark level estimates. It should be noted however that
there are some limitations to the data. The 1960 and 1970 censuses captured information on all
those who worked for at least one day for pay or profit during the 4 weeks before census night. In
March 1984, this reference period was specified as working for one day during the seven days
before census night. The 2000 and 2010 censuses, however, collected information on all people
aged 7 years and older who worked for at least one hour for pay or profit or family gain during the
seven days before census night. According to the analytical report of the 2000 census this may have
given a lower number of people who report themselves working (NSI, 2005).
Furthermore, there are variations in the treatment of unpaid family workers. These variations in
the qualification of unpaid family member working for at least one week during the four weeks
before census night (1960 and 1970), three days within seven days before census night (1984) and
one hour or more during the seven days before census night (2000) are likely to affect the size of
unpaid family workers. The shortening of the minimum time of work in the 2000 and 2010

21
Censuses means that many people may be classified as unpaid family workers, who may not
necessarily have been so classified during the earlier census (NSI, 2005, p. 207).
Sectoral Value Added
This section describes the methods used to obtain continuous series of nominal sectoral value
added (VA) and the corresponding price developments in the sector. Volumes of VA in the ASD are
implicitly derived from these series by deflating the nominal data with the price deflator,
expressing the volumes in 2005 base year prices. Different sectoral data sources have been used for
different periods, according to the availability and quality of the data.
0 shows the sectoral data sources that are used for each time period. We start in the most recent
years for which the level data is used as the benchmark source for nominal VA. For earlier periods
growth rates from the sectoral data sources are used to link the series to the benchmark level data.
Data on sectoral price developments is taken from the same source as the nominal data, unless
otherwise indicated. In cases where data for detailed sectors is missing, growth rates of aggregate
sectors are applied, as indicated in the table.
Sectoral VA data sources
Period Sectoral data source Notes
2006-2010 UN Official Country Data (UN OCD) Level data used.
1993-2006 UN OCD Level data used.
1986-1993 African Statistical Yearbook 1996
(ASYB)
Trend used. UNECA estimates, no official data is
available for this period.
1968-1986 UN OCD Trend used.
1960-1968 Statistical Tables on the Economy of
Ghana, 1950-1985 (Ewusi, 1986).
Aggregate GDP growth rate used because no sectoral
GDP is available. Total economy GDP deflator growth
used, hence sectoral shares are constant.
Construction notes on Value Added Series
22
- Official data is lacking for the period 1986-1992, we use UNECA sectoral estimates.
- Data from the ASYB for ‘Government services’ is linked to the sector Government services
(L,M,N) and data for ‘Community services’ to Personal services (O,P).
- Values for Dwellings (70) are missing for the entire period. In the ASD values for dwellings
are estimated using the share of dwellings in Financial services (J+K) from Mauritius.
- For the period 1960-1968 aggregate GDP estimates from Ewusi (1986) are applied, because
of missing sectoral data (nominal data is missing from 1965 onwards and volume data from
1968 onwards).

23
Employment
This section provides detailed information on the sources used to estimate the employment time
series. 0 shows an overview of the years for which census data (PC, Labour Force Surveys (LFS) or
additional surveys are used as the benchmark level data. Interpolation methods between the
benchmark years are discussed in the construction notes.
Employment sources
Year Primary sources Source publication
2010 Sectoral employment levels from the 2010 PC report (NSI, 2012)
2000 Total employment levels from the 2000 PC report (NSI, 2005)
Sectoral distribution from the 2000 PC ILO figures (ILO Laborsta)
1984 Total employment levels from the 2000 PC report (NSI, 2005)
Sectoral distribution from the 1984 PC report (NSI, 1987)
1970 Total employment levels from the 2000 PC report (NSI, 2005)
Sectoral distribution from the 1970 PC ILO figures (ILO Laborsta)
1960 Sectoral employment levels from the 2000 PC report (NSI, 2005)
1960-
2010
Trend used from FAO Economically active population in Agriculture
series
FAO
Construction notes on employment series
- Total employment data pertaining to employed persons 15 years and older for the 1960,
1970, 1984 and 2000 censuses is taken from the analytical report of the 2000 census. The
1960 sectoral distribution is also taken from this report, the 1970 sectoral distribution is
taken from the ILO Laborsta database.
- In the 1960 and 1970 PC employment data for the services sectors (J-P) is grouped. To split
these sectors, we use the distribution of the 1984 PC.
- Interpolation is done using the following sources and methods:
o The employment data in between the benchmark years are estimated using average
productivity growth rates between benchmark years using equation (5).
o The gender shares are linearly interpolated using equation (6), extrapolation and
back casting is done by assuming constant gender shares.
o The trend from FAO data on the economically active population in agriculture is
used for interpolation, using equation (4), of the agricultural employment figures.

24
Kenya
Synopsis of the main points
• Use of SNA93 for recent years in official statistics.
• Continuous official GDP data in current and constant prices is available for the period from
1960(1964)-2010.
• PC data on employment is of limited use, therefore our estimates rely by and large on
surveys.
Introduction
Background to the National Accounts statistics of Kenya
The first official estimates of the domestic income and product of Kenya were prepared in 1947, but
data in constant prices is only available for the period from 1964 onwards.8 Until the 80’s the series
were rebased every five or ten years (see table 3). After the 1982 revision it took more than two
decades to incorporate new sources and methods to create a new benchmark year. In this revision,
which was undertaken in 2007 the base year was changed to 2001 using the SNA93 standards.
Kenyan Labour Force data
Kenya has a good record of census taking, but the questions on employment were rather limited
and before 1989 even non-existent. The third post-independence population census in 1989 was
the first which attempted to collect and analyse in detail information on the labour force. The
definition of the employed population in this census is rather vague. Considered as employed are all
persons who, during the reference period, worked most of the time for wages, salary, commission,
tips, contract and those paid in kind. No specific working time, for example one day or one hour
during last week, was asked. Questions on occupation, industry and status were asked but turned
out to be useless because of insufficient probing by enumerators and errors in the processing phase
leaving a ‘not stated’ category of 92,3%. The useable labour force information from this PC is that
on type of activity, which include: worked for pay or profit, on leave, worked on family holding, no
work, seeking work. In the following census, held in august 1999, questions on the labour force
were asked but again problems were encountered in processing the data which rendered all
information except the economic activity status of the population useless (NSI, 2002, p. 10). Apart
from the censuses there is a range of surveys available. Therefore our estimates on employment by
sector rely by and large on labour force and establishment surveys and to a lesser extent on
population census data.
Sectoral Value Added
This section describes the methods used to obtain continuous series of nominal sectoral value
added (VA) and the corresponding price developments in the sector. Volumes of VA in the ASD are
8 See Jerven (2011b) for a discussion of the Kenyan GDP data.
25
implicitly derived from these series by deflating the nominal data with the price deflator,
expressing the volumes in 2005 base year prices. Different sectoral data sources have been used for
different periods, according to the availability and quality of the data.
0 shows the sectoral data sources that are used for each time period. We start in the most recent
years for which the level data is used as the benchmark source for nominal VA. For earlier periods
growth rates from the sectoral data sources are used to link the series to the benchmark level data.
Data on sectoral price developments is taken from the same source as the nominal data, unless
otherwise indicated. In cases where data for detailed sectors is missing, growth rates of aggregate
sectors are applied, as indicated in the table.
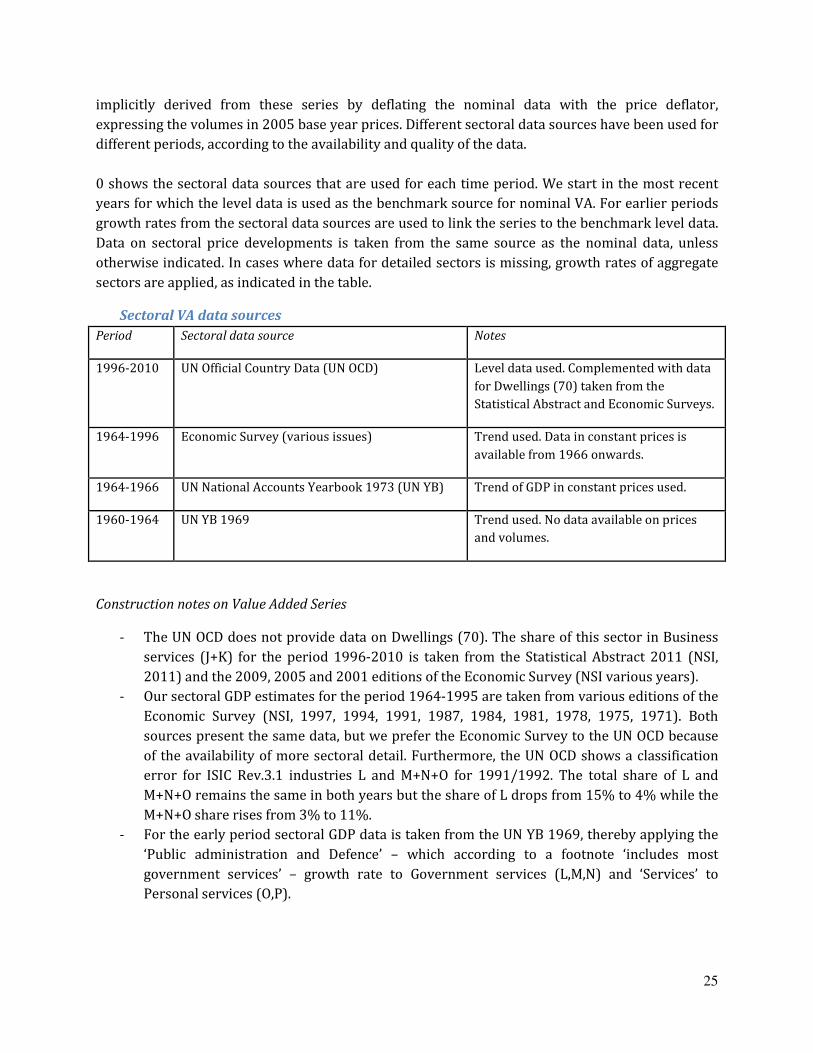
Sectoral VA data sources
Period Sectoral data source Notes
1996-2010 UN Official Country Data (UN OCD) Level data used. Complemented with data
for Dwellings (70) taken from the
Statistical Abstract and Economic Surveys.
1964-1996 Economic Survey (various issues) Trend used. Data in constant prices is
available from 1966 onwards.
1964-1966 UN National Accounts Yearbook 1973 (UN YB) Trend of GDP in constant prices used.
1960-1964 UN YB 1969 Trend used. No data available on prices
and volumes.
Construction notes on Value Added Series
- The UN OCD does not provide data on Dwellings (70). The share of this sector in Business
services (J+K) for the period 1996-2010 is taken from the Statistical Abstract 2011 (NSI,
2011) and the 2009, 2005 and 2001 editions of the Economic Survey (NSI various years).
- Our sectoral GDP estimates for the period 1964-1995 are taken from various editions of the
Economic Survey (NSI, 1997, 1994, 1991, 1987, 1984, 1981, 1978, 1975, 1971). Both
sources present the same data, but we prefer the Economic Survey to the UN OCD because
of the availability of more sectoral detail. Furthermore, the UN OCD shows a classification
error for ISIC Rev.3.1 industries L and M+N+O for 1991/1992. The total share of L and
M+N+O remains the same in both years but the share of L drops from 15% to 4% while the
M+N+O share rises from 3% to 11%.
- For the early period sectoral GDP data is taken from the UN YB 1969, thereby applying the
‘Public administration and Defence’ – which according to a footnote ‘includes most
government services’ – growth rate to Government services (L,M,N) and ‘Services’ to
Personal services (O,P).

26
27
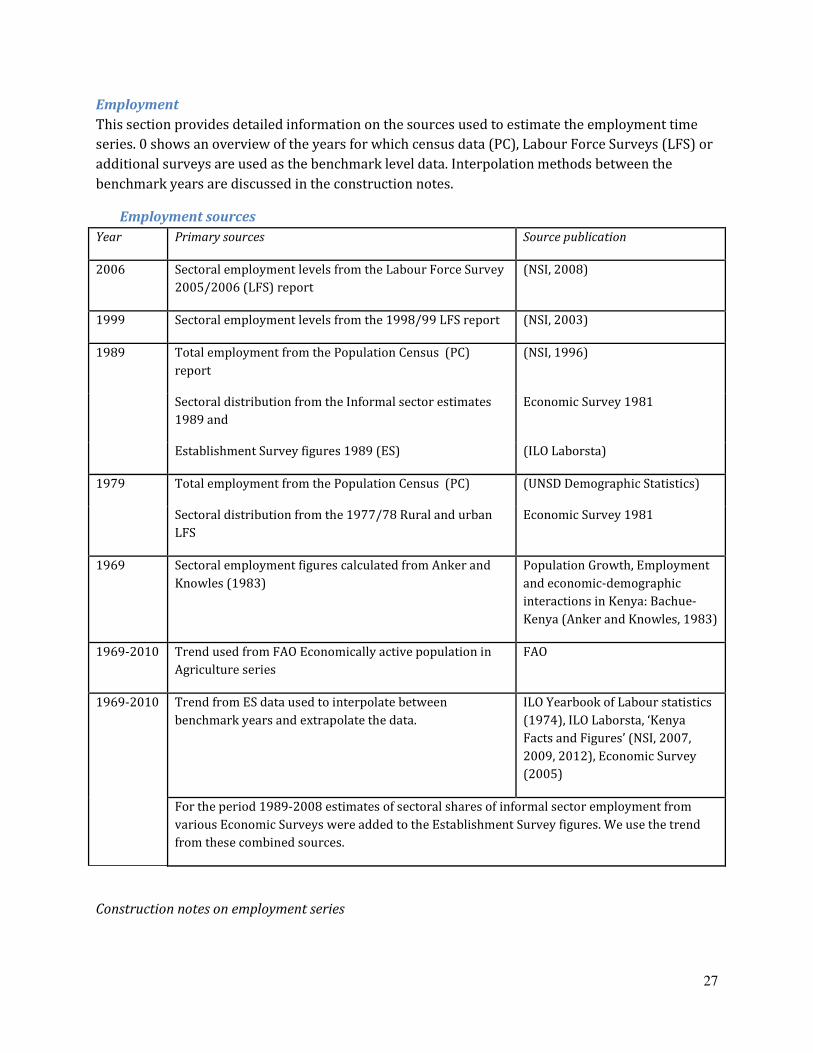
Employment
This section provides detailed information on the sources used to estimate the employment time
series. 0 shows an overview of the years for which census data (PC), Labour Force Surveys (LFS) or
additional surveys are used as the benchmark level data. Interpolation methods between the
benchmark years are discussed in the construction notes.
Employment sources
Year Primary sources Source publication
2006 Sectoral employment levels from the Labour Force Survey
2005/2006 (LFS) report
(NSI, 2008)
1999 Sectoral employment levels from the 1998/99 LFS report (NSI, 2003)
1989 Total employment from the Population Census (PC)
report
(NSI, 1996)
Sectoral distribution from the Informal sector estimates
1989 and
Economic Survey 1981
Establishment Survey figures 1989 (ES) (ILO Laborsta)
1979 Total employment from the Population Census (PC) (UNSD Demographic Statistics)
Sectoral distribution from the 1977/78 Rural and urban
LFS
Economic Survey 1981
1969 Sectoral employment figures calculated from Anker and
Knowles (1983)
Population Growth, Employment
and economic-demographic
interactions in Kenya: Bachue-
Kenya (Anker and Knowles, 1983)
1969-2010 Trend used from FAO Economically active population in
Agriculture series
FAO
1969-2010 Trend from ES data used to interpolate between
benchmark years and extrapolate the data.
ILO Yearbook of Labour statistics
(1974), ILO Laborsta, ‘Kenya
Facts and Figures’ (NSI, 2007,
2009, 2012), Economic Survey
(2005)
For the period 1989-2008 estimates of sectoral shares of informal sector employment from
various Economic Surveys were added to the Establishment Survey figures. We use the trend
from these combined sources.
Construction notes on employment series

28
- Data for benchmark years 2006 and 1999 are derived from the Labour Force Surveys of
1998/99 and 2005/06.
- Various sources are used to construct the 1989 estimates:
o Total Agricultural employment: Only five categories of the economically active are
available from the 1989 census results: worked for pay or profit, on leave, worked
on family holding, no work, seeking work.. We categorise persons of 15 years and
older who ‘worked on family holding’ as agricultural employment. It should be
noted that a fraction of this category also includes family businesses other than
agriculture. However, the figure for agricultural employment is comparable judging
by the trend from our other benchmark years.
o Total employment: To the number of total agricultural employment we added
persons of 15 years and who ‘worked for pay or profit’ and were ‘on leave’ to form
the level of total employment.
o The distribution of the remaining sectors is taken from ES data and the NSI
calculated informal sector estimates – for sectors Manufacturing (D), Construction
(F) and all services except Business services (G+H, I and J-P) – for 1989. While the
ES methodology is clearly defined, it is not entirely clear how the NSI estimated
these informal sector employment numbers. We used the distribution from the
1999 LFS to split the aggregate ‘Government, community and social services’ in
sectors Government services (L,M,N) and Personal services (O,P). No data on gender
distribution is available from the benchmark sources.
- Various sources are used to construct the 1979 estimates:
o Total employment: The main source for this benchmark estimate is the 1977/78
LFS, which covered both urban-rural areas and modern-informal components of the
Kenyan labour force. The 1981 Economic Survey presents data from this survey as
percentages. It also presents percentages of employment per age cohort for the
urban and rural segments. We multiplied these percentages by the relevant age
cohort population figures from the 1979 Population Census (UNSD Demographic
Statistics). In this way we derived total employment figures for persons aged 15
years and older for the urban and rural segments separately.
o The sectoral distribution for the urban and rural segments from the 1977/78 LFS is
applied to these totals (urban and rural total employment) and added up in order to
arrive at the sectoral distribution of total employment in Kenya in 1979. We used
the distribution from the 1999 LFS to split the aggregate ‘Government, community
and social services’ in sectors Government services (L,M,N) and Personal services
(O,P).
- Data for benchmark year 1969 is derived from Anker and Knowles (1983) who used various
published and unpublished NSI surveys to arrive at employment estimates covering urban-
rural and modern-informal segments (Anker and Knowles, 1983, pp. 399-401). We made
some adjustments to their data in order to make it more compatible with the other
benchmark figures. Agricultural employment seems implausibly high in comparison with
the other benchmark estimates. Therefore it was adjusted using the 1979 benchmark year
share of agricultural employment in the FAO economically active population in agriculture

29
for 1979, multiplied by the 1969 FAO figure. Anker and Knowles did not distinguish the
sectors Trade services and Business services but instead grouped these into one figure
(G+H and J+K). We used the 1979 distribution of these sectors. We used the distribution
from the 1999 LFS to split the aggregate ‘Government, community and social services’ in
sectors Government services (L,M,N) and Personal services (O,P).
- Interpolation and extrapolation is done using the following sources and methods:
o Kenya has a long and continuous tradition of conducting annual Establishment
Surveys. We constructed one time series of paid employment by using data of the ES
from several sources (1967-1972 from ILO Yearbook of Labour Statistics 1974;
1972-2000 from ILO Laborsta; 2000-2004 from Economic Survey Kenya 2005;
2005-2008 from various issues of ‘Kenya Facts and Figures’). We added to these
series the estimates of informal sector employment for several sectors
(Manufacturing (D), Construction (F), all services except Business services (G+H, I
and J-P) for the period 1989-2008. The trend from the resulting series is used to
interpolate the benchmark data using equation (4) and extrapolate using equation
(7), except for manufacturing for which we used the estimates directly.
o The trend from FAO data on the economically active population in agriculture is
used for interpolation of the agricultural employment figures using equation (4).
o A gender split is inserted using the following methodology. The benchmarks 1979,
1999 and 2006 benchmark years contain sectoral male employment figures. For the
period 1969-1979 the 1979 sectoral male employment shares were used. Sectoral
male employment shares for the years 1979-1999 and 1999-2006 are calculated
using equation (6).
- The employed population refers to persons aged 15 years and older.
Malawi
Synopsis of the main points
• Use of SNA08 for recent years in official statistics.
• No official data (GDP current prices) for the period 1990-1996. We use sectoral trends from
UNECA estimates.
• No official data (GDP current prices) for the period 2008-2010. We use data from UN
Estimates.
• First PC (1966) contains only limited information on employed. Solved by using ES data.
Introduction
Background to the National Accounts statistics of Malawi
National accounts for Malawi (called Nyasaland from 1891 to 1964) were first calculated by Miss
Phyllis Deane for the year 1938. During the federal period (Federation of Nyasaland and Rhodesia,
1954-1963) a set of national accounts was prepared for Malawi by the Central Statistics Office in
Salisbury. Phyllis Deane writes later: “The difficulties in the way of measuring the national income

30
in Africa spring from two main sources. First, the concepts and experience from which the national
income estimator usually derives his definitions and methods have for the most part been
developed in dealing with advanced industrial economies such as those of the United Kingdom or
the United States. How far they are applicable to less advanced economies must be deduced from a
series of practical tests. Second, data on which to base estimates are scarce” (Chikoti, Siwinda,
Brændvang, & Simpson, 2011, pp. 5-6). With the collapse of the federation an independent Malawi
came into existence in 1964 and the task of preparing national accounts fell on the newly
established National Statistics Institute (NSI) in Zomba. Its first director Derek W. Blades, known
for his studies on the reliability of national accounts in developing countries, prepared a set of
national accounts for 1964-1967, published in 1968. In the following decades the base year was not
extended as often as the UN SNA framework recommends and there are some gaps in the data.
Official current price series estimates are lacking for the period 1990-1996 and 2008-2010 and
there is no overlapping year in two constant price series in 1996/1997.
Recently a twinning project between Statistics Norway and the NSI of Malawi, the Ministry of
Development Planning and Cooperation and the Ministry of Finance was initiated to enhance the
National Accounts (using the SNA08) and rebase the series to 2007 prices. The newly estimated
series contain sectoral constant prices data for 2002-2011 and current price data for 2002-2007.
Malawian Labour Force data
The censuses provide the most reliable information of the historical sectoral structure of the
employed population of Malawi. There are however some data limitations in comparing the
different census employment figures. Questions on employment were very limited and only
pertained to the African population in the 1966 census, Malawi’s first post-independence census.
The African working population was put in the following categories: Own farm produce (reference
period 12 months), wage or salary (worked for at least 2 weeks in past 12 months), other cash
income (did not work but had some kind of cash income) and none. These categories do not add up
to total population. The 1977 census was the first to introduce questions on sectors and data is
available on a two digit level. This census differs from the ones held in 1987, 1998 and 2008 in that
the reference period for agricultural workers was set to 12 months in order to include the
subsistence farmers. In general the employed in the 1977, 1987, 1998, 2008 censuses include
categories as Mlimi (subsistence farmers) and (unpaid) family workers. It is not clear how these
seemingly minor differences affect the comparability of the employment figures, but the total
employment to total population ratio (15 years and older) seems to be comparable over time and
the (change of) sectoral structure seems to follow an expected pattern on the basis of GDP data.
Sectoral Value Added
This section describes the methods used to obtain continuous series of nominal sectoral value
added (VA) and the corresponding price developments in the sector. Volumes of VA in the ASD are

31
implicitly derived from these series by deflating the nominal data with the price deflator,
expressing the volumes in 2005 base year prices. Different sectoral data sources have been used for
different periods, according to the availability and quality of the data.
0 shows the sectoral data sources that are used for each time period. We start in the most recent
years for which the level data is used as the benchmark source for nominal VA. For earlier periods
growth rates from the sectoral data sources are used to link the series to the benchmark level data.
Data on sectoral price developments is taken from the same source as the nominal data, unless
otherwise indicated. In cases where data for detailed sectors is missing, growth rates of aggregate
sectors are applied, as indicated in the table.
Sectoral VA data sources
Period Sectoral data source Notes
2008-
2010
UN Official Estimates (UN E) Trend used. GDP by 7 sectors: Agriculture (AtB),
Manufacturing (D), Mining/Utilities (C+E),
Construction (F), Trade services (G+H), Other
services (J-P).
2002-
2008
UN Official Country Data (UN OCD) Level data used.
1997-
2002
UN OCD Trend used. No data for sector Mining (C), we used
the Manufacturing (D) growth rate. Aggregate data
for sectors L-P applied to benchmark estimates of
Government services (L,M,N) and Personal services
(O,P)
1990-
1997
African Statistical Yearbook 2000
(ASYB)
Trend used. Used because of lack of official data. No
data for sector Mining (C), we used the Manufacturing
(D) growth rate.
1989-
1990
ASYB (1997) Trend used. Used because of lack of official data. No
data for sector Mining (C), we used the Manufacturing
(D) growth rate.
1973-
1989
UN OCD Trend used.
1967-
1973
UN National Accounts Yearbook
1976 (UN YB)
The data in current prices is back casted from 1973.
Malawi. Some Historical Statistics
(Pryor, 1988)
Constant price sectoral GDP data from Pryor (1988)
matches the UN OCD data, but data is available
further back to 1967. Price deflators are estimated
from these current and constant series.
1960- ASYB (1974) Trend used. No data for sector Mining (C),
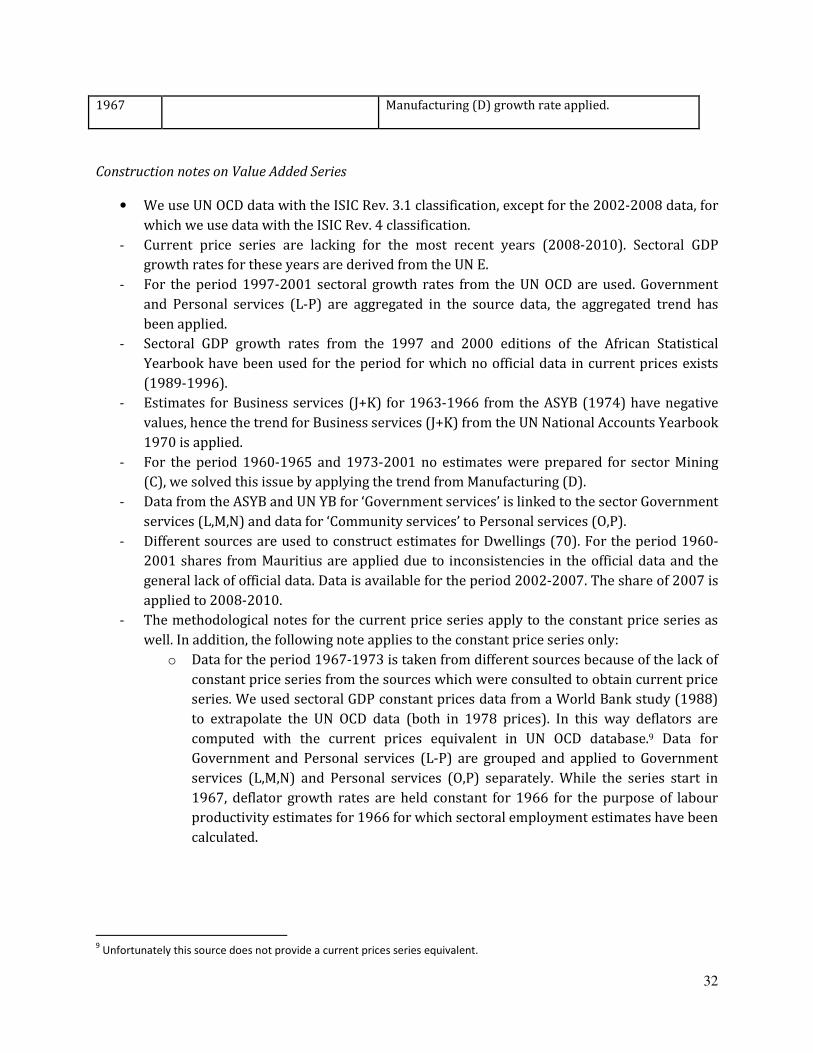
32
1967 Manufacturing (D) growth rate applied.
Construction notes on Value Added Series
• We use UN OCD data with the ISIC Rev. 3.1 classification, except for the 2002-2008 data, for
which we use data with the ISIC Rev. 4 classification.
- Current price series are lacking for the most recent years (2008-2010). Sectoral GDP
growth rates for these years are derived from the UN E.
- For the period 1997-2001 sectoral growth rates from the UN OCD are used. Government
and Personal services (L-P) are aggregated in the source data, the aggregated trend has
been applied.
- Sectoral GDP growth rates from the 1997 and 2000 editions of the African Statistical
Yearbook have been used for the period for which no official data in current prices exists
(1989-1996).
- Estimates for Business services (J+K) for 1963-1966 from the ASYB (1974) have negative
values, hence the trend for Business services (J+K) from the UN National Accounts Yearbook
1970 is applied.
- For the period 1960-1965 and 1973-2001 no estimates were prepared for sector Mining
(C), we solved this issue by applying the trend from Manufacturing (D).
- Data from the ASYB and UN YB for ‘Government services’ is linked to the sector Government
services (L,M,N) and data for ‘Community services’ to Personal services (O,P).
- Different sources are used to construct estimates for Dwellings (70). For the period 1960-
2001 shares from Mauritius are applied due to inconsistencies in the official data and the
general lack of official data. Data is available for the period 2002-2007. The share of 2007 is
applied to 2008-2010.
- The methodological notes for the current price series apply to the constant price series as
well. In addition, the following note applies to the constant price series only:
o Data for the period 1967-1973 is taken from different sources because of the lack of
constant price series from the sources which were consulted to obtain current price
series. We used sectoral GDP constant prices data from a World Bank study (1988)
to extrapolate the UN OCD data (both in 1978 prices). In this way deflators are
computed with the current prices equivalent in UN OCD database.9 Data for
Government and Personal services (L-P) are grouped and applied to Government
services (L,M,N) and Personal services (O,P) separately. While the series start in
1967, deflator growth rates are held constant for 1966 for the purpose of labour
productivity estimates for 1966 for which sectoral employment estimates have been
calculated.
9 Unfortunately this source does not provide a current prices series equivalent.

33
Employment
This section provides detailed information on the sources used to estimate the employment time
series. 0 shows an overview of the years for which census data (PC), Labour Force Surveys (LFS) or
additional surveys are used as the benchmark level data. Interpolation methods between the
benchmark years are discussed in the construction notes.
Employment sources
Year Primary sources Source publication
2008 Sectoral employment levels from the 2008 PC report (NSI, 2010)
Gender split from micro data (AICMD)
1998 Total employment levels from the 1998 PC report (NSI, 2002)
Sectoral distribution from micro data (AICMD)
1987 Sectoral employment levels from the 1987 PC report (NSI, 1993)
1977 Sectoral employment levels from the 1977 PC report (NSI, 1980)
1966 Agricultural employment from the 1966 PC report (NSI, 1967)
Total employment from ‘Malawi. Some Historical
Statistics’ (World Bank report)
(Pryor, 1988)
Sectoral distribution (other than agriculture) from
the Establishment Survey 1969 (ES)
(ILO Laborsta)
1966-2010 Trend used from the FAO series on Economically
active population in Agriculture
FAO
1977-1987 Establishment Survey (ES) (ILO Laborsta)
2008-2010 ILO Estimates of employment-to-population ratios ILO E
Construction notes on employment series
- The 1998 PC report does not present the sectoral distribution, therefore we use micro data
from the AICMD database.
- The 2008 PC report does not present the gender split in employment, therefore we use
micro data from the AICMD database.
- We used several sources to construct our 1966 benchmark estimates.
o Total employment figures are derived from a World Bank report (Pryor 1988).
o Agricultural employment figures are taken from the 1966 PC. In this census the
African working population was put in the following categories: Own farm produce
(reference period 12 months), wage or salary (worked for at least 2 weeks in past

34
12 months), other cash income (did not work but had some kind of cash income)
and none. These categories do not add up to total population. We assume that most
unpaid (agricultural) family workers would be in the last mentioned category. To
arrive at agricultural employment estimates, this figure, minus the double count
(total workers minus the sum of the categories) is added to the category ‘own farm
produce.’
o The remainder of the employed population is computed from the categories ‘wage
or salary’ and ‘other’. The distribution of the remaining sectors is taken from the
1969 ES. Sectoral shares for Government services (L,M,N) and Personal services
(O,P) from the 1977 census are applied to the ‘Community Services’ figure. Males
account for 90% of employment in the ES data series. Therefore we applied the
gender split from the 1977 PC.
- Interpolation and extrapolation is done using the following sources and methods:
o The employment data in between the benchmark years are estimated using average
productivity growth rates between benchmark years using equation (5).
o The employment data is extrapolated using average productivity growth rates
between the nearest benchmark years using equation (9) and these values have
been normalised using the trend from ILO E using equation (11) and equation (12).
o The trend from FAO data on the economically active population in agriculture is
used for interpolation (using equation (4)), back casting (using equation (8)) and
extrapolation (using equation (7)) of the agricultural employment figures.
o The gender shares are linearly interpolated using equation (6), extrapolation and
back casting is done by assuming constant gender shares.
- The employment figures refer to persons aged 15 years and older.
35
Mauritius
Synopsis of the main points
• Use of SNA93 for recent years in official statistics.
• Continuous official GDP data in current and constant prices is available for the period from
1960(1970)-2010.
• Under coverage of female employment in 1972 and 1983 PC. We use 1986 LFS data.
Introduction
Background to the National Accounts statistics of Mauritius
At the time the island gained its independence from Great Britain in 1968, national accounting
practices were already firmly rooted on the island republic. The first sectoral GDP series in constant
prices however were only estimated in the 70’s with 1970 as the first base year. Since then every
five or six years the base year was shifted according to new information from the quinquennial
Census of Economic Activities. The last series, in 2006 constant prices (2006-2012) are calculated
following the SNA93 guidelines.
Mauritian Labour Force data
The Mauritian population censuses are the major sources used for our sectoral employment data.
Over time the concepts and definitions hardly altered, the major change being the shortening of the
reference period from last month to last week in the 1983, 1990, 2000 and 2011 censuses as
compared to the 1972 census. However the female labour force seems to be heavily underreported
in the 1972 and 1983 PC which is reflected in a low employment to population ratio derived from
these censuses (NSI, 1987, p. 23). Apart from the censuses we make extensive use of the LFS,
conducted in 1986 and from 1990 onwards annually.
Sectoral Value Added
This section describes the methods used to obtain continuous series of nominal sectoral value
added (VA) and the corresponding price developments in the sector. Volumes of VA in the ASD are
implicitly derived from these series by deflating the nominal data with the price deflator,
expressing the volumes in 2005 base year prices. Different sectoral data sources have been used for
different periods, according to the availability and quality of the data.
0 shows the sectoral data sources that are used for each time period. We start in the most recent
years for which the level data is used as the benchmark source for nominal VA. For earlier periods
growth rates from the sectoral data sources are used to link the series to the benchmark level data.
Data on sectoral price developments is taken from the same source as the nominal data, unless
otherwise indicated. In cases where data for detailed sectors is missing, growth rates of aggregate
sectors are applied, as indicated in the table.

36
Sectoral VA data sources
Period Sectoral data source Notes
2006-2010 NSI Historical National Account Series Level data used. All sectors available.
1976-2006 NSI Historical National Account Series Trend used.
1975-1976 UN Official Estimates (UN E) No link year for volumes and prices, Total
economy deflator applied to all sectors
1970-1975 UN National Accounts Yearbook 1979 (UN YB) Trend used. Strange trend in Agriculture
(AtB) was smoothed by linear
interpolation (see construction notes).
1965-1970 UN YB (1975) Trend used. No price information
available.
1960-1965 UN YB (1966) Trend used. No price information
available.
Construction notes on Value Added Series
- On the website of the Mauritian NSI various historical national accounts series are available.
The series published in December 2012, covering the years 2006-2012 in 2006 prices, are
used as the benchmark level estimates in the ASD. Sectoral GDP from series ‘1999-2010’,
‘1990-2002’ and ‘1976-1998’ are linked through growth rates. Data for the pre-1976 period
is taken from various edition of the UN National Accounts Yearbook.
- For the period 1960-1989 ‘Producers of government services’ data is linked to the sector
Government services (L,M,N). The UN YB show a strange trend for Agriculture (AtB) for the
years 1973-1975, increasing almost threefold from 1973 to 1974 and jumping from a 31%
to a 50% share. This is smoothed by linearly interpolating the data between 1972 and 1976.

37
- The first constant price series with base year 1970 for the period 1970-1975 stem from the
UN YB (1979). There is no official estimate for the overlapping year between this series and
the NSI historical series, therefore we use the aggregate deflator for 1975/1976
Employment
This section provides detailed information on the sources used to estimate the employment time
series. 0 shows an overview of the years for which census data (PC), Labour Force Surveys (LFS) or
additional surveys are used as the benchmark level data. Interpolation methods between the
benchmark years are discussed in the construction notes.
Employment sources
Year Primary sources Source publication
2011 Sectoral employment levels from the 2011 PC report (Mauritius, 2012)
2000 Sectoral employment levels from the 2000 PC report (Mauritius, 2001)
1990 Sectoral employment levels from the 1990 PC report (Mauritius, 1994)
1983 Total employment levels from Labour Force Survey 1986 (LFS) (Mauritius, 1987)
Sectoral distribution taken from the 1983 PC report (Mauritius, 1987)
1972 Sectoral employment levels from the 1972 PC report (Mauritius, 1974)
1990-2011 Sectoral trend used from ‘Historical Labour Force Series –
Employed population by economic activity’
(NSI website)
1970-1990 Sectoral trend used from Survey of Employment and Earnings
(ES)
(ILO Laborsta)
1970-1983 Trend used from FAO estimates of total economically active
population
FAO
Construction notes on employment series
- We worked around the low female coverage in the first two post-independence censuses as
follows. For 1983 we use the employment figures from the Labour Force Sample Survey
1986, as recommended by the 1983 PC report. The total employment figure for 1983 was
back casted to 1970 using the trend from the FAO estimates of the total economically active
population and equation (8). The sectoral distribution is taken from the 1983 and 1972 PC.
- For 1983 no separate data on Service sectors L-P is available. The 1990 distribution is
applied.
- Interpolation, extrapolation and back casting is done using the following sources and
methods:

38
o 1990-2011: Data for total employment and the gender split between the (census)
benchmark years 1990, 2000 and 2011 is interpolated with a constructed 1990-
2011 sectoral employment time series. This time series is constructed from various
historical employment series presented on the Statistics Mauritius website. Prior to
2004, these series are based on the latest Population Census or Labour Force
Sample Survey, updated with data from surveys of establishments and information
from various administrative sources. From 2004 onwards the estimates are based
on the Continuous Multi-Purpose Household Survey (NSI, 2007, p. 133). We
constructed the 1990-2011 series as follows. The most recently published figures
(2009-2011) serve as our benchmark series (NSI, 2011). Next, 2007-2009 figures
are linked through the use of growth rates (NSI, 2009). Due to a break in the series
from 2006, growth rates from revised totals 2003-2007 (from (NSI, 2007)) are
applied, and subsequently growth rates of total employment down to 1990 are
linked to this total. Next, the relative shares of the sectors are applied to these new
total employment figures. The trend from the resulting series is used to interpolate
the benchmark data using equation (4).
o 1972-1990: Total sectoral employment between the benchmark years 1972, 1983
and 1990 is interpolated using the Survey of Employment and Earnings. This
establishment based survey was first conducted in September 1966 and since then
carried out on a smei annual basis. Because of weak female coverage, employment
by gender is estimated differently. The gender shares are linearly interpolated using
equation (6), extrapolation is done by assuming constant gender shares.
o 1970-1972: The data is back casted using the trend from the ES and using equation
(8), while we normalized the total employment figures as mentioned above using
equation (11) and equation (12).
- The employed population of the whole series refers to persons aged 12 years and older.
39
Nigeria
Update September 2014:
Following the major revision of GDP in Nigeria we present two series: one updating the ‘old’ GDP series
and another using the new GDP data and extrapolating backwards using trends. We deem it appropriate
to have two series for now as the details and potential further refinements behind the revision are not
yet revealed and the series in the new base year only start in 2010.
The employment data has been improved by incorporating information from 1983 and 1986 labor force
surveys and the 1999 and 2009 General household surveys. In addition, the 1974 estimates are now
based on the labor force surveys instead of the national development plan. These changes and
improvements resulted in a major downward revision of manufacturing employment for the 1970s and
1980s.
Synopsis of the main points
• Use of SNA68 for recent years in official statistics.
• Severely outdated base year (1990), rebasing effort will be published soon.
• Continuous official GDP data in current and constant prices is available for the period from
1960-2010.
• Historical census data is unreliable, instead we make use of surveys.
Introduction
Background to the National Accounts statistics of Nigeria
The first attempts to measure the National product of Nigeria were undertaken in the 50’s by Prest
and Steward (Prest & Steward, 1953). According to Jerven the data were far less sophisticated than
the theoretical blueprint, and 86 per cent of the total estimates remained ‘unclassified’ income
(Jerven, 2011, p. 17). Prest and Stewart noted problems with applying western concepts on a
subsistence based economy like Nigeria. The next national accounts estimates were prepared in
1962 and covered the period 1950-1957 (Okigbo, 1962). Okigbo GDP estimates for 1950 were
more than 15% lower compared to the estimates of Prest and Steward, caused mainly by the
different valuations of forestry and building production (Eke, 1966). It was not until 1981 that the
sources and methods were revised. Professor O. Aboyade, in charge of the revision, noted in the
report the shortcomings of statistical methods and that some critical estimates were based on
highly tenuous assumptions. In the last revision to date the base year was shifted to 1990. The
accompanying report does not evaluate its general validity, weaknesses or the quality but Jerven,
using various reports published by the Federal Office of Statistics, notes that the data base on
current economic activities is weak and efforts need to be made to drastically improve the series
(Jerven, 2011, p. 20). To this date the base year remains 1990 and the SNA93 framework still needs

40
to be implemented. A re-basing effort in which the base year is shifted to 2008 is expected to be
published soon.10
Nigerian Labour Force data
Measuring the historical size and structure of the labour force for Nigeria is a great challenge, not in
the least because the 1963 and 1991 population censuses are deemed unreliable. The 1962 and
1973 censuses were heavily politicised and cancelled because the results were rendered useless.
Although the census figures of 1963 and 1991 are officially approved, yet there were complaints of
undercount and over count, and even manipulation of figures. The last census of 2006 was less
controversial and generally acclaimed to be reliable (Okafor, 2007). However, this census did not
contain questions on the employed population and hence is useless to our purposes. It is for this
reason that we took a different approach in constructing employment estimates for Nigeria, not
using the census results.11 The most important sources on historical information on the labour
market are the various labour force surveys. While their underlying concepts and methods are the
same in principle, they show conflicting figures of the size of the employed population and its
sectoral structure. We therefore turned to the literature to select sources which reflect the Nigerian
situation most accurate. Furthermore, we used sources that follow an expected pattern on the basis
of GDP, following the advice of African socio-economic statistics specialists Kdepko and Arya
(1981).
Sectoral Value Added
This section describes the methods used to obtain continuous series of nominal sectoral value
added (VA) and the corresponding price developments in the sector. Volumes of VA in the ASD are
implicitly derived from these series by deflating the nominal data with the price deflator,
expressing the volumes in 2005 base year prices. Different sectoral data sources have been used for
different periods, according to the availability and quality of the data.
0 shows the sectoral data sources that are used for each time period. We start in the most recent
years for which the level data is used as the benchmark source for nominal VA. For earlier periods
growth rates from the sectoral data sources are used to link the series to the benchmark level data.
Data on sectoral price developments is taken from the same source as the nominal data, unless
otherwise indicated. In cases where data for detailed sectors is missing, growth rates of aggregate
sectors are applied, as indicated in the table.
Sectoral VA data sources
Period Sectoral data source Notes
10
See ‘Nigerian GDP rebase will alter investor perceptions’, October 5 2012,
http://www.oxan.com/Analysis/DailyBrief/Samples/NigerianGDPRebase.aspx [visited 22-01-2013]. 11
However, some information from the 1952/53 census is used because this PC was held in colonial times and therefore less
subjected to tribal strive as compared to the 1963 PC.

41
2008-
2010
NSI – Statistical bulletin 2012 quarter 2 Level data used. All sectors available.
1970-
2008
UN Official Country Data (UN OCD) Trend used.
1981-
1997
NSI historical GDP series Data for Government services (L,M,N) and
Personal services (O,P) is taken from this
source because of a break in the UN OCD
series. Data for
1960-
1970
NSI historical GDP series
Trend used.
1960-
1963
UN National Accounts Yearbook 1966 (UN YB) The share of Dwellings (70) in Business
services (J+K) is used.
Construction notes on Value Added Series
- The website of the Central Bank of Nigeria presents time series covering the period 1960-
2009 (in 0 this source is referred to as ‘NSI historical GDP series’), but no overlapping years
are presented for which different base year estimates were produced and there are large
spikes in the series. This source is therefore used in conjunction with the UN Official
Country Data, which does present the various base series but only covers the period 1970-
2007. The UN OCD data source is used as the main source from which growth rates have
been used, but in some instances, as explained below, the NSI historical GDP data is used.
- There are some gaps in the data for sector Personal services (O,P) (growth rates of 3000%)
in the UN OCD, therefore growth rates for this sector is taken from the NSI historical series
(period 1981-1997). Data for this sector for 1970-1972 is lacking from UN OCD, here the
NSI series data is used.
- There is a break in the series for Utilities (E) for the period 1998-2000, we use the trend
from another series (from an older revision, available in the UN OCD).
- There is a break in the series for Agriculture (AtB) for the period 2001/2002, use the trend
from another series (from an older revision, available in the UN OCD).
- For the period 1960-1969 we used the NSI historical series. We assume that data for
Business services (J+K) is included in aggregated data for Government services (L,M,N) and
Personal services (O,P) judging by the break in the source data in 1980/81 where J+K rises
and L-P plummet whereas the sum of sectors J-P data remains constant. Therefore
aggregate growth rates from L-P are used for Business services (J+K) for 1960-69.
- Data for Dwellings (70) is lacking in the UN OCD source. We use the share of Dwellings (70)
in Business services (J+K) from the NSI historical series for the years 1994-2010. Because of
a gap in the series we cannot use data for Dwellings for the period 1960-1993 from this
source. For 1960-1963 we use the share of Dwellings in Business services from the UN YB
1966. Figures for Dwellings for the period 1963-1993 are interpolated using the trend from

42
Business services and normalized at the end and starting points. See Equation (6), then θt
denotes the VA data for Dwellings at time t.
Employment
This section provides detailed information on the sources used to estimate the employment time
series. 0 shows an overview of the years for which census data (PC), Labour Force Surveys (LFS) or
additional surveys are used as the benchmark level data. Interpolation methods between the
benchmark years are discussed in the construction notes.
Employment sources
Year Primary sources Source publication
2009 Total employment ratio taken from ‘2011 Annual Socio-
Economic Report’, applied to 2009 population figure
from Maddison historical statistics.
(NSI, 2011), (Maddison, 2009)
Sectoral distribution taken from the General Household
Survey (HS) (2009)
(Adeyink, Salau, & Vollrath, 2012)
Gender split taken from the 2010 National Manpower
Stock and Employment Generation Survey
(Statistics, 2010)
1975 Sectoral employment levels taken from ‘Total Gainful
Employment in 1975’. Total employment to population
ratio from this source applied to 1975 population figure
from Maddison historical statistics.
(Olayide, 1976), (Maddison, 2009)
1967 Sectoral employment levels taken from Labour Force
Sample Survey 1966/67 report
(National Manpower Board, 1972)
1960 Total employment taken from Olayide (1976) (Olayide, 1976)
Gender distribution from the 1952/53 PC (National Economic Council, 1959)
Distribution for sectors other than Agriculture (AtB),
Manufacturing (D) and Trade services (G+H) from the
Labour Force Sample Survey 1966/67 report
(National Manpower Board, 1972)
1960-
2010
Trend used from FAO series on Economically active
population in Agriculture
FAO
2009-
2010
ILO Estimates of employment-to-population ratios ILO E
Construction notes on employment series
- We use various sources to construct our benchmark figures for 2009:

43
o Total employment: We apply the total employment ratio taken for 2009 from the
‘2011 Annual Socio-Economic Report’, to the 2009 Nigeria population figure from
Maddison Historical Statistics (Maddison, 2009). Because of the unreliability of
Nigerian PC data we use population totals from the Maddison historical statistics.
o The sectoral distribution is derived from a recent study on structural change in
Nigeria by Adeyinka, Salua and Vollrath. In measuring labour productivity in Nigeria
between 1996 and 2009 they use the General Household Survey (Adeyinka, Salau, &
Vollrath, 2012). We use the figures of the 2009 GHS. The gender split is not available
in this source and is computed using the 2010 National Manpower Stock and
Employment Generation Survey.
- Benchmark estimates for the year 1975 are derived from Olyaide who in turn used figures
from the National Development Plan. (Olayide, 1976, p. 22). This source does not contain
data on employment by gender.
- The total employment figure for 1960 is computed by applying the total employment to
population ratio for 1960 from Olayide (Olayide, 1976, p. 22) to the Maddison total
population estimate (Maddison, 2009) of that year. The sectoral structure of employment
(for sectors Agriculture (AtB), Manufacturing (D) and Trade services (G+H) ) is derived
from the results of the 1952/53 PC. According to a 1959 report of the National Economic
Council the structure of the labour market in this PC was also representative of 1960
(National Economic Council, 1959, p. 13). The labour force sample survey of 1966/67 is
used to estimate the distribution of the other sectors.
- Interpolation and extrapolation is done using the following sources and methods:
o The employment data in between the benchmark years are estimated using average
productivity growth rates between benchmark years using equation (5).
o The employment data is extrapolated using average productivity growth rates
between the nearest benchmark years using equation (9) and these values have
been normalised using the trend from ILO E using equation (11) and equation (12).
o The trend from FAO data on the economically active population in agriculture is
used for interpolation (using equation (4)), back casting (using equation (8)) and
extrapolation (using equation (7)) of the agricultural employment figures.
o The gender shares are linearly interpolated using equation (6), extrapolation and
back casting is done by assuming constant gender shares.
- The employment figures refer to persons aged 15 years and older.

44
Senegal
Synopsis of the main points
• Use of SNA93 for recent years in official statistics.
• Continuous official GDP data in current and constant prices is available for the period from
1969(1970)-2010.
• Lack of sectoral detail in historical GDP data, which means that aggregate growth rates have
been used for some sectors.
• Historical PC data unreliable due to under coverage of female activities and unusable due to
lack of questions on the sectoral distribution. Instead we use surveys to construct our
employment figures.
Introduction
Background to the National Accounts statistics of Senegal
Continuous annual sectoral GDP estimates are available from 1969 for current and 1970 onwards
for constant prices. However, Senegal’s first GDP estimates (in current prices) were made in the
sixties. Generally speaking the GDP series have been revised almost every ten years in the post-
independence period. Senegal, being a former French colony, compiled their National Accounts in
earlier times according to the ‘courcier’ system. One of the consequences is that some sectors are
aggregated. In various UN National Accounts Yearbooks the UN comment that the figures have been
adjusted to conform the UN SNA system so far as the existing data would permit. It was not until the
last revision, which shifted the base year to 1999, that the UN System of National Accounts
framework was entirely adopted (SNA93).
Employment data from Senegalese censuses
The Population Censuses held in Senegal (1976, 1988 and 2002) do not present the most accurate
information on the structure and size of the labour market for several reasons. First, female
participation is not accurately measured, especially in the 1976 and 1988 censuses.12 Many females
are reported as homemakers, a category of the inactive population. Second, only the 1988 census
included a question to measure the sectoral distribution of the labour force, while the other
censuses only included questions on status and occupation. From the micro data of the 1988 census
(provided for by the AICMD) a cross industry-occupations matrix could be extracted and applied to
the 2002 PC occupation figures. In this way we allocated the occupations of this census to sectors
using the 1988 blueprint. However, the resulting sectoral distribution for the 2002 census was
unusable, showing a 45% share of agriculture which is deemed too low in comparison to other
sources. This could be due to the timing of the census, which was December. It is for the above
mentioned reasons that the census data are not used to provide benchmarks but, as outlined below,
have a minor role in constructing our employment by industry estimates.
12
The 1976 PC report even leaves out the analysis of female employment because of its marginal size of 6% of the total labour force.

45
Use of the ‘National Survey’s’
Before the first census of 1976 two ‘National Survey’s’ (EDN - Enquête Démographique Nationale)
were held in order to measure the size and characteristics of the population of Senegal, one in
1960-61 and one in 1970-71. The 1970-71 survey was conducted during December 1970 until May
1971. The question to determine employment was not very explicit, namely every individual who
worked regularly (included are aides familial – family workers). To include seasonal variations in
agriculture the reference period for agriculture was set to one year, for all other occupations one
week. The reasons why we use the figures of this survey instead of the 1976 census are because the
EDN made an attempt to produce a realistic measure of female employment in agriculture. The
survey was held during off-season (December-May) but an attempt was made to include seasonal
employment by adding the unemployed who stated that their last job was agriculture to the
employment figure for agriculture (NSI 1973, pp. 11-15). The resulting female to total employment
ratio for agriculture is 34%, as opposed to 1% in the 1976 census.
Sources for recent labour market trends
In the last two decades several surveys were conducted which measured (among other things) the
size and structure of the employed population. Female coverage in these surveys is deemed more
reliable than PC data. For example, the 1988 census shows a share of 25% for female employment
in total employment while the 1991 survey shows a more realistic figure of 46%. Two priority
surveys were conducted in 1991-92 and 2005-06. The purpose of these World Bank initiated
surveys is in the first place to measure the size and characteristics of poverty in Senegal. In between
two Household Survey’s (Enquête Sénégalaise Auprès des Ménages) were held, in 1994 and 2001.
These HS however are not used because they show a strange trend for some sectors (Mining (C)
increases tenfold and Manufacturing (D) halves in size). Therefore we used the priority survey data
for our employment benchmarks for 1991 and 2005.
Sectoral Value Added
This section describes the methods used to obtain continuous series of nominal sectoral value
added (VA) and the corresponding price developments in the sector. Volumes of VA in the ASD are
implicitly derived from these series by deflating the nominal data with the price deflator,
expressing the volumes in 2005 base year prices. Different sectoral data sources have been used for
different periods, according to the availability and quality of the data.
0 shows the sectoral data sources that are used for each time period. We start in the most recent
years for which the level data is used as the benchmark source for nominal VA. For earlier periods
growth rates from the sectoral data sources are used to link the series to the benchmark level data.
Data on sectoral price developments is taken from the same source as the nominal data, unless

46
otherwise indicated. In cases where data for detailed sectors is missing, growth rates of aggregate
sectors are applied, as indicated in the table.
Sectoral VA sources
Period Sectoral data source Notes
1996-2010 UN Official Country Data (UN
OCD)
Level data used.
1980-1996 Comptes Nationaux 1980-2004
(NSI website)
Trend used.
1970-1980 UN OCD Trend used. Several adjustments were made, see the
construction notes.
1963-1970 UN National Accounts Yearbook
(UN YB) 1978
Trend used. Aggregate growth rates used for Mining (C),
Manufacturing (D) and Utilities (E) (C+D+E) and Business
services (J+K), part of Government services (M,N) and
Personal services (O,P) (J+K,M,N,O). No data for 1964,
1966-1968, which was solved by simple linear
interpolation. No data on prices available.
1960-1963 Comptes Economiques, 1959 à
1968 (Diop, 1973)
Trend used. Aggregate growth rates used for Mining (C)
and Utilities (E) (C+E) and Business services (J+K) through
Personal services (O,P) (J-P). No data on prices available.
Construction notes on Value Added Series
- Due to the lack of data the share of Dwellings (70) in Business services (J+K) for the period
1960-1979 is taken from Mauritius. The share of Dwellings in J+K for the period 1980-2010
is taken from NA accounts files from the NSI website.
- We made several adjustments in order to use the 1979 source data for our purposes.
o ISIC Rev.3.1 industries J+K,M,N,O are combined, hence this aggregate growth rate is
applied to sectors Business services (J+K), part of Government services (M,N) and
Personal services (O,P).
o Data for sectors Transport services (I) Business services (J+K), part of Government
services (M,N) and Personal services (O,P) is lacking. Here we use the aggregate GDP
growth rate.
o Sector Trade services (G+H) shows a huge jump for 1979/1980. We suspect that the
1979 value (which is halved in the following year) might contain the ‘missing’ data
for ISIC Rev3.1 industries I and J+K,M,N,O. We use the aggregate GDP growth rate.
- The 1963-1969 and 1970-1978 data has limited sectoral detail, we used aggregate growth
rates for the following sectors:
o Mining (C), Manufacturing (D) and Utilities (E)
o Business services (J+K), part of Government services (M,N) and Personal services
(O,P).
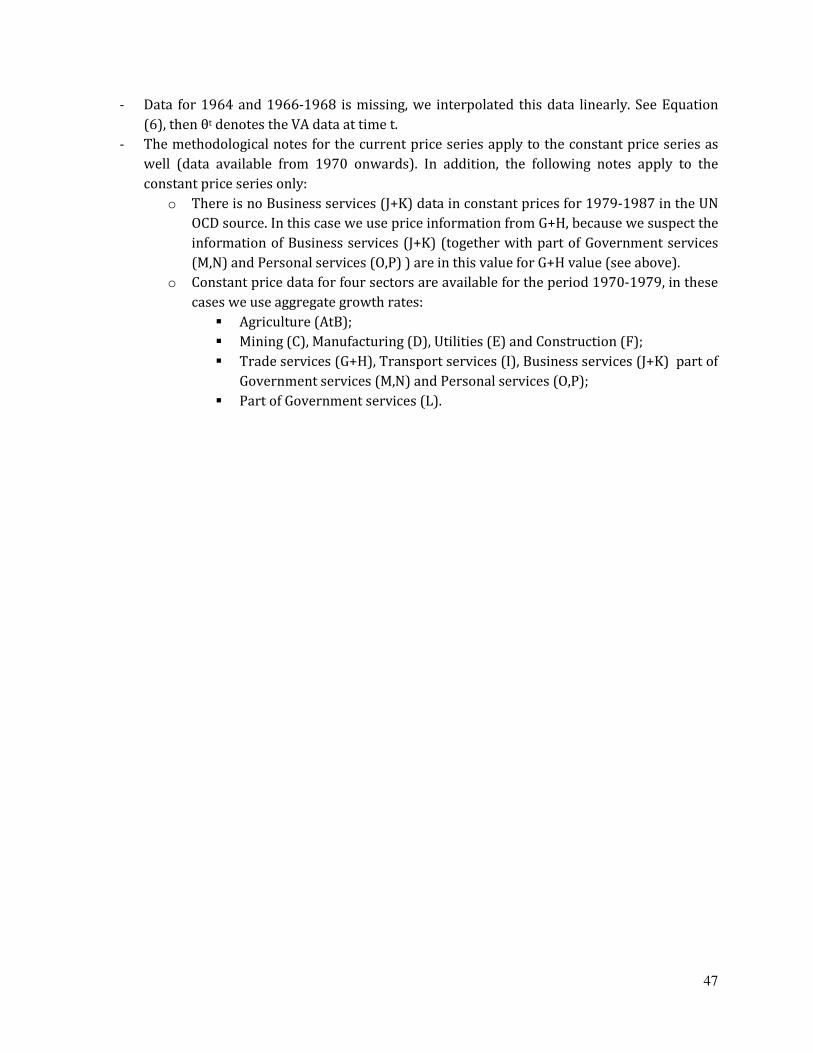
47
- Data for 1964 and 1966-1968 is missing, we interpolated this data linearly. See Equation
(6), then θt denotes the VA data at time t.
- The methodological notes for the current price series apply to the constant price series as
well (data available from 1970 onwards). In addition, the following notes apply to the
constant price series only:
o There is no Business services (J+K) data in constant prices for 1979-1987 in the UN
OCD source. In this case we use price information from G+H, because we suspect the
information of Business services (J+K) (together with part of Government services
(M,N) and Personal services (O,P) ) are in this value for G+H value (see above).
o Constant price data for four sectors are available for the period 1970-1979, in these
cases we use aggregate growth rates:
� Agriculture (AtB);
� Mining (C), Manufacturing (D), Utilities (E) and Construction (F);
� Trade services (G+H), Transport services (I), Business services (J+K) part of
Government services (M,N) and Personal services (O,P);
� Part of Government services (L).
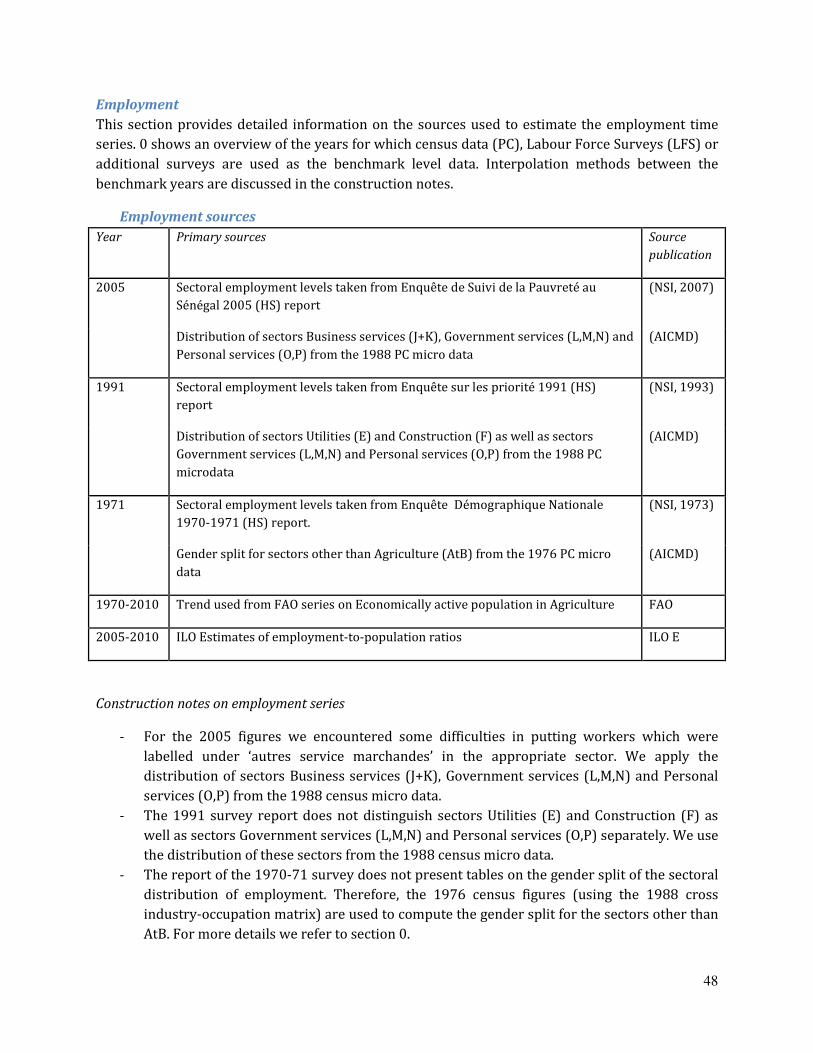
48
Employment
This section provides detailed information on the sources used to estimate the employment time
series. 0 shows an overview of the years for which census data (PC), Labour Force Surveys (LFS) or
additional surveys are used as the benchmark level data. Interpolation methods between the
benchmark years are discussed in the construction notes.
Employment sources
Year Primary sources Source
publication
2005 Sectoral employment levels taken from Enquête de Suivi de la Pauvreté au
Sénégal 2005 (HS) report
(NSI, 2007)
Distribution of sectors Business services (J+K), Government services (L,M,N) and
Personal services (O,P) from the 1988 PC micro data
(AICMD)
1991 Sectoral employment levels taken from Enquete sur les priorite 1991 (HS)
report
(NSI, 1993)
Distribution of sectors Utilities (E) and Construction (F) as well as sectors
Government services (L,M,N) and Personal services (O,P) from the 1988 PC
microdata
(AICMD)
1971 Sectoral employment levels taken from Enquête Démographique Nationale
1970-1971 (HS) report.
(NSI, 1973)
Gender split for sectors other than Agriculture (AtB) from the 1976 PC micro
data
(AICMD)
1970-2010 Trend used from FAO series on Economically active population in Agriculture FAO
2005-2010 ILO Estimates of employment-to-population ratios ILO E
Construction notes on employment series
- For the 2005 figures we encountered some difficulties in putting workers which were
labelled under ‘autres service marchandes’ in the appropriate sector. We apply the
distribution of sectors Business services (J+K), Government services (L,M,N) and Personal
services (O,P) from the 1988 census micro data.
- The 1991 survey report does not distinguish sectors Utilities (E) and Construction (F) as
well as sectors Government services (L,M,N) and Personal services (O,P) separately. We use
the distribution of these sectors from the 1988 census micro data.
- The report of the 1970-71 survey does not present tables on the gender split of the sectoral
distribution of employment. Therefore, the 1976 census figures (using the 1988 cross
industry-occupation matrix) are used to compute the gender split for the sectors other than
AtB. For more details we refer to section 0.

49
- Interpolation, extrapolation and back casting is done using the following sources and
methods:
o The employment data is back casted for the period 1970-1971 using average
productivity growth rates between the nearest benchmarks using equation (10).
o The employment data in between the benchmark years are estimated using average
productivity growth rates between benchmark years using equation (5).
o The employment data is extrapolated using average productivity growth rates
between the nearest benchmark years using equation (9) and these values have
been normalised using the trend from ILO E using equation (11) and equation (12).
o The trend from FAO data on the economically active population in agriculture is
used for interpolation (using equation (4)), back casting (using equation (8)) and
extrapolation (using equation (7)) of the agricultural employment figures.
o The gender shares are linearly interpolated using equation (6), extrapolation and
back casting is done by assuming constant gender shares.
- The employment figures refer to persons aged 15 years and older.
South Africa
Synopsis of the main points
• Use of SNA93 for recent years in official statistics.
• Continuous official GDP data in current and constant prices available from 1946 onwards.
Introduction
Background to the National Accounts statistics of South Africa
The first estimates of the South African national income were prepared in the 1920s by R.A. Lehfelt
and covered the years 1917/18 and 1922/23. With these estimates South Africa was among the
first countries in the world which produced estimates of national income. At the time South Africa
was part of the British realm as the Union of South Africa. With the statute of Westminster of 1931
the Union was granted independence from the United Kingdom within the Commonwealth and
thirty years became completely independent as a Republic. In the early 1940s S.H. Frankel made
attempts to estimate national income for 1910/11 and from 1917/18 to 1945/46.
However, it was not until 1946 that the former Bureau of Census and Statistics (at present Stats
South Africa – henceforth abbreviated as NSI) started making official estimates of South Africa’s
domestic product and national income on an annual basis, along with the United States and many
European countries. The practice of national accounting in South Africa is a concerted effort of the
South African Reserve Bank and the NSI, the first being responsible for compiling the expenditure
side as well as income and savings and the balance of payments, the latter being responsible for
compiling the production side of the national accounts. Following the UN SNA recommendations
the South African GDP has been historically rebased every five years. 2005 is the latest benchmark

50
year and the methodology is still mainly based on the SNA93 framework. The major issue in
revising the (historical) sectoral GDP estimates has been to adjust for the exclusion of countries
who gained independence from the Republic: Botswana (1966), Lesotho (1966), Swaziland (1968)
and Namibia (1990). The former self-governing states and the former Republics of Transkei,
Bophuthatswana, Venda and Ciskei have always been and still are included in the national accounts
estimates of South Africa (Prinsloo, 2002).
South African Labour Force data
There are three types of sources that refer to the historical size and structure of the South African
Labour Market. These are the Population Censuses, (Quarterly) Labour Force Surveys and
Establishment Surveys.
South African census taking has a long history, going back to 1798, when every head of a household
in the Cape Colony had to submit a return stating the size of his family and the number of slaves and
cattle that he owned. For the purpose of our database we focus on the post 1960 censuses. In the
1960 and 1970 censuses there was a full count only for white, coloured and Asian people. A
different questionnaire was used for black people, for whom a small sample was enumerated. The
1980 census was the first census that aimed to count all population groups through a uniform data
collection methodology (although a question on family structure was not asked of the black
population). Due to the unplanned and unstructured nature of certain residential areas, and the
inaccessibility of others due to political violence and budget limitations, the NSI decided to use
aerial photographs for obtaining estimates of population counts for 83 urban areas and magisterial
districts during the 1991 census. The 1996 census was the first census in which the whole country
was covered and all residents of the country were treated equally (NSI, 2007). The questionnaire
was now available in all 11 official languages, instead of Afrikaans and English only. The 1970, 1980
and 1985 censuses excluded the homeland territories of Transkei, Bophuthatswana, Venda and
Ciskei which held their own (sample) censuses.
Household based survey’s are regarded as the most comprehensive and reliable sources of the
South African labour market (Daniela Casale, 2004, p. 981). In 1993 the annual ‘October Household
Survey’ (OHS) was launched and was replaced by the biannual Labour Force Survey (LFS) in
February 2000. While the OHS collected information from respondents about a diverse range of
issues, the LFS focused on the employment situation only. Therefore the latter provides a far more
detailed explanation of what constitutes a job, with the aim of capturing irregular and informal
work more thoroughly than was the case in the OHS. The LFS was in turn replaced by a Quarterly
Labour Force Survey (QLFS) in 2008 which further improved among other things the coverage of
informal sector employment. The two surveys are comparable in that they use the same definitions
of employment, that is a person is employed who during the reference week worked for pay or
profit for at least one hour in the last week (included are unpaid family workers).

51
The last source on (historical) labour market information under review here is the establishment
based survey introduced in the 1950’s. This source is in fact a mixture of various enterprise based
surveys but presented as one series on the website of the Reserve Bank of South Africa. Two
important downfalls of this source are the omittance of agricultural and informal employment. Last
but not least there is criticism about the sample, which was not changed for a long time and
therefore became increasingly outdated in the nineties (Altman, 2008, p. 128).
Sectoral Value Added
This section describes the methods used to obtain continuous series of nominal sectoral value
added (VA) and the corresponding price developments in the sector. Volumes of VA in the ASD are
implicitly derived from these series by deflating the nominal data with the price deflator,
expressing the volumes in 2005 base year prices. Different sectoral data sources have been used for
different periods, according to the availability and quality of the data.
Table 20 shows the sectoral data sources that are used for each time period. We start in the most
recent years for which the level data is used as the benchmark source for nominal VA. For earlier
periods growth rates from the sectoral data sources are used to link the series to the benchmark
level data. Data on sectoral price developments is taken from the same source as the nominal data,
unless otherwise indicated. In cases where data for detailed sectors is missing, growth rates of
aggregate sectors are applied, as indicated in the table.
Sectoral VA sources
Period Sectoral data source Notes
1960-2010 UN Official Country Data Data for Dwellings (70) is not available from this source. No
data for sectors Government services (L,M,N) and Personal
services (O,P) separately.
1993-2010 GDP Bulletin (NSI) Share of Dwellings (70) in Business services (J+K) used.
1960-1968 UN National Accounts
Yearbook 1969 (UN YB)
Share of Dwellings (70) in Business services (J+K) used.
Construction notes on Value Added Series
- Data for ‘Public administration and defence; compulsory social security’ is allocated to
Government services (L,M,N) and Education; health and social work; other community,
social and personal services (M,N,O) and Private households with employed persons (P) to
‘Personal Services’ (O,P).

52
- Data for dwellings is not included in the UN OCD data source and is therefore taken from
other sources:
o For the period 1993-2011 various editions of the GDP bulletin published by the NSI
(Statistical release P0441) are used. We use the share of Dwellings (70) in Business
services (J+K).
o For the period 1960-1968 we use the share of Dwellings (70) in Business services
(J+K) from the UN YB 1969.
o Figures for the period 1969-1992 are interpolated using the growth of Business
services (J+K).
Employment
This section provides detailed information on the sources used to estimate the employment time
series. 0 shows an overview of the years for which census data (PC), Labour Force Surveys (LFS) or
additional surveys are used as the benchmark level data. Interpolation methods between the
benchmark years are discussed in the construction notes.
Employment sources
Year Primary sources Source publication
2008-2010 Sectoral employment levels taken from the Quarterly
Labour Force Survey (2012) report
(NSI, 2012)
1996 Sectoral distribution taken from 2001 PC report (NSI, 2004)
1991 Sectoral distribution taken from 1991 PC ILO figures (ILO Laborsta)
1985 Sectoral distribution taken from 1985 PC ILO figures (ILO Laborsta)
1980 Sectoral distribution taken from 1980 PC report (NSI, 1985)
1970 Benchmark figures Agriculture (AtB) (Lange, 1979)
Other sectors from 1970 PC report (NSI, 1975)
1960 Benchmark figures Agriculture (AtB) (Lange, 1979)
Other sectors from 1960 PC report (NSI, 1968)
2000-2007 Sectoral trend taken from 2000-2002 Labour Force Survey (NSI, 2009)
1960-1999 Trend for agricultural employment from FAO figures for
economically active population in agriculture
FAO
1971-1999 Trend for total employment taken from total economically
active population series from various editions of ‘Mid-year
Population Estimates’.
(NSI Mid-year Population
Estimates)
1970-1999 Trend for sectors other than Agriculture (AtB) STEE series
53
1960-1970 Trend for sectors other than Agriculture (AtB) (Lange, 1979)
Construction notes on employment series
- We created three benchmark ‘periods’:
o 2000-2010: The 2008-2010 figures from the Quarterly LFS (QLFS) are used as our
benchmark figures. To increase comparability with other African countries in the
ASD we included from the various reports of the QLFS ‘Subsistence farming’ and
‘Hunting or fishing for household use’ in the figure for Agriculture (AtB). The bi-
annually held LFS is used to provide trends for the period 2000-2007 and is linked
to the QLFS level data. Figures for the period 2003-2011 originate from two editions
of the SSA Labour Market Dynamics reports (2008, 2011) which present historically
revised employment series for 2003-2010. Data for 2000-2002 is taken from
‘Labour Force Survey Historical Revision September Series 2000-2007’ and is linked
to the 2003-2010 figures.
o 1960, 1970: The figures for benchmark years 1960 and 1970 are derived from a
1979 study by Roukens de Lange (1979). He estimated total employment (informal
and formal) using among others the population censuses. We assume that his
figures for agricultural employment are more reliable than the census figures. The
distribution of the other sectors is taken from the 1960 and 1970 PC.
- Data for the period 1970-2000 is interpolated using the following sources and methods:
o To provide a uniform continuous total employment estimate we interpolated the
total employment data with the trend from the total economically active population
from various editions of ‘Mid-year Population Estimates’ and normalized for the end
points using equation (4).
o The trend from FAO data on the economically active population in agriculture is
used for interpolation, using equation (4) of the agricultural employment figures.
o The distribution of the remaining sectors for the years 1980, 1985, 1991 and 1996
is taken from PC data. We made some adjustments to these figures. We assume that
there is a misclassification in all the censuses concerning the sectors Trade services
(G+H), Government services (L,M,N) and Personal services (O,P) which was picked
up only in the QLFS since 2008. Therefore the distribution of these sectors for all the
years for which we use PC data, thus including the 1960 and 1970 data, are based on
the QLFS 2008.
- Data for the period 1960-1970 is interpolated using the sectoral trend from the STEE
establishment survey figures and normalized for the end points using equation (4). Data for
sectors Government services (L,M,N) and Personal services (O,P) are interpolated using
average annual productivity growth rates using equation (5).
- The gender shares are linearly interpolated using equation (6).
- The employment figures refer to persons aged 15 years and older.

54

55
Tanzania
Update September 2014:
In this new release, we include information from the 2001 and 2006 labor force surveys. We use the
ratio of employment data by sector from 2006 over 2001 and apply these to the estimates for 2001. Due
to this adjustment, employment in manufacturing and most other sectors grow faster. Employment
estimates in the period between 2002 and 2006 were interpolated, whereas after 2006, series were
extrapolated using labor productivity growth rates as in the previous release.
Synopsis of the main points
• Use of SNA93 for recent years in official statistics.
• Tanzania in the ASD refers to Tanzania mainland.
• Continuous official GDP data in current and constant prices is available for the period from
1960-2010.
• The 1978 and 1988 PC data do not contain information on the sectoral structure of the
employed. We applied the allocation of occupations by sectors from the 1990/91 LFS.
Introduction
Background to the National Accounts statistics of Tanzania
The first estimates of the national income of Tanzania cover the years 1952-54 (Peacock and
Dosser, 1958). Continuous official GDP data is available for the period from 1960 onwards. After
independence in 1964 the Central Bureau of Statistics (NSI), with the assistance of the UN
embarked on a detailed and comprehensive revision of the national accounts. Jerven notes that the
estimates for agricultural output were sometimes problematic, as for its basic data it sometimes
relied on eye observations (Jerven, 2011a). During the late eighties and early nineties the series
became increasingly unreliable. Formal activities in the economy declined, after Structural
Adjustment Programs forced the Tanzanian government towards liberalization (Jerven, 2011a).
Meanwhile the statistical office had to do more with fewer resources. It was not until the next big
revision in 1997, changing the base year to 1992 prices, that the growth of parallel/informal
markets was picked up. It has been estimated that the size of the unrecorded economy in 1990 was
some 30 per cent of official GDP (Jerven, 2011a). In the last revision, conducted in 2007, the base
year was changed to 2001 using the SNA93 methodological framework. The Tanzanian national
accounts refer to the mainland of Tanzania only.
Tanzanian Labour Force data
Tanzania has conducted four post-independence censuses: 1967, 1978, 1988 and 2002. Over time
the concepts and methods hardly altered, they all used for example a long reference period of 12
months. Like most African countries the biggest difficulty lies in what constitutes employed and

56
what not in the setting of a subsistence based economy. Sometimes the demarcation line between
employed and unemployed can seem very arbitrary. For example, women who worked on family
farms or enterprises for at least one-third of their time were to be classified as employed rather
than home-maker. The use of the one third criterion is impossible to apply with any confidence in a
subsistence agriculture system in which there are seasonal variations in the time spent by family
workers on agricultural activities (Egerö & Henin, 1973, p. 131). The 1967 census analytical report
mentions a similar but more practical problem. In Swahili there is no suitable translation to
distinguish occupation from industry. This could be the reason for the omittance of questions on
industry in the 1978 and 1988 censuses where instead only questions on occupations were asked.
Other important sources are the Labour Force Surveys conducted in 1965, 1990/91, 2000/01 and
2005/06. The first LFS of 1965, prepared by Robert S. Ray (1966), however was very limited in its
questions and did not ask for industry or occupation. The last three LFS (which cover Tanzania
mainland) are unfortunately incomparable with the census results on employment, as the levels are
very different. However it is not clear where these differences arise from since the concepts and
methods are generally the same. Therefore we choose to use the censuses which provide consistent
historical data on the level and sectoral structure of employment dating further back than the LFS
do.
Sectoral Value Added
This section describes the methods used to obtain continuous series of nominal sectoral value
added (VA) and the corresponding price developments in the sector. Volumes of VA in the ASD are
implicitly derived from these series by deflating the nominal data with the price deflator,
expressing the volumes in 2005 base year prices. Different sectoral data sources have been used for
different periods, according to the availability and quality of the data.
0 shows the sectoral data sources that are used for each time period. We start in the most recent
years for which the level data is used as the benchmark source for nominal VA. For earlier periods
growth rates from the sectoral data sources are used to link the series to the benchmark level data.
Data on sectoral price developments is taken from the same source as the nominal data, unless
otherwise indicated. In cases where data for detailed sectors is missing, growth rates of aggregate
sectors are applied, as indicated in the table.
Sectoral VA sources
Period Sectoral data source Notes
2001-2010 Economic Bulletin, September 2012,
Bank of Tanzania
Level data used. No data on Dwellings (70) available.
The share of Dwellings (70) in Business services (J+K)
of 2000 is applied.
1998-2001 UN Official Country Data (UN OCD) Trend used. No data on Dwellings (70) available.

57
1998-2000 Economic and operations annual
report for the year 2001, Bank of
Tanzania
Share of Dwellings (70) in Business services (J+K)
used.
1992-1998 Economic and operations annual
report for the year 2001, Bank of
Tanzania
Trend used.
1976-1992 The National Accounts of Tanzania,
1976-1992 (NSI, 1993)
Trend used.
1970-1976 UN OCD Trend used. Aggregate growth rate of sectors
Government services (L,M,N) and Personal services
(O,P) applied due to lack of sectoral detail.
1964-1970 UN National Accounts Yearbook 1974
(UN YB)
Trend used. Aggregate growth rate of sectors
Government services (L,M,N) and Personal services
(O,P) applied due to lack of sectoral detail.
1960-1964 UN YB (1967) Trend used. Aggregate growth rate of sectors Trade
services (G+H) and Business services (J+K) applied
due to lack of sectoral detail.
Construction notes on Value Added Series
- No information on the sector Dwellings (70) for the period 2001-2010 is available. We
applied the share of Dwellings (70) in Business services (J+K) for the year 2000.
- Some sectors are aggregated in the 1960-1976 source data:
o 1964-1970: The sectors Government services (L,M,N) and Personal services (O,P)
are aggregated. We apply the aggregate growth rates.
o 1960-1964: The sectors Trade services (G+H) and Business services (J+K) are
aggregated. We aply the aggregate growth rates.
Employment
This section provides detailed information on the sources used to estimate the employment time
series. 0 shows an overview of the years for which census data, Labour Force Surveys (LFS) or
additional surveys are used as the benchmark level data. Interpolation methods between the
benchmark years are discussed in the construction notes.
58
Employment sources
Year Primary sources Source publication
2002 Sectoral employment levels taken from the 2002 PC report (NSI, 2006)
1988 Total employment from the 1988 PC report (NSI, 1991)
Sectoral / occupations matrix from 1990/1991 LFS (NSI, 1993)
1978 Total employment from the 1978 PC report (NSI, 1982)
Sectoral / occupations matrix from 1990/1991 LFS (NSI, 1993a)
1967 Sectoral employment levels taken from the 1967 PC report (NSI, 1971)
1960-1967 Sectoral trend from Establishment survey (ES) series used ILO Laborsta and
ILO Yearbook 1962
1960-2010 Trend used from FAO figures on Economically active population in
Agriculture
FAO
2002-2010 Trend used from ILO Estimates of employment-to-population ratios ILO E
Construction notes on employment series
- The 1978 and 1988 PC data does not contain data on the sectoral distribution of the
employed. We apply the allocation of occupations by sectors from the 1990/91 LFS to the
1978 and 1988 data on occupations.
- The figures for Business services (J+K) for benchmark year 1967 are too low in comparison
with the ES data. Therefore we used the ES data on J+K for benchmark year 1967.
- Interpolation, extrapolation and back casting is done using the following sources and
methods:
o The employment data is back casted for the period 1960-1966 using the trend from
the ES data using equation (8).
o The employment data in between the benchmark years are estimated using average
productivity growth rates between benchmark years using equation (5).
o The employment data is extrapolated using average productivity growth rates
between the nearest benchmark years using equation (9) and these values have
been normalised using the trend from ILO E using equation (11) and equation (12).
o The trend from FAO data on the economically active population in agriculture is
used for interpolation (using equation (4)), back casting (using equation (8)) and
extrapolation (using equation (7)) of the agricultural employment figures.
o The gender shares are linearly interpolated using equation (6), extrapolation and
back casting is done by assuming constant gender shares.
- The employed population refers to persons aged 15 years and older.

59

60
Zambia
Update September 2014:
We have now incorporated the 2010 Benchmark estimates from Zambia’s statistical office. See ‘Gross
Domestic Product 2010 Benchmark Estimates: Summary Report’ (published March 2014). The new
series are given for the period from 1994 onwards.
Synopsis of the main points
• Use of SNA68 for recent years in official statistics.
• Continuous official GDP data in current (and constant) prices is used for the period from
1960(1965)-1991 and 1994-2010. For the period 1991-1994 we use sectoral trends from
UNECA estimates.
• Low female coverage in early censuses (1969, 1980, 1990). We use LFS data on female
employment instead.
Introduction
Background to the National Accounts statistics of Zambia
Time series on sectoral GDP in current prices are available from 1955 onwards. At the end of the
eighties and early nineties Zambia experienced similar difficulties with its national accounting as
Tanzania (Jerven, 2009, p. 288). Structural Adjustment programs caused the informal economy to
sore while the resources of the NSI were curtailed. In Zambia this resulted in a break in the annually
estimated sectoral GDP for the years 1992 and 1993. In the nineties the data was revised (the base
year was overhauled to 1994) and new ways were found to include informal sector activity, which
caused overall GDP to rise. The latest revision was done according to the SNA68 framework and it
should therefore be noted that the methods as well as the base year are outdated.
Employment data from the Zambian population and housing censuses
Five censuses have been held in the history of post-independence Zambia: 1969, 1980, 1990, 2000
and 2010. For the recent period two labour force surveys are available (2005, 2008). All of the
censuses collected the same information on the employed population (economic activity, status,
occupation, industry) but over the years the concepts have changed slightly. The 1969 census set
the age boundary for the employed population at 15 years and above and the employed were
categorized as someone who worked for pay or profit during last week (non-agricultural activities)
or last year (agricultural activities). Much was kept the same in the 1980 census except that the age
limit was changed to 12 years and above. Furthermore, the definition of employed was changed to
having worked at least one day during last week (non-agricultural activities) or last year
(agricultural activities). The 1990 and 2000 censuses subsequently changed the reference period
and definition of employed, considered as employed in these censuses are persons who worked for
pay or profit for any time (non-agricultural activities) or at least one day (agricultural activities)

61
during last week or last year (two reference periods were used for both agricultural and non-
agricultural activities).
Under coverage of females in Zambian censuses
Despite the fact that the PC used the same methods to
categorize women as ‘home makers’ or employed there
seems to be a large undercount of women in the labour
force in earlier years (see table to the right). This could be
a cultural phenomenon (women do not report themselves
to be employed) but could also be due to insufficient
probing by the enumerator (Kpedepko and Arya 1981).
The first held LFS in 1986 reports a female employment
share of 45%, which suggests that the 1990 census undercounts female workers (Zambia, 1989).
Sectoral Value Added
This section describes the methods used to obtain continuous series of nominal sectoral value
added (VA) and the corresponding price developments in the sector. Volumes of VA in the ASD are
implicitly derived from these series by deflating the nominal data with the price deflator,
expressing the volumes in 2005 base year prices. Different sectoral data sources have been used for
different periods, according to the availability and quality of the data.
The table below shows the sectoral data sources that are used for each time period. We start in the
most recent years for which the level data is used as the benchmark source for nominal VA. For
earlier periods growth rates from the sectoral data sources are used to link the series to the
benchmark level data. Data on sectoral price developments is taken from the same source as the
nominal data, unless otherwise indicated. In cases where data for detailed sectors is missing,
growth rates of aggregate sectors are applied, as indicated in the table.
Sectoral VA sources
Period Sectoral data source Notes
2000-
2010
Monthly Bulletin of Statistics (NSI,
2013)
Level data used. All sectors available except Dwellings
(70)
1994-
2000
UN Official Country Data (UN OCD) Trend used. All sectors available except Dwellings (70)
1991-
1994
African Statistical Yearbook 1996
(ASYB)
Trend used. Used because of lack of official data.
1970-
1990
UN OCD Trend used. Data for sectors Government services
(L,M,N) and Personal services (O,P) is aggregated in this
Percentage of females in total
employment (census years)
1969 1980 1990 2000 201
0
10% 26% 34% 45% 45%

62
source. Several UN National Accounts Yearbooks were
consulted to get separate data on both sectors.
1967-
1969
UN National Accounts Yearbook 1976
(UN YB)
Trend used.
1964-
1966
UN YB (1970) Trend used. No data on prices available prior to 1965.
1960-
1963
UN YB (1966) Trend used. No data on prices available.
Construction notes on Value Added Series
- Official data is lacking for the period 1991-1994, we use UNECA sectoral estimates.
- Values for owner-occupied dwellings are missing for the entire period. In the ASD values for
dwellings are estimated using the share of Dwellings (70) in Financial services (J+K) from
Mauritius.
- The methodological notes for the current price series apply to the constant price series as
well. In addition, the following notes apply to the constant price series only:
o No deflator growth for sector other services (O,P) is available for 1966 and 1967,
here we applied the trend from Government services (L,M,N).
o Data on prices is missing for 1966, data for this year has been linearly interpolated
between 1965 and 1967. See Equation (6), with θt denoting VA data at time t in this
case.

63
Employment
This section provides detailed information on the sources used to estimate the employment time
series. The table below gives an overview of the years for which census data, Labour Force Surveys
(LFS) or additional surveys are used as the benchmark level data. Interpolation methods between
the benchmark years are discussed in the construction notes.
Employment sources
Year Primary sources Source publication
2010 Sectoral employment levels taken from 2010 PC report (NSI, 2012)
2000 Sectoral employment levels taken from 2000 PC report (NSI, 2003)
1990 Total employment to population ratio from Labour Force Survey 1986
(LFS) report
(NSI, 1989)
Sectoral distribution taken from the 1990 PC report (NSI, 1995)
1980 Total employment to population ratio from Labour Force Survey 1986
(LFS) report
(NSI, 1989)
Sectoral distribution taken from the 1980 PC report (NSI, 1985)
1969 Total employment to population ratio from Labour Force Survey 1986
(LFS) report
(NSI, 1989)
Sectoral distribution taken from the 1969 PC report (NSI, 1973)
1965-2010 Trend used from FAO series on Economically active population in
Agriculture
FAO
Construction notes on employment series
- We adjusted the 1969, 1980 and 1990 census figures because of the under coverage of
female employment activities. We assume the 1986 LFS figures on female employment to be
more credible and assumed the bulk of the ‘missing’ female employment would be in
agriculture. We applied the following method:
o Total employment was calculated by applying the 1986 LFS employment to total
population ratio to the total population figures of the 1969, 1980 and 1990 PC.
o The levels of employment for the sectors other than Agriculture (AtB) are derived
from the PC data.
o This number (the sum of employment for sectors other than Agriculture (AtB) ) was
subtracted from the total employment figure to calculate the agricultural
employment. In this way the historical sectoral structure and levels of employment
are more consistent.
- Interpolation and back casting is done using the following sources and methods:

64
o The employment data is back casted for the period 1965-1969 using average
productivity growth rates between the nearest benchmarks using equation (10).
o The employment data in between the benchmark years are estimated using average
productivity growth rates between benchmark years using equation (5).
o The trend from FAO data on the economically active population in agriculture is
used for interpolation (using equation (4)) and back casting (using equation (8)) of
the agricultural employment figures.
o The gender shares are linearly interpolated using equation (6), extrapolation and
back casting is done by assuming constant gender shares.
- No separate data on sectors Government services (L,M,N) and other services (O,P) is
available, therefore this data is aggregated.
- The employed population refers to persons aged 12 years and older.

65
References
The various sources which have been used to construct the variables in the ASD are divided in three
subsections: National Statistics Institutes, International organisations and additional literature. The
abbreviation for National Statistics Institute (NSI) in some cases refers to the Ministry of Finance or
Central Bank.
National Statistics Institutes
Botswana
NSI Botswana (2012). Stats Brief. Botswana’s National Accounts Rebased to 2006, No.2012/16
(October). Gaborone: Statistics Botswana.
NSI Botswana (1995). 1991 Population and Housing Census. Administrative and Technical Report and
National Statistical Tables. Gaborone: Central Statistics Office.
NSI Botswana (1987). 1981 Population and Housing Census. Publication Series Volume 4. Gaborone:
Central Statistics Office; Ministry of Finance and Development Planning.
NSI Botswana (1972). Report on the population census 1971. Gaborone: Republic of Botswana.
Ethiopia
NSI Ethiopia (2013), National Economic Accounts Statistics of Ethiopia. Estimates of the 2010/11
base year series (2003 Ethiopian Fiscal Year). Ministry of Finance and Economic Development
Ethiopia.
NSI Ethiopia (2010). The 2007 Population and Housing Census of Ethiopia. Addis Ababa: Central
Statistical Agency.
NSI Ethiopia (2006). Report on the 2005 National Labour Force Survey. Addis Ababa: Central
Statistical Agency.
NSI Ethiopia (1991). The 1984 Population and Housing Census of Ethiopia. Analytical Report at
National Level. Addis Ababa: Central Statistical Authority.
NSI Ethiopia (1985). Rural labour force survey. April 1981-April 1982. Addis Ababa: Central
Statistical Office.
Ghana
NSI Ghana (2012). 2010 Population and Housing Census. Summary Report of Final Results. Accra:
Ghana Statistical Service.
NSI Ghana (2010). News Brief. New Series of the Gross Domestic Product Estimates. Ghana Statistical
Service.

66
NSI Ghana (2005). Population Data Analysis Reports. Volume 2. Policy Implications of Population
Trends Data. Ghana Statistical Service.
NSI Ghana (1987). 1984 Population Census of Ghana. Demographic and Economic Characteristics.
Total Country. Accra: Statistical Service.
Kenya
NSI Kenya (various years). Economic Survey. Kenya National Bureau of Statistics, Nairobi.
NSI Kenya (various years). Kenya Facts and Figures. Kenya National Bureau of Statistics, Nairobi.
NSI Kenya (2011). Statistical Abstract 2011. Nairobi: Kenya National Bureau of Statistics.
NSI Kenya (2008). Labour Force Analytical Report. Based on the Kenya Integrated Household Budget
Survey 2005/06. Nairobi: Kenya National Bureau of Statistics.
NSI Kenya (2003). The 1998/99 Labour Force Survey Report. Nairobi: Central Bureau of Statistics;
Ministry of Planning and National Development.
NSI Kenya (2002). 1999 Population and Housing Census. Analytical Report on Labour Force Volume 9.
Nairobi: Kenya National Bureau of Statistics.
NSI Kenya (1996). Kenya Population Census 1989. Analytical Report Volume 9. Labour Force. Nairobi:
Central Bureau of Statistics; Office of the Vice-President; Ministry of Planning and National
Development.
Malawi
NSI Malawi (2010). Population and Housing Census 2008. Analytical Report Volume 10. Economic
Activity. Zomba: National Statistical Office.
NSI Malawi (2002). 1998 Malawi Population and Housing Census. Analytical Report. Zomba: National
Statistical Office.
NSI Malawi (1993). Malawi Population and Housing Census 1987. Volume III. Economic
Characteristics. Zomba: National Statistcal Office.
NSI Malawi (1980). Malawi Population Census 1977. Final Report. Zomba: National Statistical Office.
NSI Malawi (1967). Malawi Population Census 1966. Final Report. Zomba: Department of Census and
Statistics.
Mauritius
NSI Mauritius (various years). Historical Series - National Accounts. Statistics Mauritius website
http://statsmauritius.gov.mu/English/Pages/Historical-Series--National-Accounts.aspx
[accessed 2-1-2013].

67
NSI Mauritius (various years). Historical Series – Labour Force. Statistics Mauritius website
http://statsmauritius.gov.mu/English/StatsbySubj/Pages/Historical--series--labour.aspx
[accessed 2-1-2013].
NSI Mauritius (various years). Digest of Labour Statistics. Port Louis: Government Press.
NSI Mauritius (2012). 2011 Housing and Population Census Republic of Mauritius. Volume 5
Economic Characteristics. Port Louis: Government Press.
NSI Mauritius (2001). 2000 Housing and Population Census Republic of Mauritius. Volume 3
Economic Characteristics. Port Louis: Government Press.
NSI Mauritius (1994). 1990 Housing and Population Census of Mauritius. Analysis Report Volume 8
Economic Activity Characteristics and Prospects. Port Louis: Government Press.
NSI Mauritius (1987). 1983 Housing and Population Census of Mauritius. Analysis report volume 4
Economic activity. Port Louis: Government Press.
NSI Mauritius (1974). 1972 Housing and Population Census of Mauritius. Port Louis: Government
Press.
NSI Mauritius (1964). 1962 Population Census of Mauritius and its Dependencies Volume 1. Port
Louis: Government Press.
Nigeria
NSI Nigeria (various years). Central Bank of Nigeria. Statistics Database:
http://statistics.cbn.gov.ng/cbn-onlinestats/ [accessed 20-1-2013].
NSI Nigeria (2012). 2012 Quarter Two. Quarterly Statistical Bulletin, 1(2), 1-65. Central Bank of
Nigeria.
NSI Nigeria (2011). 2011 Annual Socio-Economic Report. National Bureau of Statistics.
NSI Nigeria (2010). National Manpower Stock And Employment Generation Survey. Household and
Micro Enterprise (Informal Sector). Lagos: Government Printer.
NSI Nigeria (2010). Statistical Bulletin 2010. Central Bank of Nigeria
Senegal
NSI Senegal. Comptes Nationaux 1980-2004. Senegal Agence Nationale de la Statistique
et de la Démographie website: http://www.ansd.sn/ [accessed 30-1-2013].
NSI Senegal (2007). Enquête de Suivi de la Pauvreté au Sénégal. ESPS 2005-2006. Dakar: Ministere de
l'economie, des finances et du plan, Direction de la prevision et de la statistique.
NSI Senegal (1993). Enquête sur les priorités : présentation des résultats préliminaires. Dakar:
Ministere de l'economie, des finances et du plan, Direction de la prevision et de la statistique.

68
NSI Senegal (1973). Enquête démographique nationale 1970-1971. Analyse des Resultats du 2eme
Passage Portant sur la Population Active. Dakar: Min. des Finances et des Affaires
Economiques, Direction de la Statistique.
South Africa
NSI South Africa (various years). Labour Market Dynamics in South Africa. Pretoria: Stats SA.
NSI South Africa (various years). P0441 – Gross Domestic Product (GDP). Pretoria: Stats SA.
NSI South Africa (various years). P0302 – Mid-year Population Estimates, 2013. Pretoria: Stats SA.
NSI South Africa (various years). South African Reserve Bank. Statistics – STEE series.
http://www.resbank.co.za/Research/Statistics/Pages/OnlineDownloadFacility.aspx
[accessed 25-1-2013].
NSI South Africa (2012). P0211 – Quarterly Labour Force Survey. Quarter 3, 2012. Pretoria: Stats SA.
NSI South Africa (2009). Labour Force Survey. Historical Revision September Series 2000 to 2007.
Pretoria: Stats SA.
NSI South Africa (2007). Using the 2001 Census. Approaches to analysing data. Pretoria: Stats SA.
NSI South Africa (2004). Census 2001. Primary Tables South Africa. Census '96 and 2001 compared.
Pretoria: Stats SA.
NSI South Africa (1985). Population Census 80. Economic Characteristics. Pretoria: Government
Printer.
NSI South Africa (1975). Population Census 1970. Occupations. Income, Industry and Identity.
Pretoria: The Government Printer.
NSI South Africa (1968). Population Census 6 September 1960.Volume 8, no.1 Occupations. By income,
work status, industry and identity of employer. Pretoria: Government Printer.
Tanzania
NSI Tanzania (2012). Quarterly Economic Bulletin, September 2012. Bank of Tanzania.
http://www.bot-tz.org/Publications/publicationsAndStatistics.asp?sec=Financial_Statements
[accessed 25-1-2013].
NSI Tanzania (2006). Tanzania Census 2002. Analytical Report. Volume X. Dar es Salaam: National
Bureau of Statistics; Ministry of Planning; Economy and Empowerment.
NSI Tanzania (2001). Economic and operations annual report for the year 2001. Bank of Tanzania.
http://www.bot-tz.org/Publications/publicationsAndStatistics.asp?sec=Financial_Statements
[accessed 25-1-2013].
NSI Tanzania (1993).National accounts of Tanzania 1976-1992. Dar es Salaam: Bureau of Statistics,
National Accounts Section.
69
NSI Tanzania (1993a). Tanzania Mainland. The Labour Force Survey 1990/91. Dar es Salaam: Bureau
of Statistics; President's Office; Planning Commission.
NSI Tanzania (1991). 1988 Population Census. National Profile. The Population of Tanzania. The
Analytical Report. Dar es Salaam: Bureau of Statistics; Presidents' Office; Planning
Commission.
NSI Tanzania (1982). 1978 Population Census Volume 7. Basic Demographic and Socio-Economic
Characteristics. Dar es Salaam: Bureau of Statistics; Ministry of Planning and Economic
Affairs.
NSI Tanzania (1971). 1967 Population Census. Volume 4 Economic Statistics. Dar es Salaam: Bureau
of Statistics; Ministry of Economic Affairs and Development Planning.
Zambia
NSI Zambia (2013). The Monthly. Volume 123, July. Central Statistical Office.
NSI Zambia (2012). 2010 Census of Population and Housing. Volume 11 National Descriptive Tables.
Lusaka: Central Statistical Office.
NSI Zambia (2003). 2000 Census of Population and Housing. Zambia Analytical Report. Volume 10.
Lusaka: Central Statistical Office.
NSI Zambia (1995). Census of Population, Housing and Agriculture 1990. Volume 10. Zambia
Analytical Report. Lusaka: Central Statistical Office.
NSI Zambia (1989). Labour Force Survey 1986. Lusaka: Central Statistical Office.
NSI Zambia (1985). 1980 Census of Population and Housing. Volume 2 part 1. Socio-Economic Tables.
Lusaka: Central Statistical Office.
NSI Zambia (1973). Census of Population and Housing 1969. Final Report Volume 1 - Total Zambia.
Lusaka: Central Statistical Office.
Data from international organisations
International Labour Organisation (ILO)
ILO Laborsta Internet: http://laborsta.ilo.org.
ILO Estimates of Employment to Population Ratios, available through KILM (7th edition):
http://www.ilo.org/empelm/what/WCMS_114240/lang--en/index.htm .
ILO (various years). Yearbook of Labour Statistics. Geneva: ILO.

70
Food and Agriculture Organisation of the United Nations (FAO)
Data on the Economically Active Population in Agriculture from:
FAOSTAT: http://faostat3.fao.org/home/index.html
FAO (various years). Statistical Yearbook. Rome: FAO.
United Nations
UN Statistics Division (various years). National Accounts Official Country Data
www.data.un.org .
UN Statistics Division (various years). National Accounts Estimates of Main Aggregates
www.data.un.org.
UN Statistics Division (various years). UNSD Demographic Statistics
www.data.un.org.
UN Statistics Division (various years). Yearbook of National Accounts Statistics. New York: UN.
UN Economic Commission for Africa (various years). African Statistical Yearbook. Tunis: African
Development Bank Group.
Other
Maddison, A. (2009). Historical Statistics of World Economy, 1-2006 AD 2009.
UN Economic Commission for Africa. African Integrated Census Micro data
http://ecastats.uneca.org/aicmd/en-us/home.aspx
The World Bank (2011). Africa Development Indicators
http://data.worldbank.org/data-catalog/africa-development-indicators
Additional literature
Abegaz, B. (1983). The Structure of Employment and Earnings in the Early Stages of Urbanization.
The Case of Ethiopia. African Urban Studies, 15, 41-58.
Abegaz, B. (1985). Papers in Ethiopian Demography III. Labor Force Structure, Migration and
Poverty. Northeast African Studies, 7(3), 4969.
Adeyink, A., Salau, S., & Vollrath, D. (2012). Structural Change in Nigeria. 1-34. Mimeo.
Anker, R. and Knowles, J.C. (1983). Population Growth, Employment and Economic-Demographic
Interactions in Kenya. Bachue-Kenya. New York: ILO World Employment Programme.

71
Altman, M. (2008). Revisiting South African Employment Trends in the 1990s. South African Journal
of Economics, 127-147.
Chikoti, L., Siwinda, P., Brændvang, A.-K., & Simpson, L. H. (2011). The National Accounts for Malawi
The Effect on GDP Of Integrating Supply and Use Tables in the National Accounts And the
Requirements for Periodically Main Revisions. International Conference on Measuring National
Income, Wealth, Poverty and Inequality in African Countries. Cape Town.
Daniela Casale, C. M. (2004). 'Two Million Net New Jobs.' A Reconsideration of the Rise in
Employment in South Africa. 1995-2003. The South African Journal of Economics, 978-1002.
Diop, L. (1973). Sénégal. Comptes économiques 1959 à 1968. Dakar: Min. des Finances et des Affaires
Economiques: Direction de la Statistique.
Egerö, B., & Henin, R. A. (1973). The population of Tanzania. An analysis of the 1967 population
census. Dar es Salaam: Bralup.
Eke, I. (1966). The Nigerian National Accounts. A Critical Appraisal. Nigerian Journal of Economic
and Social Studies, 8, 333-359.
Ewusi, K. (1986). Statistical Tables on the Economy of Ghana 1950-1985. Legon. Institute of
Statistical, Social and Economic Research, University of Ghana.
Gemechu, H. (2010) Ethiopia: The propaganda of high growth and the state of economic data in
Ethiopia (http://www.ethioguardian.com/news.php?extend.4143 [accessed 6-3-2013]).
Jerven, M. (2010). Accounting for the African growth miracle. The official evidence. Botswana 1965-
1995. Journal of Southern African Studies, 36(1), 73-95.
Jerven, M. (2011). Controversy, facts and assumptions. Long term growth in Nigeria. Simons Papers
in Security and Development (13), 3-38.
Jerven, M. (2011a). Growth, Stagnation or Retrogression? On the Accuracy of Economic
Observations, Tanzania 1961-2001. Journal of African Economies, 377-394.
Jerven, M. (2011b). Revisiting the Consensus on Kenyan Economic Growth. Journal of Eastern
African Studies, 5(1), 2-23.
Jerven, M. (2009). Random Growth in Africa? Lessons from an Evaluation of the Growth Evidence
on Botswana, Kenya, Tanzania and Zambia, 1965-1995. Journal of Development Studies, 46(2),
274-294.
Kpedekpo, G.M.K. and Arya, P.L. (1981). Social and Economic Statistics for Africa. Their Sources,
Collection, Uses and Reliability. London.
Lange, A. R. (1979). Employment and income in South Africa. Trends and projections. Johannesburg:
Dept. of Applied Mathematics, University of the Witwatersrand.

72
National Economic Council Nigeria (1959). Economic Survey of Nigeria 1959. Lagos: Federal
Government Printer.
Nigerian Manpower Board (1972). Labour Force Sample Survey 1966/67. Manpower Studies No.11.
Okigbo, P. N. (1962). Nigerian National Accounts 1950-57. Enugu: Government Printer.
Olayide, S. O. (1976). Economic Survey of Nigeria 1960-1975. Ibadan: Aromolaran Publishing
Company.
Okafor, R., Adeleke, I., Oparac, A. (2007). An Appraisal of the Conduct and Provisional Results of the
Nigerian Population and Housing Census of 2006. Proceedings of the American Statistical
Association.
Peacock and Dosser, A. T. (1958). The national income of Tanganyika 1952-54. London: Colonial
Office.
Prest, A. R., & Steward, I. G. (1953). The National Income of Nigeria 1950-1951. London: Colonial
Research Studies.
Prinsloo, J. a. (2002). Decentralised implementation of the 1993 system of national accounts: South
Africa’s experience. South African Reserve Bank Quarterly Bulletin, 223, 76-88.
Pryor, F. L. (1988). Income Distribution and Economic Development in Malawi. Some Historical
Statistics. Washington: The World Bank.
Ray, R.S. (1966). Labour Force Survey of Tanzania. Dar es Salaam.

73
ASIA

74
China
GDP and employment data by broad sectors (agriculture, industry, and services) match those from the
China Statistical Yearbook 2012 for the period from 1978 onwards. More detailed data is obtained from
various sources discussed in detail below.
Value added at current prices
- World Input-Output Database (WIOD), Socio-economic accounts for the year 1995-2009
- Trends from China statistical yearbook (edition 2012) for 2010 and 2011. Trend in the more aggregated
industry sector is used for mining, manufacturing, and public utilities. For other sectors, detailed data is
available.
- Trends from dataset presented by de Vries et al. (2012) for 1987-1994
- Trends from China statistical yearbook (edition 2012) for 1978 – 1987. Trend in the more aggregated
industry sector is applied to mining, manufacturing, and public utilities. For other sectors, detailed data
is available.
- Trends from Holz (2006) for 1952-1977. Trend in the more aggregated industry sector is used for
mining, manufacturing, and public utilities. For other sectors, detailed data is available.
Value added at constant prices
- WIOD Socio-economic accounts for the year 1995-2009
- Trends from China statistical yearbook (edition 2012) for 2010. Trend in the more aggregated industry
sector is used for mining, manufacturing, and public utilities. Also same trend for sector L,M,N and other
social and household services (O,P) is used. For other sectors, detailed data is available.
- Trends from dataset presented by de Vries et al. (2012) for 1987-1994
- Trends from China statistical yearbook (edition 2012) for 1978 – 1987. Trend in the more aggregated
industry sector is used for mining, manufacturing, and public utilities. Also same trend for sector L,M,N
and other social and household services (O,P) is used. For other sectors, detailed data is available.
- Trends from Holz (2006) for 1952-1977. Trend in the more aggregated industry sector is used for
mining, manufacturing, and public utilities. Trend for services activities is used for all services sectors
distinguished.
Employment
- WIOD Socio-economic accounts for the year 1995-2009

75
- Trends from China statistical yearbook (edition 2012) for 2010. Trend in the more aggregated industry
sector is used for mining, manufacturing, and public utilities. For other sectors, detailed data is available.
- Trends from dataset presented by de Vries et al. (2012) for 1987-1994
- Trends from China statistical yearbook (edition 2012) for 1978 – 1987. Trend in the more aggregated
industry sector is used for mining, manufacturing, and public utilities. For other sectors, detailed data is
available.
- Trends from Holz (2006) for 1952-1977. Trend in the more aggregated industry sector is used for
mining, manufacturing, and public utilities. Trend for services activities is used for all services sectors
distinguished.
References
Holz, C.A. (2006), "Measuring Chinese Productivity Growth, 1952-2005", version 22 july 2006.
de Vries, G. J., A. A. Erumban, M. P. Timmer, I. Voskoboynikov, H. Wu (2012) “Deconstructing the BRICs:
Structural Transformation and Aggregate Productivity Growth”. Journal of Comparative Economics, vol.
40(2), pages 211-227.
Hong Kong
Gross Domestic Product in Constant Prices
Sources:
- Figures on GDP for the period 1961-1999 for the total economy from Census and Statistics
Department, “Estimates of GDP”, various issues. Supplemented with production indices from ADB,
SDBS and price indices from Census and Statistics Department, “Hong Kong Annual Digest of
Statistics”, various issues, linked in 2000
- 2000-2011: Census and Statistics Department Hong Kong (2010 prices).
Notes:
- Only GDP at constant Market Prices calculated from the expenditure side for the total economy is
available (up to 1999). In order to derive sectoral GDP in constant 1990 prices we used a 3-step
procedure. First we applied the real growth rate of GDP at market prices from the expenditure side to

76
1990 sectoral sum in current prices. Second, we estimated constant price series for each sector
separately. For Agriculture (1979-96), an index of agricultural production was used. Other years were
derived by applying a growth rate derived by deflating current series by the CPI (for middle incomes)
for foodstuffs. For manufacturing and mining, the manufacturing production index for 1982-1996
was applied to 1990 current GDP. Other years were derived by applying a growth rate derived by
deflating current series by the average CPI (for middle incomes) for foodstuffs and clothing and
footwear. For other sectors, current series were deflated by various appropriate components of the
CPI. Lastly, we controlled for total by scaling the sectoral series for each year by the difference
between sectoral sums derived in step 2 and total GDP derived in step 1.
Gross Domestic Product by Industry in Current Prices
Sources:
- 1970-1978 From Census and Statistics Department, “Estimates of GDP, 1966 to 1980”, Hong Kong,
linked in 1979 to
- 1979 ADB, Key Indicators 2002
- 1980-1999 from Census and Statistics Department, “Estimates of GDP”.
- 2000-2011: Census and Statistics Department Hong Kong (2010 prices).
Notes:
- Figures given are at factor cost
- Figures before 1980 are not strictly comparable with those of 1980 onwards. The former are
income-based estimates whereas the latter are production-based estimates.
- Ownership of dwellings is included in finance, insurance and real estate.
- Government services is included in Community, Social and Personal Services
Number of Persons Employed by Industry
Sources:
- 1974-76 trend from Census and Statistics Department, “Hong Kong Annual Digest of Statistics”,
1981, Hong Kong, applied to 1976
- 1976 from by-census of 1976 as published in Census and Statistics Department, "Hong Kong
Annual Digest of Statistics", 1981.
- 1981 from Census and Statistics Department, Hong Kong 1981 Census Basic Tables.
- 1985-2005 from ILO, Laborstat.

77
- 2001-2011: Sectoral trend used from a Labour Force Survey, as taken from ILO’s Key Indicators of the
Labour Market 7th
edition.
Notes:
- Periods between 1976, 1981 and 1985 are based upon exponential trend.
- Figure for Construction for 1974 and 1975 was estimated using trend in Manufacturing.
- Agricultural employment for 1974 and 1975 based on annual trend for 1976-81.
- Update 2011: Sectoral data from Hong Kong Monthly Digest of Statistics 2007 and 2011 issues
applied as new benchmark data. Shares from 2005 used to estimate the breakdown of AtB and C in
2006-2010. Public administration data is now is included in the series. Growth rates from older series
have been used to extrapolate from 2001.

78
India
Gross Domestic Product in Constant Prices
Sources:
- 1950-79 trend in 1980/81 prices from CSO, National Accounts Statistics (NAS), Disaggregated
Statements, 1950/51-1979/80;
- 1980-92 trend in 1980/81 prices from CSO, NAS, various issues., linked in 1993
- 1993-1994 in 1993/94 prices from ADB, Key indicators of developing Asian and Pacific countries
2006.
- 1995-2009: WIOD Socio Economic Accounts, February 2012 release.
- 2009-2011: Sectoral trend from the Ministry of Statistics and Programme Implementation.
Notes:
- Figures given are at 1993/94 factor cost
- 1950 refers to fiscal year 1950/51 etc.
CSO has revised its national accounts in 1999. These revisions include: 1. Better estimation of
unregistered activities, 2. Inclusion of new products, 3. Improvement in coverage of existing products,
and 4. Methodological improvements. In practice GDP in 1993 was revised upwards by about 9 per
cent. However, growth rates generally remained unchanged. (see Economic and Political Weekly, New
Series of National Accounts Statistics, April 3-9, 1999).
Gross Domestic Product by Industry in Current Prices
Sources:
- 1950-1987 trend from National accounts statistics, CSO, National Accounts Statistics (NAS), various
issues, linked in 1993.
- 1988-1994 ADB, Key indicators of developing Asian and Pacific countries 2006
- 1995-2009: WIOD Socio Economic Accounts, February 2012 release.
- 2009-2011: Sectoral trend from the Ministry of Statistics and Programme Implementation.
Notes:
- at factor costs
- 1950 refers to fiscal year 1950/51 etc.
- CSO has revised its national accounts in 1999. These revisions include: 1. Better estimation of
unregistered activities, 2. Inclusion of new products, 3. Improvement in coverage of existing products,
and 4. Methodological improvements.
The data for 1992 and backwards have been upscaled, using the ratio between 1993 (unrevised) and
1993 (revised). In practice GDP in 1993 was revised upwards by about 9 per cent (note that this
differs considerably between sectors). However, growth rates generally remained unchanged. (see
Economic and Political Weekly, New Series of National Accounts Statistics, April 3-9, 1999).

79
Number of Persons Employed by Industry
Sources:
- 1960, 1970 and 1980 from Van Ark, "Long Term Economic Stagnancy in 20th Century India",
University of Groningen, 1987, mimeographed.
- 1991on basis of CSO, Census of India 1991
- 1991-1994 trends for all sectors (except for agriculture 1991-2001) from CSO, Labour-related
establishment survey, various issues as, given in ILO, Labour statistics database, January 2003,
applied to 1991.
- 1995-2009: WIOD Socio Economic Accounts, February 2012 release.
- 2010: Annual average labour productivity growth between 2008/2009 held constant for 2009/2010
and applied to 2010 volume data.
Notes:
- For 1991 public utilities separated from manufacturing, and FIRE from other services, using data for
organised sector from Ministry of Finance, Economic survey 1994/95, assuming these sectors consist
only of organised sector.
- Figures for years between 1960-1970, 1970-1980 and 1980-1991 are estimated by using sectoral
average labour productivity growth rates for these periods. For agriculture the average growth rate of
employment was taken.
- Employment estimates for 1992-2000 are intrapolated using the sectoral employment growth rates
from the labour-related establishment survey. These sectoral growth rates from the establishment
survey are moderated upon the sectoral employment growth rates from the 1991 and 2001 census.
- Agriculture 1992-2004 using average growth rate of period 1991-2001.
- Total employment from GGDC, Total economy database.

80
Indonesia
Gross Domestic Product in Constant Prices
Sources:
- 1960-71 trend in 1960 prices from BPS, National Income, various issues linked in 1971
- 1971-83 trend in 1973 prices from BPS, National Income, various issues, linked in 1983
- 1983-88 trend in 1983 prices trend from BPS, National Income, various issues, linked in 1988
- 1988-1994 trend in 1993 prices from ADB SDBS dataset, March 1999 (new series).
- 1995-2009: WIOD Socio Economic Accounts, February 2012 release.
- 2009-2011: Sectoral trend from the Central Bank of Indonesia.
Notes:
- Figures given are at 2000 market prices
- For 1960-71 Government services included Community etc. services
- Trend for 1988 and earlier in Community etc. services includes business services.
- BPS has revised national accounts in 1993. The new series have some methodological refinements
and a sectoral reclassification. Total GDP in 1993 was increased by about 9%. Revisions back to 1988
have been published. Most important reclassification involved the transfer of ownership of dwellings
into finance, insurance and real estate services. Also in the new series business services, which were
included in other private services in the old series, were moved to FIRE.
Gross Domestic Product by Industry in Current Prices
Sources:
- 1966-1988 trend from BPS, National Income, various issues linked in 1988
- 1988-1994 from CBS, Official Communication, 9 April 1999
- 1995-2009: WIOD Socio Economic Accounts, February 2012 release.
- 2009-2011: Sectoral trend from the Central Bank of Indonesia.

81
Notes:
- Figures given at market prices
- Trend for 1988 and earlier in Community, Social and Personal Services includes business services.
- BPS has revised national accounts in 1993. The new series have some methodological refinements
and a sectoral reclassification. Total GDP in 1993 was increased by about 9%. Revisions back to 1988
have been published. Most important reclassification involved the transfer of ownership of dwellings
into finance, insurance and real estate services. Also in the new series business services, which were
included in other private services in the old series, were moved to FIRE.
Number of Persons Employed by Industry
Sources:
- 1961, 1971 and 1980 from Hugo et all, The Demographic Dimension in Indonesian Development
(1987), Table 8.7, based on Population Censuses
- 1990 from Hill 1996, Table 2.2, based on 1990 Population Census.
- Trends for 1989-94 from ILO, Yearbook of Labour statistics, various issues, applied to 1990.
- 1995-2009: WIOD Socio Economic Accounts, February 2012 release.
- 2009-2012: Sectoral trend from a Labour Force Survey, derived from Statistics Indonesia.
Notes:
There are a number of sources on labour force statistics but they lack consistency due to differences
in concepts, procedures, seasonal timing etc (see Hugo et all, 1987). This especially effects the number
of workers reported in agriculture and trade. Therefore we choose to rely solely on population
censuses to maximise intertemporal consistency, and apply trends from the labour force survey to
these benchmarks. Population census have been held in 1961, 1971, 1980 and 1990.
- 1989 and 1991-94, 1996-97 by applying growth rates from ILO, Yearbook of Labour statistics,
various issues (which uses figures based on labour force surveys) to 1990 population census
benchmark.
- in 1995 no labour force survey was held. An average of 1994 and 1996 is taken instead.
- 1980 split for manufacturing and public utilities, and for finance and community etc. services based
on shares for 1980 from ILO, Yearbook of Labour Statistics.

82
- 1990 split for mining and public utilities, and for finance and community etc. services based on
shares for 1990 from ILO, Yearbook of Labour Statistics.
- Figures for years between 1971-1980 and 1980-1989 are estimated by using sectoral average
labour productivity growth rates for these periods.

83
Japan
Gross Domestic Product in Constant Prices
Sources:
- 1953-1969 growth rates for all sectors, except Community, Social and Personal Services and
Government Services, from Pilat (1994).
- 1970-1994 growth rates from EPA, annual report on national accounts
- 1995-2009: WIOD Socio Economic Accounts, February 2012 release.
- 2009-2011: Sectoral trend from the The Cabinet Office, Japan.
Notes:
- Figures given are at 2000 market prices
- Figures for 1953 and 1954 are based upon the old 1953 SNA and therefore not completely
comparable
- 1953-1960 trend for Community, Social and Personal Services and Government Services combined
from Pilat (1994) was used for both individual series
Gross Domestic Product by Industry in Current Prices
Sources:
- 1953-1969 growth rates for all sectors, except Community, Social and Personal Services and
Government Services, from Pilat (1994)
- 1970-1994 growth rates from EPA, annual report on national accounts
- 1995-2009: WIOD Socio Economic Accounts, February 2012 release.
- 2009-2011: Sectoral trend from the The Cabinet Office, Japan.
Notes:

84
- Figures given are at Market Prices
- Figures for 1953 and 1954 are based upon the old 1953 SNA and therefore not completely
comparable
- 1953-1960 trends for Community, Social and Personal Services and Government Services combined
from Pilat (1994) was used for both individual series
Number of Persons Employed by Industry
Sources:
- 1953-1954 growth rates from Ohkawa, Shinohara & Meisner (1979)
- 1955-1970 growth rates from Economic Planning Agency, Report on National Accounts from 1955-
1989, Tokyo, October 1991;
- 1971-1980 growth rates from EPA, Annual Report on National Accounts, 1997.
- 1981-1994 trend from OECD STAN database May 2003.
- 1995-2009: WIOD Socio Economic Accounts, February 2012 release.
- 2009-2012: Sectoral trend from a Labour Force Survey, as taken from Statistics Japan.
Notes:
- Business services are included in Community, Social and Personal Services and not in FIRE.

85
Malaysia
Gross Domestic Product in Constant Prices
Sources:
- 1970-77 at 1970 prices from United Nations, National Accounts Statistics, various issues, linked in
1978
- 1978-86 at 1978 prices from United Nations, National Accounts Statistics, various issues, linked in
1987
- 1987-2005 at 1987 prices from ADB.
- 2005-2011: Department of Statistics Malaysia (2000 prices).
Notes:
- Figures in 1987 market prices
- For 1987-2001, owner-occupied dwellings are included in community etc. services in the original
source. This has been reallocated to FIRE using ADB, SDBS, March 1999 and UN, National Accounts
Statistics.
Gross Domestic Product by Industry in Current Prices
Sources:
- 1970, 1973 and 1978 from United Nations, National Accounts Statistics, various issues.
- 1987-2005 from ADB.
- 2005-2011: Department of Statistics Malaysia (2000 prices).
Notes:
- Figures are given at market prices
- Figures in between 1970, 73, 78, 87 were intrapolated.
- For 1987-2001, owner-occupied dwellings are included in community etc. services in the original
source. This has been reallocated to FIRE using ADB, SDBS, March 1999 and UN, National Accounts
Statistics.

86
Number of Persons Employed by Industry
Sources:
- 1975-79 and 1981-84 figures for agriculture, mining, manufacturing and other sectors aggregated
from Asian Development Bank, "Key Indicators of developing Asian and Pacific countries", 1996.
- 1980 all sectors from Department of Statistics, “Monthly Statistical Bulletin of Malaysia”, 1994.
- 1985-96 from United Nations 'Statistical Yearbook for Asia and the Far East', various issues.
- 1996-2001 growth rates from ILO, Labour statistics database
- 2001-2009, 2010-211: Sectoral trend from a Labour Force Survey, as taken from the Department of
Statistics Malaysia.
- 2009-2010: Asian Development Bank Key Indicators 2012
Notes:
- For 1975-1979 only total of all sectors, excluding agriculture, mining and manufacturing, is given in
source. Controlling for this total, we distributed across the various sectors assuming identical sectoral
labour productivity growth rates.
- For 1981-1984 only total of all sectors, excluding agriculture, mining and manufacturing, is given in
source. Controlling for this total, we distributed across the various sectors using average productivity
growth in each sector for the period 1980-85.
- The ILO and ADB databases figures are based on figures from one survey month only, rather than
two or more rounds as the other sources. Hence only trends from these sources should be used.
- For 1996-2000 total of community, social and personal services and government services is given in
source. Controlling for this total, we distributed across the various sectors using average productivity
growth in each sector for the period 1995-2000.
- For 2001 Sectoral weights from 2000 have been used in order to calculate the employment data for
2001 for Public Utilities, Construction, Trade, T&C, FIRE, CSPS and Government Services

87
Philippines
Gross Domestic Product in Constant Prices
Sources:
- 1971-1975 at 1975 prices taken from a publication of the Asian Productivity Organization:
"Comparative information on productivity levels and changes in APO member countries", january
1986. Linked in 1975.
- 1975-1981 at 1972 prices from Philippine Statistical Yearbook, 1990. Linked in 1981.
- 1981-1997 at 1985 prices from National Statistical Coordination Board. Linked in 1997.
- 1998-2010: Sectoral trend from UN National Accounts Official Country Data.
- 2010-2012: Philippine Statistics Authority, National Statistics Office (2000 prices).
Notes:
- Figures in 1985 market prices.
- Update 2011: Revised series for 1998-2010 (2000 prices) used as new benchmark data. Shares for
dwellings were computed with 1998-2008 data from the National Statistical Coordination Board.
Growth rates from older data were used for data on 1971-1997.
Gross Domestic Product by Industry in Current Prices
Sources:
- 1971-1975 trend from a publication of the Asian Productivity Organization: "Comparative
information on productivity levels and changes in APO member countries", january 1986. Linked in
1975.
- 1975-1981 trend from Philippine Statistical Yearbook, 1990. Linked in 1981.
- 1981-1998 trend from National Statistical Coordination Board.
- 1998-2010: Sectoral trend from UN National Accounts Official Country Data.
- 2010-2012: Philippine Statistics Authority, National Statistics Office (2000 prices).
Notes:

88
- Figures are given at market prices
- Update 2011: Revised series for 1998-2010 used as new benchmark data. Shares for dwellings were
computed with 1998-2008 data from the National Statistical Coordination Board. Growth rates from
older data were used for data on 1971-1997.
Number of Persons Employed by Industry
Sources:
- 1971-1987 trend from Philippine Statistical Yearbook 1990, NSO, linked in 1988.
- 1988-2000 trend from ILO, labour statistics, linked in 2000.
- 2001-2004 from Bureau of Labor and Employment Statistics, june 2003.
- 2005 growth rates from ADB, Key Indicators 2006
- 2001-2012: Sectoral employment from a Labour Force Survey, as taken from the Philippine Statistics
Authority, National Statistics Office.
Notes:
- Figures from Bureau of Labor and Employment Statistics refer to annual average, ILO figures refer to
fourth quarter of each year.
- Growth rate for 2000-2001 from ILO, which is based on 4th quarter, was implausible high. Instead
estimate based on first three quarters has been used, based on data from National Statistics Office in
PIDS-database.
- ILO data for period 1999-2001 are based on 1995 population census projections. Data for 1988-
1998 are based on 1980 census. Growth rate for 1998-1999 based on 1980 census has been used to
resolve the break. This data was derived from National Statistics Office in PIDS-database. The
difference between the level of employment for 1999 based on 1980 and 1995 census was about
4.5%.
- For 1971-2000, hotels and restaurants were included in community etc. services in the original
sources. This has been reallocated to Wholesale and Retail using average shares for period 2001-2002
from Bureau of Labor and Employment Statistics.
- UPDATE 2011: 2006-2010 Labor Force Survey data used as new benchmark data. Growth rates from
older 2001-2005 LFS data used because of a change in definitions. Older existing employment data
were used to compute growth rates in order to complete the series.

89
Singapore
Gross Domestic Product in Constant Prices
Sources:
-1960-1989 growth rate from Singapore Statistics, National Accounts, various issues
-1990-1998 growth rate from ADB, Key Indicators 2006
- 1999-2009: Sectoral trend from 2010 and 2011 issues of Statistical Yearbook of Singapore, from
Singapore Statistics.
- 2009-2012: Singapore Statistics (2005 prices).
Notes:
- Estimates given at 2000 basic prices
- Sectoral estimates for 2000 and 2001 in the ADB Key Indicators 2006 do not provide detail for
agriculture and mining (aggregate for both is presented), trade, and financial services (aggregate for
both is presented). The current price sectoral shares from unrevised Singapore statistics for 2000 and
2001 are used to break down these aggregates.
- Government services is included in community and other services
- Update 2011: New 2005 prices series token from the Singapore Statistical Yearbooks editions 2010
and 2011. Growth rates from older series used to go back in time before 2005.
Gross Domestic Product by Industry in Current Prices
Sources:
- 1960 from Department of Statistics, ”Singapore National Accounts”, Singapore, 1975,
- 1970-1988 growth rate from Department of Statistics, ”Singapore National Accounts”, Singapore,
1987 and Department of Statistics, ”Yearbook of Statistics Singapore’, 1991, linked in 1990
-1989-1999 growth rate from ADB, Key Indicators 2006

90
- 1999-2009: Sectoral trend from 2010 and 2011 issues of Statistical Yearbook of Singapore, from
Singapore Statistics.
- 2009-2012: Singapore Statistics (2005 prices).
Notes:
- Estimates given at basic prices
- Government services is included in community and other services
- Sectoral estimates for 2000 and 2001 in the ADB Key Indicators 2006 do not provide detail for
agriculture and mining (aggregate for both is presented), trade, and financial services (aggregate for
both is presented). The current price sectoral shares from unrevised Singapore statistics for 2000 and
2001 are used to break down these aggregates.
- Update 2011: The Singapore Statistical Yearbooks 2010 and 2011 provided data for new sectoral
series (1999-2010). The last two editions give radically different figures on AtB+C, hence they’re used
to compile new benchmark series. To break down the AtB+C aggregates shares from 1998 were used
(see above).
Number of Persons Employed by Industry
Sources:
- 1971 and 1972 growth rate from Yearbook of Statistics, Singapore 1972/73, Department of
Statistics, linked in 1970 to
- 1970 and 1973-1981 growth rate from Department of Statistics, “Economic and Social Statistics
Singapore, 1960-1982” Singapore, linked in 1981 to
- 1981-1989 growth rate from Department of Statistics, ”Yearbook of Statistics Singapore”, various
issues.
1990, 1995, 2000, 2005 from Population Census (Published in Yearbook of Statistics of Singapore,
2006).
- 1990-2001 from ILO, Labour statistics.
- 2002-2011: Sectoral trend from a Labour Force Survey, as taken from Employment Statistics, Ministry
of Manpower.
.
Notes:

91
- Community etc. services include government services and employment not allocated by industry.
- Years between censuses are interpolated with the growth rate from the labour force survey (as
publicly available from ILO).
- Update 2011: Firstly, new totals for 2002-2010 from the Ministry of Manpower labor statistics were
added. Because of a break in series in 2006/2007, growth rates for the years prior to 2007 were used.
Annual sectoral change data was used to compute sectors and subsequently normalized with new
totals.
South Korea
Gross Domestic Product in Constant Prices
Sources:
- 1953-1970 in 1985 prices from D. Pilat, "The Economics of Catch Up: the Experience of Japan and
Korea, Groningen Growth and Development Centre, 1993". linked in 1970
- 1970-1994 in 1995 prices from Bank of Korea, “National Accounts”
- 1995-2009: WIOD Socio Economic Accounts, February 2012 release.
- 2009-2011: Sectoral trend from the The Bank of Korea.
Notes:
- Figures given are at 1995 Market Prices.
- Figures for 1953-70 based upon the old 1953 SNA and therefore not completely comparable
- Government services is included in community and other services
Gross Domestic Product by Industry in Current Prices
Sources:
- 1953-1970 trend from D. Pilat, "The Economics of Catch Up: the Experience of Japan and Korea,
Groningen Growth and Development Centre, 1993". linked in 1970
- 1970-1994 from Bank of Korea, “National Accounts”
92
- 1995-2009: WIOD Socio Economic Accounts, February 2012 release.
- 2009-2011: Sectoral trend from the The Bank of Korea.
Notes:
- imputation for owner occupied dwellings based on shares in current prices
- Figures are at market prices.
- Figures for 1953-70 based upon the old 1953 SNA and therefore not completely comparable
- Government services is included in community and other services
- imputation for owner occupied dwellings based on shares derived from benchmark input-output
tables 1970-1995, Bank of Korea. Intermediate years intrapolated.
Number of Persons Employed by Industry
Sources:
- 1963-86 from Pilat 1994, "The Economics of Rapid Growth: the Experience of Japan and Korea”,
originally from EPB, Annual Report on the Economically Active Population Survey, Seoul, various
issues.
- 1987-1994 EPB, “Annual Report on the Economically Active Population Survey”, Seoul, various
issues.
- 1995-2009: WIOD Socio Economic Accounts, February 2012 release.
- 2009-2010: Sectoral trend from a Labour Force Survey, as taken from ILOStat.
Notes:
- Government services included Community etc. services
93
Taiwan
Gross Domestic Product in Constant Prices
Sources:
- 1961-1980 growth rate from Directorate-General of Budget, Accounting and Statistics, “Statistical
Abstract of National Income in Taiwan Area of the Republic of China, March 2000", complemented
with DGBAS, “National Income in Taiwan Area,” 1994 and 1999.
- 1981-1994 from National Statistics Taiwan
- 1995-2009: WIOD Socio Economic Accounts, February 2012 release.
- 2009-2012: Sectoral trend from National Statistics, Republic of China (Taiwan).
Notes:
- Figures given are at 2001 Market Prices.
- Community, social and personal services include other private producer of services
- Total GDP includes all industries plus GDP less imputed bank service charges plus import duties plus
value added tax (existing since 1986).
- For 1961-88, community, social and personal services estimated by applying growth rates in 1991
prices from DGBAS , “National Income in Taiwan Area, 1994”.
Gross Domestic Product by Industry in Current Prices
Sources:
- 1951-1980 from Directorate-General of Budget, Accounting and Statistics, “Statistical Abstract of
National Income in Taiwan Area of the Republic of China, March 2000", complemented with DGBAS,
“National Income in Taiwan Area,” 1994 and 1999.
- 1981-1994 from National Statistics Taiwan
- 1995-2009: WIOD Socio Economic Accounts, February 2012 release.
- 2009-2012: Sectoral trend from National Statistics, Republic of China (Taiwan).

94
Notes:
- Figures are given at Market Prices.
- Community, social and personal services include other private producer of services. Taken from
DGBAS, “National Income in Taiwan Area,” 1994 and 1999.
- Total GDP includes all industries plus GDP less imputed bank service charges plus import duties plus
value added tax (existing since 1986).
Number of Persons Employed by Industry
Sources:
- 1963-1965 trends from Directorate-General of Budget, Accounting and Statistics, "Statistical
Yearbook of the Republic of China, 1982" applied to 1965
- 1965-1977 from Directorate-General of Budget, Accounting and Statistics, Statistical Yearbook of the
Republic of China, 1993 and 1999
- 1978-1994 from Directorate-General of Budget, Accounting and Statistics, "Monthly Bulletin of
Manpower Statistics, Taiwan Area”, various issues.
- 1995-2009: WIOD Socio Economic Accounts, February 2012 release.
- 2009-2012: Sectoral trend from a Labour Force Survey, as taken from National Statistics, Republic of
China (Taiwan).
Notes:
- For the years 1963-1977 separate figures for Community services and Government services are not
given. We assumed identical labour productivity growth rates in both sectors and controlled for
combined employment.

95
Thailand
Gross Domestic Product in Constant Prices
Sources:
- 1946-1950 trend in 1972 prices from Vanderveen, 1987, 'Postwar Economic Growth and Structural
Change in Thailand', linked in 1951
- 1951-1959 trend in 1956 prices from NESDB, National Income of Thailand, 1951-63, linked in 1960
- 1960-1969 trend in 1962 prices from NESDB, National Income of Thailand, 1960-75, linked in 1970
- 1970-1979 trend in 1972 prices from NESDB, National Income of Thailand, 1970-90, linked in 1980
- 1980-1992 from NESDB, National Income of Thailand, 1980-96
- 1993-2011: National Economic and Social Development Board, Thailand.
Notes:
- Estimates at 1988 Market Prices.
- The figures after 1970 were based on a different industrial classification in which simple agricultural
processing products had been taken away from the manufacturing sector and put under the
agricultural sector. We retain the industrial classification used for the post-1970 figures. (NB This is in
contrast with Office of the National Economic and Social Development Board, National Income of
Thailand, 1951-1996, 1999, in which this break is not resolved).
- Ownership of dwellings is included in FIRE.
- In the National accounts, hotels and restaurants are included in services. This industry is reallocated
to trade. Since ADB Key Indicators does not provide detailed estimates of value added in hotels and
restaurants, we used historical national income estimates and extrapolated the sectoral estimates
with growth rates from the ADB Key indicators.
- Update 2011: Revised data comes from ADB key indicators 2011, which has been used to compute
growth rates up to 2010. Hotels and Restaurants (H) as an industrial sector is missing in this series,
and is included in ‘Others’. Sectoral data from NESDB 2009 has been used to compute the share of this
sector.
Gross Domestic Product by Industry in Current Prices
Sources:

96
- 1951-1959 trend from NESDB, National Income of Thailand, 1951-63, applied to 1960
- 1960-1969 trend from NESDB, National Income of Thailand, 1960-75, applied to 1970
- 1970-1979 trend from NESDB, National Income of Thailand, 1970-90, applied to 1980
- 1980-1992 from NESDB, National Income of Thailand, 1980-96
- 1993-2011: National Economic and Social Development Board, Thailand (1998 prices).
Notes:
- Figures at current prices differ between the various issues in overlapping years. Therefore we
applied growth rates to the earliest year of the most recent publication.
- The figures after 1970 were based on a different industrial classification in which simple agricultural
processing products had been taken away from the manufacturing sector and put under the
agricultural sector. We retain the industrial classification used for the post-1970 figures. (NB This is in
contrast with Office of the National Economic and Social Development Board, National Income of
Thailand, 1951-1996, 1999, in which this break is not resolved).
- Ownership of dwellings is included in FIRE.
- In the National accounts, hotels and restaurants are included in services. This industry is reallocated
to trade. Since ADB Key Indicators does not provide detailed estimates of value added in hotels and
restaurants, we used historical national income estimates and extrapolated the sectoral estimates
with growth rates from the ADB Key indicators.
- Update 2011: Revised data comes from ADB key indicators 2011, which has been used to compute
growth rates up to 2010. Hotels and Restaurants (H) as an industrial sector is missing in this series,
and is included in ‘Others’. Sectoral data from NESDB 2009 has been used to compute the share of this
sector.
Number of Persons Employed by Industry
Sources:
- 1960-77 trend from N. Vanderveen, 1987, ‘Postwar Economic Growth and Structural Change in
Thailand’, mimeo University of Groningen, linked in 1977 to
- 1977-1989 trend from NSO, Labour Force Survey, various issues, linked in 1997 to

97
- 1990-2011: Sectoral employment from a Labour Force Survey, as taken from ILO’s Key Indicators of the
Labour Market 7th
edition.
Notes:
- The labour force survey is held more than once in most years. We take the average of the Februari
(first round) and the August survey (third round) to take account for the seasonal inactive labour
force. For years for which only August round results are available (1980, 1982 and 1990) we
estimated the Februari round by applying the February/August proportions from the year before.
- For Finance, insurance and real estate, the trend (1960-1997) from wholesale and retail trade has
been applied. This is because this sector is included in trade in the data before 1998.
- For Government services, the trend (1960-1997) from Community, social and personal services has
been applied. This is because this sector is included in services in the data before 1998.
- Update 2011: New benchmark data token from LFS data (2003-2011, average of 1st and 3rd quarter).
Older data served to compute growth rates.

98
LATIN AMERICA

99
Argentina
Value Added by Industry in Constant 2005 Prices
Sources:
1950-1979: growth rate from National Accounts Statistics: Main Aggregates and
Detailed Tables, various issues. United Nations.
1980-1992: growth rate from Statistical Yearbook for Latin American and the
Caribbean 2003. ECLAC.
1993-2011: Instituto Nacional De Estadística, y Censos, Dirección Nacional de Cuentas Nacionales (1993
prices).
Notes:
Series for 1950-1992 have been linked using growth rates. Since 1993, SNA 1993 has been adapted.
Series for 1993-2005 use the SNA 1993 classification. As a base serves the period 1993-2003, SNA
1993, 1993 prices. For 1950-1951, growth rate in "other sectors" has been used for utilities, trade,
transport, finance, and other services. For 1952-1955, forestry is included in manufacturing. Also,
utilities are included in services, and trade is included in transport, For 1956-1959, forestry is
included in manufacturing. For 1960-1967, storage is excluded from transport. We haven't split
Community, social and personal services from Government services. As our ISIC-3 approach to
employment does not make a distinction on ownership, we cannot distinguish between these sector
in the employment series. Therefore in order for the database to remain consistent, we have
aggregated both sectors in the sectoral GDP-series. The value added by dwellings in financial services
does not have an employment equivalent and should preferably not be included in output for the
purpose of labour productivity comparisons. We therefore have constructed series on the value
added of dwellings (which can easily be deducted from financial services).
Value Added by Industry in Current Prices
Sources:
1950-1979: growth rate from National Accounts Statistics: Main Aggregates
and Detailed Tables, various issues. United Nations
1980-1992: growth rate from Statistical Yearbook for Latin American and the
Caribbean 2003. ECLAC.
100
1993-2011: Instituto Nacional De Estadística, y Censos, Dirección Nacional de Cuentas Nacionales (1993
prices).
Notes:
Series for 1950-1979 have been linked using growth rates. Since 1993, SNA 1993 has been adapted.
Series for 1993-2005 use SNA 1993 classification. As a base serves the period 1993-2005, SNA 1993.
For 1950-1951, services include communication. For 1952-1959, forestry is included in
manufacturing. For 1960-1967, storage is excluded from transport. We haven't split Community,
social and personal services from Government services. As our ISIC-3 approach to employment does
not make a distinction on ownership, we cannot distinguish between these sector in the employment
series. Therefore in order for the database to remain consistent, we have aggregated both sectors in
the sectoral GDP-series. The value added by dwellings in financial services does not have an
employment equivalent and should preferably not be included in output for the purpose of labour
productivity comparisons. We therefore have constructed series on the value added of dwellings
(which can easily be deducted from financial services).
Number of Persons Employed by Industry
Sources:
1950, 1960, 1970: PREALC (1982).
1980: ILO (1991) Yearbook of Labour Statistics, retrospective
edition on population censuses, 1945-1989.
1991, 2001: INDEC, www.indec.gov.ar, november 2004
1971-1979, 1981-1990, 1992-2000: Encuesta Permanente de Hogares.
1961-1969, 1971-1979, 1981-1990, 1992-2000: For agriculture, the GGDC agricultural
database.
2001 Benchmark: sectoral employment taken from the 2001 Population Census.
2001-2011: For Agriculture the trend from FAOstat Economically Active Population in Agriculture is
used. For the other sectors the trend from an urban Labour Force Survey is used, as taken from ILO’s Key
Indicators of the Labour Market 7th
edition.
1950-2005: Total employment from ECLAC.
Notes:
101
Shares from the population censuses (1950, 1960, 1970, 1980, 1991, 2001) are used to estimate
sectoral employment. For the population censuses of 1950, 1960 and 1970 employment in financial
services is included in services. We have used the growth rate in services to estimate the share of
financial services in these years.
For 1951-1959 and 1961-1969 (except agriculture during 1961-1969) we estimated annual
sectoral employment by interpolation, using the average annual labour productivity growth rates
for each sector. For 1971-1979, 1981-1990, 1992-2000, we estimated annual sectoral employment
by interpolation, using the household survey. In order to estimate annual agricultural employment,
we interpolated the years 1961-1969, 1971-1979, 1981-1990, 1992-2000 using the GGDC
agricultural database. Update 2011: Data from ILO laborsta (source: Encuesta Permenente de
Hogares) linked through growth rates to 2001 census shares. Since the EPH’s are restricted to
urban areas, growth rates for agriculture come from a different source, that is FAOstat
(economically active population in Agriculture).

102
Bolivia
Value Added by Industry in Constant 2005 Prices
Sources:
1950-1957: growth rate from CEPAL (1978).
1958-1979: growth rate from National Accounts Statistics: Main Aggregates and
Detailed Tables, various issues. United Nations.
1980-1987: growth rate from Statistical Yearbook for Latin American and the
Caribbean 2003. ECLAC.
1988-2011: Instituto Nacional De Estadística, 1988-2011.
Notes:
Series for 1950-1989 are linked using growth rates. SNA 1993 has been adapted. Series for 1992-
2003 use the SNA 1993 classification. As a base serves the period 1989-2003, SNA 1993, 1990 prices.
For 1958-1963, Services include communication. For 1958-1963, Transport includes financial
services. For 1958-1963, value added for electricity only in the sector electricity, gas and water. We
haven't split Community, social and personal services from Government services. As our ISIC-3
approach to employment does not make a distinction on ownership, we cannot distinguish between
these sector in the employment series. Therefore in order for the database to remain consistent, we
have aggregated both sectors in the sectoral GDP-series. The value added by dwellings in financial
services does not have an employment equivalent and should preferably not be included in output for
the purpose of labour productivity comparisons. We therefore have constructed series on the value
added of dwellings (which can easily be deducted from financial services).
Value Added by Industry in Current Prices
Sources:
1958-1979: growth rate from National Accounts Statistics: Main Aggregates and
Detailed Tables, various issues. United Nations.
1980-1989: growth rate from Statistical Yearbook for Latin American and the
Caribbean 2003. ECLAC.
1988-2011: Instituto Nacional De Estadística, 1988-2011
Notes:
Series for 1950-1989 have been linked using growth rates. SNA 1993 has been adapted. Series for
1992-2003 use the SNA 1993 classification. As a base serves the period 1989-2003, SNA 1993, 1990
prices. For 1958-1963, Services include communication. For 1958-1963, Transport includes financial
services. For 1958-1963, value added for electricity only in the sector electricity, gas and water. We
haven't split Community, social and personal services from Government services. As our ISIC-3
approach to employment does not make a distinction on ownership, we cannot distinguish between
these sector in the employment series. Therefore in order for the database to remain consistent, we
have aggregated both sectors in the sectoral GDP-series. The value added by dwellings in financial
services does not have an employment equivalent and should preferably not be included in output for

103
the purpose of labour productivity comparisons. We therefore have constructed series on the value
added of dwellings (which can easily be deducted from financial services).
Number of Persons Employed by Industry
Sources:
1950, 1970: PREALC (1982)
1982: ECLAC (1989)
1992, 2001: INE, www.ine.gov.bo, january 2005
1983-1991, 1993-2000: Unidad de Analises de Politicas Economicas, estimation
based upon household surveys.
1971-1981, 1983-1991, 1993-2000: agriculture from GGDC agricultural database.
2001 Benchmark sectoral employment taken from the 2001 Population Census.
2001-2009: Sectoral trend from a Labour Force Survey, as taken from ILO’s Key Indicators of the Labour
Market 7th
edition.
2010: Annual average labour productivity growth between 2008/2009 held constant for 2009/2010 and
applied to 2010 volume data.
1950-2003: Total employment from ECLAC.
Notes:
Shares from the population censuses (1950, 1970, 1982, 1992, 2001) are used to estimate sectoral
employment. For population censuses of 1950 and 1970 employment in financial services is
included in services. We have used the growth rate in services to estimate the share of financial
services in these years.
For 1950-1969 and 1971-1981 (except agriculture in the last decade) we estimated annual sectoral
employment by interpolation, using the average annual labour productivity growth rates for each
sector.
For 1983-1991, 1993-2000, 2002 we estimated sectoral employment by interpolation, using the
household survey.
In order to estimate annual agricultural employment, we interpolated the years 1971-1981, 1983-
1990, 1992-2000 using the GGDC agricultural database.
104
Brazil
Value Added by Industry in Constant 2005Prices
Sources:
1950-1990: Sectoral growth rate from Mulder (1998).
1991-1994: Growth rate from National Accounts (IBGE)
1995-2009: WIOD Socio Economic Accounts, February 2012 release.
2009-2011: Sectoral trend from CEPALSTAT.
Notes:
Base year is 2000. Series are extrapolated with growth rates from national accounts and Mulder
(1998). For some sector, we used the growth rate from a representative sub sector (i.e. the growth
rate from transport was applied to the transport and communication sector).
Value Added by Industry in Current Prices
Sources:
1991-1992: National Accounts (IBGE), in millions of cruzeiros
1993: National Accounts (IBGE), in millions of cruzeiros reais
1995-2009: WIOD Socio Economic Accounts, February 2012 release.
2009-2011: Sectoral trend from CEPALSTAT.
Notes:
Due to hyperinflation, it is no use to employ current price growth rates to extrapolate series before
1994.
Number of Persons Employed by Industry
Sources:
105
1950-1989: Growth rates from Mulder (1996).
1990-2003: National Accounts (IBGE)
1995-2009: WIOD Socio Economic Accounts, February 2012 release.
2009-2011: Sectoral trend from Labour Force Survey, derived from CEPALSTAT.
Notes:
For 1990-2005, the national accounts do not provide enough detail in the services sector. In order to
obtain employment in services sector, we relied on several additional sources. For wholesale and
retail trade (50-52), we used shares from the Pesquisa Anual de Comércio. For transport and
communication (60-64), we used shares from the Pesquisa Anual de Serviços. For other services
sector we used shares from the household surveys.

106
Chile
Value Added by Industry in Constant 2005 Prices
Sources:
1950-1979: growth rate from National Accounts Statistics: Main Aggregates and
Detailed Tables, various issues. United Nations.
1980-1995: growth rate from Statistical Yearbook for Latin American and the
Caribbean 2003. ECLAC.
1996-2005: National Accounts, Instituto Nacional de Estadística (INE) 1996 pr.
2003-2007: National Accounts, Banco Nacional de Chile, 2003 prices.
2008-2011: Statistical Database Banco Central De Chile (2008 prices)
Notes:
Series for 1950-1995 have been linked by using growth rates. Since 1996, SNA 1993 has been
adapted. Series for 1985-2005 have been revised using the SNA 1993 classification. As a base serves
the period 1996-2005, SNA 1993, 1996 prices. For the period 1960-1984, Restaurants and hotels are
included in Community, social and personal services. Using growth rates, we haven't made
adjustments. We assumed this to be a minor issue. Even more, in the employment series, restaurants
and hotels are also included in trade. Internal consistency is thereby guaranteed. Also, for the period
1960-1984, Business services are included in Community, social and personal services. Using growth
rates, we haven't made adjustments. We assumed this to be a minor issue. Again, internal consistency
is effective, for in the employment series business services are included in financial services. We
haven't split Community, social and personal services from Government services. As our ISIC-3
approach to employment does not make a distinction on ownership, we cannot distinguish between
these sector in the employment series. Therefore in order for the database to remain consistent, we
have aggregated both sectors in the sectoral GDP-series. The value added by dwellings in financial
services does not have an employment equivalent and should preferably not be included in output for
the purpose of labour productivity comparisons. We therefore have constructed series on the value
added of dwellings (which can easily be deducted from financial services). Update 2011: New
benchmark series (2003 prices) taken from the Central Bank of Chile. Old data linked through growth
rates.
Value Added by Industry in Current Prices
Sources:
1950-1979: growth rate from National Accounts Statistics: Main Aggregates and

107
Detailed Tables, various issues. United Nations.
1980-1995: growth rate from Statistical Yearbook for Latin American and the
Caribbean 2003. ECLAC.
1996-2005: National Accounts, Instituto Nacional de Estadística (INE).
2003-2007: National Accounts, Banco Nacional de Chile
2008-2011: Statistical Database Banco Central De Chile
Notes:
Series for 1950-1995 have been linked by using growth rates. Since 1996, SNA 1993 has been
adapted. Series for 1985-2005 have been revised using the SNA 1993 classification. As a base serves
1996, SNA 1993. Recently the value added for financial services and other services has been revised
by INE. These two sectors have undergone a major revision, but the other sectors are unchanged. The
revision by INE has only been in the constant price series. At its website, INE doesn't publish current
price series, but current prices series are published by ECLAC. The new 1996 series from INE have
been adopted here and it is linked to the growth rates in the series published by ECLAC. The
expectation is, that ECLAC will also revise the series in their 2004 Statistical Yearbook. . For the
period 1960-1984, Restaurants and hotels are included in Community, social and personal services.
Using growth rates, we haven't made adjustments. We assumed this to be a minor issue. Even more,
in the employment series, restaurants and hotels are also included in trade. Internal consistency is
thereby guaranteed. Also, for the period 1960-1984, Business services are included in Community,
social and personal services. Using growth rates, we haven't made adjustments. We assumed this to
be a minor issue. Again, internal consistency is effective, for in the employment series business
services are included in financial services. We haven't split Community, social and personal services
from Government services. As our ISIC-3 approach to employment does not make a distinction on
ownership, we cannot distinguish between these sector in the employment series. Therefore in order
for the database to remain consistent, we have aggregated both sectors in the sectoral GDP-series.
The value added by dwellings in financial services does not have an employment equivalent and
should preferably not be included in output for the purpose of labour productivity comparisons. We
therefore have constructed series on the value added of dwellings (which can easily be deducted from
financial services). Update 2011: New benchmark series taken from the Central Bank of Chile. Old data
linked through growth rates.
Number of Persons Employed by Industry
Sources:
1950, 1960, 1970: PREALC (1982).
1982: ILO (1991).
1992, 2002: INE, www.ine.cl , december 2004.
1961-1969, 1971-1981, 1983-1991, 1993-2001: For agriculture, GGDC agricultural

108
database.
1961-1969, 1971-1979: For Manufacturing, Construction, Trade, Transport and Other
services, Encuesta de Empleo.
1980-1981, 1983-1985: For Mining, Manufacturing, Construction, Trade, Transport and
Other services, CASEN nacional.
1986-1991, 1993-2001: For all sectors except agriculture, Encuesta Nacional de
Empleo.
2001 Benchmark: sectoral employment taken from the 2001 Population Census.
2001-2011: Sectoral trend from new National Employment Survey, as taken from Statistical
Database Banco Central De Chile.
1950-2010: Total employment from ECLAC.
Notes:
Shares from the population censuses (1950, 1960, 1970, 1982, 1992, 2002) are used to estimate
sectoral employment. For population censuses of 1950, 1960, and 1970 employment in financial
services is included in services. We have used the growth rate in services to estimate the share of
financial services in these years.
For 1951-1959 (and for 1961-1969, 1971-1981 in Mining, Public Utilities and Financial services),
we estimated annual sectoral employment by interpolation, using the average annual labour
productivity growth rates for each sector.
For 1961-1969, 1971-1981, 1983-1991, 1993-2000, 2002 we estimated sectoral employment by
interpolation, using the different available household surveys.
An exception is agriculture and for 1961-1969 and 1971-1981 also Mining, Public Utilities and
Financial services. For agriculture we interpolated the years 1961-1969, 1971-1981, 1983-1991,
1993-2001 using the GGDC agricultural database.

109
Colombia
Value Added by Industry in Constant 2005 Prices
Sources:
1950-1954: growth rate from CEPAL (1978).
1955-1979: growth rate from National Accounts Statistics: Main Aggregates and
Detailed Tables, various issues. United Nations.
1980-1993: Statistical Yearbook for Latin American and the Caribbean 2003.
ECLAC.
1994-2000: Departemento Administrativo Nacional Estadiistica (DANE) (www.dane.gov.co).
2001-2011: Departamento Administrativo Nacional de Estadística (2005 prices)
Notes:
Series for 1955-1993 have been linked by using growth rates. Series for 1994-2005 use the SNA 1993
classification. As a base serves the period 1994-2005, SNA 1993, 1994 prices. For 1968-1971: Hotels
and restaurants are included in community, social and personal services. For 1968-1971: Business
services are included in community, social and personal services. For 1968-1971: Community, social
and personal services also include other producers. We haven't split Community, social and personal
services from Government services. As our ISIC-3 approach to employment does not make a
distinction on ownership, we cannot distinguish between these sector in the employment series.
Therefore in order for the database to remain consistent, we have aggregated both sectors in the
sectoral GDP-series. The value added by dwellings in financial services does not have an employment
equivalent and should preferably not be included in output for the purpose of labour productivity
comparisons. We therefore have constructed series on the value added of dwellings (which can easily
be deducted from financial services). Update 2011: New benchmark data from DANE, consant 2005
prices, 2000-2010. Old series are linked through growth rates. No new data on dwellings, shares from
older data used (which runs till 2005). 2005 shares were used for 2006-2010.
Value Added by Industry in Current Prices
Sources:
1950-1979: growth rate from National Accounts Statistics: Main Aggregates and
Detailed Tables, various issues. United Nations.

110
1980-1993: Statistical Yearbook for Latin American and the Caribbean 2003.
ECLAC.
1994-2000: DANE (www.dane.gov.co)
2001-2011: Departamento Administrativo Nacional de Estadística
Notes:
Series for 1950-1993 have been linked using growth rates. Series for 1994-2005 use the SNA 1993
classification. As a base serves the period 1994-2005, SNA 1993, 1994 prices. For 1968-1971: Hotels
and restaurants are included in community, social and personal services. For 1968-1971: Business
services are included in community, social and personal services. For 1968-1971: Community, social
and personal services also include other producers. We haven't split Community, social and personal
services from Government services. As our ISIC-3 approach to employment does not make a
distinction on ownership, we cannot distinguish between these sector in the employment series.
Therefore in order for the database to remain consistent, we have aggregated both sectors in the
sectoral GDP-series. The value added by dwellings in financial services does not have an employment
equivalent and should preferably not be included in output for the purpose of labour productivity
comparisons. We therefore have constructed series on the value added of dwellings (which can easily
be deducted from financial services). Update 2011: New benchmark data from DANE, 2000-2010. Old
series are linked through growth rates. No new data on dwellings, shares from older data used (which
runs till 2005). 2005 shares were used for 2006-2010.
Number of Persons Employed by Industry
Sources:
1950, 1960, 1970: Sectoral population census share from PREALC (1982).
1993: Sectoral population census share from DANE,
http://www.dane.gov.co/inf_est/poblacion/censo/censo5.xls ,
february 2005.
1970-2001: Household Surveys; Encuasta Nacional de Hogares.
2002-2010: Sectoral trend from a Labour Force Survey, as taken from ILO’s Key Indicators of the
Labour Market 7th
edition.
1960-1992: GGDC Agricultural Database.
1950-2010: Total Employment from ECLAC.

111
Notes:
Shares from the population censuses (1950, 1960, 1970, 1993) are used to estimate sectoral
employment. For 1950, 1960 and 1970 employment in financial services is included in services. We
have used the growth rate in services to estimate the share of financial services in these years.
For 1951-1959, and 1961-1969 (except agriculture in the last decade), we estimated annual
sectoral employment by interpolation, using the average annual labour productivity growth rates
for each sector.
For 1971-1992 we estimated annual sectoral employment by interpolation, using the household
survey.
For 1993-2005, we estimated annual sectoral employment by using the sectoral growth rates in the
household survey.
For annual agricultural employment estimates, we interpolated the years 1961-1969, and1971-
1992, using the GGDC agricultural database.

112
Costa Rica
Value Added by Industry in Constant Prices
Sources:
1950-1959: growth rate from CEPAL (1978).
1960-1979: growth rate from National Accounts Statistics: Main Aggregates and
Detailed Tables, various issues. United Nations.
1980-1990: growth rate from Statistical Yearbook for Latin American and the
Caribbean 2003. ECLAC.
1991-2011: Central Bank Costa Rica
Notes:
Series for 1960-1990 have been linked using growth rates. Series for 1991-2005 use the SNA 1993
classification. As a base serves the period 1991-2005, SNA 1993, 1991 prices. No data could be found
for 1961, 1962, 1964, 1967 and 1968. We have estimated these years by interpolating, using the
growth rates in current prices. For 1960-1990 Mining and quarrying are included in Manufacturing.
In order to estimate the sector mining and quarrying, we have used the growth rate in manufacturing.
We haven't split Community, social and personal services from Government services. As our ISIC-3
approach to employment does not make a distinction on ownership, we cannot distinguish between
these sector in the employment series. Therefore in order for the database to remain consistent, we
have aggregated both sectors in the sectoral GDP-series. The value added by dwellings in financial
services does not have an employment equivalent and should preferably not be included in output for
the purpose of labour productivity comparisons. We therefore have constructed series on the value
added of dwellings (which can easily be deducted from financial services).
Value Added by Industry in Current Prices
Sources:
1950-1979: growth rate from National Accounts Statistics: Main Aggregates and
Detailed Tables, various issues. United Nations.
1980-1990: growth rate from Statistical Yearbook for Latin American and the
Caribbean 2003. ECLAC.
1991-2011: Banco Central Costa Rica. Website,

113
Notes:
Series for 1960-1990 have been linked using growth rates. Series for 1991-2005 use the SNA 1993
classification. As a base serves the period 1991-2003, SNA 1993. For 1950-1990 Mining and
quarrying are included in Manufacturing. In order to estimate the sector mining and quarrying, we
have used the growth rate in manufacturing. For 1950-1960, the sector "Other" includes certain
amounts which could not be allocated by industry. Product originating in the industries classified
under items 1-9 and item 11 refer to the private sector only. The sector "Other" comprises the total
product of state enterprises, e.g., public utilities, state banks, railways, postal and telegraph services.
We haven't split Community, social and personal services from Government services. As our ISIC-3
approach to employment does not make a distinction on ownership, we cannot distinguish between
these sector in the employment series. Therefore in order for the database to remain consistent, we
have aggregated both sectors in the sectoral GDP-series. The value added by dwellings in financial
services does not have an employment equivalent and should preferably not be included in output for
the purpose of labour productivity comparisons. We therefore have constructed series on the value
added of dwellings (which can easily be deducted from financial services).
Number of Persons Employed by Industry
Sources:
1950, 1960, 1970: Sectoral population census share from PREALC (1982).
1984: Sectoral population census share from ILO (1989).
2000: Sectoral population census share from INEC,
www.inec.go.cr , january 2005.
1984-2001: Sectoral growth rate from household surveys. Except for agriculture.
1960-2000: Sectoral growth rate for agriculture from GGDC agricultural
database.
2001 Benchmark: sectoral employment taken from the 2001 Population Census.
2011 Benchmark: sectoral employment taken from the 2011 Population Census.
2000-2011: Sectoral employment in between benchmark years interpolated using the sectoral trend
from a Labour Force Survey, as taken from Instituto Nacional de Estadística y Censos de Costa Rica.a
1950-2003: Total employment from ECLAC.
Notes:

114
Shares from the population censuses (1950, 1960, 1970, 1984, 2000) are used to estimate sectoral
employment. For 1950, 1960 and1970 employment in financial services is included in services. We
have used the growth rate in services to estimate the share of financial services in these years.
For 1951-1959, 1961-1969 and 1971-1983 (except agriculture in the last decade), we estimated
annual sectoral employment by interpolation, using the average annual labour productivity growth
rates for each sector.
For 1985-1999 we estimated annual sectoral employment by interpolation, using the household
survey.
For annual agricultural employment estimates, we interpolated the years 1961-1969, 1971-1983,
1985-1999 using the GGDC agricultural database.

115
Mexico
Value Added by Industry in Constant Prices
Sources:
1950-1956: growth rate from Mulder (1996)
1956-1979: growth rate from National Accounts Statistics: Main Aggregates and
Detailed Tables, various issues. United Nations.
1980-2005: Banco Central Mexico.
1995-2009: WIOD Socio Economic Accounts, February 2012 release.
2009-2011: Sectoral trend from CEPALSTAT.
Notes:
Series for 1950-1979 have been linked using growth rates. As a base serves the period 1980-2005,
SNA 1993, 1993 prices. For 1950-1967 financial services are included in services. We haven't split
Community, social and personal services from Government services. As our ISIC-3 approach to
employment does not make a distinction on ownership, we cannot distinguish between these sector
in the employment series. Therefore in order for the database to remain consistent, we have
aggregated both sectors in the sectoral GDP-series. The value added by dwellings in financial services
does not have an employment equivalent and should preferably not be included in output for the
purpose of labour productivity comparisons. We therefore have constructed series on the value
added of dwellings (which can easily be deducted from financial services).
Value Added by Industry in Current Prices
Sources:
1950-1965: growth rate from Mulder (1996).
1965-1969: growth rate from National Accounts Statistics: Main Aggregates and
Detailed Tables, various issues. United Nations.
1970-1987: growth rate from Statistical Yearbook for Latin American and the
Caribbean 2003. ECLAC.
1988-1994: INEGI
1995-2009: WIOD Socio Economic Accounts, February 2012 release.
116
2009-2011: Sectoral trend from CEPALSTAT.
Notes:
Series for 1950-1990 have been linked by using growth rates. Series for 1988-2005 use the SNA 1993
classification. As a base serves the period 1991-2003, SNA 1993. For 1950-1990 Mining and
quarrying are included in Manufacturing. In order to estimate the sector mining and quarrying, we
have used the growth rate in manufacturing. For 1950-1960, the sector "Other" includes certain
amounts which could not be allocated by industry. Product originating in the industries classified
under items 1-9 and item 11 refer to the private sector only. The sector "Other" comprises the total
product of state enterprises, e.g., public utilities, state banks, railways, postal and telegraph services.
We haven't split Community, social and personal services from Government services. As our ISIC-3
approach to employment does not make a distinction on ownership, we cannot distinguish between
these sector in the employment series. Therefore in order for the database to remain consistent, we
have aggregated both sectors in the sectoral GDP-series. The value added by dwellings in financial
services does not have an employment equivalent and should preferably not be included in output
for the purpose of labour productivity comparisons. We therefore have constructed series on the
value added of dwellings (which can easily be deducted from financial services).
Number of Persons Employed by Industry
Sources:
1950-1987 (except for manufacturing: 1950-1969): growth rate from Mulder (1996).
1988-1994 (except for manufacturing: 1970-1994 and public utilities 1988-1995):
growth rate from OECD STAN Number of Employees (vol. 2002).
1995-2009: WIOD Socio Economic Accounts, February 2012 release.
2009-2012: Sectoral trend from a Labour Force Survey, as taken from Instituto Nacional de Estadística y
Geografía (INEGI).
1950-2003: Total employment from ECLAC.
Notes:
As a base for sectoral employment shares serves total employment data from the ILO, laborstatistics
database. These figures are only presented for 1995-2001. Sectoral employment for the other years
has been estimated by using growth rates from other sources.

117

118
Peru
Value Added by Industry in Constant Prices
Sources:
1950-1952: growth rate from CEPAL (1978).
1953-1979: growth rate from National Accounts Statistics: Main Aggregates and
Detailed Tables, various issues. United Nations.
1980-1990: growth rate from Statistical Yearbook for Latin American and the
Caribbean 2003. ECLAC.
1991-2000: Banco Central Peru.
2001-2011: Statistical Yearbook of Peru, 2012, Instituto Nacional de Estadística e Informática.
Notes:
Series for 1953-1990 have been linked using growth rates. As a base serves the period 1991-2005,
SNA 1993, 1994 prices. No data could be found for 1954 and 1956. We have estimated these years by
interpolating, using the growth rates in current prices. For 1960-1967, Services include Transport,
Trade, and Financial services. For 1968-1971, Services include Financial services and Transport and
Communication. We haven't split Community, social and personal services from Government
services. As our ISIC-3 approach to employment does not make a distinction on ownership, we
cannot distinguish between these sector in the employment series. Therefore in order for the
database to remain consistent, we have aggregated both sectors in the sectoral GDP-series. The
value added by dwellings in financial services does not have an employment equivalent and should
preferably not be included in output for the purpose of labour productivity comparisons. We
therefore have constructed series on the value added of dwellings (which can easily be deducted
from financial services).
Value Added by Industry in Current Prices
Sources:
1950-1979: growth rate from National Accounts Statistics: Main Aggregates and
Detailed Tables, various issues. United Nations.
1980-1990: growth rate from Statistical Yearbook for Latin American and the

119
Caribbean 2003. ECLAC.
1991-2001: Banco Central Peru
2001-2011: Statistical Yearbook of Peru, 2012, Instituto Nacional de Estadística e Informática.
Notes:
Series for 1950-1990 have been linked using growth rates. As a base serves the period 1991-2005,
SNA 1993.
For 1950-1954, Electricity and Construction are included in transport, Real estate from financial
services is included in services, Dwellings is included in services, Public administration represents
total expenditure of government on goods and services rather than the product originating in public
administration and defence. As a result, the estimate of gross national product is overstated, Services
includes rental income, real estate and miscellaneous services, n.e.s.
For 1955-1956, Electricity is included in transport, Construction is included in manufacturing,
Dwellings is included in services, Public administration and defence represents total expenditure of
general government, including consumption expenditure and fixed capital formation., Services
includes rental income, real estate and miscellaneous services, n.e.
We haven't split Community, social and personal services from Government services. As our ISIC-3
approach to employment does not make a distinction on ownership, we cannot distinguish between
these sector in the employment series. Therefore in order for the database to remain consistent, we
have aggregated both sectors in the sectoral GDP-series. The value added by dwellings in financial
services does not have an employment equivalent and should preferably not be included in output
for the purpose of labour productivity comparisons. We therefore have constructed series on the
value added of dwellings (which can easily be deducted from financial services).
Number of Persons Employed by Industry
Sources:
1960, 1970: Sectoral population census share from PREALC (1982).
1981: Sectoral population census share from ILO (1989).
1993: Sectoral population census share from INEI, www.inei.gov.pe ,
January 2005.

120
1970-2005: Growth rates from (various) Household survey(s) for Lima, metropolitan area.
Except for agriculture.
2007 Benchmark: sectoral employment from the 2007 Population Census.
2007-2011: Sectoral employment in between benchmark years interpolated using the sectoral
trend from a Labour Force Survey, as taken from Instituto Nacional de Estadística e
Informática.
1960-2000: Growth rates for agriculture from GGDC Agricultural Database,
www.ggdc.nl.
1950-2005: Total employment from ECLAC.
Notes:
Shares from the population censuses (1960, 1970, 1981, 1993) are used to estimate sectoral
employment. For 1960 and 1970 employment in financial services is included in services. We have
used the growth rate in services to estimate the share of financial services in these years.
For 1961-1969 (except agriculture), we estimated sectoral employment by interpolation using the
average annual labour productivity growth rates for each sector.
For 1971-1980 and 1982-1992 we estimated sectoral employment by interpolation, using the
household surveys.
For annual agricultural employment estimates, we interpolated the years 1960-1969, 1971-1980,
1982-1992 using the GGDC agricultural database.
We extrapolated all annual sectoral employment estimates for 1994-2005, using the household
survey data.

121
Venezuela
Value Added by Industry in Constant Prices
Sources:
1950-1951: growth rate from CEPAL (1978).
1952-1979: growth rate from National Accounts Statistics: Main Aggregates and
Detailed Tables, various issues. United Nations.
1980-1994: growth rate from Statistical Yearbook for Latin American and the
Caribbean 2003. ECLAC.
1995-1999: Banco Central de Venezuela. Website,
http://www.bcv.org.ve/excel/7_1_2.xls?id=108 , december 2004.
2000-2010: Sectoral Value Added from UN National Accounts Official Country Data.
2010-2012: Trend of aggregate GDP applied to all sectors, from Banco Central de Venezuela.
Notes:
Series for 1952-1994 have been linked using growth rates. Series for 1968-2003 use the SNA 1968
classification. As a base serves the period 1995-2003, SNA 1968, 1984 prices. For 1952-1955,
financial services are included in Trade. For 1955-1959, financial services are included in services.
For 1960-1967, financial services are included in Trade. For 1952-1959, Mining and quarrying
includes the extraction and refining of crude petroleum. For 1960-2003, Mining and quarrying
includes the extraction crude petroleum, whereas refining is included in manufacturing. For 1972-
1980, Electricity, gas and water exclude gas. For 1980-1984, Dwellings refer to Real estate and
Business services. For 1984-2003, Dwellings refer to Real estate. We haven't split Community, social
and personal services from Government services. As our ISIC-3 approach to employment does not
make a distinction on ownership, we cannot distinguish between these sector in the employment
series. Therefore in order for the database to remain consistent, we have aggregated both sectors in
the sectoral GDP-series. The value added by dwellings in financial services does not have an
employment equivalent and should preferably not be included in output for the purpose of labour
productivity comparisons. We therefore have constructed series on the value added of dwellings
(which can easily be deducted from financial services). Update 2011: UN national accounts
estimates used as benchmark (>2009), UN national accounts official country data (>2006) used to

122
compute share for industry C and E in C-E and J+K and L-Q in J-P.Shares for dwellings assumend
constant from 2002.
Value Added by Industry in Current Prices
Sources:
1960-1979: growth rate from National Accounts Statistics: Main Aggregates and
Detailed Tables, various issues. United Nations.
1980-1994: growth rate from Statistical Yearbook for Latin American and the
Caribbean 2003. ECLAC.
1995-1999: Banco Central de Venezuela. Website,
http://www.bcv.org.ve/excel/7_1_2.xls?id=108 , december 2004.
2000-2010: Sectoral Value Added from UN National Accounts Official Country Data.
2010-2012: Trend of aggregate GDP applied to all sectors, from Banco Central de Venezuela.
Notes:
Series for 1960-1994 have been linked using growth rates. Series for 1968-2003 use the SNA 1968
classification. As a base serves the period 1995-2003, SNA 1968. For 1960-1963, financial services are
included in Trade. For 1964-1968, Services includes all sectors except agriculture and mining. For
1972-1980, Electricity, gas and water exclude gas. For 1980-1984, Dwellings refer to Real estate and
Business services. For 1984-2003, Dwellings refer to Real estate. We haven't split Community, social
and personal services from Government services. As our ISIC-3 approach to employment does not
make a distinction on ownership, we cannot distinguish between these sector in the employment
series. Therefore in order for the database to remain consistent, we have aggregated both sectors in
the sectoral GDP-series. The value added by dwellings in financial services does not have an
employment equivalent and should preferably not be included in output for the purpose of labour
productivity comparisons. We therefore have constructed series on the value added of dwellings
(which can easily be deducted from financial services). Update 2011: UN national accounts
estimates used as benchmark (>2009), UN national accounts official country data (>2006) used to
compute share for industry C and E in C-E and J+K and L-Q in J-P. Shares for dwellings assumend
constant from 2002.
Number of Persons Employed by Industry
Sources:

123
1950, 1960, 1970: Sectoral population census share from PREALC (1982).
1981: Sectoral population census share from ILO (1989).
1990: Sectoral population census share from OCEI, www.ine.gov.ve ,
february 2005.
2001: Sectoral population census share from OCEI, www.ine.gov.ve
1991-2000: Growth rates from Household survey(s). Encuasta de Hogares por
muestro.
1960-2001: Growth rates for agriculture from GGDC Agricultural Database,
www.ggdc.nl.
1950-2008: Total employment from ECLAC.
2001-2011: Sectoral trend from a Labour Force Survey, as taken from ILO’s Key Indicators of the
Labour Market 7th
edition.
Notes:
Shares from the population censuses (1950, 1960, 1970, 1981, 1990, 2001) are used to estimate
sectoral employment. For 1950, 1960 and 1970 employment in financial services is included in
services. We have used the growth rate in services to estimate the share of financial services in
these years. For 1951-1959, 1961-1969, 1971-1980, and 1981-1989 (except agriculture), we
estimated sectoral employment by interpolation using the average annual labour productivity
growth rates for each sector. For annual agricultural employment estimates, we interpolated the
years 1960-1969, 1971-1980, 1982-1989 using the GGDC agricultural database. We extrapolated
all annual sectoral employment estimates for 1991-2000 and 2002-2005, using the household
survey data. Update 2011: Labor force survey data provided by ILO laborsta haa been linked to the
census shares using growth rates.

124
USA and Europe
The current version of the European 10-sector database is derived from the EU KLEMS March 2008
release for the period 1970-1995 and WIOD socio-economic accounts for the period 1995-2011 (release
July 2014). data before 1970 is based on van Ark (1996) through splicing. Growth rates of employment,
hours worked, and constant price value added for the period before 1970 have been applied to the 1970
level from the WIOD database. Obviously levels in the van Ark (1996) and EU KLEMS and WIOD
database are not strictly comparable. Absolute levels of employment and value added at the total
economy level are roughly comparable but at industry level differences can be observed; this is mainly
in the services sectors. There are a variety of reasons for this:
Data revisions:
Ten years have passed since the estimates by van Ark and many revisions have taken place since then
such as the FISIM adjustment, changes in deflation procedures (e.g. double deflation) and other SNA
1993 revisions
Differences in industrial classification:
In van Ark (1996) hotels and restaurants were included in personal services, but in EU KLEMS they are
included in the trade sector (see footnote in van Ark 1996). Also it seems that the division between
public and private services was made differently in the two databases. EU KLEMS follows the NACE rev 1
classification.
Improved estimates:
In van Ark sometimes sectoral labour productivity trends were used to estimate industry level
employment. In contrast to absolute levels, industry growth rates differ much less between van Ark
(1996) and EU KLEMS. For example over the period 1970-1994 average growth rates of real value
added were within 1 % bounds for most industries and countries (except mining and personal and
community services).
Bart van Ark (1996), Sectoral Growth Accounting and Structural Change in Post-War Europe, in B. van Ark
and N.F.R. Crafts, eds., Quantitative Aspects of Post-War European Economic Growth, CEPR/Cambridge
University Press, pp. 84-164".
Middle East and North Africa

125
Egypt
The series of VA in current prices of Egypt was constructed using official sources. The latest
revision of the VA series was obtained through the Central Bank of Egypt (2014). This latest
series includes detailed sectoral VA statistics based on ISIC Rev. 3.1. and also data for owner
occupied dwellings dating back to 1991. The second source used for official country data is the
UN database (UN, 2014b). This data overlaps with the data published by the central bank in the
1990s and dates back to 1960. However, the UN OCD is based on several different series with
several revisions and re-definitions of sectors. There is one gap in the UN OCD in 1971. This gap
is covered by using official data from the UN YB 1975.
The VA series in constant prices was constructed by using the same sources, but these series
have more gaps and base year changes and thus it had to be relied on estimates to bridge
those. The series also starts with the data obtained through the Central Bank of Egypt and is
extrapolated by making us of UN OCD. However, there are seven gaps in total over the whole
period during which the official series do not have overlapping years. In these seven cases, nine
years in total, estimates published by the UN were used (United Nations National Accounts
Estimates of Main Aggregates; UN, 2014b). That series covers only seven sectors and the
growth rates for these years are less precise for the sectors J to P, as these sectors are
aggregated in the UN estimates. However, VA series could be constructed and extrapolated for
14 sectors.
Benchmark levels were obtained for 1960, 1966, 1976, 1986, 1996 and 2006. However, the
level of detail varies. The data of 1996 and 2006 is very detailed, which means that all necessary
parameters can be obtained, such as only persons that are older than 15 and with great
sectoral detail. This data is obtained from the IPums project (IPums, 2014). For earlier censuses,
it is relied on the publications of censuses in the ILO Laborsta database (ILO, 2014b), which
collects census data. The publications of 1976 and 1986 both include 9 sectors and also have
details on the sectoral distribution of persons engaged under 15 years and thus benchmark
employment levels of persons engaged in economic activities older than 15 years for nine
sectors can be constructed. The publications of 1960 and 1966 include only eight sectors and
only total values of persons engaged younger than 15. In order to retain a sectoral detail of nine
sectors and to employ the concept of persons engaged older than 15, two simplifications were
applied. For both censuses, the distribution between the JtK and LtP sectors was assigned by
assuming the 1976 share between the two sectors. Concerning persons engaged younger than
15 years, the distribution of 1976 was also the basis to calculate the distribution of these
persons in 1960 and 1966. This second assumption, however, has only a minor effect since the
vast majority of persons under 15 is engaged in the agricultural sector and it can be assumed
that this pattern did not change dramatically. Regarding the interpolation between the
benchmark years, it is relied on data on agricultural employment trends published by the FAO
(2014).

126
Morocco
The value added series in current prices only covers the period 1970 to 2012, as there are no
official publications for the 1960s. The complete VA series in current prices is based on UN OCD
series based on ISIC Rev. 3.1 and does not have gaps in the series.
Concerning data on VA in constant prices, the coverage of the data is quite extensive and the
series can be fully constructed relying on UN OCD. Both VA series can be constructed with great
sectoral detail. One drawback of the Moroccan data is that there is no information on owner
occupied dwellings. In order to retain international consistency, a constant share of the J+K
sector is assumed to account for owner occupied dwellings. This share is approximated by the
Egyptian one.
The coverage of employment data of Morocco is also greater than in the case of Egypt.
Morocco experienced five population censuses during the last 58 years: 1960, 1971, 1982, 1994
and 2004. The latest three are also covered in the IPums database (IPums, 2014) and therefore
the data is of great detail.
The data of the censuses in 1960 and 1971 are obtained by consulting the official publications
of the respective census published by the Royaume du Maroc (1960, 1971). Both publications
have great sectoral detail so that employment levels could be matched to the 10 sectors based
on ISIC Rev. 3.1.
One drawback of the 1960 data is that the sectoral distribution of people engaged in economic
activities younger than 15 years is not available, but only the total amount. Similar to the
procedure in the case of Egypt, the distribution of these workers is taken from the 1971 census
and thereupon the level of workers below 15 is calculated for 1960 in order to retain the
employment concept. Again, the vast majority of people engaged in economic activities
younger than 15 years is engaged in agricultural activity.
Regarding the interpolation of employment data, the agricultural trends are also based on FAO
(2014). Concerning the other sectors, it is also relied on constant labor productivity growth.