Embed Size (px)
Citation preview
Getting to 80% ART coverage
Dr Francois VenterReproductive Health and HIV Research Unit
University of the Witwatersrand
January 2010
Thanks to: Robin Wood

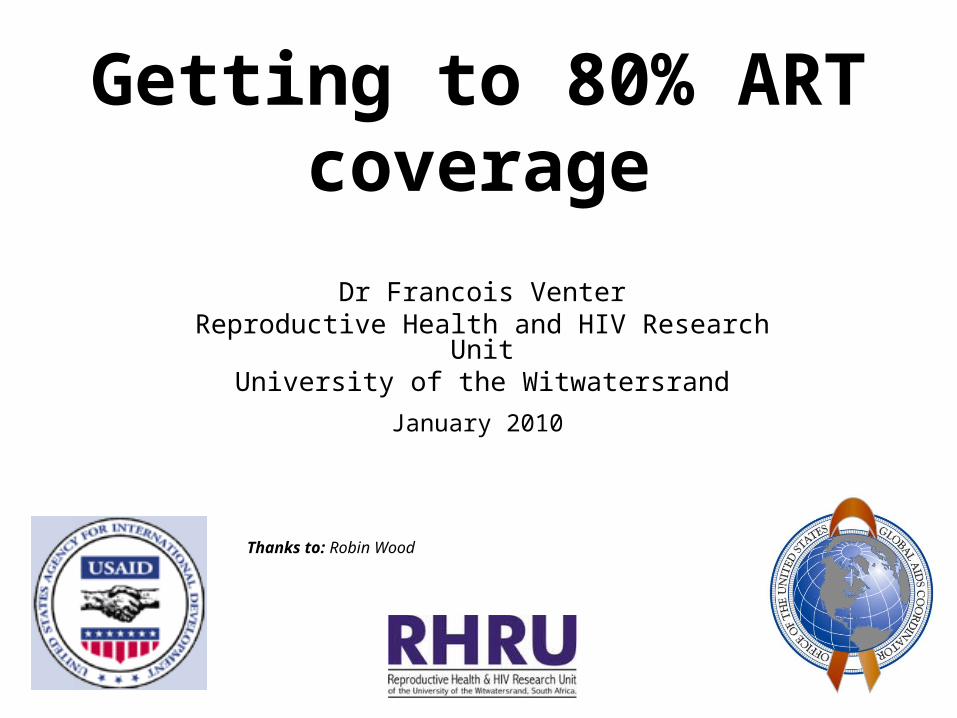
HIV and South Africa
5 million people
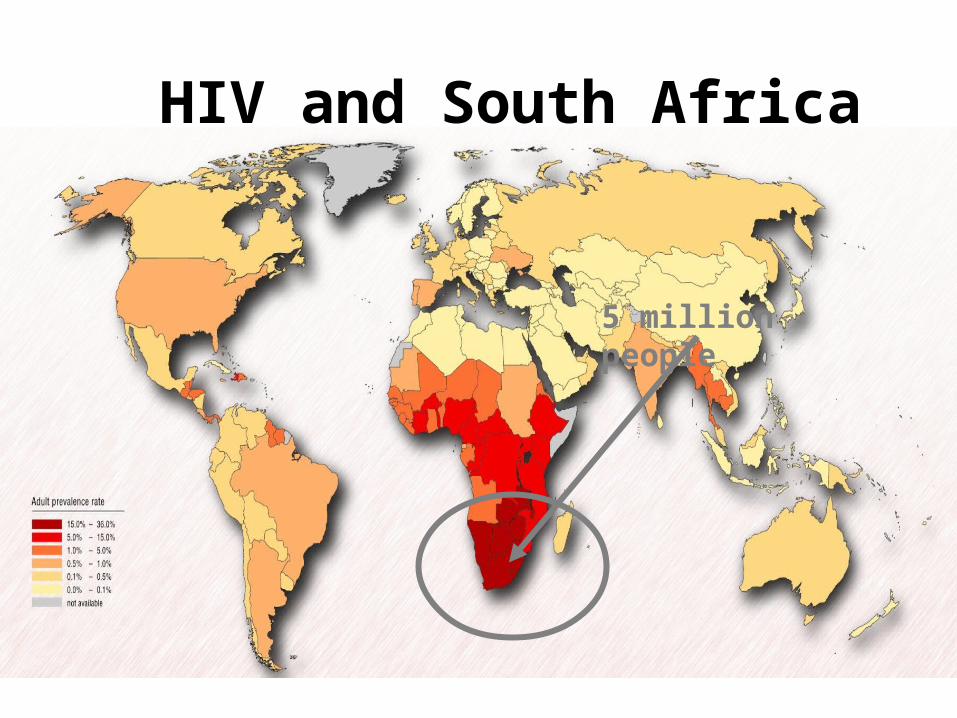
Kenya, 245,162
16%
Mozambique, 156,108
10%
Tanzania, 139,151
9%
Uganda, 78,769, 5%
Eritrea4,838 Madagascar
1,491Mauritius
584
Comoros28
South Africa, 473,499
31%
Zambia, 103,077
7%
Ethiopia, 94,489
6%
Malawi, 86,905, 6%
Rwanda, 9,225, 1%
Botswana, 13,518, 1%
Swaziland, 15,131, 1%
Namibia, 16,082, 1%
Angola, 21,777, 1%
Lesotho, 22,666, 1%
Zimbabwe, 45,652, 3%
Eastern & Southern Africa
1.5 million (57%
Rest of the world1.2 million (43%)
Global new infections, 2.7 million ESA new infections,
Prov. estimate 1.5m
Estimates of New Infections in Eastern and Southern Africa, 2007
South Africa: Why is it important?
• Size of the country; size of the epidemic; size of ART programme
• Rich country!
• De Cock: If South Africa fails, we all fail
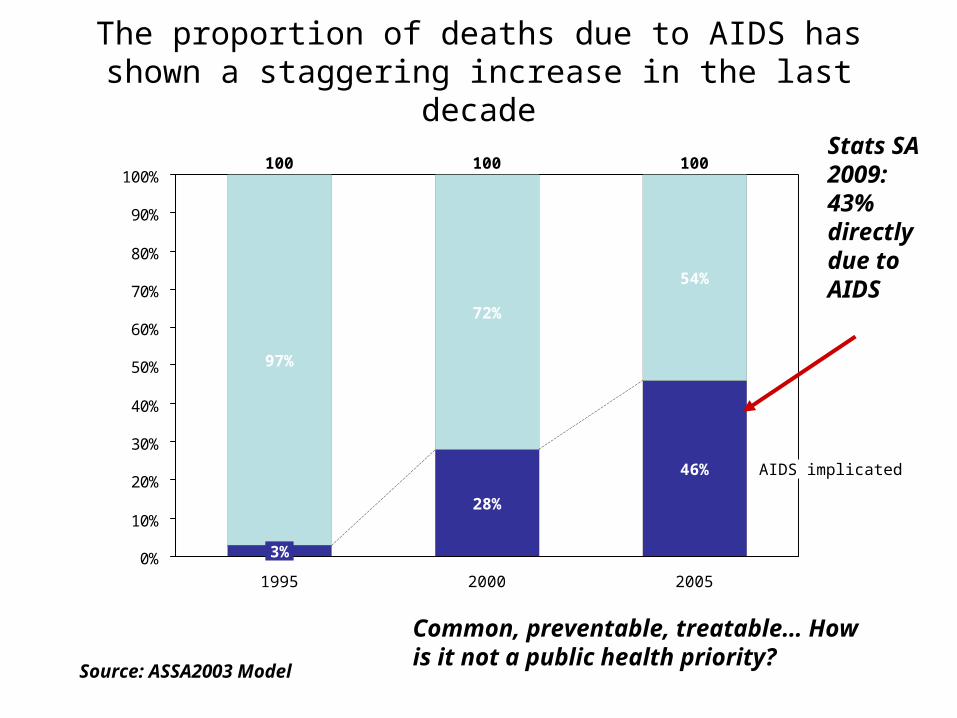
The proportion of deaths due to AIDS has shown a staggering increase in the last decade
0%
10%
20%
30%
40%
50%
60%
70%
80%
90%
100%
97%
3%
28%
54%
46% AIDS implicated
2000
100
1995
72%
100 100
2005
Source: ASSA2003 Model
Stats SA 2009: 43% directly due to AIDS
Common, preventable, treatable… How is it not a public health priority?
164
187
102
181
200192
87 239
163
97
134
179
97
100125
12386
122103 53
157 20695
72
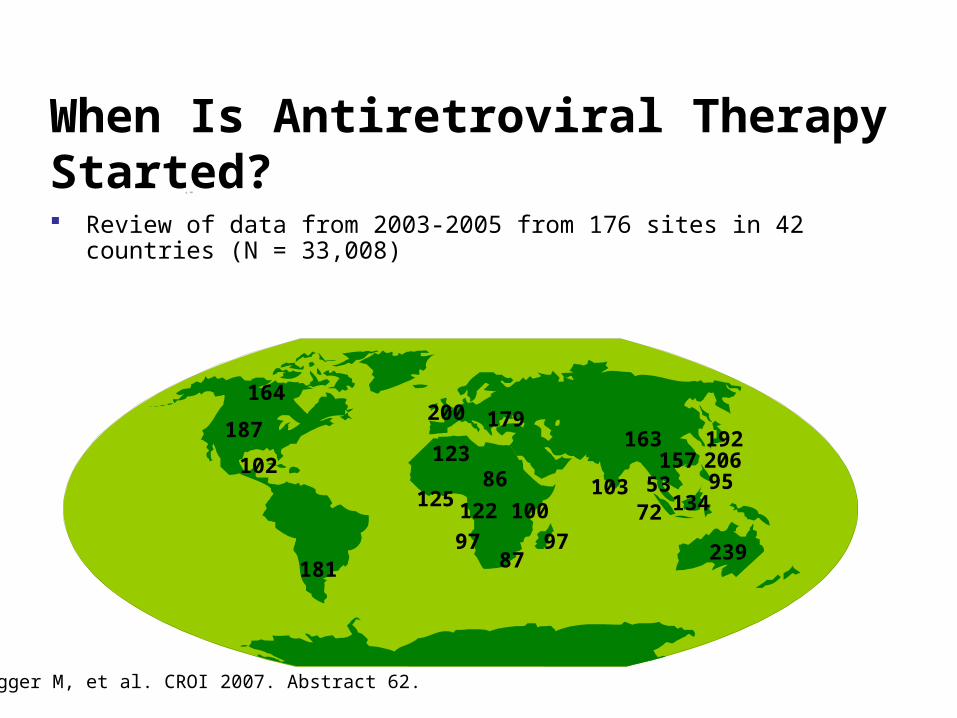
Review of data from 2003-2005 from 176 sites in 42 countries (N = 33,008)
When Is Antiretroviral Therapy Started?
Egger M, et al. CROI 2007. Abstract 62.
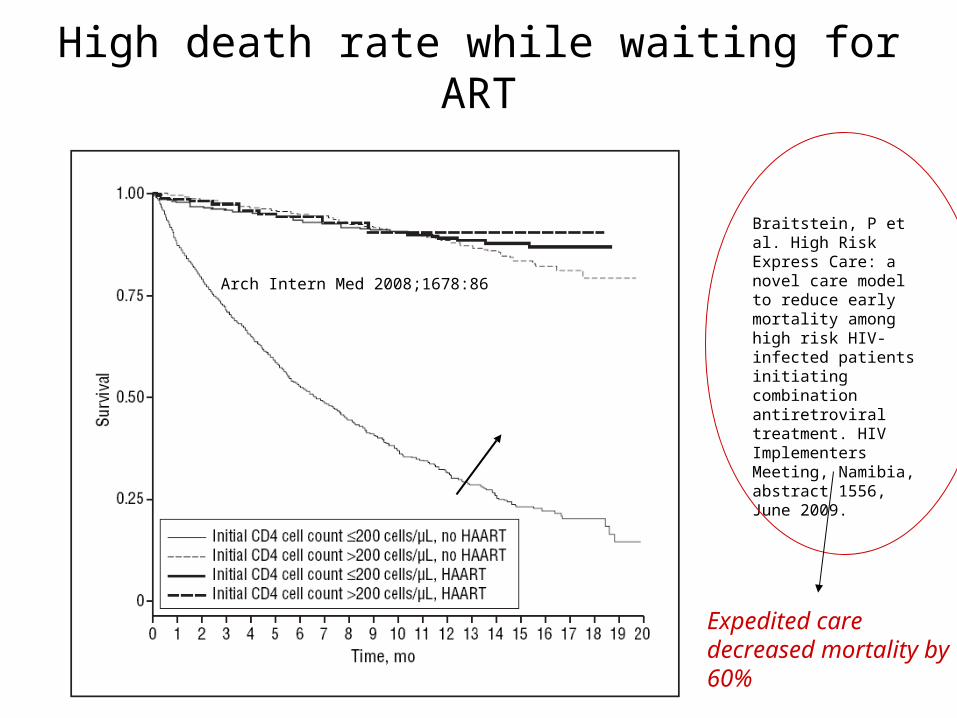
High death rate while waiting for ART
Arch Intern Med 2008;1678:86
Braitstein, P et al. High Risk Express Care: a novel care model to reduce early mortality among high risk HIV-infected patients initiating combination antiretroviral treatment. HIV Implementers Meeting, Namibia, abstract 1556, June 2009.
Expedited care decreased mortality by 60%
• “"There is a need for honesty and peer review in situations that impact public health policy. When AIDS denialism enters public health practice, the consequences are tragic. The implications start in honest science but extend to the need for accountability and, perhaps, public health reform." Chigwedere P, Essex M. AIDS Denialism and Public Health Practice. AIDS and
Behavior, 2010; DOI: 10.1007/s10461-009-9654-7 http://www.sciencedaily.com/releases/2010/01/100118132134.htm
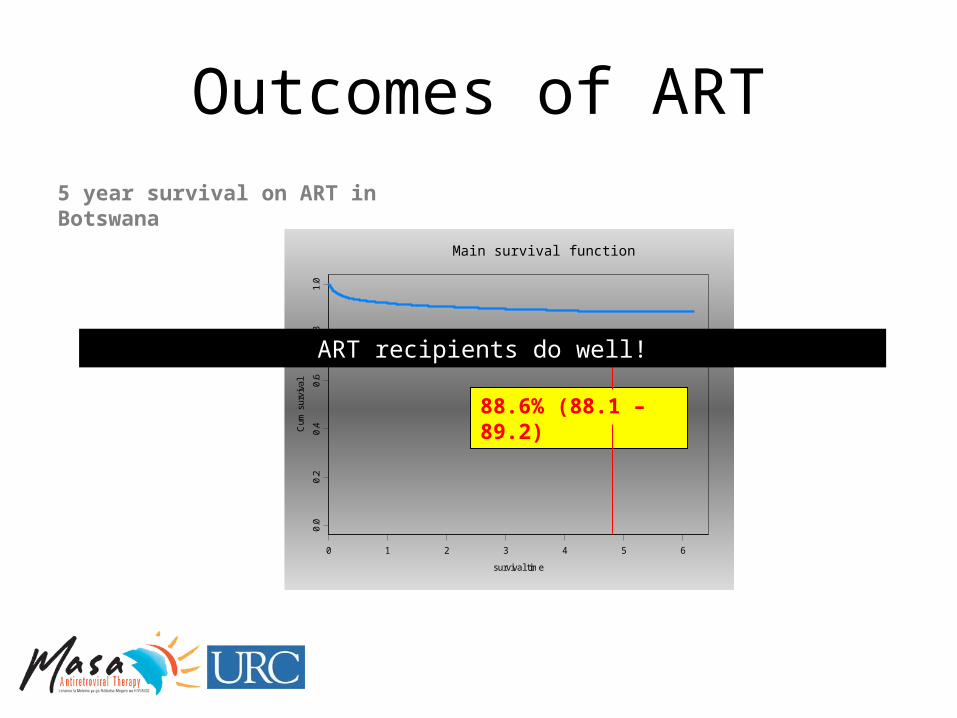
Outcomes of ART
5 year survival on ART in Botswana
0 1 2 3 4 5 6
survival time
0.0
0.2
0.4
0.6
0.8
1.0
Cum
sur
viva
l
Main survival function
88.6% (88.1 – 89.2)
Puvimanasinghe JPA et al. Mexico 2008 (MOAB0204)
ART recipients do well!
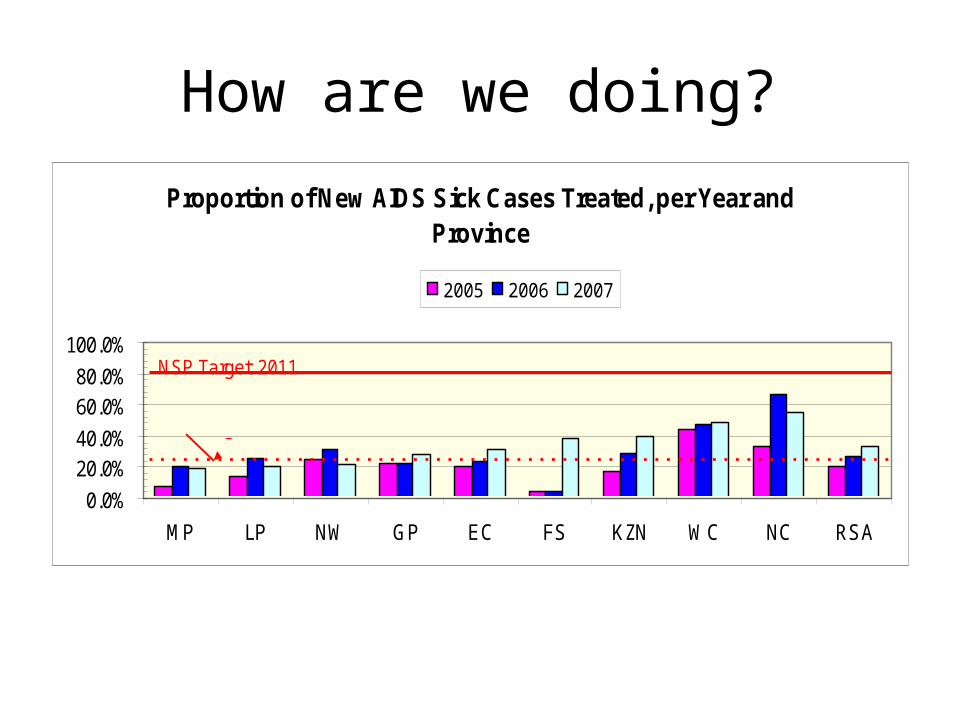
How are we doing?
Proportion of New AIDS Sick Cases Treated, per Year and Province
0.0%
20.0%40.0%
60.0%80.0%
100.0%
MP LP NW GP EC FS KZN WC NC RSA
2005 2006 2007
NSP Target 2011
NSP Target 2007
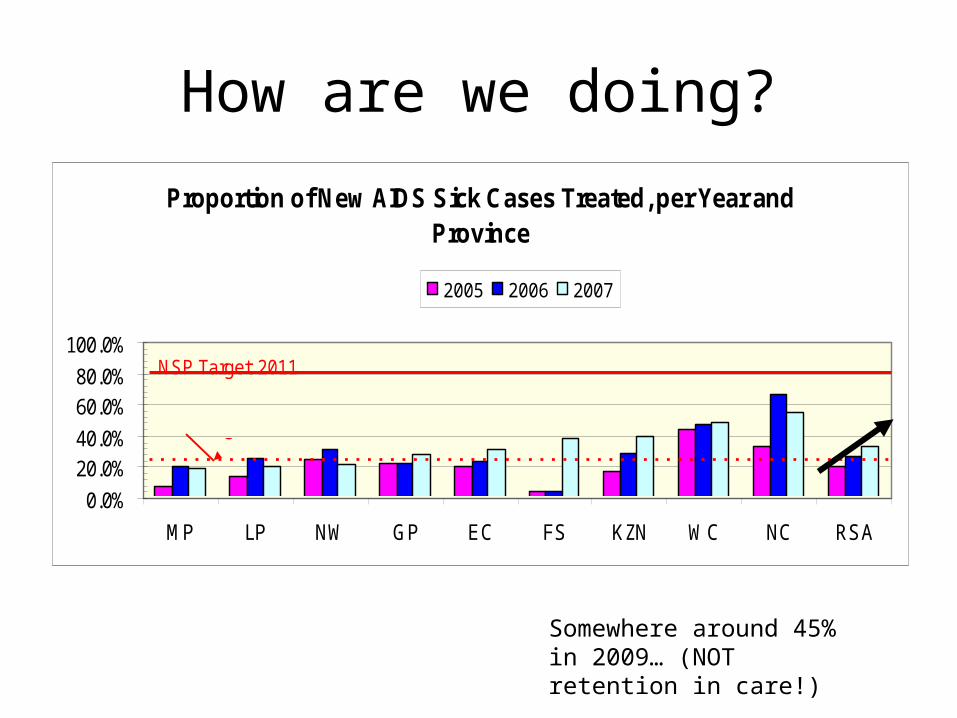
How are we doing?
Proportion of New AIDS Sick Cases Treated, per Year and Province
0.0%
20.0%40.0%
60.0%80.0%
100.0%
MP LP NW GP EC FS KZN WC NC RSA
2005 2006 2007
NSP Target 2011
NSP Target 2007
Somewhere around 45% in 2009… (NOT retention in care!)
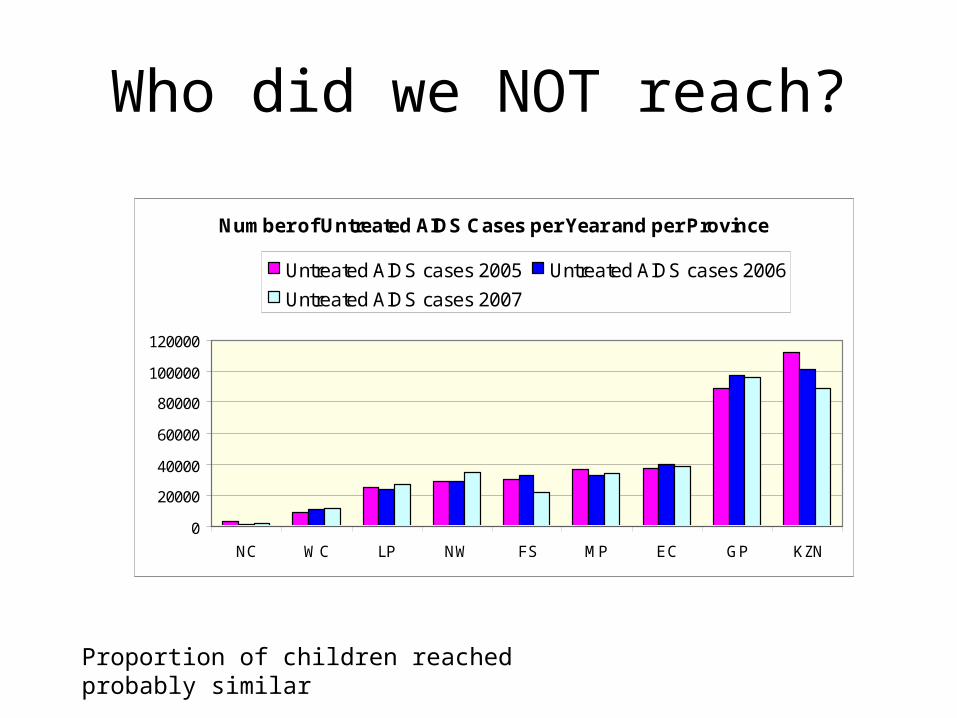
Who did we NOT reach?
Number of Untreated AIDS Cases per Year and per Province
0
20000
40000
60000
80000
100000
120000
NC WC LP NW FS MP EC GP KZN
Untreated AIDS cases 2005 Untreated AIDS cases 2006
Untreated AIDS cases 2007
Proportion of children reached probably similar
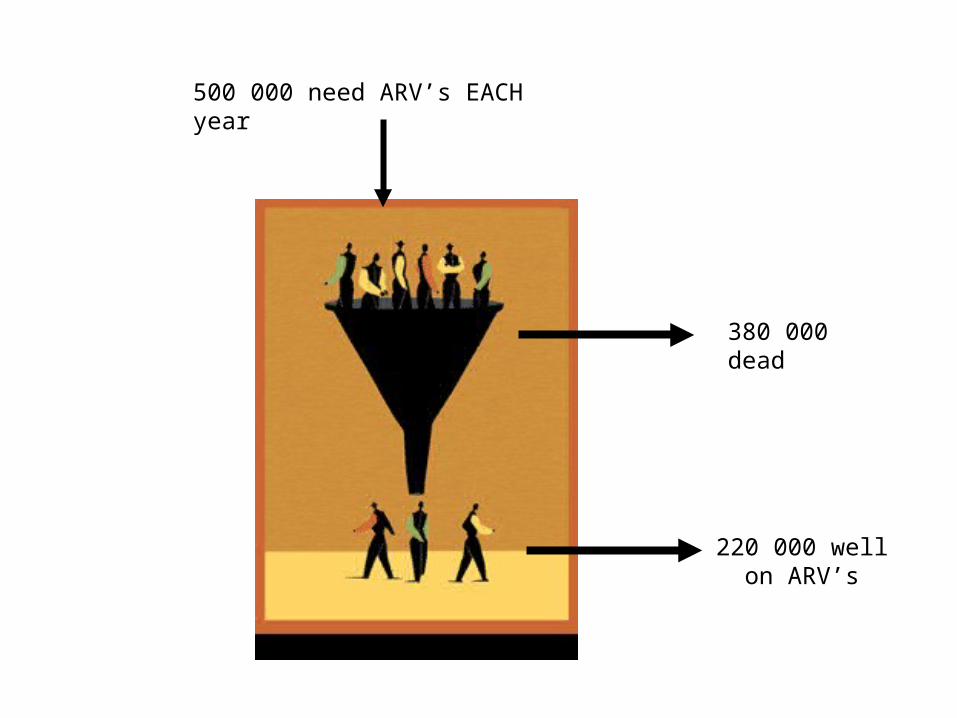
500 000 need ARV’s EACH year
220 000 well on ARV’s
380 000 dead
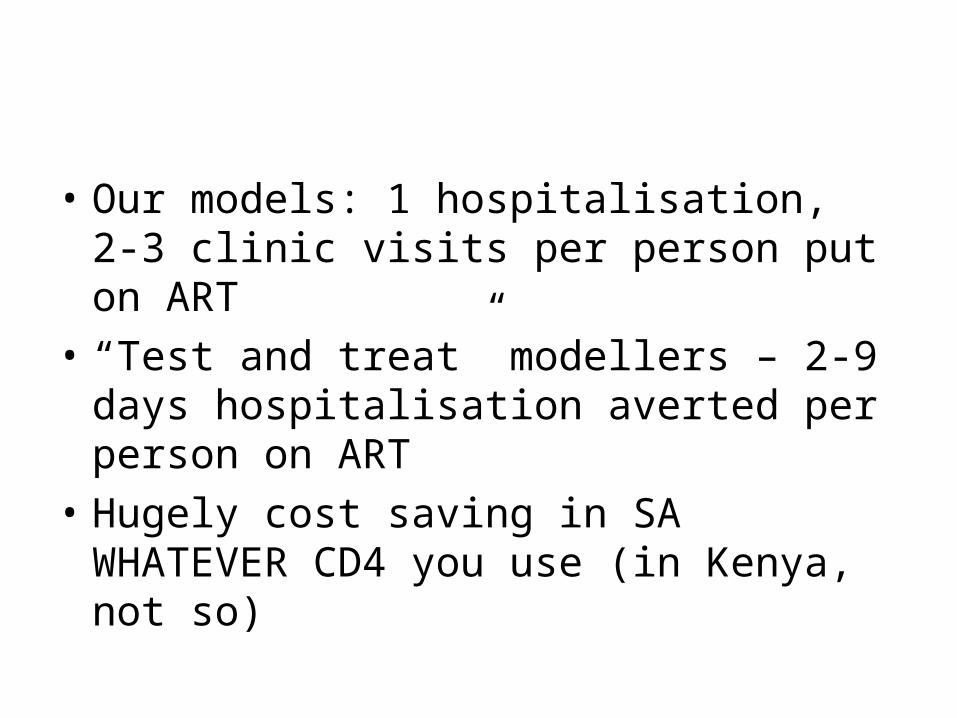
• Our models: 1 hospitalisation, 2-3 clinic visits per person put on ART
• “Test and treat” modellers – 2-9 days hospitalisation averted per person on ART
• Hugely cost saving in SA WHATEVER CD4 you use (in Kenya, not so)
Can we achieve scale-up?
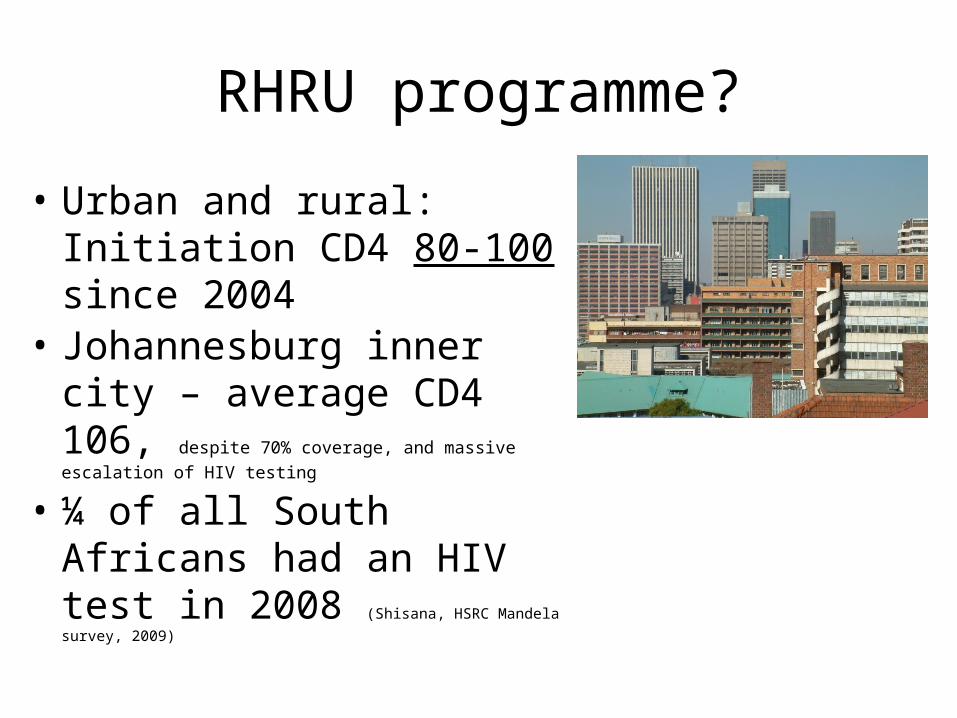
RHRU programme?
• Urban and rural: Initiation CD4 80-100 since 2004
• Johannesburg inner city – average CD4 106, despite 70%
coverage, and massive escalation of HIV testing
• ¼ of all South Africans had an HIV test in 2008 (Shisana, HSRC
Mandela survey, 2009)
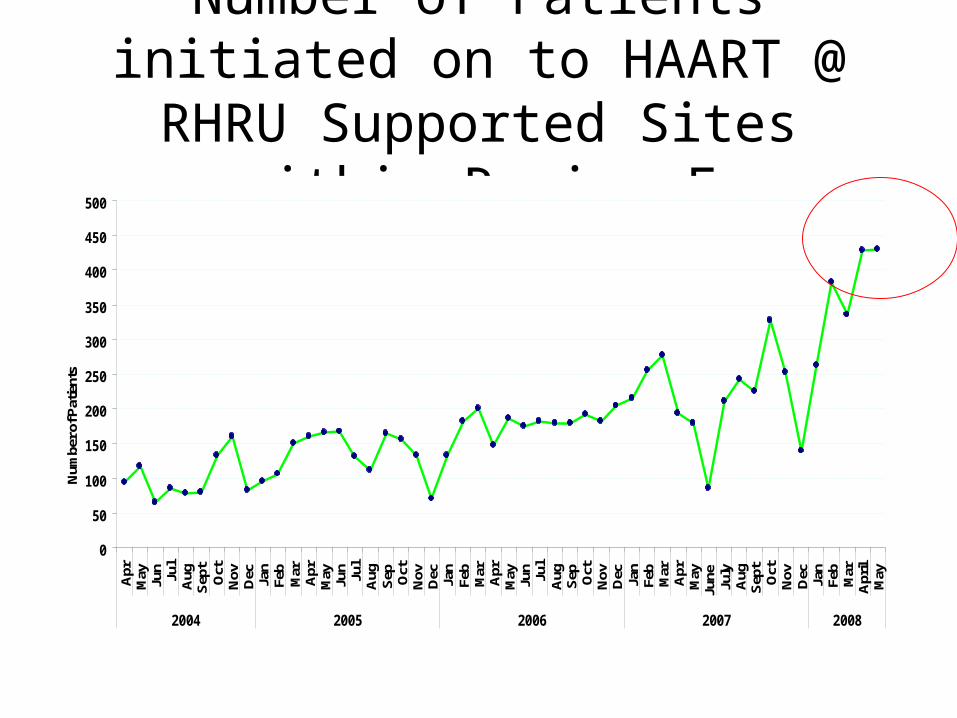
Number of Patients initiated on to HAART @ RHRU Supported Sites
within Region F
0
50
100
150
200
250
300
350
400
450
500
Apr
May Jun
Jul
Aug
Sep
tO
ctN
ovD
ec Jan
Feb
Mar
Apr
May Jun
Jul
Aug
Sep Oct
Nov
Dec Jan
Feb
Mar
Apr
May Jun
Jul
Aug
Sep Oct
Nov
Dec Jan
Feb
Mar
Apr
May
June
July
Aug
Sep
tO
ctN
ovD
ec Jan
Feb
Mar
Apr
ilM
ay
2004 2005 2006 2007 2008
Num
ber o
f Pat
ient
s
The famous cascade…
• 50% loss to follow up at EVERY step
Target setting
• Not even done at a provincial level
• Starts with HIV testing – but EVERY step needs to be counted
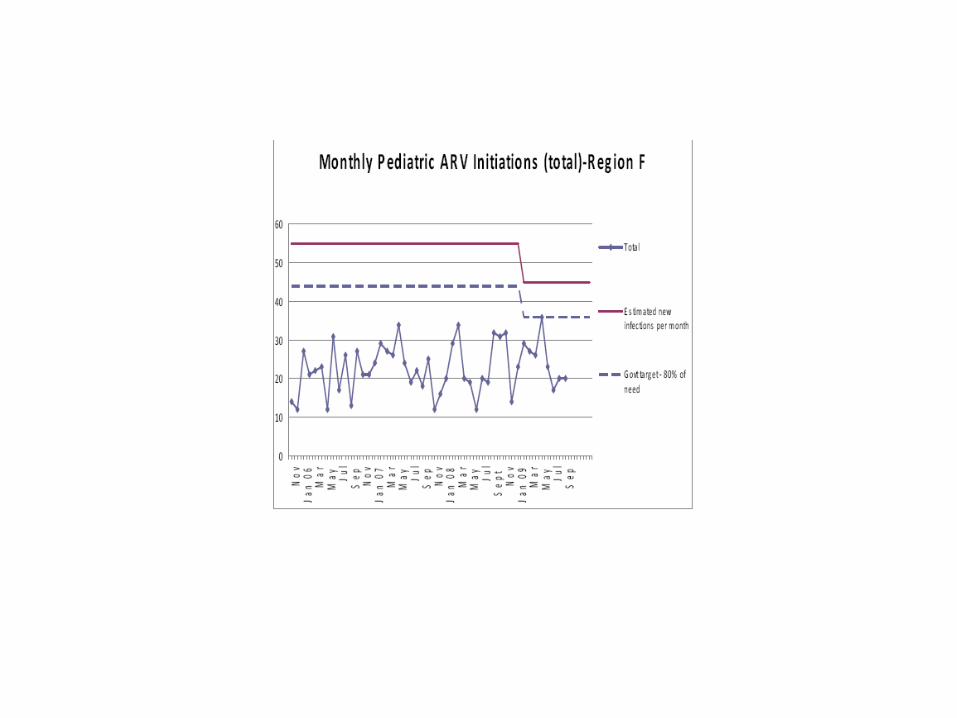
Paediatrics
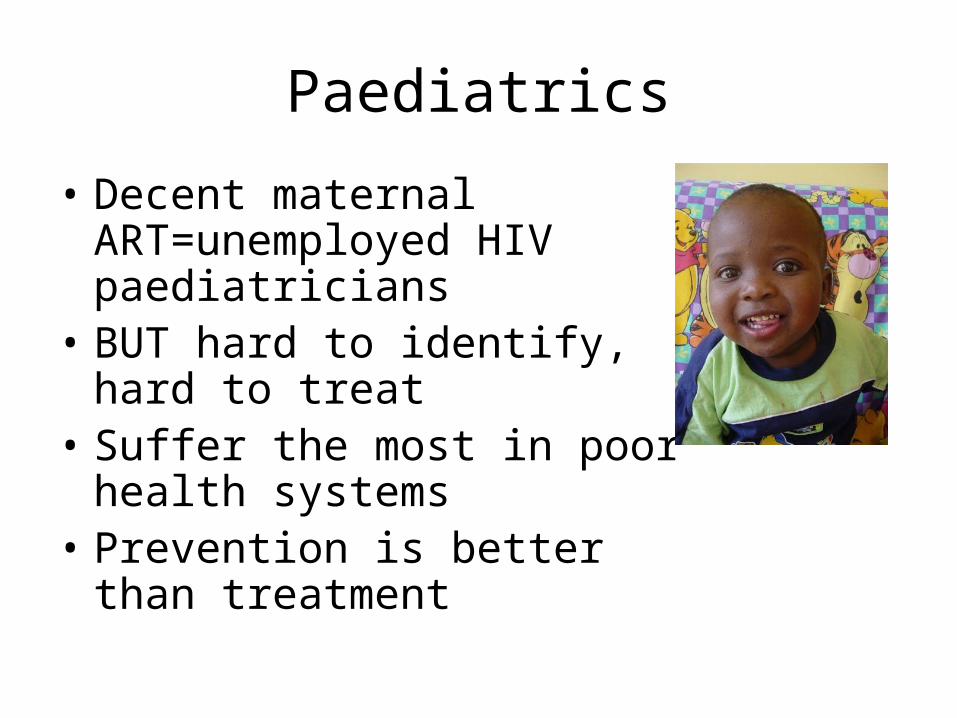
• Decent maternal ART=unemployed HIV paediatricians
• BUT hard to identify, hard to treat
• Suffer the most in poor health systems
• Prevention is better than treatment
Task shifting
• Cost of SA health care workers is very high
• Excuse for not scaling up, despite relatively high staffing levels
• Paradoxically, meant that task shifting has not happened
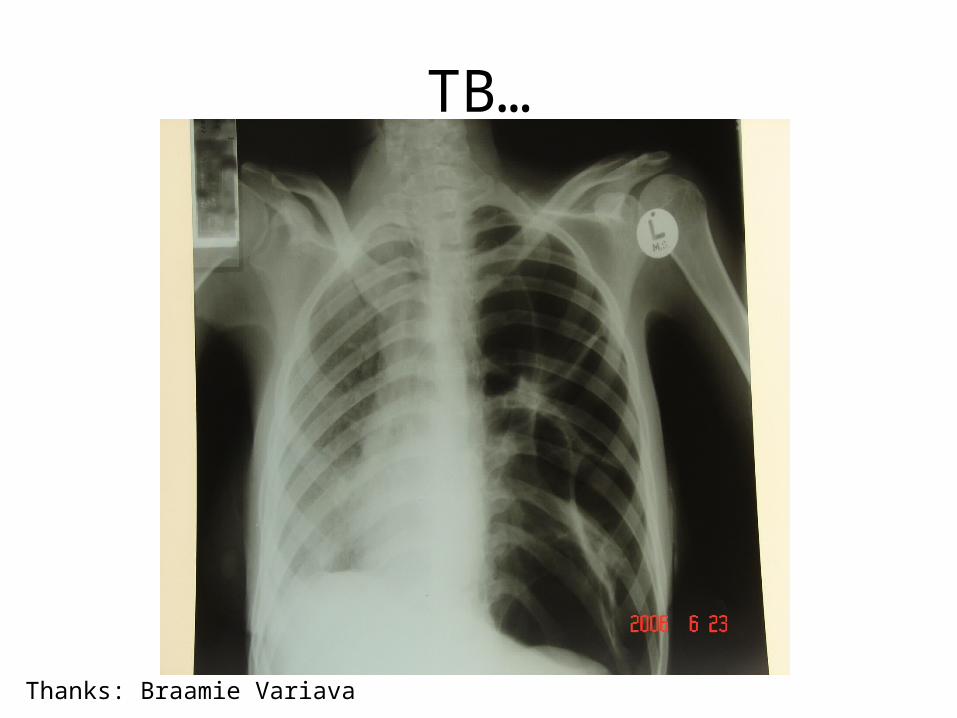
TB…
Thanks: Braamie Variava
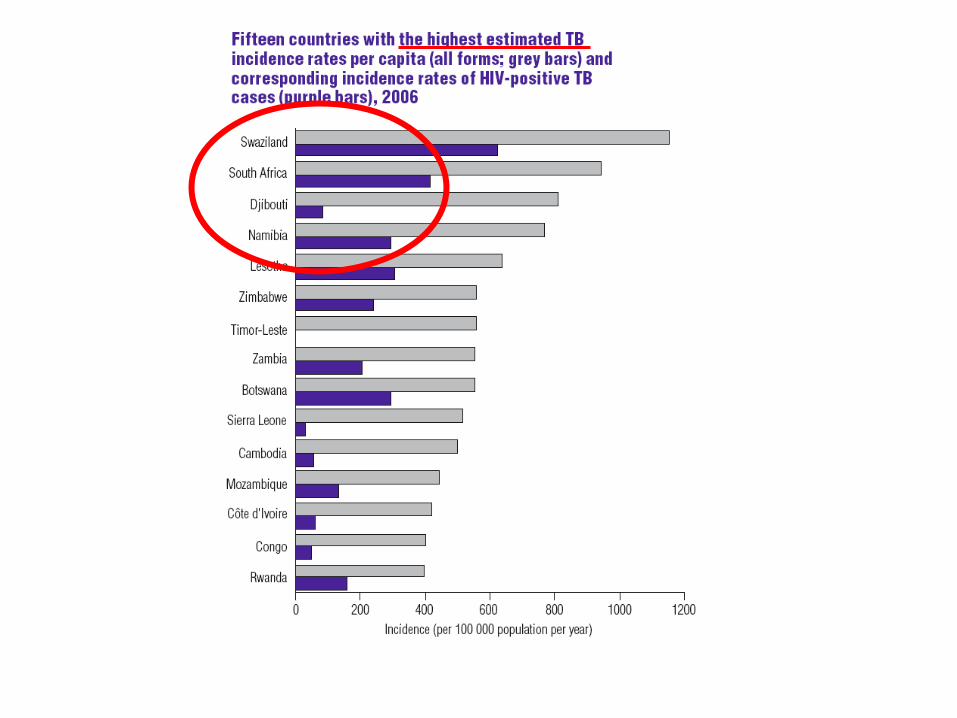
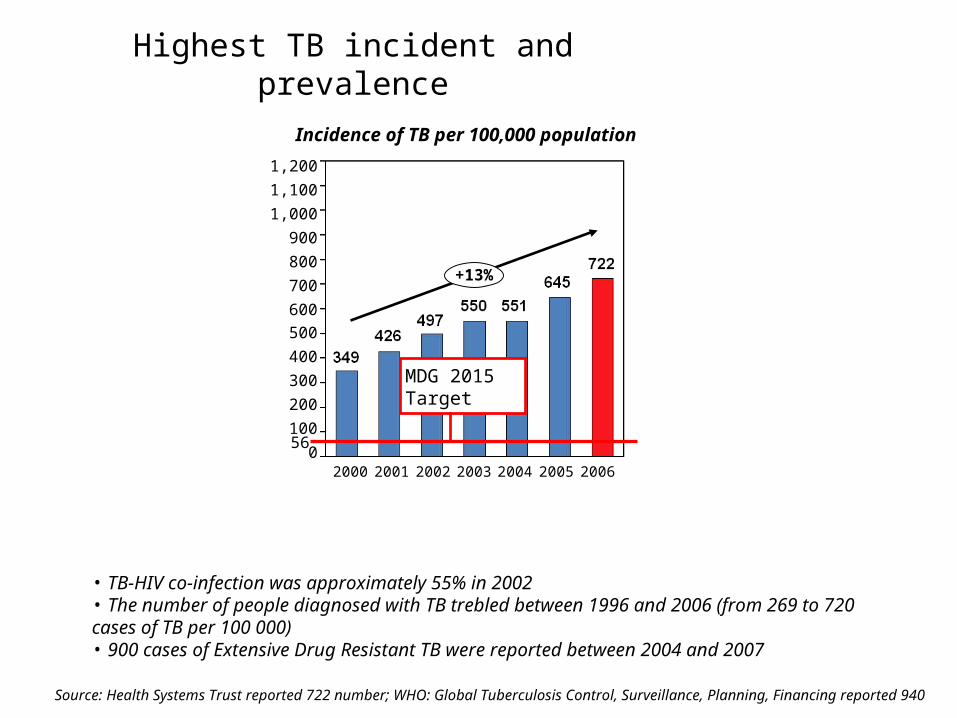
Highest TB incident and prevalence
2006
+13%
0
100
1,000
1,100
1,200
200
300
400
500
600
700
800
900
2000 2001 2002 2003 2004 2005
Incidence of TB per 100,000 population
MDG 2015 Target
56
Source: Health Systems Trust reported 722 number; WHO: Global Tuberculosis Control, Surveillance, Planning, Financing reported 940
• TB-HIV co-infection was approximately 55% in 2002• The number of people diagnosed with TB trebled between 1996 and 2006 (from 269 to 720 cases of TB per 100 000) • 900 cases of Extensive Drug Resistant TB were reported between 2004 and 2007
• ART best way to prevent TB
• IPT very hard to implement
The role of donors
• History – confrontational
• Patch up the gaping holes in the programme
• Now: sustainability and technical ability – ESPECIALLY critical reviews of data and resource usage
In summary:
• We’re still treating HIV as an acute illness
• Mortality is driven by late diagnosis, poor referral, and delayed ART – we aren’t acting urgently post diagnosis
• People who get ART, generally stay on it DESPITE the system (commonest reason for LTFU – changing jobs)
• Adherence is good, but failures are costly
What would I do?
• Quick and (relatively) easy: TDF, FDC’s, use tender process to get better deals on drug packaging, PMTCT
• ANC and TB clinics to test and start ART• Programmatically hard: Targets for every step – starting
with the provinces, down to a clinical level• Creative and expensive: Chronic disease grants,
medicine pick ups• Expand HIV testing in health facilities• Critically review certain programmes for LTFU – ‘know
your status’ not good enough• Review SANAC
The two elephants in the room
• Health systems and retention in care• The average South African does not want to
attend a state health facility (for good reason!)• Retention in care affects – OI prophylaxis, IPT,
‘prevention for positives’, discordant couple interventions, etc etc
• ? A chronic care system is the silo we need• Finally: Public health leadership – tough
choices, tough priority setting – focus on using existing resources more intelligently