Embed Size (px)
Citation preview

Getting non-major students Getting non-major students excited about geology using real excited about geology using real
data in classroomdata in classroom
Prajukti Bhattacharyya Prajukti Bhattacharyya
University of Wisconsin - University of Wisconsin - WhitewaterWhitewater

Why data-based authentic research? Why data-based authentic research?
• ““Learning science by doing science” Learning science by doing science” especially in lecture-only courses especially in lecture-only courses
• Avoiding “cookbook” assignments with Avoiding “cookbook” assignments with known solutionsknown solutions
• Relating course materials to real worldRelating course materials to real world
• It is never too early for getting students It is never too early for getting students involved in authentic research activitiesinvolved in authentic research activities
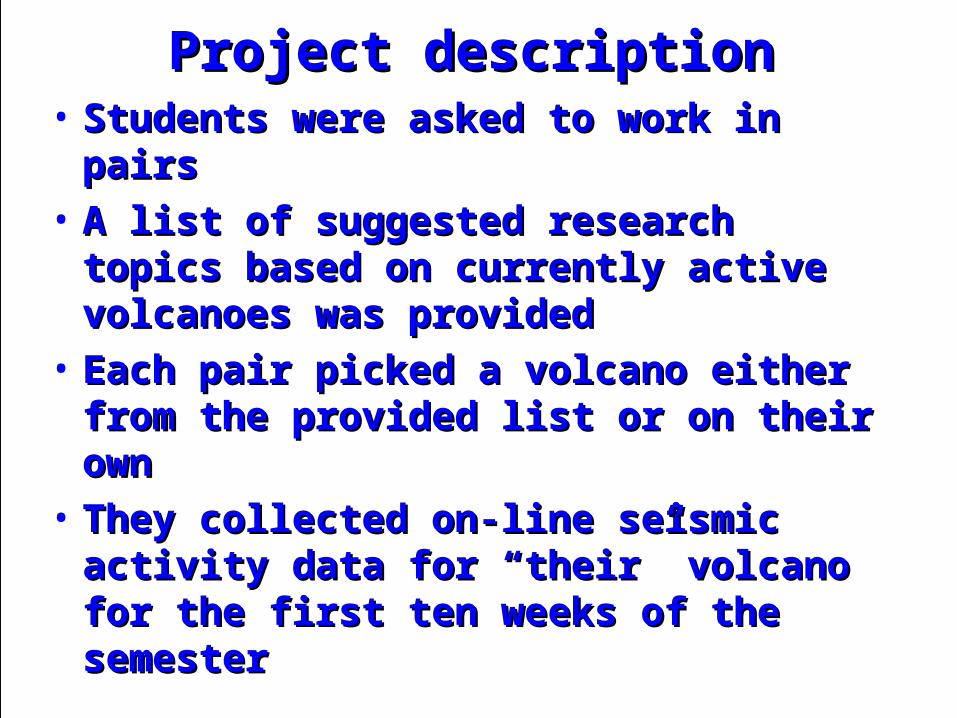
Project descriptionProject description• Students were asked to work in pairsStudents were asked to work in pairs
• A list of suggested research topics A list of suggested research topics based on currently active volcanoes based on currently active volcanoes was provided was provided
• Each pair picked a volcano either from Each pair picked a volcano either from the provided list or on their ownthe provided list or on their own
• They collected on-line seismic activity They collected on-line seismic activity data for “their” volcano for the first ten data for “their” volcano for the first ten weeks of the semesterweeks of the semester

Project description contd.Project description contd.
• They plottedthe earthquake epicenter They plottedthe earthquake epicenter locations using ArcMaplocations using ArcMap® and conducted ® and conducted some some spatial analyses on thosespatial analyses on those
• A geography major specializing in GIS A geography major specializing in GIS techniques was the technical resource techniques was the technical resource for this course (for this course (saved my sanity saved my sanity ))
• Students publicly presented their project Students publicly presented their project in a poster sessionin a poster session
• Guidelines and grading rubrics for the Guidelines and grading rubrics for the graded portions of the project were graded portions of the project were provided on-lineprovided on-line

By Lauren, Brittany and Chelsey
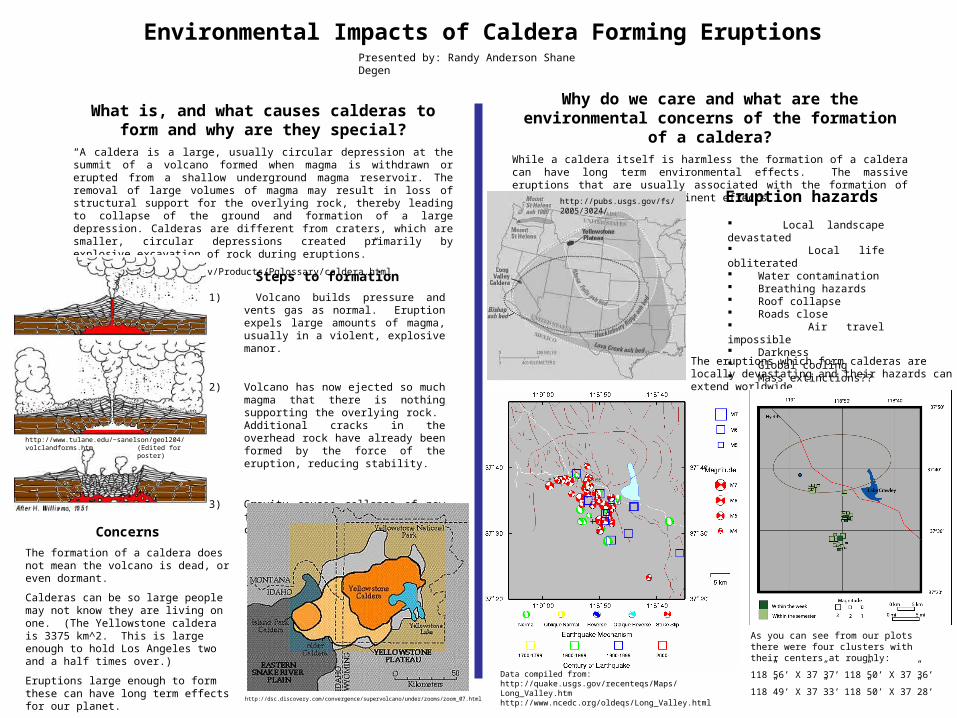
What is, and what causes calderas to form and why are they special?
“A caldera is a large, usually circular depression at the summit of a volcano formed when magma is withdrawn or erupted from a shallow underground magma reservoir. The removal of large volumes of magma may result in loss of structural support for the overlying rock, thereby leading to collapse of the ground and formation of a large depression. Calderas are different from craters, which are smaller, circular depressions created primarily by explosive excavation of rock during eruptions.”
http://volcanoes.usgs.gov/Products/Pglossary/caldera.html
Steps to formation
1) Volcano builds pressure and vents gas as normal. Eruption expels large amounts of magma, usually in a violent, explosive manor.
2) Volcano has now ejected so much magma that there is nothing supporting the overlying rock. Additional cracks in the overhead rock have already been formed by the force of the eruption, reducing stability.
3) Gravity causes collapse of now free hanging rock, resulting in caldera.
Environmental Impacts of Caldera Forming Eruptions
http://www.tulane.edu/~sanelson/geol204/volclandforms.htm
http://dsc.discovery.com/convergence/supervolcano/under/zooms/zoom_07.html
Concerns
The formation of a caldera does not mean the volcano is dead, or even dormant.
Calderas can be so large people may not know they are living on one. (The Yellowstone caldera is 3375 km^2. This is large enough to hold Los Angeles two and a half times over.)
Eruptions large enough to form these can have long term effects for our planet.
(Edited for poster)
Why do we care and what are the environmental concerns of the formation of a caldera?
While a caldera itself is harmless the formation of a caldera can have long term environmental effects. The massive eruptions that are usually associated with the formation of calderas can have very prominent effects.
Local landscape devastated Local life obliterated Water contamination Breathing hazards Roof collapse Roads close Air travel impossible Darkness Global cooling Mass extinctions??
http://pubs.usgs.gov/fs/2005/3024/ Eruption hazards
Data compiled from:http://quake.usgs.gov/recenteqs/Maps/Long_Valley.htmhttp://www.ncedc.org/oldeqs/Long_Valley.html
Presented by: Randy Anderson Shane Degen
The eruptions which form calderas are locally devastating and their hazards can extend worldwide.
As you can see from our plots there were four clusters with their centers at roughly:
118”56’ X 37”37’ 118”50’ X 37”36’
118”49’ X 37”33’ 118”50’ X 37”28’

Authentic research as a learning tool: Authentic research as a learning tool: Student commentsStudent comments
“ “The project was very fun, interesting, and The project was very fun, interesting, and informative. I also liked the presentation format in informative. I also liked the presentation format in the lobby, it takes some pressure off the the lobby, it takes some pressure off the students.”students.”
““I found the research not to be a chore, which I found the research not to be a chore, which was very refreshing.” was very refreshing.”

““Making the connection between GIS Making the connection between GIS program…, something I thought was program…, something I thought was only for geography people”only for geography people”
““We had a tough time making the map and figuring We had a tough time making the map and figuring out GIS, but we figured it out and made it work.” out GIS, but we figured it out and made it work.”
““I really appreciated that I was able to get some I really appreciated that I was able to get some good information from other students without good information from other students without having to do the research myself.” having to do the research myself.”

““I had fun working on this project and I liked the I had fun working on this project and I liked the whole idea of having us standing by our posters whole idea of having us standing by our posters and presenting them to whoever had questions.”and presenting them to whoever had questions.”
“ “I would suggest this assignment for future I would suggest this assignment for future classes bases (classes bases (sicsic) on the fun and knowledge I ) on the fun and knowledge I gained from it.” gained from it.”
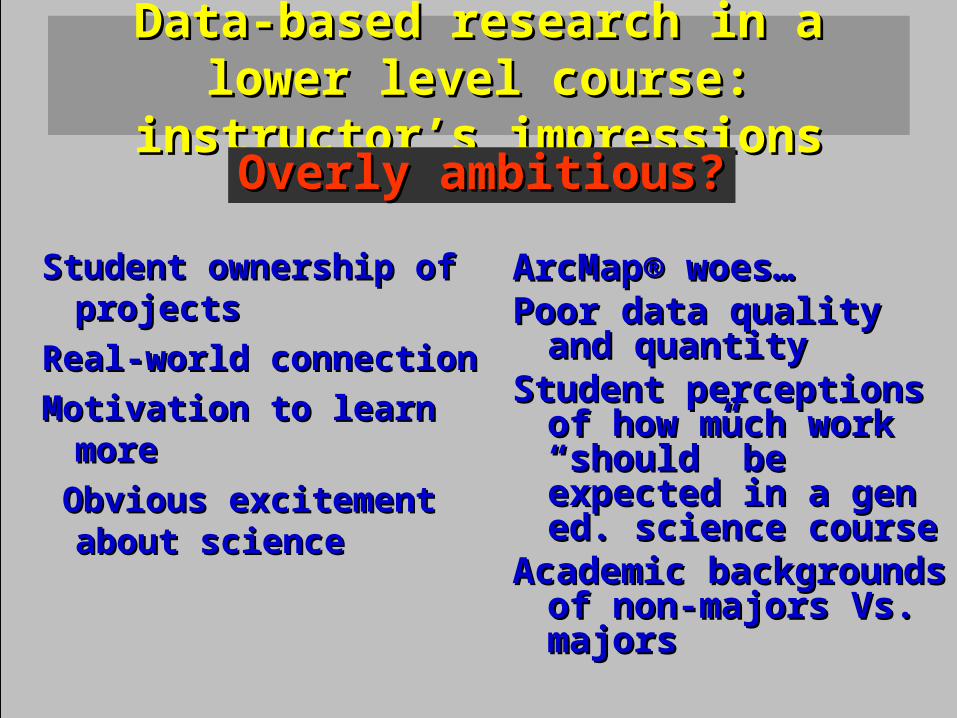
Data-based research in a lower level Data-based research in a lower level course: instructor’s impressionscourse: instructor’s impressions
Student ownership of Student ownership of projectsprojects
Real-world connectionReal-world connection
Motivation to learn moreMotivation to learn more
Obvious excitement Obvious excitement about scienceabout science
ArcMapArcMap® woes…® woes…Poor data quality and Poor data quality and
quantity quantity Student perceptions of Student perceptions of
how much work how much work “should” be expected “should” be expected in a gen ed. science in a gen ed. science coursecourse
Academic backgrounds Academic backgrounds of non-majors Vs. of non-majors Vs. majorsmajors
Overly ambitious?Overly ambitious?

Other ways I have used real time/near-real time data in my courses:
• Plate motion labs based on GPS data available from UNAVCO (http://www.unavco.org/edu_outreach/data.html)
• Current and archived weather data available from Weather Underground (http://www.wunderground.com/)
• Air quality data for Wisconsin (http://dnrmaps.wisconsin.gov/imf/imf.jsp?site=wisards)

Assessment• Assessment for data-based projects
Each part of the project (abstract, data quality, interpretation… etc. ) gets graded separately according to a grading rubric
The poster and student presentation (final product) gets graded
Students submit a written report evaluating their own learning
Students critically evaluate each other (provide anonymous written feedback)
• Assessment for data-based labsStudents answer questions based on data/graphs
or graphically solve problems
Other possible assessment method(s)
• Performance-based assessments (students can be given a real-life problem that would require proper data collection and data analyses/syntheses methods– Example: Determine the risk level of a
volcano (you have to understand what the current data means in order to do that)