Embed Size (px)
Citation preview

Getting It Right: Performance
Based Integrated Curriculum in
Small Learning Communities
Penni Hudis and Kathleen Harris
ConnectEd: The California Center for College and
Career
Objectives
• Identify key elements of quality
integrated curriculum
• Recognize value of performance maps
• Determine how performance maps can
be used in project development
• Practice using maps to find connections
3
Motivation and Rigor
1. Tap motivation
FORCED TO…....NEED TO…….WANT TO
You push…..They comply…..They seek
2. Engage in meeting standards that
are aligned with assessment
expectations
4
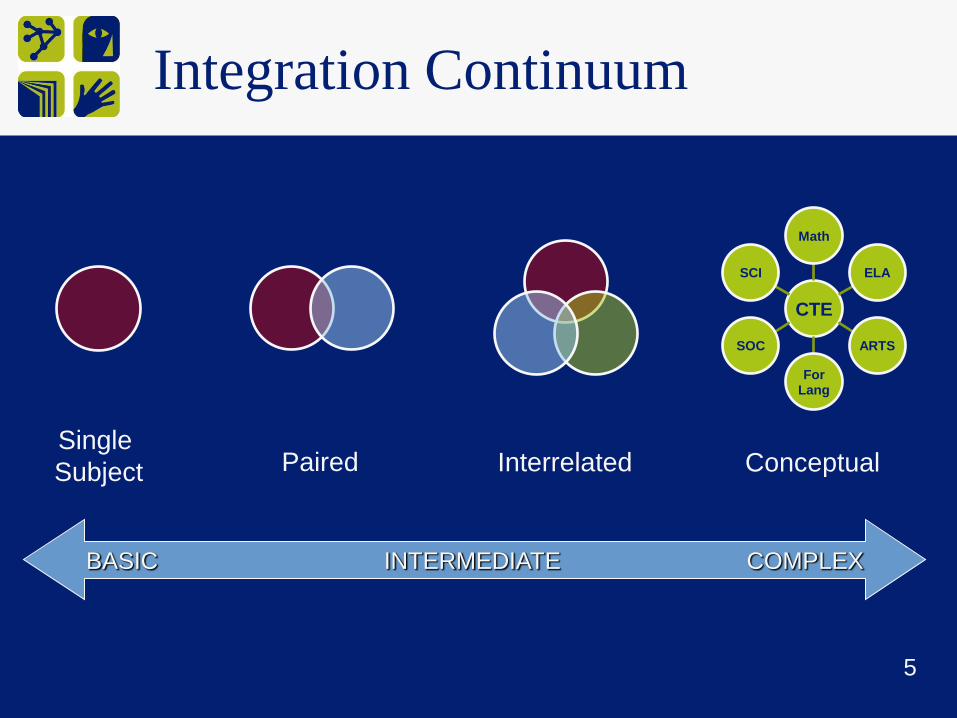
BASIC INTERMEDIATE COMPLEX
Integration Continuum
CTE
Math
ELA
ARTS
ForLang
SOC
SCI
Single
Subject Paired Interrelated Conceptual
5
Integrated Curriculum Design
• Curriculum/Performance mapping
• Overarching theme
• Essential questions
• Performance assessments
• Industry partners
• Reflection and revision6
Integrated Planning in Action
7
Integrated Projects
• Standards driven – timely and identifies
level of mastery
• Inquiry driven – becomes the students’
problem
• Authentic – product, performance,
service or solution
• Personalized – differentiated based on
students’ motivation and skills8

Quality integrated curriculum
ACTIVITY:
Review the sample
projects as directed using
the rubric provided
9

Reflection
Session Worksheet
Question One
10
Begin With the End in Mind
All things are created twice:
first mentally and then physically.
The key to creativity is to begin
with the end in mind, with a vision and a
blueprint of the desired result.
11
What is the end?
• The project or activity
• The course outline/pacing guide
• Performance of standards
12
What Can Performance Maps
Do For Teachers?
In single subject
• Provide a tool for looking at their
classes and how they might address
relevancy and motivation
• Help teachers identify areas where
students may needs skills remediation
or special help before they fall behind
13
What Can Performance Maps
Do For Teachers?
Across disciplines
• Provide a tool for looking across
students’ program of study to find
natural connections and build projects
14
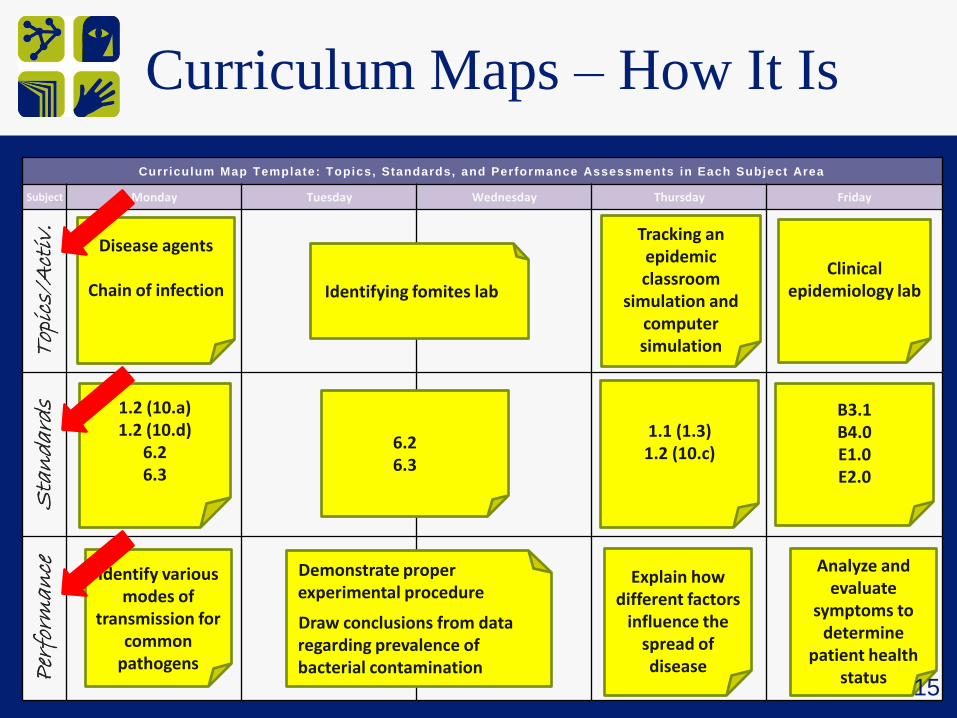
Curriculum Maps – How It Is
Curriculum Map Template: Topics, Standards, and Performance Assessments in Each Subject Area
Subject Monday Tuesday Wednesday Thursday Friday
Topics/Activ.
Standards
Performance
Disease agents
Chain of infection
Tracking an epidemic classroom
simulation and computer simulation
Identifying fomites labClinical
epidemiology lab
6.26.3
1.2 (10.a)1.2 (10.d)
6.26.3
1.1 (1.3)1.2 (10.c)
B3.1B4.0E1.0E2.0
Demonstrate proper experimental procedure
Draw conclusions from data regarding prevalence of bacterial contamination
Analyze and evaluate
symptoms to determine
patient health status
Explain how different factors
influence the spread of disease
Identify various modes of
transmission for common
pathogens
15
Unpacking the Standards
Verbs matter!
Verbs establish the level of learning
and drive the assessment
methods
Activities in the project must allow
students to demonstrate the
desired level of learning16
Bloom’s Revised Taxonomy
• Remembering
• Understanding
• Applying
• Analyzing
• Evaluating
• Creating17
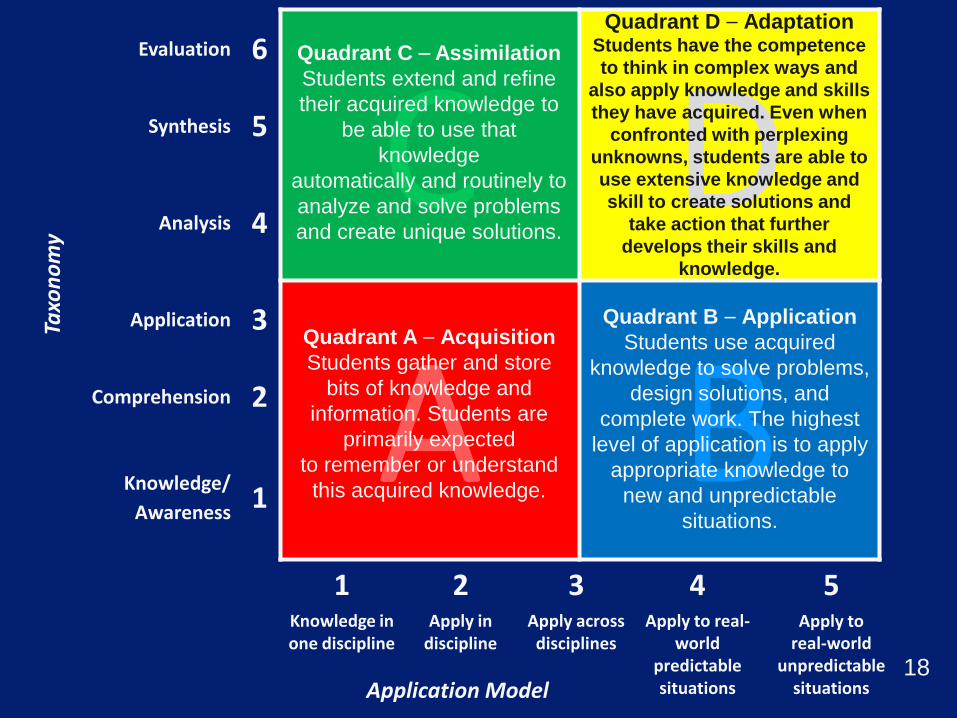
Taxonomy
Evaluation 6
C DSynthesis 5
Analysis 4
Application 3
A BComprehension 2
Knowledge/
Awareness1
1 2 3 4 5Knowledge in one discipline
Apply in discipline
Apply across disciplines
Apply to real-world
predictable situations
Apply to real-world
unpredictable situationsApplication Model
Quadrant A ⎯ Acquisition
Students gather and store
bits of knowledge and
information. Students are
primarily expected
to remember or understand
this acquired knowledge.
Quadrant B ⎯ Application
Students use acquired
knowledge to solve problems,
design solutions, and
complete work. The highest
level of application is to apply
appropriate knowledge to
new and unpredictable
situations.
Quadrant C ⎯ Assimilation
Students extend and refine
their acquired knowledge to
be able to use that
knowledge
automatically and routinely to
analyze and solve problems
and create unique solutions.
Quadrant D ⎯ AdaptationStudents have the competence
to think in complex ways and
also apply knowledge and skills
they have acquired. Even when
confronted with perplexing
unknowns, students are able to
use extensive knowledge and
skill to create solutions and
take action that further
develops their skills and
knowledge.
18

Curriculum Map – How It Should
BeCurriculum Map Template: Topics, Standards, and Performance Assessments in Each Subject Area
Monday Tuesday Wednesday Thursday Friday
Standards.
Performance
Topics/Activ
6.26.3
1.2 (10.a)1.2 (10.d)
6.26.3
1.1 (1.3)1.2 (10.c)
B3.1B4.0E1.0E2.0
Demonstrate proper experimental procedure
Draw conclusions from data regarding prevalence of bacterial contamination
Analyze and evaluate
symptoms to determine
patient health status
Explain how different factors
influence the spread of disease
Identify various modes of
transmission for common
pathogens
???
?
19
Curriculum Map Template: Topics, Standards, and Performance Assessments in Each Subject Area
Subject Week 1 Week 2 Week 3 Week 4 Week 5
20
Curriculum Map Template: Topics, Standards, and Performance Assessments in Each Subject Area
Subject August September October November December
21

Curriculum Map Template: Topics, Standards, and Performance Assessments in Each Subject Area
Subject Monday Tuesday Wednesday Thursday Friday
22
Reflection
Session Worksheet
Question Two
23

Finding Connection Among
Subjects
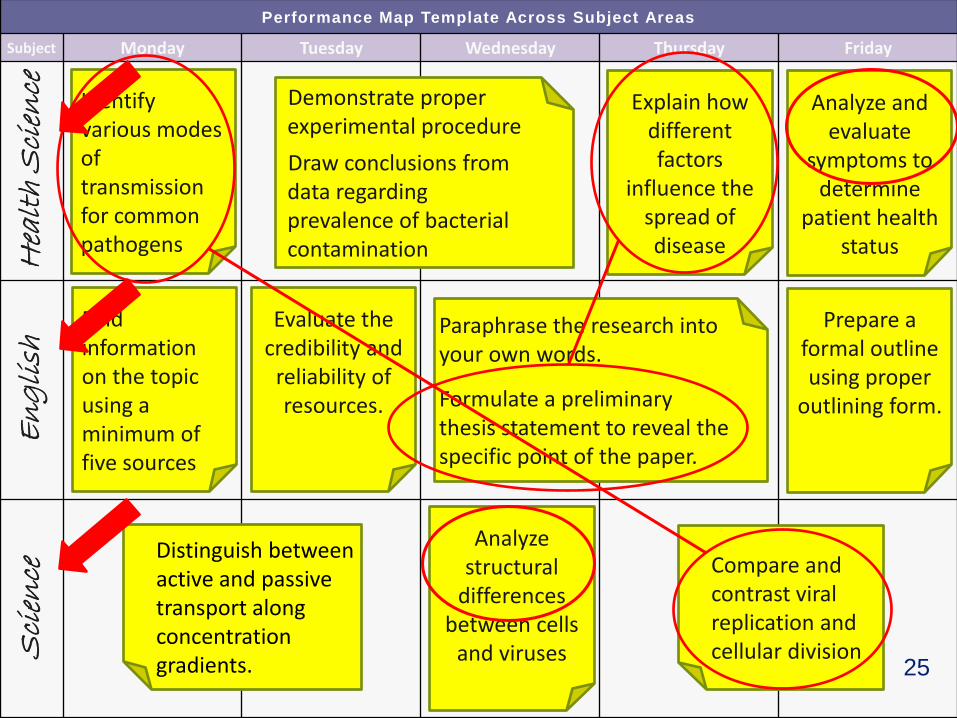
Performance Map Template Across Subject Areas
Subject Monday Tuesday Wednesday Thursday FridayHealthScience
English
Science
Find information on the topic using a minimum of five sources
Evaluate the credibility and
reliability of resources.
Paraphrase the research into your own words.
Formulate a preliminary thesis statement to reveal the specific point of the paper.
Prepare a formal outline using proper
outlining form.
Distinguish between active and passive transport along concentration gradients.
Analyze structural
differences between cells
and viruses
Compare and contrast viral replication and cellular division
Demonstrate proper experimental procedure
Draw conclusions from data regarding prevalence of bacterial contamination
Explain how different factors
influence the spread of disease
Identify various modes of transmission for common pathogens
Analyze and evaluate
symptoms to determine
patient health status
25
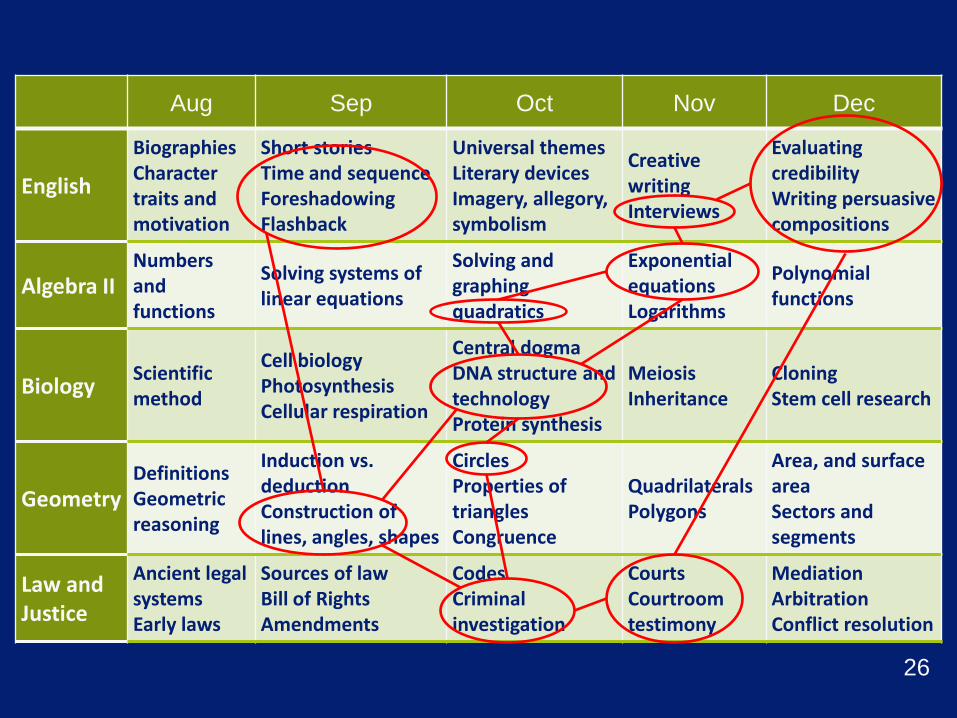
Aug Sep Oct Nov Dec
English
BiographiesCharacter traits and motivation
Short storiesTime and sequenceForeshadowingFlashback
Universal themesLiterary devices Imagery, allegory, symbolism
Creative writingInterviews
Evaluating credibilityWriting persuasive compositions
Algebra IINumbers and functions
Solving systems of linear equations
Solving and graphing quadratics
Exponential equationsLogarithms
Polynomial functions
BiologyScientific method
Cell biologyPhotosynthesisCellular respiration
Central dogmaDNA structure and technologyProtein synthesis
MeiosisInheritance
CloningStem cell research
GeometryDefinitionsGeometric reasoning
Induction vs. deductionConstruction of lines, angles, shapes
CirclesProperties of trianglesCongruence
QuadrilateralsPolygons
Area, and surface areaSectors and segments
Law and Justice
Ancient legal systemsEarly laws
Sources of lawBill of RightsAmendments
CodesCriminal investigation
CourtsCourtroom testimony
MediationArbitrationConflict resolution
26
Connections across subjects
come from both verbs (skills)
AND applications (content)
27
The goal of performance
mapping is to find cross-subject
area connections from which to
build an authentic project
28
Key role for CTE teachers
Key opportunity for
Industry/Advisory partners
Getting Started on
Performance Mapping
• Agree on the level of granularity
(week vs. month) of map
• Establish the time spans for your
maps (which sets an upper limit on
the project)
• Design the (standardized?) physical
format
29
Getting Started on
Performance Mapping
• Determine the means for sharing the
maps
• Schedule curriculum design meetings
• Establish a strategy for providing
technical assistance
30
Building Connections into Lessons
or Projects
Building the Lesson or Project
• Find the link—concept, idea, and/or
skill in common
• Determine authentic context for
performance measures
• Align the appropriate activities to the
context and performance measures
32
33
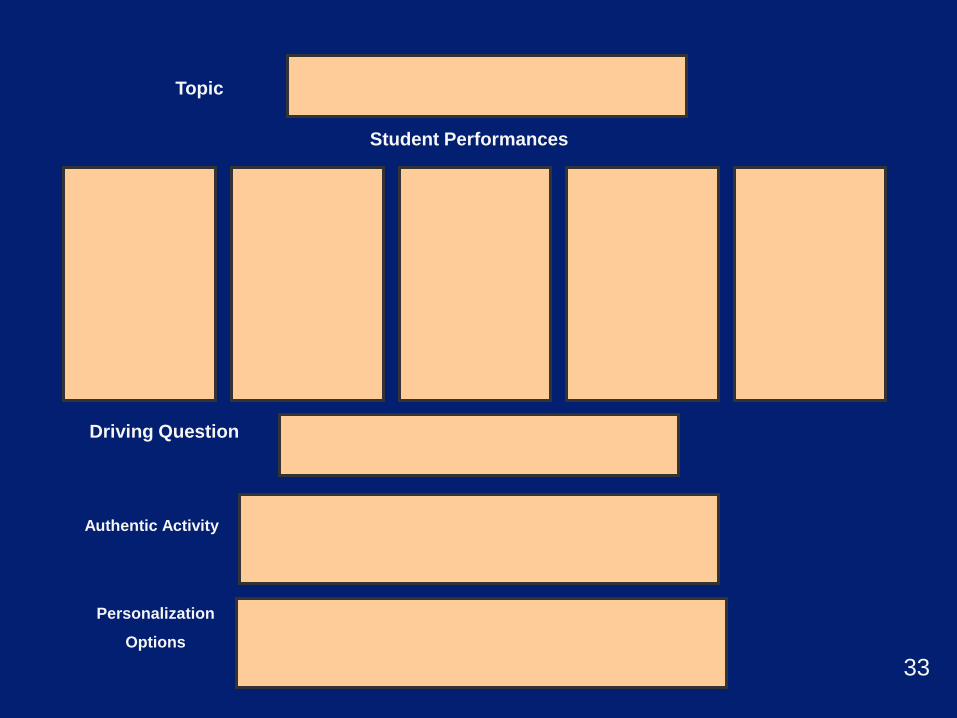
Topic
Student Performances
Authentic Activity
Personalization
Options
Driving Question
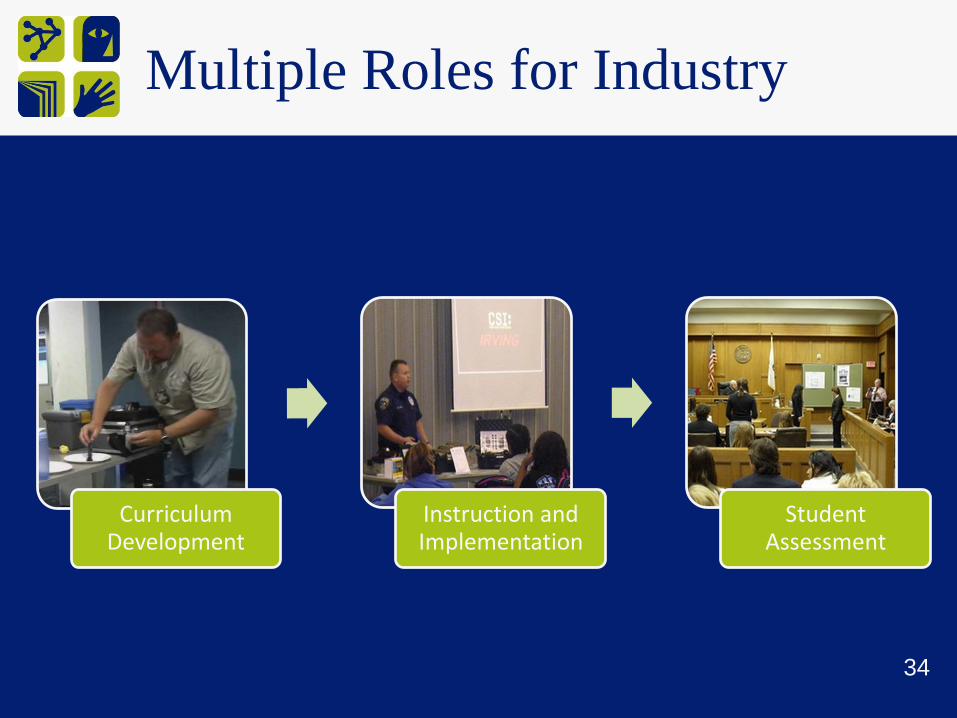
Multiple Roles for Industry
Curriculum Development
Instruction and Implementation
Student Assessment
34
Reflection
Session Worksheet
Question Three
35
RUBRICS
• STANDARD: uses verbs that imply
level of performance
• CRITERIA: describes competence
• SCALE: rates student performance in
relationship to competence
36
Adapting Existing Curriculum
• Use map to find timely connections to
the concept, driving questions or topic of
the lesson/project
• Adjust activities in the project to match
performances identified from the map
• Revise assessment tools to reflect new
performance expectations
37
Reflection
Session Worksheet
Question Four
38