Embed Size (px)
Citation preview
Getting a grip on GASB and pension funding
2
Today’s presenters
Beth Kellar President/CEO Center for State and Local Government Excellence
Rich Harris Finance and Compliance Officer Denver Employees Retirement Plan, and Vice Chair of the GFOA Committee on Retirement and Benefits Administration
3
Three sets of pension numbers
1. Books - accounting (GASB) – balance sheet
2. Bonds – (ratings agencies) 3. Budgets - funding (government) – the
annual required contribution (ARC)

4
Books: GASB’s new accounting standards • Use blended rate to discount liabilities • Market valuation of assets • No longer address how to calculate the
ARC • Use the Entry Age Normal cost method • If you are in a multiemployer cost-sharing
plan, you must report the proportional share of pension liability on your balance sheet
5
Be prepared
• Entry Age Normal cost method will be required
• The “smoothing” period for investment losses/gains is limited to 5 years
• Unfunded liabilities must be amortized over the “average remaining service life” of pension plan members
• Get to know your actuaries well!

6
Timeline for GASB Reporting
• GASB Statement No. 67, Financial Reporting for Pension Plans: Effective for pension plan fiscal years beginning after June 15, 2013
• GASB Statement No. 68, Accounting and Reporting for Pensions: Effective for employers (and contributing nonemployer) for fiscal years beginning after June 15, 2014

7
GASB’s New Net Pension Liability • New calculation to report on government financial
statements (even if ARC fully paid) • Net pension liability = the difference between the
market value of pension fund assets and benefit obligations as of a specific date
• More volatility to be expected due to fluctuations in annual market value of assets
• Many plans can expect this new calculation of unfunded liabilities to be larger than current GASB measures (Unfunded Actuarial Accrued Liabilities)
8
Bonds – the ratings agencies
• Ratings analysts calculate how pension obligations affect credit worthiness
• Each ratings agency has its own practices • Some ratings agencies say they will adjust
pension data using uniform (generally more conservative) assumptions regarding amortization periods and investment returns
• Different assumptions from GASB
9
Budgets and pension funding • Key is to calculate what is needed each year to
properly fund benefits: the Annual Required Contribution (ARC)
• Actuaries calculate the ARC • New GASB standards no longer address how to
calculate the ARC • New standards refer to an actuarially determined
contribution or a statutory contribution • Follow the Pension Funding Task Force
recommendations
10
What is the ARC? According to GASB, the ARC is the payment required to keep the plan on a steady path toward full funding.
ARC = Normal cost (the present value of the benefit accrued each year) + a payment to amortize the unfunded liability (typically has been over a 30-year period)
Each year the plan sponsor reports what percentage of the ARC the employer actually paid.
11
Why the national associations are concerned
• No more guidance on funding standards • Media and public focus on pension
funding • Public officials need a credible, consistent
approach • In a vacuum, much mischief can occur
12
Putting pension funding issues into perspective • We’ve fixed funding problems in the past –
“pay as you go” was common in the 1970s • GASB disclosure requirements (1986)
stimulated better funding • Most plans were fully funded by 2000 • The last decade hit pension plans hard – two
recessions and more retirees to support • In 2012, only 33 percent of plans were over 80
percent funded • Average funded ratio in 2012 was 73 percent
13
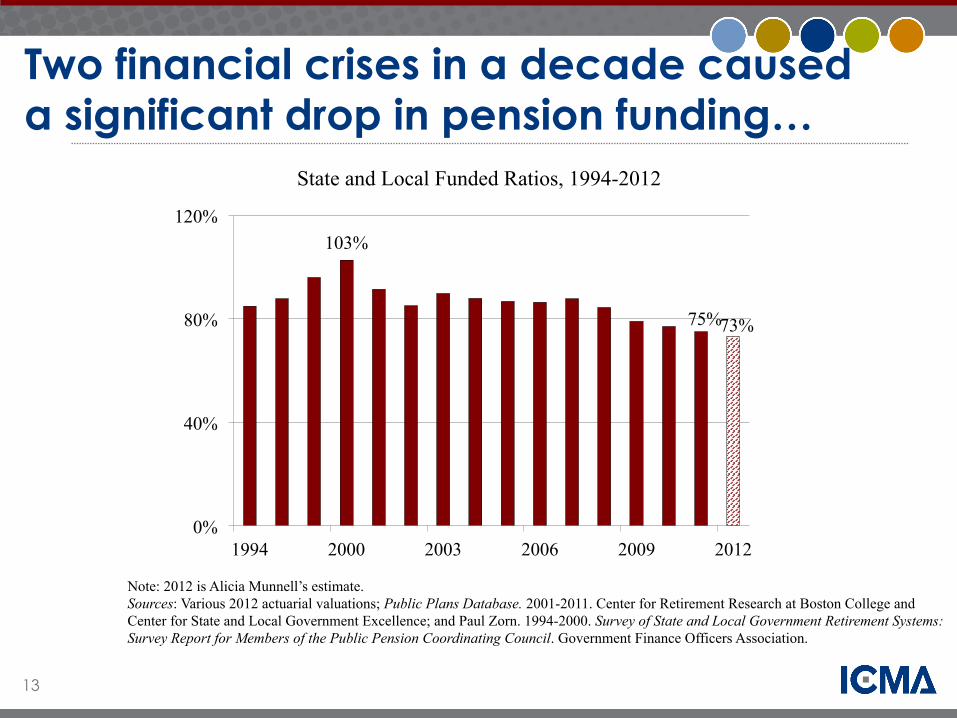
Two financial crises in a decade caused a significant drop in pension funding…
State and Local Funded Ratios, 1994-2012
Note: 2012 is Alicia Munnell’s estimate. Sources: Various 2012 actuarial valuations; Public Plans Database. 2001-2011. Center for Retirement Research at Boston College and Center for State and Local Government Excellence; and Paul Zorn. 1994-2000. Survey of State and Local Government Retirement Systems: Survey Report for Members of the Public Pension Coordinating Council. Government Finance Officers Association.
103%
75% 73%
0%
40%
80%
120%
1994 2000 2003 2006 2009 2012

14
…and a more than doubling of the ARC.
Annual Required Contribution as a Percentage of Payroll, 2001-2012
Note: 2012 is Alicia Munnell’s estimate. Sources: Various 2012 actuarial valuations; and Public Plans Database. 2001-2011. Center for Retirement Research at Boston College and Center for State and Local Government Excellence.
6.4% 6.4% 7.4%
9.0% 10.5% 11.0% 11.5% 11.7% 12.1%
13.4% 15.2% 15.3%
0%
6%
12%
18%
2001 2002 2003 2004 2005 2006 2007 2008 2009 2010 2011 2012
15
Poll Question
In the aggregate, what percentage of budget are pension costs? A. 4-5 percent B. 5-6 percent C. 7-8 percent D. 9-10 percent E. 11-12 percent
16
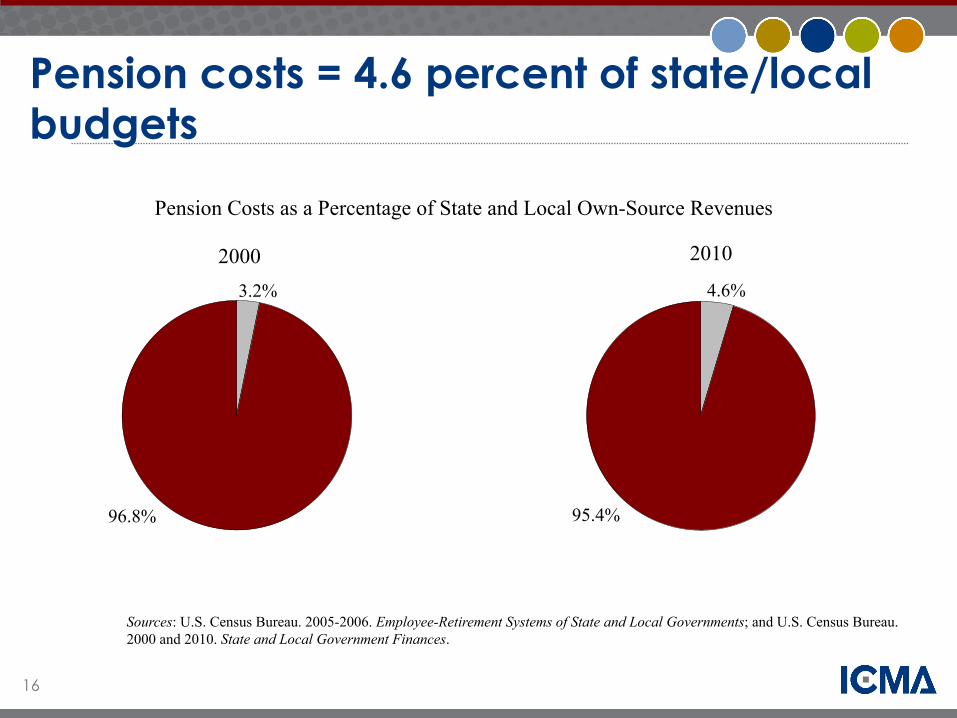
Pension costs = 4.6 percent of state/local budgets
Pension Costs as a Percentage of State and Local Own-Source Revenues
Sources: U.S. Census Bureau. 2005-2006. Employee-Retirement Systems of State and Local Governments; and U.S. Census Bureau. 2000 and 2010. State and Local Government Finances.
2010
3.2%
96.8%
4.6%
95.4%
2000
17
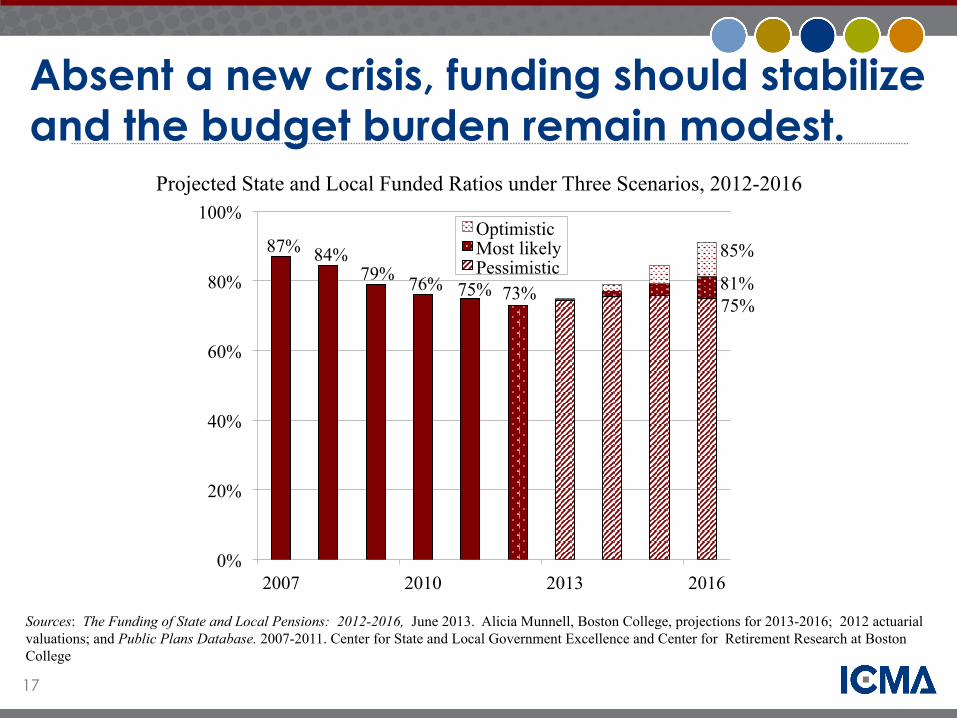
Absent a new crisis, funding should stabilize and the budget burden remain modest.
Sources: The Funding of State and Local Pensions: 2012-2016, June 2013. Alicia Munnell, Boston College, projections for 2013-2016; 2012 actuarial valuations; and Public Plans Database. 2007-2011. Center for State and Local Government Excellence and Center for Retirement Research at Boston College
Projected State and Local Funded Ratios under Three Scenarios, 2012-2016
87% 84% 79% 76% 75% 73%
75% 81%
85%
0%
20%
40%
60%
80%
100%
2007 2010 2013 2016
Optimistic Most likely Pessimistic
18
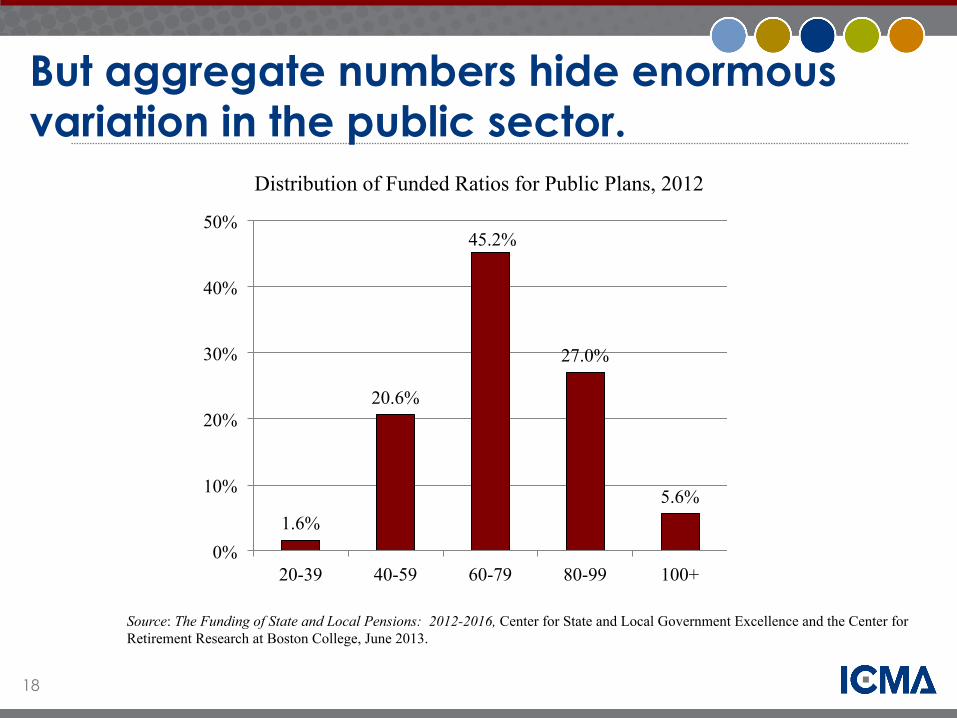
But aggregate numbers hide enormous variation in the public sector.
Source: The Funding of State and Local Pensions: 2012-2016, Center for State and Local Government Excellence and the Center for Retirement Research at Boston College, June 2013.
Distribution of Funded Ratios for Public Plans, 2012
1.6%
20.6%
45.2%
27.0%
5.6%
0%
10%
20%
30%
40%
50%
20-39 40-59 60-79 80-99 100+
19
Why did pension funding ratios slip?
• The economic downturns of 2001 and 2008 hurt funding levels of all public and private retirement plans
• Plan sponsors paying less than full ARC • Some pension plans made changes that
exacerbated their funding problems – lowering the retirement age – authorizing, but not funding, retroactive
benefit enhancements
20
Poll Question
What percentage of the ARC did plan sponsors pay in 2012? A. 60% B. 70% C. 80% D. 90% E. 100%
21
Why pension headaches won’t go away
• Plan sponsors paid 80 percent of ARC in 2012, same level as 2011
• New GASB pension accounting standards will create more confusion
• We’re now on our own to calculate annual funding requirements
• Assumptions often have to be adjusted • Rolling amortization periods

22
Pension Funding Task Force
• Released policy recommendations this year • Recommendations consistent with actuarial and
financial community guidance • Plain English • Who?
– Convened by the Center for State and Local Government Excellence
– Members are: ICMA, National League of Cities, National Association of Counties, U.S. Conference of Mayors, Government Finance Officers Association, National Governors Association, National Conference of State Legislatures, Council of State Governments, National Association of State Retirement Administrators, National Council on Teacher Retirement, and the National Association of State Auditors, Comptrollers, and Treasurers
23
What are the recommendations?

24
Pension funding policy objectives 1. Base pension funding policy on
actuarially determined ARC 2. Be disciplined about funding so that
promised benefits can be paid 3. Maintain intergenerational equity 4. Manage employer costs so they are a
consistent percentage of payroll 5. Have clear reporting that shows how and
when plans will be fully funded.

25
Why is a pension policy important?
• Employees want assurance that pension promises can be paid
• Employers need to manage costs • Trust! The funding plan should be credible
and clear to all.
26
Pension Funding Policy: core elements to address • Amortization policy
– e.g., 25 years
• Actuarial cost method – e.g., Entry Age Normal
• Asset smoothing method – e.g., a maximum 5-year smoothing period – gains and losses subject to same treatment
27
Transition Plan
Make pension funding policy changes over time. Example: an employer or retirement board that currently amortizes its unfunded liabilities over 30 years could adopt a transition plan to continue that schedule (as a fixed, decreasing period) for current unfunded liabilities and to amortize any new unfunded liabilities over 25 years. In five years, the pension plan would have completed its transition to a 25-year amortization period.

28
Why are some plans better funded than others?
• Consistent funding of the annual required contribution (ARC)
• Have appropriate full-retirement ages • Are realistic about investment assumptions • Do not allow extraordinary income to be
included in pension formulas • Take a long term view; no contribution
“holidays” in good times.
29
Pension reform lessons • Plan design changes pay big dividends over
time. 45 states enacted major changes in retirement plans 2009-2012
• Use long-term financial modeling to analyze pension benefits
• Ask for annual briefings from the plan sponsor and actuary; hire your own actuary
• Provide training to elected officials and pension trustees
• Communicate! Keep employees and the public fully informed.

30
IMRF Communications Strategy 1. Ongoing and frequent communications with
members through newsletters, Facebook, Twitter 2. Reach out to the media through editorial board
meetings to: a) Introduce IMRF (membership, major employers in the region,
not Cook County, not city of Chicago) b) Describe how pensions work – where the money comes from
and where the money goes c) Share pension research d) Share economic impact studies – impact of previous year's
total payout on local and regional economies. See http://www.imrf.org/info/economic_impact_studies/2012_Economic_Impact_Study.pdf)
31
IMRF Communications Strategy
3. Reach out to civic groups to: a) Help opinion leaders understand the economic value of pensions b) Describe how pensions work – where the money comes from and where the money goes c) Explain impact of pensions on local economy (spending by retirees, jobs supported)
32
What to do?
• Get a funding plan • Identify any changes you need to make • Agree on a transition plan (over how many
years will you phase in changes) • Make sure your funding policy complies
with actuarial standards • Secure an actuarially determined
contribution (ADC) so you can budget
33
Resources
1. Pension Funding: Guide for Elected Officials (Report from the Pension Funding Task Force) 2. Understanding New Public Pension Funding Guidelines and Calculations (“Books, Bonds, Budgets” one pager) Research on local and state government pensions, health benefits, demographics, and workforce issues slge.org

Case Study: Denver Employees Retirement Plan
35
DERP Background Info
• Established in 1963 • “General” City of Denver Employees
– No uniforms – No teachers
• Did include Hospital • Hospital “seceded” in 2001
– Existing employees given choice to stay in DERP or go to new hospital-sponsored 401(k)
– All new Hospital employees to new plan – Legacy Hospital Employees became a closed group…very
expensive – Separate cost-sharing agreement signed in 2006…they pay
“their share” based on their Normal Cost – Only have two employers…City and Hospital (shrinking)

36
DERP Demographics • No collective bargaining • 8,175 actives • 3,550 vested terms • 8,045 retirees and beneficiaries
37
DERP Plan Provisions • Traditional DB, Social Security eligible • Three tiers
– Tier 1 - Hired Before 9/1/04 • 2% Multiplier, • Rule of 75, minimum age 55 • Generous early retirement reduction factors • 5-year vesting • High (usually final) three-year average salary • No lump sums • Only ad hoc colas…none given since 2002
38
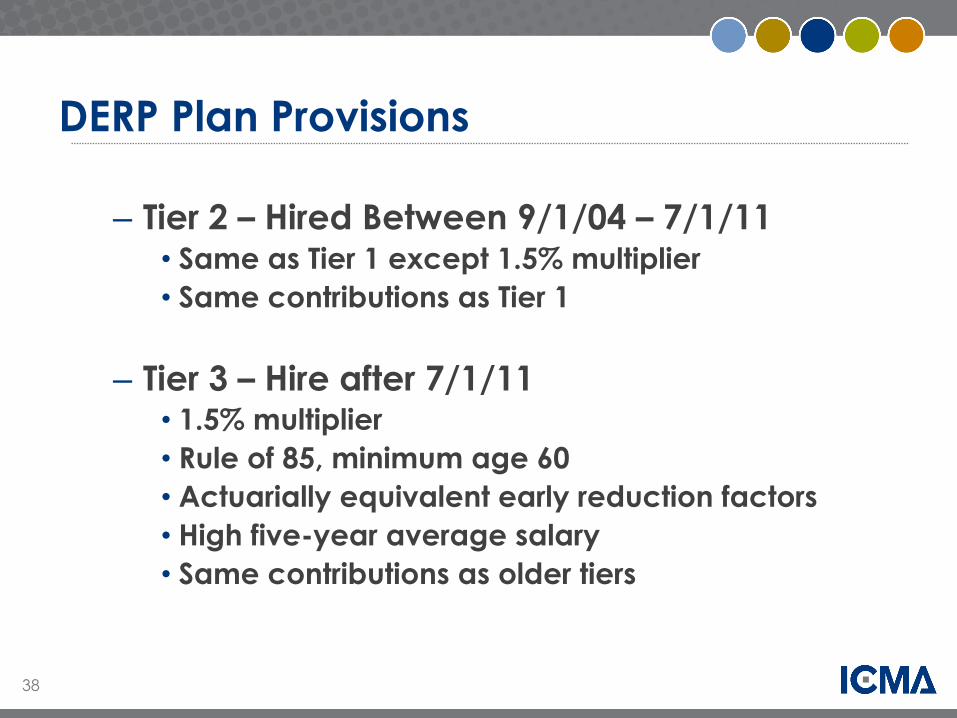
DERP Plan Provisions
– Tier 2 – Hired Between 9/1/04 – 7/1/11 • Same as Tier 1 except 1.5% multiplier • Same contributions as Tier 1
– Tier 3 – Hire after 7/1/11 • 1.5% multiplier • Rule of 85, minimum age 60 • Actuarially equivalent early reduction factors • High five-year average salary • Same contributions as older tiers
39
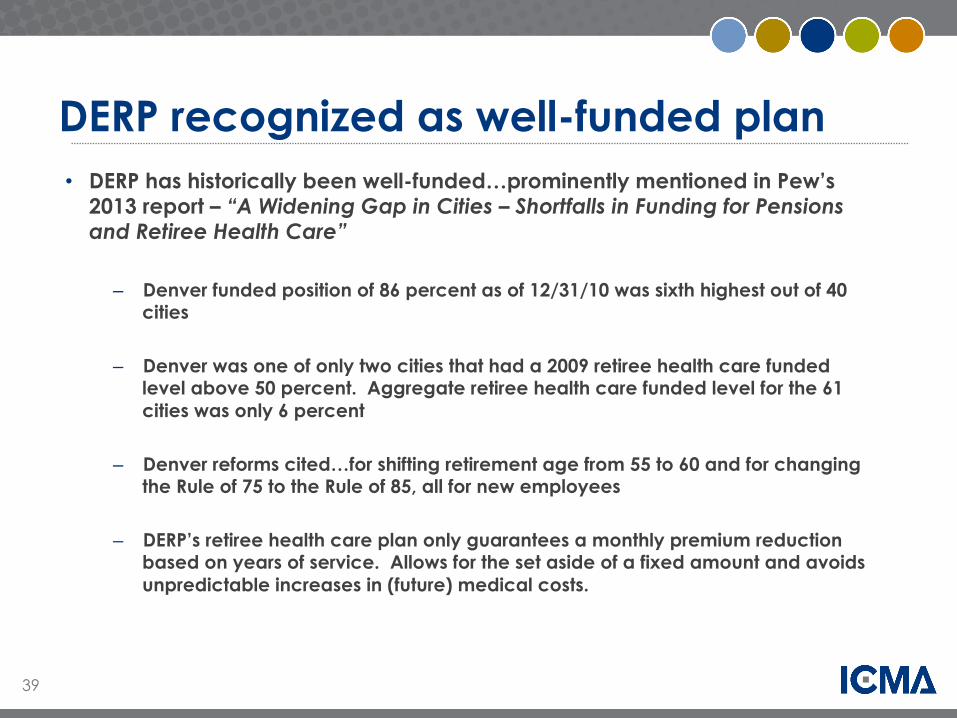
DERP recognized as well-funded plan • DERP has historically been well-funded…prominently mentioned in Pew’s
2013 report – “A Widening Gap in Cities – Shortfalls in Funding for Pensions and Retiree Health Care”
– Denver funded position of 86 percent as of 12/31/10 was sixth highest out of 40 cities
– Denver was one of only two cities that had a 2009 retiree health care funded
level above 50 percent. Aggregate retiree health care funded level for the 61 cities was only 6 percent
– Denver reforms cited…for shifting retirement age from 55 to 60 and for changing
the Rule of 75 to the Rule of 85, all for new employees – DERP’s retiree health care plan only guarantees a monthly premium reduction
based on years of service. Allows for the set aside of a fixed amount and avoids unpredictable increases in (future) medical costs.
40
Three Keys to Pension Fund Sustainability
• Manage the assets • Manage the liabilities • Full ARC payment every year
We never stop talking about these three things. It’s a key part of our orientation course for new board members and new DERP employees. And we continually stress these points with the Denver City Administration and with Denver City Council. As a result, we have been successful at receiving our full ARC, every year, for more than 40 straight years.
41
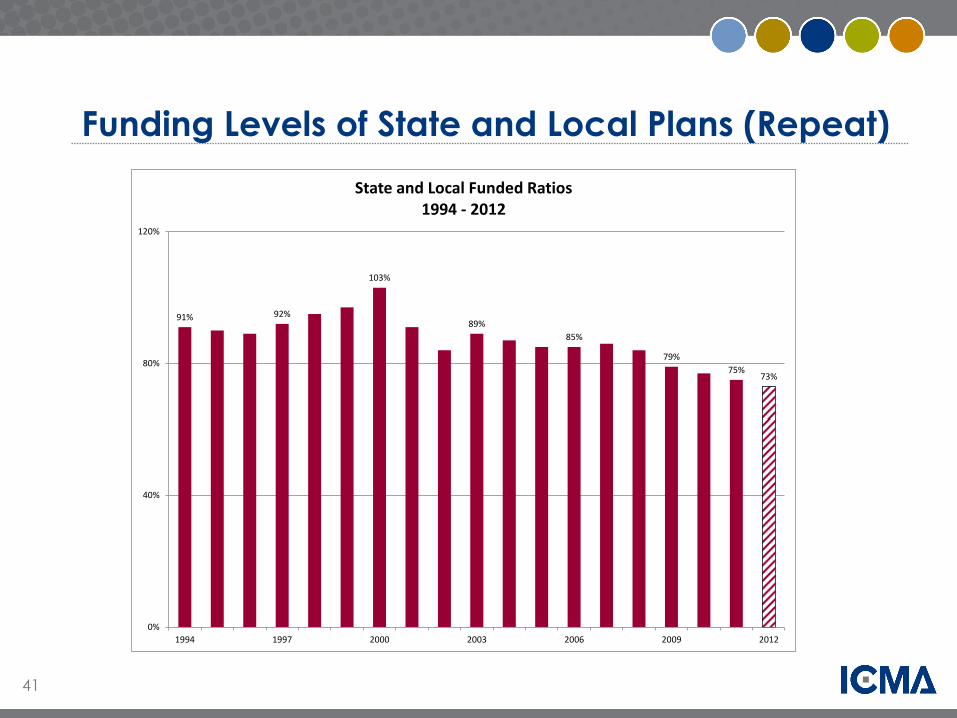
Funding Levels of State and Local Plans (Repeat)
91% 92%
103%
89%85%
79%75%
73%
0%
40%
80%
120%
1994 1997 2000 2003 2006 2009 2012
State and Local Funded Ratios 1994 -‐ 2012
42
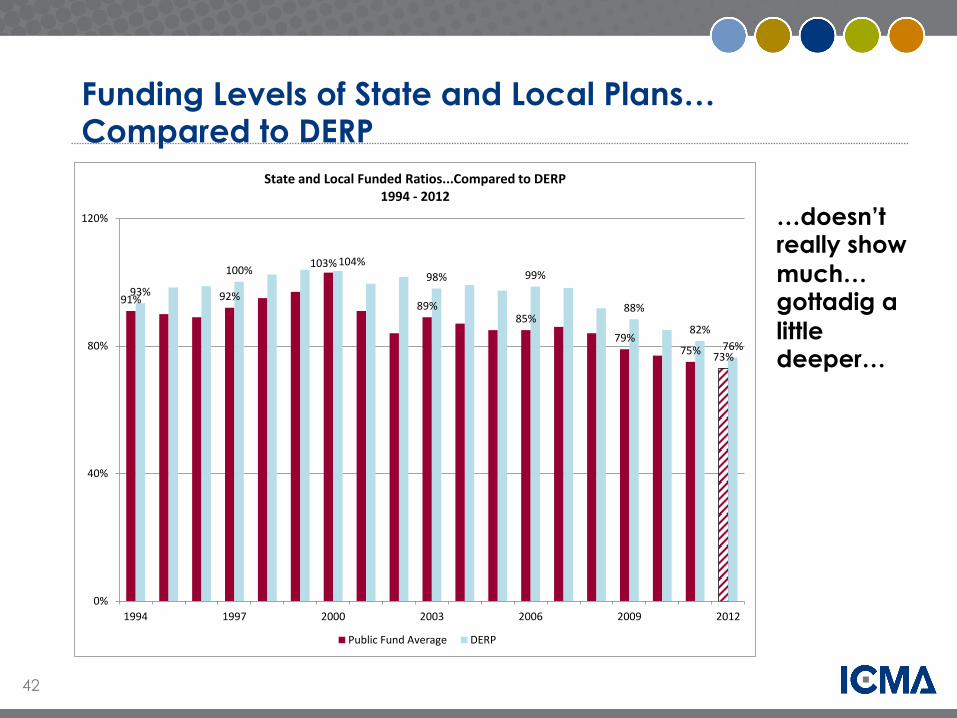
Funding Levels of State and Local Plans… Compared to DERP
…doesn’t really show much…gottadig a little deeper…
91% 92%
103%
89%85%
79%75% 73%
93%
100%104%
98% 99%
88%
82%76%
0%
40%
80%
120%
1994 1997 2000 2003 2006 2009 2012
State and Local Funded Ratios...Compared to DERP1994 -‐ 2012
Public Fund Average DERP

43
Funding Levels of State and Local Plans… Compared to DERP
…still doesn’t really show much…gottago just a little deeper…
91% 92%89%
85%79%
75% 73%
93%100%
104%98% 99%
88%82%
76%
0%
40%
80%
120%
1994 1997 2000 2003 2006 2009 2012
State and Local Plans Funded Ratios...Compared to DERP1994 -‐ 2012
Public Fund Average DERP
44
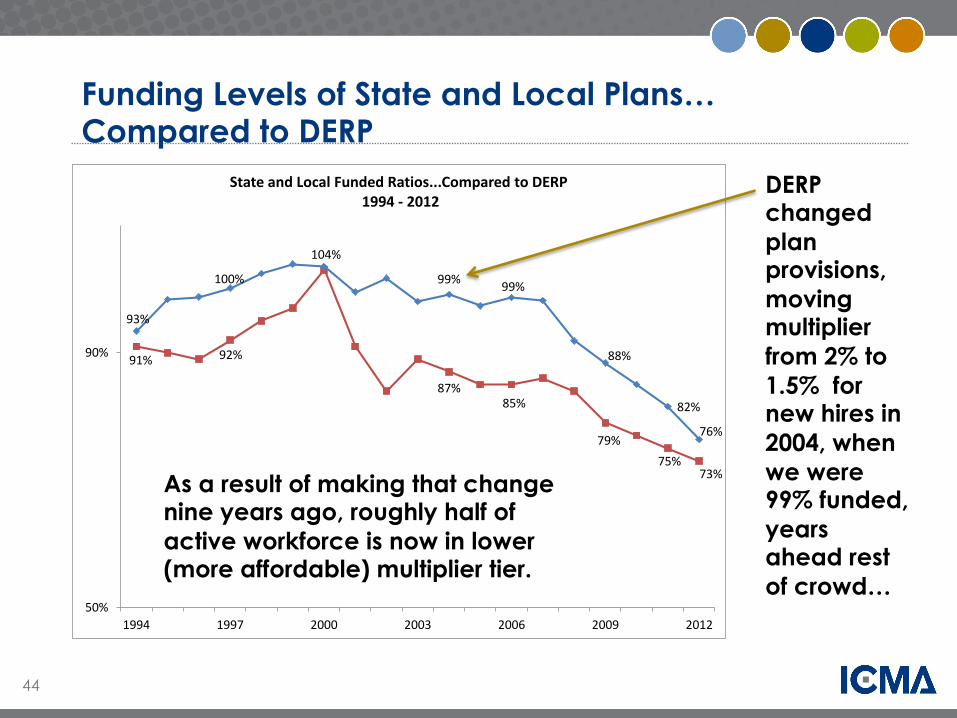
Funding Levels of State and Local Plans… Compared to DERP
91% 92%
87%85%
79%75%
73%
93%
100%
104%
99% 99%
88%
82%
76%
50%
90%
1994 1997 2000 2003 2006 2009 2012
State and Local Funded Ratios...Compared to DERP1994 -‐ 2012
DERP changed plan provisions, moving multiplier from 2% to 1.5% for new hires in 2004, when we were 99% funded, years ahead rest of crowd…
As a result of making that change nine years ago, roughly half of active workforce is now in lower (more affordable) multiplier tier.
45
Three Keys to Pension Fund Sustainability
• Manage the assets – Everybody does this…we’re just a little bit
above average at it…but we have made our assumed 8 percent annual average return over the long term
• Manage the liabilities – We are better at this than most
• Receive total ARC, in full every year – We are better at this than most
46
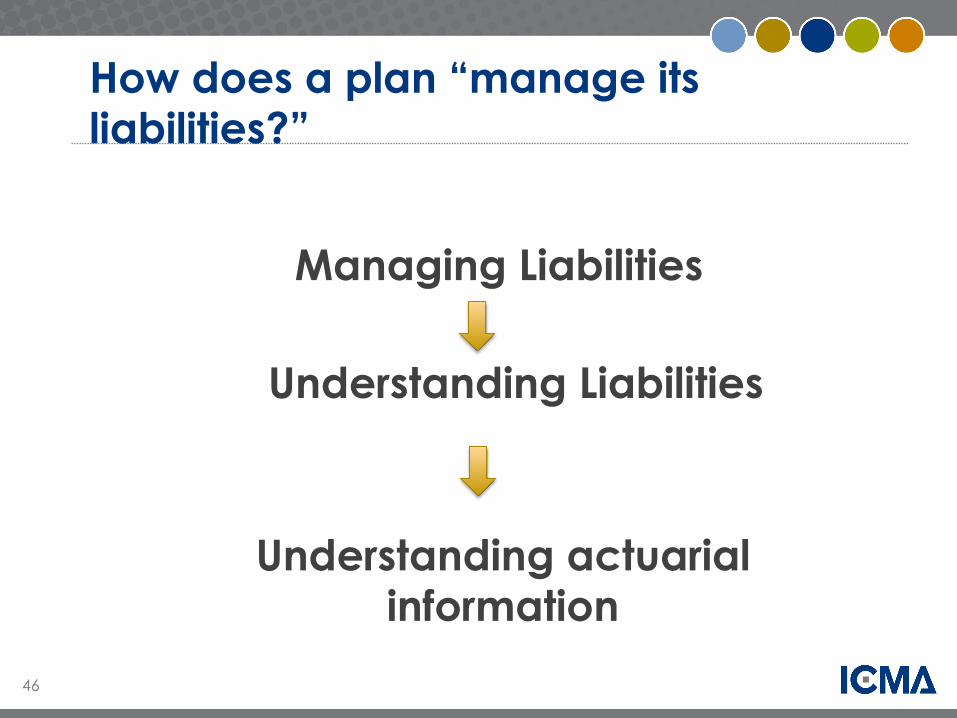
How does a plan “manage its liabilities?”
Understanding Liabilities
Managing Liabilities
Understanding actuarial information
47
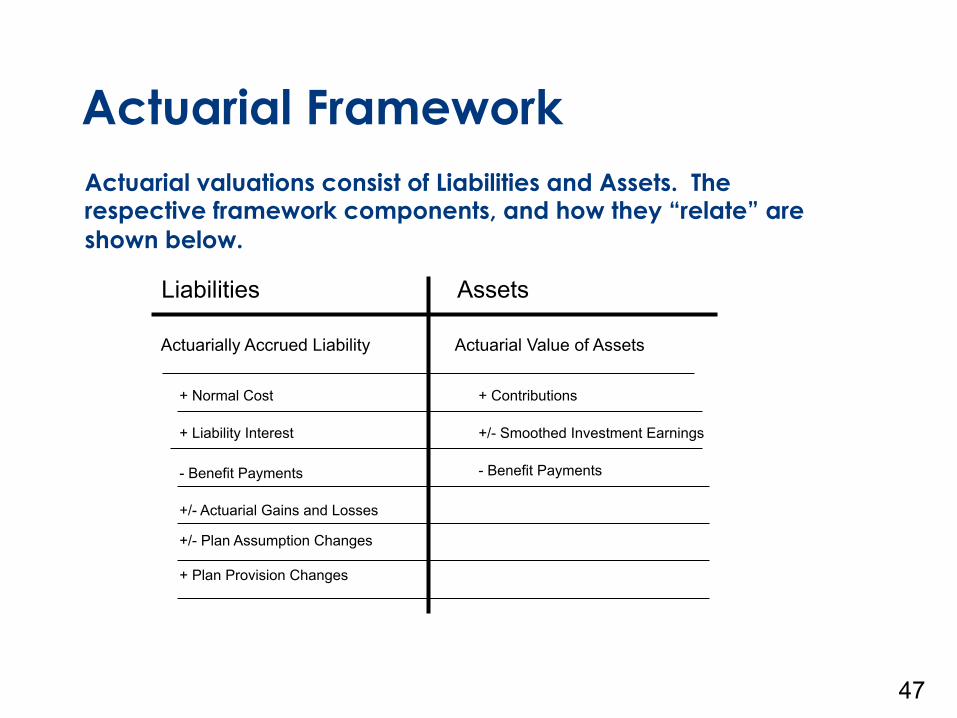
Actuarial valuations consist of Liabilities and Assets. The respective framework components, and how they “relate” are shown below.
Liabilities Assets
Actuarially Accrued Liability Actuarial Value of Assets
+ Normal Cost + Contributions
+ Liability Interest +/- Smoothed Investment Earnings
- Benefit Payments - Benefit Payments
+ Plan Provision Changes
+/- Plan Assumption Changes +/- Actuarial Gains and Losses
Actuarial Framework

Normal Cost Amortization of Unfunded
Liability
Total Required
Contribution
Market Value of Assets
Smoothing method
Actuarial Value Assets
Actuarially Accrued Liability
Unfunded Actuarial Liability
Amortization method
Removes some of market volatility
Contribution Calculation
Model
Interest on Liability
Volatile Market Returns
Current year cost of future benefits earned this year
48
49
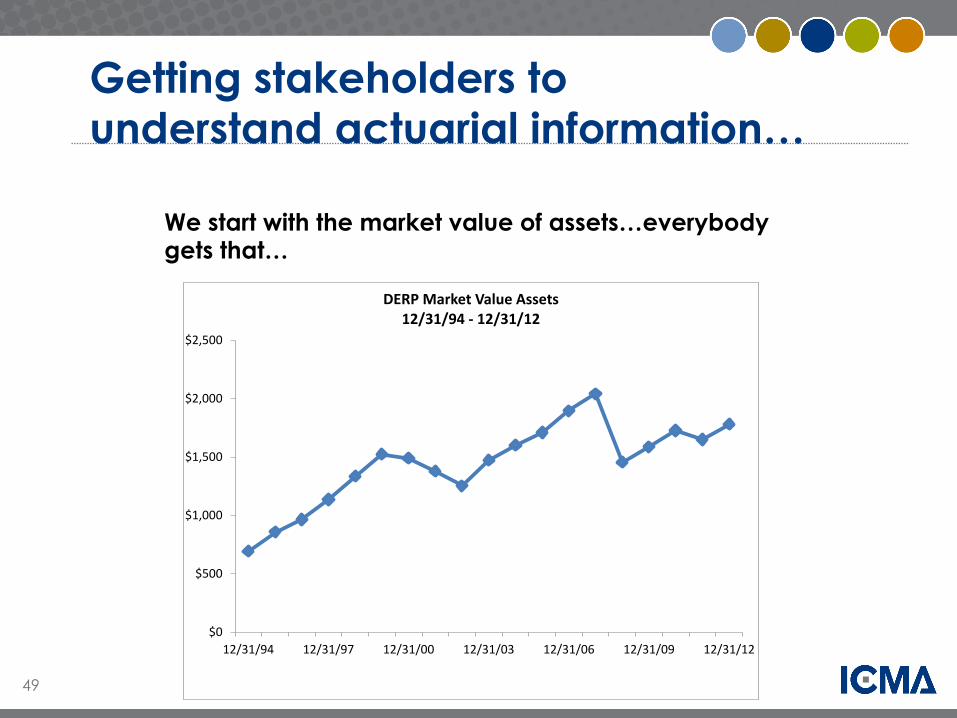
Getting stakeholders to understand actuarial information…
$0
$500
$1,000
$1,500
$2,000
$2,500
12/31/94 12/31/97 12/31/00 12/31/03 12/31/06 12/31/09 12/31/12
DERP Market Value Assets12/31/94 -‐ 12/31/12
We start with the market value of assets…everybody gets that…
50
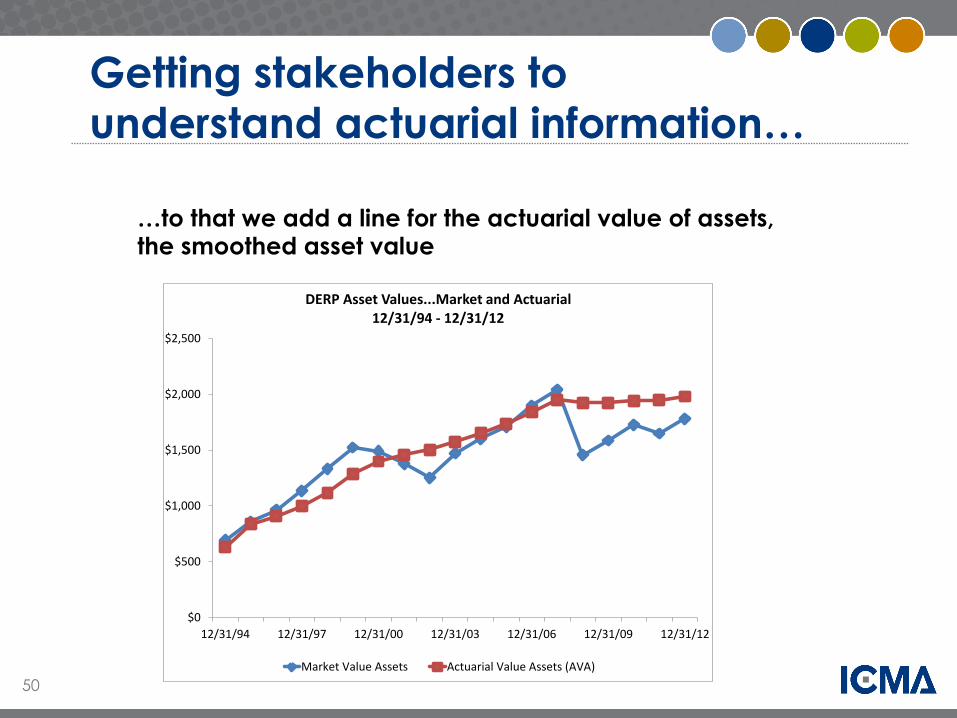
Getting stakeholders to understand actuarial information…
…to that we add a line for the actuarial value of assets, the smoothed asset value
$0
$500
$1,000
$1,500
$2,000
$2,500
12/31/94 12/31/97 12/31/00 12/31/03 12/31/06 12/31/09 12/31/12
DERP Asset Values...Market and Actuarial12/31/94 -‐ 12/31/12
Market Value Assets Actuarial Value Assets (AVA)
51
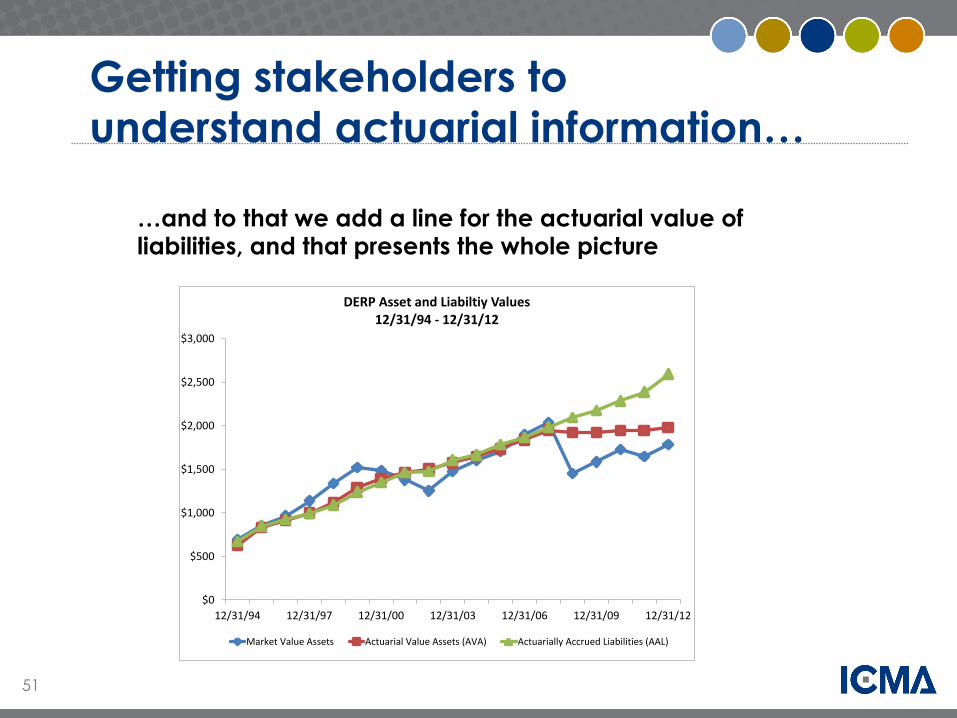
Getting stakeholders to understand actuarial information…
…and to that we add a line for the actuarial value of liabilities, and that presents the whole picture
$0
$500
$1,000
$1,500
$2,000
$2,500
$3,000
12/31/94 12/31/97 12/31/00 12/31/03 12/31/06 12/31/09 12/31/12
DERP Asset and Liabiltiy Values12/31/94 -‐ 12/31/12
Market Value Assets Actuarial Value Assets (AVA) Actuarially Accrued Liabilities (AAL)

52
Impact on total contribution rates
10.0%11.0% 11.0% 11.0% 11.0% 11.0% 11.0%
13.0%
15.0%16.5%
18.0%
0.0%
5.0%
10.0%
15.0%
20.0%
25.0%
30.0%
< 2004 2004 2005 2006 2007 2008 2009 2010 2011 2012 2013
DERP Total ARC< 2004 -‐ 2013
This is the total ARC. It includes employer and employee contributions and the ARC for retiree medical benefits.
The increases since 2009 have been "manageable."
53
What do the new GASB standards mean with regard to funding?
• GASB standards are about “books” • Required discipline concerning funding has
not changed • DERP will work with its plan sponsors to
continue the funding practices as they have been up until now…based on the total actuarially required contribution
54
Retiree Medical
• DERP has separate trust for Retiree Medical • We began funding that liability in 1992 • Pew study found DERP’s retiree medical
funded position is second highest out of 61 U.S. cities
• Benefit structure is of utmost importance – Retiree medical benefits are serviced-based
premium reduction – Actuary does not have to consider “medical
inflation trend” when valuing the liability

55
In Summary…
• Three keys to pension fund sustainability – Manage Assets – Manage liabilities – Receive the full ARC every year
• Last two of three things above probably won’t happen unless relevant stakeholders have working understanding of actuarial information.

Questions?

Thank You Beth Kellar | [email protected] Richard Harris | [email protected]


![WV GASB Conference GAAP Update [Read-Only]wvde.state.wv.us/finance/documents/GASBUpdatePresentation.pdf · The Great GASB Conference ... implementation of GASB 47 • All other termination](https://img.pdfslide.us/doc/110x75/5b2a1f147f8b9ad6458b9054/wv-gasb-conference-gaap-update-read-onlywvdestatewvusfinancedocumentsga.jpg)