Embed Size (px)
Citation preview
INFLUENCE OF CLAY MINERALS, HUMIC SUBSTANCES, AND SOIL
AGGREGATION ON THE FATE AND BIOAVAILABILITY OF
2,4,6-TRINITROTOLUENE (TNT)
by
GREGORY D. PILLAR
(Under the Direction of Miguel Cabrera)
ABSTRACT
Over the last several decades the production, use, and disposal of munitions has
resulted in widespread contamination of nitroaromatic explosives, including 2,4,6-
trinitrotoluene (TNT). In this dissertation, the environmental fate of TNT in soil, soil
aggregates, and primary soil particles was investigated. In the first experiment, the
objective was to characterize the influence of humic acid on TNT sorption to clay
minerals. TNT sorption to humic acid was significant and increased with a decrease in
humic acid concentration. Additionally, humic acid complexed with a high and low
charge smectite and kaolinite resulted in greater TNT sorption compared to the
corresponding homo-ionic clay minerals. The fractionation of humic acid during
adsorption to a low-charge smectite was observed and sequential humic-clay
complexation resulted in a reduction in TNT sorption.
The objective of the next study was to characterize how the soil fractionation
method used to obtain soil aggregates influences soil properties and processes. Wet- and
dry-sieving of three different soils indicated that the particle size distribution, inherent
clay mineralogy, and organic matter content determined to what extent the sieving
method altered the aggregate size distribution and aggregate specific soil properties. In
all three soils, wet-sieving resulted in a greater distribution of aggregates < 250 μm and a
redistribution of organic matter and sand particles from large aggregates to
microaggregates. Additionally, wet-sieving significantly altered the microbial
community structure of aggregates < 250 μm.
The objective of the third and final study was to determine if earthworms could
influence the fate of TNT within soil aggregates and to what extent TNT and earthworms
altered the soil microbial community. After 21 d 15.5 to 19.6% of the initial (≈ 100 mg
kg-1) TNT was recovered from two soils. After 7 d earthworm activity resulted in a 0 to
45% reduction in TNT depending on the soil type. With time, earthworm influence on
TNT disappearance decreased due to the formation of irreversibly bound residues.
Additionally, earthworms were able to absorb and transform TNT within their body and
alter the distribution of TNT and metabolites among different sized aggregates, and along
with TNT alter the microbial community structure.
INDEX WORDS: 2,4,6-trinitrotoluene (TNT), metabolites, clay minerals, humic
acid, humic-clay complexes, soil aggregates, soil fractionation, earthworms, Eisenia fetida, microbial community structure, FAME
INFLUENCE OF CLAY MINERALS, HUMIC SUBSTANCES, AND SOIL
AGGREGATION ON THE FATE AND BIOAVAILABILITY OF
2,4,6-TRINITROTOLUENE (TNT)
by
GREGORY D. PILLAR
B.S., University of Minnesota, 1999
M.S., Kansas State University, 2002
A Dissertation Submitted to the Graduate Faculty of The University of Georgia in Partial
Fulfillment of the Requirements for the Degree
DOCTOR OF PHILOSOPHY
ATHENS, GEORGIA
2006

© 2006
Gregory D. Pillar
All Rights Reserved
INFLUENCE OF CLAY MINERALS, HUMIC SUBSTANCES, AND SOIL
AGGREGATION ON THE FATE AND BIOAVAILABILITY OF
2,4,6-TRINITROTOLUENE (TNT)
by
GREGORY D. PILLAR
Major Professor: Miguel Cabrera
Committee: Kang Xia Paul Hendrix John Seaman Paul Schroeder
Electronic Version Approved: Maureen Grasso Dean of the Graduate School The University of Georgia August 2006
iv
DEDICATION
This work is dedicated to my parents, Mary and Dennis Pillar. Without their love,
guidance, and support from the day I was born I would not be where I am today. Thank
you for everything you have sacrificed and given to me to help me get to this point and
beyond.
v
ACKNOWLEDGEMENTS
I would like to thank my major professor Dr. Kang Xia for her support,
encouragement, and patience throughout my academic career at Kansas State University
and the University of Georgia. I am extremely thankful for the members of my graduate
supervisory committee who took the time to advise and mentor me throughout my
research: Dr. Miguel Cabrera, Dr. Paul Hendrix, Dr. John Seaman, and Dr. Valentine
Nzengung. I am also thankful for the comments and suggestions of Dr. Paul Schroeder
who was a welcome addition to my committee.
I owe a debt of gratitude to John Kruse, Karin Lichtenstein, Patrick Davies, and
Franta Majs for their friendship, support, and advice over the last four years. I would like
to thank Nehru Mantri, Ken Bradshaw, Vickie Hufstettler, Dawit Yifru, Jennifer Yates,
Maria Monteros, Patty Hayes, David Butler, Nicolas Vaio, Sarah Schuler, Yabin Zhao
and all of the graduate students who have assisted with this research and made graduate
school enjoyable and interesting. Thank you to Dr. Bill Miller for his support and
encouragement as I worked to finish this dissertation. I owe current and former members
of the Department of Crop and Soil Science faculty, specifically Dr. Larry West, Dr.
Peter Hartel, Dr. David Radcliffe, and Dr. Mark Williams a world of thanks for sharing
their knowledge and skills in soil science. I would also like to thank the department
staff, especially Vivienne Sturgill for their help in navigating the ins and outs of Graduate
School life
vi
I am very thankful for the help and assistance of my research assistants Amy
Thompson, Micah Gardner, Nathan Jensrud, and Jami Schaffner. Their countless hours
of hard work were an integral part of the research presented in this dissertation.
Finally, my academic career has been influenced by many, but without a few, I
would never be where I am today. I would like to thank Mr. Walter Schumann for
believing in me and encouraging me to pursue an education and career in the
environmental sciences. I would like to thank my undergraduate advisor, Dr. Jay Bell,
who was a major inspiration and empowered me to take control of my education. A
special debt of thanks is owed to Dr. Bill Koskinen who provided me my first research
opportunity as an undergraduate. The experience I received working for him and the
many students, technicians, and post-docs in his lab is the driving force behind my work
ethic and desire to pursue a graduate education. I am thankful to Dr. Terry Cooper who
was my first soil science instructor and provided me with my first college teaching
experience. A special debt of gratitude goes to Dr. Steve Thien, who is the essence and
model of a true teaching scholar. I certainly would not be where I am today if it was not
for his guidance and friendship over the last 6 years.
Most importantly, the utmost thanks and gratitude goes to my entire family, who
has always supported me in everything I do. To my parents Dennis and Mary Pillar, who
this dissertation is dedicated to, thank you for your love and for the sacrifices you have
made. To the love of my life, Rachel, your love, patience and sacrifice through this
challenging time has been amazing. I love you with all of my heart and look forward to
whatever the future may hold.
vii
TABLE OF CONTENTS
Page
ACKNOWLEDGEMENTS.................................................................................................v
LIST OF TABLES...............................................................................................................x
LIST OF FIGURES .......................................................................................................... xii
CHAPTER
1 INTRODUCTION .............................................................................................1
References ....................................................................................................6
2 LITERATURE REVIEW ..................................................................................7
TNT ...............................................................................................................8
Soil aggregation...........................................................................................29
Effects of earthworms on soil properties and fate of organic
contaminants..........................................................................................33
Effects of biotic and abiotic factors and contaminants on the soil microbial
community structure..............................................................................36
Objectives....................................................................................................42
References ...................................................................................................43
3 INTERACTION OF 2,4,6-TRINITROTOLUENE WITH HUMIC ACID,
CLAY MINERALS, AND HUMIC-CLAY COMPLEXES.......................57
Abstract .......................................................................................................58
Introduction .................................................................................................59
viii
Materials and Methods ................................................................................62
Results and Discussion................................................................................68
Conclusions .................................................................................................80
References ...................................................................................................83
4 IMPACT OF SIZE FRACTIONATION METHODS ON PROPERTIES OF
SOIL AGGREGATES ..............................................................................100
Abstract .....................................................................................................101
Introduction ...............................................................................................102
Materials and Methods ..............................................................................104
Results and Discussion..............................................................................110
Conclusions ...............................................................................................120
References .................................................................................................122
5 FATE OF 2,4,6-TRINITROTOLUENE (TNT) AND MICROBIAL
COMMUNITY STRUCTURE WITHIN SOIL AGGREGATES IN THE
PRESENCE OF EARTHWORMS ...........................................................134
Abstract .....................................................................................................135
Introduction ...............................................................................................137
Materials and Methods ..............................................................................140
Results and Discussion..............................................................................147
Conclusions ...............................................................................................166
References .................................................................................................168
6 SUMMARY AND CONCLUSIONS ............................................................186
APPENDICES .................................................................................................................192

ix
A SUPPLEMENTAL DATA FROM CHAPTER 3..........................................192
B SUPPLEMENTAL DATA FROM CHAPTER 4..........................................198
C SUPPLEMENTAL DATA FROM CHAPTER 5..........................................202
x
LIST OF TABLES
Page
Table 2.1: Physical and chemical properties of 2,4,6-trinitrotoluene (TNT), 2-amino-4,6-
dinitrotoluene (2-ADNT), and 4-amino-2,6-dinitrotoluene (4-ADNT). ...........11
Table 2.2: TNT sorption isotherm parameters for various sorbents under different
environmental conditions ..................................................................................19
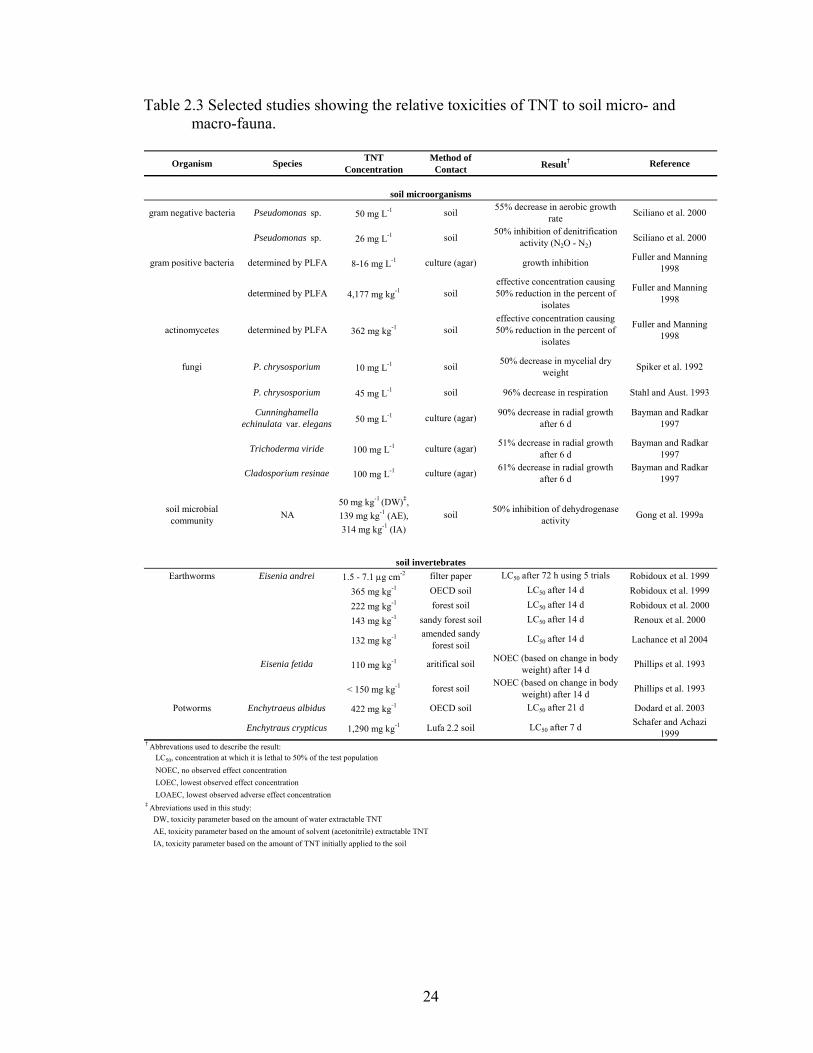
Table 2.3: Selected studies showing the relative toxicities of TNT to soil micro- and
macro-fauna.......................................................................................................24
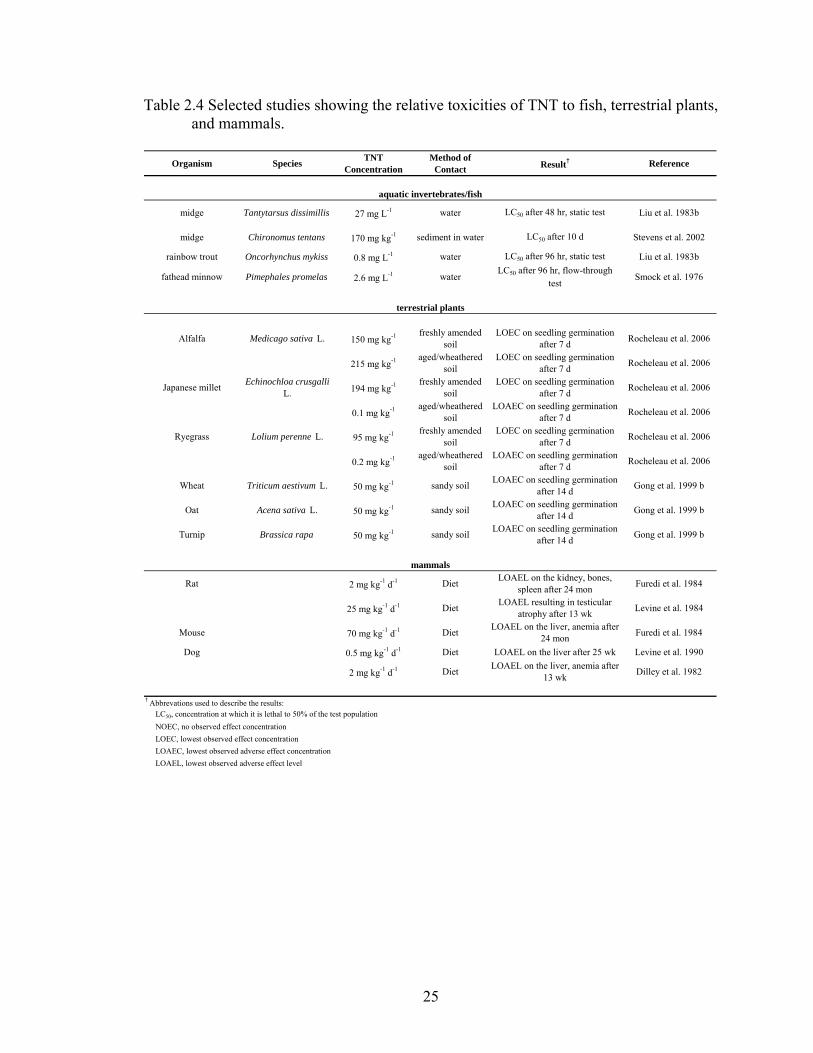
Table 2.4: Selected studies showing the relative toxicities of TNT to fish, terrestrial
plants and mammals ..........................................................................................25
Table 2.5: Common fatty acids and corresponding biomarker interpretations..................38
Table 3.1: Properties of reference clay minerals (SWy-2, SAz-1, SHCa-1, and KGa-1b),
their K+- and Ca2+ - saturated forms, their humic acid-clay complexes, and
sequentially complexed humic acid-clay complexes ........................................87
Table 3.2: Sorption and desorption isotherm parameters for TNT to K+- and Ca2+ -
saturated clay minerals and their humic acid (HA)-clay complexes.................88
Table 3.3: Sorption isotherm parameters for TNT to humic acid at different humic acid
concentrations....................................................................................................89
Table 4.1: Physical and chemical characteristics of soils used in this study. Numbers
within parentheses reflect the standard deviation (n = 3)................................126
xi
Table 4.2: Particle size analysis of soil aggregates collected from dry- and wet-sieving
techniques (n = 1). ...........................................................................................127
Table 4.3: Cation exchange capacity (CEC) and concentration of total carbon (TC) in soil
aggregates collected from dry- and wet-sieving methods as determined on a
sand-free basis†................................................................................................128
Table 4.4: Comparison of dry- and wet-sieving methods on the mole percentage of 18
microbial biomarkers in three distinct soils† ...................................................129
Table 5.1: Physical and chemical soil properties of the Appling (GA) and Theresa (WI)
soils..................................................................................................................175
Table 5.2: Average mole percentages of individual FAMEs in the whole soil and
aggregates of an Appling sandy loam soil exposed to earthworms and/or TNT
for 21 d. ...........................................................................................................176
Table 5.3: Average mole percentage of individual FAMEs in the whole soil and
aggregates of a Theresa silt loam soil exposed to earthworms and/or TNT for
21 d ..................................................................................................................177
Table B.1: Cation exchange capacity (CEC) and concentration of total carbon (TC) in soil
aggregates collected from dry- and wet-sieving methods†..............................199
Table C.1: The percentage of TNT, 2-ADNT, and 4-ADNT recovered from soil
aggregates compared to the whole soil............................................................203
Table C.2: Amount of individual FAMEs from 21 d incubation experiment involving an
Appling sandy loam soil..................................................................................204
Table C.3: Amount of individual FAMEs from 21 d incubation experiment involving a
Theresa silt loam soil.......................................................................................205
xii
LIST OF FIGURES
Page
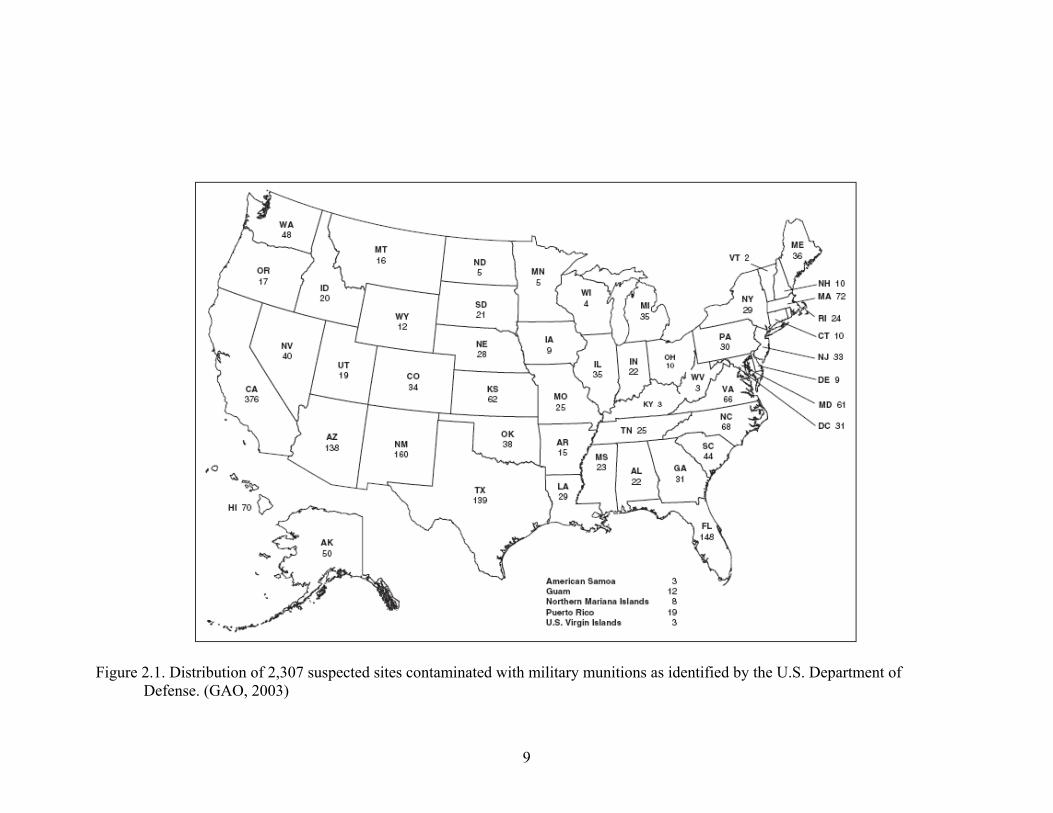
Figure 2.1: Distribution of 2,307 suspected sites contaminated with military munitions as
identified by the U.S. Department of Defense (GAO, 2003). .............................9
Figure 2.2: Pathways for the aerobic transformation of TNT by microorganisms. Two
arrows indicate the conversion of a compound to another is believed to occur
through a series of intermediates (modified from Esteve-Nunez et al., 2001)..13
Figure 2.3: Pathways for the anaerobic transformation of TNT by microorganisms. Two
arrows indicate the conversion of a compound to another is believed to occur
through a series of intermediates (modified from Esteve-Nunez et al., 2001)..15
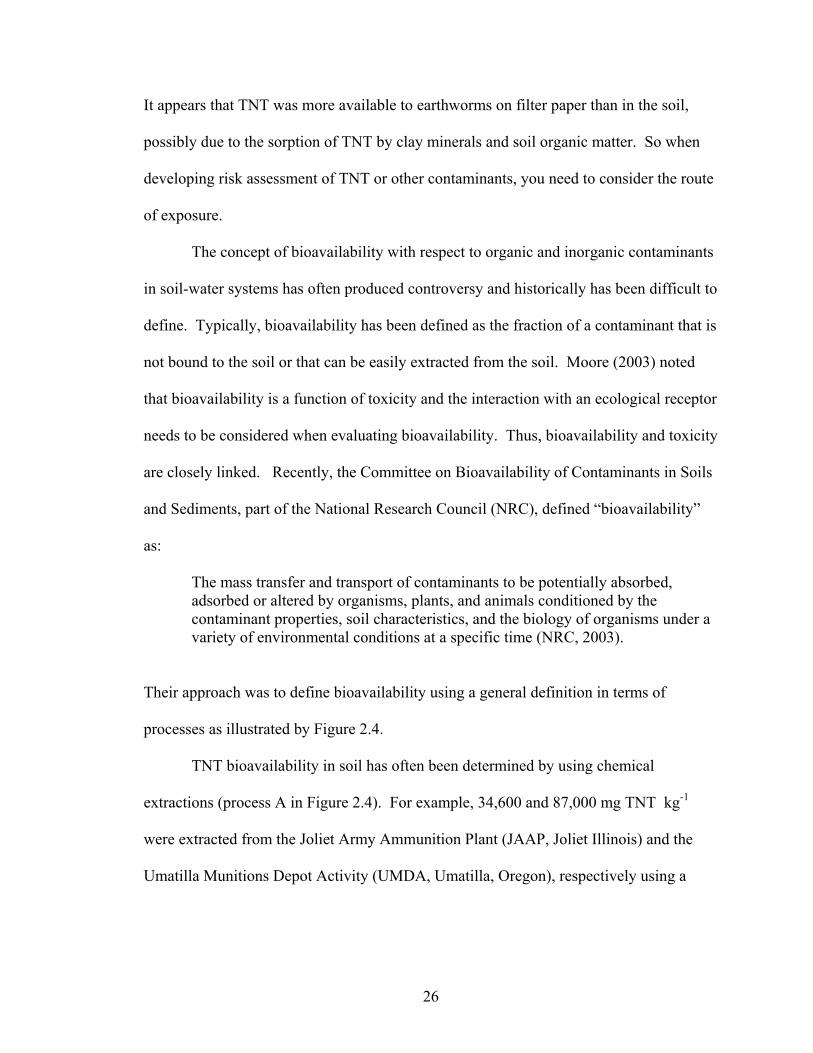
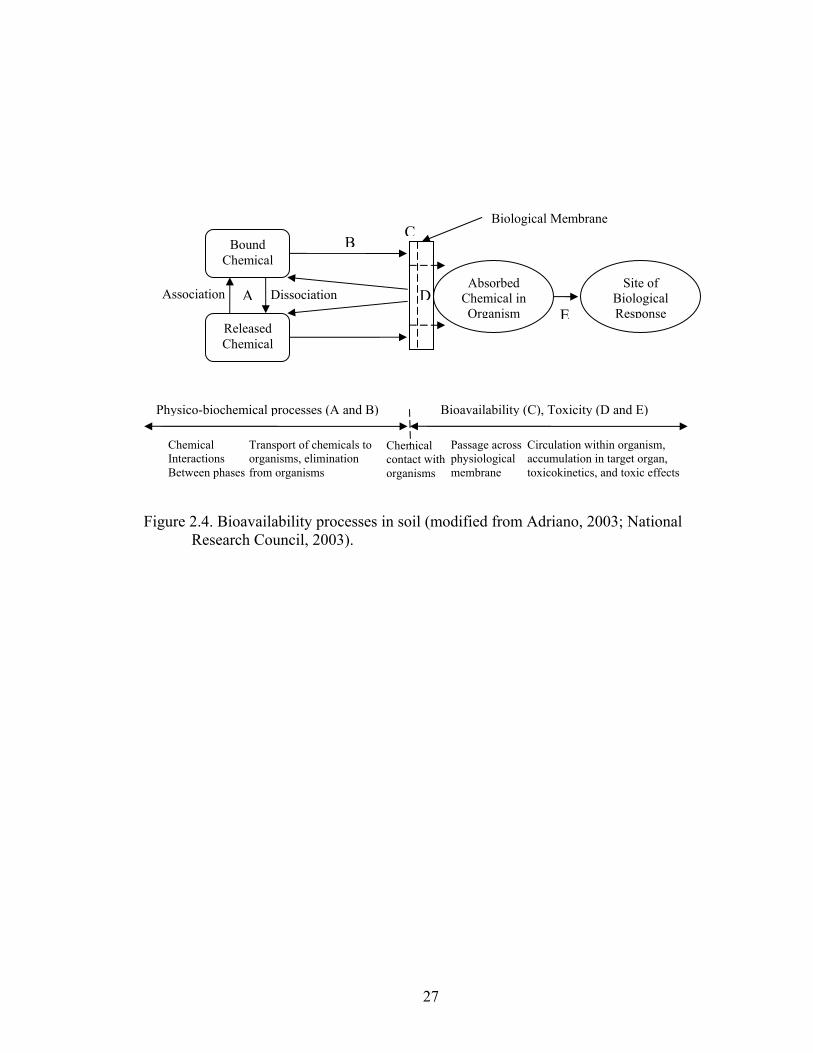
Figure 2.4: Bioavailability processes in soil (modified from Adriano, 2003; National
Research Council, 2003) ...................................................................................27
Figure 2.5: Conceptual model developed by Six et al. (1999) of the aggregate “life cycle”
based on aggregate hierarchy models proposed by Tisdall and Oades (1982)
and Oades (1984)...............................................................................................31
Figure 3.1: Dialysis unit for the batch equilibrium experiments for TNT and humic acid
interactions ........................................................................................................90
Figure 3.2: Isotherms describing 2,4,6-trinitrotoluene sorption by K+- (top) and Ca2+-
(bottom) saturated clay minerals. Symbols and error bars represent the mean
and ± 1 S.D., respectively (n = 3)......................................................................91
xiii
Figure 3.3: Sorption/desorption isotherms of TNT to K+-saturated (K-SWy, K-SHCa, K-
SAz) and Ca+2- saturated (Ca-Swy, Ca-SHCa) smectite clay minerals.
Symbols and error bars represent sample mean and ± 1 S.D., respectively (n =
3)........................................................................................................................92
Figure 3.4: Sorption isotherms for TNT sorption to humic acid. Symbols and error bars
represent the mean and ± 1 S.D., respectively (n = 2). *,n = 1. .......................93
Figure 3.5: Sorption/desorption isotherms of TNT to K+- saturated (K-HA-SWy, K-HA-
SHCa, K-HA-SAz) and Ca+2- saturated (Ca-HA-SWy, Ca-HA-SHCa) humic-
clay complexes. Symbols and error bars represent sample mean and ± 1 S.D.,
respectively ( n = 3)...........................................................................................94
Figure 3.6: Sorption isotherms representing TNT sorption to K+- and Ca+2- saturated
smectite clay minerals and their corresponding humic-clay complexes; Close
and open symbols represent sorption to the clay mineral (-●-) and
corresponding humic-clay complex (-○-),, respectively. Symbols and error
bars represent sample mean and ± 1 S.D., respectively (n = 3) ........................95
Figure 3.7: Associated d-spacings of K-SWy and its corresponding humic-clay complex
K-HA-SWy obtained from x-ray diffraction patterns of oriented films as a
function of TNT sorption ..................................................................................96
Figure 3.8: Isotherms describing TNT sorption by K+-saturated kaolinite and humic-
kaolinite complexes. Symbols and error bars represent the mean and ± 1 S.D.,
respectively (n = 3)............................................................................................97
xiv
Figure 3.9: Isotherms describing 2,4,6-trinitrotoluene sorption by K+ -saturated humic-
clay complexes sequentially prepared with smectite (K-SWy). Symbols and
error bars represent the mean and ± 1 S.D., respectively (n = 3) ......................98
Figure 3.10: Associated d-spacings of sequentially prepared humic-clay complexes
obtained from x-ray diffraction patterns of oriented films as a function of TNT
sorption..............................................................................................................99
Figure 4.1: The amount of soil within each aggregate size fraction as a percentage of total
sand-free soil (top-Theresa, middle-Appling, bottom-Marlette-Oshtemo).
Significant differences between sieving methods are represented by different
letters on the graph (p < 0.01, mean ± 1 S.D.) ................................................130
Figure 4.2: Total fatty acid methyl esters (FAME) within each aggregate size fraction
obtained by using dry- and wet-sieving techniques (top-Theresa, middle-
Appling, bottom-Marlette-Oshtemo). Significant differences between sieving
methods are represented by different letters (p-value ....................................131
Figure 4.3: Nonmetric multidimensional scaling plots of mole percentages of FAMEs of
all aggregate size fractions for both sieving methods and all three soils. The
proportion of variance explained by each axis is indicated in parentheses.
Ellipses enclose and identify the Theresa, Appling, and Marlette-Oshtemo
soils. Multiresponse permutation procedure (MRPP) analysis indicated that the
three soils were significantly different from each other. Values of the symbols
and error bars represent means and standard error, respectively (n = 3).........132
xv
Figure 4.4: Nonmetric multidimensional scaling plots of mole percentages of all
individual FAMEs of dry- and wet-sieved Theresa, Appling, and Marlette-
Oshtemo soils. The proportion of variance explained by each axis is indicated
in parentheses. A one dimensional solution explained the bulk of the variance
in the Marlette-Oshtemo soil, but for the sake of clarity a two dimension
solution is presented. Multi-response permutation procedure (MRPP) analysis
indicated that the sieving method was significantly different from each other
within each soil type. Values of the symbols and error bars represent means
and standard error, respectively (n = 3). ........................................................133
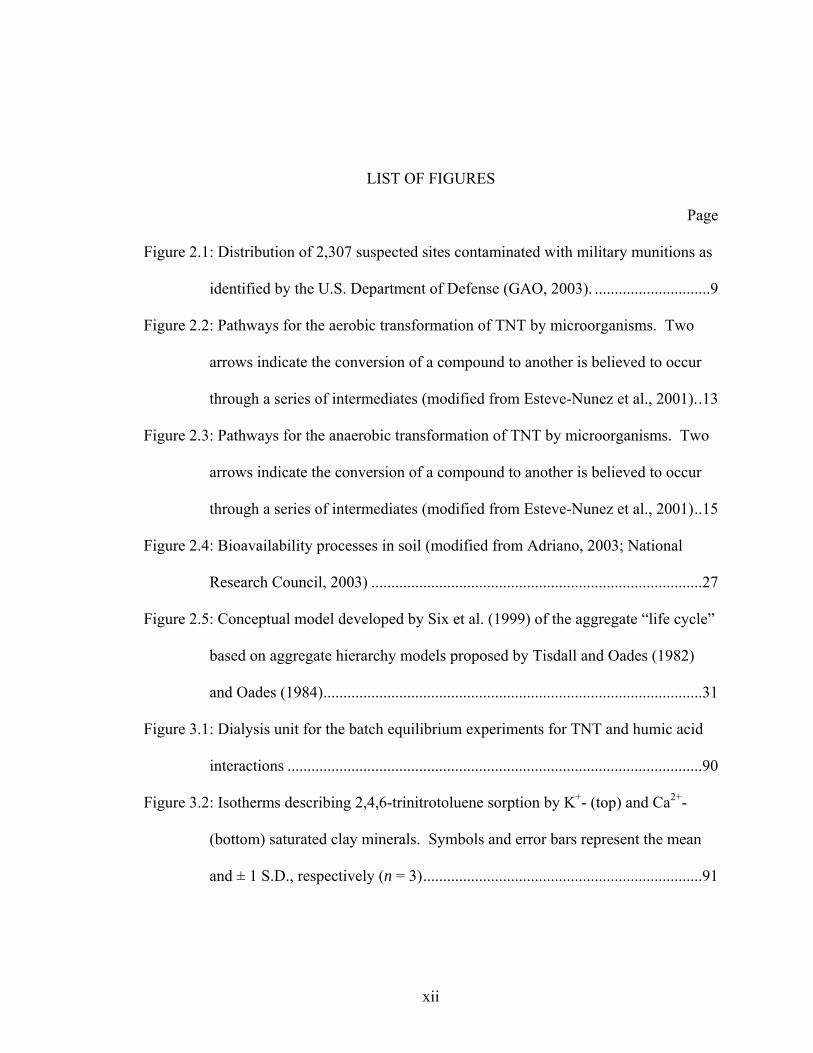
Figure 5.1: Concentrations of 2-ADNT and 4-ADNT in earthworms (A,C) and their
biomass (B,D) after exposure to TNT in an Appling sandy loam and a Theresa
silt loam loam at initial soil concentrations of 96 mg kg-1 and 99 mg kg-1,
respectively (C,D). Error bars represent ± 1 S.D., n = 3, * n = 2. ..................178
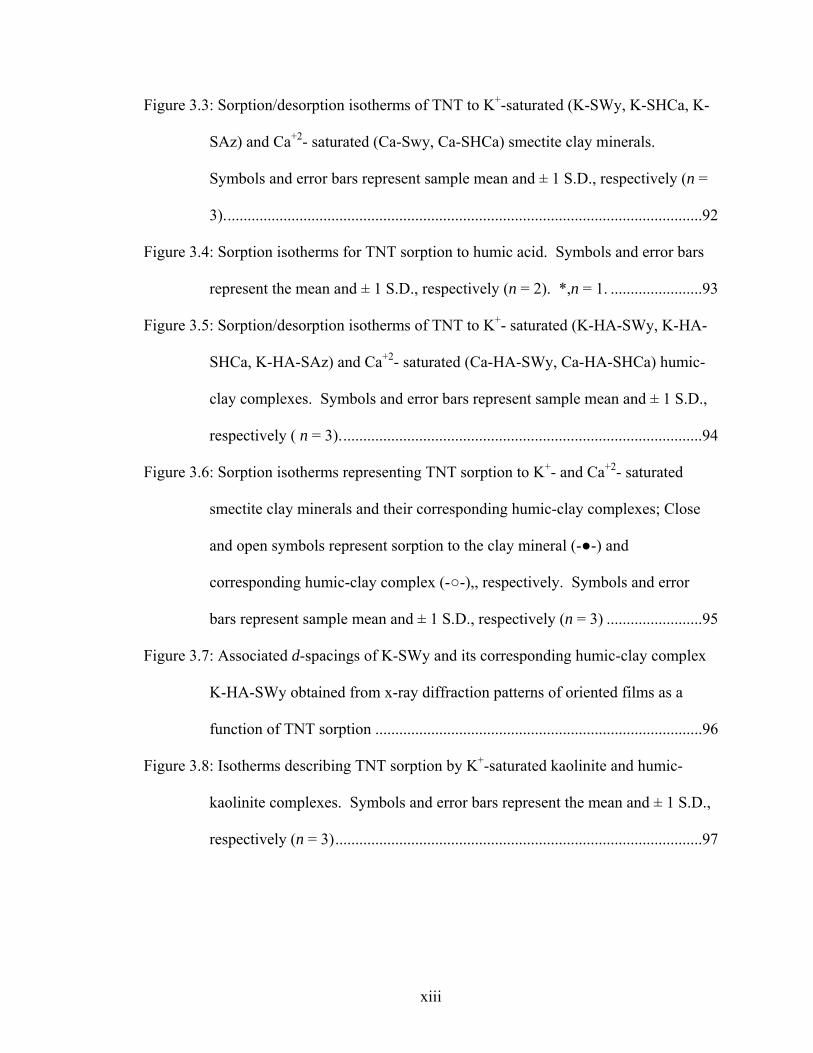
Figure 5.2: Aggregate size distribution of an Appling sandy loam and a Theresa silt loam
after 21 days of exposure to TNT and earthworms. Values followed by a
different lowercase letter within aggregate size class are significantly different
between treatments (mean ± 1 S.D., n = 3). ....................................................179
xvi
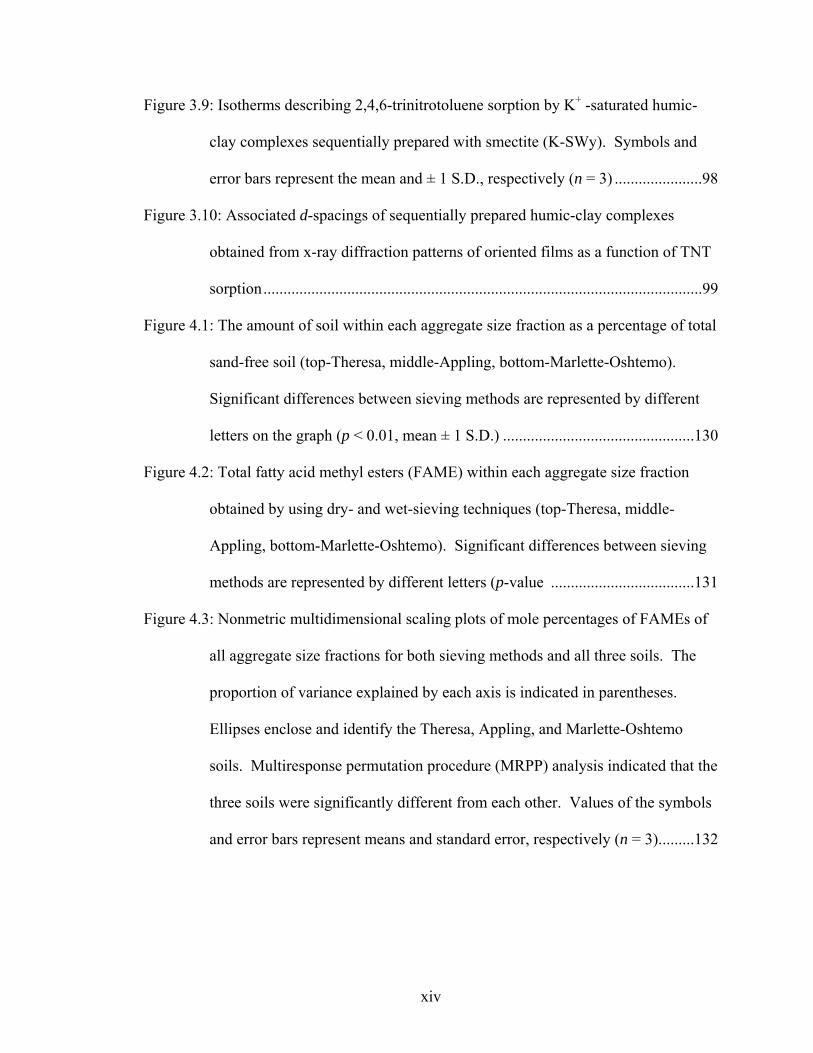
Figure 5.3: Concentration of readily extractable (-●- -○-), potentially extractable
(-■- -□-), and total extractable (-▲- -∆-) TNT and its two major metabolites (2-
ADNT and 4-ADNT) in the whole soil, 2000 – 4000, 500 – 2000, and 250 -
500μm aggregates of an Appling sandy loam with and without earthworms
(open and closed symbols, respectively). Asterisks denote significant
differences (using Fishers LSD) between treatments at each time period
(p<0.05, n = 3).................................................................................................180
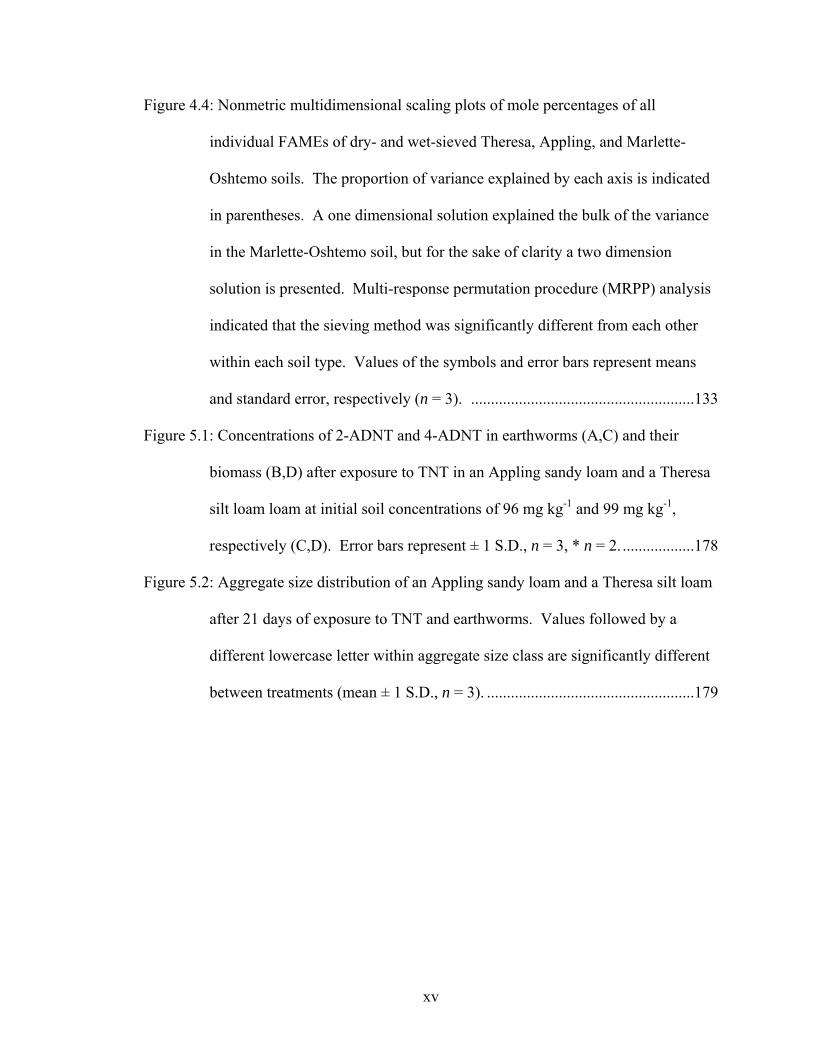
Figure 5.4: Concentration of readily extractable (-●- -○-), potentially extractable
(-■- -□-), and total extractable (-▲- -∆-) TNT and its two major metabolites (2-
ADNT and 4-ADNT) in the whole soil, 2000 – 4000, 500 – 2000, 250 – 500,
and 75 – 250 μm aggregates of a Theresa silt loam with and without
earthworms (open and closed symbols, respectively). Asterisks denote
significant differences (using Fishers LSD) between treatments at each time
period (p<0.05, n = 3)......................................................................................181
Figure 5.5: Concentration of total extractable TNT and its two major metabolites (2-
ADNT and 4-ADNT) at 21 d in the different sized aggregates of an Appling
sandy loam (left panel) and a Theresa silt loam (right panel) with and without
earthworms. Different letters denote significant differences (using Fishers
LSD) between aggregate size fractions for each treatment (p < 0.05, n = 3). 182
Figure 5.6: Sorption/desorption isotherms of TNT to an Appling sandy loam (GA) and a
Theresa silt loam (WI) soil (mean ± 1 S.D., n = 3). ........................................183
xvii
Figure 5.7: Nonmetric multidimensional scaling plots of mole percentages of all
individual FAMEs in whole soil, 2000 – 4000, 500 – 2000, and 250 – 500 μm
aggregates of an Appling sandy loam soil after 21 d of exposure to earthworm
and/or TNT. The proportion of variance explained by each axis is indicated in
parentheses. Indicator FAME biomarkers for each treatment are listed in the
legend. Values of the symbols and error bars represent means and standard
errors, respectively (n = 3). .............................................................................184
Figure 5.8: Nonmetric multidimensional scaling plots of mole percentages of all
individual FAMEs from whole soil, 2000 – 4000, 500 – 2000, 250 – 500, and
75-250 μm aggregates of a Theresa silt loam soil after 21 d of exposure to
earthworm and/or TNT. The proportion of variance explained by each axis is
indicated in parentheses. Indicator FAME biomarkers for each treatment are
listed in the legend. Values of the symbols and error bars represent means and
standard error, respectively (n = 3). ................................................................185
Figure A.1: X-ray diffraction patterns of K-SWy as a function of TNT sorption (Cu-Κα
radiation, 0% humidity)...................................................................................193
Figure A.2: X-ray diffraction patterns of K-HA-SWy as a function of TNT sorption (Cu-
Kα radiation, 0% humidity) .............................................................................194
Figure A.3: X-ray diffraction patterns of K-HA-S2-SWy as a function of TNT sorption
(Cu-Kα radiation, 0% humidity)......................................................................195
Figure A.4: X-ray diffraction patterns of K-HA-S3-SWy as a function of TNT sorption
(Cu-Kα radiation, 0% humidity)......................................................................196
xviii
Figure A.5: X-ray diffraction patterns of K-HA-S4-SWy as a function of TNT sorption
(Cu-Kα radiation, 0% humidity)......................................................................197
Figure B.1: The amount of soil within each aggregate size fraction as a percentage of the
whole soil (top-Theresa, middle-Appling, bottom-Marlette-Oshtemo).
Significant differences between sieving methods are represented by different
letters on the graph (p < 0.01, mean ± 1 S.D.). ...............................................200
Figure B.2: Total fatty acid methyl esters (FAME) within each aggregate size fraction
obtained by using dry- and wet-sieving techniques (top-Theresa, middle-
Appling, bottom-Marlette-Oshtemo). Significant differences between sieving
methods are represented by different letters (p-value ≤ 0.01, mean ± 1 S.D.).201
Figure C.1: Effects of earthworm activity and TNT on aggregate size distribution of an
Appling sandy loam (A) and a Theresa silt loam (B) after 14 days. Values
followed by a different lowercase letter within aggregate size class are
significantly different between treatments (mean ± 1 S.D., n = 3). ................206
Figure C.2: Effects of earthworm activity and TNT on aggregate size distribution of an
Appling sandy loam (A) and a Theresa silt loam (B) after 7 days. Values
followed by a different lowercase letter within aggregate size class are
significantly different between treatments (mean ± 1 S.D., n = 3). ................207
Figure C.3: Concentration of acetonitrile extractable TNT and its two major metabolites
(2-ADNT and 4-ADNT) at 21 d in the different sized aggregates of an Appling
sandy loam (left panel) and a Theresa silt loam (right panel) with and without
earthworms. Different letters denote significant differences (using Fishers
LSD) between aggregate size fractions for each treatment (p < 0.05, n = 3)..208
xix
Figure C.4: Concentration of CaCl2 extractable TNT and its two major metabolites (2-
ADNT and 4-ADNT) at 21 d in the different sized aggregates of an Appling
sandy loam (left panel) and a Theresa silt loam (right panel) with and without
earthworms. Different letters denote significant differences (using Fishers
LSD) between aggregate size fractions for each treatment (p < 0.05, n = 3)..209
Figure C.5: Nonmetric multidimensional scaling plots of mole percentages of all
individual FAMEs from whole soil, 2000 – 4000, 500 – 2000, 250 – 500 μm
aggregates of an Appling sandy loam over time (0, 7, 14, 21 d). The
proportion of variance explained by each axis is indicated in parentheses.
Values of the symbols and error bars represent means and standard error,
respectively (n = 3)..........................................................................................210
Figure C.6: Nonmetric multidimensional scaling plots of mole percentages of all
individual FAMEs from whole soil, 2000 – 4000, 500 – 2000, 250 – 500 and
75 – 250 μm aggregates of a Theresa silt loam over time (0, 7, 14, 21 d). The
proportion of variance explained by each axis is indicated in parentheses.
Values of the symbols and error bars represent means and standard error,
respectively (n = 3)..........................................................................................211
Figure C.7: Nonmetric multidimensional scaling plots of mole percentages of all
individual FAMEs from whole soil, 2000 – 4000, 500 – 2000, 250 – 500 μm
aggregates of an Appling sandy loam after 14 d. The proportion of variance
explained by each axis is indicated in parentheses. Indicator FAME
biomarkers for each treatment are listed in the legend. Values of the symbols
and error bars represent means and standard error, respectively (n = 3).........212
xx
Figure C.8: Nonmetric multidimensional scaling plots of mole percentages of all
individual FAMEs from whole soil, 2000 – 4000, 500 – 2000, 250 – 500, and
75 - 250 μm aggregates of a Theresa silt loam after 14 d. The proportion of
variance explained by each axis is indicated in parentheses. Indicator FAME
biomarkers for each treatment are listed in the legend. Values of the symbols
and error bars represent means and standard error, respectively (n = 3).........213
Figure C.9: Nonmetric multidimensional scaling plots of mole percentages of all
individual FAMEs from whole soil, 2000 – 4000, 500 – 2000, 250 – 500 μm
aggregates of an Appling sandy loam after 7 d. The proportion of variance
explained by each axis is indicated in parentheses. Indicator FAME
biomarkers for each treatment are listed in the legend. Values of the symbols
and error bars represent means and standard error, respectively (n = 3).........214
Figure C.10: Nonmetric multidimensional scaling plots of mole percentages of all
individual FAMEs from whole soil, 2000 – 4000, 500 – 2000, 250 – 500, and
75 - 250 μm aggregates of a Theresa silt loam after 7 d. The proportion of
variance explained by each axis is indicated in parentheses. Indicator FAME
biomarkers for each treatment are listed in the legend. Values of the symbols
and error bars represent means and standard error, respectively (n = 3).........215
1
CHAPTER 1
INTRODUCTION
2
Since the dawn of the industrial age, the world has seen an untold number of
technological advances which have made, and continue to make, our lives easier and
more enjoyable. However, with every technological advance comes greater
responsibilities and in many cases problems. For example, the creation of every new
gadget involves the use of synthetic chemicals during their development, production,
storage, and/or disposal in some way. In 2004, more than 23,000 private and federal
facilities within the US reported to the Environmental Protection Agency as part of the
Toxic Release Inventory Program 4.24 billion pounds of on-site and off-site
disposal/release of more than 600 toxic chemicals (USEPA, 2004). Not surprisingly, the
general public has become increasingly concerned about the large quantities of toxic
substances that have been reported to be in the environment, particularly in soil and water
systems. The nitroaromatic explosive 2,4,6-trinitrotoluene (TNT) is just one of these
chemicals which has recently posed a ecotoxicological threat, especially with the closing
and decommissioning of military institutions in the US and across the world (Spain,
2000).
Over the last 20 years there has been a significant amount of published research
on the fate of TNT in the environment. Originally it was reported that TNT is adsorbed
by soil with greater affinity for clay minerals than soil organic matter, and can be readily
mobilized through desorption processes (Pennington and Patrick, 1990; Haderlein and
Schwarzenbach, 1993; Haderlien et al., 1996). Thus, these studies suggested that TNT
poses a significant risk to surface and groundwater resources through subsurface
transport. However, additional research has shown that TNT is not readily desorbed from
soil and may not be easily removed via simple extraction procedures; especially with
3
prolong exposure (Hundal et al., 1997; Achtnich et al., 1999). There are numerous
reasons for these apparent discrepancies in the literature. For example, earlier studies
reporting reversible sorption focused on low concentrations of TNT, sorption to
individual soil components, and very short exposure/equilibration times. Conversely,
research conducted more recently has focused on higher concentrations up to and beyond
the solubility of TNT in water, extended exposure of TNT in soil, and fate studies
conducted in-situ or in the laboratory involving more complex systems. In general, there
is still considerable uncertainty with respect to how TNT behaves in the environment.
Thus, the research presented in this dissertation is focused on expanding our
understanding of how TNT interacts with the environment by looking specifically at
interactions with humic-clay complexes and soil systems. With respect to TNT
interactions in the soil, this work focused on how the fate of TNT may differ within
various soil aggregate size fractions. Overall, the research in this dissertation is presented
as three distinct chapters, with each being prepared as separate manuscripts for
publication.
The first study (Chapter 3) focuses on TNT sorption and desorption to clay
minerals, humic acid, and humic-clay complexes. Clay minerals and components of soil
organic matter (such as humic acid) play an important role in the formation of soil
aggregates. Although previous work has been conducted examining the sorption of TNT
to clay minerals and humic acid individually, little is known on how interactions between
humic substances and clay minerals may affect the ability of each to adsorb TNT. Batch
sorption experiments were performed to determine the extent and characteristics of TNT
sorption to four different clay minerals each saturated with two cations (K+- and Ca2+-),
4
humic acid, and the respective humic-acid-clay complexes. This research was presented
in Salt Lake City as part of the 2005 Soil Science Society of America Meetings.
Additionally this work will be submitted to the Environmental Science and Technology, a
journal published by the American Chemical Society.
The second study (Chapter 4) deviated from the focus on the fate of TNT in soil
and instead focuses on how soil aggregates are obtained for use in ex-situ studies. The
properties and processes that occur with soil aggregates still remain a mystery because of
the lack of in-situ methods available to characterize and monitor aggregation. As soon as
soil is removed from its natural state and sieved into individual size fractions the complex
system is greatly disturbed and thus no longer behaves in the same manner. Although our
understanding of processes related to soil aggregates have been greatly improved, there
are some who believe that the results of this research is merely an artifact of the
sampling, storage, handling, and fractionation methods used. Thus, before examining
how TNT may behave in soil aggregates of different size, I tried to characterize how
different sieving methods may impact soil properties and processes which are related to
the fate of environmental contaminants (i.e. sorption, biotransformation, biodegradation).
This included physical soil properties (i.e. clay content, aggregate size distribution),
chemical soil properties (i.e. organic carbon, cation exchange capacity), and biological
function by characterizing the microbial community structure through the analysis of
fatty acid methyl esters (FAME) which can be used as indicators of specific
microorganisms (i.e. gram-negative bacteria, fungi, protozoa, etc). This research was
presented in Denver as part of the 2003 Soil Science Society of America Meetings.
5
Additionally this work will be submitted to the Journal of Soil Biology and Biochemistry,
a journal published by Elsevier Publishing.
Finally, the third study (Chapter 5) focused on the ability of earthworms to
mediate and/or accelerate the disappearance and transformation of TNT in soil and soil
aggregates. Earthworms are known to contribute to the formation of soil aggregates
through incorporation of organic residues, soil mixing, and excretion of soil material as
casts which have been characterized as hot beds of microbial activity (Lee, 1985;
Edwards and Bohlen, 1996). Thus, they may play a significant role in the distribution
and transformation of TNT within soil and soil aggregates. This could come about
through direct interaction with TNT or through the alteration of the microbial
community, particularly those organisms which are known to breakdown TNT into other
compounds or metabolites. Two soils, an alfisol from Wisconsin and an ultisol from
Georgia, with contrasting characteristics (i.e. soil organic matter content, clay
mineralogy) were used in two 21 d incubation studies involving the earthworm Eisenia
fetida in small soil microcosms. Over the 21 d the aggregate size distribution, earthworm
biomass, amount of TNT disappearance, amount of metabolite formation (2-amino-4,6-
dinitrotoluene, 4-amino-2,6-dinitrotoluene) in soil and within earthworms, and the
microbial community structure were measured or characterized. The research presented
in this chapter was presented in Seattle and Salt Lake City as part of the 2004 and 2005
Soil Science Society of America Meetings, respectively. Additionally this work will be
submitted to Environmental Toxicology and Chemistry, a journal published by the
Society of Environmental Toxicology and Chemistry.
6
References
Achtnich, C., U. Sieglen, H-J. Knackmuss, and H. Lenke. 1999. Irreversible binding of biologically reduced 2,4,6-trinitrotoluene to soil. Environ. Toxicol. Chem. 18: 2416-2423.
Edwards, C.A., and P.J. Bohlen. 1996. Biology and ecology of earthworms. Chapman and Hall, London.
Haderlein, S.B., and R.P. Schwarzenbach. 1993. Adsorption of substituted nitrobenzenes and nitrophenols to mineral surfaces. Environ. Sci. Technol. 27: 316-326.
Haderlein, S.B., K.H. Weissmahr, and R.P. Schwarzenbach. 1996. Specific adsorption of nitroaromatic explosives and pesticides to clay minerals. Envion. Sci. Tehcnol. 30: 612-622.
Hundal, L., P.J. Shea, S.D. Comfort, W.L. Powers, and J. Singh. 1997. Long-term TNT sorption and bound residue formation in soil. J. Environ. Qual. 26: 896-904.
Lee, K.E., 1985. Earthworms: Their ecology and relationships with soils and land use. Academic Press. Sydney.
Pennington, J.C., and W.H. Patrick. 1990. Adsorption and desorption of 2,4,6-
trinitrotoluene by soils. J. Environ. Qual. 19: 559-567.
Spain J.C. 2000. Introduction. p. 1-5, In Biodegradation of nitroaromatic compounds and explosives. Spain, J.C. (ed). Lewis Publishers, Boca Raton, FL.
USEPA 2004. Toxics Release Inventory (TRI) Public Data Release Report [Online]. http://www.epa.gov/tri/tridata/tri04/pdfs/2004brochure.pdf (accessed 20 June 2006). USEPA, Washington, DC.
7
CHAPTER 2
LITERATURE REVIEW
8
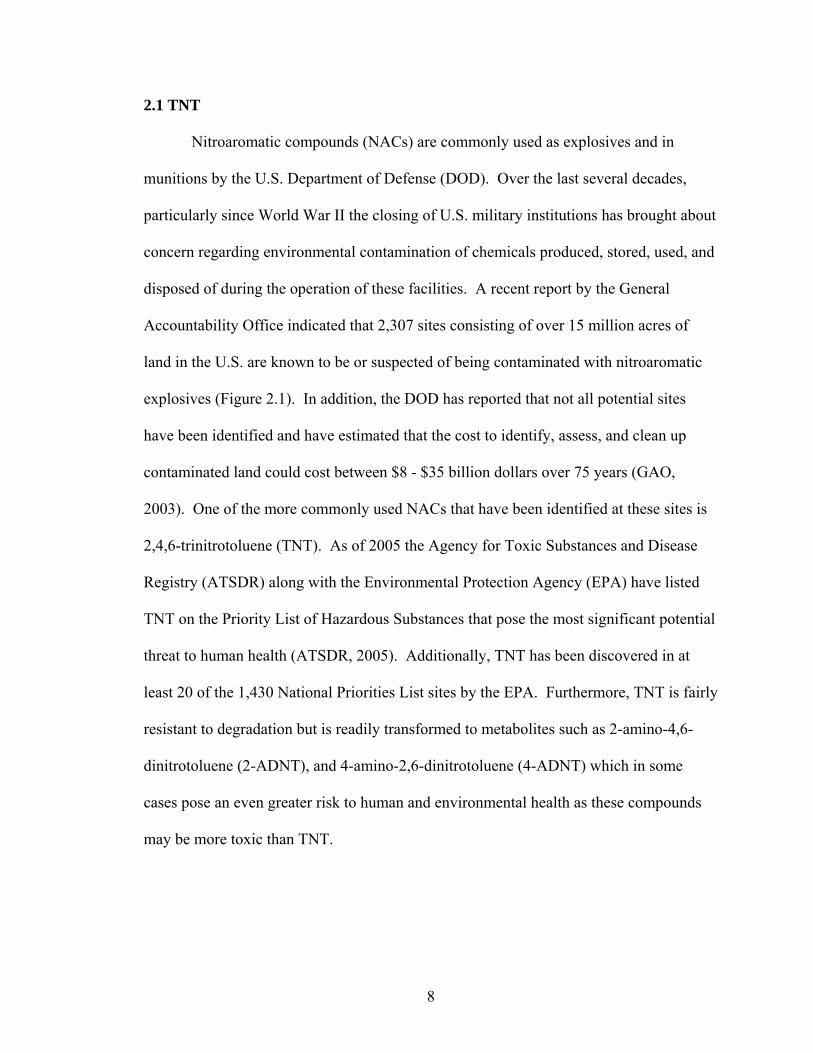
2.1 TNT
Nitroaromatic compounds (NACs) are commonly used as explosives and in
munitions by the U.S. Department of Defense (DOD). Over the last several decades,
particularly since World War II the closing of U.S. military institutions has brought about
concern regarding environmental contamination of chemicals produced, stored, used, and
disposed of during the operation of these facilities. A recent report by the General
Accountability Office indicated that 2,307 sites consisting of over 15 million acres of
land in the U.S. are known to be or suspected of being contaminated with nitroaromatic
explosives (Figure 2.1). In addition, the DOD has reported that not all potential sites
have been identified and have estimated that the cost to identify, assess, and clean up
contaminated land could cost between $8 - $35 billion dollars over 75 years (GAO,
2003). One of the more commonly used NACs that have been identified at these sites is
2,4,6-trinitrotoluene (TNT). As of 2005 the Agency for Toxic Substances and Disease
Registry (ATSDR) along with the Environmental Protection Agency (EPA) have listed
TNT on the Priority List of Hazardous Substances that pose the most significant potential
threat to human health (ATSDR, 2005). Additionally, TNT has been discovered in at
least 20 of the 1,430 National Priorities List sites by the EPA. Furthermore, TNT is fairly
resistant to degradation but is readily transformed to metabolites such as 2-amino-4,6-
dinitrotoluene (2-ADNT), and 4-amino-2,6-dinitrotoluene (4-ADNT) which in some
cases pose an even greater risk to human and environmental health as these compounds
may be more toxic than TNT.
9
Figure 2.1. Distribution of 2,307 suspected sites contaminated with military munitions as identified by the U.S. Department of Defense. (GAO, 2003)
10
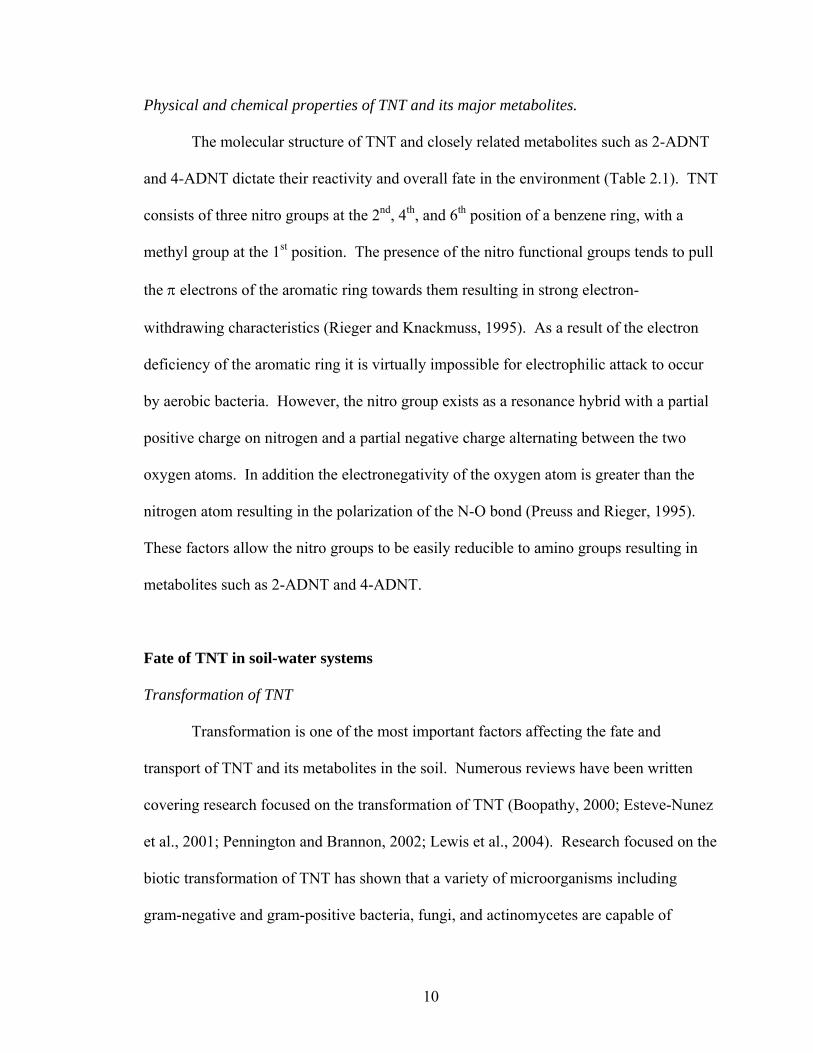
Physical and chemical properties of TNT and its major metabolites.
The molecular structure of TNT and closely related metabolites such as 2-ADNT
and 4-ADNT dictate their reactivity and overall fate in the environment (Table 2.1). TNT
consists of three nitro groups at the 2nd, 4th, and 6th position of a benzene ring, with a
methyl group at the 1st position. The presence of the nitro functional groups tends to pull
the π electrons of the aromatic ring towards them resulting in strong electron-
withdrawing characteristics (Rieger and Knackmuss, 1995). As a result of the electron
deficiency of the aromatic ring it is virtually impossible for electrophilic attack to occur
by aerobic bacteria. However, the nitro group exists as a resonance hybrid with a partial
positive charge on nitrogen and a partial negative charge alternating between the two
oxygen atoms. In addition the electronegativity of the oxygen atom is greater than the
nitrogen atom resulting in the polarization of the N-O bond (Preuss and Rieger, 1995).
These factors allow the nitro groups to be easily reducible to amino groups resulting in
metabolites such as 2-ADNT and 4-ADNT.
Fate of TNT in soil-water systems
Transformation of TNT
Transformation is one of the most important factors affecting the fate and
transport of TNT and its metabolites in the soil. Numerous reviews have been written
covering research focused on the transformation of TNT (Boopathy, 2000; Esteve-Nunez
et al., 2001; Pennington and Brannon, 2002; Lewis et al., 2004). Research focused on the
biotic transformation of TNT has shown that a variety of microorganisms including
gram-negative and gram-positive bacteria, fungi, and actinomycetes are capable of
11
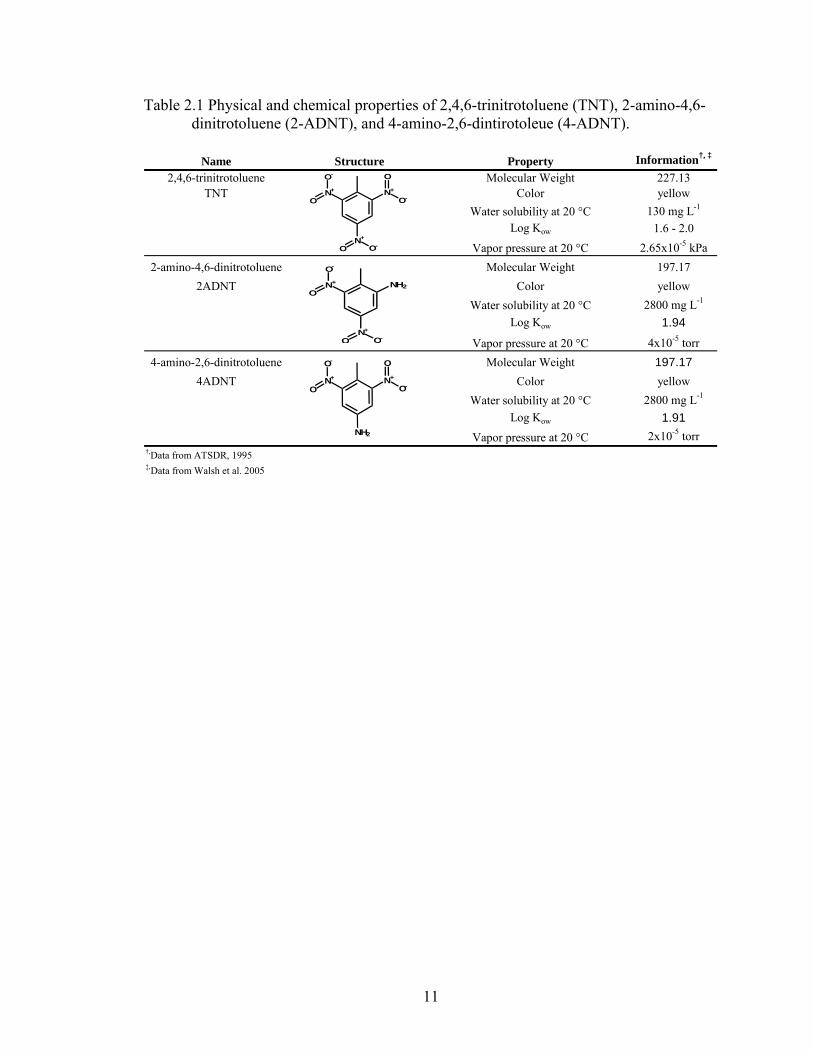
Table 2.1 Physical and chemical properties of 2,4,6-trinitrotoluene (TNT), 2-amino-4,6- dinitrotoluene (2-ADNT), and 4-amino-2,6-dintirotoleue (4-ADNT).
Name Structure Property Information†, ‡
2,4,6-trinitrotoluene Molecular Weight 227.13TNT Color yellow
Water solubility at 20 °C 130 mg L-1
Log Kow 1.6 - 2.0Vapor pressure at 20 °C 2.65x10⁻⁵ kPa
2-amino-4,6-dinitrotoluene Molecular Weight 197.172ADNT Color yellow
Water solubility at 20 °C 2800 mg L-1
Log Kow 1.94
Vapor pressure at 20 °C 4x10⁻⁵ torr4-amino-2,6-dinitrotoluene Molecular Weight 197.17
4ADNT Color yellowWater solubility at 20 °C 2800 mg L-1
Log Kow 1.91Vapor pressure at 20 °C 2x10⁻⁵ torr
†,Data from ATSDR, 1995‡,Data from Walsh et al. 2005
N+
O
O-
N+
O O-
N+
O
O-
N+
O
O-
N+
O O-
NH2
N+
O
O-
N+
O
O-
NH2
12
transforming TNT under aerobic, anaerobic, and anoxic conditions (McCormick et al.,
1976; Boopathy, 1994; Bruns-Nagel, et al., 1996; Bayman and Radkar, 1997; Ederer et
al., 1997; Scheibner et al., 1997; Hawari et al., 1998; Vorbeck et al., 1998; Vasilyeva et
al., 2000).
Under normal environmental conditions, aerobic transformation is the most
common transformation pathway. For example, Oh et al. (2001) reported that the gram-
negative bacteria Pseudomonas aeruginosa isolated from TNT-contaminated soil was
capable of aerobically transforming TNT (to 2-ADNT and 4-ADNT) through the
production of the nitroreductase enzyme. Additionally, Pseudomonas savastanoi also
isolated from a TNT contaminated soil was capable of denitrifying TNT under aerobic
conditions to produce 2,4-dinitrotoluene (2,4-DNT) with 2-ADNT and 4-ADNT as
incidental products (Martin et al., 1997). Fungi native to soil (Trichoderma viride,
Cladosporium resina, and Cunninghamella echinulata var. elegans) and two white-rot
basidiomycetes (Schizophyllum commune and Phanerochaete chrysosporium) have
demonstrated the ability to transform TNT via enzymatic reduction (Fernando et al.,
1990; Bayman and Radkar, 1997). A study conducted by Bayman and Radkar (1997)
demonstrated that Cunninghamella echinulata var. elegans and Trichoderma viride were
capable of converting 27 and 19%, respectively, of a 200 ppm TNT solution into
aqueous-soluble metabolites and that after three days no TNT was detectible in the
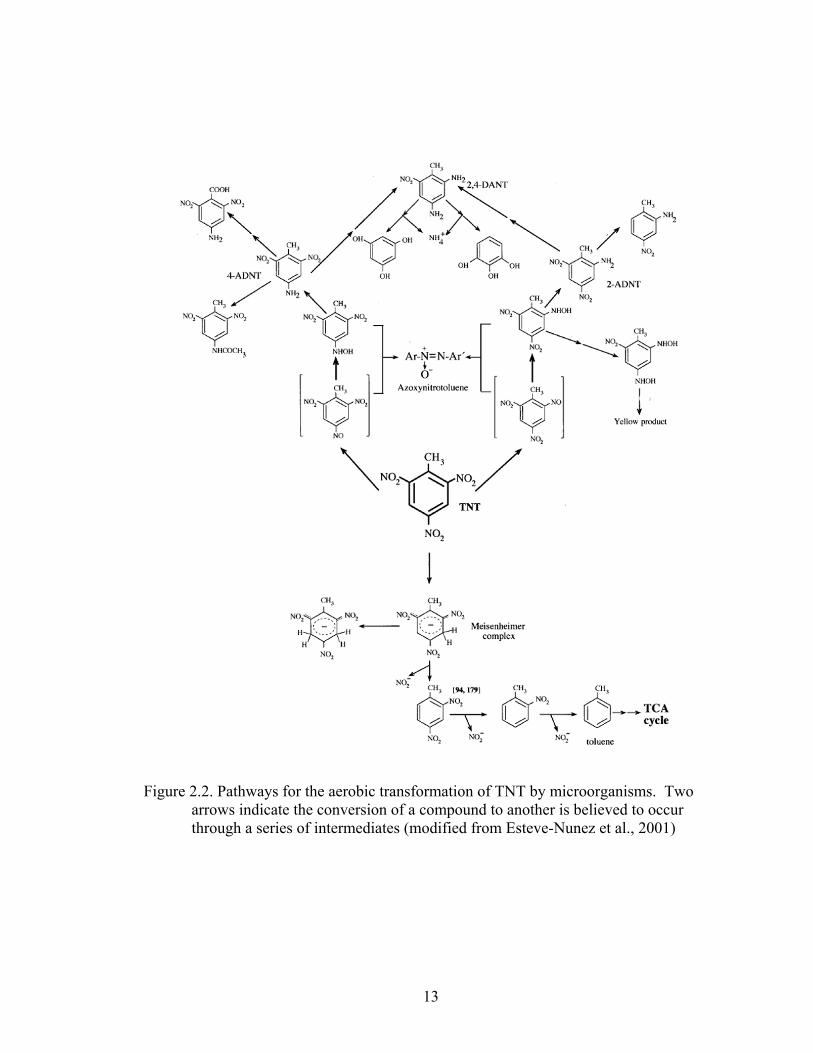
cultures. An additional aerobic pathway, although not as likely, is the formation of a
Meisenheimer complex (Figure 2.2). Bacteria such as Mycobacterium sp. and
Rhodococcus erythropolis have been shown to produce the hydride-Meisenheimer
13
Figure 2.2. Pathways for the aerobic transformation of TNT by microorganisms. Two arrows indicate the conversion of a compound to another is believed to occur through a series of intermediates (modified from Esteve-Nunez et al., 2001)
14
complex under aerobic conditions (Vorbeck et al., 1994; Vorbeck et al., 1998; Pak et al.,
2000). If transformation proceeds via the Meisenheimer complex TNT can potentially
be transformed into toluene, a compound that can be incorporated into the trichloroacetic
acid (TCA) cycle that is the normal metabolic cycle from which microbes synthesize
energy.
The transformation of TNT to 4-ADNT is the energetically favored pathway as it
is easier to reduce the nitro- group located at the 4th carbon on the benzene ring than it is
to reduce the 2nd carbon due to the close proximity to the methyl- group and the nitro
group on the 6th carbon (Elovitz and Weber, 1999). The reduction of two nitro- groups
leading to the formation of 2,4- diamino-6-nitrotoluene (2,4-DANT) is energetically more
difficult to form and are observed much less frequently then 2-ADNT or 4-ADNT. The
reduction of all three nitro- groups leading to the formation of 2,4,6-triaminotoluene
(TAT) is rarely observed as it requires strong reducing or anaerobic conditions to reduce
all three nitro groups (McCormick et al., 1976; Rieger and Knackmuss, 1995, Lewis et
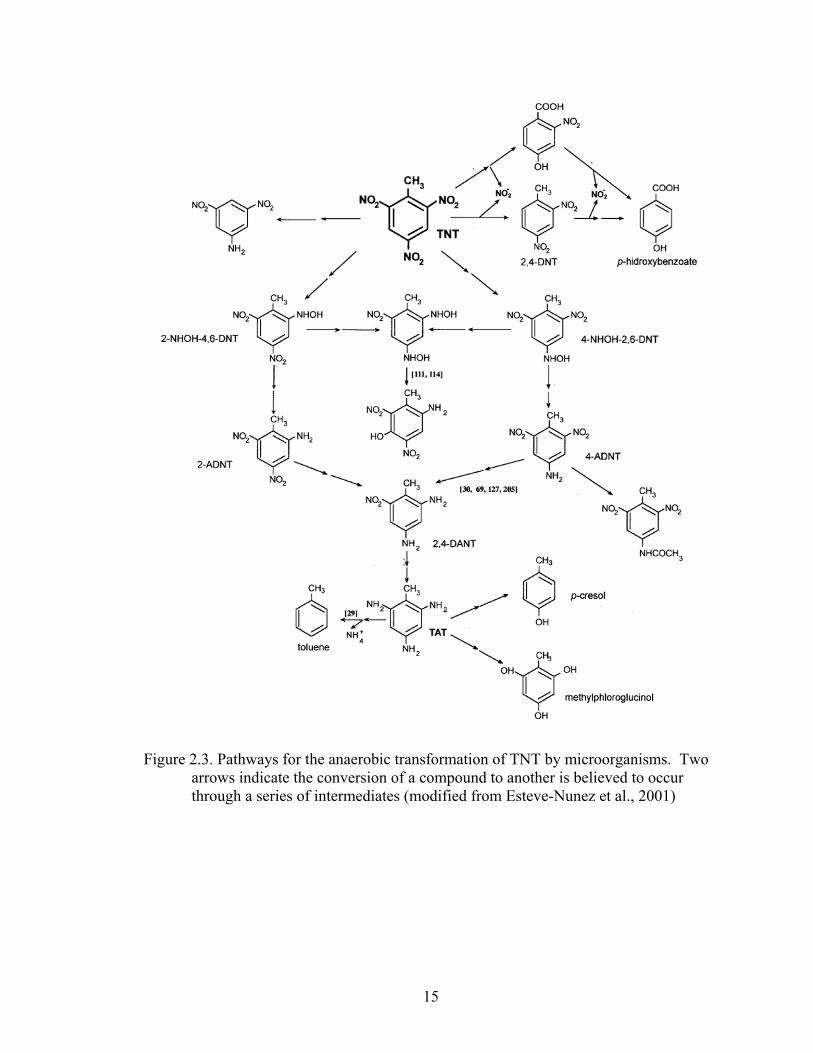
al., 1996; Daun et al., 1998; Hawari et al., 1998). The transformation pathways and
products produced under anaerobic conditions are shown in Figure 2.3. Anaerobic
transformation of TNT is preferred over aerobic transformation due to the rapid reduction
of TNT and absence of azoxy- intermediates that may be more toxic than TNT (Esteve-
Nunez et al., 2001; Wang et al., 2003). In general, two genera of bacteria have been
identified as reducing TNT under anaerobic conditions: Clostridium and Desulfovibrio.
For example, Lewis et al. (1996) demonstrated that Clostridium bifermentans LJP-1 was
able to transform TNT into TAT and phenolic compounds capable of being degraded
further. Additionally, Boopathy and Kulpa (1994) reported that the sulfate-reducing
15
Figure 2.3. Pathways for the anaerobic transformation of TNT by microorganisms. Two arrows indicate the conversion of a compound to another is believed to occur through a series of intermediates (modified from Esteve-Nunez et al., 2001)
16
bacterium Desulfovibrio sp. (B strain) could use TNT as a sole nitrogen source and as an
electron acceptor in the absence of sulfate. Under nitrogen-limiting conditions the
authors reported 100% removal of TNT after 8 days and detected toluene which formed
from the denitration of TAT.
It should be noted that the aerobic progression of TNT to 2-ADNT, 4-ADNT, or
2,4-DANT does not result in metabolizable compounds, however, the anaerobic
transformation to TAT does (Figure 2.2). Although a variety of organisms have been
identified as being capable of degrading or transforming TNT, in most cases the
organisms have required a co-substrate and/or have only been successful in pure cultures
without other microorganisms or soil fauna present (Boopathy and Kulpa, 1994; Hawari
et al., 2000).
Although there is considerable knowledge regarding biotic transformation, much
less is known regarding abiotic transformation of TNT (Haderlein and Schwarzenbach,
1995). Under anaerobic conditions iron (hydr)oxide coatings on mineral surfaces have
been shown to promote the reduction of NACs such as TNT (Klausen et al. 1995;
Brannon et al., 1998). Brannon and coworkers demonstrated minimal TNT
transformation in samples containing only Fe+2 and TNT or montmorillonite and TNT.
However, in montmorillonite + TNT + Fe+2 systems with a pH > 7 the authors reported
80-99% disappearance of the initial TNT concentrations (0.11mmol L-1). Transformation
products included 2ADNT, 4ADNT and azoxy compounds. Additionally as much as
50% of the initial TNT was unaccounted for and assumed to be unextractable or
converted to unidentifiable transformation products. Nefso et al. (2005) reported
insignificant reactions between TNT, Fe2+, and minerals such as magnetite, pyrite, and
17
goethite in unbuffered systems. However, in the presence of calcite the reduction
occurred rapidly to completion. This was attributed to the pH of the calcite system
exceeding 7.4. These results indicate that under specific conditions (anaerobic, high pH)
the abiotic reduction of TNT on the surfaces of certain minerals may be a significant
mechanism for TNT transformation and removal from the soil. Zero-valent iron (Fe0) has
also been used to reduce TNT under anaerobic conditions (Agrawal and Tratnyek, 1996;
Hundal et al. 1997; Keum and Li, 2004). Within 8 h a 1% Fe0 solution was able to
remove 100% of a 70 mg TNT L-1 solution and after 24 hr a significant amount (98%) of
the TNT was adsorbed by the iron within 24 hr and 38% was irreversibly bound (Hundal
et al., 1997).
Previously studies have shown that the oxidation of TNT via enzymatic processes
is almost nonexistent (Boopathy et al., 1994). This is due to the electron-withdrawing
nature of the nitro groups leaving the aromatic structure electron deficient and preventing
electrophilic attack my aerobic bacteria (Bruhn et al., 1987; Rieger and Knackmuss,
1995). However, the addition of reduced iron and H2O2, which initiates the Fenton
reaction, into systems containing TNT has shown promise as a method to remediate TNT
contaminated water and soil (Hundal et al., 1997; Li et al., 1997). Fenton oxidation is a
strong oxidizing reaction which is capable of oxidizing reduced TNT intermediates and
metabolites (Hundal et al., 1997). The products formed from this strong oxidation are
readily degradable resulting in the mineralization of TNT. Li et al. (1997) reported 100%
destruction of TNT using fenton oxidation and the subsequent exposure to UV-light
resulted in > 90% mineralization.
18
TNT sorption to soil and soil components
Sorption of TNT and its metabolites to soil has been well documented
(Pennington and Patrick; 1990; Comfort et al., 1995; Xue et al., 1995; Selim et al., 1995;
Pennington and Brannon, 2002). Specifically, clay minerals and soil organic matter are
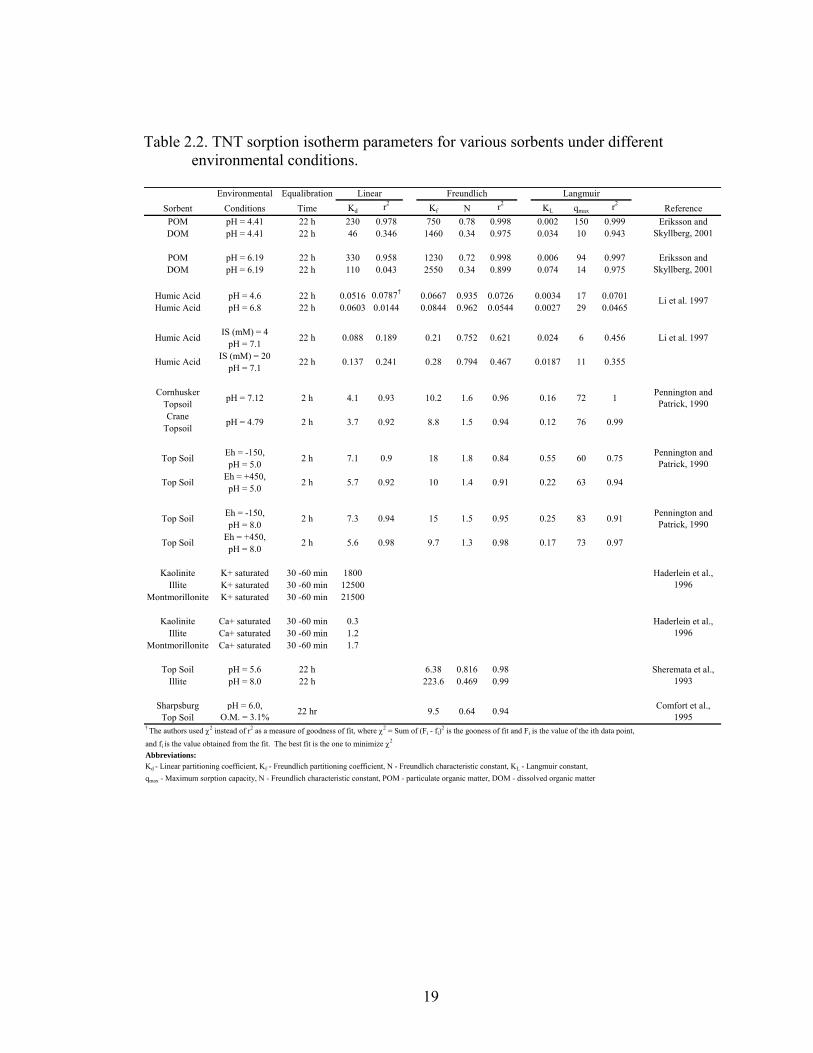
the most common sorbents of these compounds in the environment. Table 2.2 is a
summary of TNT sorption parameters for various sorbents under different environmental
conditions. Although there have been many studies examining TNT sorption there is
some discrepancy as to the extent TNT is reversibly sorbed to soils. Studies performed
by Pennington and Patrick (1990) and Haderlein et al. (1996) reported that TNT is readily
desorbed from soil and clay minerals. However, others have reported the formation of
irreversibly bound residues from the sorption of TNT and related metabolites. One
possible explanation for the conflicting results was the length of time TNT was exposed
to the sorbent. For example, although equilibration is achieved fairly quickly (< 1 hr),
Hederlein et al. (1996) and Pennington and Patrick (1990) used equilibrium times of 30
to 60 min and 2 h, respectively. Alternatively studies involving batch equilibration times
of > 24 h and long term aging studies up to 168 d have reported the formation of
irreversibly bound residues. These studies reported that 19 to 47 % of the initial
concentration of TNT was not removed from the soil after exhaustive extractions using
solvents (Hundal et al., 1997; Achtnich et al., 1999; Sheremata et al., 1999). Thus, TNT
may be reversibly bound to clay and soil in the short term but with prolong exposure the
extractability of TNT becomes more difficult. This also suggests that the sorption
mechanism between TNT and these sorbents is complex and may change with time.
19
Table 2.2. TNT sorption isotherm parameters for various sorbents under different environmental conditions.
Environmental EqualibrationSorbent Conditions Time Kd r2 Kf N r2 KL qmax r2
ReferencePOM pH = 4.41 22 h 230 0.978 750 0.78 0.998 0.002 150 0.999DOM pH = 4.41 22 h 46 0.346 1460 0.34 0.975 0.034 10 0.943
POM pH = 6.19 22 h 330 0.958 1230 0.72 0.998 0.006 94 0.997DOM pH = 6.19 22 h 110 0.043 2550 0.34 0.899 0.074 14 0.975
Humic Acid pH = 4.6 22 h 0.0516 0.0787† 0.0667 0.935 0.0726 0.0034 17 0.0701Humic Acid pH = 6.8 22 h 0.0603 0.0144 0.0844 0.962 0.0544 0.0027 29 0.0465
IS (mM) = 4pH = 7.1
IS (mM) = 20pH = 7.1
CornhuskerTopsoilCrane
Topsoil
Eh = -150,pH = 5.0
Eh = +450,pH = 5.0
Eh = -150,pH = 8.0
Eh = +450,pH = 8.0
Kaolinite K+ saturated 30 -60 min 1800Illite K+ saturated 30 -60 min 12500
Montmorillonite K+ saturated 30 -60 min 21500
Kaolinite Ca+ saturated 30 -60 min 0.3Illite Ca+ saturated 30 -60 min 1.2
Montmorillonite Ca+ saturated 30 -60 min 1.7
Top Soil pH = 5.6 22 h 6.38 0.816 0.98Illite pH = 8.0 22 h 223.6 0.469 0.99
SharpsburgTop Soil
† The authors used χ2 instead of r2 as a measure of goodness of fit, where χ2 = Sum of (Fi - fi)2 is the gooness of fit and Fi is the value of the ith data point,
and fi is the value obtained from the fit. The best fit is the one to minimize χ2
Abbreviations:
2 h
2 h
22 hr
Eriksson and Skyllberg, 2001
Eriksson and Skyllberg, 2001
Li et al. 1997
Li et al. 1997
Haderlein et al., 1996
Haderlein et al., 1996
Sheremata et al., 1993
2 h
2 h
2 h
2 h
0.0187 11 0.3550.28 0.794 0.467
0.024 6 0.4560.21 0.752 0.621Humic Acid
Humic Acid
0.088 0.189
0.137 0.241
22 h
22 h
Linear Freundlich Langmuir
pH = 7.12 4.1 0.93 10.2 1.6 0.96 0.16 72 1 Pennington and Patrick, 1990
pH = 4.79 3.7 0.92 8.8 1.5 0.94 0.12 76 0.99
Top Soil 7.1 0.9 18 1.8 0.84 0.55 60 0.75 Pennington and Patrick, 1990
Top Soil 5.7 0.92 10 1.4 0.91 0.22 63 0.94
Top Soil 7.3 0.94 15 1.5 0.95 0.25 83 0.91 Pennington and Patrick, 1990
Top Soil 5.6 0.98 9.7 1.3 0.98 0.17 73 0.97
pH = 6.0, O.M. = 3.1% 9.5 0.64 0.94
Kd - Linear partitioning coefficient, Kf - Freundlich partitioning coefficient, N - Freundlich characteristic constant, KL - Langmuir constant,qmax - Maximum sorption capacity, N - Freundlich characteristic constant, POM - particulate organic matter, DOM - dissolved organic matter
Comfort et al., 1995
20
Sorption mechanisms for TNT and other NACs to soil and soil components have
been investigated and again, there are conflicting theories reported in the literature.
Weissmahr et al. (1997) and Haderlein et al. (1996) using in-situ spectroscopic
techniques (ATR-FTIR, 13C-NMR, UV/VIS, XRD) proposed a co-planar electron donor-
acceptor (EDA) mechanism to explain TNT sorption to clay minerals. Based on this
theory, siloxane oxygen sheets with negative charge (arising from isomorphous
substitution in the clay structure) donate electrons to NACs, which are e- acceptors due to
the electron-deficient π-system as a result of the electron withdrawing properties of the
nitro groups. The extent to which EDA complexes are formed was determined to be a
function of the type of interlayer exchangeable cation and its corresponding degree of
hydration. For example, Haderlein et al. (1996) reported TNT Kd values of 21,500 and
1.7 L kg-1 on a K+- and Ca2+- saturated Arizona smectite (SAz-1), respectively. The
weakly hydrated K+- (-360 kJ mol-1 enthalpy of hydration) was easily replaced by TNT
where the strongly hydrated Ca+2- (-1669 kJ mol-1 enthalpy of hydration) prevented TNT
interaction with the clay surface (Haderlein et al. 1996; Johnston et al., 2004). The
authors also stated that their results indicated that the EDA complex formation occurred
mainly at external and to a lesser degree interlamellar siloxane surfaces inferring that
TNT sorption occurs mostly on external surfaces.
Boyd et al. (2001) and Johnston et al. (2001) provided a modified and contrasting
mechanism to the EDA complex. Again using in-situ spectroscopic methods the authors
proposed that sorption of NACs to clay minerals was controlled by the ability of NACs to
form inner-sphere complexes directly with exchangeable cations rather than interactions
with negatively charged siloxane oxygens. However, similar to the findings of Haderlien
21
and co-workers the type of cation and the strength of hydration again were important
factors involved in NAC sorption. The low hydration energy of K+- would allow for
direct inner-sphere coordination with TNT whereas the high hydration energy of Ca+2-
inhibits this coordination. Additionally, sorption of TNT to clay minerals increases with
an increasing number of nitro- groups and decreases with the presence of electron-
releasing groups such as amines. This explains why TNT sorption to clay minerals is
greater than its metabolites (2-ADNT, 4-ADNT, 2,4-DANT, etc) as has been reported
(Sheremata et al., 1999). Li et al. (2003) examined the sorption of two NAC pesticides to
clay minerals and humic-clay complexes. They noted that humic acid, which was
associated with the external surface of the clay minerals, had no impact on the sorption of
either pesticide by the humic-clay complex. Additionally, XRD analysis indicated
intercalation of the smectite clay was no different compared to the humic-clay complex
when exposed to the pesticide. Thus, the authors concluded that the interlameller regions
were the primary domains for NAC sorption. Furthermore, quantum chemical studies
and quantum calculations have provided direct evidence against the EDA mechanism as
the significant sorption mechanism for NACs (Pelmenschikov and Leszczynski, 1999;
Johnston et al., 2001). In these studies, the high affinity of NACs for the siloxane surface
was determined to be the result of nonspecific, short-ranged dispersion interactions
otherwise known as van der Waals interactions.
An additional mechanism which has been discussed further elaborates on the
nonspecific, short-ranged van der Waals interactions between NACs and clay minerals.
Johnston et al. (2004) provides a detailed discussion on the hydrophobic characteristics of
clay minerals. Clay minerals without isomorphic substitution or that have low surface
22
charge densities are known to have hydrophobic characteristics. Hectorite (SHCa-1) is
an example of a 2:1 clay mineral that exhibits hydrophobic characteristics (Van Oss and
Giese, 1995). Briefly, for clays which have isomorphous substitution, the charged
surfaces on the clay mineral are separated by distances of 1 – 2 nm. The space between
the charge sites is neutral and has been shown to stabilize NAC sorption due to the
neutral and planar characteristics of many NACs. Because TNT has a fairly low
solubility in water (90 – 130 mg L-1) and a moderate octanol:water coefficient (Kow =
1.6), these sites are capable of contributing to the sorption of TNT. Studies involving the
NAC 4,6-dinitro-o-cresol and non NACs such as atrazine have provided evidence of
hydrophobic interactions with clay minerals (Boyd et al., 2001; Sheng et al., 2002).
These studies reported that the intercalation of these compounds was due to compound
partitioning from the bulk water and into the subaqueous environment of the internal clay
surfaces. This also supports the conclusions of Li et al. (2003), discussed above, that the
interlayer region provides most of the available sorption sites for NACs.
Overall, these studies do not provide unequivocal evidence of one dominant
mechanism for the sorption of NACs and TNT to clay minerals. Additionally, although
significant progress has been made to identify TNT sorption mechanisms for clay
minerals, little is known as to the mechanism for NAC sorption to organic matter.
Studies involving NAC sorption to organic substances such as humic acid, dissolved and
particulate organic matter, and natural organic matter have yet to identify anything other
than nonspecific interactions (Li et al., 1997; Weissmahr et al. 1999; Eriksson and
Skyllberg, 2001). Although there is still much debate, it is obvious that the sorption of
23
NACs to soil and soil components is complex and involves multiple sorption
mechanisms.
Bioavailability and ecotoxicity of TNT in soil-water systems.
Toxicity to humans first became a concern during World War I when >
17,000 people were poisoned and there were ≈475 deaths as a result of TNT
contamination (Yinon, 1990). Studies have also determined that TNT is mutagenic,
however, since the determination of toxic effects on humans have been limited to
experiments with rats, TNT is listed as a possible carcinogen (Won et al., 1976; ATSDR,
1995). Since this time a substantial amount of research has been conducted investigating
the toxicity of TNT and other explosives to a variety of organisms including soil bacteria,
plants, mammals, and humans. A summary of toxicity research on these organisms is
presented in Tables 2.3 and 2.4. Often times the method of exposure or contact is
overlooked with respect to interpreting the levels contaminant or TNT toxicity to
organisms. For example, Robidoux et al. (1999) exposed the earthworm Eisenia andrei
to TNT in soil and on filter paper and reported drastically different degrees of toxicity
(LC50 values). Although the concentrations at which TNT was lethal to 50% of the test
population is expressed in different units, if you account for the amount of soil and the
area of filter paper; earthworms were much more tolerant of TNT in soil than on filter
paper. The differences are due to the methods of exposure and fate of TNT within soil.
On filter paper, earthworms are only being exposed to TNT by dermal contact, however,
in the soil, they are coming into contact with TNT externally and internally through the
ingestion of soil spiked with TNT. This brings up the concept of bioavailability.
24
Table 2.3 Selected studies showing the relative toxicities of TNT to soil micro- and macro-fauna.
Organism Species TNT Concentration
Method of Contact Result† Reference
gram negative bacteria Pseudomonas sp. 50 mg L-1 soil 55% decrease in aerobic growth rate Sciliano et al. 2000
Pseudomonas sp. 26 mg L-1 soil50% inhibition of denitrification
activity (N2O - N2)Sciliano et al. 2000
gram positive bacteria determined by PLFA 8-16 mg L-1 culture (agar) growth inhibition Fuller and Manning 1998
determined by PLFA 4,177 mg kg-1 soileffective concentration causing 50% reduction in the percent of
isolates
Fuller and Manning 1998
actinomycetes determined by PLFA 362 mg kg-1 soileffective concentration causing 50% reduction in the percent of
isolates
Fuller and Manning 1998
fungi P. chrysosporium 10 mg L-1 soil 50% decrease in mycelial dry weight Spiker et al. 1992
P. chrysosporium 45 mg L-1 soil 96% decrease in respiration Stahl and Aust. 1993
Cunninghamella echinulata var. elegans 50 mg L-1 culture (agar) 90% decrease in radial growth
after 6 dBayman and Radkar
1997
Trichoderma viride 100 mg L-1 culture (agar) 51% decrease in radial growth after 6 d
Bayman and Radkar 1997
Cladosporium resinae 100 mg L-1 culture (agar) 61% decrease in radial growth after 6 d
Bayman and Radkar 1997
soil microbial community NA
50 mg kg-1 (DW)‡, 139 mg kg-1 (AE), 314 mg kg-1 (IA)
soil 50% inhibition of dehydrogenase activity Gong et al. 1999a
Earthworms Eisenia andrei 1.5 - 7.1 μg cm-2 filter paper LC50 after 72 h using 5 trials Robidoux et al. 1999
365 mg kg-1 OECD soil LC50 after 14 d Robidoux et al. 1999
222 mg kg-1 forest soil LC50 after 14 d Robidoux et al. 2000
143 mg kg-1 sandy forest soil LC50 after 14 d Renoux et al. 2000
132 mg kg-1 amended sandy forest soil
LC50 after 14 d Lachance et al 2004
Eisenia fetida 110 mg kg-1 aritifical soil NOEC (based on change in body weight) after 14 d Phillips et al. 1993
< 150 mg kg-1 forest soil NOEC (based on change in body weight) after 14 d Phillips et al. 1993
Potworms Enchytraeus albidus 422 mg kg-1 OECD soil LC50 after 21 d Dodard et al. 2003
Enchytraus crypticus 1,290 mg kg-1 Lufa 2.2 soil LC50 after 7 d Schafer and Achazi 1999
DW, toxicity parameter based on the amount of water extractable TNT AE, toxicity parameter based on the amount of solvent (acetonitrile) extractable TNT IA, toxicity parameter based on the amount of TNT initially applied to the soil
† Abbrevations used to describe the result: LC50, concentration at which it is lethal to 50% of the test population NOEC, no observed effect concentration LOEC, lowest observed effect concentration LOAEC, lowest observed adverse effect concentration‡ Abreviations used in this study:
soil microorganisms
soil invertebrates
25
Table 2.4 Selected studies showing the relative toxicities of TNT to fish, terrestrial plants, and mammals.
Organism Species TNT Concentration
Method of Contact Result† Reference
midge Tantytarsus dissimillis 27 mg L-1 water LC50 after 48 hr, static test Liu et al. 1983b
midge Chironomus tentans 170 mg kg-1 sediment in water LC50 after 10 d Stevens et al. 2002
rainbow trout Oncorhynchus mykiss 0.8 mg L-1 water LC50 after 96 hr, static test Liu et al. 1983b
fathead minnow Pimephales promelas 2.6 mg L-1 waterLC50 after 96 hr, flow-through
testSmock et al. 1976
Alfalfa Medicago sativa L. 150 mg kg-1 freshly amended soil
LOEC on seedling germination after 7 d Rocheleau et al. 2006
215 mg kg-1 aged/wheathered soil
LOEC on seedling germination after 7 d Rocheleau et al. 2006
Japanese millet Echinochloa crusgalli L. 194 mg kg-1 freshly amended
soilLOEC on seedling germination
after 7 d Rocheleau et al. 2006
0.1 mg kg-1 aged/wheathered soil
LOAEC on seedling germination after 7 d Rocheleau et al. 2006
Ryegrass Lolium perenne L. 95 mg kg-1 freshly amended soil
LOEC on seedling germination after 7 d Rocheleau et al. 2006
0.2 mg kg-1 aged/wheathered soil
LOAEC on seedling germination after 7 d Rocheleau et al. 2006
Wheat Triticum aestivum L. 50 mg kg-1 sandy soil LOAEC on seedling germination after 14 d Gong et al. 1999 b
Oat Acena sativa L. 50 mg kg-1 sandy soil LOAEC on seedling germination after 14 d Gong et al. 1999 b
Turnip Brassica rapa 50 mg kg-1 sandy soil LOAEC on seedling germination after 14 d Gong et al. 1999 b
Rat 2 mg kg-1 d-1 Diet LOAEL on the kidney, bones, spleen after 24 mon Furedi et al. 1984
25 mg kg-1 d-1 Diet LOAEL resulting in testicular atrophy after 13 wk Levine et al. 1984
Mouse 70 mg kg-1 d-1 Diet LOAEL on the liver, anemia after 24 mon Furedi et al. 1984
Dog 0.5 mg kg-1 d-1 Diet LOAEL on the liver after 25 wk Levine et al. 1990
2 mg kg-1 d-1 Diet LOAEL on the liver, anemia after 13 wk Dilley et al. 1982
NOEC, no observed effect concentration LOEC, lowest observed effect concentration LOAEC, lowest observed adverse effect concentration
mammals
aquatic invertebrates/fish
terrestrial plants
† Abbrevations used to describe the results: LC50, concentration at which it is lethal to 50% of the test population
LOAEL, lowest observed adverse effect level
26
It appears that TNT was more available to earthworms on filter paper than in the soil,
possibly due to the sorption of TNT by clay minerals and soil organic matter. So when
developing risk assessment of TNT or other contaminants, you need to consider the route
of exposure.
The concept of bioavailability with respect to organic and inorganic contaminants
in soil-water systems has often produced controversy and historically has been difficult to
define. Typically, bioavailability has been defined as the fraction of a contaminant that is
not bound to the soil or that can be easily extracted from the soil. Moore (2003) noted
that bioavailability is a function of toxicity and the interaction with an ecological receptor
needs to be considered when evaluating bioavailability. Thus, bioavailability and toxicity
are closely linked. Recently, the Committee on Bioavailability of Contaminants in Soils
and Sediments, part of the National Research Council (NRC), defined “bioavailability”
as:
The mass transfer and transport of contaminants to be potentially absorbed, adsorbed or altered by organisms, plants, and animals conditioned by the contaminant properties, soil characteristics, and the biology of organisms under a variety of environmental conditions at a specific time (NRC, 2003).
Their approach was to define bioavailability using a general definition in terms of
processes as illustrated by Figure 2.4.
TNT bioavailability in soil has often been determined by using chemical
extractions (process A in Figure 2.4). For example, 34,600 and 87,000 mg TNT kg-1
were extracted from the Joliet Army Ammunition Plant (JAAP, Joliet Illinois) and the
Umatilla Munitions Depot Activity (UMDA, Umatilla, Oregon), respectively using a
27
Figure 2.4. Bioavailability processes in soil (modified from Adriano, 2003; National
Research Council, 2003).
Bound Chemical
Released Chemical
Absorbed Chemical in Organism
Site of Biological Response
DissociationAssociation A
BC
Biological Membrane
Physico-biochemical processes (A and B) Bioavailability (C), Toxicity (D and E)
E
Chemical Interactions Between phases
Transport of chemicals to organisms, elimination from organisms
D
Chemical contact with organisms
Passage across physiological membrane
Circulation within organism, accumulation in target organ, toxicokinetics, and toxic effects
28
solvent (acetonitrile) extraction (Pennington et al. 1995; Simini et al., 1995).
Additionally it was determined that these values greatly exceed the EPA risk-based
concentrations for human exposure of 95 and 21 mg kg-1 for industrial and residential
areas, respectively (ATSDR, 1995). Although > 34,000 mg TNT kg-1 were extracted,
this may not be the concentration which is accessible to an organism, plant, or person.
Because solvent extractions may remove TNT that under normal conditions is tightly
bound to the soil, some researchers have used water or low ionic strength salt solutions to
mimic the amount of TNT that could be removed from the soil during a rain or flooding
event (Hundal et al., 1997; Gong et al., 1999a). Additionally, sequential extractions
using water followed by a solvent have been used to measure the readily and potentially
available fractions. For example, Hundal et al. (1997) spiked a Sharpsburg soil (A
horizon) with ≈ 210 mg kg-1 TNT. Thirty minutes after spiking the soil the authors used
a sequential extraction scheme consisting of a 3 mM CaCl2 solution followed by
acetonitrile and measured 42.3 and 34.4 mg kg-1 TNT, respectively, with a total extracted
amount of 76.7 mg kg-1 TNT. Thus only 55.1% of the total was removed by water (weak
salt solution) and was considered bioavailable.
Although chemical extraction provides a general idea as to the amount of TNT or
contaminant that is bioavailable, more direct methods measuring organism exposure have
provided a better measure of bioavailability and toxicity (processes B and C, Figure 2.4).
Frische (2003) used a battery of five bioassays consisting of plant growth, Collembola
reproduction, soil respiration, luminescent bacteria acute toxicity, and a mutagenicity test
along with chemical extractions to determine the amount of bioavailable TNT in soil.
The advantage of this method is the potential ability to determine the bioavailability and
29
toxicity of TNT to a variety of receptors (i.e. plants, bacteria, soil fauna, etc). However,
the disadvantage is that these multiple methods are more time consuming and may only
reflect the bioavailability to a specific receptor. Additionally, the bioavailability of TNT
has been measured by assessing plant uptake (Wang et al., 2003; Rocheleau et al., 2006),
the absorption of TNT by earthworms (Renoux et al., 2000; Lachance et al., 2004), and
fish (Belden et al., 2005; Ownby et al., 2005)
2.2 Soil aggregation and fractionation
Over the past several decades it has been shown that soils can be grouped into
distinct aggregate fractions that often show meaningful relationships between ecological
function and soil properties such as organic matter dynamics and C and N pool sizes
(Tisdall and Oades 1982; Monrozier et al., 1991; Brady and Weil, 1999). Based on a
model developed by Tisdall and Oades (1982) these aggregates can be classified into a
hierarchical order. Small, primary soil particles (< 53μm) are cemented together into
microaggregates (53 – 250 μm) by persistent binding agents (i.e. humified organic
material) through various processes (i.e. polyvalent-clay and metal-humic organic matter
complexes). These microaggregates are then further bound together by more labile
binding agents (i.e. polysaccharides, roots, fungal hyphae) into macroaggregates (> 250
μm).
Oades (1984) proposed a modification to the original model by suggesting that
microaggregates could also form within macroaggregates. In this model,
macroaggregates could still be derived from microaggregates or from fresh residues (i.e.
plant material) that serves as an aggregate “nucleus”. Next polysaccharides and other
30
labile organic compounds are accumulated and deposited around the aggregate nucleus.
With time, the nucleus will decompose and break into finer organic particles that interact
with clay particles and microbial by-products resulting in the formation of
microaggregates within the former aggregate “nucleus” or macroaggregate. Then the
cycle can start again as the newly formed microaggregates can then be incorporated into
macroaggregates in a similar manner proposed by Tisdall and Oades (1982). A
conceptual model of this process was presented by Six et al. (1999) and is shown in
Figure 2.5.
Numerous studies and reviews have proposed that earthworms, micro-organisms,
binding agents, and land management practices can influence various processes and
properties at the aggregate level (Shipitalo and Protz, 1989; Dexter, 1988; Kay, 1990;
Oades and Waters, 1991; Six et al., 1998; Six et al., 2000a). However, research focused
on the characterization of soil aggregates and the processes associated with them have
often produced conflicting results. This is due to the lack of in-situ methods to
characterize soil aggregate properties and processes and the use of different aggregate
separation methods. For example, the rate of denitrification, amount of water soluble
carbon, total carbon and overall weight distribution of soil aggregates are different when
assessed using dry-sieving compared to wet-sieving procedures (Beauchamp and Seech,
1990; Puget et al., 1995; Angers and Giroux, 1996). As a result, some have suggested
that the links between aggregate size and various soil properties and biological processes
are merely an artifact of the soil fractionation procedure and not related to intrinsic
properties specific to an aggregate size fraction (Ashman, et al., 2003).
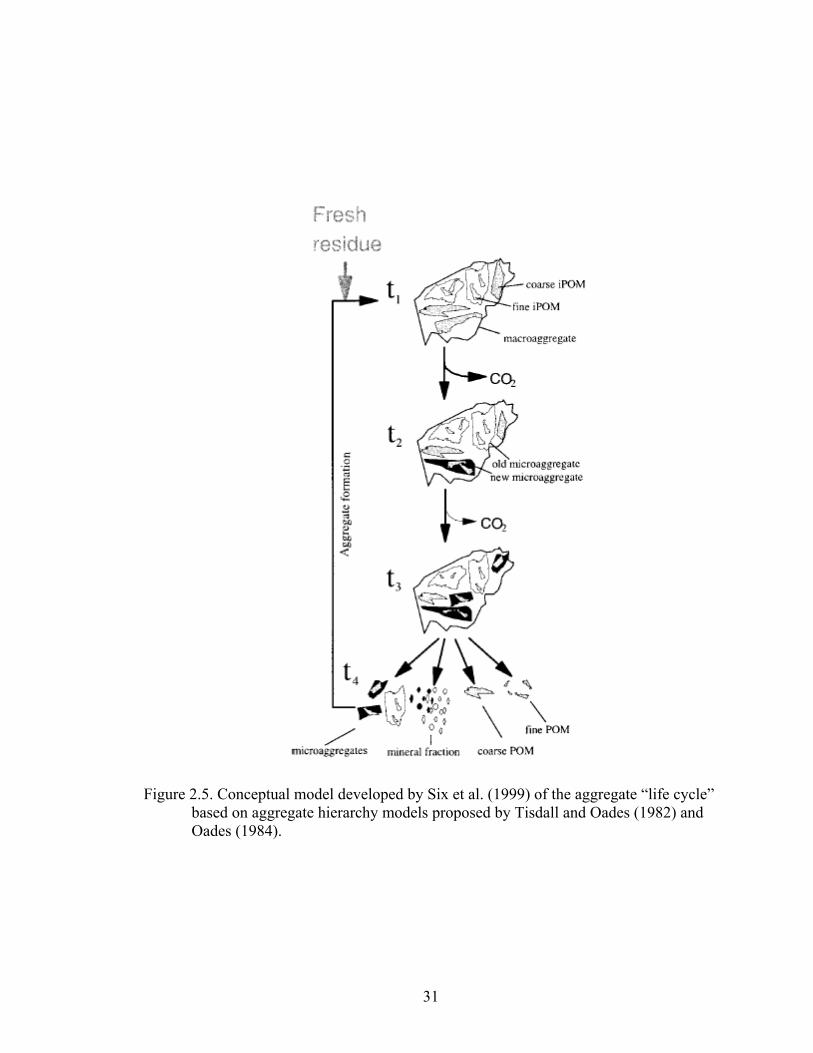
31
Figure 2.5. Conceptual model developed by Six et al. (1999) of the aggregate “life cycle” based on aggregate hierarchy models proposed by Tisdall and Oades (1982) and Oades (1984).
32
Typically, the methods used to fractionate soil try to simulate disruptive events
that could occur in the field (Young and Ritz, 2000). Wet-sieving is one of the more
common fractionation methods which involves the rapid wetting of air-dry samples in
water and is supposed to simulate conditions of severe water stress (Nimmo and Perkins,
2002), and thus provide information about the water-stable aggregates and their
associated properties/processes. However, there is considerable interest in the
characterization of soil aggregates, regardless of stability, to better understand processes
related to soil organic matter dynamics (Bossuyt et al., 2005), biological soil processes
(Stemmer et. al., 1998; Mummey et al., 2002), and the fate of organic contaminants
(Krauss and Wilcke, 2002; DeSutter et. al., 2003). For example, studies on polycyclic
aromatic hydrocarbons (PAHs) have shown that the percentage of small molecular
weight PAHs (2-3 ring structures) decreased with a decrease in aggregate size fraction
(Muller et al., 2000; Krauss and Wilcke, 2002). This indicates that the degradation
and/or volatilization of less persistent and more volatile PAHs occurred in larger sized
aggregates. Additionally the lack of degradation and/or volatilization of small molecular
weight PAHs in small aggregate size fractions were due to the inaccessibility to PAH
degrading bacteria or greater retention reducing volatilization (Muller et al., 2000).
Additional studies examining the fate of atrazine, polychlorinated biphenyls (PCBs) and
PAHs have shown that the sorption and accessibility of contaminant degrading bacteria to
the contaminant are dependent on the aggregate size (Muller et al., 2000; Amellal et al.,
2001a; Amellal et al., 2001b; DeSutter et al., 2003).
One of the more common concerns surrounding research on these processes is
whether wet-sieving methods may create their own artifacts that may misrepresent the
33
microbial community or the chemical properties of an aggregate fraction (Amato and
Ladd, 1980; Ahmed and Oades, 1984; Miller and Dick, 1995). In contrast, dry sieving
methods may provide a suitable alternative to overcoming the potential artifacts
associated with wet-sieving. There is however limited information on how wet-sieving
compares to dry sieving methods for the separation and collection of soil aggregates.
Additionally, there is no information on how these methods might influence the apparent
distribution of soil properties and their associated microbial communities
2.3 Effect of earthworms on soil properties and fate of contaminants
Earthworms historically are known to play a significant role in the ecological
function of soil (Lee, 1985; Coleman et al., 2004). The ingestion and egestion of soil is
perhaps one of the most important activities associated with earthworms. Through the
production of earthworm casts and mucus excreted on the walls of burrows, earthworms
contribute to the cycling of nutrients, formation of soil micro- and macroaggregates, and
incorporation of organic materials into soil aggregates (Lee and Foster, 1991; Martin and
Marinissen, 1993; Edwards and Bohlen, 1996; Six et al., 2004; Bossuyt et al., 2005). For
example, research has shown that the incorporation of organic residues on the soil surface
(i.e. alfalfa, plant material) into the soil via earthworm activity increases the carbon
content and leads to the formation of stable soil aggregates (Zhang and Hendrix, 1995;
Haynes and Fraser, 1998; Bossuyt et al., 2004; Pulleman et al., 2005). This in turn can
have a significant impact on physical and biological soil properties such as water
retention, solute transport, and microbial activity and biomass (Lee, 1985).
34
Interestingly, earthworms are known to selectively consume soil particles and
organic materials of a specific size (Piearce, 1978; Lowe and Butt, 2004). Specifically,
the size of particles they ingest is directly correlated to their body size (Piearce, 1978).
During the ingestion of soil material by earthworms, the microaggregates are destroyed
when chemical bonds between soil particles are broken (Barois et al., 1993). However,
new aggregates are formed and the resulting earthworm cast contains a mixture of new
and humified organic substances which promotes formation and strengthening of soil
aggregates, and briefly stimulates microbial activity and biomass (Shipitalo and Protz,
1989; Lavelle et al., 1989; Zhang and Schrader, 1993; Brown et al., 2000). The
earthworm casts, in a sense, can be compared to the formation of the aggregate nucleus in
the aggregate hierarchy models proposed by Tisdall and Oades (1982) and Oades (1984)
and discussed previously. However, the type and extent of bonding that occurs between
mineral and organic materials during ingestion or after excretion in earthworm casts
greatly depends on the properties of the ingested organic debris and chemical properties
of the soil materials (Shipitalo and Protz, 1989).
Earthworms can be divided up into three distinct classes; epigeic, anecic, and
endogeic species, with each having distinctive impacts on soil aggregates and properties
(Edwards and Bohlen, 1996). Epigeic earthworms work the soil litter and contribute very
little to soil aggregation and mixing of soil components within the soil. Their casts are
often very unstable and don’t contribute to the formation of aggregates on the soil
surface. Anecic earthworms are mixers who take surface litter and bring it down into
their burrows and galleries and incorporate the organic material deeper into the soil
allowing for better turnover and decomposition by other soil organisms and fauna (Lee,
35
1985). They build deep vertical burrows and will consume a mixture of soil and surface
litter. Endogeic species are earthworms which feed on the soil and organic matter within
the soil. While they do sometimes consume litter material their main function and niche
is within the subsoil horizons. More often than not they leave their casts within their
burrows which can be quite extensive. They are also known to break down the casts and
materials other earthworms have left behind (Edwards and Bohlen, 1996), which can alter
the resource availability to other microorganisms and fauna (Jones et al., 1994; Lavelle et
al., 1997; Lavelle et al., 1998).
Based on the previous discussion, it is reasonable to assume that earthworm
activity can contribute to the translocation, transformation and/or degradation of organic
contaminants. Possible examples include the incorporation of contaminants into
earthworm casts and microaggregates reducing its availability to contaminant specific
degrading bacteria, increasing sorption of contaminants to soil organic matter, and
stimulating the microbial community resulting in increased degradation. While there
have been a wide range of studies focusing on the toxicity of organic and inorganic
contaminants on earthworms, few studies have focused on the ability of earthworms to
alter contaminant fate (Robidoux et al., 1999; Conder and Lanno, 2000; Schaefer, 2004).
Binet et al. (2006) reported that Lumbricus terrestris and Aporrectodea caliginosa altered
the distribution of atrazine in a soil microcosm leading to greater leaching losses due to
deeper incorporation of atrazine into the microcosm. Additionally, the formation of
earthworm casts resulted in greater atrazine sorption over the long term (86 d) and thus
increased atrazine persistence. Renoux et al. (2000) reported that the earthworm Eisenia
andrei was capable of facilitating the transformation of TNT at a greater rate than a soil
36
without earthworms. Overall, there is a considerable need for research that focuses on
how soil fauna, such as earthworms can impact the fate of organic and inorganic
contaminants in the soil.
2.4 Effects of biotic and abiotic factors and contaminants on soil microbial
community structure.
Soil microorganisms play an integral part in the overall health and function of the
soil (Brady and Weil, 1999). Although there are a wide range of different species,
microorganisms rarely exist as isolated monocultures and instead coexist as part of
communities with other soil micro- and macroorganisms (Vestal and White, 1989).
Assessment and characterization of these microbial communities can help in our
understanding of processes important to the ecological function and health of soil. In the
past, microbial cultures have been a common method used to assess microbial growth,
activity, and diversity. Pure cultures are good for preliminary studies to determine the
growth and function of a specific organism under ideal conditions. Although specific
organisms can be examined, this method has major limitations as many organisms require
specific conditions for growth and as a result, < 1% of organisms are capable of being
cultured (Paul and Clark, 1996). In response to such limitations, of using selectively
enriched cultures, scientists have developed methods of assessing microbial biomass,
structure, and activity in situ to gain a more complete understanding of the ecological
function of soil microorganisms (Vestal and White, 1989). Although there are no fool-
proof methods, the recent development of lipid analysis has become a popular method to
identify microorganisms and characterize their activity and function in soil.
37
Lipids are commonly found in the cytoplasmic and outer membranes of most
microorganisms (Moat and Foster, 1995). In many cases, specific fatty acids are
common to a given taxon (Table 2.5). For example, cyclopropane and branched fatty
acids are specific to bacteria (Lechevalier, 1989). Additionally, the fatty acid 18:2ω6
makes up ≈40% of the total fatty acids of more than 45 different species of soil fungi
(Paul and Clark, 1996). Phospholipid fatty acid analysis (PLFA) has been one of the
more common methods to extract and analyze lipids. PLFA analysis is useful in
identifying the presence or absence of specific microbial communities and has been used
as a measure of microbial biomass (Zelles, 1999). It involves the use of a one phase
mixture of chloroform, methanol and water (Paul and Clark, 1996). Lipids which are
collected in the organic phase are then further fractionated into neutral, glycol-, and
phospholipids. Finally, the phospholipids undergo alkaline methanolysis to obtain fatty
acids methyl esters (FAMEs) which are then analyzed by gas chromatography (Schutter
and Dick, 2000). Recently, a simpler method to the PLFA method has been developed
where microbial cells from soil are saponified by sonication, heat, and the addition of a
strong base. After the fatty acids have been removed, they are methylated to form
FAMEs and are again analyzed using gas chromatography (Sasser, 1990). One drawback
to the FAME method is that it may extract fatty acids from sources other than living
organisms, such as humic substances and plant tissue (Schutter and Dick, 2000). As a
result, the FAME analysis can not be used as a measure of microbial biomass to the same
extent that the PLFA method is.
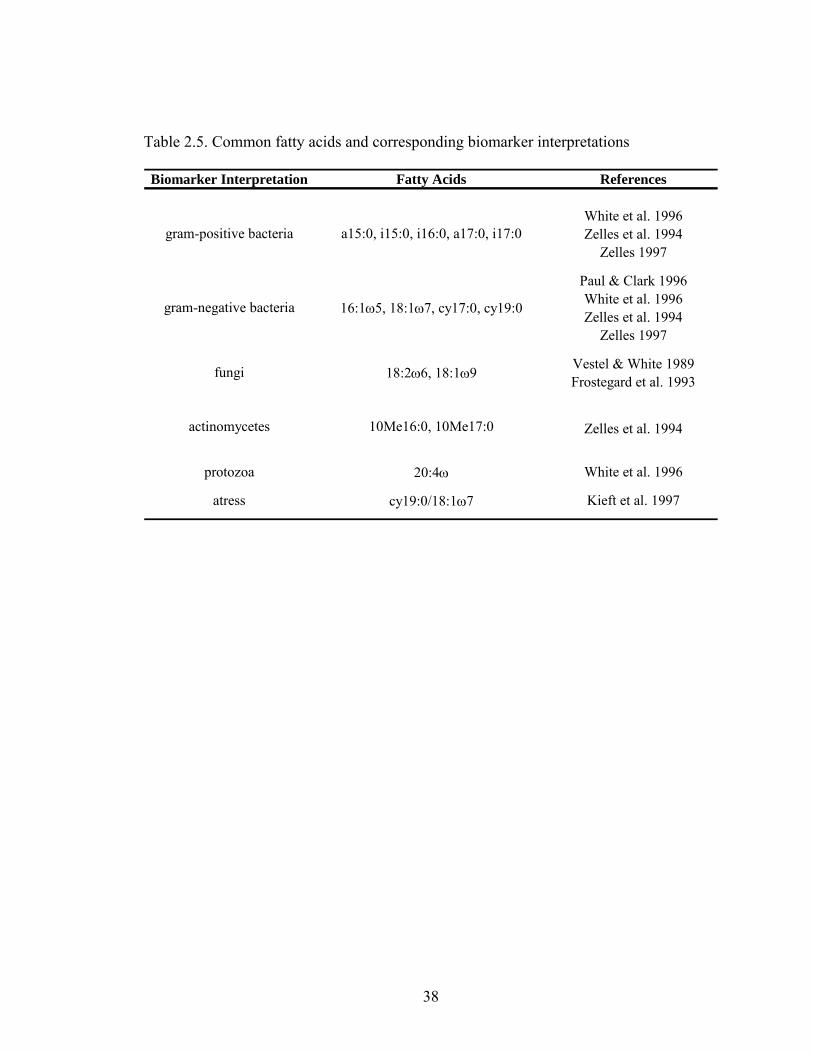
38
Table 2.5. Common fatty acids and corresponding biomarker interpretations
Biomarker Interpretation Fatty Acids References
White et al. 1996 Zelles et al. 1994
Zelles 1997
Paul & Clark 1996White et al. 1996Zelles et al. 1994
Zelles 1997
Vestel & White 1989Frostegard et al. 1993
Zelles et al. 1994
protozoa 20:4ω White et al. 1996
atress cy19:0/18:1ω7 Kieft et al. 1997
fungi 18:2ω6, 18:1ω9
actinomycetes 10Me16:0, 10Me17:0
gram-positive bacteria a15:0, i15:0, i16:0, a17:0, i17:0
gram-negative bacteria 16:1ω5, 18:1ω7, cy17:0, cy19:0
39
PLFA and FAME methods have been used to study changes in the microbial
community over time due to physical, chemical, and biological perturbations. For
example, Butler et al. (2003) used PLFA analysis to characterize soil organic carbon
dynamics and flow between the rhizosphere of ryegrass and the bulk soil. The authors
reported that gram-positive and gram-negative bacteria utilized 13C-labeled rhizodeposits
during two different growing periods and that soil fungi, as indicated by high levels of
labeled C in 18:2w6, utilized carbon from the rhizosphere in both growing periods.
Olsson et al. (1999) used fatty acid analysis to characterize the bacterial populations
found in the rhizosphere of barley. Using multivariate statistics the authors found three
distinct groups of bacteria; two different gram-negative populations dominated by
Pseudomonas and Cytophaga and gram-positive bacteria as indicated by iso-branched
fatty acids. The application of dairy manure to a field under corn-clover-ryegrass crop
rotation resulted in a 15-27% increase in gram-negative bacteria biomarkers compared to
the control, further demonstrating the use PLFAs or FAMEs to assess changes in
microbial community structure and composition (Peacock et al., 2001).
Other studies have examined how anthropogenic activity can influence the
microbial community structure. Feng et al. (2003) examined the impact of conventional
and no-till practices (on soil microbial communities) in a cotton system. The authors
noted a shift in the bacterial communities over time as a result of tillage practices,
particularly when the field was in fallow or pre-planting. Petersen and Klug (1994)
examined how sampling and storage practices may alter the microbial community before
the soil is used for other research. After three weeks at elevated temperatures (25°C)
there were indications the microbial community was adapting or responding to the
40
temperature due to an increase in cyclopropyl fatty acids (cy17:0, cy19:0) which have
been used as indicators of stress.
FAME analysis has additionally been used to characterize the impact of
environmental contamination on soil bacteria, fungi, actinomycetes, and protozoa. The
contamination of a forest and arable soil with Cd, Cu, Ni, Pb, or Zn resulted in a decrease
in iso-branched fatty acids indicative of gram-positive bacteria and an increase in cy17:0,
an indicator for stress (Frostegard et al., 1993). Additionally, metal contamination in the
arable soil resulted in a decrease in 10Me16:0 and 10Me18:0 (indicators of
actinomycetes), however, in the forest soil there was an increase in these same indicators.
This suggests that the actinomycetes were perhaps more tolerable of metal contamination
in the forest soil then they were in the arable soil. Gentry et al. (2003) reported an
increase in a fatty acid characteristic of protozoa in a soil contaminated with pyrene. The
analysis of two different surface mine reclamation sites indicated a significant decrease in
FAME biomarkers indicative of fungi and bacteria compared to an undisturbed site
(Mummey et al., 2002). The effect of three earthworm species (Lumbricus terrestris,
Allolobophora chlorotica, and Eisenia fetida) on the microbial community structure of
oil-contaminated soil revealed a stimulation in 20:4ω6, an indicator of protozoa, and an
increase in the fungal:bacterial ratios (Schaefer et al., 2005). Finally, FAME/PLFA
analysis has been used to asses the impact of TNT contamination and remediation on the
microbial community. Research has shown that gram-positive bacteria, fungi, and
actinomycetes tend to decrease with an increase in TNT contamination (Fuller and
Manning, 1998; Wilke et al., 2004). However, the use of molasses addition and
humification as bioremediation practices resulted in an increase in microbial biomass,
41
recovery of the gram-positive bacteria population, and overall the microbial community
was altered to a greater degree than contaminated soil (Fuller and Manning, 2004; Wilke
et al., 2004).
Overall, lipid extraction followed by PLFA/FAME analysis has significant
promise as a tool to monitor and characterize changes in microbial community structure,
activity, and biomass as a result of natural or anthropogenic events.
42
2.5 Objectives
The findings of the research presented in this dissertation address four main objectives:
1. Characterize the impact of wet- and dry-sieving procedures on physical, chemical, and
biological properties which may influence the evaluation of chemical and
biological processes in soil and soil aggregates (i.e. contaminant fate, sorption,
transformation, microbial activity).
2. Investigate the ability of clay minerals and humic substances to sorb TNT and
determine to what extent humic-clay complexes may affect the sorption of TNT in
soil systems.
3. Investigate the potential of earthworms to facilitate the transformation and distribution
of TNT in soil and within soil aggregates.
4. Characterize the impact of earthworms and TNT, both individually and together, on the
soil microbial community structure.
43
References
Achtnich, C., U. Sieglen, H.-J. Knackmuss, and H. Lenke. 1999. Irreversible binding of biologically reduced 2,4,6-trinitrotoluene to soil. Environ. Toxicol. Chem. 18: 2416-2423.
Adriano, D.C. 2003. Biogeochemical processes and abiotic factors controlling
bioavailability. Abstract. 2nd International Workshop on Bioavailability of Soil Pollutant and Risk Assessment, Monte Verita Ascona, Switzerland, February 2-7, 2003.
Agrawal, A. and P.G. Tratnyek. 1996. Reduction of nitro aromatic compounds by zero- valent iron metal. 30: 153-160.
Ahmed, M., and J.M. Oades. 1984. Distribution of organic matter and adenosine
triphosphate after fractionation of soils by physical procedures. Soil Bio. Biochem. 16: 465-470.
Amato, M., and J.N. Ladd. 1980. Studies of nitrogen mineralization and immobilization in calcareous soil. V. Formation and distribution of isotope-labeled biomass during decomposition of 14C and 15N-labelled plant material. Soil Bio. Biochem. 12: 405-411.
Amellal, N., J.-M. Portal, and J. Berthelin. 2001a. Effect of soil structure on the bioavailability of polycyclic aromatic hydrocarbons within aggregates of a contaminated soil. Appl. Geochem. 16: 1611-1619.
Amellal, N., J.-M. Portal, T. Vogel, and J. Berthelin. 2001b. Distribution and location of polycyclic aromatic hydrocarbons (PAHs) and PAH-degrading bacteria within polluted soil aggregates. Biodeg. 12: 49-57.
Angers, D.A., and M. Giroux. 1996. Recently deposited organic matter in soil water- stable aggregates. Soil Sci. Soc. Am. J. 60: 1547-1551.
Ashman, M.R., P.D. Hallett. and P.C. Brookes. 2003. Are the links between soil aggregate size class, soil organic matter and respiration rate artifacts of the fractionation procedure? Soil Biol. Biochem. 35: 435-444.
ATSDR. 1995. Toxicological profile for 2,4,6-trinitrotoluene (TNT) [Online]. http://www.atsdr.cdc.gov/toxprofiles/tp81.html Atlanta, GA: U.S. Department of Health and Human Services, Public Health Service.
ATSDR. 2005. 2005 CERCLA priority list of hazardous substances that will be the subject of toxicological profiles and support document [Online]. http://www.atsdr.cdc.gov/cercla/supportdocs/text.pdf, (accessed 15 June, 2006).
44
Atlanta, GA: U.S. Department of Health and Human Services, Public Health Service.
Barois, I., G. Villemin, and P. Lavelle. 1993. Transformation of the soil structure through Pontoscolex corethrurus (Oligochaeta) intestinal tract. Geoderma, 56: 57-66.
Bayman, P., and G.V. Radkar. 1997. Transformation and tolerance of TNT (2,4,6- trinitrotoluene) by fungi. Int. Biodeter. Biodegr. 39: 45-53.
Beauchamp, E.G., and A.G. Seech. 1990. Denitrification with different sizes of soil aggregates obtained from dry-sieving and from sieving with water. Biol. Fert. Soil 10: 188-193.
Belden, J.B., D.R. Ownby, G.R. Lotufo, M.J. Lydy. 2005. Accumulation of trinitrotoluene (TNT) in aquatic organisms: Part 2 – Bioconcentration in aquatic invertebrates and potential for trophic transfer to channel catfish (Ictalurus punctatus). Chemosphere 58: 1161-1168.
Binet, F., A. Kersante, C. Munier-Lamy, R.-C. Le Bayon, M.-J. Belgy, and M.J. Shipitalo. 2006. Lumbricid macrofauna alter atrazine mineralization and sorption in a silt loam soil. Soil Bio. Biochem. 38: 1255-1263.
Boopathy, R. 1994. Transformation of nitroaromatic compounds by a methanogenic
bacterium, methanoccoccus SP (strain-B). Arch. Microbial. 162: 167-172.
Boopathy, R., J.F. Manning, C. Montemagno, and C.F. Kulpa. 1994. Metabolism of 2,4,6-trinitrotoluene by a Pseudomonas consortium under aerobic conditions. Curr. Microbiol. 28: 131-137.
Boopathy, R. 2000. Bioremediation of explosives contaminated soil. Int. Biodeter.
Biodegr. 46: 29-36.
Boopathy, R., and C.F. Kulpa. 1994. Biotransformation of 2,4,6-trinitrotoluene (TNT) by a Methanococcus sp. (strain B) isolated from a lake sediment. Can. J. Microbiol. 40: 273-278.
Bossuyt, H., J. Six, and P.F. Hendrix. 2004. Rapid incorporation of carbon from fresh residues into newly formed stable microaggregates within earthworm casts. Eur. J. Soil Sci. 55: 393-399.
Bossuyt, H., J. Six, and P.F. Hendrix. 2005. Protection of soil carbon by microaggregates within earthworm casts. Soil Bio. Biochem. 37: 251-258.
Boyd, S.A., G. Sheng, B.J. Teppen, and C.T. Johnston. 2001. Mechanisms for the adsorption of substituted nitrobenzenes by smectite clays. Environ. Sci. Technol. 35: 4227-4234.
45
Brady, N.C., and R.R. Weil. 1999. The nature and properties of soils. 12th Ed. Prentice-
Hall, New Jersey.
Brannon, J.M., C.B. Price, and C. Hayes. 1998. Abiotic transformation of TNT in montmorillonite and soil suspensions under reducing conditions. Chemosphere 36:1453-1462.
Brown, G.G., I Barois, and P. Lavelle. 2000. Regulation of soil organic matter dynamics
and microbial activity in the drilosphere and the role of interactions with other edaphic functional domains. Eur. J. Soil Biol. 36: 177-198.
Bruhn, C., H. Lenke, and J.J. Knackmuss. 1987. Nitrosubstituted aromatic compounds as nitrogen sources for bacteria. Appl. Environ. Microbiol. 53:208-210.
Bruns-Nagel, D., J. Bretung, E. von Low, K. Steinbach, T. Borontzy, M. Kahl, K.-H.
Blotevogel, and D. Gemsa. 1996. Microbial transformation of 2,4,6-trinitrotoluene in aerobic soil columns. Appl. Environ. Microbiol. 62: 2651-2662.
Butler, J.L., M.A. Williams, P.J. Bottomley, and D.D. Myrold. 2003. Microbial community dynamics associated with rhizosphere carbon flow. Appl. Environ. Microbiol. 69: 6793-6800.
Coleman D.C., Crossley D.A., and P.F. Hendrix. 2004. Fundamentals of soil ecology. 2nd ed. Elsevier, New York.
Comfort, S.D., P.J. Shea, L.S. Hundal, Z. Li, B.L. Woodbury, J.L. Martin, and W.L. Powers. 1995. TNT transport and fate in contaminated soil. J. Environ. Qual. 24:1174-1182.
Conder, J.M., and R.P. Lanno. 2000. Evaluation of surrogate measures of cadmium, lead, and zinc bioavailability to Eisenia fetida. Chemosphere 41: 1659-1668.
Daun, G., H. Lenke, M. Reuss, and H.-J. Knackmuss. 1998. Biological treatment of TNT- contaminated soil. 1. Anaerobic cometabolic reduction and interaction of TNT and metabolites with soil components. Environ. Sci. Technol. 32: 1956-1963.
DeSutter, T.M., S.A. Clay, and D.E. Clay. 2003. Atrazine sorption and desorption as affected by aggregate size, particle size, and soil type. Weed Sci. 51: 456-462.
Dexter, A.R., 1988. Advances in characterization of soil structure. Soil Till. Res. 11: 199-238.
Dilley, J.V., C.A. Tyson, R.J. Spanggord, D.P. Sasmore, G.W. Newell, and J.C. Dacre. 1982. Short-term oral toxicity of 2,4,6-trinitrotoluene in mice, rats, and dogs. J. Toxicol. Environ. Health 9: 565-585.
46
Dodard, S.G., A.Y. Renoux, J. Powlowski, and G.I. Sunahara. 2003. Lethal and
subchronic effects of 2,4,6-trinitrotoluene (TNT) on Enchytraeus albidus in amended artificial soil. Ecotoxicol. Environ. Saf. 54:131-138.
Ederer, M.M., T.A. Lewis, and R.L. Crawford. 1997. 2,4,6-Trinitrotoluene (TNT) transformation by Clostridia isolated from a munition-fed bioreactor: Comparison with non-adapted bacteria. J. Ind. Microbiol. Biotechnol. 18:82-88.
Edwards, C.A., and P.J. Bohlen. 1996. Biology and ecology of earthworms. Chapman and Hall, London.
Elovitz, M.S., and E.J. Weber. 1999. Sediment-mediated reduction of 2,4,6- trinitrotoluene and fate of the resulting aromatic (poly)amines. Environ. Sci. Technol. 33: 2617-2625.
Eriksson, J., and U. Skyllberg. 2001. Binding of 2,4,6-trinitrotoluene and its degradation products in a soil organic matter two-phase system. J. Environ. Qual. 30: 2053-2061.
Esteve-Nunez, A., A. Caballero, and J.L. Ramos. 2001. Biological degradation of 2,4,6- trinitrotoluene. Microbiol. Mol. Biol. Rev. 65: 335-352.
Feng, Y., A.C. Motta, D.W. Reeves, C.H. Burmester, E. van Santen, and J.A. Osborne. 2003. Soil microbial communities under conventional-till and no-till continuous cotton systems. Soil Biol. Biochem. 35: 1693-1703.
Fernando, T., J.A. Bumpus, and S.D. Aust. 1990. Biodegradation of TNT (2,4,6- trinitrotoluene) by Phanerochaete chrysoporium. Appl. Environ. Microbiol. 56: 1666-1671.
Frische, T. 2003. Ecotoxicological evaluation of in situ bioremediation of soils contaminated by the explosive 2,4,6-trinitrotoluene (TNT). Environ. Pollut. 121: 103-113.
Frostegard, A., A. Tunlid, and E. Baath. 1993. Phospholipid fatty acid composition, biomass, and activity of microbial communities from two soil types experimentally exposed to different heavy metals. App. Environ. Microbiol. 59: 3605-3617.
Fuller, M.E., and J.F. Manning. 1998. Evidence for differential effects of 2,4,6- trinitrotoluene and other munitions compounds on specific subpopulations of soil microbial communities. Environ. Toxicol. Chem. 17: 2185-2195.
Fuller, M.E., and J.F. Manning. 2004. Microbiological changes during bioremediation of
47
explosives-contaminated soils in laboratory and pilot-scale bioslurry reactors. Bioresource Technol. 91: 123-133.
Furedi, E.M., B.S. Levine, J.W. Sagartz, V.S. Rac, and P.M. Lish. 1984. Determination of the chronic mammalian toxicological effects of TNT: Twenty-four month chronic toxicity/carcinogenicity study of trinitrotoluene (TNT) in the Fischer-344 rat. Final report, phase III. Vol I. AD-A168 637. U.S. Army Medical Research and Development Command, Fort Detrick, MD. ITT Research Institute, Chicago, IL.
GAO 2003. Military munitions: DOD needs to develop a comprehensive approach for cleaning up contaminated sites, Report GAO-04-147, General Accountability Office, Washington, D.C.
Gentry, T.J., D.C. Wolf, C.M. Reynolds, and J.J. Fuhrmann. 2003. Pyrene and phenanthrene influence on soil microbial populations. Biorem. J. 7: 53-68.
Gong, P., S.D. Sicilliano, C.W. Greer, L. Paquet, J. Hawari, and G.I. Sunahara. 1999a. Effects and bioavailability of 2,4,6-trinitrotoluene in spiked and field-contaminated soils to indigenous microorganisms. Environ. Toxicol. Chem. 18: 2681-2688.
Gong, P., B.-M. Wilke, and S. Fleischmann. 1999b. Soil-based phytotoxicity of 2,4,6- trinitrotoluene (TNT) to terrestrial higher plants. Arch. Environ. Contam. Toxicol. 36:152-157.
Haderlein, S.B. and R.P. Schwarzenbach. 1995. Environmental processes influencing the rate of abiotic reduction of nitroaromatic compounds in the subsurface. p. 199-225 In Biodegradation of nitroaromatic compounds. J.C. Spain (ed.)., Plenum Press, New York.
Hawari, J., A. Halasz, L. Paquet, E. Zhou, B. Spencer, G. Ampleman, and S. Thiboutot.
1998. Characterization of metabolites in the biotransformation of 2,4,6-trinitrotoluene with anaerobic sludge: Role of triaminotoluene. Appl. Environ. Micro. 64:2200-2206.
Hawari, J., S. Beaudet, A. Halasz, S. Thiboutot, and G. Ampleman. 2000. Microbial degradation of explosives: Biotransformation versus mineralization. Appl. Microbiol. Biotechnol. 54: 605-618.
Haynes, R.J., and P.M. Fraser. 1998. A comparison of aggregate stability and biological activity in earthworm casts and uningested soil as affected by amendment with wheat or Lucerne straw. Eur. J. Soil. Sci. 49: 629-636.
Hundal, L.S., J. Singh, E.L. Bier, P.J. Shea, S.D. Comfort, and W.L. Powers. 1997.
48
Removal of TNT and RDX from water and soil using iron metal. Environ. Pollut. 97: 55-64.
Johnston, C.T., M.F.D. Oliveira, B.J. Teppen, G. Sheng, and S.A. Boyd. 2001.
Spectroscopic study of nitroaromatic-smectite sorption mechanisms. Environ. Sci. Technol. 35: 4767-4772.
Johnston, C.T., S.A. Boyd, B.J. Teppen, and G. Sheng. 2004. Sorption of nitroaromatic compounds on clay surfaces. p. 155-189. In Handbook of layered materials for catalytic applications. S.M. Auerbach, K.A. Carrado, P.K. Dutta (eds)., Marcel-Dekker, New York.
Jones, C.G., J.H. Lawton, and M. Shachak. 1994. Organisms as ecosystem engineers. Oikos, 69: 373-386.
Kay, B.D., 1990. Rates of change of soil structure under different cropping systems. Adv. Soil Sci. 12: 1-52.
Keum Y-S., and Q.X. Li. 2004. Reduction of nitroaromatic pesticides with zero-valent iron. Chemosphere. 54: 255-263.
Kieft, T.L., E. Wilch, K. O’Connor, D.B. Ringleberg, and D.C. White. 1997. Survival
and phospholipid fatty acid profiles of surface and subsurface bacteria in natural sediment microcosms. App. Environ. Microbiol. 63: 1531-1542.
Klausen, J., S.P. Trober, S.B. Haderlein, and R.P. Schwarzenbach. 1995. Reduction of substituted nitrobenzenes by Fe(II) in aqueous mineral suspensions. Environ. Sci. Technol. 29: 2396-2404.
Krauss, M., and W. Wilcke. 2002. Sorption strength of persistent organic pollutants in
particle-size fractions of urban soils. Soil Sci. Soc. Am. J. 66: 430-437.
Lachance, B., A.Y. Renoux, M. Sarrazin, J. Hawari, and G.I. Sunahara. 2004. Toxicity and bioaccumulation of reduced TNT metabolites in the earthworm Eisenia Andrei exposed to amended forest soil. Chemosphere 55: 1339-1348.
Lavelle, P., R. Schaefer, and Z. Zaidi. 1989. Soil ingestion and growth in Millsonia anomala, a tropical earthworm, as influenced by the quality of the organic matter ingested. Pedobiologia, 33: 379-388.
Lavelle, P., D. Bignell, M. Lepage, V. Wolters, P. Roger, P. Ineson, O.W. Heal, and S. Dhillion. 1997. Soil function in a changing world: The role of invertebrate ecosystem engineers. Eur J. Soil Biol. 33: 159-193.
Lavelle, P., B. Pashani, F. Charpentier, C. Gilot, J.P. Rossi, L.Derouard, J. Andre, J.P.
49
Ponge, and N. Bernier. 1998. Large-scale effects of earthworms on soil organic matter and nutrient dynamics. p. 103-122. In Earthworm ecology. Edwards, C.A. (ed) St. Lucie Press, Boca Raton, FL.
Lechevalier, M.P. 1989. Lipids in bacterial taxonomy. p. 455-560. In W.M. O’Leary (ed) Microbial lipids. Vol 1. Academic Press, London.
Lee, K.E., 1985. Earthworms: Their ecology and relationships with soils and land use. Academic Press. Sydney.
Lee, K.E., and R.C. Foster. 1991. Soil fauna and soil structure. Aust. J. Soil. Res. 29: 745-776.
Levine, B.S., E.M. Furedi, D.E. Gordon, P.M. Lish, and J.J. Barkley. 1984. Subchronic toxicity of trinitrotoluene in Fischer-344 rats. Toxicol. 32: 253-265.
Levine, B.S., J.H. Rust, J.J. Barkley, E.M. Furedi, and P.M. Lish. 1990. Six month oral toxicity study of trinitrotoluene in beagle dogs. Toxicol. 63: 233-244.
Lewis, T.A., S. Goszczynski, R.L. Crawford, R.A. Korus, and W. Admassu. 1996. Products of anaerobic 2,4,6-trinitrotoluene (TNT) transformation by Clostridium bifermentans. Appl. Environ. Microbiol. 62: 4669-4674.
Lewis, T.A., D.A. Newcombe, and R.L. Crawford. 2004. Bioremediation of soils contaminated with explosives. J. Environ. Manage. 70: 291-307.
Li, A.Z., K.A. Marx, J. Walker, and D.L. Kaplan. 1997. Trinitrotoluene and metabolites binding to humic acid. Environ. Sci. Technol. 31: 584-589.
Li, Z.M., S.D. Comfort, and P.J. Shea. 1997. Destruction of 2,4,6-trinitrotoluene by fenton oxidation. J. Environ. Qual. 26: 480-487.
Li, H., G. Sheng, B.J. Teppen, C.T. Johnston, and S.A. Boyd. 2003. Sorption and
desorption of pesticides by clay minerals and humic acid-clay complexes. Soil Sci. Soc. Am. J. 67: 122-131.
Liu, D.H., R.J. Spanggord, H.C. Bailey, H.S. Javitz, and D.C.L. Jones. 1983. Toxicity of TNT wastewaters to aquatic organisms Final report. Vol. I: Acute toxicity of LAP wastewater and 2,4,6-trinitrotoluene. AD A142 144. SRI International, Menlo Park, CA.
Lowe, C.N., and K.R. Butt. 2004. Influence of food particle size on inter- and intra- specific interactions of Allolobophora chlorotica (Savigny) and Lumbricus terrestris. Pedobiologia 47: 574-577.
Martin, J.L., S.D. Comfort, P.J. Shea, T.A. Kokjohn, and R.A. Drijber. 1997. Denitration
50
of 2,4,6-trinitrotoluene by Pseudomonas savastanoi. Can. J. Microbiol. 43: 447-455.
Martin, A., and J.C.Y. Marinissen. 1993. Biological and physico-chemical processes in excrements of soil animals. Geoderma 56: 331-347.
McCormick, N.G., F.E. Feeherry, and H.S. Levinson. 1976. Microbial transformation of 2,4,6-trinitrotoluene and other nitroaromatic compounds. Appl. Environ. Micro. 31: 949-958.
Miller, M., and R.P. Dick. 1995. Dynamics of soil C and microbial biomass in whole soil and aggregates in two cropping systems. Appl. Soil Ecol. 2: 253-261.
Moat A.G., and J.W. Foster. 1995. Microbial physiology. Wiley-Liss, New York. Monrozier, L.J., J.N. Ladd, A.W. Fitzpatrick, R.C. Foster, and M. Raupach, 1991.
Components and microbial biomass content of size fractions in soils of contrasting aggregation. Geoderma 49: 37-62.
Moore, M.R. 2003. Risk assessment in environmental contamination and environmental health. p. 3-19. In. Naidu et al. (eds). Bioavailability, toxicity and risk relationships in ecosystems. Science Publishers, Enfield, NH, USA.
Muller, S., W. Wilcke, N. Kanchanakool, and W. Zech. 2000. Polycyclic aromatic hydrocarbons (PAHs) and polychlorinated biphenyls (PCBs) in particle-size separates of urban soils in Bangkok, Thailand. Soil Sci. 165: 412-419.
Mummey, D.L., P.D. Stahl, and J.S. Buyer. 2002. Microbial biomarkers as an indicator of ecosystem recovery following surface mine reclamation. Appl. Soil Ecol. 21: 251-259.
National Research Council. 2003. Bioavailability of contaminants in soils and sediments: Processes, tools and applications. National Academy Press, Washington D.C.
Nimmo, J.R., and K.S. Perkins. 2002. Aggregate stability and size distribution p. 317- 328, In J.H. Dane and G. Clarke (eds.) Methods of soil analysis. Part 4 Physical Methods. SSSA Book Ser No. 5. SSSA, Madison, WI.
Nefso, E.K., S.E. Burns, and C.J. McGrath. 2005. Degradation kinetics of TNT in the presence of six mineral surfaces and ferrous iron. J. Mazard. Mater. B123: 79-88.
Oades, J.M. 1984. Soil organic matter and structural stability: Mechanisms and
implications for management. Plant and Soil 76: 319-337.
Oades, J.M., and A.G. Waters, 1991. Aggregate hierarchy in soils. Aust. J. Soil
51
Res. 29: 815-828.
Oh, B.-T., G. Sarath, and P.J. Shea. 2001. TNT nitroreductase from a Pseudomonas aeruginosa strain isolated from TNT contaminated soil. Soil Biol. Biochem. 33: 875-881.
Olsson, S., S. Alstrom, and P. Persson. 1999. Barley rhizobacterial population characterized by fatty acid profiling. Appl. Soil Ecol. 12: 197-204.
Ownby, D.R., J.B. Belden, G.R. Lotufo, and M.J. Lydy. 2005. Accumulation of trinitrotoluene (TNT) in aquatic organisms: Part 1 – Bioconcentration and distribution in channel catfish (Ictalurus punctatus). Chemosphere 58: 1153-1159.
Pak, J.W., K.L. Knoke, D.R. Noguera, B.G. Fox, and G.H. Chambliss. 2000. Transformation of 2,4,6-trinitrotoluene by purified xenobiotic reductase B from Pseudomonas fluorescens I-C. Appl. Environ. Microbiol. 66: 4742-4750.
Paul, E.A., and F.E. Clark. 1996. Soil microbiology and biochemistry. 2nd ed. Academic Press, New York.
Peacock, A.D., M.D. Mullen, D.B. Ringelberg, D.D. Tyler, D.B. Hedrick, P.M. Gale, and D.C. White. 2001. Soil microbial community responses to dairy manure or ammonium nitrate applications. Soil Biol. Biochem. 33: 1011-1019.
Pelmenschikov, A., and J. Leszczynski. 1999. Adsorption of 1,3,5-trinitrobenzene on the siloxane sites of clay minerals: Ab initio calculations of molecular models. J. Phys. Chem. B. 103: 6886-6890.
Pennington, J.C., and W.H. Patrick. 1990. Adsorption and desorption of 2,4,6- trinitrotoluene by soils. J. Environ. Qual. 19: 559-567.
Pennington, J.C., C.A. Hayes, K.F. Myers, M. Ochman, D. Gunnison, D.R. Felt, and E. F. McCormick. 1995. Fate of 2,4,6-trinitrotoluene in a simulated compost system. Chemosphere 30: 429-438.
Pennington, J.C., and J.M. Brannon. 2002. Environmental fate of explosives. Thermochimica Acta 384: 163-172.
Petersen, S.O., and M.J. Klug. 1994. Effects of sieving, storage, and incubation temperature on the phospholipid fatty acid profile of a soil microbial community. 60: 2421-2430.
Phillips, C.T., R.T. Checkai, and R.S. Wentsel. 1993. Toxicity of selected munitions and munition-contaminated soil on earthworm (Eisenia foetida). Edgewood Research Development and Engineering Center. US Army Chemical and Biological Defense Agency, Aberdeen Proving Ground, MD., ERDEC-TR-037.
52
Piearce, T.G. 1978. Gut content of some lumbricid earthworms. Pedobiologia 18: 153-
157.
Preuss, A., and P.G. Rieger. 1995. Anaerobic transformation of 2,4,6-trinitrotoluene (TNT). Arch. Microbiol. 159: 343-353.
Puget, P., C. Chenu, and J. Balesdent. 1995. Total and young organic matter distributions in aggregates of silty cultivated soils. Eur. J. Soil Sci. 46: 449-459.
Pulleman, M.M., J. Six, N. van Breemen, and A.G. Jongmans. 2005. Soil organic matter distribution and microaggregate characteristics as affected by agricultural management and earthworm activity. Eur. J. Soil Sci. 56: 453-467.
Renoux, A.Y., M. Sarrazin, J. Hawari, and G.I. Sunahara. 2000. Transformation of 2,4,6- trinitrotoluene in soil in the presence of the earthworm Eisenia Andrei. Environ. Toxicol. Chem. 19: 1473-1480.
Rieger, P.G., and H.J. Knackmuss. 1995. Basic knowledge and perspectives on biodegradation of 2,4,6-trinitrotoluene and related nitroaromatic compounds in contaminated soil. p. 1-18. In Biodegradation of nitroaromatic compounds. Spain J. (ed). Plenum Press, New York.
Robidoux, P.Y., J. Hawari, S. Thiboutot, G. Ampleman, and G.I. Sunahara. 1999. Acute toxicity of 2,4,6-trinitrotoluene in earthworm (Eisenia andrei). Ecotox. Environ. Safe 44: 311-321.
Robidoux, P.Y., C. Svendsen, J. Caumartin, J. Hawari, G. Ampleman, S. Thiboutot, J.M. Weeks, and G.I. Sunahara. 2000. Chronic toxicity of energetic compounds in soil determined using the earthworm (Eisenia andrei) reproduction test. Environ. Toxicol. Chem. 19:1764-1773.
Rocheleau, S., R.G. Kuperman, M. Martel, L. Paquet, G. Bardai, S. Wong, M. Sarrazin, S. Dodard, P. Gong, J. Hawari, R.T. Checkai, and G.I. Sunahara. 2006. Phytotoxicity of nitroaromatic energetic compounds freshly amended or weathered and aged in sandy loam soil. Chemosphere 62: 545-558.
Sasser, M. 1990. Identification of bacteria by gas chromatography of cellular fatty acids. Tech. Note #101. Microbial ID, Newark, DE.
Schaefer, M. 2004. Assessing 2,4,6-trinitrotoluene (TNT)-contaminated soil using three different earthworm test methods. Ecotox. Environ. Saf. 57: 74-80.
Schaefer, M., S.O. Petterson, and J. Filser. 2005. Effects of Lumbricus terrestris, Allolobophora chlorotica and Eisenia fetida on microbial community dynamics in oil-contaminated soil. Soil Biol. Biochem. 37: 2065-2076.
53
Schafer, R., and R.K. Achazi. 1999. The toxicity of soil samples containing TNT and
other ammunition derived compounds in the enchytraeid and collembolan-biotest. Environ. Sci. Pollut. Res. 6: 213-219.
Scheibner, K., M. Hofrichter, A. Herre, J. Michels, and W. Fritsche. 1997. Screening for fungi intensively mineralizing 2,4,6-trinitrotoluene. Appl. Microbiol. Biotechnol. 47: 452-457.
Schutter, M.E., and R.P. Dick. 2000. Comparison of fatty acid methyl ester (FAME) methods for characterizing microbial communities. Soil Sci. Soc. Am. J. 64: 1659-1668.
Selim, H.M., S.K. Xue, and I.K. Iskandar. 1995. Transport of 2,4,6-trinitrotoluene and hexahydro-1,3,5-trinitro-1,3,5-triazine in soils. Soil. Sci. 160: 328-339.
Sheng, G., C.T. Johnston, B.J. Teppen, and S.A. Boyd. 2002. Adsorption of dinitrophenol herbicides from water by montmorillonites. Clays Clay Miner. 50: 25-34.
Sheremata, T.W., S. Thiboutot, G. Ampleman, L. Paquet, A. Halasz, and J. Hawari. 1999. Fate of 2,4,6-trinitrotoluene and its metabolites in natural and model soil systems. Environ. Sci. Technol. 33: 4002-4008.
Shipitalo, M.J., and R. Protz. 1989. Chemistry and micromorphology of aggregation in earthworm casts. Geoderma 45: 357-374.
Siciliano, S.D., R. Roy, and C.W. Greer. 2000. Reduction in denitrification activity in field soils exposed to long term contamination by 2,4,6-trinitrotoluene (TNT). FEMS Microbiol. Ecol. 32: 61-68.
Simini M., R.S. Wentsel, R.T. Checkai, C.T. Phillips, N.A. Chester, M.A. Major, and J.C. Amos. 1995. Evaluation of soil toxicity at Joliet Army Ammunition plant. Environ. Toxicol. Chem. 14: 623-630.
Six, J., E.T. Elliott, K. Pautsian, and J.W. Doran. 1998. Aggregation and soil organic matter accumulation in cultivated and native grassland soils. Soil Sci. Soc. Am. J. 62: 1367-1377.
Six, J., E.T. Elliott, and K. Paustian. 1999. Aggregate and soil organic matter dynamics under conventional and no-tillage systems. Soil Sci. Soc. Am. J. 63: 1350-1358.
Six, J., E.T. Elliot, and K. Paustian. 2000a. Soil macroaggregate turnover and microaggregate formation: A mechanism for C sequestration under no-tillage agriculture. Soil Biol. Biochem. 32: 2099-2103.
Six, J., H. Bossuyt, S. De Gryze, and K. Denef. 2004. A history of research on the link
54
between (micro)aggregates, soil biota, and soil organic matter dynamics. Soil Till. Res. 79:7-31.
Spiker, J.K., D.L. Crawford, and R.L. Crawford. 1992. Influence of 2,4,6-trinitrotoluene (TNT) concentration on the degradation of TNT in explosive-contaminated soils by the white rot fungus Phanerochaete chrysosporium. Appl. Environ. Microbiol. 58: 3199-3202.
Stahl, J.D., and S.D. Aust. 1993. Metabolism and detoxification of TNT by Phanerochaete chrysosporium. Biochem. Biophys. Res. Commun. 192: 477-482.
Steevens, J.A., B.M. Duke, G.R. Lotufo, and T.S. Bridges. 2002. Toxicity of the explosives 2,4,6-trinitrotoluene, hexahydro-1,3,5-trinitro-1,3,5-triazine, and octahydro-1,3,5,7-tetranitro-1,3,5,7-tetrazocine in sediments to Chironomus tentans and Hyalella azteca: Low-dose hormesis and high-dose mortality. Environ. Toxicol. Chem. 21:1475-1482.
Stemmer, M., M.H. Gerzabek, and E. Kandeler. 1998. Organic matter and enzyme activity in particle-size fractions of soils obtained after low-energy sonication. Soil Biol. Biochem. 30: 9-17.
Tisdall, J.M., and J.M. Oades, 1982. Organic matter and water-stable aggregates in soils. J. Soil Sci. 62: 141-163.
van Oss, C.J., and R.F. Giese. 1995. The hydrophilicity and hydrophobicity of clay minerals. Clays Clay Miner. 43:474-477.
Vasilyeva, G.K., B.-T. Oh, P.J. Shea, R.A. Drijber, V.D. Kreslavski, R. Minard, and J.- M. Bollag. 2000. Aerobic TNT reduction via 2-hydroxylamino-4,6-dinitrotoluene by Pseudomonas aeruginosa strain MX isolated from munitions-contaminated soil. Bioremed. J. 4:111-124.
Vestal, J.R., and D.C. White. 1989. Lipid analysis in microbial ecology: Quantitative approaches to the study of microbial communities. Biosci. 39: 535-541.
Vorbeck, C., H. Lenke, P. Fischer, and H.-J. Knackmuss. 1994. Identification of a hydride-Meisenheimer complex as a metabolite of 2,4,6-trinitrotoluene by a Mycobacterium strain. J. Bacteriol. 176: 932-934.
Vorbeck, C., H. Lenke, P. Fischer, J.C. Spain, and H.-J. Knackmuss. 1998. Initial reductive reactions in aerobic microbial metabolism of 2,4,6-trinitrotoluene. Appl. Environ. Microbiol. 64: 246-252.
Wang, C., D.Y. Lyon, J.B. Hughes, and G.N. Bennett. 2003. Role of hydroxylamine intermediates in the phytotransformation of 2,4,6-trinitrotoluene by Myriophyllum aquaticum. Environ. Sci. Technol. 37:3595-3600.
55
Weissmahr, K.W., S.B. Haderlein, and R.P. Schwarzenbach. 1997. In situ spectroscopic
investigations of adsorption mechanisms of nitroaromatic compounds on clay minerals. Environ. Sci. Technol. 31: 240-247.
Weissmahr, K.W., M. Hildenbrand, R.P. Schwarzenbach, and S.B. Haderlein. 1999. Laboratory and field scale evaluation of geochemical controls on groundwater transport of nitroaromatic ammunition residues. Environ. Sci. Technol. 33:2593-2600.
White, D.C., J.O. Stair, and D.B. Ringelberg. 1996. Quantitative comparisons of in situ microbial biodiversity by signature biomarker analysis. J. Indus. Microbiol. 17: 185-196.
Wilke B.-M., A. Gattinger, E. Frohlich. L. Zelles, and P. Gong. 2004. Phospholipid fatty acid composition of a 2,4,6-trinitrotoluene contaminated soil and an uncontaminated soil as affected by a humification remediation process. Soil Bio. Biochem 36: 725-729.
Won, W.D., L.H. DiSalvo, and J. Ng. 1976. Toxicity and mutagenicity of 2,4,6- trinitrotoluene and its microbial metabolites. Appl. Environ. Microbiol. 31: 576-580.
Xue, S.K., I.K. Iskandar, and H.M. Selim. 1995. Adsorption-desorption of 2,4,6- trinitrotoluene and hexahidro-1,3,5-trinitro-1,3,5-triazine in soils. Soil Sci. 160: 317-327.
Yinon, J. 1990. Toxicity and metabolism of explosives. CRC Press, Boca Raton, FL. Young, I.M., and K. Ritz. 2000. Tillage, habitat space and function of soil microbes. Soil
Till Res 53, 201-213.
Zelles, L., Q.Y. Bai, R.X. Ma, R. Rackwitz, K. Winter, and F. Beese. 1994. Microbial biomass, metabolic activity, and nutritional status determined from fatty acid patterns and poly-hydroxybutyrate in agriculturally-managed soils. Soil Biol. Biochem. 26: 439-446.
Zelles, L. 1997. Phospholipid fatty acid profiles in selected members of soil microbial communities. Chemosphere. 35:275-294.
Zelles, L. 1999. Fatty acid patterns of phospholipids and lipopolysaccharides in the characterization of microbial communities in soil: A review. Biol. Fertil. Soil 29: 111-129.
Zhang, Q.L., and P.F. Hendrix. 1995. Earthworm (Lumbricus rubellus and Aporrectodea caliginosa) effects on carbon flux in soil. Soil Sci. Soc. Am. J. 59:816-823.

56
Zhang, H., and S. Schrader. 1993. Earthworm effects on selected physical and chemical
properties of soil aggregates. Biol. Fert. Soils 15: 229-234.
57
CHAPTER 3
INTERACTION OF 2,4,6-TRINITROTOLUENE WITH HUMIC ACID, CLAY
MINERALS, AND HUMIC-CLAY COMPLEXES
Pillar, G.D., and K. Xia. To be submitted to Environmental Science and Technology
58
Abstract
Clay minerals have typically been considered as the dominant sorbent for
nitroaromatic compounds (NACs) such as 2,4,6-trinitrotoluene (TNT) in natural systems.
However, it is well known that interactions between soil organic matter and clay minerals
can alter the sorption characteristics of some organic chemicals. To determine how soil
organic matter influences the sorptive properties of clay minerals for TNT, we measured
the sorption and desorption of TNT to humic acid, four different K+- and Ca2+-saturated
reference clay minerals, and their humic-clay complexes. In addition, we examined how
the fractionation of humic acid adsorbed to clay minerals may affect TNT sorption. It
was found that clay minerals and humic-clay complexes, saturated with K+ were more
effective sorbents than those saturated with Ca2+. Low-charge smectites (SWy and
SHCa) had a greater affinity for TNT compared to high-charge smectites (SAz) and 1:1
clay minerals such as kaolinite. Significant sorption of TNT to humic acid was observed,
however, this sorption was negatively correlated with HA concentration. Humic-acid
resulted in greater adsorption of TNT to the humic-clay surface for K+-HA-SWy
compared to K-SWy. However, XRD analysis showed similar levels of interlayer
sorption of TNT (≈12.0 Å) with or without humic acid, indicating a possible increase in
TNT sorbed to the humic-clay surface. The sequential complexation of humic acid to K-
SWy indicated fractionation of the humic acid based on size and a decrease in TNT
sorption with increasing number of complexation steps. In addition, XRD analysis
indicated possible intercalation of humic material during the second, third, and fourth
sequential complexation steps. The results of this study demonstrate the significant
effects of natural organic matter on TNT sorption to clay minerals.
59
1. Introduction
Nitroaromatic compounds (NACs) such as 2,4,6-trinitrotoluene (TNT) historically
are common explosive compounds used in military munitions (Achtnich et al., 1999;
Jerger and Woodhull, 2000; Spain, 2000). Recently, the environmental fate of TNT has
become a serious concern because of its widespread existence in soils of former
ammunition plants and has been shown to be toxic to a variety of organisms, plants,
mammals and humans (Levine et al., 1984; Fuller and Manning, 1998; Robidoux et al.,
1999; Steevens et al., 2002; Rocheleau et al. 2006). A recent report by the General
Accountability Office indicated that 2,307 sites consisting of over 6 million hectares of
land in the U.S. are known to be or are suspected of being contaminated with
nitroaromatic explosives (GAO, 2003).
When exposed to the soil, studies have shown that transformation and adsorption
rather than mineralization are the significant mechanisms governing the environmental
fate of TNT as well as other NACs (Xue et al., 1995; Hundal et al., 1997; Pennington and
Brannon, 2002). TNT is moderately polar. Polar to semi-polar compounds in aqueous
solution generally have a strong tendency to be sorbed by clay minerals rather then
organic matter (Koskinen and Harper, 1990). Numerous studies have shown that NACs
are strongly adsorbed by clay minerals, particularly 2:1 minerals such as smectite
(Haderlein et al., 1996; Weissmahr et al., 1998; Boyd et al., 2001; Johnston et al., 2001).
Those studies have proposed several possible mechanisms for TNT sorption to clay
minerals. Haderlein et al. (1996) and Weissmahr et al. (1998) proposed an electron
donor-acceptor (EDA) mechanism suggesting that TNT binds to clay minerals as a co-
planar molecule. The presence of electron-withdrawing nitro groups allows the electron-
60
deficient π-system to accept electrons from siloxane surfaces of clay minerals that have a
negative charge due to isomorphic substitution. The ability of TNT to form EDA
complexes with the siloxane surface depends on the ability of TNT to replace hydrated
and bound cations from mineral surfaces. It was noted that this phenomena is only likely
to occur when weakly hydrated exchangeable cations such as K+ or NH4+ are present
compared to strongly hydrated cations such as Ca2+ or Mg2+. It was also noted that TNT
sorption via EDA complexes was both reversible and not as favorable in the interlamellar
region of 2:1 expandable clay minerals. This would suggest that TNT sorption would be
more likely to occur on the external surface rather than the interlamellar region of clay
minerals. However, research has shown that sorption of nitroaromatic pesticides such as
4,6-dinitro-o-cresol resulted in the intercalation of clay minerals and that the interlayer
region provided a significant portion of the available binding sites (Li et al., 2003). In
addition, some studies have noted non-reversible sorption of TNT and other NACs (i.e.
hysteresis) to soil components (Comfort et al., 1995; Hundal et al., 1997; Achtnich et al.,
1999a). Although these findings do not refute the proposed EDA mechanism they
suggest that additional mechanisms may be responsible for sorption of NAC by soil
components. Boyd et al. (2001) proposed that NAC sorption was the result of
complexation of the –NO2 groups with interlayer K+ ions as a result of partitioning into
the interlayer where the NACs may be less hydrated. This would suggest that TNT
prefers a hydrophobic environment and recent studies have noted that the hydrophobic
characteristics of some clay minerals may contribute to the sorption of NACs (Johnston
et al., 2004). Molecular quantum mechanics calculations have supported the mechanism
61
proposed by Boyd and co-workers (Pelmenschikov and Leszczynksi, 1999; Johnston et
al., 2001).
Several studies have noted that in addition to clay minerals, soil organic matter
also plays a significant role in the transformation and sorption of NACs in soil (Li et. al.,
1997; Eriksson and Skyllberg, 2001; Sheng et al., 2001; Wang et al, 2002; Li et al.,
2003). Li et al. (1997) reported significant adsorption of TNT and two metabolites, 2-
amino-4,6-dinitrotoluene (2ADNT) and 2,6-diamino-4-nitrotoluene (2,6DANT) to
Aldrich (Milwaukee, WI) humic acid under non-sterile conditions. In addition, Eriksson
and Skyllberg (2001) reported that the sorption of TNT to dissolved and particulate
organic matter (DOM, POM) was due mostly to the initial transformation of TNT to its
reduced metabolites which were subsequently sorbed to soil organic matter. They argued
that TNT sorption should be considered as the sorption of TNT and its transformation
products. Studies using 15N and 14C nuclear magnetic resonance (NMR) have further
supported these findings by demonstrating that hydroxylamino and amino metabolites of
TNT can form ionic and covalent interactions with humic acid and other organic fractions
of soil organic matter (Achtnich et al., 1999; Bruns-Nagel et al., 2000; Thorn et al., 2002;
Eriksson et al., 2004). Wang et al. (2002) also demonstrated the ability of humic acid
precursors such as catechol to mediate the transformation and subsequent sorption of the
TNT metabolites forming either an anilinoquinone via nucleophilic addition or a
benzoquinone-imine through condensation reactions. In two separate studies, Hundal et
al. (1997) and Kreslavski et al. (1999) reported that as much as 40% of TNT in TNT-
contaminated soil was unextractable after exhaustive extraction techniques and that this
was attributed in part to interactions with soil organic matter to form stable complexes.
62
Although numerous studies have examined NAC sorption to clay and humic
substances independently, little research is available on the behavior of TNT in the
presence of humic-clay complexes (Haderlein et al., 1996; Boyd et al., 2001; Li et al.,
2003). Previous work has shown that humic acid associated with smectitic clays can
inhibit, enhance, or have no effect on NAC sorption (Li et al., 2003). Research that
characterizes the combined role of organic matter and clay minerals on TNT sorption will
lead to a better understanding of the fate and bioavailability of TNT and other NACs in
the soil environment. The objective of this study was to determine to what extent humic
acid and humic acid-clay interactions would influence the sorption and desorption of
TNT to clay minerals.
2. Materials and Methods
2.1. Chemicals.
Granular 2,4,6-trinitrotoluene (TNT) (CAS 118-96-7: MW 227.15 g mol-1) used
in batch equilibration experiments was purchased from Holston Army Ammunition Plant
(Kingsport, TN USA) with a reported purity > 98% and was used as received. Analytical
standards for TNT were obtained from Accustandard (New Haven, CT, USA) with a
reported purity of ≥ 99%. Humic acid was obtained from Aldrich Chemical Company
Inc. (Milwaukee, WI, USA). All solvents used were HPLC grade and were obtained
from Fisher Scientific (Pittsburgh, PA USA).
63
2.2. Humic Acid- Clay Complex Preparation.
The reference clay minerals, Kaolinite (KGa-1b), smectite low-charge (SWy-2),
smectite low-charge (SHCa-1), and smectite high-charge (SAz-1) were purchased from
the Source Clays Repository of the Clay Minerals Society (www.cms.org, West
Lafayette, IN, USA). The reference clays were used as delivered with no additional
purification. The clays were exchanged (i.e. suspended and centrifuged) with 0.1 M
aqueous solutions of KCl or CaCl2 to obtain K+- or Ca2+-saturated clays, respectively.
Excess electrolyte was removed by repeated washes with distilled water until the ionic
strength of the extractants were less than 0.01 M, which was used in the batch
experiments described later. The clay suspensions were then frozen, freeze-dried, and
stored in closed containers. The specific surface areas for the prepared clays were
analyzed using N2 sorption following the BET method (Pennell, 2002).
Humic acid-clay complexes were prepared using a modified method by Li et al.,
(2003). Briefly, 1.0 gram of humic acid was dissolved in a small volume (< 10 mL) of
0.1 M NaOH, brought up to1 L in 0.1 M KCl or CaCl2 solution, followed by shaking with
10 g of the corresponding previously prepared K+- or Ca2+- clays for 3 days before
centrifuging. The pH of the humic-clay complex was not altered, but was monitored over
the course of equilibration. The pH of the humic-acid solution was between 7.0 and 7.5
before, and 7.0 and 9.5 (depending on the clay mineral) after equilibration. To ensure
saturation of K+ and Ca2+ ,the prepared humic acid-clay complexes were mixed with
either 0.1 M KCl (for K+- clays) or CaCl2 (for Ca2+- clays) solution and then centrifuged
before discarding the supernatants. This process was repeated three times. After the
saturation, excess electrolyte and humic acid were removed by repeatedly washing the
64
prepared humic acid-clay complexes with deionized water until there was no light brown
color in the supernatant, no visual humic acid particulates settled on the top of the clay
fraction after centrifugation, and the ionic strength was less than 0.01 M, which was used
for the later batch experiments.
Additional humic-clay complexes for K+-saturated smectite (K-SWy) were also
prepared by sequentially adsorbing humic acid onto the K+-saturated clay using the
following procedures. After the humic- K-SWy complex was prepared for the batch
sorption experiments it was removed from the humic acid solution, 10 g of fresh K-SWy
smectite was added to the residual humic acid solution and shaken for 3 d before
centrifuging. To saturate and clean the humic-clay complexes with K+, the method
described in the previous paragraph was used. The sequential sorption of humic acid
onto the K-SWy smectite was repeated a total of three times after the initial saturation
resulting in a total of 4 humic acid-clay complexes designated as K-HA-SWy, K-HA-S2-
SWy, K-HA-S3-SWy, and K-HA-S4-Swy following the sequence of humic acid
sorption). Humic-clay complexes for K+-saturated kaolinite (KGa-1b) were also
prepared following the same procedure, but under two different pH values, 4.5 (K-HA-
KGa-A) and 6.5 (K-HA-KGa-B). All of the humic-clay complexes were frozen, freeze-
dried, and stored in sealed containers. The organic C contents were measured using the
dry combustion method (Nelson and Sommers, 1996). Additionally, the specific surface
areas of the prepared humic-clay complexes were measured using the same method
mentioned in the previous section. Selected properties of the clay minerals and humic
acid-clay complexes are given in Table 3.1.
65
2.3. Batch Sorption Experiments: Clay and Humic-Clay Complexes.
Experiments for sorption and desorption of TNT to clays and humic-clay
complexes were conducted by using a batch equilibration method. Stock solutions of
TNT were prepared in acetonitrile and were kept refrigerated before use. Initial aqueous
concentrations of TNT ranged from 2.5 to 60 μg mL-1 (2.3 to 55% of aqueous solubility).
Clays and humic acid-clay complexes were weighed in triplicate into 50 mL
polypropylene tubes followed by the addition of the initial TNT solutions. The samples
were mixed on a vortex for 1 minute and then placed on a shaker for 24 h at room
temperature (25ºC), followed by centrifugation at 1250 x g for 45 min. Previous
experiments (data not shown) indicated that equilibrium was achieved within this time
and that there was no adsorption to the polypropylene tubes or caps. A 1 mL aliquot of
supernatant was collected, filtered through a 0.45-μm filter, and transferred to a glass GC
vial for analysis of TNT and its metabolites on HPLC. The HPLC analysis of all samples
indicated no quantifiable levels of TNT metabolites and thus, the difference in the initial
amount TNT and the amount of TNT remaining after equilibration was assumed to be
adsorbed to the solid phase. Desorption of TNT was conducted by using a decant and
refill technique. In situations where TNT sorption was low, desorption for certain clays
(i.e. Ca-SAz, Ca-HA-SAz, Ca-KGa) was not conducted because of variable, unreliable
data. After the sorption experiments, the remaining solution in each tube was carefully
decanted and the residual supernatant was determined gravimetrically. The concentration
of TNT in the residual solution was assumed to be the same as that measured in the
removed supernatant. An appropriate volume of TNT-free solution with the
corresponding electrolyte was added into the centrifuge tubes to achieve the initial
66
volume used for the sorption experiment. The tubes were placed on the shaker for 24
hours and then centrifuged at 1250 x g for 45 min. After centrifugation a 1 mL aliquot of
supernatant was removed, filtered through a 0.45-μm filter, and transferred to a glass GC
vial for analysis of TNT and metabolites by HPLC. No quantifiable TNT metabolites
were detected and, therefore, the amount of TNT detected in the supernatant was
considered as the amount desorbed from the solid phase.
2.4. Batch Sorption Experiments: Humic Acid.
The humic acid was fractionated into molecular weights greater than and less than
3500 D by dialyzing it against deionized water using a dialysis membrane with a 3500 D
molecular weight cutoff (Spectrum Co). The humic acid > 3500 D molecular weight was
retained and used to prepare stock HA solutions for later batch sorption experiments
using custom made two-compartment dialysis cells (Figure 4.1). For all calculations and
sorption coefficients based on humic acid concentration it was assumed that the humic
acid consisted of 49.01% carbon based on the certificate of analysis provided by Aldrich
Chemical Co. Five stock solutions containing 24.3, 39.9, 62.4, 129.2, and 200 μg HA
mL-1 were prepared in 0.01 M KCl at pH 6.7 ± 0.6. After being conditioned in three
changes of deionized water, one piece of the 3500 D cutoff dialysis membrane (Spectrum
Co) was tightly secured between the two compartments of each cell. For each cell, one
compartment was loaded with 5 mL of humic-acid solution at the desired concentration
and the other compartment was loaded with 5 mL of TNT solution in 0.01 M KCl at the
same pH. The initial TNT concentrations ranged from 0.44 to 24.4 μg mL-1 (0.4 to 22%
of aqueous solubility). The two-compartment dialysis cells were placed on a shaker,
67
covered, and allowed to equilibrate for 23 to 24 h. The equilibration time was based on
the findings of Li et al. (1997) and was chosen to minimize the impact of degradation or
transformation of TNT due to the presence of humic acid. After equilibrium was
achieved the concentration of free TNT was equal on both sides of the membrane with
the humic acid and TNT-humic acid complexes being retained in only one compartment.
Controls were run before batch equilibrium experiments to ensure that TNT molecule
was able to pass through the membrane. Following the sorption experiments, an aliquot
of sample from the non-humic acid compartment was transferred to a glass GC vial for
analysis of TNT and metabolites by HPLC. For the range of TNT concentrations used in
this study only 0.01 to 0.05 % of TNT was adsorbed to the membrane, and thus was
ignored in all sorption calculations. Since no TNT metabolites were detected, the
differences between the amount of initial TNT added and the amount of free TNT
measured in the solution at the end of sorption experiments was considered as sorbed or
complexed with humic acid.
2.5. HPLC Analysis.
Aqueous TNT concentrations were determined by injection of filtered aqueous
samples on a reversed phase ThermoFinnigan HPLC system (Woburn, MA USA)
equipped with a Spectra System P4000 pump, AS3000 Autosampler, UV6000LP UV
detector (228 nm peak detection) and a J’sphere ODS-H80 (YMC Co. Ltd., Tokyo,
Japan) reversed-phase column (5 μm, 150 by 4.6 mm i.d.). The mobile phase was 82:18
(v:v) water:2-propanol with a flow rate of 1.5 mL min-1, a 10-μL injection volume and a
column oven temperature of 40° C. Controls used included clay and humic acid-clay
68
complexes in electrolyte solution, the stock solution of each initial concentration, and
blanks containing only the electrolyte concentration. A standard curve was run every 30
samples, with one standard rechecked every 10 samples. The lowest concentration of
aqueous TNT at which reproducible results were obtained on the HPLC was 75 μg L-1.
The precision of the HPLC method ranged from 0.5 to 5% RSD.
2.6. X-Ray Diffraction Analysis.
X-Ray diffraction (XRD) analysis was conducted for selected samples after the
desorption step was completed. The three replicates for each sorption/desorption
treatment were pooled together to ensure a sample containing at least 150 mg of clay or
humic acid-clay complex for the XRD analysis. Oriented clay slides were prepared for
XRD analysis using the filter-membrane technique and stored at 0% humidity before
analysis (Drever, 1973). The XRD patterns of clay and humic-clay films were obtained
using a Philips PW 1729 automated x-ray diffractormeter equipped with Cu-Κα radiation
and a curved crystal monochromator. The scanning angle (2θ) ranged from 3 to 15 at
steps of 0.05º with 2 s per step.
3. Results and Discussion
3.1. TNT sorption and desorption by homoionic K+- and Ca2+- clay minerals.
Isotherms representing sorption of TNT by K+- and Ca2+- clay minerals (KGa,
SWy, SAz, and SHCa) are shown in Figure 3.2. Sorption isotherms describing TNT
sorption were fitted to the Langmuir and Freundlich equations for all clay minerals and to
the Linear equation for selected minerals,
69
wL
wLS CK
CKQC
+=
1*
[1]
NwfS CKC = [2]
wdS CKC = [3]
where CS (μg g-1) is the amount of TNT sorbed by the clay or humic-clay complex, Cw
(μg mL-1) is the equilibrium aqueous concentration of TNT. In the Langmuir model
(equation 1), KL is the Langmuir constant and is related to entropy and Q is the
monolayer sorption capacity parameter. In the Freundlich model (equation 2), Kf (mL
μg-1) is the Freundlich sorption coefficient and N (unitless) describes the fitness of the
isotherm or its curvature. In the linear model (equation 3), Kd (mL μg-1) is the sorption
coefficient. The results of fitting the TNT sorption data to the three models are shown in
Table 3.2.
The sorption of TNT to K+- saturated clay minerals followed the order of SWy >
SHCa > SAz > KGa. However, the sorption of TNT to Ca2+- saturated clay minerals
followed the order of SHCa > SWy > SAz > KGa (Figure 3.2). For all clay minerals
there was greater sorption to K+- saturated minerals compared to the corresponding Ca2+-
saturated clay mineral. These results are in agreement with the findings of Haderlein et al.
(1996) and Li et al. (2003), who observed similar trends with TNT and 4,6-dinitro-o-
cresol, respectively. The greater affinity for K+- saturated clay minerals can be attributed
to the lower hydration energy associated with K+ compared to the larger and stronger
hydration sphere associated with Ca2+ (Haderlein et al., 1996; Sheng et al., 2001). In
addition, the larger hydration radius associated with Ca2+ can obscure the siloxane
surface and result in fewer opportunities for TNT sorption on Ca2+-saturated clays
70
compared to K+-saturated clays. Similarly, it has been suggested that TNT is able to
interact through inner-sphere cation bridging with the K+- in the interlayers by replacing
the water (Boyd et al., 2001). However, since the hydration energy associated with Ca2+-
is greater, the interactions between TNT and Ca2+- saturated clay minerals is a result of
outersphere interactions with Ca2+- (Harper, 1994). TNT sorption to K-SAz was lower
than K-SHCa and K-SWy due to the larger interlayer charge and stronger binding of
interlayer cations and vicinal water which makes it more difficult for TNT to replace
them (Boyd et al., 2001; Sheng et al., 2002; Li et al., 2003).
The different sequence of TNT sorption to K+- and Ca2+- saturated SWy and
SHCa (Table 4.3) could be attributed to the surface of hectorite (SHCa) exhibiting
hydrophobic characteristics that may allow additional neutral siloxane sites and easier
exchange of water and Ca2+ by TNT (Van Oss and Giese, 1995; Wu, 2001). Recently it
has been suggested that the surface of clay minerals may exhibit hydrophobic
characteristics between charged sites (from isomorphic substitution) and that surface
hydrophobicity is negatively correlated with interlayer charge (Sposito et al., 1999).
Hectorite (SHCa – trioctahedral) has a lower layer charge than smectite (SWy -
dioctahedral) and has been characterized as more hydrophobic than hydrophilic (Van Oss
and Giese, 1995). Similarly, a study examining the sorption of atrazine to Ca2+- saturated
clay minerals also noted the hydrophobic characteristics of hectorite as greater adsorption
was observed compared to other smectitic minerals (Laird et al., 1992). However, studies
by Weissmahr and coworkers indicated that hydrophobic interactions between TNT and
clay minerals were minimal and that strong EDA interactions were responsible for TNT
71
sorption (Weissmahr, et al., 1997). To date, there is still considerable uncertainty as to
the mechanism(s) responsible for sorption of TNT to clay minerals.
Desorption isotherms for the K+- and Ca+2- saturated clay minerals are presented
in Figure 3.3. For all clay minerals except Ca-SHCa the desorption isotherms indicate
significant hysteresis (Figure 3.3, Table 3.2). This is in disagreement with the findings of
Haderlein et al. (1996) and Weissmahr et al. (1997) who reported a high degree of
mobility consistent with reversible sorption for a variety of NACs including TNT.
However, it should be noted that in the studies performed by Haderlein and coworkers an
equilibration time of 30 to 60 min. was used compared to the 24 h equilibration time used
in this study for both sorption and desorption experiments. It has been recently
demonstrated that with prolonged exposure to TNT, there is an increase in the formation
of non-extractable residues and an increase in hysteresis (Hundal et al., 1997). The
desorption isotherms for the Ca2+- saturated clays were convex to the abscissa (N ≥1.0)
indicating greater hysteresis at higher levels of TNT sorption (Figure 4.4). The lack of
hysteresis with Ca-SHCa and the linear nature of both the sorption and desorption
isotherms indicates that the binding of TNT on Ca-SHCa may be the result of weak, short
range, physical interactions which is typical in the partitioning of neutral organic
compounds rather than site specific sorption (Harper, 1994). These results support the
discussion in the previous paragraph regarding hydrophobic interactions between TNT
and netural siloxane sites on hectorite.
72
3.2 TNT sorption by humic acid
TNT sorption isotherms for humic acid, normalized to HA concentrations (μg
TNT g-1 HA) are shown in Figure 3.4 and Table 3.3. For all humic acid concentrations a
non-linear isotherm was observed which was well described by both the Langmuir and
Freundlich isotherms. Previous research has shown that TNT in the presence of humic
substances, especially in non-sterile conditions, can be readily reduced to monoamino
(i.e. 2ADNT, 4ADNT) and diamino (2,4DANT) which can also be adsorbed by humic
substances (Renoux et al., 2000; Eriksson and Skyllberg, 2001; Eriksson et al., 2004).
However, it has been shown that this process may be microbially driven and that under
sterile conditions, TNT, 4ADNT or 2ADNT do not adsorb to humic substances (Held et
al., 1997). Other studies have shown that the reduction of TNT to 4ADNT via humic
acid precursors such as catechol can lead to the formation of an azoxy-dimer that is
readily adsorbed by humic substances (Achtnich et al., 1999; Wang et al., 2002).
Eriksson and Skyllberg (2001) suggested that when discussing TNT sorption to humic
materials it is more appropriate to refer to TNT sorption as the sorption of TNT and the
sum of its degradation products. Thus, although no TNT metabolites were measured
during this study, it is possible that the disappearance of TNT was due in part to
transformation to and sorption of 2-ADNT or 4-ADNT In our study, an increase in TNT
sorption was correlated with a decrease in HA concentration (Figure 4.5, Table 4.4). This
is in agreement with Li et al. (1997) who noted an increase in TNT and 2,6DANT
sorption with a decrease in HA concentration from 5.12 μM to 2.56 μM. At low
concentrations, HA exhibits a linear polyelectrolyte behavior with more binding sites
73
available compared to high HA concentrations when the HA tends to be more coiled and
aggregated with fewer sites available for TNT sorption (Schnitzer, 1986).
3.3 TNT sorption and desorption by humic-clay complexes
TNT sorption and desorption isotherms and fitted sorption parameters for the
humic-clay complexes of the selected K+ and Ca2+-saturated are shown in Figure 3.5 and
Table 3.2. All TNT sorption isotherms for the K+- saturated humic-clay complexes were
nonlinear with the Langmuir and Freundlich equations providing the best fit (Table 3.2).
However, the TNT sorption isotherms for the Ca2+- saturated humic-clay complexes were
linear to slightly non-linear and were well described by all three equations (Table 3.2).
Except for the Ca-HA-SHCa, TNT desorption coefficients for all other humic-
clay complexes were considerably larger than its sorption coefficients indicating sorption
hysteresis (Figure 3.5, and Table 3.2). Larger desorption coefficients were found for K-
HA-S1-SWy, K-HA-SAz, and Ca-HA-SHCa compared to that for the corresponding non-
humic complexed clays, indicating that the humic acid further hindered the desorption of
TNT. This is in line with the findings of Eriksson and Skyllberg (2001) and Held et al.
(1997) who observed strong irreversible binding of TNT to DOM and HA, respectively.
Contrary to these results, a smaller desorption coefficient was observed for K-HA-SHCa
and Ca-HA-SWy compared to K-SHCa and Ca-SWy (Table 3.2). The previously
mentioned hydrophobic characteristics of hectorite SHCa, and to a lesser extent low-
charge smectite (SWy), could have resulted in greater adsorption of humic acid leading to
a reduction in potential binding sites and binding strength.
74
The TNT sorption isotherms for humic-clay complexes and the corresponding K+-
and Ca2+- saturated clay minerals are shown in Figure 3.6. For the smectitic clays K-HA-
SWy and K-HA-SAz, humic acid resulted in greater sorption of TNT compared to the
clay mineral. However, for K-HA-SHCa, the presence of humic acid resulted in a
decrease in TNT sorption compared to the corresponding clay mineral. This implies that
the sorption mechanism or mineral surface conditions are different for K+-saturated
SHCa compared to K+-saturated SWy and SAz. The nature of the humic acid-clay
interactions and/or the presence of impurities (i.e. calcite) could have potentially hindered
the availability of sorption sites to TNT. Studies by Arnarson and Keil (2001) have noted
that the interaction between humic acid and clay minerals may result in sporadic
coverage of the clay surface rather than complete encasing by humic acid. Thus, the
surface area covered by humic-acid in SHCa may be greater than that covered by SWy,
due to the nature of humic-clay interactions, leading to the observed differences in TNT
sorption. The decrease in external surface area of K-HA-SHCa and Ca-HA-SHCa
compared to K-SHCa and Ca-SHCa supports the theory of increase surface area coverage
by humic acid.
Li et al. (2003) observed no difference in 4,6-dinitro-o-cresol or dichlorbenil
sorption between K+- clay minerals and the corresponding humic-clay complexes. They
concluded that humic acid, which was limited to the outer clay surfaces, had no impact
on sorption because the interlayer region provides the dominant binding sites for these
nitroaromatic pesticides. Their conclusion was further supported by XRD analysis. On
the contrary, a substantial increase in TNT sorption was observed in this study for K-HA-
SWy compared to K-SWy and a moderate increase was observed in K-HA-SAz
75
compared to K-SAz (Figure 3.6). The XRD analysis of K-HA-SWy and K-SWy further
supports these findings (Figure 3.7; Appendix A, Figures A.1., A.2). The interlayer
spacing of K-SWy and K-HA-SWy increased with increasing TNT sorption and was
≈12.0 Å at the highest level of TNT sorption. This supports the suggestion that TNT
interacts with the basal surfaces as a planar molecule (Haderlein et al., 1996; Sheng et al.,
2001). Previous research has demonstrated that the interlayer spacing representing the
interaction between siloxane surfaces is 9.2 Å (i.e. pyrophyllite) and that NACs such as
TNT have a planar van der Waals molecular thickness of ≈3.5 Å (Sheng et al., 2001;
Johnston et al., 2004). Thus, adding the thickness of TNT to the interlayer spacing of
two siloxane surfaces yields a total thickness of roughly 12.7 Å, which is similar to that
measured in this study. One possible explanation for the difference between the
calculated spacing and our measured spacing is that our XRD peaks were fairly broad
which is due to the contributions of expanded and non-expanded layers (Johnston et al.,
2004). Furthermore, the measured XRD peaks for the humic-clay complexes were
extremely broad compared to those of the corresponding clay mineral indicating possible
interference from the humic acid or a greater degree of heterogeneity in the number of
layers that were expanded and not expanded.
Our results also indicate the possibility that the surface of the humic-clay
complex had a greater affinity for TNT than the corresponding clay mineral. For a given
amount of TNT sorbed, K-SWy had a greater basal spacing (d001) compared to K-HA-
SWy (Figure 3.7), yet overall K-HA-SWy sorbed TNT to a greater extent. This implies
that with humic acid, there was less sorption in the interlayer region and a greater degree
of sorption on the humic-clay surface then on the corresponding clay mineral. A possible
76
explanation for this is that the humic-acid associated with the clay increased the affinity
for or ability of TNT to bind with the outer surfaces compared to the clay with no humic
acid. Thus, the humic acid associated clay surface was more attractive or accessible to
TNT than the clay interlayer, however, with additional TNT loadings eventually TNT
sorption in the interlayer reached the same degree as that for the non-humic clay complex
(K-SWy, Figure 3.7). Further evidence for this is that every humic-clay complex had a
reduction in the exterior surface area compared to the corresponding homoionic clay
mineral (Table 3.1), yet there was still an increase in TNT sorption for two of the three
humic-clay complexes (Table 3.2). This would indicate possible hydrophobic
partitioning was involved despite the fact that previous studies have refuted this as a
significant mechanism responsible for TNT sorption (Weissmahr et al., 1998).
The effect of humic acid on the sorption of TNT to Ca2+ clay minerals was
minimal compared to that on K+- saturated clays (Figure 3.6, Table 3.2). The TNT
sorption to these humic-clay complexes and clay minerals were well described by linear
isotherms which indicate a portioning mechanism rather than site specific sorption which
tends to be more common with non-linear isotherms (Harper, 1994). The larger
hydration sphere of Ca+2 prevented the sorption of TNT by the humic-clay complexes
and corresponding clay minerals by reducing the space between exchangeable cations,
which are favorable sorptive domains for TNT (Johnston et al., 2004). In addition, the
expansion of the interlayer region to almost 14.0 Å (data not shown) for both Ca-SWy
and Ca-HA-SWy may allow for greater hydration of the interlayer region and thus reduce
the affinity for TNT compared to the K+- saturated clay minerals and humic-clay
complexes (Sheng et al., 2001). Overall, humic acid slightly increase sorption to Ca-HA-
77
SAz compared to Ca-SAz and slightly reduced sorption to Ca-HA-SWy compared to Ca-
SWy (Figure 3.6). Li et al. (2003) noted similar trends with 4,6-dinitro-o-cresol by Ca+2
saturated SWy and SAz and the corresponding humic-clay complexes.
Sorption of TNT to kaolinite, the only non 2:1 clay mineral examined in this
study was lower than any other clay mineral (Figure 3.8). The isotherm was non-linear
indicating site specific interactions with the mineral surface. The lack of TNT sorption
can be attributed to the low external and total surface area. Humic-clay complexes were
prepared only for the K+- saturated kaolinite and under two different experimental
conditions of pH 4.5 and 6.5. The isotherms for the humic-clay complexes (K-HA-KGa-
A, K-HA-KGa-B) were similar regardless of the pH with both exhibiting a linear
characteristic and had linear sorption coefficients that were almost 3x greater than K-KGa
(Figure 4.8, Table 4.3). This implies that the sorption of TNT to the humic-kaolinite
complex was due to partitioning rather than site specific sorption. Additionally, the
significant increase in sorption with humic acid suggests that in soil systems dominated
by 1:1 clay minerals soil organic matter is the dominant sorbent for NACs such as TNT.
The overall lack of difference in TNT sorption to kaolinite under different pH conditions
is typical for nonionizable compounds, such as NACs including TNT (Haderlein and
Schwarzenbach, 1993).
3.4 TNT sorption to sequentially prepared humic-clay complexes.
The sorption of TNT to humic-clay complexes was further examined by preparing
four humic-clay complexes with the SWy-2 reference mineral sequentially saturated with
the same humic acid solution (K-HA-SWy, K-HA-S2-SWy, K-HA-S3-SWy, K-HA-S4-
78
SWy). Sorption isotherms for TNT to the sequentially prepared humic-clay complexes
are presented in Figure 3.9. All the sorption isotherms were well described with the
Langmuir and Freundlich models (Table 3.2). The sorption of TNT on the humic-clay
complexes decreased with each sequentially prepared humic-clay complex.
Studies involving solid- and liquid-state 13C NMR have provided evidence for the
fractionation of humic acid during its adsorption onto the mineral surface that result in
the preferential adsorption of aliphatic humic substances (Wang and Xing, 2005). In
addition, their UV-visible spectroscopy analysis showed a decrease of humic acid E4 to
E6 ratios in the residual humic acid solution with increasing order of sequential sorption,
indicating an increase in the aromaticity of the humic acid solution. What we observed in
the current study, (Figure 3.9, Table 3.2) that TNT sorption decreased with increasing
order of sequential complexation with SWy-2 indirectly supports the findings by Wang
and Xing (2005).
The second, third, and fourth HA saturations resulted in carbon contents of 3.6,
2.3, and 3.2 g kg-1, respectively, which was significantly lower than the first HA
saturation (K-HA-SWy) with a carbon content of 13.9 g kg-1 (Table 3.1). This could be
due to a reduction in the ratio of humic acid to clay in the humic acid solution with each
sequential humic-clay complexation resulting in a decrease in sorbed humic acid. A
second possibility is that the nature of the remaining humic acid was changed (i.e.
increase in aromaticity) and resulted in a reduction in affinity for the clay mineral
surface. The initial humic acid to clay ratio of the humic acid solution was 1:10 (w/w).
The reduction in carbon content for the second and third sequential complexation
corresponded with an increase in the specific surface area of the humic-clay complexes
79
compared to that from the initial humic acid sorption (Table 3.1). Although the humic-
clay complex from the fourth sequential complexation had similar carbon content as that
of the previous two sequential complexations, its specific surface area is the lowest
(Table 3.1). Wang and Xing (2005) noted similar change for surface areas of humic-clay
complexes with different humic acid loading levels. The authors suggested that the
thickness of the HA covering the clay surface may differ depending on the nature of the
humic-clay interaction. Arnarson and Keil (2001) suggested that the sorption of clay
minerals by humic acid exists at discrete portions of the mineral surface. This would
explain the increase in specific surface area observed in the second and third humic acid
sequencial complexation steps, as the humic acid covered less surface area of the clay
mineral compared to the first HA saturation. However, after the forth sequential
complexation, it is possible that the humic acid sorbed to the clay resulted in a thicker
and more sporadically located (i.e hydrophobic portions of SWy) layers of HA compared
to the previous two sequential complexation steps, resulting in a decrease in specific
surface area (Table 3.1). Typically, the surface area of organic matter has been measured
at 1 m2 g-1, thus, the difference in surface area between the second and fourth sequentially
saturated humic-clay complexes may be due to the size/thickness of the humic acid
particles or the overall surface area that they cover (Chiou et al., 1990).
The XRD analysis of the sequentially saturated humic-clay complexes provided
possible evidence of the intercalation by humic acid or impurities in the humic acid
(humic substances) within the interlayer regions (Figure 3.10; Appendix A, Figures A2,
A3, A4). The adsorption of fulvic acid in clay interlayers has been previously discussed,
however, to our current knowledge there is no evidence of humic acid intercalation in 2:1
80
clay minerals (Schnitzer, 1986). With a TNT loading of 0 ppm, the basal (d001) spacing
for K-HA-S2-SWy, K-HA-S3-SWy, and K-HA-S4-SWy was 12.1, 11.6, and 12.5 Å,
respectively, compared to K-HA-SWy with a basal spacing of 10.3 Å. These results
would suggest that larger molecular weight humic acids were adsorbed to the clay during
the initial complexation, leaving behind smaller aliphatic humic substances for later
sequential complexation steps. It is not known if the interlayer humic acid sorbed to the
clay was aliphatic or aromatic in nature, but when the humic-clay complexes from the
2nd, 3rd, and 4th complexation steps were exposed to TNT their interlayer spacing dropped
to 10 – 10.7 Å which was similar to that for K-HA-SWy. This would suggest that the
humic substances in the interlayer were weakly adsorbed, possibly due to van der Waals
forces or outersphere complexation. In addition, at the highest TNT level similar
interlayer spacings of 12.0 Å was observed for all four sequentially complexed humic-
clay complexes. This would suggest that the interlayer sorption of TNT was similar for
all four humic-clay complexes and that the overall reduction in TNT sorption observed in
the second through fourth sequentially complexes humic-clay complexes was due to a
reduction in TNT sorption to the humic-clay complex external surface rather than in the
interlayer region. Thus, with sequential complexation between clay minerals and humic
acid, the surface characteristics changed resulting in a reduction in surface sorption of
TNT.
4. Conclusion
Overall, the observed results of TNT sorption to K+- and Ca2+- saturated clays
agree with previous studies. The TNT sorption to humic acid was significant and may
81
have been the result of TNT reduction to mono- and di-amino metabolites followed by
sorption to the humic acid solutions. TNT sorption to humic acid increased with a
decrease in humic acid solution concentration and in part explains the high levels of
sorption to certain humic-clay complexes (K-HA-SWy, K-HA-SAz). Humic acid
associations with clay minerals, particularly K+- humic-clay complexes enhanced
sorption with kaolinite, two smectite minerals (SWy and SAz), and suppressed sorption
to a third smectite mineral (SHCa). Additionally, desorption hysteresis was observed
with all clay minerals and the corresponding humic-clay complexes, except for Ca-SHCa,
indicating strong binding of TNT to the surfaces and interlayer regions of clay and
humic-clay complexes. The TNT sorption to smectite minerals which were sequentially
complexed with humic acid provided further evidence for fractionation of humic acid
during sorption by clay minerals and the possible intercalation of humic acid in smectite.
These findings have relevant applications in the risk assessment and remediation
of contaminated sites. Soil contaminated with TNT and that contain a significant amount
of organic matter may not pose a threat to groundwater and transport compared to other
sites. This is especially true of soils dominated by 1:1 clays such as kaolinite. Although
kaolinite does not readily adsorb TNT, if the contribution for organic matter is not
considered site assessment may over estimate the potential risk to humans, wildlife, and
plants. Although hectorite is not as common as other smectite minerals, the reduction in
TNT sorption with the humic acid-hectorite complex raises the possibility of
underestimating the amount of TNT bound to the soil. Therefore, clay mineralogy should
not be overlooked during site assessment and characterization.
82
The affinity of TNT for humic acid also raises the possibility of incorporating
organic amendments in existing remediation technologies such as composting,
phytoremediation, and biostimulation. Organic amendments may reduce the
bioavailability of TNT through sequestration and stimulating biotic and abiotic
transformation to metabolites which in turn may be readily adsorbed. Overall, these
results indicate the importance of considering organic matter-clay interactions when
determining the bioavailability and fate of TNT in the environment.
83
References Arnarson, T.S.,and R.G. Keil. 2001. Organic-mineral interactions in marine sediments
studied using density fractionation and X-ray photoelectron spectroscopy. Org Geochem 32: 1401-1415.
Achtnich, C., U. Sieglen, H.-J. Knackmuss, and H. Lenke. 1999. Irreversible binding of biologically reduced 2,4,6-trinitrotoluene to soil. Environ. Toxicol. Chem. 18: 2416-2423.
Borden, D., and R.F. Griese. 2001. Baseline studies of the clay minerals society source clays: Cation exchange capacity measurements by the ammonia-electrode method. Clays Clay Miner. 49: 444-445.
Boyd, S.A., G. Sheng, B.J. Teppen, and C.T. Johnston. 2001. Mechanisms for the adsorption of substituted nitrobenzenes by smectite clays. Environ. Sci. Technol. 35: 4227-4234.
Bruns-Nagel, D., H. Knicker, O. Drzyzga, U. Butehorn, K. Steinbach, D. Gemsa, and E.V. Low. 2000. Characterization of 15N NMR spectroscopy. 2. Systematic investigation of whole soil and different humic fractions. Environ. Sci. Technol. 34: 1549-1556.
Chiou, C.T., J.-F. Lee, and S.A. Boyd. 1990. The surface area of soil organic matter. Environ. Sci. Technol. 24: 1164-1166
Chipera, S.J., and D.L. Bish 2001. Baseline studies of the clay minerals society source clays: Powder x-ray diffraction analyses. Clays Clay Miner. 49: 398-409.
Comfort, S.D., P.J. Shea, L.S. Hundal, Z. Li, B.L. Woodbury, and W.L. Powers. 1995. TNT transport and fate in contaminated soil. J. Environ. Qual. 24: 1174-1182.
Drever, J.E. 1973. The preparation of oriented clay mineral specimens for x-ray diffraction analysis by a filter-membrane technique. Am. Mineral. 58: 553-554.
Eriksson, J., and U. Skyllberg. 2001. Binding of 2,4,6-trinitrotoluene and its degradation products in a soil organic matter two-phase system. J. Environ. Qual. 30: 2053-2061.
Eriksson, J., S. Frankki, A. Shchukarev, and U. Skyllberg. 2004. Binding of 2,4,6- trinitrotolune, aniline, and nitrobenzene to dissolved and particulate soil organic matter. Environ. Sci. Technol. 38: 3074-3080.
Fuller, M.E., and J.F. Manning. 1998. Evidence for differential effects of 2,4,6-
84
trinitrotoluene and other munitions compounds on specific subpopulations of soil microbial communities. Environ. Toxicol. Chem. 17: 2185-2195.
GAO 2003. Military munitions: DOD needs to develop a comprehensive approach for
cleaning up contaminated sites, Report GAO-04-147, General Accountability Office, Washington, D.C.
Haderlein, S.B., and R.P. Schwarzenbach. 1993. Adsorption of substituted nitrobenzenes
and nitrophenols to mineral surfaces. Environ. Sci. Technol. 27: 316-326.
Haderlein, S.B., K.H. Weissmahr, and R.P. Schwarzenbach. 1996. Specific adsorption of nitroaromatic explosives and pesticides to clay minerals. Environ. Sci. Technol. 30: 612-622.
Haper, S.S. 1994. Sorption-desorption and herbicide behavior in soil. Rev. Weed. Sci. 6: 207-225.
Held, T., G. Draude, F.R.J. Schmidt, A. Brokamp, and K.H. Reis. 1997. Enhanced humification as an in-situ bioremediation technique for 2,4,6-trinitrotoluene (TNT) contaminated soils. Environ. Sci. Technol. 18: 479-487.
Hundal, L., P.J. Shea, S.D. Comfort, W.L. Powers, and J. Singh 1997. Long-term TNT sorption and bound residue formation in soil. J. Environ. Qual. 26: 896-904.
Jerger, D.E., and P.E. Woodhull. 2000. Applications and costs for biological treatment of explosives contaminated soil in the U.S. p. 395-424. In Biodegradation of nitroaromatic compounds and explosives. Spain, J.C., Joseph B. Hughes, and Hans-Joachim Knackmuss (eds). CRC Press, Boca Raton.
Johnston, C.T., M.F.D. Oliveira, B.J. Teppen, G. Sheng, and S.A. Boyd. 2001. Spectroscopic study of nitroaromatic-smectite sorption mechanisms. Environ. Sci. Technol. 35: 4767-4772.
Johnston, C.T., S.A. Boyd, B.J. Teppen, and G. Sheng. 2004. Sorption of nitroaromatic compounds on clay surfaces. p. 155-189. In Handbook of layered materials. Auerbach S.M., Carrado K.A., Dutta P.K. (eds). Marcel-Dekker, New York.
Koskinen, W.C., and S.S. Harper. 1990. The retention process: Mechanisms. p. 51-78 In. Pesticides in the soil environment: Processes, impacts, and modeling. Soil
Science Society of America, Inc., Madison, WI.
Laird, D.A., E. Barriuso, R.H. Dowdy, and W.C. Koskinen. 1992. Adsorption of atrazine on smectites. Soil Sci. Soc. Am. J. 56: 62-67.
Levine, B.S., E.M. Furedi, D.E. Gordon, P.M. Lish, and J.J. Barkley. 1984. Subchronic toxicity of trinitrotoluene in Fischer-344 rats. Toxicol. 32: 253-265.
85
Li, A.Z., K.A. Marx, J. Walker, and D.L. Kaplan. 1997. Trinitrotoluene and metabolites
binding to humic acid. Environ. Sci. Technol. 31: 584-589.
Li, H., G. Sheng, B.J. Teppen, C.T. Johnston, and S.A. Boyd. 2003. Sorption and desorption of pesticides by clay minerals and humic acid-clay complexes. Soil. Sci. Soc. Am. J. 67: 122-131.
Mermut, A.R., and G. Lagaly. 2001. Baseline studies of the clay minerals society source
clays: Layer-charge determination and characteristics of those minerals containing 2:1 layers. Clays Clay Miner. 49: 393-397.
Nelson, D.W., and L.E. Sommers, 1996. Total carbon, organic carbon, and organic matter. p. 961-1010. In. Methods of soil analysis. Part 3. Chemical Methods. Sparks, D.L. (ed). SSSA Book Ser. No. 5. SSSA, Madison, WI.
Pelmenschikov, A., and J. Leszczynski. 1999. Adsorption of 1,3,5-trinitrobenzene on the
siloxane sites of clay minerals: Ab initio calculations of molecular models. J. Phys. Chem. B. 103: 6886-6890.
Pennell, K.D., 2002. Specific surface area. p. 295-316. In. Methods of soil analysis. Part 4. Physical Methods. Dane J.H. and Topp G.C (eds). SSSA Book Ser. No. 5. SSSA, Madison, WI.
Pennington, J.C., and J.M. Brannon. 2002. Environmental fate of explosives.
Thermochimica Acta 384: 163-172.
Renoux, A.Y., M. Sarrazin, J. Hawari, and G.I. Sunahara. 2000. Transformation of 2,4,6- trinitrotoluene in soil in the presence of the earthworm Eisenia Andrei. Environ. Toxicol. Chem. 19: 1473-1480.
Robidoux, P.Y., J. Hawari, S. Thiboutot, G. Ampleman, and G.I. Sunahara. 1999. Acute toxicity of 2,4,6-trinitrotoluene in earthworm (Eisenia andrei). Ecotox. Environ. Safe 44: 311-321.
Rocheleau, S., R.G. Kuperman, M. Martel, L. Paquet, G. Bardai, S. Wong, M. Sarrazin,
S. Dodard, P. Gong, J. Hawari, R.T. Checkai, and G.I. Sunahara. 2006. Phytotoxicity of nitroaromatic energetic compounds freshly amended or weathered and aged in sandy loam soil. Chemosphere 62: 545-558.
Rodgers, J.D., and N.J. Brunce. 2001. Treatment methods for the remediation of
nitroaromatic explosives. Water. Res. 35: 2101-2111.
Schnitzer M., 1986. Binding of humic substances by soil mineral colloids. p. 77-101. In Interactions of soil minerals with natural organics and microbes. Huang P.M., M. Schnitzer (eds.) Soil Science Society of America Inc., Madison, WI.
86
Spain J.C. 2000. Introduction. p. 1-5. In Biodegradation of nitroaromatic compounds and
explosives. Spain, J.C. (ed). Boca Raton: Lewis Publishers, New York.
Sposito, G., N.T. Skipper, R. Sutton, S.-H. Park, A.K. Soper, and J.A. Greathouse. 1999. Surface geochemistry of the clay minerals. Proc. Natl. Acad. Sci. 96: 3358-3364.
Steevens, J.A., B.M. Duke, G.R. Lotufo, and T.S. Bridges. 2002. Toxicity of the explosives 2,4,6-trinitrotoluene, hexahydro-1,3,5-trinitro-1,3,5-triazine, and octahydro-1,3,5,7-tetranitro-1,3,5,7-tetrazocine in sediments to Chironomus tentans and Hyalella azteca: Low-dose hormesis and high-dose mortality. Environ. Toxicol. Chem. 21:1475-1482.
Thorn, K.A., J.C. Pennington, and C.A. Hayes. 2002. 15N NMR investigation of the
reduction and binding of TNT in an aerobic bench scale reactor simulating windrow composting. Environ. Sci. Technol. 36: 3797-3805.
van Olphen, H., and J.J. Fripiat. 1979. Data handbook for clay minerals and other non- metallic minerals. Pergamon, Oxford, UK.
van Oss, C.J., and R.F. Giese. 1995. The hydrophilicity and hydrophobicity of clay minerals. Clays Clay Miner. 43: 474-477.
Wang, C.J., S. Thiele, and J.-M. Bollag. 2002. Interaction of 2,4,6-trinitrotoluene (TNT) and 4-amino-2,6-dinitrotoluene with humic monomers in the presence of oxidative enzymes. Arch. Environ. Contam. Toxicol. 42: 1-8.
Wang, K., and B. Xing. 2005. Structural and sorption characteristics of adsorbed humic acid on clay minerals. J. Environ. Qual. 34: 342-349.
Weissmahr, K.W., S.B. Haderlein, and R.P. Schwarzenbach. 1998. Complex formation of soil minerals with nitroaromatic explosives and other pi-acceptors. Soil Sci. Soc. Am. J. 62: 369-378.
Wilke, B.M., A. Gattinger, E. Froich, L. Zelles, and P. Gong. 2004. Phospholipid fatty acid composition of a 2,4,6-trinitrotoluene contaminated soil and an uncontaminated soil as affected by a humification remediation process. Soil Biol. Biochem. 36: 725-729.
Wu, W. 2001. Baseline studies of the clay minerals society source clays: Colloid and surface phenomena. Clays Clay Miner. 49: 446-452.
Xue, S.K., I.K. Iskandar, and H.M. Selim. 1995. Adsorption-desorption of 2,4,6- trinitrotoluene and hexahydro-1,3,5-trinitro-1,3,5-triazine in soils. Soil Sci. 160: 317-327.
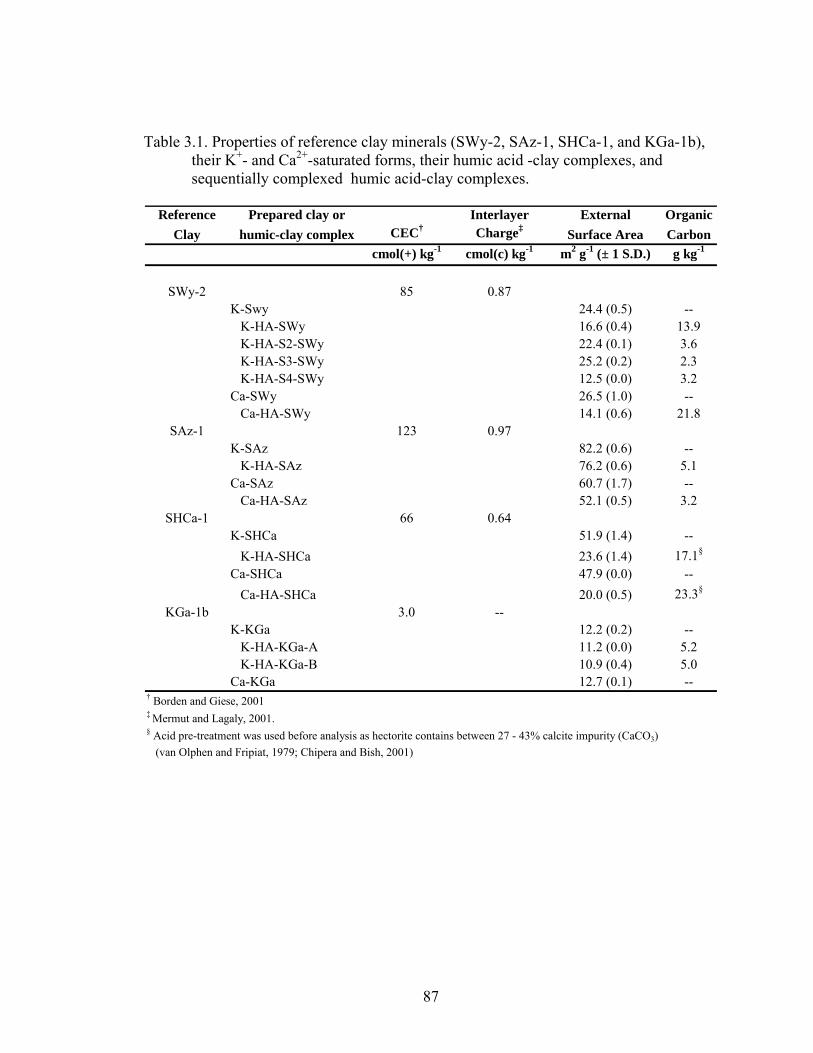
87
Table 3.1. Properties of reference clay minerals (SWy-2, SAz-1, SHCa-1, and KGa-1b),
their K+- and Ca2+-saturated forms, their humic acid -clay complexes, and sequentially complexed humic acid-clay complexes.
Reference Prepared clay or Interlayer External Organic
Clay humic-clay complex CEC† Charge‡ Surface Area Carboncmol(+) kg-1 cmol(c) kg-1 m2 g-1 (± 1 S.D.) g kg-1
SWy-2 85 0.87K-Swy 24.4 (0.5) -- K-HA-SWy 16.6 (0.4) 13.9 K-HA-S2-SWy 22.4 (0.1) 3.6 K-HA-S3-SWy 25.2 (0.2) 2.3 K-HA-S4-SWy 12.5 (0.0) 3.2Ca-SWy 26.5 (1.0) -- Ca-HA-SWy 14.1 (0.6) 21.8
SAz-1 123 0.97K-SAz 82.2 (0.6) -- K-HA-SAz 76.2 (0.6) 5.1Ca-SAz 60.7 (1.7) -- Ca-HA-SAz 52.1 (0.5) 3.2
SHCa-1 66 0.64K-SHCa 51.9 (1.4) -- K-HA-SHCa 23.6 (1.4) 17.1§
Ca-SHCa 47.9 (0.0) -- Ca-HA-SHCa 20.0 (0.5) 23.3§
KGa-1b 3.0 --K-KGa 12.2 (0.2) -- K-HA-KGa-A 11.2 (0.0) 5.2 K-HA-KGa-B 10.9 (0.4) 5.0Ca-KGa 12.7 (0.1) --
† Borden and Giese, 2001‡ Mermut and Lagaly, 2001.§ Acid pre-treatment was used before analysis as hectorite contains between 27 - 43% calcite impurity (CaCO3) (van Olphen and Fripiat, 1979; Chipera and Bish, 2001)
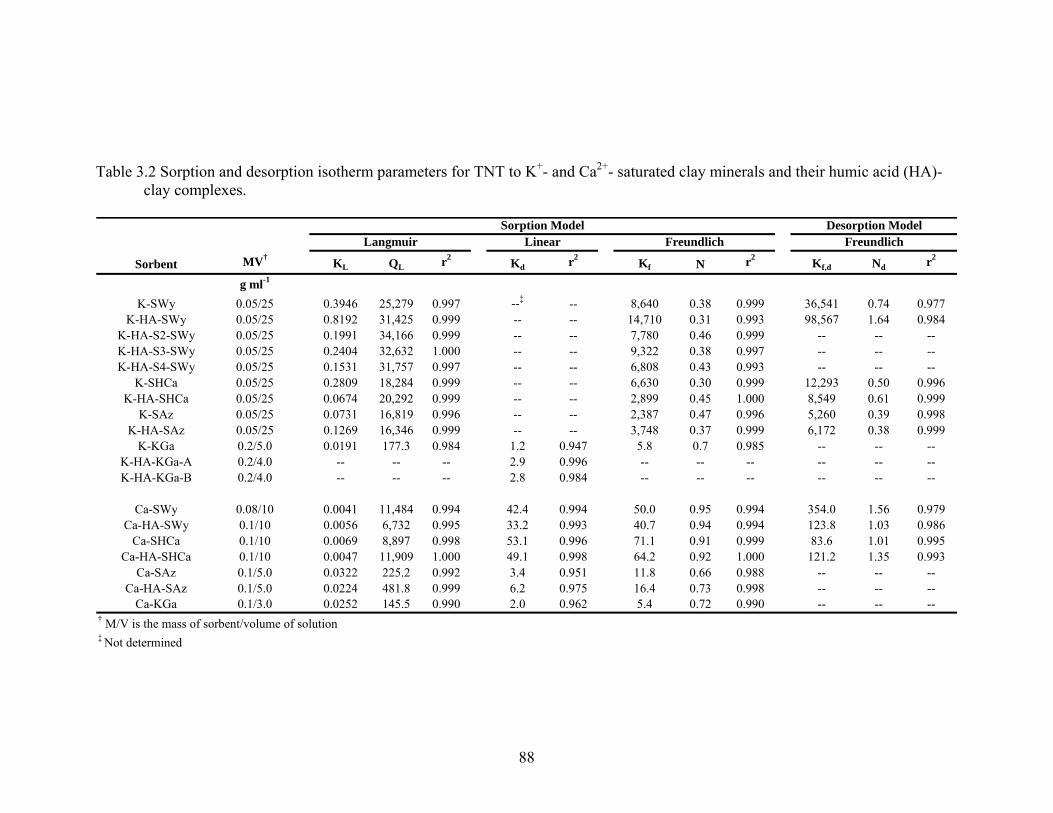
88
Table 3.2 Sorption and desorption isotherm parameters for TNT to K+- and Ca2+- saturated clay minerals and their humic acid (HA)-
clay complexes.
Sorbent MV† KL QL r2 Kd r2 Kf N r2 Kf,d Nd r2
g ml-1
K-SWy 0.05/25 0.3946 25,279 0.997 --‡ -- 8,640 0.38 0.999 36,541 0.74 0.977K-HA-SWy 0.05/25 0.8192 31,425 0.999 -- -- 14,710 0.31 0.993 98,567 1.64 0.984
K-HA-S2-SWy 0.05/25 0.1991 34,166 0.999 -- -- 7,780 0.46 0.999 -- -- --K-HA-S3-SWy 0.05/25 0.2404 32,632 1.000 -- -- 9,322 0.38 0.997 -- -- --K-HA-S4-SWy 0.05/25 0.1531 31,757 0.997 -- -- 6,808 0.43 0.993 -- -- --
K-SHCa 0.05/25 0.2809 18,284 0.999 -- -- 6,630 0.30 0.999 12,293 0.50 0.996K-HA-SHCa 0.05/25 0.0674 20,292 0.999 -- -- 2,899 0.45 1.000 8,549 0.61 0.999
K-SAz 0.05/25 0.0731 16,819 0.996 -- -- 2,387 0.47 0.996 5,260 0.39 0.998K-HA-SAz 0.05/25 0.1269 16,346 0.999 -- -- 3,748 0.37 0.999 6,172 0.38 0.999
K-KGa 0.2/5.0 0.0191 177.3 0.984 1.2 0.947 5.8 0.7 0.985 -- -- --K-HA-KGa-A 0.2/4.0 -- -- -- 2.9 0.996 -- -- -- -- -- --K-HA-KGa-B 0.2/4.0 -- -- -- 2.8 0.984 -- -- -- -- -- --
Ca-SWy 0.08/10 0.0041 11,484 0.994 42.4 0.994 50.0 0.95 0.994 354.0 1.56 0.979Ca-HA-SWy 0.1/10 0.0056 6,732 0.995 33.2 0.993 40.7 0.94 0.994 123.8 1.03 0.986
Ca-SHCa 0.1/10 0.0069 8,897 0.998 53.1 0.996 71.1 0.91 0.999 83.6 1.01 0.995Ca-HA-SHCa 0.1/10 0.0047 11,909 1.000 49.1 0.998 64.2 0.92 1.000 121.2 1.35 0.993
Ca-SAz 0.1/5.0 0.0322 225.2 0.992 3.4 0.951 11.8 0.66 0.988 -- -- --Ca-HA-SAz 0.1/5.0 0.0224 481.8 0.999 6.2 0.975 16.4 0.73 0.998 -- -- --
Ca-KGa 0.1/3.0 0.0252 145.5 0.990 2.0 0.962 5.4 0.72 0.990 -- -- --† M/V is the mass of sorbent/volume of solution
Desorption Model
‡ Not determined
Sorption ModelLangmuir Linear Freundlich Freundlich
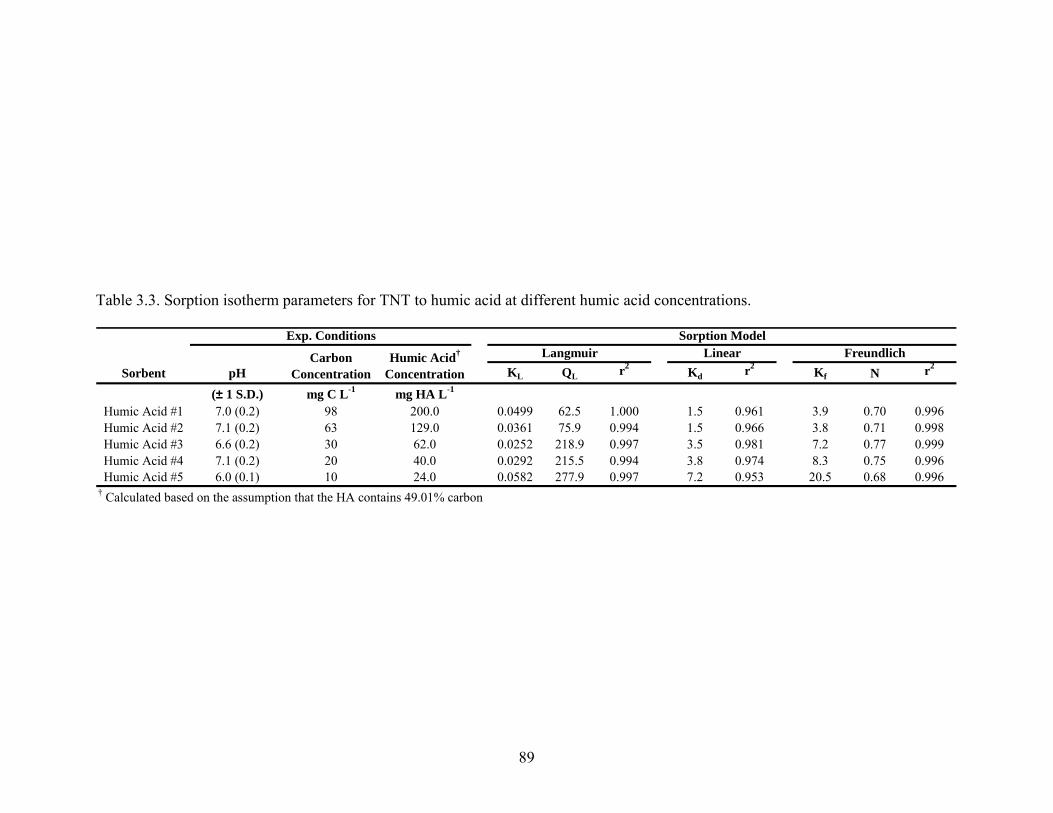
89
Table 3.3. Sorption isotherm parameters for TNT to humic acid at different humic acid concentrations.
Sorbent pH KL QL r2 Kd r2 Kf N r2
(± 1 S.D.) mg C L-1 mg HA L-1
Humic Acid #1 7.0 (0.2) 98 200.0 0.0499 62.5 1.000 1.5 0.961 3.9 0.70 0.996Humic Acid #2 7.1 (0.2) 63 129.0 0.0361 75.9 0.994 1.5 0.966 3.8 0.71 0.998Humic Acid #3 6.6 (0.2) 30 62.0 0.0252 218.9 0.997 3.5 0.981 7.2 0.77 0.999Humic Acid #4 7.1 (0.2) 20 40.0 0.0292 215.5 0.994 3.8 0.974 8.3 0.75 0.996Humic Acid #5 6.0 (0.1) 10 24.0 0.0582 277.9 0.997 7.2 0.953 20.5 0.68 0.996
† Calculated based on the assumption that the HA contains 49.01% carbon
Exp. Conditions
Carbon Concentration
Humic Acid†
Concentration
Sorption ModelLangmuir Linear Freundlich
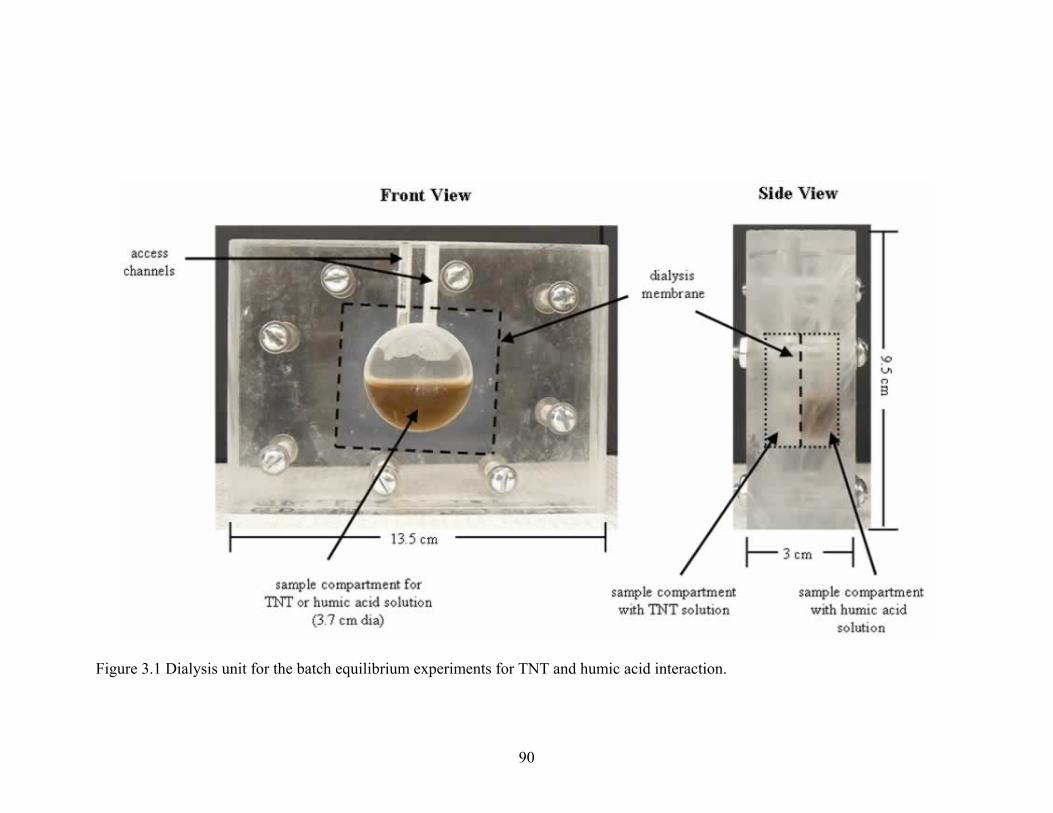
90
Figure 3.1 Dialysis unit for the batch equilibrium experiments for TNT and humic acid interaction.
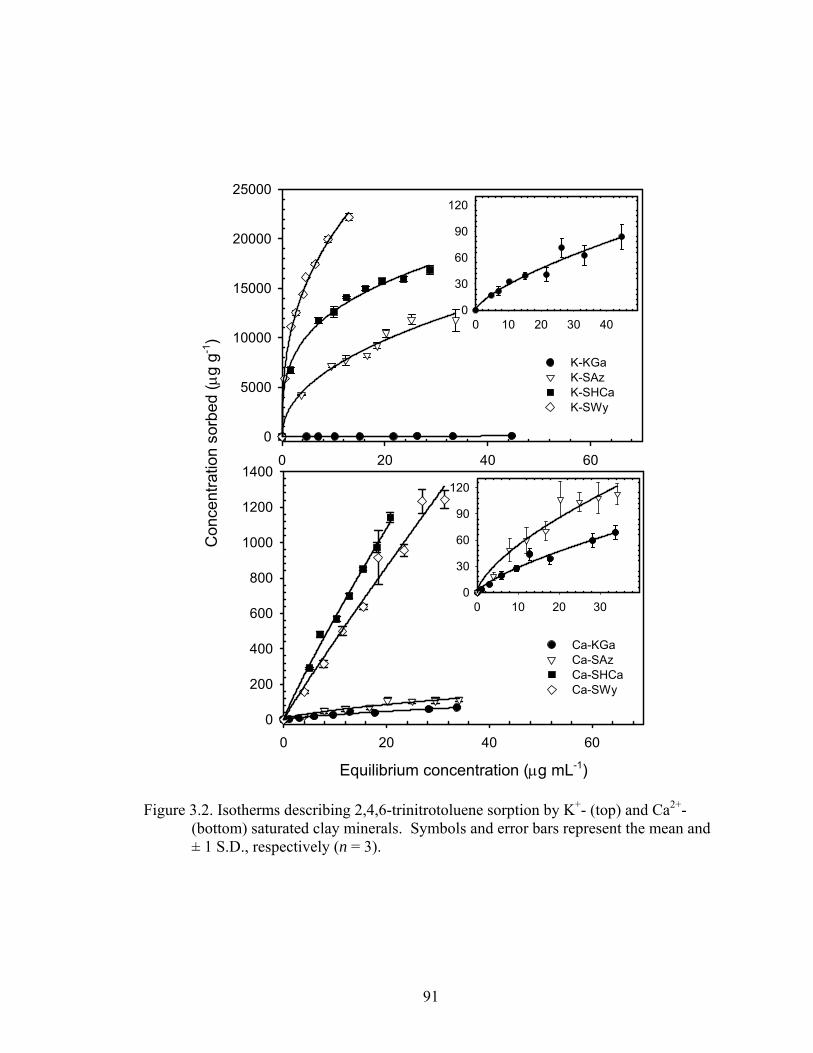
91
0 20 40 60
0
5000
10000
15000
20000
25000
K-KGaK-SAzK-SHCaK-SWy
0 10 20 30 400
30
60
90
120
Equilibrium concentration (μg mL-1)
0 20 40 60
Con
cent
ratio
n so
rbed
(μg
g-1)
0
200
400
600
800
1000
1200
1400
Ca-KGaCa-SAzCa-SHCaCa-SWy
0 10 20 300
30
60
90
120
Figure 3.2. Isotherms describing 2,4,6-trinitrotoluene sorption by K+- (top) and Ca2+- (bottom) saturated clay minerals. Symbols and error bars represent the mean and ± 1 S.D., respectively (n = 3).
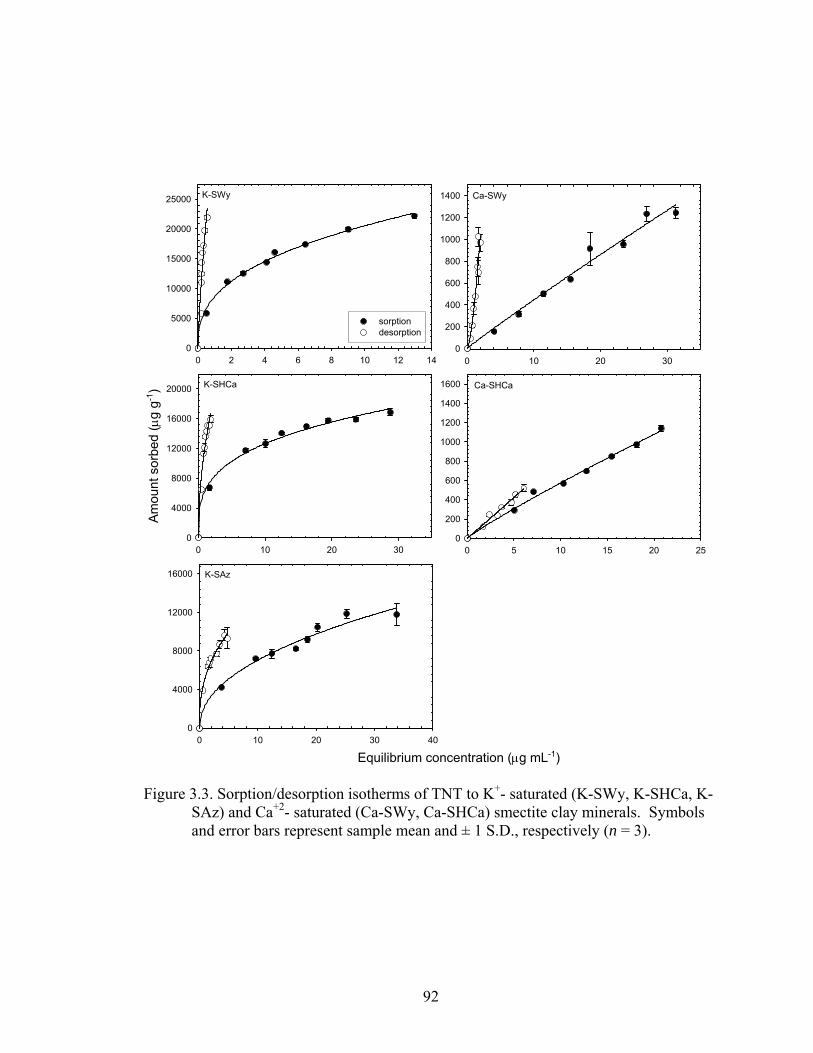
92
0 2 4 6 8 10 12 140
5000
10000
15000
20000
25000
sorptiondesorption
K-SWy
Equilibrium concentration (μg mL-1)0 10 20 30 40
0
4000
8000
12000
16000 K-SAz
0 10 20 30
Amou
nt s
orbe
d (μ
g g-1
)
0
4000
8000
12000
16000
20000 K-SHCa
0 10 20 300
200
400
600
800
1000
1200
1400 Ca-SWy
0 5 10 15 20 250
200
400
600
800
1000
1200
1400
1600 Ca-SHCa
Figure 3.3. Sorption/desorption isotherms of TNT to K+- saturated (K-SWy, K-SHCa, K-
SAz) and Ca+2- saturated (Ca-SWy, Ca-SHCa) smectite clay minerals. Symbols and error bars represent sample mean and ± 1 S.D., respectively (n = 3).
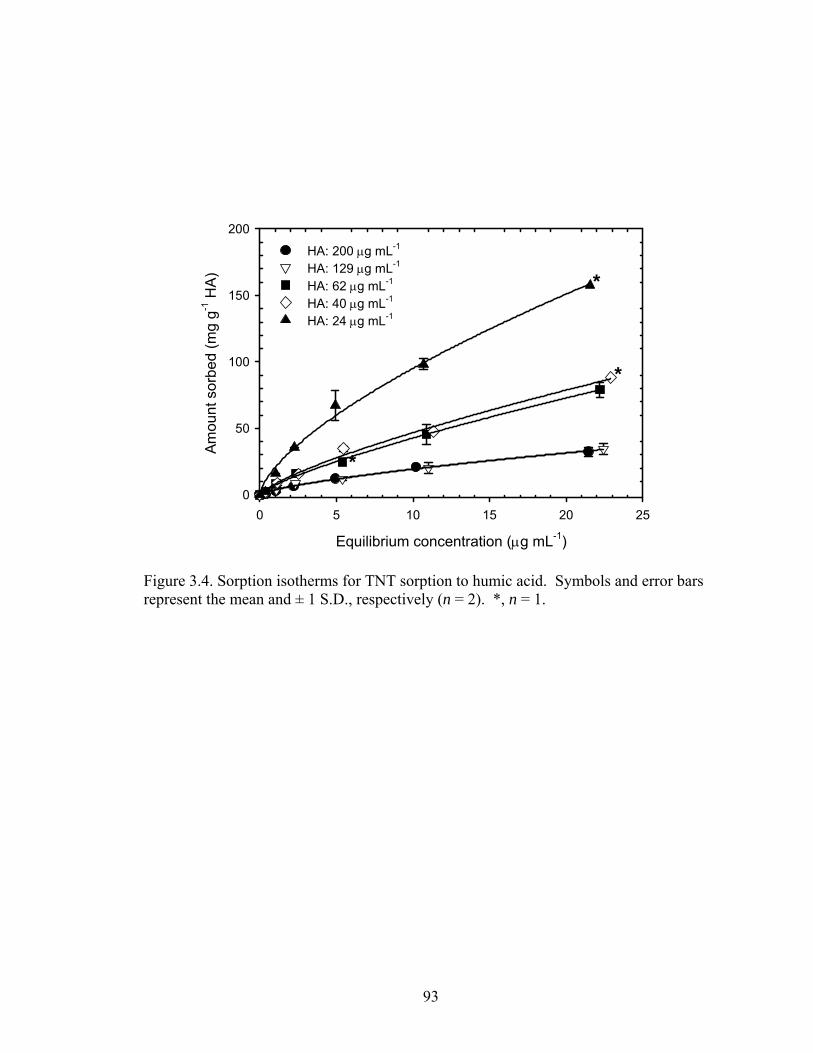
93
Equilibrium concentration (μg mL-1)
0 5 10 15 20 25
Amou
nt s
orbe
d (m
g g-1
HA)
0
50
100
150
200
HA: 200 μg mL-1
HA: 129 μg mL-1
HA: 62 μg mL-1
HA: 40 μg mL-1
HA: 24 μg mL-1
*
*
*
Figure 3.4. Sorption isotherms for TNT sorption to humic acid. Symbols and error bars represent the mean and ± 1 S.D., respectively (n = 2). *, n = 1.
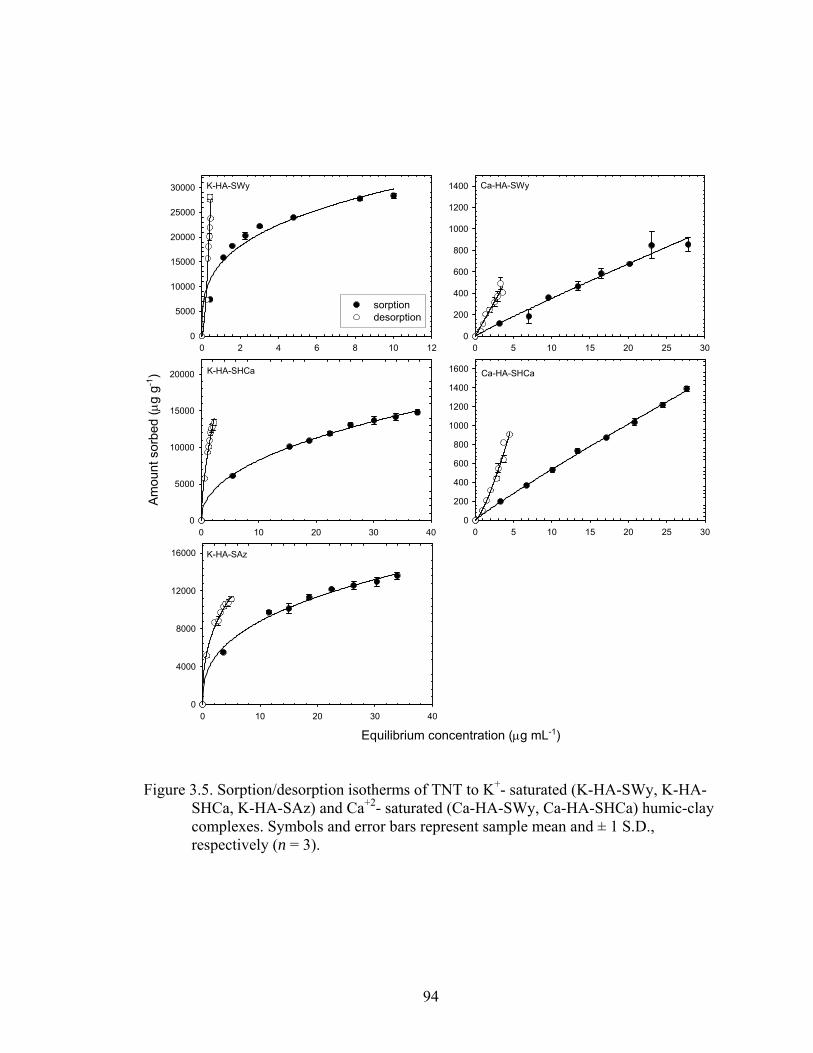
94
Equilibrium concentration (μg mL-1)0 10 20 30 40
0
4000
8000
12000
16000 K-HA-SAz
0 10 20 30 40
Am
ount
sor
bed
(μg
g-1)
0
5000
10000
15000
20000 K-HA-SHCa
0 5 10 15 20 25 300
200
400
600
800
1000
1200
1400
1600 Ca-HA-SHCa
0 5 10 15 20 25 300
200
400
600
800
1000
1200
1400 Ca-HA-SWy
0 2 4 6 8 10 120
5000
10000
15000
20000
25000
30000
sorptiondesorption
K-HA-SWy
Figure 3.5. Sorption/desorption isotherms of TNT to K+- saturated (K-HA-SWy, K-HA-
SHCa, K-HA-SAz) and Ca+2- saturated (Ca-HA-SWy, Ca-HA-SHCa) humic-clay complexes. Symbols and error bars represent sample mean and ± 1 S.D., respectively (n = 3).
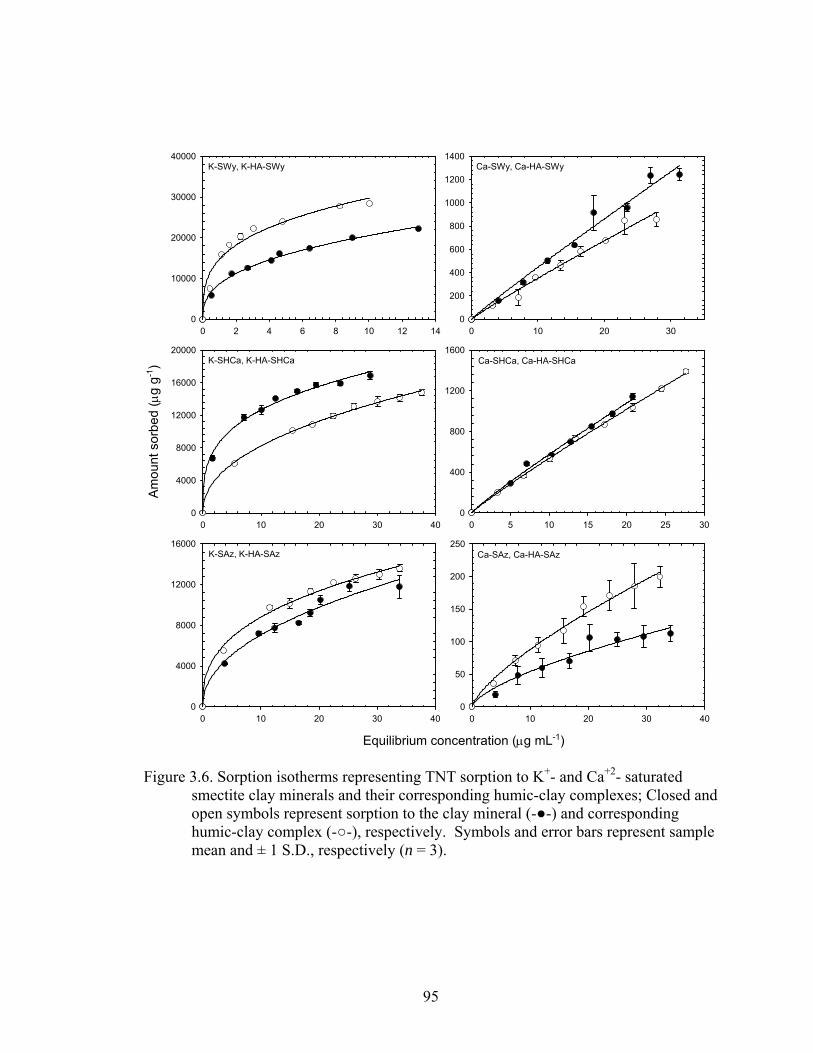
95
0 2 4 6 8 10 12 140
10000
20000
30000
40000K-SWy, K-HA-SWy
0 10 20 300
200
400
600
800
1000
1200
1400Ca-SWy, Ca-HA-SWy
0 10 20 30 40
Am
ount
sor
bed
(μg
g-1)
0
4000
8000
12000
16000
20000K-SHCa, K-HA-SHCa
0 5 10 15 20 25 300
400
800
1200
1600Ca-SHCa, Ca-HA-SHCa
Equilibrium concentration (μg mL-1)
0 10 20 30 400
4000
8000
12000
16000K-SAz, K-HA-SAz
0 10 20 30 400
50
100
150
200
250Ca-SAz, Ca-HA-SAz
Figure 3.6. Sorption isotherms representing TNT sorption to K+- and Ca+2- saturated
smectite clay minerals and their corresponding humic-clay complexes; Closed and open symbols represent sorption to the clay mineral (-●-) and corresponding humic-clay complex (-○-), respectively. Symbols and error bars represent sample mean and ± 1 S.D., respectively (n = 3).
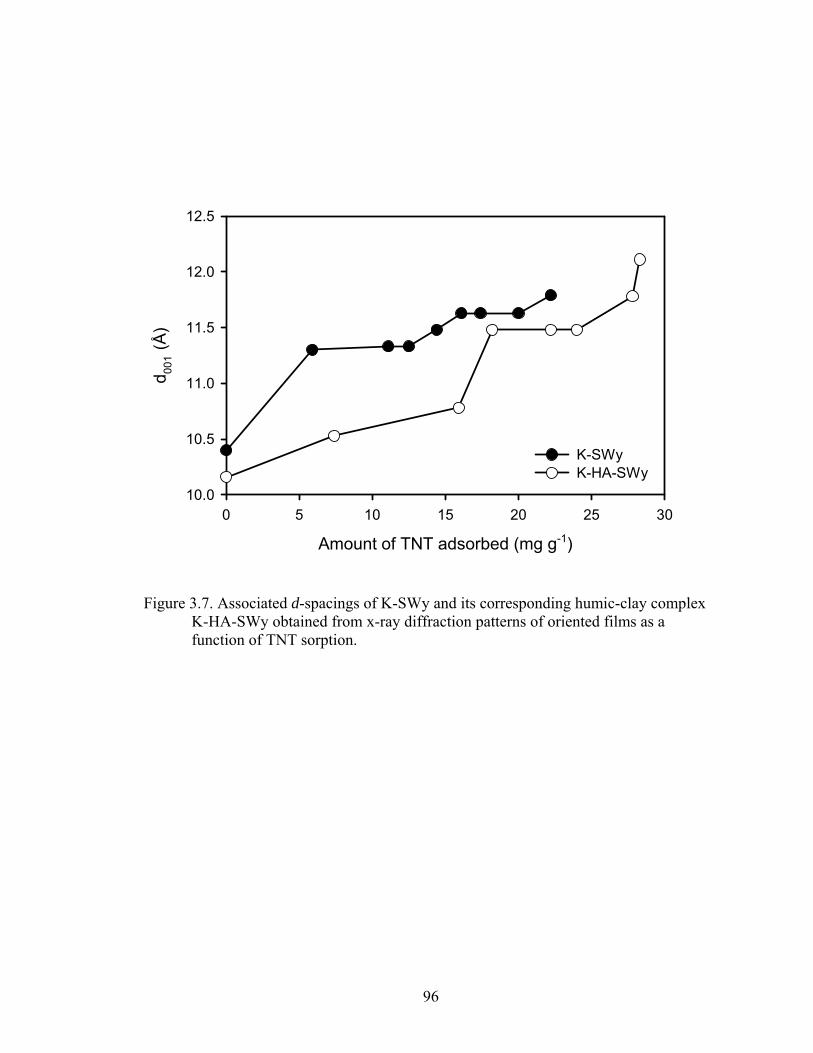
96
Amount of TNT adsorbed (mg g-1)
0 5 10 15 20 25 30
d 001 (
Å)
10.0
10.5
11.0
11.5
12.0
12.5
K-SWyK-HA-SWy
Figure 3.7. Associated d-spacings of K-SWy and its corresponding humic-clay complex K-HA-SWy obtained from x-ray diffraction patterns of oriented films as a function of TNT sorption.
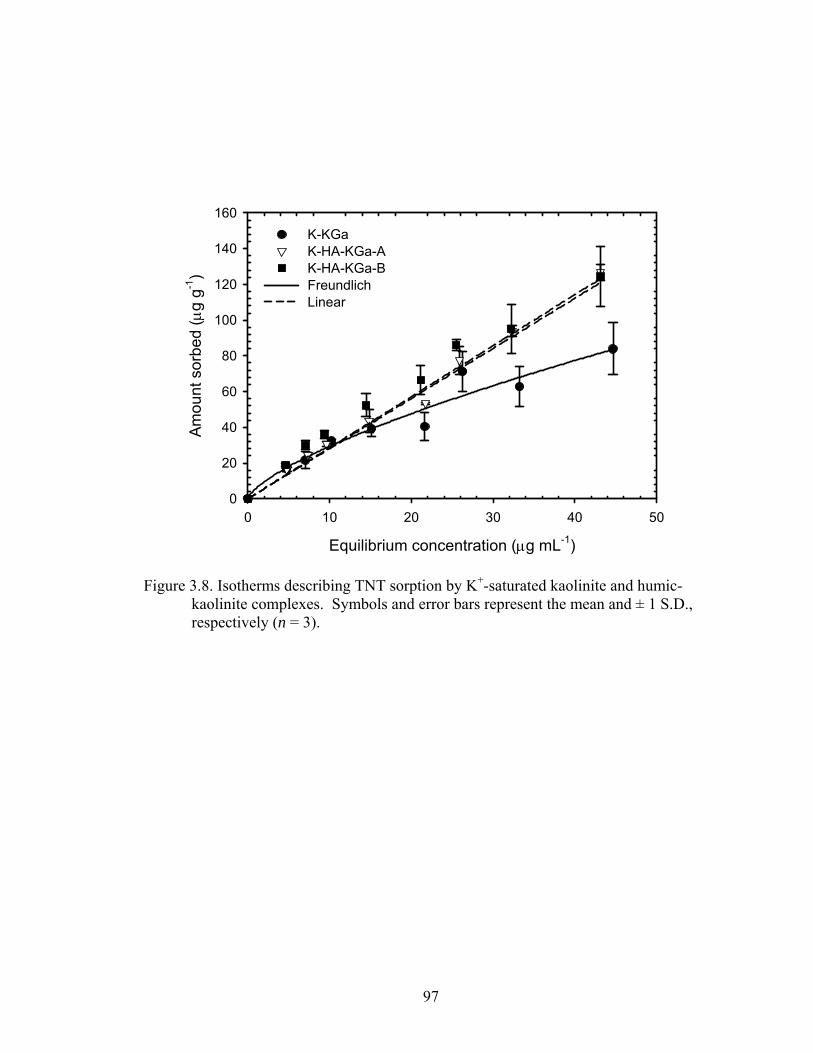
97
Equilibrium concentration (μg mL-1)
0 10 20 30 40 50
Amou
nt s
orbe
d (μ
g g-1
)
0
20
40
60
80
100
120
140
160K-KGaK-HA-KGa-AK-HA-KGa-BFreundlichLinear
Figure 3.8. Isotherms describing TNT sorption by K+-saturated kaolinite and humic-
kaolinite complexes. Symbols and error bars represent the mean and ± 1 S.D., respectively (n = 3).
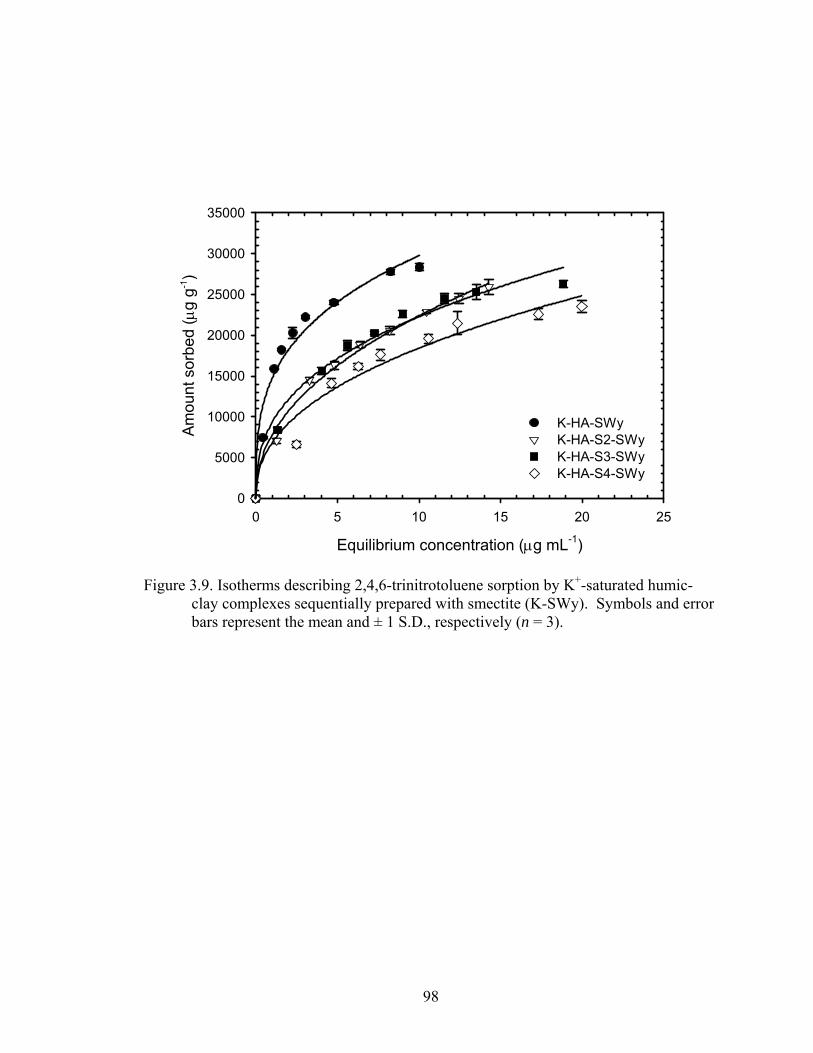
98
Equilibrium concentration (μg mL-1)
0 5 10 15 20 25
Amou
nt s
orbe
d (μ
g g-1
)
0
5000
10000
15000
20000
25000
30000
35000
K-HA-SWyK-HA-S2-SWyK-HA-S3-SWyK-HA-S4-SWy
Figure 3.9. Isotherms describing 2,4,6-trinitrotoluene sorption by K+-saturated humic-
clay complexes sequentially prepared with smectite (K-SWy). Symbols and error bars represent the mean and ± 1 S.D., respectively (n = 3).
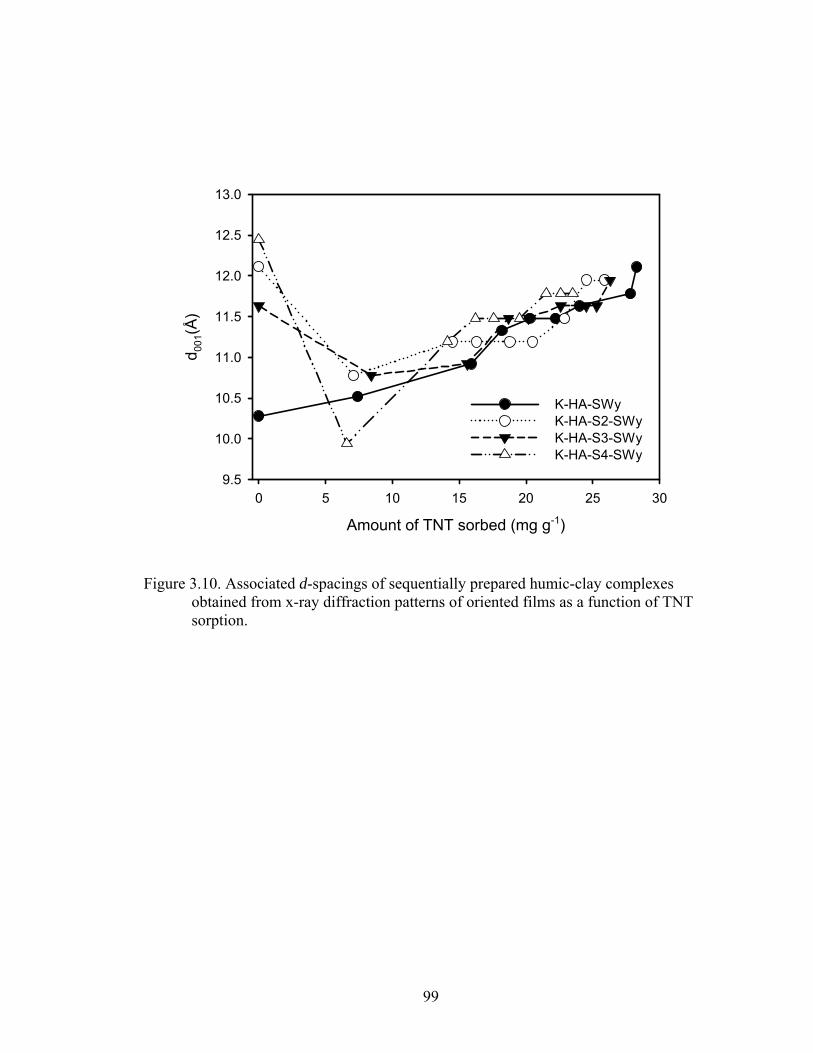
99
Amount of TNT sorbed (mg g-1)
0 5 10 15 20 25 30
d 001(
Å)
9.5
10.0
10.5
11.0
11.5
12.0
12.5
13.0
K-HA-SWyK-HA-S2-SWyK-HA-S3-SWyK-HA-S4-SWy
Figure 3.10. Associated d-spacings of sequentially prepared humic-clay complexes obtained from x-ray diffraction patterns of oriented films as a function of TNT sorption.
100
CHAPTER 4
IMPACT OF SIZE FRACTIONATION METHODS ON
PROPERTIES OF SOIL AGGREGATES
Pillar, G.D., K. Xia, J. Kim, J. Reeves, and M. Williams. To be submitted to Soil Biology and Biochemistry.
101
Abstract
The effect of wet-sieving and dry-sieving methods on the characterization of soil
properties and processes within soil aggregates was evaluated on three soils with
contrasting clay mineralogy and organic matter content. The wet-sieving method yielded
a greater distribution of soil aggregates less than 250 μm and a significant reduction in
the 500 – 2000 μm sized aggregates for all three soils tested. The difference in aggregate
size distribution contributed to differences in the physical composition of soil aggregates
between the two sieving methods and, therefore resulted in differences in other soil
properties. Although differences in total carbon within soil aggregates were not as
profound, observed significant differences in the CEC, microbial biomass, and microbial
community structure between the two sieving methods could be explained based on the
clay mineralogy and dominate aggregate stabilization mechanism for each soil.
Specifically, the sieving method used had the most significant impact on the 75 – 250 μm
aggregate size fraction regardless of soil type. Our results suggest that wet-sieving is
more disruptive than the dry-sieving method and, therefore studies which are designed to
characterize microbially mediated functions of soil aggregates should use dry-sieving
rather than wet-sieving techniques. Regardless of the analysis being conducted, the
inherent clay mineralogy, soil organic matter content, and sand content of the soil should
also be considered in the selection of the appropriate sieving technique and the
interpretation and extrapolation of the results.
Keywords: soil aggregates; microbial biomass; microbial community structure; aggregate
fractionation procedures
102
1. Introduction
Over the past several decades it has been shown that soils can be grouped into
distinct aggregate fractions that often show meaningful relationships between ecological
function and soil properties such as organic matter dynamics and C and N pool sizes
(Tisdall and Oades 1982; Monrozier et al., 1991; Brady and Weil, 1999). Numerous
studies and reviews have proposed that earthworms, micro-organisms, binding agents,
and land management practices can influence various processes and properties at the
aggregate level (Shipitalo and Protz, 1989; Dexter, 1988; Kay, 1990; Oades and Waters,
1991; Six et al., 1998; Six et al., 2000a). However, research focused on the
characterization of soil aggregates and the processes associated with them have often
produced conflicting results, possibly a consequence of different aggregate separation
methods. For example, the rate of denitrification, amount of water soluble carbon, total
carbon and overall weight distribution of soil aggregates are different when assessed
using dry-sieving compared to wet-sieving procedures (Beauchamp and Seech, 1990;
Puget et al., 1995; Angers and Giroux, 1996). As a result, some have suggested that the
links between aggregate size and various soil properties and biological processes are
merely an artifact of the soil fractionation procedure and not related to intrinsic properties
specific to an aggregate size fraction (Ashman, et al., 2003).
Typically, the methods used to fractionate soil try to simulate disruptive events
that could occur in the field (Young and Ritz, 2000). Wet-sieving is one of the more
common fractionation methods which involves the rapid wetting of air-dry samples in
water and is supposed to simulate conditions of severe water stress (Nimmo and Perkins,
2002), and thus provide information about the water-stable aggregates and their
103
associated properties/processes. There is also considerable interest in the characterization
of soil aggregates, whether relatively stable or unstable, to better understand processes
related to soil organic matter dynamics (Bossuyt et al., 2005), environmental fate of
contaminants (Krauss and Wilcke, 2002; DeSutter et. al., 2003), and biological soil
properties (Stemmer et. al., 1998). One of the more common concerns surrounding
research on these processes is whether wet-sieving methods may create their own
artifacts that may misrepresent the microbial community or the chemical properties of an
aggregate fraction (Amato and Ladd, 1980; Ahmed and Oades, 1984; Miller and Dick,
1995). In contrast, dry sieving methods may provide a suitable alternative to overcoming
the potential artifacts associated with wet-sieving. There is however limited information
on how wet-sieving compares to dry sieving methods for the separation and collection of
soil aggregates, nor information on how these methods might influence the apparent
distribution of soil properties and their associated microbial communities.
The objective of this study was to examine how two different soil fractionation
techniques, wet- and dry-sieving, may impact the characterization of soil aggregates of
various sizes. Specifically, we focused on how the characterization of biological soil
properties such as microbial biomass and soil community structure may be effected by
the fractionation procedure used. We hypothesized that (1) wet-sieving would result in a
decrease in total carbon and cation exchange capacity due to a decrease in
macroaggregates relative to dry-sieving and that (2) wet-sieving would result in a
decrease in the microbial biomass and significantly alter the microbial community
structure as identified by fatty acid methyl-ester (FAME) analysis.
104
2. Methods and Materials
2.1 Sample collection and preparation
Soil samples were collected from three sites; a Theresa Silt loam (fine-loamy
mixed mesic Typic Hapludalf) from New Berlin (Waukesha County), WI, an Appling
sandy loam (fine kaolinitic thermic Typic Kanhapludult) from Bogart (Oconee County),
GA, and a Marlette-Oshtemo Complex (mesic Typic hapludalf, Alto) from Freeport
(Kent County), MI. Throughout the paper, the soils will be referred to as Theresa,
Appling, and Marlette-Oshtemo, respectively. Each site was sampled within a 1-m2 area
by carefully loosening the upper 15 cm of soil with a square-bladed spade from below to
preserve the soil’s natural aggregation. The soil samples were stored at 4ºC until needed
for sieving and analysis. General physical and chemical soil data are presented in Table
4.1. The water content of soil at each sampling site was 85%, 82%, and 81% of field
capacity (1/3 bar) for the Theresa, Appling, and Marlette-Oshtemo soils, respectively.
2.2 Sieving procedures
To minimize the impact of storage or handling before sieving, all three soils were
handled carefully and equally before the experiment. Soils were pre-sieved through a 4-
mm mesh. Soil material larger than 4 mm, which consisted primarily of rock debris and
plant material, were discarded. This pre-sieving of field-moist soil is considered less
disruptive to the relatively ‘unstable’ aggregates (Denef, et al., 2002).
For the wet-sieving treatment, the Yoder procedure was followed using a
mechanical sieving apparatus described by Kemper & Rosenau (1986). Field moist soil
was placed on a nest of sieves in order to obtain four aggregate size fractions: 2000 –
105
4000, 500 – 2000, 250 – 500, and 75 – 250 μm. The nest of sieves was placed in a
holder, suspended in a container of water, lowered to the point where the soil sample on
the top screen was just covered with water, and allowed to sit for several minutes. The set
of sieves were then set into an up and down motion whereby the soils were alternately
immersed and removed from the water at a rate of 30 cycles per minute over a 10 min
period.
Using the same nest of sieves the dry sieving procedure was conducted with the
use of a mechanical shaker (Tyler Ro-Tap© RX-29, Boca Raton, FL, USA) Previous
experiments showed no significant difference in the physical weight distribution of dry-
sieved aggregates sieved for 3 min. and longer (up to 10 min.) 10 minutes. A 3 minute
time was thus chosen to expedite the process of aggregate separation.
After sieving (wet- and dry-sieving), the soil aggregates were frozen and freeze-
dried and kept at 4º C until analysis. Freeze drying as opposed to air or oven drying has
been proposed as a better method to obtain dry aggregates because freeze drying
maintains the intricate structural network which is more representative of field conditions
(Chen & Schnitzer, 1989). Freezing and freeze-drying should also help to preserve the
biological properties of the soils (Schutter and Dick, 2000).
2.3 Soil characterization
Characterization of physical and chemical soil properties was conducted using
methods approved by the Soil Science Society of America (Madison, WI). Total C in the
bulk soil and each freeze dried soil fraction was determined with a Shimadzu TOC 5050
total carbon analyzer (Columbia, MD, USA) fitted with an SSM5000A solid sample
106
module (Nelson and Sommers, 1996). Cation exchange capacity (CEC) was determined
using the unbuffered salt extraction method (Sumner & Miller; 1996). Soil pH was
measured using the 0.01 M CaCl2 (2:1 ratio) saturated paste method (Thomas, 1996)
Particle size distribution (PSD) was determined using the pipette method (Gee & Or,
2002).
2.4 Microbial community characterization
Fatty acid methyl-ester (FAME) extractions were conducted according to the
method by Schutter and Dick (2000), with a few modifications. Briefly, three grams of
soil from each aggregate size fraction and un-sieved soil were placed in a 40 mL
scintillation vial. Fifteen milliliters of 0.2 M KOH dissolved in methanol were added to
each sample and the vials were then sonicated for 1 h in a sonicating bath. Three mL of 1
M acetic acid was added in order to neutralize the KOH and the samples were mixed
using a vortex for 1 min. Ten milliliters of hexane was added and mixed on a vortex for
1 min. Five milliliters of deionized water was added to each sample to allow for better
phase separation of hexane from water. The samples were mixed a third time for 1 min
on a vortex. The vials were then placed in a centrifuge at 2500 rpm for 15 min. Five
milliliters of the hexane layer was removed using a pipette and placed in a 7-mL
disposable glass tube. The samples were dried to complete dryness under a gentle stream
of nitrogen gas. The remaining residue was then re-dissolved in 0.5 mL of hexane and
placed in a 2-mL GC vial for analysis of FAME on a gas chromatograph-mass
spectrometer (GC-MS).
107
The concentrated hexane extracts were analyzed for FAME on a GC/MS
(ThermoFinnigan Polaris Q/Trace GC) using electron impact ionization. An INNOWAX
capillary column (30 m, 0.25I.D., 0.25 μm film) from J&W Scientific (Palo Alto, CA,
USA) was used. The inlet and transfer line temperatures were maintained at 250º C. A
splitless injector was used with an injection volume of 1 μL. Helium was used as the
carrier gas at a constant flow rate of 1.2 mL min-1. The initial temperature of each run
began at 120º C followed by a 5º C min-1 ramp up to 250º C. The temperature was
maintained at 250º C for 1 min, then ramped at 10º C min-1 to a final temperature of 260º
C which was maintained for 3 min. The temperature of the MS ion source was kept at
200º C. Data were collected using a full scan mode with a mass range between 40 to 600
m/z. Fatty acid methyl esters were identified by comparison with 37 components FAME
(47885-U) and bacterial acid methyl-ester (BAME, 47080-U) standards purchased from
Supelco (Bellefonte, PA, USA).
Fatty acid methyl esters (FAME) are described by standard nomenclature
(IUPAC-IUB, 1977). The fatty acids are written as (A:BωC), where “A” refers to the
total number of carbon atoms, “B” refers to the number of unsaturated bonds, and “ωC”
indicates the number of carbon atoms between the aliphatic end of the molecule and the
first unsaturated bond. Methyl branching is designated by the appropriate number from
the aliphatic end as a prefix (e.g. 10Me18:0). Cyclopropane fatty acids have the prefix
“cy”, and finally the prefixes i and a for iso and anteiso methyl branching, respectively.
Two fatty acids (18:1w7 and 10Me18:0) merged into one peak and is denoted as 18:1+.
108
2.5 Calculations – sand correction
Typically, the contribution of sand in the formation of soil aggregates and to
chemical and biological soil properties is considered to be minimal and passive
(Marquez., et al. 2004). The inclusion of free sand or redistributed sand from unstable
aggregates can lead to a dilution effect of some properties (e.g. carbon content) in some
aggregate size fractions, particularly microaggregates (<250 μm). Since all three soils
have a considerable amount of sand (Table 4.1) we concluded that correction for the
aggregate-sized sand content would foster a more robust comparison that is more useful
for answering our questions regarding effects of sieving methods. All data presented are
on a sand-free basis unless otherwise noted.
The percentage of sand-free aggregates (SFA) within each size fraction in a 200 g
soil sample was calculated as:
100)(200
)()(x
gsandggsandgfractionsizei
SFAt
ith
i −−
= [1]
where i = 1 to 4, representing the four aggregate size fractions (4000 – 2000, 2000 – 500,
500 – 250, and 250 to 75 μm) and sandt represents the total sand in the 200 g soil
sample. The percentage of SFA smaller than 75 μm (SFA< 75 μm) was calculated as:
∑−=< im SFASFA 10075μ [2]
where i = 1 to 4, representing the four aggregate size fractions described in Eq. (1), which
are subtracted from 100%. Sand-free determinations of total carbon (TC), cation
exchange capacity (CEC), and total FAME (fatty acid methyl esters) were calculated as:
)()()(1
kgsandkgfractionsizeimgTCkgmgTC
ithi −
=− [3]
109
)()()(1
kgsandkgfractionsizeicmolcationsleexchangeab
kgcmolCECi
thC
Ci −=− [4]
)()(
)(18
11
gsandgfractionsizei
nmolFAMEgnmolFAMETotal
ith
ki −
=∑=− [5]
where i = 1 to 4, representing the four aggregate size fractions described in Eq. (1), k = 1
to 18, representing the eighteen different fatty acid methyl esters which can be related to
soil bacteria, fungi, actinomycetes and protozoa.
2.6 Statistical analysis
Differences in soil properties between wet- and dry-sieving techniques were
evaluated using ANOVA with the GLM procedure of SAS (Statistical Analysis Systems
Institute Inc., Cary, NC). Location (WI, GA, and MI), treatment (wet and dry), and
particle size were considered the explanatory variables. To satisfy the assumption of
constant variance, TC and CEC data were log-transformed. The Tukey multiple
comparison method was used within SAS to determine differences between sieving
methods for each soil and soil size fraction. Significance for all data, unless otherwise
noted, are reported at the p = 0.01 level.
All multivariate and nonparametric data analysis was conducted using PC-ORD v.
4.0 (McCune and Mefford, 1999). Nonmetric multidimensional scaling (NMS) based on
Sorensen’s distance was used to graphically represent FAME profile relationships. NMS
was first performed on combined FAME data of all three sampling locations. Because
there were large differences between the three soil types, the NMS analysis was re-run on
each individual soil type to better highlight the differences associated with sieving
110
method and aggregate particle size (see results). The FAME mole percentage data
underwent a general relativization before analysis in PC-ORD. Based on an initial Monte
Carlo test, the NMS was constrained to two axes using the “slow-and-thorough” autopilot
mode of NMS in PC-ORD. The autopilot mode uses the best of 40 runs with a random
starting configuration using the real data and 50 runs using randomized data for a Monte
Carlo test of significance. Adequate stability of the results was qualified for each run by
examining plots of stress versus the number of iterations.
A multi-response permutation procedure (MRPP) using Euclidean distance was
used to determine for differences in the mole percentages of FAMEs between the three
soil types and two sieving methods. MRPP is another nonparametric procedure which
can be used to test group differences and has the advantage of not requiring distributional
assumptions such as multivariate normality and homogeneity of variances which are
seldom met with ecological community data (McCune and Grace, 2002). ‘Indicator
species’ analysis was conducted to determine which FAMEs were important descriptors
of the sieving method and to further support NMS and MRPP analysis.
3. Results and Discussion
3.1 Aggregate size distribution and particle size analysis of aggregate size fractions
There have been numerous attempts to explain the biological activity and
structure of physically fractionated soil aggregates (Monrozier et al., 1991; Puget et al.,
2000; Six et al., 2000; Bossuyt et al., 2001; Denef et al., 2002), but there have been far
fewer studies that have tried to decipher the meaningfulness of biological-soil physical
fractionation associations by comparing results from two types of fractionation methods
111
in three different soils. In confirmation of a variety of other studies, our results
demonstrated that the fractionation method had a clear affect on the aggregate size
distribution (Beauchamp and Seech, 1990; Ashman et al., 2003; Limon-Ortega et al.
2006). Results from Figure 4.1 suggest that sieving method has a large impact on
aggregate size distribution, with wet sieving resulting in a greater mass of soil in the
smaller size fractions compared to dry sieving. For example, dry-sieving resulted in 91 to
97% of the sand-free weight distributed into an aggregate fraction that is larger than 250
μm in all three soils. Wet-sieving in contrast, resulted in a more even distribution of soil
into all aggregate sizes for all three soils with 46 to 74% of the sand-free soil weight
collected as macroaggregates greater than 250 μm (Figure. 4.1). The differences between
the weight of aggregates collected in wet compared to dry sieving is most striking in the
Marlette-Oshtemo soil. Dry-sieving resulted in 96% while wet-sieving resulted in 46%
of the sand-free soil weight collected as aggregates larger than 250 μm (Figure 4.1).
Similar to previous work, the differences observed in the distribution of
aggregates between sieving methods were related to aggregate fractions containing
inherently different properties (Beauchamp and Seech, 1990; Angers and Giroux, 1996;
Ashman et al., 2003). For instance, particle size analysis revealed numerous changes in
the percent of sand (coarse and fine) and clay for aggregate size fractions, and a shift in
aggregate size distribution (Table 4.2, Figure 4.1). These changes are most likely a result
of the disintegration of soil aggregates or the slaking of soil material from sand particles
during wet-sieving. The removal of soil material (silt, clay, fine sand) will result in an
enrichment of sand, which is very likely to be “loose” sand and not associated with soil
aggregates (Cambardella and Elliott, 1993). However, fine sand, which is more likely to
112
be within and a part of soil aggregates could be released during wet-sieving and
redistributed to a smaller size fractions (Elliott et al., 1991). The accumulation of fine-
sand in the < 250 μm size fractions would “dilute” the total carbon and microbial biomass
measurements possibly leading to a conclusion that wet-sieving had a negative impact on
total carbon and microbial biomass. This may be particularly relevant in sandy soils and
supports the observed difference in the aggregate size distribution between methods in
the Marlette-Oshtemo complex. These factors are especially important to consider when
comparing soil aggregate data obtained by using two different sieving methods or
comparing the impact of different treatments on properties/process of soil aggregates.
The redistribution of soil material, whether sand or silt and clay from
macroaggregates was also evident in the three soils as indicated by the increase in the
proportion of micro-aggregates (< 250 μm) obtained by wet- compared to dry-sieving
(Figure 4.1). Regardless of soil type, there was considerably less aggregate mass in the
two fractions associated with the 250 – 2000 μm size class in wet- compared to dry-
sieving. Compared to the larger size fraction (2000-4000 um), the 500 – 2000 μm size
fraction was unstable to the effects of wet-sieving, resulting in the re-distribution of soil
into smaller aggregate size fractions when compared to dry-sieving. Indeed, it has been
previously reported that aggregates larger macroaggregates (i.e. > than 2000 μm) may be
more stable than the smaller macroaggregate (i.e. 250 – 2000 μm) classes because of the
binding capacity associated with young organic matter (Puget et al., 1995 Angers and
Giroux, 1996; Six et al, 2004). However, it is not known if the accumulation of
aggregates in the 500-2000 μm size fraction of the dry sieved compared to the wet-sieved
soil is a consequence of the more disruptive wet-sieving forces or an artifact of high sand
113
content clogging the sieve and preventing smaller aggregates from passing through
during dry-sieving. In any event, the aggregate size distribution differed considerably
between the sieving methods regardless of the sand content of the soil.
Some of the largest effects were concentrated at the smaller aggregate sizes, and
in most cases the change in the physical distribution of the aggregates were mirrored by
changes in both the chemical and biological properties of the soils. However, our results
build upon these previous studies by directly linking the changes associated with the
separation methodology with the prevailing physical, chemical, and biological properties
of the separated fractions (Ahmed & Oades, 1984; Beauchamp & Seech, 1990; Angers
and Giroux, 1996).
3.2 Total carbon and cation exchange capacity
Contrary to other studies, total carbon on a sand-free basis did not differ within
soil aggregates between the two sieving methods for any of the soils (Puget et al., 1995;
Ashman et al., 2003). These apparent inconsistencies may be a consequence of
comparing sieving methods with sand-free rather than whole soil data. On a whole soil
basis wet-sieving resulted in a significant decrease (p < 0.05) in total carbon in
aggregates < 500 μm and an increase in aggregates > 500 μm compared to dry sieving
(Appendix B, Table B.1). In addition, contrary to other studies where aggregate
hierarchy was evident (Six et al., 2000c) and both dry- and wet-sieving was used to
obtain soil aggregates (Puget et al., 1995) we did not detect any significant difference in
total carbon between the aggregate size fractions for either sieving method for the
Theresa or Marlette-Oshtemo soils.
114
However, in the Appling soil there were strong differences in the distribution of
total carbon among dry- and wet-sieved soil aggregates, respectively (Table 4.3). This
result in the Appling but not the Theresa or Marlette-Oshtemo soil may be due inherent
differences in clay mineralogy. In Ultisols such as the Appling, oxides and 1:1 clay
minerals rather than humic-clay complexes are the dominant stabilizing agent and weak
organic matter – clay interactions may allow for the slaking or fractionation of organic
matter (Oades and Waters, 1991; Six et al., 2000b; Denef et al., 2002). While Theresa or
Marlette-Oshtemo soils mainly contain 2:1 clay minerals, resulting in stronger organic
matter-clay complexes.
Although wet-sieving resulted in a significant amount of soil to pass through the <
75 μm, a sub sample from this size fraction was analyzed for total carbon (data not
shown). A mass balance of the total carbon within soil aggregates compared with the
whole soil measurements was conducted to determine if wet-sieving resulted in a
significant loss of water soluble carbon. Mass balance calculations resulted in 94 – 110%
recovery from all three soils, indicating most of the carbon was accounted for within the
soil aggregates rather than lost in the water used for wet-sieving. However, our results do
not support or negate the possibility of a significant loss in water soluble C as a result of
wet-sieving.
Cation exchange capacity (CEC) was largely different as a result of sieving
method (Table 4.3) among all size fractions. For example, in the Theresa soil, dry-sieving
resulted in CEC values which were 20 and 35% lower than wet-sieving for aggregates
collected in the 250 and 75 μm size fraction, respectively. In the Marlette-Oshtemo soil
the sieving method had a similar effect on CEC values for the same aggregate size classes
115
as the Theresa soil. In contrast, an opposite trend was observed in the Appling soil which
had a 36% reduction in CEC for the 500 μm size fraction compared to dry-sieving. In
addition to the differences in CEC between the two sieving methods for a given soil type
and size fraction, there were differences in the range of CEC values among aggregate size
fractions. Some of the larger differences between the CEC of aggregate size fractions
were found associated with the Appling soil, irrespective of sieve method. For the
Theresa and Mareltte-Oshtemo soils in contrast, the differences in CEC between
aggregate size fractions were confined to the wet-sieving treatment.
While dry sieving tended to have a relatively small influence on the CEC of the
aggregate fractions, wet-sieving showed dramatic changes, with CEC’s being largest in
the smallest size fractions. The decrease in sand content, particularly fine sand (Table
4.2) was greater than the decrease in clay or organic matter and that the loss of sand
resulted in a concentrating effect with respect to the silt and clay in the smaller soil
aggregates of the wet-sieved soils. This shift in CEC in wet- compared to dry-sieved soils
follows the same patterns observed with total carbon and is likely a result of the loss of
total carbon in the 500 – 2000 μm size fraction and accumulation in the 75 – 250 μm size
fraction. Overall, we suspect that the impact of sieving method on total carbon and CEC
was first a consequence of differences in the distribution of aggregate sizes, but also
possibly related to the inherent stability of those aggregates that is related to the soil’s
clay mineralogy and organic-clay complexes.
3.3 Impact of sieving method on soil microbial biomass and community structure as
indicated by FAME profiles
116
The total amount of extractable fatty acids obtained as phospholipid fatty acids
(PLFAs), has been used as an estimate of the viable microbial biomass (White et al.,
1996). However, in this study the measurement of FAMEs rather than PLFAs was used
to characterize the microbial community structure. Thus, caution should be used in the
estimate of microbial biomass since FAMEs may include fatty acids from humic
substances and plants (White et al., 1996; Zelles, 1999; Schutter and Dick, 2000). Figure
4.2 shows that differences in the total FAMEs are not large, except for the 75 - 250 μm
size fraction. In the Theresa soil there was no significant difference in the total FAME
content between the two sieving methods (Figure 4.2). In the Appling and Marlette-
Oshtemo soils in contrast, there was a 45.1% and a 52.8% decrease, respectively, in total
FAME content associated with the 75 - 250 μm size fraction as a result of dry- compared
to wet-sieving (Figure 4.2). We hypothesize that differences in the soil biological
biomass and microbial community structure between soil aggregates collected from
different sieving methods was primarily a result of differences in aggregate size
distribution, and not a consequence of losses of microbial community biomass, as is often
concluded by other researchers (Amato and Ladd, 1980; Ahmed and Oades, 1984; Chiu
et al., 2006). The apparent differences in FAME content found in our work, when
comparing the two sieving methods can be accounted for by re-distribution of sand sized
particles or organic matter, and not a true loss in the community biomass. For example,
the increase in the total amount of extractable fatty acids in the wet-sieved 75-250 μm
fraction of the Appling soil coincides with the change in the distribution of total carbon.
As discussed above, this shift in the distribution of total carbon within wet-sieved
aggregates may be due to the removal of organic matter surrounding sand particles and its
117
redistribution to the < 250 μm size fraction and thus, may have resulted in a
concentration (increase) in microbial biomass. This idea would support the crack
hypothesis which Ashman et al. (2003) proposed as an alternative to the aggregate
hierarchy model. In this scenario, microaggregates which line pore walls and are
enriched in carbon, and microbial biomass, would become dislodged during fractionation
and re-deposited in a smaller size fraction, leaving behind an aggregate core or sand
particle with lower biological activity.
While inherent properties of soils explained the majority of the variability, there
were clear effects exerted by both sieve method and aggregate size that contributed to the
variability in structural characteristics of the microbial community (Figure 4.3). An NMS
analysis of all three soils clearly showed that the Theresa, Appling, and Marlette-
Oshtemo FAME profiles were significantly different from each other (Figure 4.3). An
MRPP analysis further indicated significant differences in the distribution of mol %
FAME between the three soil types (p < 0.001). While indicator species analysis
between the soils suggested that almost all of the FAME were important for defining
differences, differences as a result of sieving method (p < 0.05) were more dependent on
specific FAMEs such as the biomarkers for gram positive bacteria (i15:0, i16:0, i17:0,
a17:0), actinomycetes (10Me17:0) and fungi (18:2ω6,9).
In many cases there was no clear trend, other than general differences, in how the
sieve method influenced the distribution of the microbial communities associated with
different aggregate size classes. It is interesting to note however, that microbial
community structure of the wet-sieved 75-250 μm size fraction of the Theresa soil was
very similar to the dry-sieved 500-2000 and 2000-4000 μm size fractions (Figure 4.3). In
118
the same light as that mentioned in the previous paragraph, this could be a consequence
of the microbial community associated with the larger size fraction have been
redistributed into smaller size fractions. Differences between the sieving methods can be
identified in the NMS analysis of the soils shown in Figure 4.3. But to more clearly
demonstrate the impact of sieving method on the soil microbial community structure both
NMS and MRPP analysis were conducted on each soil type separately (Figure 4.4). The
separation of clusters indicates the microbial community structure is distinctively
different between the two sieving methods. In the all three soils there is a greater degree
of separation of data points between wet- and dry-sieving in the fractions < 250 μm
compared to the clusters of those > 250 μm. These groups were separated primarily by
axis 1 in the Marlette-Oshtemo soil and by both axis 1 and axis 2 in the Appling and
Theresa soils. Interestingly, in the Appling and Theresa soils the separation between
treatments for the 250-500 μm size fractions was minimal. This is in line with the
changes in the aggregate size distribution as this size fraction had smallest reduction as a
result of wet-sieving compared to the 500 – 2000 and 2000 – 4000 μm size fractions
(Figure 4.1). This may be due to greater aggregate stability and protection of soil organic
matter. In summary, the differences among the soils are greater than the effects of sieve
method, but sieve method had an important, though not uniform effect on the microbial
community.
3.4 Impact of sieving method on the relative abundance of individual FAME biomarkers.
Analysis of individual FAMEs also provided some interesting insights regarding
how wet-sieving and dry sieving impact the soil microbial community within different
119
soil types and soil aggregate size fractions. The results of this study further fuel concern
that the choice of method for aggregate separation will determine the relationship of the
microbial-aggregate associations. For example, an interesting trend in the Theresa soil
was that the increase in gram positive biomarkers i15:0, a15:0, and i17:0 in dry-sieved 75
– 250 μm size fractions corresponded to a decrease of the same biomarkers in the dry-
sieved 500 – 2000 μm size fraction (Table 4.4). This further supports the redistribution
of soil material from larger to smaller soil aggregates previously mentioned and the
similar location of the wet-sieved 75 – 250 μm and dry-sieved 500 – 2000 μm data points
on the NMS plot for the Theresa soil (Figure 4.3). Additionally, far fewer differences in
mol% FAMEs were observed between sieving methods in the larger size fractions. In
particular, no differences were observed between sieving methods among all three soils
in 250 – 500 μm size fraction. This follows the NMS analysis where the separation
between treatments for this size fraction was minimal (Figure 4.4). Thus, for this
particular size fraction sieving method appears to have little if any impact on the
microbial community structure.
The mol% distribution of FAMEs shows clearly that certain biomarkers are more
important for describing differences between sieving methods (Table 4.4). For example,
in all soils, the bulk of the differences we measured could be found in the 75-250 μm size
fraction with a preponderance of these differences explainable by an increase in the
abundance of gram-positive type biomarkers in dry compared to wet-sieving. In contrast,
fungal biomarkers (18:1ω9 and/or 18:2ω6,9) were more abundant in wet- than dry-sieved
75 – 250 μm size fractions. In this context, considerable interest has been focused on
examining and explaining the non-random distributions of microbial communities within
120
soil microsites and associated with soil aggregates (Menendes and Bottomley, 1998;
Guggenberger et al.,1999; Vaisanen et al., 2005). More work is certainly needed to
explain which microbial community members are associated with particular soil
components, why these associations occur, and how they affect the heterogeneous
distribution of soil processes, such as microbial activity and N mineralization (Menendes
and Bottomley, 1998; Schutter and Dick, 2002). However, our work clearly shows that
the choice of method can have a strong influence on microbial-aggregate associations,
and until these discrepancies can be explained, conclusions from studies seeking to
understand the role of microbial communities in aggregate processes will be limited.
This line of thinking is substantiated, for example, by the high abundance of the fungal
biomarkers in wet-sieved micoaggregates of the Appling and Marlette-Oshtemo soils that
may be a direct result of slaking and disintegration of macroaggregates. This observation
follows the statements made by Chiu et al. (2006) that wet sieving might destroy fungal
mycelium within soil aggregates, however, this contrasts with the findings of others that
assert a strong link between soil fungi and the formation and stabilization of
macroaggregates (Tisdall, 1994; Guggenberger et al., 1998).
4. Conclusion
In light of the physical force imparted on soil it is not surprising that dry and wet
sieving methods provide different outcomes and interpretations of the aggregate
associated biological and chemical properties. This result does not necessarily imply that
the search for aggregate-microbial associations in soil is fruitless, however. In instances
where inherent aggregate stability is the key question of an experiment, the tendency for
121
aggregates to break down into smaller sized fractions, as with sieving, might provide
consistent data. On the other hand, when researchers intend to study the natural
associations found within aggregate hierarchies, or need to extract biological or chemical
information that is sensitive to the effects of sieving, then careful consideration of the
likelihood of artifacts should be used to select the best aggregate separation method.
122
References
Ahmed, M., and J.M. Oades, 1984. Distribution of organic matter and adenosine triphosphate after fractionation of soils by physical procedures. Soil Bio. Biochem. 16: 465-470.
Amato, M., and J.N. Ladd, 1980. Studies of nitrogen mineralization and immobilization in calcareous soil. V. Formation and distribution of isotope-labeled biomass during decomposition of 14C and 15N-labelled plant material. Soil Bio. Biochem. 12: 405-411.
Angers, D.A., and M. Giroux, 1996. Recently deposited organic matter in soil water- stable aggregates. Soil Sci. Soc. of Am. J. 60: 1547-1551.
Ashman, M.R., P.D. Hallett, and P.C. Brookes, 2003. Are the links between soil aggregate size class, soil organic matter and respiration rate artifacts of the fractionation procedure? Soil Bio. Biochem. 35: 435-444.
Beauchamp, E.G., and A.G. Seech, 1990. Denitrification with different sizes of soil aggregates obtained from dry-sieving and from sieving with water. Bio. Fert. of Soil 10: 188-193.
Bossuyt, H., K. Denef, J. Six, S.D. Frey, R. Merckx, and K. Paustian. 2001. Influence of microbial populations and residue quality on aggregate stability. Appl. Soil Ecol. 16:195-208.
Bossuyt, H., J. Six, and P.F. Hendrix, 2005. Protection of soil carbon by microaggregates within earthworm casts. Soil Bio. Biochem. 37: 251-258.
Brady, N.C., and R.R.Weil, 1999. The nature and properties of soils. 12th Ed. Prentice- Hall, New Jersey.
Cambardella, C.A., and E.T. Elliott, 1993. Carbon and nitrogen distribution in aggregates from cultivated and native grassland soils. Soil Sci. Soc. Am. J. 57: 1071-1076.
Chen, Y., and M. Schnitzer, 1989. Sizes and shapes of humic substances by electron microscopy p. 622-638 In Humic substances: In search of structure. M.B.H. Hayes et al. (ed.) Wiley & Sons, New York, N.Y.
Chiu, C.Y., T.H. Chen, K. Imberger, and G. Tian, 2006. Particle size fractionation of fungal and bacterial biomass in subalpine grassland and forest soils. Geoderma 130: 265-271.
Denef, K., J. Six, R. Merckx, and K. Paustian, 2002. Short-term effects of biological and physical forces on aggregate formation in soils with different clay mineralogy. Plant Soil 246: 185-200.
123
DeSutter, T.M., S.A. Clay, and D.E. Clay, 2003. Atrazine sorption and desorption as
affected by aggregate size, particle size, and soil type. Weed Sci. 51: 456-462.
Dexter, A.R., 1988. Advances in characterization of soil structure. Soil Tillage Res. 11: 199-238.
Elliot, E.T., C.A. Palm, D.E. Reuss, and C.A. Monz, 1991. Organic matter contained in soil aggregates from a tropical chronosequence. Agriculture, Ecosystems & Environment 34: 443-451.
Elliott, E.T. 1986. Aggregate structure and carbon, nitrogen, and phosphorus in native and cultivated soils. Soil Sci. Soc. Am. J. 50: 627-633.
Foster, R.C., 1988. Microenvironments of soil microorganisms. Bio. Fert.Soils 6: 189- 203.
Gee, G.W., and D. Or., 2002. Particle-size analysis. p. 255-294. In. Methods of soil analysis. Part 4. Physical methods. Dane, J.H., Topp, G.C. (eds) ASA and SSSA, Madison, WI.
Guggenberger, G., E.T. Elliott, S.D. Frey, J. Six, and K. Paustian. 1998. Microbial contributions to the aggregation of a cultivated grassland soil amended with starch. Soil Bio. Biochem. 31: 407-419.
Kay, B.D., 1990. Rates of change of soil structure under different cropping systems.
Adv. Soil Sci. 12: 1-52.
Kemper, W.D., and R.C. Rosenau, 1986. Aggregate stability and size distribution. p. 425- 442. In. Methods of soil analysis. Part 1. Physical and mineralogical methods. Klute, A. (ed.) 2nd ed. ASA and SSSA, Madison, WI.
Krauss, M., and W. Wilcke. 2002. Sorption strength of persistent organic pollutants in particle-size fractions of urban soils. Soil Sci. Soc. Am. J. 66: 430-437.
Limon-Ortega, A., B. Govaerts, J. Deckers, and K.D. Sayre. 2006. Soil aggregate and microbial biomass in a permanent bed wheat-maize planting system after 12 years. Field Crops Res. 97: 302-309.
Marquez, C.O., V.J. Garcia, C.A. Cambardella, R.C. Schultz, and T.M. Isenhart, 2004.
Aggregate-size stability distribution and soil stability. Soil Sci. Soc. Am. J. 68: 725-735.
McCune, B., and M.J. Mefford, 1999. PC-ORD Multivariate analysis of ecological data. Version 4.0 MjM Software, Gleneden Beach, Oregon, USA.
124
McCune, B., and J.B. Grace, 2002. Analysis of ecological communities. MjM Software Design, Gleneden Beach, Oregon, USA.
Mendes, I.C., and P.J. Bottomley. 1998. Distribution of a population of Rhizobium leguminosarum bv.trifolii among different size classes of soil aggregates. Appl. Environ. Microbiol. 64: 970-975.
Miller, M., and R.P. Dick, 1995. Dynamics of soil C and microbial biomass in whole soil and aggregates in two cropping systems. Appl. Soil Ecol. 2: 253-261.
Monrozier, L.J., J. N. Ladd, A.W. Fitzpatrick, R.C. Foster, and M. Raupach, 1991. Components and microbial biomass content of size fractions in soils of contrasting aggregation. Geoderma 49: 37-62.
Nelson, D.W., and L.E. Sommers, 1996. Total carbon, organic carbon, and organic matter. p. 961-1010. In. Methods of soil analysis. Part 3. Chemical Methods. Sparks, D.L. (ed). SSSA Book Ser. No. 5. SSSA, Madison, WI.
Nimmo, J.R., and K.S. Perkins, 2002. Aggregate stability and size distribution p. 317- 328, In Methods of soil analysis. Part 4 Physical methods. J.H. Dane and G. Clarke (eds.) SSSA Book Ser No. 5. SSSA, Madison, WI.
Oades, J.M., 1984. Soil organic matter and structural stability: Mechanisms and implications for management. Plant Soil 76: 319-337.
Oades, J.M., and A.G. Waters, 1991. Aggregate hierarchy in soils. Aust. J. Soil Res. 29: 815-828.
Puget, P., C. Chenu, and J. Balesdent, 1995. Total and young organic matter distributions in aggregates of silty cultivated soils. Eur. J. Soil Sci. 46: 449-459.
Puget, P., C. Chenu, and J. Balesdent, 2000. Dynamics of soil organic matter associated with particle-size fractions of water-stable aggregates. Eur. J. Soil Sci. 51: 595-605.
Schutter, M.E.,and R. P. Dick, 2000. Comparison of fatty acid methyl ester (FAME) methods for characterizing microbial communities. Soil Sci. Soc. Am. J. 64: 1659-1668.
Shields, J.A., E.A. Paul, W.E. Lowe, and D. Parkinson, 1973. Turnover of microbial tissue in soil under field conditions. Soil Bio. Biochem. 5: 753-764.
Shipitalo, M.J., and R. Protz, 1989. Chemistry and micromorphology of aggregation in earthworm casts. Geoderma 45: 357-374.
Six, J., E.T. Elliott, K. Pautsian, and J.W. Doran. 1998. Aggregation and soil organic
125
matter accumulation in cultivated and native grassland soils. Soil Sci. Soc. Am. J. 62: 1367-1377.
Six, J., E.T. Elliot, and K. Paustian, 2000a. Soil macroaggregate turnover and microaggregate formation: A mechanism for C sequestration under no-tillage agriculture. Soil Bio.Biochem. 32: 2099-2103.
Six, J., E.T. Elliott, and K. Paustian, 2000b. Soil structure and soil organic matter. II. A normalized stability index and the effect of mineralogy. Soil Sci. Soc. Am. J. 64: 1042-1049.
Six, J., K. Paustian, E.T. Elliott, and C. Combrink, 2000c. Soil structure and soil organic matter. I. Distribution of aggregate-size classes and aggregate-associated carbon Soil Sci. Soc. Am. J. 64: 681-689.
Six, J., H. Bossuyt, S. Degryze, and K. Denef. 2004. A history of research on the link between (micro)aggregates, soil biota, and soil organic matter dynamics. Soil Tillage Res. 79: 7-31.
Stemmer, M., M.H. Gerzabek, and E. Kandeler, 1998. Organic matter and enzyme activity in particle-size fractions of soils obtained after low-energy sonication. Soil Bio. Biochem. 30: 9-17.
Sumner, M.E., and W.P. Miller. 1996. Cation exchange capacity and exchange coefficients. p. 1201-1230. In. Methods of soil analysis. Part 3. Chemical methods. Sparks, D.L. (ed) SSSA Book Ser. No. 5. SSSA, Madison, WI.
Thomas, G. 1996. Soil pH and soil acidity. p. 475-490. In. Methods of soil analysis. Part 3. Chemical methods. Sparks, D.L. (ed) SSSA Book Ser. No. 5. SSSA, Madison, WI.
Tisdall, J.M., and J.M. Oades, 1982. Organic matter and water-stable aggregates in soils.
J. Soil Sci. 62, 141-163.
Tisdall, J.M. 1994. Possible role of soil microorganisms in aggregation in soils. J. Soil Sci. 33: 141-163.
Vaisanen, R.K., M.S. Roberts, J.L. Garland, S.D. Frey, and L.A. Dawson. 2005. Physiological and molecular characterization of microbial communities associated with different water-stable aggregate size classes. Soil Bio Biochem. 37: 2007-2016.
Young, I.M., and K. Ritz, 2000. Tillage, habitat space and function of soil microbes. Soil Tillage Res. 53: 201-213.
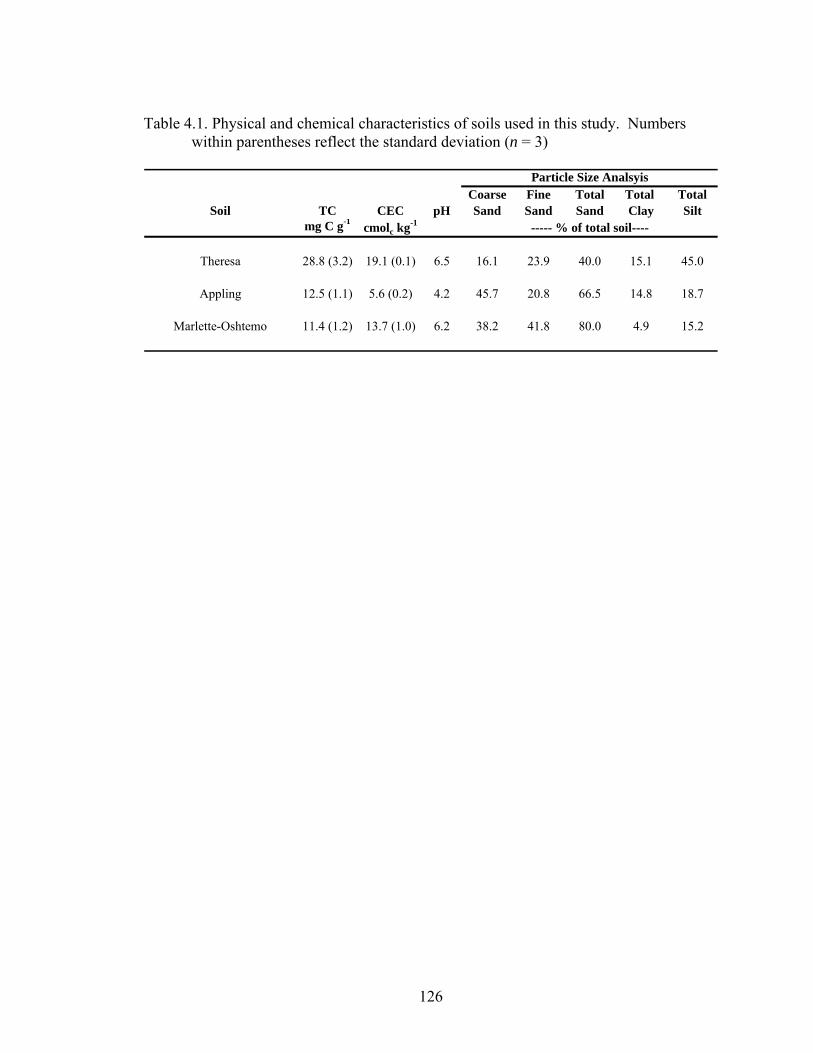
126
Table 4.1. Physical and chemical characteristics of soils used in this study. Numbers
within parentheses reflect the standard deviation (n = 3)
Coarse Fine Total Total TotalSoil TC CEC pH Sand Sand Sand Clay Silt
mg C g-1 cmolc kg-1
Theresa 28.8 (3.2) 19.1 (0.1) 6.5 16.1 23.9 40.0 15.1 45.0
Appling 12.5 (1.1) 5.6 (0.2) 4.2 45.7 20.8 66.5 14.8 18.7
Marlette-Oshtemo 11.4 (1.2) 13.7 (1.0) 6.2 38.2 41.8 80.0 4.9 15.2
Particle Size Analsyis
----- % of total soil----
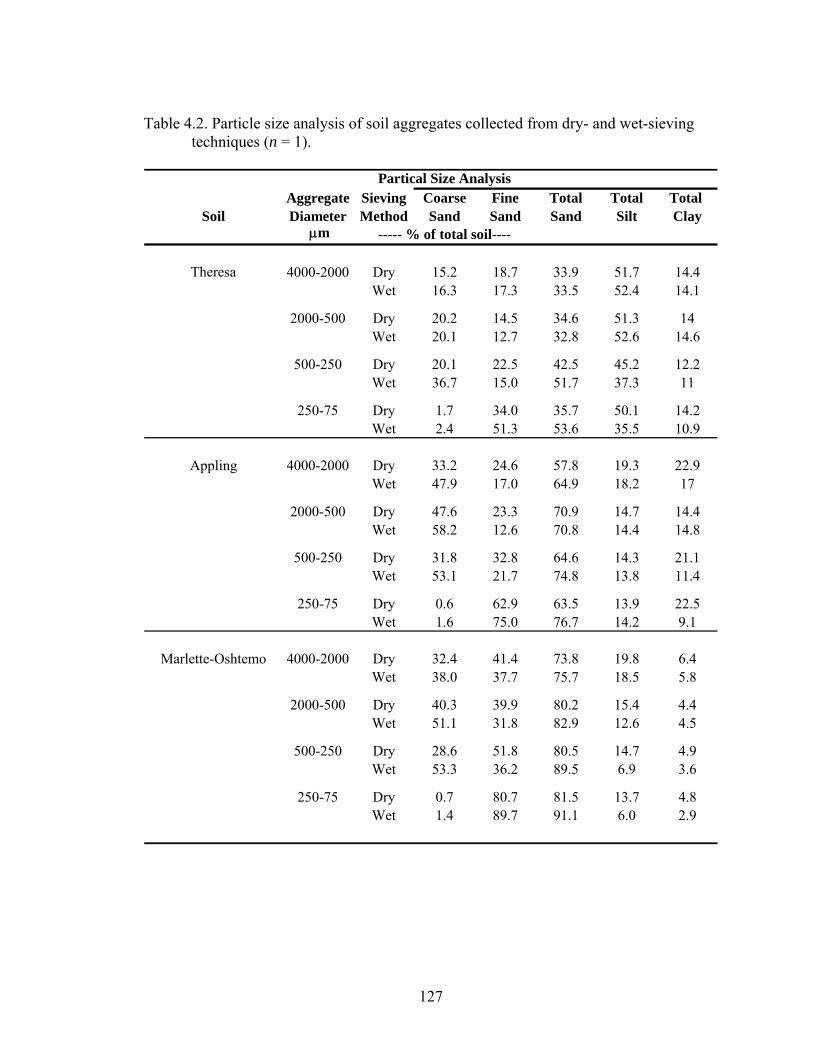
127
Table 4.2. Particle size analysis of soil aggregates collected from dry- and wet-sieving
techniques (n = 1).
Partical Size AnalysisAggregate Sieving Coarse Fine Total Total Total
Soil Diameter Method Sand Sand Sand Silt Clay μm ----- % of total soil----
Theresa 4000-2000 Dry 15.2 18.7 33.9 51.7 14.4Wet 16.3 17.3 33.5 52.4 14.1
2000-500 Dry 20.2 14.5 34.6 51.3 14Wet 20.1 12.7 32.8 52.6 14.6
500-250 Dry 20.1 22.5 42.5 45.2 12.2Wet 36.7 15.0 51.7 37.3 11
250-75 Dry 1.7 34.0 35.7 50.1 14.2Wet 2.4 51.3 53.6 35.5 10.9
Appling 4000-2000 Dry 33.2 24.6 57.8 19.3 22.9Wet 47.9 17.0 64.9 18.2 17
2000-500 Dry 47.6 23.3 70.9 14.7 14.4Wet 58.2 12.6 70.8 14.4 14.8
500-250 Dry 31.8 32.8 64.6 14.3 21.1Wet 53.1 21.7 74.8 13.8 11.4
250-75 Dry 0.6 62.9 63.5 13.9 22.5Wet 1.6 75.0 76.7 14.2 9.1
Marlette-Oshtemo 4000-2000 Dry 32.4 41.4 73.8 19.8 6.4Wet 38.0 37.7 75.7 18.5 5.8
2000-500 Dry 40.3 39.9 80.2 15.4 4.4Wet 51.1 31.8 82.9 12.6 4.5
500-250 Dry 28.6 51.8 80.5 14.7 4.9Wet 53.3 36.2 89.5 6.9 3.6
250-75 Dry 0.7 80.7 81.5 13.7 4.8Wet 1.4 89.7 91.1 6.0 2.9
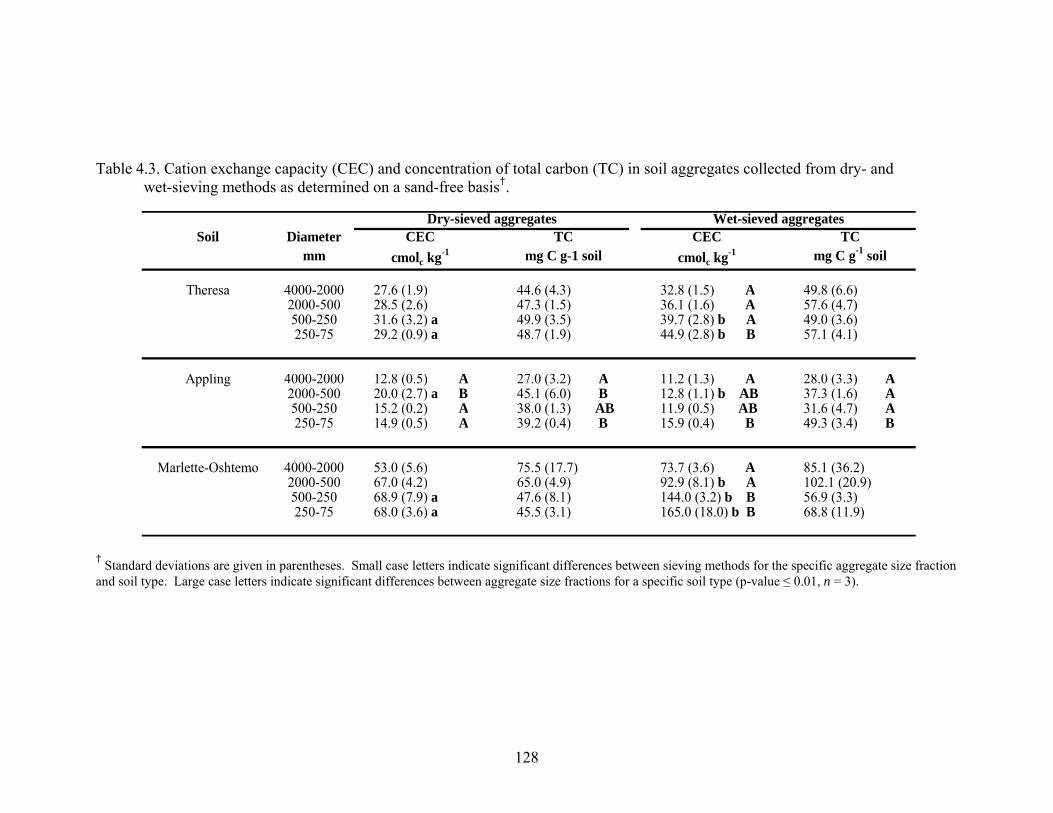
128
Table 4.3. Cation exchange capacity (CEC) and concentration of total carbon (TC) in soil aggregates collected from dry- and
wet-sieving methods as determined on a sand-free basis†.
Soil Diameter CEC TC CEC TCmm cmolc kg-1 mg C g-1 soil cmolc kg-1 mg C g-1 soil
Theresa 4000-2000 27.6 (1.9) 44.6 (4.3) 32.8 (1.5) A 49.8 (6.6)2000-500 28.5 (2.6) 47.3 (1.5) 36.1 (1.6) A 57.6 (4.7)500-250 31.6 (3.2) a 49.9 (3.5) 39.7 (2.8) b A 49.0 (3.6)250-75 29.2 (0.9) a 48.7 (1.9) 44.9 (2.8) b B 57.1 (4.1)
Appling 4000-2000 12.8 (0.5) A 27.0 (3.2) A 11.2 (1.3) A 28.0 (3.3) A2000-500 20.0 (2.7) a B 45.1 (6.0) B 12.8 (1.1) b AB 37.3 (1.6) A 500-250 15.2 (0.2) A 38.0 (1.3) AB 11.9 (0.5) AB 31.6 (4.7) A250-75 14.9 (0.5) A 39.2 (0.4) B 15.9 (0.4) B 49.3 (3.4) B
Marlette-Oshtemo 4000-2000 53.0 (5.6) 75.5 (17.7) 73.7 (3.6) A 85.1 (36.2)2000-500 67.0 (4.2) 65.0 (4.9) 92.9 (8.1) b A 102.1 (20.9)500-250 68.9 (7.9) a 47.6 (8.1) 144.0 (3.2) b B 56.9 (3.3)250-75 68.0 (3.6) a 45.5 (3.1) 165.0 (18.0) b B 68.8 (11.9)
Dry-sieved aggregates Wet-sieved aggregates
† Standard deviations are given in parentheses. Small case letters indicate significant differences between sieving methods for the specific aggregate size fraction and soil type. Large case letters indicate significant differences between aggregate size fractions for a specific soil type (p-value ≤ 0.01, n = 3).
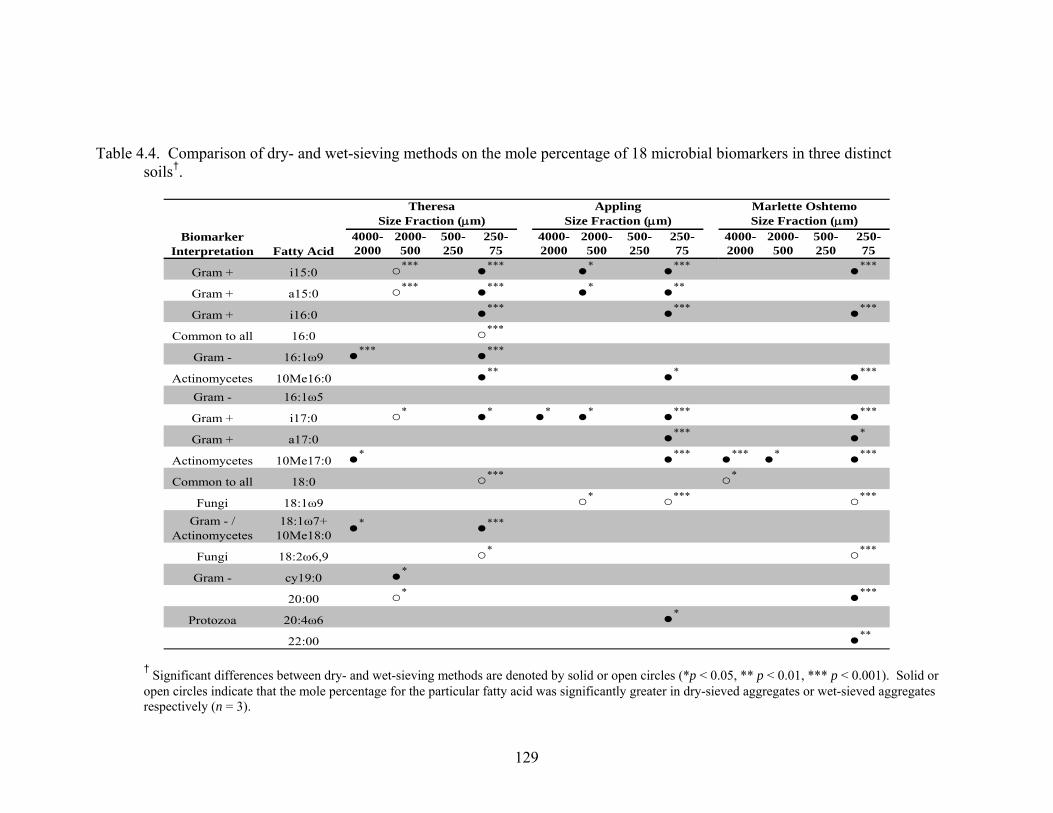
129
Table 4.4. Comparison of dry- and wet-sieving methods on the mole percentage of 18 microbial biomarkers in three distinct soils†.
4000- 2000- 500- 250- 4000- 2000- 500- 250- 4000- 2000- 500- 250-2000 500 250 75 2000 500 250 75 2000 500 250 75
Gram + i15:0 ○*** ●*** ●* ●*** ●***
Gram + a15:0 ○*** ●*** ●* ●**
Gram + i16:0 ●*** ●*** ●***
Common to all 16:0 ○***
Gram - 16:1ω9 ●*** ●***
Actinomycetes 10Me16:0 ●** ●* ●***
Gram - 16:1ω5
Gram + i17:0 ○* ●* ●* ●* ●*** ●***
Gram + a17:0 ●*** ●*
Actinomycetes 10Me17:0 ●* ●*** ●*** ●* ●***
Common to all 18:0 ○*** ○*
Fungi 18:1ω9 ○* ○*** ○***
18:1ω7+10Me18:0
Fungi 18:2ω6,9 ○* ○***
Gram - cy19:0 ●*
20:00 ○* ●***
Protozoa 20:4ω6 ●*
22:00 ●**
Theresa Appling Marlette OshtemoSize Fraction (μm) Size Fraction (μm) Size Fraction (μm)
Biomarker Interpretation Fatty Acid
Gram - / Actinomycetes ●* ●***
† Significant differences between dry- and wet-sieving methods are denoted by solid or open circles (*p < 0.05, ** p < 0.01, *** p < 0.001). Solid or open circles indicate that the mole percentage for the particular fatty acid was significantly greater in dry-sieved aggregates or wet-sieved aggregates respectively (n = 3).
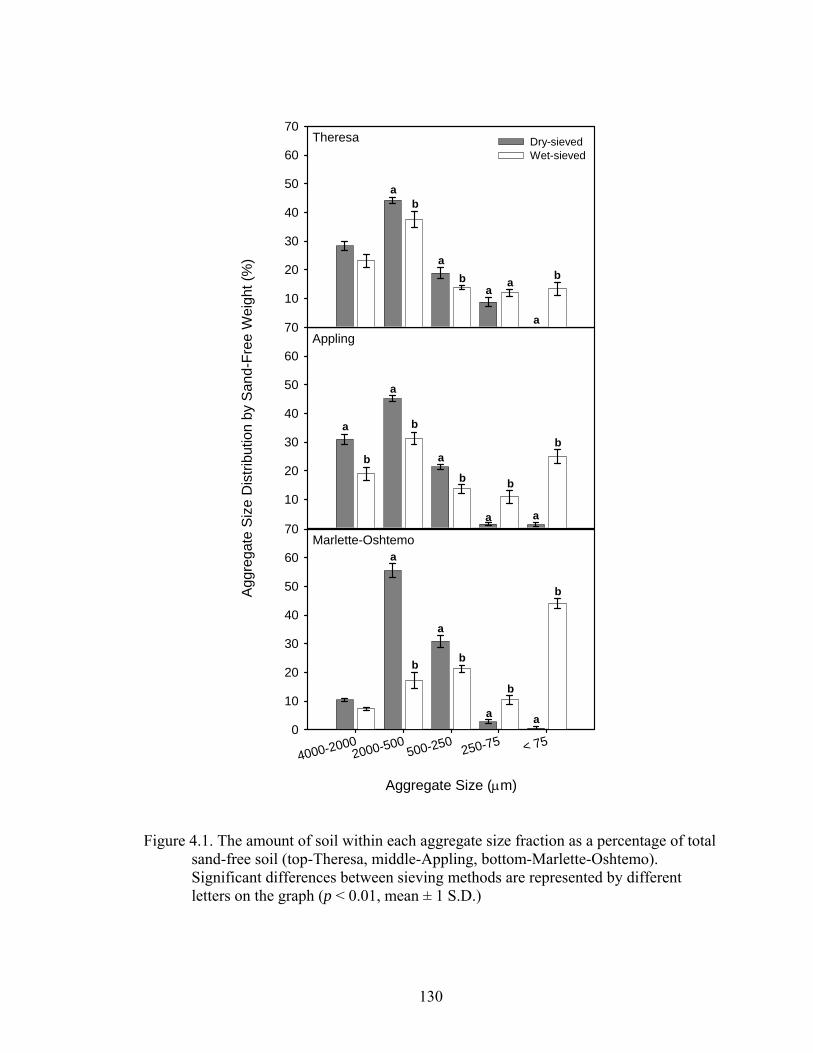
130
Aggregate Size (μm)
4000-20002000-500
500-250 250-75 < 750
10
20
30
40
50
60
70
Agg
rega
te S
ize
Dis
tribu
tion
by S
and-
Free
Wei
ght (
%)
10
20
30
40
50
60
70
10
20
30
40
50
60
70Dry-sievedWet-sieved
ab
ab
aa
a
b
a
b
a
b
a
b
a
b
a
b
a
b
a
b
a
b
a
b
Theresa
Appling
Marlette-Oshtemo
Figure 4.1. The amount of soil within each aggregate size fraction as a percentage of total
sand-free soil (top-Theresa, middle-Appling, bottom-Marlette-Oshtemo). Significant differences between sieving methods are represented by different letters on the graph (p < 0.01, mean ± 1 S.D.)
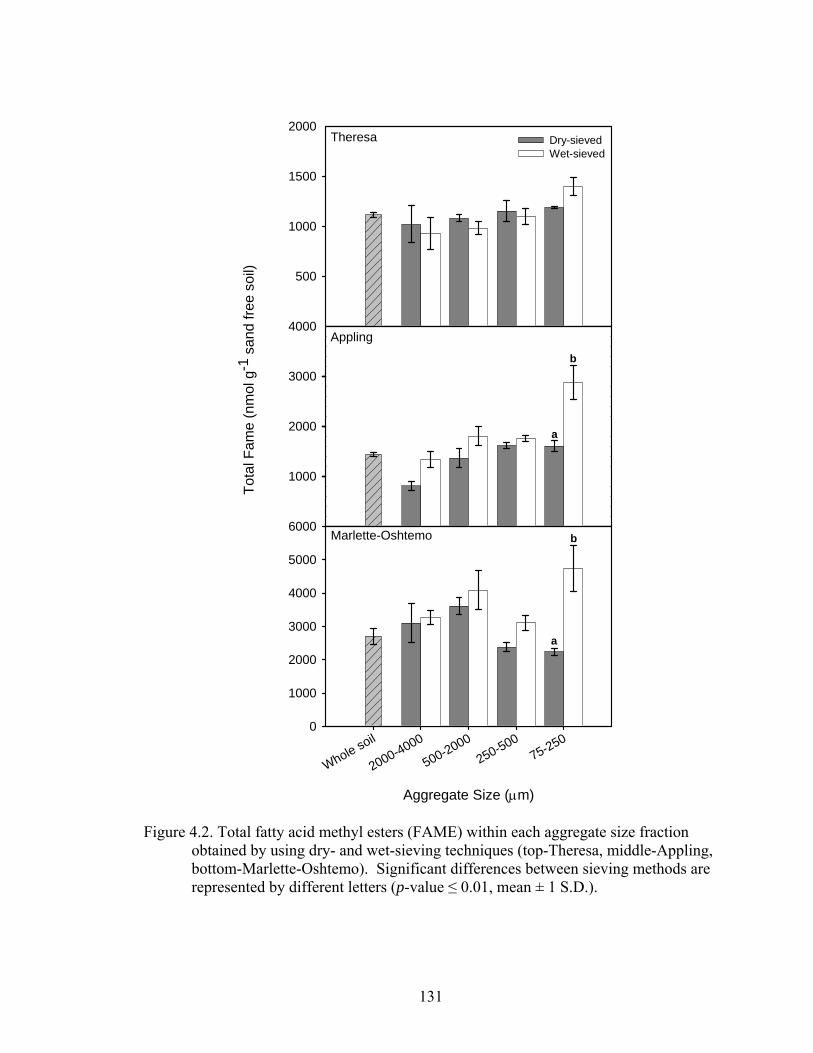
131
Tota
l Fam
e (n
mol
g-1
san
d fre
e so
il) 500
1000
1500
2000Dry-sievedWet-sieved
Theresa
1000
2000
3000
4000
Aggregate Size (μm)
Whole soil
2000-4000
500-2000250-500
75-2500
1000
2000
3000
4000
5000
6000
Appling
Marlette-Oshtemo
a
b
a
b
Figure 4.2. Total fatty acid methyl esters (FAME) within each aggregate size fraction
obtained by using dry- and wet-sieving techniques (top-Theresa, middle-Appling, bottom-Marlette-Oshtemo). Significant differences between sieving methods are represented by different letters (p-value ≤ 0.01, mean ± 1 S.D.).
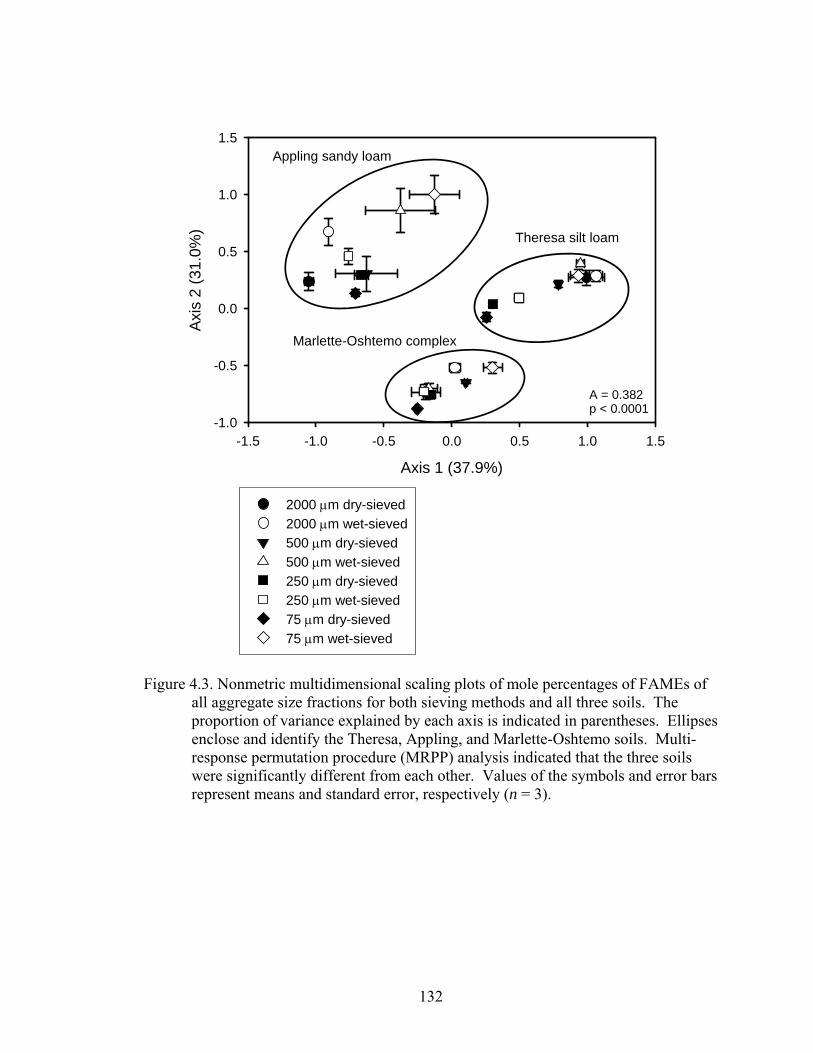
132
Appling sandy loam
Theresa silt loam
Marlette-Oshtemo complex
A = 0.382p < 0.0001
Axis 1 (37.9%)
-1.5 -1.0 -0.5 0.0 0.5 1.0 1.5
Axis
2 (3
1.0%
)
-1.0
-0.5
0.0
0.5
1.0
1.5Appling sandy loam
Marlette-Oshtemo complex
Theresa silt loam
A = 0.382p < 0.0001
2000 μm dry-sieved2000 μm wet-sieved500 μm dry-sieved500 μm wet-sieved250 μm dry-sieved250 μm wet-sieved75 μm dry-sieved75 μm wet-sieved
Figure 4.3. Nonmetric multidimensional scaling plots of mole percentages of FAMEs of
all aggregate size fractions for both sieving methods and all three soils. The proportion of variance explained by each axis is indicated in parentheses. Ellipses enclose and identify the Theresa, Appling, and Marlette-Oshtemo soils. Multi-response permutation procedure (MRPP) analysis indicated that the three soils were significantly different from each other. Values of the symbols and error bars represent means and standard error, respectively (n = 3).
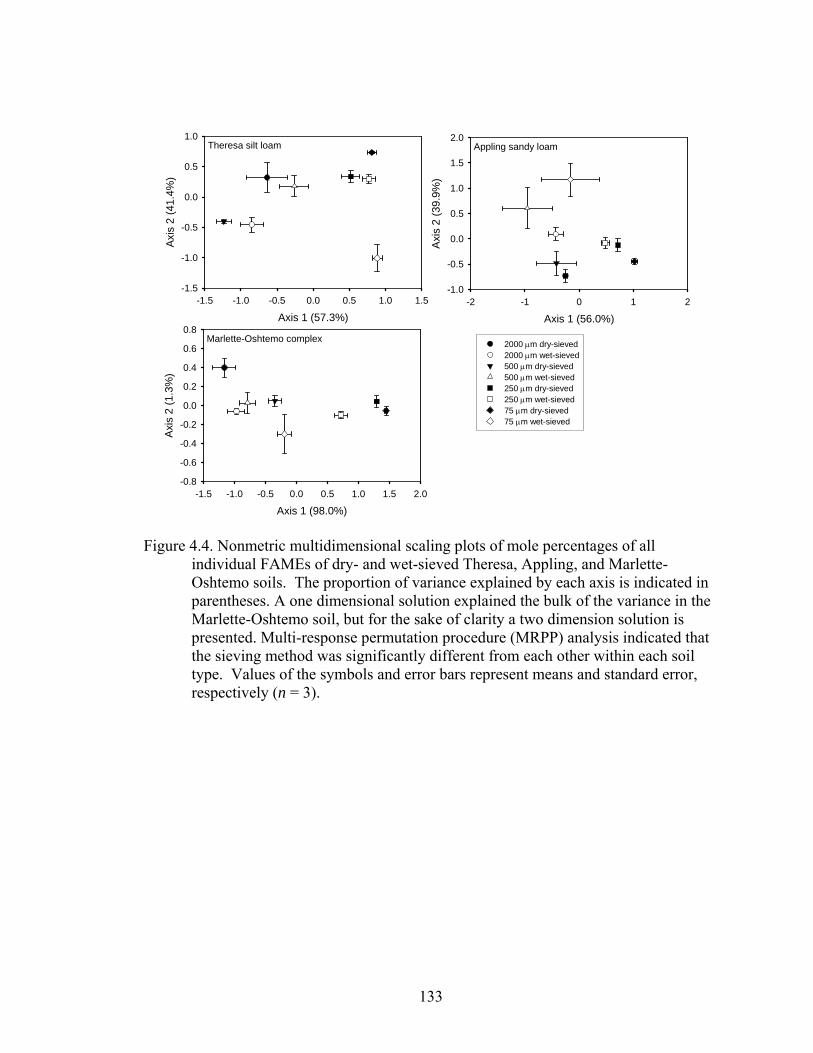
133
Axis 1 (57.3%)-1.5 -1.0 -0.5 0.0 0.5 1.0 1.5
Axis
2 (4
1.4%
)
-1.5
-1.0
-0.5
0.0
0.5
1.0Theresa silt loam
Axis 1 (56.0%)-2 -1 0 1 2
Axi
s 2
(39.
9%)
-1.0
-0.5
0.0
0.5
1.0
1.5
2.0
2000 μm dry-sieved2000 μm wet-sieved500 μm dry-sieved500 μm wet-sieved250 μm dry-sieved250 μm wet-sieved75 μm dry-sieved75 μm wet-sieved
Appling sandy loam
Axis 1 (98.0%)-1.5 -1.0 -0.5 0.0 0.5 1.0 1.5 2.0
Axi
s 2
(1.3
%)
-0.8
-0.6
-0.4
-0.2
0.0
0.2
0.4
0.6
0.8Marlette-Oshtemo complex
Figure 4.4. Nonmetric multidimensional scaling plots of mole percentages of all
individual FAMEs of dry- and wet-sieved Theresa, Appling, and Marlette-Oshtemo soils. The proportion of variance explained by each axis is indicated in parentheses. A one dimensional solution explained the bulk of the variance in the Marlette-Oshtemo soil, but for the sake of clarity a two dimension solution is presented. Multi-response permutation procedure (MRPP) analysis indicated that the sieving method was significantly different from each other within each soil type. Values of the symbols and error bars represent means and standard error, respectively (n = 3).
134
CHAPTER 5
FATE OF 2,4,6-TRINITROTOLUENE (TNT) AND MICROBIAL COMMUNITY
STRUCTURE WITHIN SOIL AGGREGATES IN THE PRESENCE OF
EARTHWORMS
Pillar, G.D., K. Xia, and P.F. Hendrix. To be submitted to Environmental Toxicology and Chemistry.
135
Abstract
We conducted laboratory studies to determine the ability of the earthworm
Eisenia fetida to facilitate the transformation of 2,4,6-trinitrotoluene (TNT) in soil and
soil aggregates of different size. Soil microcosms consisting of soil with different organic
matter contents (2.9 and 1.3 mg kg-1) and clay mineralogy were prepared with and
without TNT and earthworms. Over the course of the 21-d study earthworms in the
sandy loam soil exposed to TNT accumulated more metabolites such as 2-amino-4,6-
dinitrotoluene (2-ADNT) and 4-amino-2,6-dinitrotoluene (4-ADNT) and had a greater
reduction in biomass than those in the silt loam soil. After 21 d 15.5 – 19.6% of the
initial (≈ 100 mg kg-1) TNT was recovered from both soils. TNT bioavailability was
much less in the sandy loam soil throughout the study as ≈ 10% of the total extractable
TNT at 21 d was removed from the whole soil and soil aggregates with a weak salt
solution representing readily available TNT. Earthworm activity resulted in an increase
in the amount of extractable metabolites 2-ADNT and 4-ADNT after 14 d in both soils
despite no impact on the disappearance of TNT in the silt loam soil after 21 d. The
presence of earthworms and TNT individually and together had a significant impact on
the microbial community structure as determined by fatty acid methyl ester (FAME)
analysis. Specifically, individual fatty acids indicative of gram-negative and gram-
positive bacteria, actinomycetes, and fungi were impacted. Examination of soil
aggregates revealed that earthworms in both soils had the greatest impact on the
microbial community structure, TNT disappearance, TNT transformation, and TNT and
metabolite distribution in 2000 – 4000 μm soil aggregates. These results provide

136
evidence of the potential for earthworms to directly and indirectly influence the fate of
TNT, 2-ADNT, and 4-ADNT in soil aggregates of different soil systems.
Keywords: TNT, earthworms, Eisenia fetida, biotransformation, 2-ADNT, 4-ADNT,
metabolites, soil aggregates
137
1. Introduction
The nitroaromatic explosive 2,4,6-trinitrotoluene (TNT) is a major component of
military munitions used throughout the world. Soil and water contamination of TNT and
its related transformation products have become a significant concern, particularly at
facilities used to manufacture, store, and dispose of munitions (Jerger and Woodhull,
2000; Rodgers and Brunce, 2001). The U.S. Department of Defense has determined that
more than 1000 sites have significant contamination by explosives (Rodgers and Brunce,
2001). In addition, > 95% of those sites contained TNT and > 87% exceeded permissible
contaminant levels and as a result many of these sites have been placed on the National
Priorities List for Superfund cleanup (Talmage et al., 1999). For example, 34,600 and
87,000 mg TNT kg-1 were reported in soils from the Joliet Army Ammunition Plant
(JAAP, Joliet Illinois) and the Umatilla Munitions Depot Activity (UMDA, Umatilla,
Oregon), respectively (Pennington et al. 1995; Simini et al., 1995). These values greatly
exceed the EPA risk-based concentrations of 95 and 21 mg kg-1 for industrial and
residential areas, respectively (USEPA, 2006).
TNT has been characterized as a fairly persistent compound in the environment
and has previously been listed by the USEPA as a priority pollutant (Keith and Telliard,
1979; Kaplan and Kaplan, 1982; Vasilyeva et al., 2001). Recently, numerous studies and
literature reviews have been conducted examining the factors that influence the
environmental fate of TNT (Pennington and Patrick, 1990; Comfort et al., 1995;
McGrath, 1995; Haderlein et al., 1996; Pennington and Brannon, 2002). Complete or
even partial mineralization of TNT is unlikely due to the difficulty involved in breaking
the aromatic structure. Rather, TNT is known to readily undergo reductive
138
transformation producing nitroso, azoxy, and hydroxylamine intermediates resulting in
the formation of aminodinitrotoluenes such as 4-amino-2,6-dinitrotoluene (4ADNT) and
2-amino-4,6-dinitrotoluene (2ADNT) and diaminonitrotoluenes such as 2,4-diamino-6-
nitrotoluene and 2,6-diamino-4-nitrotoluene (Thorne and Leggett, 1997; Pennington and
Brannon, 2002). In addition, in rare situations involving highly reducing conditions TNT
can be transformed into 2,4,6-triaminotoluene (TAT)(Hawari et al., 1998). Although
numerous studies have reported high rates of TNT disappearance in soil systems, the
formation of transformation products do not completely account for the observed
disappearance (Comfort et al., 1995; Pennington et al., 1995). Numerous studies
involving the use of radio-labeled TNT compounds and mass balance calculations have
shown that with time there is an increase in unextractable TNT and related metabolites
due to strong binding to soil components such as organic matter and clay minerals
(Comfort et al. 1995; Hundal et al., 1997; Achtnich et al., 1999). This contradicts earlier
reports indicating that TNT sorption to soil was readily reversible (Pennington and
Patrick, 1990).
Since a significant portion of TNT contamination occurs in soil, particularly near
the surface there is avid concern about its possible toxicity to soil-dwelling organisms
(Gong, et al., 1999; Renoux et al., 2000; Lachance et al., 2004; Wilke et al., 2004). TNT
has been shown to have a negative impact at concentrations as low as 1 mg kg-1 on the
growth and survival of bacteria, fungi, and actinomycetes in soil (Klausmeier et al., 1973;
Bayman and Radkar, 1997; Fuller and Manning, 1998; Gong et al., 1999). TNT
contamination has also resulted in adverse effects on microbial processes with a 50%
reduction in potential denitrification (PNA) and dehydrogenase activity (DHA) at
139
concentrations of 50 mg kg-1, and 10 mg kg-1 (Gong et al. 1999). In addition to the
reported toxicity to soil microorganisms studies have also demonstrated the toxicity of
TNT to soil invertebrates and soil fauna (Parmelee et al., 1993; Robidoux et al., 1999;
Dodard et al., 2003; Lachance et al., 2004; Schaefer, 2004). However, the levels at which
TNT is toxic depends on soil properties such as clay and organic matter content. For
example, the reported lethality (LC50) of Eisenia andrei in an OECD artificial soil (70%
sand, 20% clay, 10% sphagnum peat) and a sandy forest soil (92% sand, 3% clay, 4.2%
O.M.) exposed to TNT for 14 d was 365 and 143 mg kg-1, respectively (Renoux et al.
2000; Robidoux et al. 2000). Similarly, the lethality of TNT to another earthworm
species Eisenia fetida in a forest soil (5.9% O.M.) was reported to be 325 mg kg-1
(Phillips et al. 1993).
While the various enzyme systems involved in the biotransformation of TNT may
vary among different species, the basic metabolic activity of various organisms supports
the hypothesis that earthworms could influence the biotic transformation of TNT (Corbett
and Corbett, 1995; Renoux et al., 2000). Micro- and macro-organisms are capable of
influencing TNT bioavailability by promoting or inhibiting degradation and
transformation processes within soil (Vorbeck et al., 1998; Renoux et al., 2000; Esteve-
Nunez et al., 2001; Lewis et al., 2004). However, information on the ability of
earthworms to influence the distribution and translocation of TNT and metabolites in
soils is lacking (Renoux et al., 2000). Earthworms are known to play a significant role in
the formation and incorporation of organic materials into soil aggregates (Lee and Foster,
1991; Martin, 1991; Bossuyt et al., 2005). In addition, earthworms are known to
influence soil microbial community dynamics and, therefore, may have additional
140
indirect impacts on the fate of TNT (Lee, 1985; Postma-Blaauw et al., 2006). Thus, the
physical activity of earthworms could have a profound influence on the distribution,
transport, and transformation of TNT within the soil.
The overall objective of this study was to determine to what extent earthworms
may influence the fate of TNT in soil and within soil aggregates, and in turn, determine
how TNT and earthworms may influence the microbial community structure.
Experiments were conducted using soil microcosms consisting of two different soils of
contrasting soil texture and organic matter content. Eisenia fetida was used to
characterize the interaction between earthworms and TNT in the soil and within soil
aggregates. Finally, the microbial community structure was assessed by measuring fatty
acid methyl esters (FAMEs) as indicators of specific microbial populations.
2. Methods and Materials
2.1 Chemicals and equipment
Granular TNT (CAS 118-96-7: MW 227.15 g mol-1) used for spiking soil was
purchased from Holston Army Ammunition Plant (Kingsport, TN USA). Analytical
standards for TNT, 2-ADNT (CAS 35572-78-2; MW 197.15 g mol-1), 4-ADNT (CAS
19406-51-0; MW 197.15 g mol-1) were obtained from Accustandard (New Haven, CT,
USA). The purity of these reagents was ≥ 99%. Acetonitrile (HPLC grade) and calcium
chloride (CaCl2) were obtained from Fisher Scientific (Pittsburgh, PA USA). Glassware
was washed with phosphate-free detergent, rinsed with methanol, acid washed, and rinsed
with deionized water before use.
141
2.2 Soil preparation
The TNT-uncontaminated soils were collected from the A horizon of a Theresa
silt loam (fine-loamy mixed mesic Typic Hapludalf) from New Berlin (Waukesha
County), WI, and an Appling sandy loam (fine kaolinitic thermic Typic Kanhapludult)
from Bogart (Oconee County), GA. The two soils were chosen for the differences in clay
mineralogy, soil texture, and soil organic matter content (Table 5.1).
Soils were spiked with TNT at a target concentration of 100 mg TNT kg-1
following a modified procedure described in Renoux et al. (2000). To minimize impact
of the solvent on the microbial community, 30 g of air dried soil was mixed with TNT
dissolved in 10 mL of acetonitrile, left in the dark under a chemical hood for at least 3 hr
to permit acetonitrile evaporation, thoroughly mixed with approximately 270 g of
additional soil, and then hydrated to 70% of their water holding capacity (10.3% and
14.7% based on v/w for the Appling soil and Theresa soil, respectively). The prepared
TNT-spiked soil was immediately used for the earthworm incubation experiments
described in Section 2.3. Controls were established by preparing the soil with the same
procedures using 10 mL acetonitrile without TNT.
2.3 TNT degradation and distribution in the presence of earthworm
Earthworms (Eisenia fetida) were obtained from a local bait shop (Marion &
Buck’s Bait & Tackle, Athens, GA) and were maintained at the time of purchase in a
newspaper/organic soil mixture. Adult E. fetida used for the study had a well-developed
clitellum and a wet mass ranging from 250 to 600 mg. Earthworms were placed into
non-contaminated soil for a 72-h acclimation period. Six earthworms were then placed
142
into 1-L glass jars (i.e., test unit), filled with 300 g of the soil (dry weight) prepared
following procedures described in Section 2.2, and hydrated back to their 70% of field
capacity. Test units were prepared in triplicate for each of four treatments over four time
periods. Treatments included soil – earthworm – TNT (- Ew – TNT), soil + earthworm –
TNT (+ Ew – TNT), soil – earthworm + TNT (- Ew + TNT), and soil + earthworm +
TNT (+ Ew + TNT). The test units were then incubated at 25 ºC in darkness for 0, 7, 14,
and 21 d. Soil moisture was monitored on a daily basis by weighing and water was added
to maintain the moisture content of the soil. Daily water loss was less than 2.4 mL for
both soils over the course of the experiment. For the Appling and Theresa soils, the day
0 treatment corresponded to an exposure time of less than 10 min for the earthworms.
After each incubation time period, each glass container was carefully emptied. Surviving
earthworms were counted and rinsed with deionized water. The soil particles in their
guts were then purged by placing the earthworms from each replicate on a separate
moistened (with 5 mL of deionized water) paper towel for 24 h. After 24 h, purged
earthworms were counted again, rinsed with deionized water, carefully dried on tissue
paper, weighed, and placed into Teflon tubes, and immediately frozen at -80 ºC. Soil
from each replicate was placed on a nest of sieves in order to obtain three soil aggregate
size fractions: 2000-4000, 500-2000, and 250-500. In the Theresa soil a fourth size
fraction was collected and analyzed (75-250 μm). The sieves were then placed on a
Tyler Ro-Tap © RX-29 (Boca Raton, FL, USA) mechanical shaker and sieved for 3 min.
After sieving, soil aggregates and whole soil samples which were taken before sieving
were stored at 5 ºC for less than 5 d before extraction and analysis for TNT and its
metabolites and characterization of soil microbial community
143
2.4 Extraction and measurement of TNT and its metabolites from soil and earthworm
tissue.
Extractions of total TNT, 2ADNT, and 4ADNT were performed with
modifications to EPA Method 8330 by using a sequential extraction with 0.0033 M CaCl2
followed by acetonitrile. The extraction of TNT and its metabolites using a weak salt
solution has been noted as a measure of the readily extractable fraction (also considered
bioavailable) and the extraction by a solvent such as acetonitrile has been used as a
measure of the potentially extractable fraction (Hundal et al., 1997). The sum of target
compound in both extractions was defined as the total extractable. All extractants were
filtered through a 0.45-um membrane (Altech) before HPLC analysis for TNT and its
metabolites.
The following procedures were used for extraction of TNT and its metabolites in
earthworms: frozen whole earthworms were freeze dried and then homogenized in a
small amount of liquid nitrogen using a pestle and mortar. The amount of homogenized
material was then weighed and mixed with 5 mL of acetonitrile in 50 mL Teflon plastic
tubes. The samples were then placed in a sonication bath for 3 h, placed on a shaker for
24 h. A 1.5 mL aliquot was centrifuged for 30 min at 13,000 g to allow for separation of
the solvent from the biological tissues. A 0.75 ml aliquot of supernatant was treated with
0.75 mL of 0.0033 M CaCl2 to precipitate any fine particles. Samples were then filtered
through a 0.45-um membrane (Altech) for subsequent HPLC analysis.
The concentrations of TNT and its metabolites in filtered soil and earthworm
extractants were determined on a ThermoFinnigan HPLC system (Woburn, MA USA)
144
using a J’sphere ODS-H80 reversed-phase column (5μm, 150 by 4.6 mm i.d.) (YMC Co.
Ltd., Tokyo, Japan). The mobile phase was 82:18 (v:v) water:2-propanol with a flow rate
of 1.5 mL min-1, a 10 μL injection volume and a column oven temperature of 40° C. A
standard curve was run every 30 samples, with one standard rechecked every 10 samples.
The lowest concentration of aqueous TNT at which reproducible results were obtained on
the HPLC was 75 μg L-1. The precision of the HPLC method was between 0.5 to 5%
RSD.
2.5 Microbial Community Characterization
Fatty acid methyl-esters (FAMEs) extractions were conducted according to the
method by Schutter and Dick (2000), with a few modifications. Briefly, three grams of
soil were placed in a 40-mL scintillation vial. An aliquot of 15 mL 0.2 M KOH dissolved
in methanol was added to each vial, and then sonicated for 1 h in a sonicating bath. After
the sonication, 3 mL of 1 M acetic acid was added into each vial in order to neutralize the
KOH and mixed on a vortex for 1 min. Ten mL of hexane was added into each vial and
mixed on a vortex for 1 min. Five milliliters of deionized water was added to each vial
and mixed for 1 min on a vortex to allow for better phase separation of hexane from
water. After centrifugation at 2500 rpm for 15 min., 5 mL of the hexane layer was
removed from each vial using a pipette and placed in a 7 mL disposable glass tube. Each
hexane extract was dried to complete dryness under a gentle stream of nitrogen gas. The
remaining residue was then re-dissolved in 0.5 mL of hexane and transferred into a 2 mL
glass GC vial for analysis of FAMEs on a gas chromatograph-mass spectrometer (GC-
MS, ThermoFinnigan Polaris Q/Trace GC) using electron impact ionization. An
145
INNOWAX capillary column (30 m, 0.25I.D., 0.25 μm film) from J&W Scientific (Palo
Alto, CA, USA) was used. The inlet and transfer line temperatures were maintained at
250º C. A splitless injector was used with an injection volume of 1 μL. Helium was used
as the carrier gas at a constant flow rate of 1.2 mL min-1. The initial oven temperature of
each run began at 120º C, hold for 3 min, followed by a 5º C min-1 ramp up to 250º C.
The temperature was maintained at 250º C for 1 min and then increased at 10º C min-1 to
a final temperature of 260º C which was maintained for 3 min. The temperature of the
MS ion source was kept at 200º C. Data was collected using a full scan mode with a
mass range between 40 to 600 m/z. Fatty acid methyl esters were identified by
comparison with 37 components FAME (47885-U) and bacterial acid methyl-ester
(BAME, 47080-U) standards purchased from Supelco (Bellefonte, PA, USA).
2.6 Statistical analysis
Differences between treatments in the aggregate size distribution, amount of TNT,
amount of metabolites, and individual FAME biomarkers were tested for significance
using analysis of variance with soil type, aggregate size fraction, treatment, and time as
main effects (ANOVA). Because there were numerous two-way interaction effects
involving soil type and time, analyses were run separately for each soil and time period.
The Fischer’s protected LSD comparison method was used to determine differences
between means at p < 0.05. All statistics were performed using SPSS 13.0 for Windows.
All multivariate and nonparametric data analysis was conducted using PC-ORD v.
4.0 (McCune and Mefford, 1999). Nonmetric multidimensional scaling (NMS) based on
Sorensen’s distance was used to graphically represent FAMEs profile relationships. The
146
NMS was first performed on combined FAMEs data from both soils and all time periods
used in this study. Because there were large differences between the two soil types and
between the four time periods, the NMS analysis was re-run on each individual soil type
and time period to better highlight the differences associated between the four treatments.
The FAME mole percentage data underwent a general relativization before analysis in
PC-ORD. Based on an initial Monte Carlo test, the NMS was constrained to two axes
using the “slow-and-thorough” autopilot mode of NMS in PC-ORD. The autopilot mode
uses the best of 40 runs with a random starting configuration using the real data and 50
runs using randomized data for a Monte Carlo test of significance. Adequate stability of
the results was qualified for each run by examining plots of stress versus the number of
iterations.
A multi-response permutation procedure (MRPP) using Euclidean distance was
used to determine for differences in the mole percentages of FAMEs between the four
time periods and four treatments. The MRPP is another nonparametric procedure which
can be used to test group differences and has the advantage of not requiring distributional
assumptions such as multivariate normality and homogeneity of variances which are
seldom met with ecological community data (McCune and Grace, 2002). ‘Indicator
species’ analysis was conducted to determine which FAMEs were important descriptors
of each treatment and to further support NMS and MRPP analysis.
147
3. Results and Discussion
3.1 TNT transformation within earthworms and its impact on earthworm activity.
The use of salt or solvent extractions to measure TNT, 2-ADNT, and 4-ADNT is
considered an indirect measurement of chemical bioavailability to earthworms whereas
the bioaccumulation of these chemicals by earthworms is a direct measure of
bioavailability (National Research Council, 2003; Lanno et al., 2004). TNT was not
detected in the extracts of earthworms exposed to TNT in either the Appling or Theresa
soil at any time period, including 0 d. However, the transformation products 2-ADNT
and 4-ADNT were detected in earthworms exposed to TNT in both soils over the entire
course of the study (Figure 5.1A,C). Earthworms exposed to TNT in the Appling soil
reached a peak accumulation of 2-ADNT and 4-ADNT at 7 d at concentrations of 184.7
and 231.2 μg g-1 dry tissue, respectively. Renoux et al. (2000) and Lachance et al. (2004)
reported similar concentrations of 2-ADNT (23 – 107 μg g-1 dry tissue) and 4-ADNT (79
– 180 μg g-1 dry tissue) in the tissue of Eisenia andrei in a sandy forest soil exposed to
similar initial concentrations of TNT (90-97 mg TNT kg-1) over 7 and 14 d, respectively.
Additionally, earthworms in the Appling soil exposed to TNT for < 10 min (0 day)
contained 10.3 and 18.2 μg g-1 dry tissue of 2-ADNT and 4-ADNT, respectively (Figure
5. 5.1A,C). Renoux et al. (2000) reported a similar observation with earthworms exposed
to TNT for < 5 min. The measurement of metabolites in the tissue of earthworms that
were in contact with TNT-spiked soil for such short of time suggests that dermal contact
is a significant bioaccumulation mechanism. However, it is not known if TNT
transformation occurred via earthworm absorption or if transformation occurred in the
soil and the earthworms quickly absorbed 2-ADNT and 4-ADNT. Previous toxicity
148
studies where earthworms were exposed to filter paper contaminated with TNT suggest
that TNT is transformed during absorption by the earthworm. (Robidoux et al., 1999;
Renoux et al., 2000). Along with dermal absorption, ingestion is a possible mechanism
for transformation of TNT within earthworms and in fact, the authors noted that transfer
through the earthworm tissue is only one possible mechanism for TNT transport and
transformation in earthworms.
Earthworms from the Appling soil exposed to TNT contained greater amounts of
both metabolites compared to those found in the Theresa soil suggesting that TNT and/or
the metabolites were more bioavailable in the Appling soil. In addition the decrease in
tissue concentrations of both metabolites after 7 d in both soils may be due to several
reasons. First, it is possible that the metabolites could be further transformed and/or
altered within the earthworm to compounds not extractable or detected by HPLC
analysis. Second, the reduction in metabolites after 7 d along with the leveling off of
biomass reduction (i.e. in the Appling soil) may be due an unknown detoxification
process where earthworms are capable of removing the compound from their system.
Finally, the reduction in TNT and metabolite bioavailability with time may have resulted
in a reduction in earthworm absorption/transformation after 7 d. It is possible that a
combination of these explanations are occurring, however, further investigation using
tracers (i.e. C14) or molecular analysis would be needed to further support these findings.
Although the amount of TNT the earthworms were exposed to was not lethal,
TNT did have sublethal effects as shown by the loss in biomass, particularly in the
Appling soil (Figure 5.2B,D). However, it is not known if these observations were a
result of exposure to TNT, 2-ADNT, or 4-ADNT. Lachance et al. (2004) reported the
149
toxicity of these compounds to Eisenia Andrei increased in the order of 2-ADNT < TNT
< 4-ADNT. Thus, the significant accumulation of 4-ADNT by earthworms at 7 d in the
Appling soil may be partly responsible for the dramatic decrease in earthworm biomass
observed over the first 7 d of the experiment (Figure 5.2).
3.2 Impact of earthworm activity and TNT on soil aggregation.
Earthworms are known to promote soil aggregation and the formation of stable
macroaggregates. Bossuyt et al. (2005) reported an increase in macroaggregates > 2000
μm due to the presence of the endogeic earthworm A. caliginosa. Similarly, other
researchers have noted that the presence of earthworms has a positive impact on the
formation of water-stable macroaggregates (Martin and Marinissen, 1993; Scullion and
Malik, 2000). Thus another potential measurement of the impact of TNT exposure on
earthworm activity is to monitor the aggregate size distribution in soil exposed to
earthworms and TNT. If earthworm activity (i.e. movement, digestive processes, etc) is
impacted by TNT exposure, the formation of macroaggregates may be reduced compared
to a soil without TNT, witch in turn may affect the fate and distribution of TNT in soil
aggregates. The aggregate size distribution of both soils after 21 d is presented in Figure
5.2 (7 – 14 d presented in Appendix C, Figures C.1, C.2).
Surprisingly, in the Appling soil there was no significant difference in the
aggregate size distribution between the treatment with earthworms but no TNT (+Ew –
TNT) and the treatment with earthworms and TNT (+Ew +TNT). This infers that
although the earthworm biomass dropped significantly due to TNT exposure their activity
compared to earthworms in a soil without TNT was similar. The overall lack of
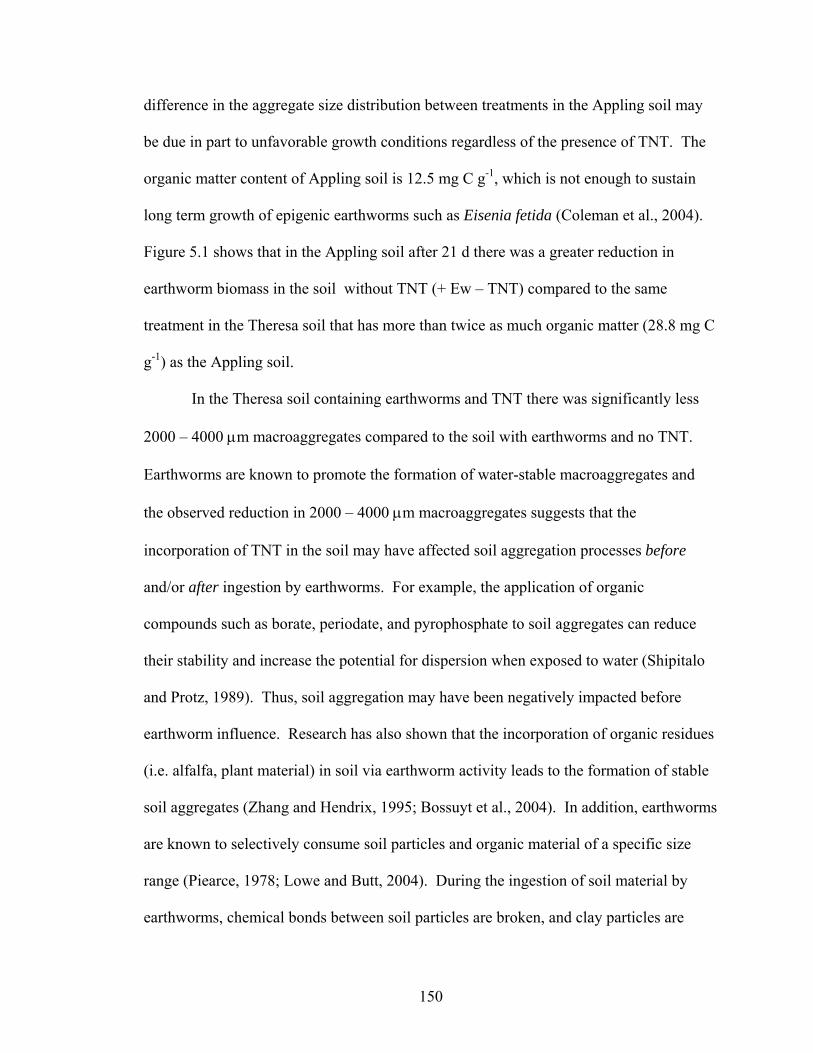
150
difference in the aggregate size distribution between treatments in the Appling soil may
be due in part to unfavorable growth conditions regardless of the presence of TNT. The
organic matter content of Appling soil is 12.5 mg C g-1, which is not enough to sustain
long term growth of epigenic earthworms such as Eisenia fetida (Coleman et al., 2004).
Figure 5.1 shows that in the Appling soil after 21 d there was a greater reduction in
earthworm biomass in the soil without TNT (+ Ew – TNT) compared to the same
treatment in the Theresa soil that has more than twice as much organic matter (28.8 mg C
g-1) as the Appling soil.
In the Theresa soil containing earthworms and TNT there was significantly less
2000 – 4000 μm macroaggregates compared to the soil with earthworms and no TNT.
Earthworms are known to promote the formation of water-stable macroaggregates and
the observed reduction in 2000 – 4000 μm macroaggregates suggests that the
incorporation of TNT in the soil may have affected soil aggregation processes before
and/or after ingestion by earthworms. For example, the application of organic
compounds such as borate, periodate, and pyrophosphate to soil aggregates can reduce
their stability and increase the potential for dispersion when exposed to water (Shipitalo
and Protz, 1989). Thus, soil aggregation may have been negatively impacted before
earthworm influence. Research has also shown that the incorporation of organic residues
(i.e. alfalfa, plant material) in soil via earthworm activity leads to the formation of stable
soil aggregates (Zhang and Hendrix, 1995; Bossuyt et al., 2004). In addition, earthworms
are known to selectively consume soil particles and organic material of a specific size
range (Piearce, 1978; Lowe and Butt, 2004). During the ingestion of soil material by
earthworms, chemical bonds between soil particles are broken, and clay particles are
151
brought into close contact with decomposing, mucilage-coated, organic material which
promotes formation and strengthening of soil aggregates (Shipitalo and Protz, 1989;
Zhang and Schrader, 1993). However, the type and extent of bonding that occurs
between mineral and organic materials during ingestion or after excretion in earthworm
casts greatly depends on the properties of the ingested organic debris and chemical
properties of the soil materials (Shipitalo and Protz, 1989). Therefore, the incorporation
and adsorption of TNT by soil organic matter and clay minerals could have weakened the
bonding between organic materials and clay minerals in the excreted earthworm casts,
thus leading to a reduction in stable macroaggregates. To test if this theory is true,
further research focused on the aggregate stability of earthworm casts and soil aggregates
exposed to TNT or other contaminants is needed.
3.3 TNT distribution and disappearance in soil and soil aggregates.
The transformation and bioavailability of TNT in soil have been well
characterized by numerous researchers (Comfort et al., 1995; Hundal et al., 1997;
Sheremata et al., 1999; Price et al., 2000; Esteve-Nunez et al., 2001). However, little is
known regarding the dynamics of TNT fate within soil aggregates. In the present study,
TNT disappearance over 21 d in all the whole soil and aggregate fractions of both soils
with and without earthworms was rapid, particularly within the first 7 d (Figures 5.3 and
5.4). At the end of the 21 d without exposure to the earthworms only 19.6 and 15.5% of
the initial amount of TNT was extractable (CaCl2 extractable + acetonitrile extractable)
from the whole soil in the Appling and Theresa soil, respectively (Figures 5.3 and 5.4).
In the Theresa soil, after 7 d < 10% of the total extractable TNT was CaCl2-extractable,
152
indicating a very small amount of readily bioavailable TNT. Because mineralization of
TNT to CO2 is highly unlikely (Hawari, et al., 2000; Esteve-Nunez et al., 2001) and the
total measured amount of TNT metabolites did not equal the amount of TNT
disappearance, it is likely that some of the TNT and/or metabolites are present in the soil
as nonextractable residue (Isbister et al., 1984; Caton et al., 1994; Comfort et al., 1995;
Hundal et al., 1997).
In the Appling soil earthworm activity enhanced TNT disappearance over the first
14 d in the whole soil and 2000 – 4000 μm aggregates and the first 7 d in 500 – 2000 μm
aggregates (Figure 5.3). At 7 d the soil with earthworms contained 7.2 mg kg-1 readily
extractable CaCl2-extractable TNT from the whole soil compared to 20.3 mg kg-1 of TNT
in the microcosm without earthworms. However, at 14 d there was no significant
difference in readily extractable TNT, but the soil with earthworms contained 7.4 mg kg-1
of potentially extractable TNT from the whole soil compared to 11.6 mg kg-1 of TNT in
the soil without earthworms. At 21 d there was no difference in TNT disappearance
between treatments. This trend of earthworms influencing the disappearance of readily
available TNT at 7 d, potentially available TNT at 14 d, and no impact by 21 d suggests
that the earthworm assisted disappearance of TNT in the Appling soil decreased with
time. Similarly, the diminishing influence of earthworm activity on TNT disappearance
with time were observed in 2000 – 4000 and 500 - 200 μm aggregates of the Appling soil
(Figure 5.3).
The diminishing impact of earthworms on TNT disappearance with time may be a
result of TNT toxicity to earthworms, resulting in a reduction in earthworm activity, as
shown by a decrease in earthworm biomass (Figure 5.1). Phillips et al. (2003) reported
153
that the no observed effect concentration (NOEC) and lowest observed effect
concentration (LOEC) for Eisenia fetida in a sandy forest soil over 56 d was 55 and 110
mg kg-1, respectively, which is close to the initial concentration of 99 mg kg-1 used in this
study. Other studies involving Eisenia andrei and Aporrectodea rosea have reported
similar levels of sublethal toxicity (Robidoux et al., 1999; Renoux et al., 2000; Robidoux
et al., 2000; Robidoux et al., 2004). Although differences in clay and organic matter
content can have a significant impact on the determination of NOEC and LOEC, the
dramatic reduction in earthworm biomass and activity during the first 7 d and during the
course of the present study (Figure 5.1) certainly indicates a reduction in earthworm
activity is at least part of the reduced influence on TNT fate. Another possibility is the
formation of irreversibly bound residues to soil components which were not
“bioavailable” to earthworms. The decrease in the amount of extractable TNT from
surface soil with time has been well documented (Sheremata, et al., 1999; Hundal et al.,
1997). Sheremata et al. (1999) reported 19 – 47% of applied TNT was un-extractable
using acetonitrile after 44 h and Hundal et al. (1997) reported 30 – 45% of applied TNT
was unextractable after 168 days using exhaustive (i.e. solvents, strong alkali and acidic
solutions) extractions.
It is interesting to note that earthworms appear to have the most influence on the
disappearance of TNT in macroaggregates > 500 μm in the Appling soil. Additionally,
although earthworm impact on the disappearance of TNT may diminish with time,
earthworms do have a significant impact on the distribution of TNT within the soil. For
example, at 21 d the soil with TNT but no earthworms had the highest levels of TNT in
2000 – 4000 μm aggregates, however, the soil with TNT and earthworms had an equal
154
distribution of TNT across all the aggregate size fractions (Figure 5.5). This is attributed
to greater TNT disappearance in the 2000 – 4000 μm size fraction relative to the other
size fractions in the soil with earthworms. The disappearance of TNT in the 2000 – 4000
μm size fraction could have been enhanced by transformation of TNT within the
earthworms and the resulting cast material containing much lower levels of TNT
compared to other aggregates (non-earthworm casts) of the same size, ultimately
resulting in a considerable drop in TNT in all aggregates that size. Renoux et al. (2000)
conducted experiments exposing earthworms to TNT through direct dermal contact on
filter paper. The authors concluded that based on the amount of TNT uptake and
transformation through dermal contact on filter paper, the amount of metabolites that
accumulated with the earthworms (see section 3.1) exposed to TNT in soil must have
been in part due to transformation through soil ingestion. Another possibility is that the
earthworms indirectly, through a modification of the soil environment (i.e. increased
aeration, exudation of organic mucus, alteration of the soil microbial community),
stimulated the transformation of TNT in macroaggregates, including earthworm casts.
Finally, the disappearance of TNT in the 2000 – 4000 μm size fraction could be the result
of increased sorption due to the organic rich nature of the earthworm casts, thus making it
more difficult to extract and giving the appearance that a greater amount of TNT was
transformed in the macroaggregates. Further studies using radio labeled compounds and
focusing on the fate of TNT within earthworm casts would help to clarify these results.
In the Theresa soil there was no significant difference in TNT disappearance due
to earthworm activity in the whole soil or any aggregate size fraction over the entire
course of the experiment (Figure 5.4). The lack of earthworm impact on TNT
155
disappearance in the Theresa soil compared to the Appling soil could be due to
differences in the overall bioavailability of TNT. Two observations in our study support
this theory. First, the amount of extractable metabolites from earthworms in the Theresa
soil was significantly less than the amount extracted from earthworms in the Appling soil
(p < 0.001) indicating the earthworms in the Theresa soil had less contact with TNT than
earthworms from the Appling soil (Figure 5.1, see section 3.1). Second, after 7 d the
treatment with no earthworms (- Ew + TNT) in the Appling soil contained 20.3 mg kg-1
of readily available TNT (CaCl2 extracted) compared to 2.5 mg kg-1 of readily available
TNT in the Theresa soil. This may be due to greater sorption and binding of TNT in the
Theresa soil. Batch sorption experiments performed indicated that the TNT sorption
coefficient (KF) of the Theresa soil was more than 2x greater than for the Appling soil
(Figure 5.8). The differences in the sorption coeffecients can be attributed to the Theresa
soil containing more than twice as much organic matter than the Appling soil (Table 5.1).
Additionally, XRD analysis (data not shown) indicated the presence of 2:1 clay minerals
such as vermiculite and smectite in the Theresa soil. Previous work has provided strong
evidence for the abiotic transformation and humification of TNT (and metabolites) in soil
as indicated by the significant amount of TNT extracted from humic acid, fulvic acid, and
humin (Hundal et al., 1997; Achtnich et al., 1999; Wang et al., 2002). Sorption studies
have shown that TNT readily binds with humic substances and TNT metabolites such as
2-ADNT and 4-ADNT have shown to form strong irreversible bonds with organic matter
(Achtnich et al., 1999; Eriksson and Skyllberg, 2001). Additionally, under certain
environmental conditions smectitic minerals are known to adsorbed greater amounts of
TNT than Kaolinite (Haderlein et al., 1996). As a result of the high amount of TNT
156
sorption and the formation of bound residues it is very unlikely that the earthworms could
influence the fate of the bound TNT over time, and thus earthworm influence on the fate
of TNT was limited to readily and potentially available TNT during the first 14 d. Gevao
et al. (2004) used soil contaminated with atrazine, isoproturon, and dicamba to
demonstrate that earthworms had little impact on the fate of bound residues. After 100-d
incubation the authors used exhaustive Soxhlet extractions to remove the pesticides and
then exposed the earthworm Aporrectodea longa to the previously extracted soils for 28
d. They reported that the earthworms absorbed 0.02 – 0.2% of the previously bound
chemical into their tissue, thus demonstrating that irreversibly bound residue is not
available to earthworms for transformation or degradation.
Although earthworms had little impact on the disappearance of TNT in the
Theresa soil, similar to the Appling soil, they did influence the distribution of TNT
among soil aggregates (Figure 5.5). For example, after 21 d soil aggregates < 500 μm
contained significantly more TNT than aggregates > 500 μm, however, with earthworms
the distribution of TNT was more equally distributed. In general there was an increase of
extractable TNT (though not statistically significant) in 2000 – 4000 μm aggregates and a
decrease in aggregates 250 – 500 μm aggregates. Thus, unlike the Appling soil where
earthworms altered the distribution of TNT by enhanced TNT disappearance in larger
macroaggregates, in the Theresa soil, earthworms altered the distribution of TNT by
moving the TNT from smaller aggregates to the larger macroaggregates. Studies have
noted the ability of earthworms to move organic material between aggregates of different
size. Bossuyt et al., (2005) reported a shift in radio labeled carbon from micro-
aggregates < 250 to macroaggregatses > 500 um as a function of earthworm activity.
157
Based on this and the previous discussed results of Gevao and co workers, the possibility
of bound TNT movement from one size soil aggregate to another is certainly feasible.
3.4 TNT transformation and distribution of metabolites in soil and soil aggregates.
During the course of this study, 2-ADNT and 4-ADNT were the only two
metabolites or transformation products of TNT identified in the soil. This observation is
in agreement with previous fate studies of TNT (Pennington, et al. 1995; Selim et al.,
1995; Comfort et al., 1995; Hundal et al., 1997). Earlier we reported that earthworms had
the most influence on the disappearance of TNT within the first 7 – 14 d of exposure to
freshly spiked Appling soil and no influence on the disappearance of TNT in the Theresa
soil. However, based on the amount of extractable metabolites (2-ADNT and 4-ADNT),
earthworms had the greatest influence on the transformation of TNT to metabolites
between 14 – 21 d of both the Appling and Theresa soils (Figures 5.3, 5.4).
In the Appling soil earthworm activity resulted in a greater amount of CaCl2,
solvent, and total extractable 2-ADNT at 14 d in the whole soil and all aggregate size
fractions (Figure 5.3). Additionally, earthworm activity resulted in an increase in CaCl2
extractable 2-ADNT at 7 d in 500 – 2000 and 250 - 500 μm aggregates and a decrease in
CaCl2 extractable 2-ADNT at 21 d in 250 – 500 μm aggregates. There was also a greater
amount of solvent and total extractable 4-ADNT at 21 d in the whole soil and all
aggregate size fractions and solvent extractable 4-ADNT at 14 d in the whole soil and
2000 – 4000 μm aggregates. Interestingly, the increase in TNT disappearance at 7 d in
the Appling whole soil and 2000 – 4000 μm aggregates due to earthworm activity did not
result in a similar increase in 2-ADNT or 4-ADNT at 7 d. As mentioned earlier, the
158
disappearance of TNT in 2000-4000 μm aggregates could be due to transformation of
TNT within the earthworms. However, the bioaccumulation of the metabolites 2-ADNT
and 4-ADNT could have resulted in earthworm casts with lower levels of TNT and no
significant change in the amount of metabolites. However, after 7 d the amount of 2-
ADNT and 4-ADNT within earthworm tissue decreased, possibly due to a detoxification
(i.e. adaptation or further transformation) or excretion of the metabolites which could
explain the significant increase in these metabolites at 14 and 21 d (Figure 5.3). The gap
between the earthworm effect on TNT disappearance at 7 d and the increase in 2-ADNT
and 4-ADNT at 14 d could be the time it takes earthworms to remove the metabolites
from their systems. Other studies have noted that the bioaccumulation of 4-ADNT and 2-
ADNT within the earthworm Eisenia andrei as a result of exposure to TNT reaches a
maximum level and then begins to drop (Renoux et al., 2000; Lachance et al., 2004).
Although the cause of the reduction and disappearance of 2-ADNT and 4-ADNT are not
known, these studies note that no further transformation of these compounds likely
occurred. Further examination using radiolabeled compounds and molecular level
investigation is needed to clarify these results.
Similar to TNT, earthworms influenced the distribution of 2-ADNT and 4-ADNT
within soil aggregates. In the Appling soil at 21 d without earthworms, the 250 – 500 μm
size fraction contained the most 2-ADNT and 4-ADNT compared to the other size
fractions (Figure 5.5). However, in the presence of earthworms their distribution was
equal among all size fractions. Interestingly, the biggest change in the concentration of
4-ADNT among the soil aggregates was in the 2000 – 4000 μm fraction. There was a
38.2, 28.8, and 16.9% increase in 4-ADNT in the 2000 – 4000, 500 -2000, and 250 – 500
159
μm fractions, respectively, compared to the same size fractions not exposed to
earthworms. The further supports the theory that with time (> 14 d) earthworms may
have excreted or deposited 4-ADNT and 2-ADNT within earthworm casts thus leading to
the increases in aggregates exposed to earthworms compared to those that were not.
In the Theresa soil earthworm activity resulted in a greater amount of solvent and
total extractable 2-ADNT at 14 and 21 d in the whole soil and 500 – 2000 μm aggregates
and 21 d in 2000 – 4000 μm aggregates (Figure 5.4). Additionally, earthworm activity
resulted in a greater amount of solvent and total extractable 4-ADNT at 21 d in 2000 –
4000 and 500 – 2000 μm aggregates. For the duration of the study CaCl2 extractable 2-
ADNT and 4-ADNT was < 2 mg kg-1 in the whole soil and all aggregate size fractions
and after 14 d, > 85% of extractable 2-ADNT and 4-ADNT were solvent extractable.
The low extractability and bioavailability can be attributed to the high organic matter
content and irreversibly bound sorption of 2-ADNT and 4-ADNT (Achtnich et al., 1999).
The observed increase in metabolites and the lack of an effect on TNT disappearance in
the presence of earthworms in the Theresa soil could be the result of earthworm
transformation of TNT and/or excretion of bioaccummulated 2-ADNT and 4-ADNT (as
discussed in the previous section) or a possible earthworm effect on the extractability of
TNT and/or metabolites. For example, the formation of non-extractable residues could
have overshadowed the effects of earthworm activity on TNT transformation and thus
giving the impression that earthworms had no impact on TNT transformation in the
Theresa soil. Alternatively, if the earthworms indeed had no impact on TNT
transformation due to low bioavailability of TNT (as previously discussed) earthworm
activity could have enhanced the ability to extract TNT metabolites from the soil giving
160
the impression that more metabolites were being transformed from TNT due to
earthworm activity than there actually was, particularly in the Theresa soil. The
enhanced extractability may be due to changes in the binding strength and/or sorption
mechanism for 2-ADNT and 4-ADNT. The increased amount of extractable 2-ADNT
and 4-ADNT in the presence of earthworms was limited to aggregates > 500 μm of the
Theresa soil. This may be due in part to a shift in the distribution of 2-ADNT and 4-
ADNT from < 500 μm to > 500 μm aggregates (Figure 5.5). Although there was not a
significant increase in percent of macroaggregates in soil with both TNT and earthworms
(Figure 5.2), earthworm activity (excretion of organic mucus, casts, enhanced porosity,
etc) may have changed the nature of 2-ADNT and 4-ADNT interactions within the soil
and soil particles. To the best of our knowledge, our study is the first to present indirect
evidence that suggests earthworm activity may influence the extractability of
nitroaromatics such as TNT from the soil.
3.5 Influence of TNT and earthworms on microbial community structure.
The NMS analysis of FAME mol % data was used to determine differences in
microbial community structure and differences among fatty acids which are used as
microbial indicators. An NMS analysis of both soils clearly showed differences in the
microbial community structure between soils (data not shown) and with time (Appendix
C, Figures C.5, C.6). These findings were further supported by MRPP analysis which
indicated significant differences in the distribution of mol % FAME between time periods
(p < 0.0001). Indicator species analysis showed that fatty acids i15:0 and a15:0
consistently separated treatments over time (p < 0.01) for the Theresa soil and that i15:0,
161
a15:0, i16:0, 18:2w, 18:1w7, and 10Me18:0 consistently separated treatments over time
(p<0.01) for the Appling soil.
The NMS, MRPP, and indicator species analysis was re-run for each soil and time
period to determine significant differences between treatments. To simplify the
discussion of the effects of earthworms and TNT on the microbial community we focused
on the results at 21 d which covers the entire time scale of the study. The NMS results
for the Appling and Theresa soil at 7 and 14 d can be found in Appendix C (Figures C.7-
C.10). Further NMS analysis performed on both soils at 21 d clearly shows differences
in the microbial community structure between treatments for the whole soil and all
aggregate size fractions (Figures 5.7., 5.8). An MRPP analysis further indicated
significant differences in the distribution of mol % of FAMEs between the treatments for
both soils at 21 d (p < 0.0001). Indicator species analysis at 21 d showed that cy17:0,
16:1w7, 10Me16:0, 20:0 and 22:0 consistently separated treatments (p < 0.01) across all
aggregate size fractions and the whole soil in the Theresa soil and 18:2w, i15:0, 18:1w7,
and cy19:0 consistently separated treatments (p < 0.01) in the Appling soil.
Analysis of individual FAMEs and specific groups which are indicative of certain
microbial organisms (i.e. gram-negative bacteria, fungi, etc.) can provide interesting
perspective into the impact of earthworms and TNT on the soil microbial community. In
addition, the total amount of fatty acids as determined by FAME can provide a relative
estimate of the total microbial population represented by the measured fatty acids.
However, since the extraction of FAMEs are not as selective as other methods (i.e.
phospholipid fatty acids, PLFAs), they do not provide a definite measure of microbial
biomass (Vestal and White, 1989; Schutter and Dick 2000; Mummey et al. 2002). In the
162
Appling soil there were no differences in the amount of total FAMEs between the control
and three treatments. In the Theresa whole soil there was a net decrease in total fatty
acids in the soil with earthworms (97.5 nmol g-1) and the soil with earthworms and TNT
(127.9 nmol g-1) compared to the soil without either (197.9 nmol g-1). Studies have
shown that depending on various environmental parameters such as temperature,
moisture, soil type, and substrate quality earthworms can have either a positive influence
(Parkinson and McLean, 1998; Postma-Blaauw et al., 2006; Binet et al., 2006) or a
negative influence on microbial biomass and microbial activity (Saetre et al., 1998;
Groffman et al., 2004). Interestingly, in the Theresa whole soil and soil aggregates > 250
μm there was no difference in the amount of fatty acids between the control (- Ew –
TNT) and the soil exposed to TNT (- Ew + TNT), thus suggesting that TNT had no
impact on the total biomass or any individual indicator (i.e. gram-negative bacteria). This
is in contrast to the findings of Wilke et al. (2004) who reported a decrease in the amount
of fatty acids due to the presence of TNT. Other studies have also indicated a decrease in
microbial activity as a result of TNT, (Fuller and Manning, 1998; Gong et al., 1999;
Siciliano et al., 2000), hydrocarbons (Schaefer et al., 2005), and pesticides such as
imazethapyr (Perucci and Scarponi, 1994). In the Theresa soil after 7 d there was < 4.2
and after 21 d < 1.1 mg kg-1 of readily available TNT in the whole soil or in any of the
aggregate size fractions (Figures 5.3, 5.4). This accounted for 8-18% of the total
extractable TNT in the soil. Thus, the low bioavailability and high amount of sequestered
TNT could explain the lack of an effect on the microbial community.
Examining changes in the mol % of fatty acids rather than the amount (nmol /g)
helps to identify changes in the microbial community structure (Vestal and White, 1989).
163
With respect to the mol % of fatty acids in the whole soil there were occasions where
there was contrasting results between the Theresa and Appling soils (Tables 5.2, 5.3).
For example, earthworm activity (+ Ew – TNT and + Ew +TNT) in the Theresa whole
soil and 2000 – 4000 μm aggregates resulted in a decrease in biomarkers indicative of
gram-positive bacteria relative to the treatments without earthworms (- Ew – TNT and –
Ew + TNT). Fuller and Manning (1998) reported similar reductions in gram-positive
bacteria in soils contaminated with TNT. However, in the Appling soil, the presence of
TNT and earthworms (+ Ew + TNT) in the whole soil resulted in no change in the mol %
of gram-positive indicators compared to the control (Table 5.2, 5.3). Additionally, in the
Appling whole soil and 500 – 2000 μm aggregates with TNT and earthworms (+ Ew +
TNT) there was a reduction in the mol % of 18:2ω and 18:1ω9 (fungal biomarkers)
compared to the soil without earthworms or TNT (-Ew – TNT). However in the Theresa
whole soil and 75 – 250 μm aggregates with TNT and earthworms there was an increase
in 18:2ω and 18:1ω9 compared to the soil without earthworms or TNT. Finally,
earthworm activity resulted in a decrease in 10Me16:0 and 10Me18:0 (actinomycetes
biomarkers) in the Appling whole soil yet there was an increase in these same biomarkers
in the whole soil and 2000 – 4000 μm aggregates of the Theresa soil. Frostegard et al.
(1993) reported contrasting impacts of metal contamination on actinomycetes biomarkers
(10Me16:0, 10Me18:0) in an arable and forest soil. These results suggest that ability of
specific organisms to tolerate organic or inorganic contaminates is in part a function of
soil characteristics (i.e. organic matter, clay content, pH, etc).
We also found contrasts in the mol % of 18:2ω in various aggregate size
fractions. In 250 - 500 μm aggregates of the Theresa soil exposed to TNT and
164
earthworms (+ Ew + TNT) there were 5.1% of 18:2ω compared to 6.3% in the control (-
Ew – TNT). Alternatively, in 75 - 250 μm aggregates exposed to TNT and earthworms
there was 12.8% of 18:2ω compared to 11.8% in the control. This same trend, although
not significant was observed between the aggregates exposed to TNT and the control.
This suggests that fungi associated with the larger 250 – 500 μm size fraction may be
more sensitive to TNT and metabolites than those associated with 75 – 250 μm size
fraction. Specific species of soil fungi (i.e. such as Cladosporium resinae) have
demonstrated the ability to transform TNT via azoxy- and hydroxyl intermediates to 2-
ADNT and 4-ADNT (Bayman and Radkar, 1997). Although not proven, the relative
increase in fungal biomarkers in 75 – 250 μm exposed to TNT may be due to the
tolerance of specific fungi associated with that size fraction. The contrasting differences
in specific biomarkers response to treatments between soils could be attributed to a
number of factors related to the earthworms or TNT including, but not limited to, TNT
bioavailability in each soil, earthworm influence on microbial properties (i.e. ingested
and excreted substrate quality), and the influence (or lack there of) of earthworms on
predatory organisms such as protozoa (Edwards and Bohlen, 1996).
Unique differences in the microbial community composition between the two
soils and among treatments were also discovered in various aggregate size fractions. In
75 – 250, 500 – 2000, and 2000 – 4000 μm aggregates of the Theresa soil earthworm
activity (+ Ew – TNT) increased the mol % of fatty acids indicative of gram-negative
bacteria compared to the control (- Ew – TNT). The same increase due to both
earthworms and TNT also occurred in 500 – 2000 and 2000 – 4000 μm aggregates of the
Appling soil. Similarly the presence of TNT (- EW + TNT) in 75-250 and 2000 – 4000
165
μm aggregates of the Theresa soil and 250 – 500 μm aggregates of the Appling soil
resulted in an increase in the mol % of gram-negative biomarkers. The increase in gram-
negative bacteria relative to other biomarkers suggests that these organisms were able to
tolerate or may have experienced favorable conditions as a result of the exposure to TNT
and earthworms compared to other organisms. Research has shown that certain gram-
negative bacteria such as Pseudomonas putida, Pseudomonas aeruginosa, and
Pseudomonas fluorescens can transform TNT via the production of nitroreductase or
other enzymatic pathways (Pak et al., 2000; Vasilyeva et al., 2000; Oh et a., 2001; Park et
al., 2003). The fact that these organisms can transform TNT under various conditions
suggests that they are capable of tolerating exposure to TNT. The increase in gram
negative biomarkers in 2000 – 4000 and 500 – 2000 μm aggregates exposed to TNT and
earthworms in both soils compared to the control provides indirect evidence that
earthworm activity may have stimulated soil organisms capable of transforming TNT.
This may further explain the differences in TNT disappearance and the amount of 2-
ADNT and 4-ADNT extracted from these aggregate size classes in both soils.
Compared to the control, TNT and earthworms resulted in an increase in cy17:0
in 2000 – 4000 μm aggregates and in cy17:0 and cy19:0 in 500 – 2000 μm aggregates of
the Appling soil. Increases in the mole % of these fatty acids have previously been an
indication of microbial community stress (White, 1993). This would follow with our
previous conclusions that TNT was more bioavailable in the Appling soil compared to
the Theresa soil. However, there was a greater mol % of cy17:0 in 250 – 500 μm
aggregates of the Theresa soil exposed to earthworms and TNT compared to the control,
suggesting potential sensitivity to TNT in this specific size fraction.
166
4. Conclusions
Using soil microcosms and the earthworm Eisenia fetida we have demonstrated
that earthworms can have a direct impact on the bioavailability of TNT in the soil and
soil aggregates. The extent to which earthworms influence the transformation and fate of
TNT depends on the sorption and sequestration of TNT within the soil. Earthworm
impact on the fate of TNT is greatly diminished when TNT is adsorbed and/or forms
irreversibly bound residues. However, earthworm activity can affect the distribution of
TNT and metabolites in soil regardless of binding strength and extractability. When TNT
and/metabolites are tightly bound in soil similar to the Theresa soil used in this study,
earthworms can redistribute these contaminants from small aggregates <500 μm into
large aggregates > 2000 μm. TNT also had a negative influence on earthworm activity
and soil aggregation compared to soil without TNT. Our results also indicate that
earthworms and TNT individually or together can alter the microbial community
structure as an increase in gram-negative bacteria biomarkers was observed in both soils,
particularly in aggregates > 500 μm in the Appling soil and aggregates > 250 μm in the
Theresa soil. To what extent earthworms along with soil organisms are able to facilitate
the transformation of TNT into a variety of metabolites remains to be seen. Studies
involving the use of tracers (such as 14C) and molecular level approaches (NMR, IR
analysis of earthworm casts) will provided further insight into TNT – soil aggregate
dynamics. In addition, based on the results of this study, further research is needed to
better characterize how earthworms along with other soil organisms can facilitate and/or
alter the environmental fate of TNT, particularly how they may affect microorganisms
167
which are specifically known to transform and cometabolize TNT. This would have wide
ranging implications risk assessment and on various remediation technologies such as
composting and phytoremediation where earthworms could contribute to the remediation
of TNT.
168
References
Achtnich, C., U. Sieglen, H.-J. Knackmuss, and H. Lenke. 1999. Irreversible binding of biologically reduced 2,4,6-trinitrotoluene to soil. Environ. Toxicol. Chem. 18: 2416-2423.
Bayman, P., and G.V. Radkar. 1997. Transformation and tolerance of TNT (2,4,6- trinitrotoluene) by fungi. Int. Biodeter. Biodegr. 39: 45-53.
Binet,F., A. Kersante, C. Munier-Lamy, R.-C. Le Bayon, M.-J. Belgy, and M.J. Shipitalo. 2006. Lumbricid macrofauna alter atrazine mineralization and sorption in a silt loam soil. Soil Bio. Biochem. 38: 1255-1263.
Boopathy, R. 2000. Bioremediation of explosives contaminated soil. Int. Biodeter. Biodegr. 46: 29-36.
Bossuyt, H., J. Six, and P.F. Hendrix. 2002. Aggregate-protected carbon in no-tillage and conventional tillage agroecosystems using carbon-14 labeled plant residue. Soil Sci. Soc. Am. J. 66: 1965-1973.
Bossuyt, H., J. Six, and P.F. Hendrix. 2004. Rapid incorporation of carbon from fresh residues into newly formed stable microaggregates within earthworm casts. Eur. J. Soil Sci. 55: 393-399.
Bossuyt, H., J. Six, and P.F. Hendrix. 2005. Protection of soil carbon by microaggregates within earthworm casts. Soil Biol. Biochem. 37: 251-258.
Caton, J.E., C.-H. Ho, R.T. Williams, and W.H. Griest. 1994. Characterization of insoluble fractions of TNT transformed by composting. J. Environ. Sci. Health A 29: 659-670.
Coleman, D.C., D.A. Crossley, and P.F. Hendrix. 2004. Fundamentals of soil ecology. 2nd ed. Elsevier, New York.
Comfort, S.D., P.J. Shea, L.S. Hundal, Z. Li, B.L. Woodbury, and W.L. Powers. 1995. TNT transport and fate in contaminated soil. J. Environ. Qual. 24: 1174-1182.
Corbett, M.D., and B.R. Corbett. 1995. Bioorganic chemistry of the arylhydroxylamine and nitrosoarene functional groups. p. 151-182. In Biodegradation of nitroaromatic compounds. Spain, J.C. (ed). New York, Plenum Press.
Dodard, S.G., A.Y. Renoux, J. Powlowski, and G.I. Sunahara. 2003. Lethal and subchronic effects of 2,4,6-trinitrotoluene (TNT) on Enchytraeus albidus in spiked artificial soil. Ecotox. Environ. Saf. 54: 131-138.
Edwards, C.A., and P.J. Bohlen. 1996. Biology and ecology of earthworms. Chapman &
169
Hall, London, UK.
Elovitz, M.S., and E.J. Weber. 1999. Sediment-mediated reduction of 2,4,6- trinitrotoluene and fate of the resulting aromatic (poly)amines. Environ. Sci. Technol. 33: 2617-2625.
Eriksson, J., and U. Skyllberg. 2001. Binding of 2,4,6-trinitrotoluene and its degradation products in a soil organic matter two-phase system. J. Environ. Qual. 30: 2053-2061.
Esteve-Nunez A., A. Caballero, and J.L. Ramos. 2001. Biological degradation of 2,4,6- trinitrotoluene. Microbiol. Mol. Biol. Rev. 65: 335-352.
Frostegard, A., A. Tunlid, and E. Baath. 1993. Phospholipid fatty acid composition, biomass, and activity of microbial communities from two soil types experimentally exposed to different heavy metals. App. Environ. Microbiol. 59: 3605-3617.
Fuller, M.E., and J.F. Manning. 1998. Evidence for differential effects of 2,4,6-
trinitrotoluene and other munitions compounds on specific subpopulations of soil microbial communities. Environ. Toxicol. Chem. 17: 2185-2195.
Gevao, B., C. Mordaunt, K.T. Semple, T.G. Piearce, and K.C. Jones. 2001. Bioavailability of nonextractable (bound) pesticide residues to earthworms. Environ. Sci. Technol. 35: 501-507.
Gong, P., S.D. Siciliano, C.W. Greer, L. Paquet, and J. Hawari, and G.I. Sunahara. 1999. Effects and bioavailability of 2,4,6-trinitrotoluene in spiked and field-contaminated soils to indigenous microorganisms. Environ. Toxicol. Chem. 18: 2681-2688.
Groffman, P.M., P.J. Bohlen, M.C. Fisk, and T.J. Fahey. 2004. Exotic earthworm invasion and microbial biomass in temperate forest soils. Ecosystems 7: 45-54.
Haderlein, S.B., K.H. Weissmahr, and R.P. Schwarzenbach. 1996. Specific adsorption of nitroaromatic explosives and pesticides to clay minerals. Environ. Sci. Technol. 30: 612-622.
Hawari, J., A. Halasz, L. Paquet, E. Zhou, B. Spencer, G. Ampleman, and S. Thiboutot. 1998. Characterization of metabolites in the biotransformation of 2,4,6-trinitrotoluene with anaerobic sludge: Role of triaminotoluene. Appl. Environ. Micro. 64: 2200-2206.
Hawari, J., S. Beaudet, A. Halasz, S. Thiboutot, and G. Ampleman. 2000. Microbial degradation of explosives: Biotransformation versus mineralization. App. Microbiol. Biotechnol. 54: 605-618.
170
Hundal, L., P.J. Shea, S.D. Comfort, and W.L. Powers, and J. Singh. 1997. Long-term TNT sorption and bound residue formation in soil. J. Environ. Qual. 26: 896-904
Isbister, J.D., G.L. Anspach, J.F. Kitchens, and R.C. Doyle. 1984. Composting for decontamination of soils containing explosives. Microbiologia. 7: 47-73.
Jerger, D.E., and P.E. Woodhull. 2000. Applications and costs for biological treatment of explosives contaminated soil in the U.S. p. 395-424. In Biodegradation of nitroaromatic compounds and explosives. Spain, J.C., Joseph B. Hughes, and Hans-Joachim Knackmuss (eds). Boca Raton: CRC Press.
Kaplan, D.L., and A.M. Kaplan. 1982. Thermophilic biotransformation of 2,4,6- trinitrotoluene under simulated composting conditions. Appl. Environ. Micro. 44: 757-760.
Keith, L.H., and W.A. Telliard. 1979. Priority pollutants. I. A perspective view. Environ. Sci. Technol. 13: 416-423.
Lachance, B., A.Y. Renoux, M. Sarrazin, J. Hawari, and G.I. Sunahara. 2004. Toxicity and bioaccumulation of reduced TNT metabolites in the earthworm Eisenia andrei exposed to amended forest soil. Chemosphere 55: 1339-1348.
Lee, K.E., 1985. Earthworms: Their ecology and relationships with soils and land use. Academic Press. Sydney.
Lee, K.E., and R.C. Foster. 1991. Soil fauna and soil structure. Aust. J. Soil Res. 29: 745- 776.
Lewis, T.A., D.A. Newcombe, and R.L. Crawford. 2004. Bioremediation of soils
contaminated with explosives. J. Environ. Manage. 70: 291-307.
Lowe C.N., and K.R. Butt. 2004. Influence of food particle size on inter- and intra- specific interactions of Allolobophora chlorotica (Savigny) and Lumbricus terrestris. Pedobiologia 47: 574-577.
Martin, A. 1991. Short- and long-term effects of the endogeic earthworm Millsonia anomala (Omodeo) (Megascolecidae Oligochaeta) of tropical savannas on soil organic matter. Biol. Fert. Soils 11: 234-238.
Martin, A., J. and C.Y. Marinissen, 1993. Biological and physico-chemical processes in excrements of soil animals. Geoderma 56: 331-347.
McCune, B., and M.J. Mefford. 1999. PC-ORD Multivariate analysis of ecological data. Version 4.0 MjM Software, Gleneden Beach, Oregon, USA.
McCune, B., and J.B. Grace. 2002. Analysis of ecological communities. MjM Software
171
Design, Gleneden Beach, Oregon, USA.
McGrath, C.J. 1995. Review of formulations for processes affecting subsurface transport of explosives. Technical Report IRRP-95-2. U.S. Army Engineer Waterways Experiment Station, Vicksburg, MS.
Mummey, D.L., P.D. Stahl, and J.S. Buyer. 2002. Microbial biomarkers as an indicator of ecosystem recovery following surface mine reclamation. App. Soil Ecol. 21: 251-259.
National Research Council. 2003. Bioavailability of contaminants in soil sand sediments: Processes, tools, and applications. National Academy Press, Washington D.C.
Oh, B.-T., G. Sarath, and P.J. Shea. 2001. TNT nitroreductase from a Pseudomonas aeruginosa strain isolated from TNT-contaminated soil. Soil Bio. Biochem. 33: 875-881.
Pak, J.W., K.L. Knoke, D.R. Noguera, B.G. Fox, and G.H. Chambliss. 2000. Transformation of 2,4,6-trinitrotoleune purified xenobiotic reductase B from Pseudomonas fluorescens I-C. App. Enviro. Microbiol. 66: 4742-4750.
Park, C., T.-H. Kim, S. Kim, S.-W. Kim, J. Lee, and S.-H. Kim. 2003. Optimization for biodegradation of 2,4,6-trinitrotoluene (TNT) by Pseudomonas putida. J. Biosci. Bioeng. 95: 567-571.
Parkinson, D. and M.A. McLean. 1998. Impacts of earthworms on the community structure of other biota in forest soils. p. 213-226. In Earthworm ecology Edwards C.A. (ed.) CRC Press, Baca Raton, FL.
Parmelee, R.W., R.S. Wentsel, C.T. Philips, M. Simini, and R.T. Checkai. 1993. Soil microcosm for testing the effects of chemical pollutants on soil fauna communities and trophic structure. Environ. Toxicol. Chem. 12: 1477-1486.
Pennington, J.C., and W.H. Patrick. 1990. Adsorption and desorption of 2,4,6- trinitrotoluene by soils. J. Environ. Qual. 19: 559-567.
Pennington J.C., C.A Hayes, K.F. Myers, M. Ochman, D. Gunnison, D.R. Felt D.R, and E.F. McCormick. 1995. Fate of 2,4,6-trinitrotoluene in a simulated compost system. Chemosphere 30:429-438.
Pennington, J.C., and J.M. Brannon. 2002. Environmental fate of explosives. Thermochimica Acta 384: 163-172.
Perucci, P., and L. Scarponi. 1994. Effects of the herbicide imazethapyr on soil microbial biomass and various soil enzyme activities. Bio. Fert. Soils 17: 237-240.
172
Phillips, C.T., R.T. Checkai, and R.S. Wetsel. 1993. Toxicity of selected munitions and munition-contaminated soil on the earthworm (Eisenia foetida). Edgewood Research Development and Engineering Center. U.S. Army Chemical and Biological Defense Agency, Aberdeen Proving Ground, MD., ERDEC-TR-037.
Piearce, T.G. 1978. Gut contents of some lumbricid earthworms. Pedobiologia 18: 153- 157.
Postma-Blaauw, M.B., J. Bloem, J.H. Faber, J.W. van Groenigen, R.G.M. and de Goede,
L. Brussaard. 2006. Earthworm species composition affects the soil bacterial community and net nitrogen mineralization. Pedobiologia 50: 243-256.
Renoux, A.Y., M. Sarrazin, J. Hawari, and G.I. Sunahara. 2000. Transformation of 2,4,6- trinitrotoluene in soil in the presence of the earthworm Eisenia Andrei. Environ. Toxicol. Chem. 19: 1473-1480.
Robertson, B.K., and P.K. Jjemba. 2005. Enhanced bioavailability of sorbed 2,4,6- trinitrotoluene (TNT) by a bacterial consortium. Chemosphere 58: 263-270.
Robidoux, P.Y., J. Hawari, S. Thiboutot, G. Ampleman, and G.I. Sunahara. 1999. Acute toxicity of 2,4,6-trinitrotoluene in earthworm (Eisenia andrei). Ecotox. Environ. Saf. 44: 311-321.
Robidoux, P.Y., C. Svendsen, J. Caumartin, J. Hawari, G. Ampleman, S. Thiboutot, J.M. Weeks, and G.I. Sunahara. 2000. Chronic toxicity of energetic compounds in soil determined using the earthworm (Eisenia andrei) reproduction test. Environ. Toxicol. Chem. 19: 1764-1773.
Robidoux, P.Y., C. Svendsen, M. Sarrazin, S. Thiboutot, G. Ampleman, J. Hawari, J.M. Weeks, and G.I. Sunahara. 2004. Assessment of a 2,4,6-trinitrotoluene-contaminated site using Aporrectodea rosea and Eisenia andrei in mesocosms. Arch. Environ. Contam. Toxicol. 48: 56-67.
Rodgers, J.D., and N.J. Brunce. 2001. Treatment methods for the remediation of nitroaromatic explosives. Water Res. 35: 2101-2111.
Saetre, P. 1998. Decomposition, microbial community structure, and earthworm effects along a birch-spruce soil gradient. Ecology 79: 834-846.
Schaefer, M. 2004. Assessing 2,4,6-trinitrotoluene (TNT)-contaminated soil using three different earthworm test methods. Ecotox. Environ. Saf. 57: 74-80.
Schaefer, M., S.O. Petersen, and J. Filser. 2005. Effects of Lumbricus terrestris, Allolobophora chlorotica and Eisenia fetida on microbial community dynamics in oil-contaminated soil. Soil Bio. Biochem. 37: 2065-2076.
173
Schutter, M.E., and R.P. Dick. 2000. Comparison of fatty acid methyl ester (FAME) methods for characterizing microbial communities. Soil Sci. Soc. Am. J. 64:1659-1668.
Scullion J., and A. Malik. 2000. Earthworm activity affecting organic matter, aggregation and microbial activity in soils restored after open case mining for coal. Soil Bio. Biochem. 32: 119-126.
Selim, H.M., S.K. Xue, and I.K. Iskandar. 1995. Transport of 2,4,6-trinitrotoluene and hexahydro-1,3,5-trinitro-1,3,5-triazine in soils. Soil Sci. 160: 328-339.
Sheremata, T.W., S. Thiboutot, G. Ampleman, L. Paquet, A. Halasz, and J. Hawari 1999. Fate of 2,4,6-trinitrotoluene and its metabolites in natural and model soil systems. Environ. Sci. Technol. 33: 4002-4008.
Shipitalo M.J., and R. Protz. 1989. Chemistry and micromorphology of aggregation in earthworm casts. Geoderma 45: 357-374.
Siciliano, S.D., R. Roy, and C.W. Greer. 2000. Reduction in denitrification activity in field soils exposed to long term contamination by 2,4,6-trinitrotoluene (TNT). FEMS Microbiol. Ecol. 32: 61-68.
Simini, M., R.W. Wentsel, R. Checkai, C. Phillips, N.A. Chester, M.A. Major, and J.C. Amos.1995. Evaluation of soil toxicity at Joliet army ammunition plant. Environ. Toxicol. Chem. 14: 623-630.
Talmage, S.S., D.M. Opresko, C.J. Maxwell, C.J. Welsh, F.M. Cretella, P.H. Reno, and F.B. Daniel. 1999. Nitroaromatic munition compounds: Environmental effects and screening values. Rev. Environ. Contam. Toxicol. 161: 1-156.
Thorne, P.G., and D.C. Leggett 1997. Hydrolytic release of bound residues from composted soil contaminated with 2,4,6-trinitrotoluene. Environ. Toxicol. Chem. 16: 1132-1134.
USEPA. 2006. EPA Mid-Atlantic Risk Assessment, retrieved June 4th 2006, http://www.epa.gov/reg3hwmd/risk/index.htm
Vasilyeva, G.K., B.-T. Oh, P.J. Shea, R.A. Drijber, V.D. Kreslavski, R. Minard, and J.- M. Bollag. 2000. Aerobic TNT reduction via 2-hydroxylamino-4,6-dinitrotoluene by Pseudomonas aeruginosa strain MX isolated from munitions-contaminated soil. Bioremed. J 4: 111-124.
Vasilyeva, G.K., V.D. Kreslavski, B.-T. Oh, and P.J. Shea. 2001. Potential of activated carbon to decrease 2,4,6-trinitrotoluene toxicity and accelerate soil decontamination. Environ. Toxicol. Chem. 20: 965-971.
174
Vestal, J.R., and D.C. White. 1989. Lipid analysis in microbial ecology: Quantitative approaches to the study of microbial communities. Bioscience 39: 535-541.
Vorbeck, C., H. Lenke, P. Fischer, J.C. Spain, and H.-J. Knackmuss. 1998. Initial reductive reactions in aerobic microbial metabolism. App. Environ. Microbiol. 64: 246-252.
Wang, C.-J., S. Thiele , and J.-M. Bollag. 2002. Interaction of 2,4,6-trinitrotoluene (TNT) and 4-amino-2,6-dinitrotoluene with humic monomers in the presence of oxidative enzymes. Arch. Environ. Contam. Toxicol. 42: 1-8.
White, D.C. 1993. In-situ measurement of microbial biomass, community structure and nutritional-status. Philos. T. Roy. Soc. B 344: 59-67.
Wilke, B.-M., A. Gattinger, E. Frohlich, L. Zelles, and P. Gong. 2004. Phospholipid fatty acid composition of a 2,4,6-trinitrotoluene contaminated soil and an uncontaminated soil as affected by a humification remediation process. Soil Bio. Biochem. 36:725-729.
Zhang, H., and S. Schrader. 1993. Earthworm effects on selected physical and chemical properties of soil aggregates. Biol. Fertil. Soils 15: 229-234.
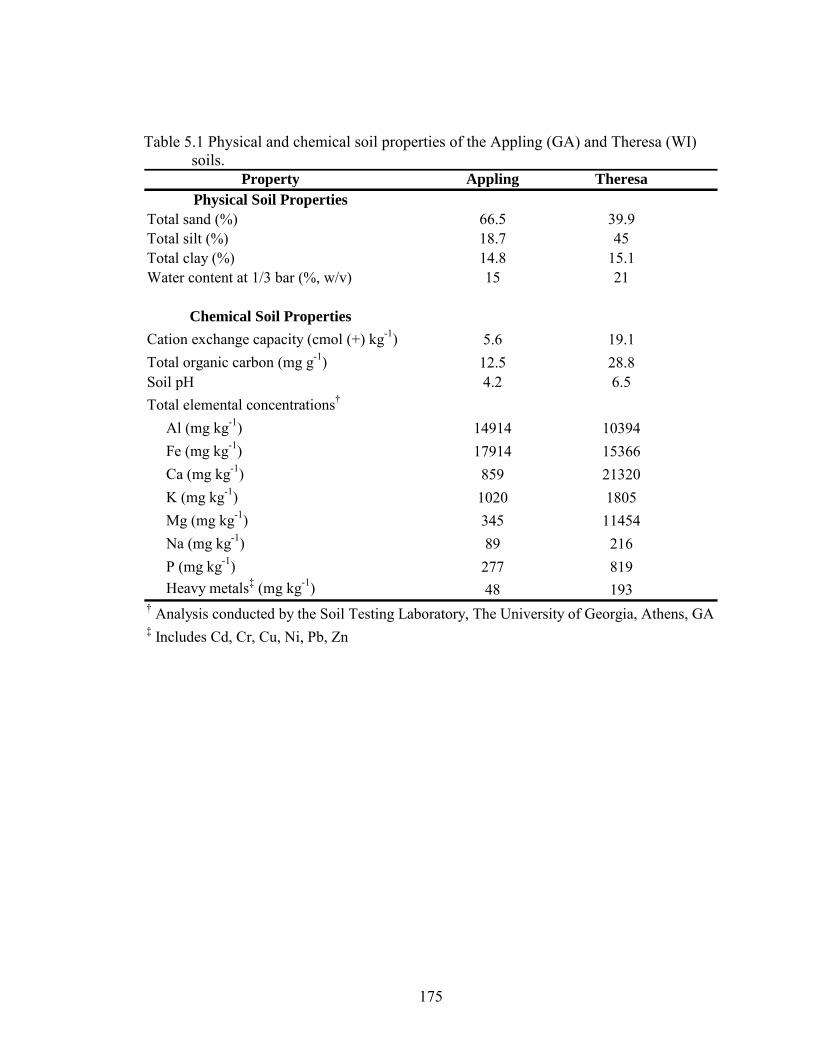
175
Table 5.1 Physical and chemical soil properties of the Appling (GA) and Theresa (WI) soils.
Property Appling TheresaPhysical Soil Properties
Total sand (%) 66.5 39.9Total silt (%) 18.7 45Total clay (%) 14.8 15.1Water content at 1/3 bar (%, w/v) 15 21
Chemical Soil PropertiesCation exchange capacity (cmol (+) kg-1) 5.6 19.1Total organic carbon (mg g-1) 12.5 28.8Soil pH 4.2 6.5Total elemental concentrations†
Al (mg kg-1) 14914 10394 Fe (mg kg-1) 17914 15366 Ca (mg kg-1) 859 21320 K (mg kg-1) 1020 1805 Mg (mg kg-1) 345 11454 Na (mg kg-1) 89 216 P (mg kg-1) 277 819 Heavy metals‡ (mg kg-1) 48 193† Analysis conducted by the Soil Testing Laboratory, The University of Georgia, Athens, GA‡ Includes Cd, Cr, Cu, Ni, Pb, Zn
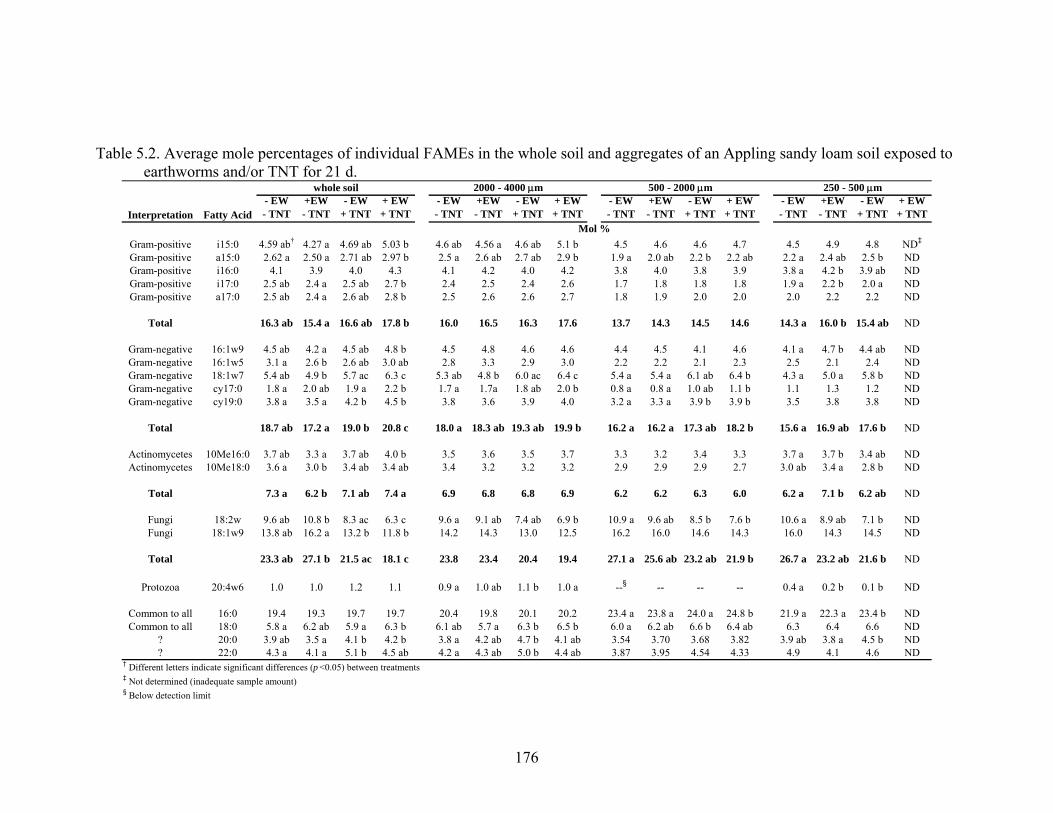
176
Table 5.2. Average mole percentages of individual FAMEs in the whole soil and aggregates of an Appling sandy loam soil exposed to earthworms and/or TNT for 21 d.
Interpretation Fatty Acid- EW - TNT
+EW - TNT
- EW + TNT
+ EW + TNT
- EW - TNT
+EW - TNT
- EW + TNT
+ EW + TNT
- EW - TNT
+EW - TNT
- EW + TNT
+ EW + TNT
- EW - TNT
+EW - TNT
- EW + TNT
+ EW + TNT
Gram-positive i15:0 4.59 ab† 4.27 a 4.69 ab 5.03 b 4.6 ab 4.56 a 4.6 ab 5.1 b 4.5 4.6 4.6 4.7 4.5 4.9 4.8 ND‡
Gram-positive a15:0 2.62 a 2.50 a 2.71 ab 2.97 b 2.5 a 2.6 ab 2.7 ab 2.9 b 1.9 a 2.0 ab 2.2 b 2.2 ab 2.2 a 2.4 ab 2.5 b NDGram-positive i16:0 4.1 3.9 4.0 4.3 4.1 4.2 4.0 4.2 3.8 4.0 3.8 3.9 3.8 a 4.2 b 3.9 ab NDGram-positive i17:0 2.5 ab 2.4 a 2.5 ab 2.7 b 2.4 2.5 2.4 2.6 1.7 1.8 1.8 1.8 1.9 a 2.2 b 2.0 a NDGram-positive a17:0 2.5 ab 2.4 a 2.6 ab 2.8 b 2.5 2.6 2.6 2.7 1.8 1.9 2.0 2.0 2.0 2.2 2.2 ND
Total 16.3 ab 15.4 a 16.6 ab 17.8 b 16.0 16.5 16.3 17.6 13.7 14.3 14.5 14.6 14.3 a 16.0 b 15.4 ab ND
Gram-negative 16:1w9 4.5 ab 4.2 a 4.5 ab 4.8 b 4.5 4.8 4.6 4.6 4.4 4.5 4.1 4.6 4.1 a 4.7 b 4.4 ab NDGram-negative 16:1w5 3.1 a 2.6 b 2.6 ab 3.0 ab 2.8 3.3 2.9 3.0 2.2 2.2 2.1 2.3 2.5 2.1 2.4 NDGram-negative 18:1w7 5.4 ab 4.9 b 5.7 ac 6.3 c 5.3 ab 4.8 b 6.0 ac 6.4 c 5.4 a 5.4 a 6.1 ab 6.4 b 4.3 a 5.0 a 5.8 b NDGram-negative cy17:0 1.8 a 2.0 ab 1.9 a 2.2 b 1.7 a 1.7a 1.8 ab 2.0 b 0.8 a 0.8 a 1.0 ab 1.1 b 1.1 1.3 1.2 NDGram-negative cy19:0 3.8 a 3.5 a 4.2 b 4.5 b 3.8 3.6 3.9 4.0 3.2 a 3.3 a 3.9 b 3.9 b 3.5 3.8 3.8 ND
Total 18.7 ab 17.2 a 19.0 b 20.8 c 18.0 a 18.3 ab 19.3 ab 19.9 b 16.2 a 16.2 a 17.3 ab 18.2 b 15.6 a 16.9 ab 17.6 b ND
Actinomycetes 10Me16:0 3.7 ab 3.3 a 3.7 ab 4.0 b 3.5 3.6 3.5 3.7 3.3 3.2 3.4 3.3 3.7 a 3.7 b 3.4 ab NDActinomycetes 10Me18:0 3.6 a 3.0 b 3.4 ab 3.4 ab 3.4 3.2 3.2 3.2 2.9 2.9 2.9 2.7 3.0 ab 3.4 a 2.8 b ND
Total 7.3 a 6.2 b 7.1 ab 7.4 a 6.9 6.8 6.8 6.9 6.2 6.2 6.3 6.0 6.2 a 7.1 b 6.2 ab ND
Fungi 18:2w 9.6 ab 10.8 b 8.3 ac 6.3 c 9.6 a 9.1 ab 7.4 ab 6.9 b 10.9 a 9.6 ab 8.5 b 7.6 b 10.6 a 8.9 ab 7.1 b NDFungi 18:1w9 13.8 ab 16.2 a 13.2 b 11.8 b 14.2 14.3 13.0 12.5 16.2 16.0 14.6 14.3 16.0 14.3 14.5 ND
Total 23.3 ab 27.1 b 21.5 ac 18.1 c 23.8 23.4 20.4 19.4 27.1 a 25.6 ab 23.2 ab 21.9 b 26.7 a 23.2 ab 21.6 b ND
Protozoa 20:4w6 1.0 1.0 1.2 1.1 0.9 a 1.0 ab 1.1 b 1.0 a --§ -- -- -- 0.4 a 0.2 b 0.1 b ND
Common to all 16:0 19.4 19.3 19.7 19.7 20.4 19.8 20.1 20.2 23.4 a 23.8 a 24.0 a 24.8 b 21.9 a 22.3 a 23.4 b NDCommon to all 18:0 5.8 a 6.2 ab 5.9 a 6.3 b 6.1 ab 5.7 a 6.3 b 6.5 b 6.0 a 6.2 ab 6.6 b 6.4 ab 6.3 6.4 6.6 ND
? 20:0 3.9 ab 3.5 a 4.1 b 4.2 b 3.8 a 4.2 ab 4.7 b 4.1 ab 3.54 3.70 3.68 3.82 3.9 ab 3.8 a 4.5 b ND? 22:0 4.3 a 4.1 a 5.1 b 4.5 ab 4.2 a 4.3 ab 5.0 b 4.4 ab 3.87 3.95 4.54 4.33 4.9 4.1 4.6 ND
† Different letters indicate significant differences (p <0.05) between treatments‡ Not determined (inadequate sample amount)§ Below detection limit
Mol %
whole soil 2000 - 4000 μm 500 - 2000 μm 250 - 500 μm
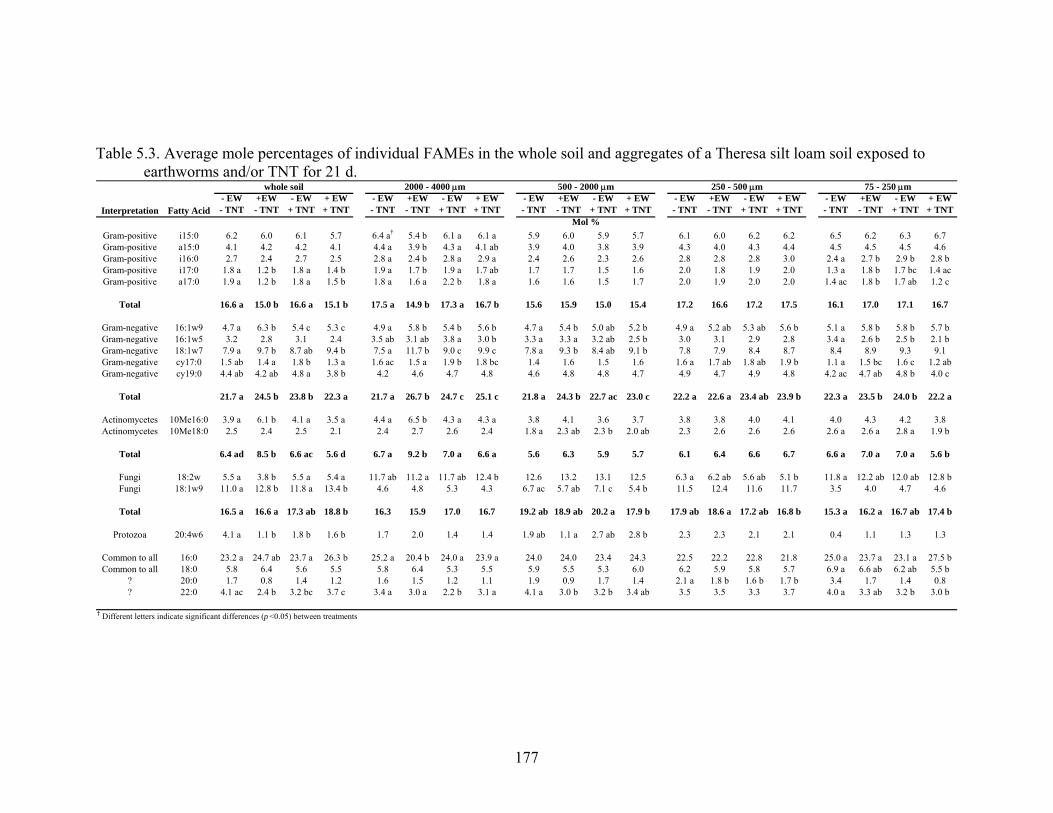
177
Table 5.3. Average mole percentages of individual FAMEs in the whole soil and aggregates of a Theresa silt loam soil exposed to earthworms and/or TNT for 21 d.
Interpretation Fatty Acid- EW - TNT
+EW - TNT
- EW + TNT
+ EW + TNT
- EW - TNT
+EW - TNT
- EW + TNT
+ EW + TNT
- EW - TNT
+EW - TNT
- EW + TNT
+ EW + TNT
- EW - TNT
+EW - TNT
- EW + TNT
+ EW + TNT
- EW - TNT
+EW - TNT
- EW + TNT
+ EW + TNT
Gram-positive i15:0 6.2 6.0 6.1 5.7 6.4 a† 5.4 b 6.1 a 6.1 a 5.9 6.0 5.9 5.7 6.1 6.0 6.2 6.2 6.5 6.2 6.3 6.7Gram-positive a15:0 4.1 4.2 4.2 4.1 4.4 a 3.9 b 4.3 a 4.1 ab 3.9 4.0 3.8 3.9 4.3 4.0 4.3 4.4 4.5 4.5 4.5 4.6Gram-positive i16:0 2.7 2.4 2.7 2.5 2.8 a 2.4 b 2.8 a 2.9 a 2.4 2.6 2.3 2.6 2.8 2.8 2.8 3.0 2.4 a 2.7 b 2.9 b 2.8 bGram-positive i17:0 1.8 a 1.2 b 1.8 a 1.4 b 1.9 a 1.7 b 1.9 a 1.7 ab 1.7 1.7 1.5 1.6 2.0 1.8 1.9 2.0 1.3 a 1.8 b 1.7 bc 1.4 acGram-positive a17:0 1.9 a 1.2 b 1.8 a 1.5 b 1.8 a 1.6 a 2.2 b 1.8 a 1.6 1.6 1.5 1.7 2.0 1.9 2.0 2.0 1.4 ac 1.8 b 1.7 ab 1.2 c
Total 16.6 a 15.0 b 16.6 a 15.1 b 17.5 a 14.9 b 17.3 a 16.7 b 15.6 15.9 15.0 15.4 17.2 16.6 17.2 17.5 16.1 17.0 17.1 16.7
Gram-negative 16:1w9 4.7 a 6.3 b 5.4 c 5.3 c 4.9 a 5.8 b 5.4 b 5.6 b 4.7 a 5.4 b 5.0 ab 5.2 b 4.9 a 5.2 ab 5.3 ab 5.6 b 5.1 a 5.8 b 5.8 b 5.7 bGram-negative 16:1w5 3.2 2.8 3.1 2.4 3.5 ab 3.1 ab 3.8 a 3.0 b 3.3 a 3.3 a 3.2 ab 2.5 b 3.0 3.1 2.9 2.8 3.4 a 2.6 b 2.5 b 2.1 bGram-negative 18:1w7 7.9 a 9.7 b 8.7 ab 9.4 b 7.5 a 11.7 b 9.0 c 9.9 c 7.8 a 9.3 b 8.4 ab 9.1 b 7.8 7.9 8.4 8.7 8.4 8.9 9.3 9.1Gram-negative cy17:0 1.5 ab 1.4 a 1.8 b 1.3 a 1.6 ac 1.5 a 1.9 b 1.8 bc 1.4 1.6 1.5 1.6 1.6 a 1.7 ab 1.8 ab 1.9 b 1.1 a 1.5 bc 1.6 c 1.2 abGram-negative cy19:0 4.4 ab 4.2 ab 4.8 a 3.8 b 4.2 4.6 4.7 4.8 4.6 4.8 4.8 4.7 4.9 4.7 4.9 4.8 4.2 ac 4.7 ab 4.8 b 4.0 c
Total 21.7 a 24.5 b 23.8 b 22.3 a 21.7 a 26.7 b 24.7 c 25.1 c 21.8 a 24.3 b 22.7 ac 23.0 c 22.2 a 22.6 a 23.4 ab 23.9 b 22.3 a 23.5 b 24.0 b 22.2 a
Actinomycetes 10Me16:0 3.9 a 6.1 b 4.1 a 3.5 a 4.4 a 6.5 b 4.3 a 4.3 a 3.8 4.1 3.6 3.7 3.8 3.8 4.0 4.1 4.0 4.3 4.2 3.8Actinomycetes 10Me18:0 2.5 2.4 2.5 2.1 2.4 2.7 2.6 2.4 1.8 a 2.3 ab 2.3 b 2.0 ab 2.3 2.6 2.6 2.6 2.6 a 2.6 a 2.8 a 1.9 b
Total 6.4 ad 8.5 b 6.6 ac 5.6 d 6.7 a 9.2 b 7.0 a 6.6 a 5.6 6.3 5.9 5.7 6.1 6.4 6.6 6.7 6.6 a 7.0 a 7.0 a 5.6 b
Fungi 18:2w 5.5 a 3.8 b 5.5 a 5.4 a 11.7 ab 11.2 a 11.7 ab 12.4 b 12.6 13.2 13.1 12.5 6.3 a 6.2 ab 5.6 ab 5.1 b 11.8 a 12.2 ab 12.0 ab 12.8 bFungi 18:1w9 11.0 a 12.8 b 11.8 a 13.4 b 4.6 4.8 5.3 4.3 6.7 ac 5.7 ab 7.1 c 5.4 b 11.5 12.4 11.6 11.7 3.5 4.0 4.7 4.6
Total 16.5 a 16.6 a 17.3 ab 18.8 b 16.3 15.9 17.0 16.7 19.2 ab 18.9 ab 20.2 a 17.9 b 17.9 ab 18.6 a 17.2 ab 16.8 b 15.3 a 16.2 a 16.7 ab 17.4 b
Protozoa 20:4w6 4.1 a 1.1 b 1.8 b 1.6 b 1.7 2.0 1.4 1.4 1.9 ab 1.1 a 2.7 ab 2.8 b 2.3 2.3 2.1 2.1 0.4 1.1 1.3 1.3
Common to all 16:0 23.2 a 24.7 ab 23.7 a 26.3 b 25.2 a 20.4 b 24.0 a 23.9 a 24.0 24.0 23.4 24.3 22.5 22.2 22.8 21.8 25.0 a 23.7 a 23.1 a 27.5 bCommon to all 18:0 5.8 6.4 5.6 5.5 5.8 6.4 5.3 5.5 5.9 5.5 5.3 6.0 6.2 5.9 5.8 5.7 6.9 a 6.6 ab 6.2 ab 5.5 b
? 20:0 1.7 0.8 1.4 1.2 1.6 1.5 1.2 1.1 1.9 0.9 1.7 1.4 2.1 a 1.8 b 1.6 b 1.7 b 3.4 1.7 1.4 0.8? 22:0 4.1 ac 2.4 b 3.2 bc 3.7 c 3.4 a 3.0 a 2.2 b 3.1 a 4.1 a 3.0 b 3.2 b 3.4 ab 3.5 3.5 3.3 3.7 4.0 a 3.3 ab 3.2 b 3.0 b
† Different letters indicate significant differences (p <0.05) between treatments
75 - 250 μm
Mol %
500 - 2000 μm 250 - 500 μmwhole soil 2000 - 4000 μm
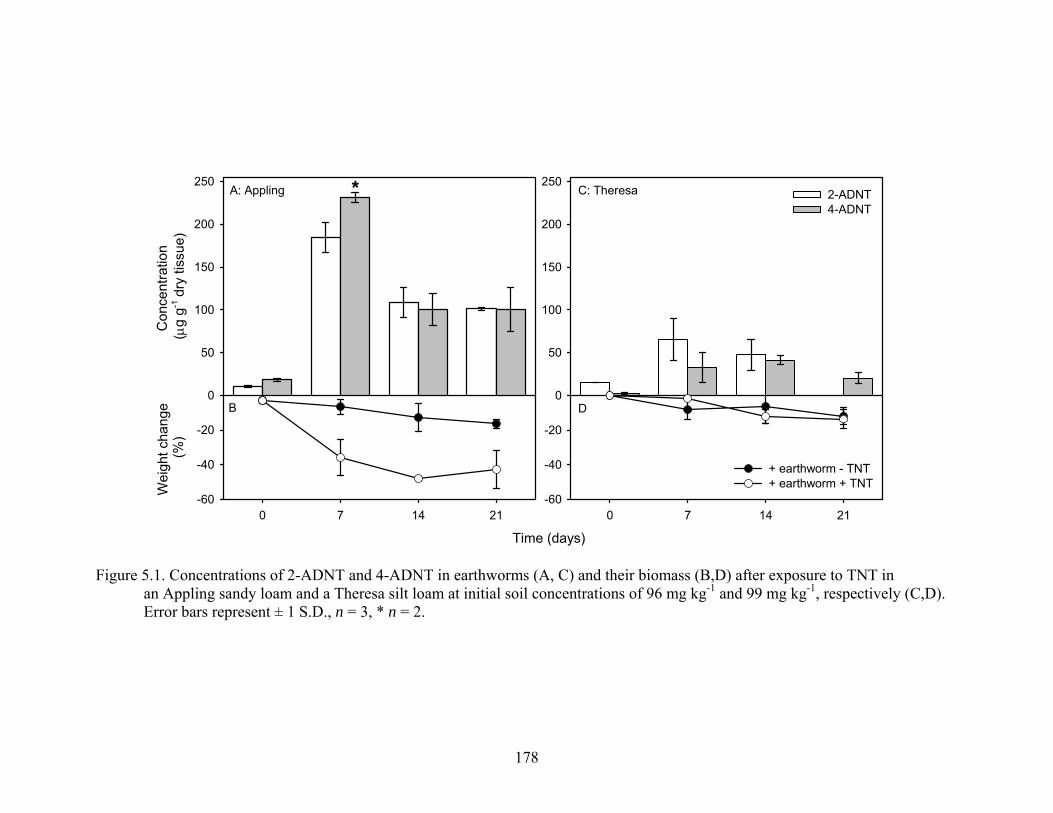
178
Con
cent
ratio
n (μ
g g-1
dry
tiss
ue)
50
100
150
200
250A: Appling
Time (days)
0 7 14 21
Wei
ght c
hang
e (%
)
-60
-40
-20
0
50
100
150
200
2502-ADNT4-ADNT
C: Theresa
0 7 14 21-60
-40
-20
0
+ earthworm - TNT+ earthworm + TNT
B D
*
Figure 5.1. Concentrations of 2-ADNT and 4-ADNT in earthworms (A, C) and their biomass (B,D) after exposure to TNT in
an Appling sandy loam and a Theresa silt loam at initial soil concentrations of 96 mg kg-1 and 99 mg kg-1, respectively (C,D). Error bars represent ± 1 S.D., n = 3, * n = 2.
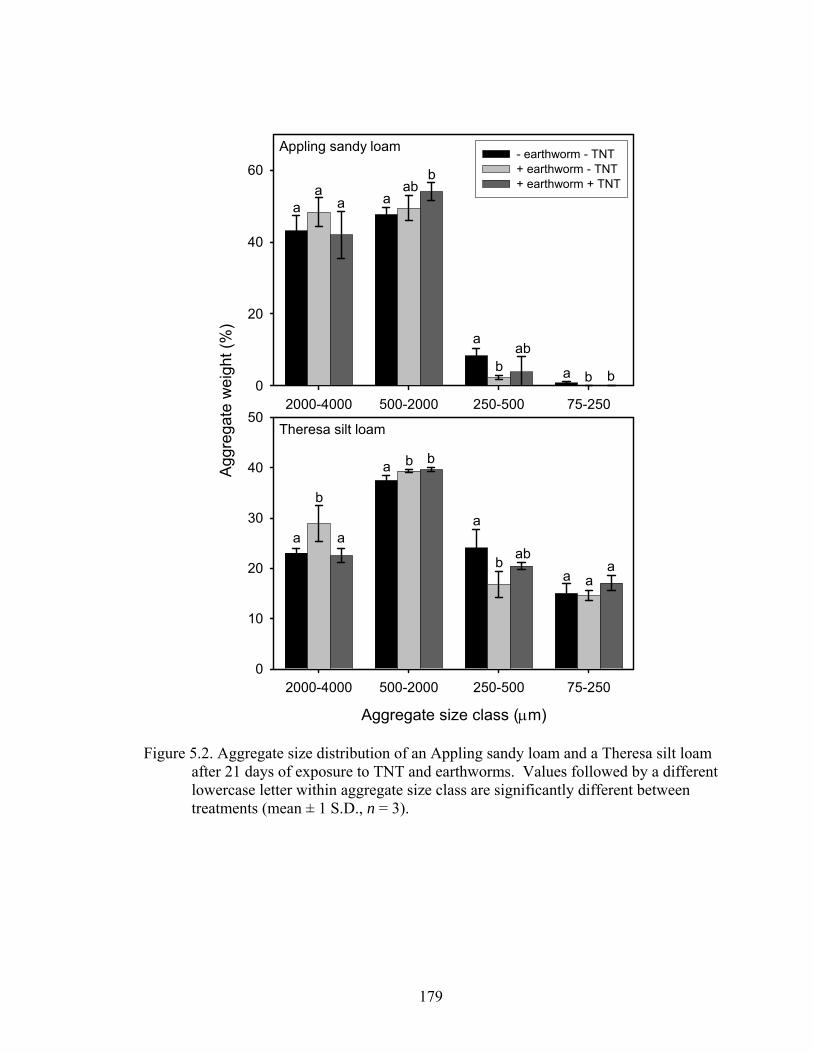
179
2000-4000 500-2000 250-500 75-2500
20
40
60- earthworm - TNT+ earthworm - TNT+ earthworm + TNT
Appling sandy loam
a aa a
abb
a
bab
a b b
Aggregate size class (μm)
2000-4000 500-2000 250-500 75-250
Agg
rega
te w
eigh
t (%
)
0
10
20
30
40
50Theresa silt loam
a
b
a
a b b
a
b aba a
a
Figure 5.2. Aggregate size distribution of an Appling sandy loam and a Theresa silt loam after 21 days of exposure to TNT and earthworms. Values followed by a different lowercase letter within aggregate size class are significantly different between treatments (mean ± 1 S.D., n = 3).
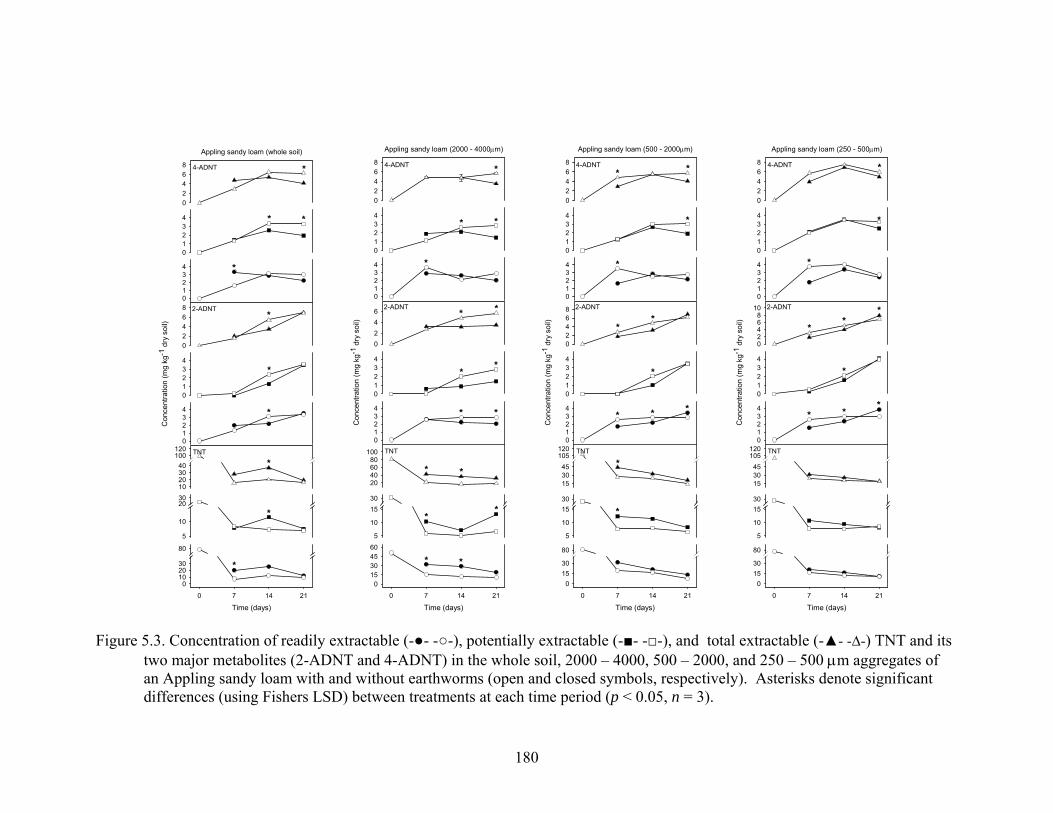
180
5
10
2030
01234
01234
Appling sandy loam (whole soil)
02468
Time (days)0 7 14 21
0102030
80
10203040
100120 TNT
01234
Con
cent
ratio
n (m
g kg
-1 d
ry s
oil)
01234
02468 2-ADNT
4-ADNT
*
*
*
*
*
*
*
*
*
*
01234
01234
Appling sandy loam (2000 - 4000μm)
02468
Time (days)0 7 14 21
015304560
5
10
1530
20406080
100 TNT01234
Con
cent
ratio
n (m
g kg
-1 d
ry s
oil)
01234
0246 2-ADNT
4-ADNT
*
*
* *
*
*
*
*
*
*
* *
*
*
*
*
01234
01234
Appling sandy loam (500 - 2000μm)
02468
Time (days)0 7 14 21
01530
80
5
10
1530
153045
105120 TNT
01234
Con
cent
ratio
n (m
g kg
-1 d
ry s
oil)
01234
02468 2-ADNT
4-ADNT
*
*
*
*
*
*
*
**
*
* *
01234
01234
Appling sandy loam (250 - 500μm)
02468
Time (days)0 7 14 21
01530
80
5
10
1530
153045
105120 TNT
01234
Con
cent
ratio
n (m
g kg
-1 d
ry s
oil)
01234
02468
10 2-ADNT
4-ADNT
*
*
*
*
*
**
*
*
*
Figure 5.3. Concentration of readily extractable (-●- -○-), potentially extractable (-■- -□-), and total extractable (-▲- -∆-) TNT and its two major metabolites (2-ADNT and 4-ADNT) in the whole soil, 2000 – 4000, 500 – 2000, and 250 – 500 μm aggregates of an Appling sandy loam with and without earthworms (open and closed symbols, respectively). Asterisks denote significant differences (using Fishers LSD) between treatments at each time period (p < 0.05, n = 3).
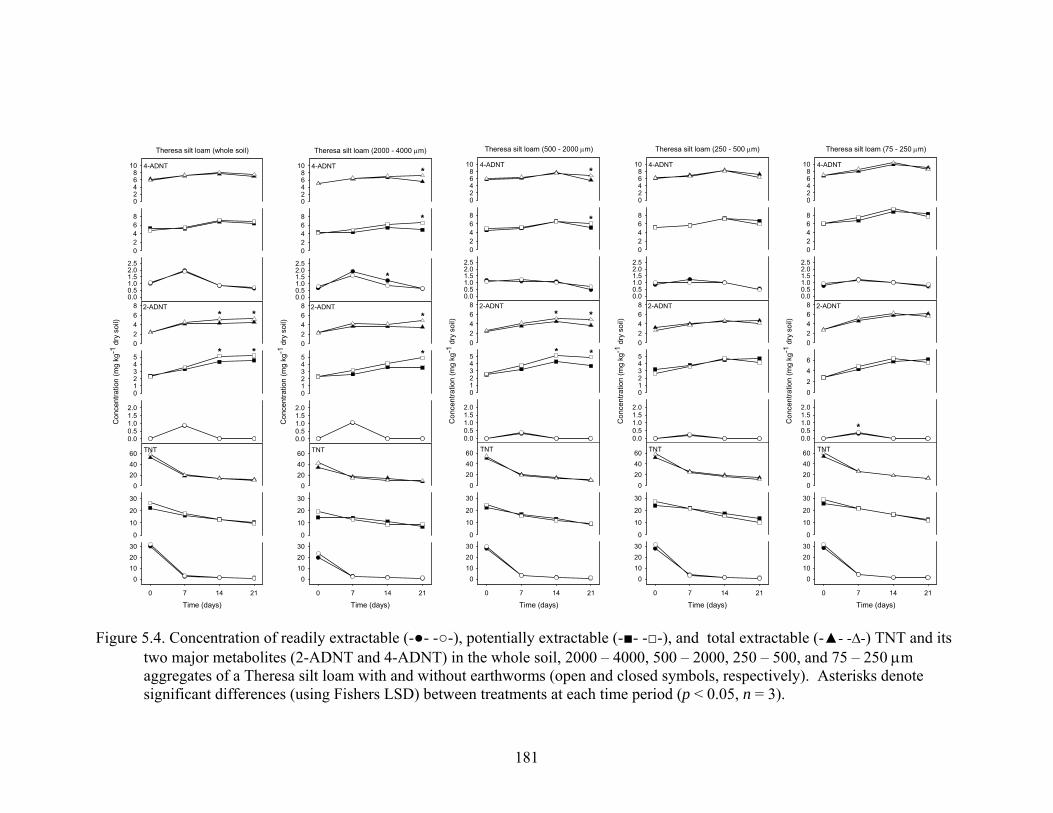
181
0.00.51.01.52.02.5
02468
Theresa silt loam (whole soil)
02468
10
Time (days)0 7 14 21
0102030
0
10
20
30
0204060 TNT0.00.51.01.52.0
Con
cent
ratio
n (m
g kg
-1 d
ry s
oil)
012345
02468 2-ADNT
4-ADNT
**
**
0.00.51.01.52.02.5
02468
Theresa silt loam (2000 - 4000 μm)
02468
10
Time (days)0 7 14 21
0102030
0
10
20
30
0204060 TNT
0.00.51.01.52.0
Con
cent
ratio
n (m
g kg
-1 d
ry s
oil)
012345
02468 2-ADNT
4-ADNT
*
*
*
*
*
0.00.51.01.52.02.5
02468
Theresa silt loam (500 - 2000 μm)
02468
10
Time (days)0 7 14 21
0102030
0
10
20
30
0204060 TNT
0.00.51.01.52.0
Con
cent
ratio
n (m
g kg
-1 d
ry s
oil)
012345
02468 2-ADNT
4-ADNT
*
*
* *
* *
0.00.51.01.52.02.5
02468
Theresa silt loam (250 - 500 μm)
02468
10
Time (days)0 7 14 21
0102030
0
10
20
30
0204060 TNT
0.00.51.01.52.0
Con
cent
ratio
n (m
g kg
-1 d
ry s
oil)
012345
02468 2-ADNT
4-ADNT
0.00.51.01.52.02.5
02468
Theresa silt loam (75 - 250 μm)
02468
10
Time (days)0 7 14 21
0102030
0
10
20
30
0204060 TNT
0.00.51.01.52.0
Con
cent
ratio
n (m
g kg
-1 d
ry s
oil)
0246
02468 2-ADNT
4-ADNT
*
Figure 5.4. Concentration of readily extractable (-●- -○-), potentially extractable (-■- -□-), and total extractable (-▲- -∆-) TNT and its two major metabolites (2-ADNT and 4-ADNT) in the whole soil, 2000 – 4000, 500 – 2000, 250 – 500, and 75 – 250 μm aggregates of a Theresa silt loam with and without earthworms (open and closed symbols, respectively). Asterisks denote significant differences (using Fishers LSD) between treatments at each time period (p < 0.05, n = 3).
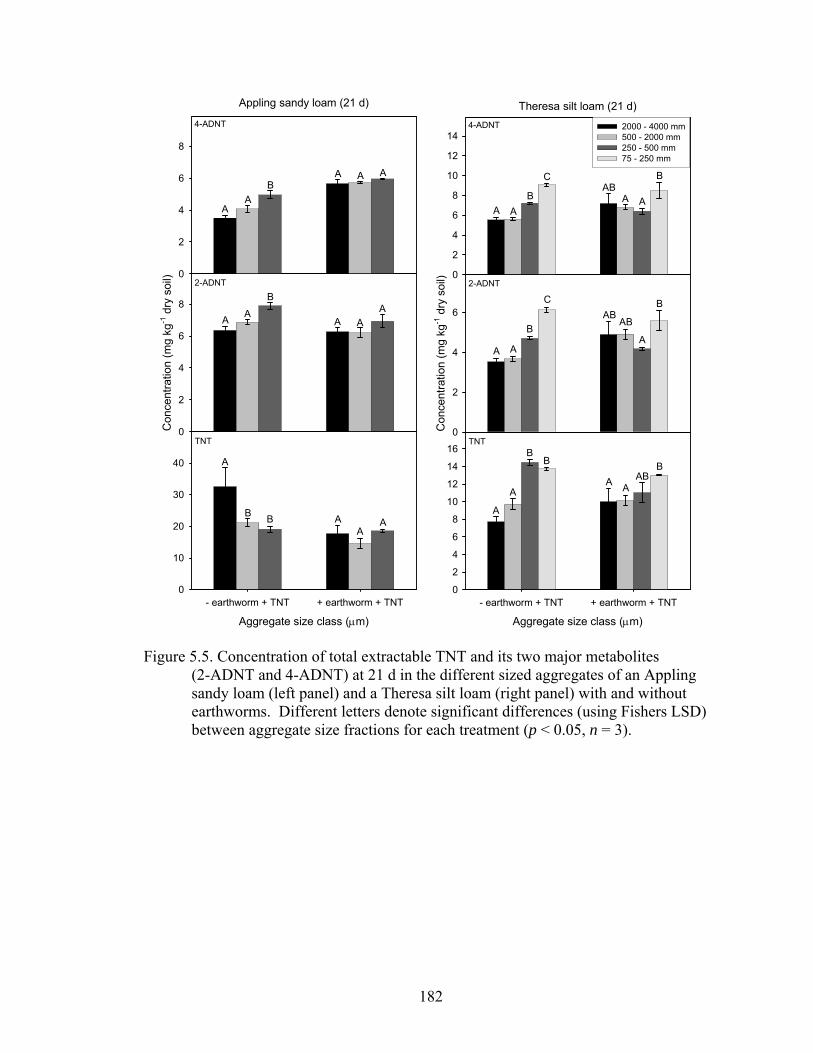
182
Aggregate size class (μm)
- earthworm + TNT + earthworm + TNT0
10
20
30
40
Con
cent
ratio
n (m
g kg
-1 d
ry s
oil)
0
2
4
6
8
Appling sandy loam (21 d)
0
2
4
6
8
TNT
2-ADNT
4-ADNT
A
B B AA
A
A A
BA
A A
AA
BAA A
Aggregate size class (μm)
- earthworm + TNT + earthworm + TNT0
2
4
6
8
10
12
14
16C
once
ntra
tion
(mg
kg-1
dry
soi
l)0
2
4
6
Theresa silt loam (21 d)
0
2
4
6
8
10
12
142000 - 4000 mm500 - 2000 mm250 - 500 mm75 - 250 mm
TNT
2-ADNT
4-ADNT
A
A
BB B
A AAB
A A
B
C BAB
AB
A
A AB
C BAB
A A
Figure 5.5. Concentration of total extractable TNT and its two major metabolites (2-ADNT and 4-ADNT) at 21 d in the different sized aggregates of an Appling sandy loam (left panel) and a Theresa silt loam (right panel) with and without earthworms. Different letters denote significant differences (using Fishers LSD) between aggregate size fractions for each treatment (p < 0.05, n = 3).
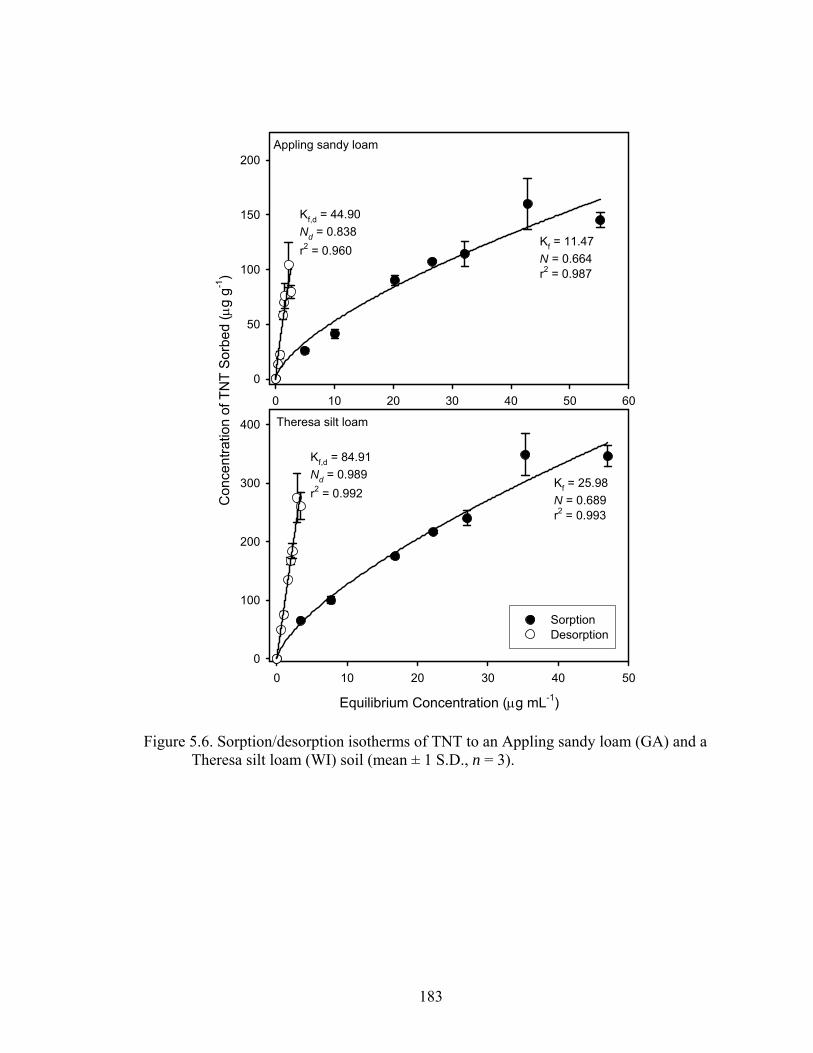
183
Equilibrium Concentration (μg mL-1)
0 10 20 30 40 50
Con
cent
ratio
n of
TN
T So
rbed
(μg
g-1)
0
100
200
300
400
SorptionDesorption
Theresa silt loam
0 10 20 30 40 50 60
0
50
100
150
200Appling sandy loam
Kf = 11.47N = 0.664r2 = 0.987
Kf,d = 44.90Nd = 0.838r2 = 0.960
Kf = 25.98N = 0.689r2 = 0.993
Kf,d = 84.91Nd = 0.989r2 = 0.992
Figure 5.6. Sorption/desorption isotherms of TNT to an Appling sandy loam (GA) and a Theresa silt loam (WI) soil (mean ± 1 S.D., n = 3).
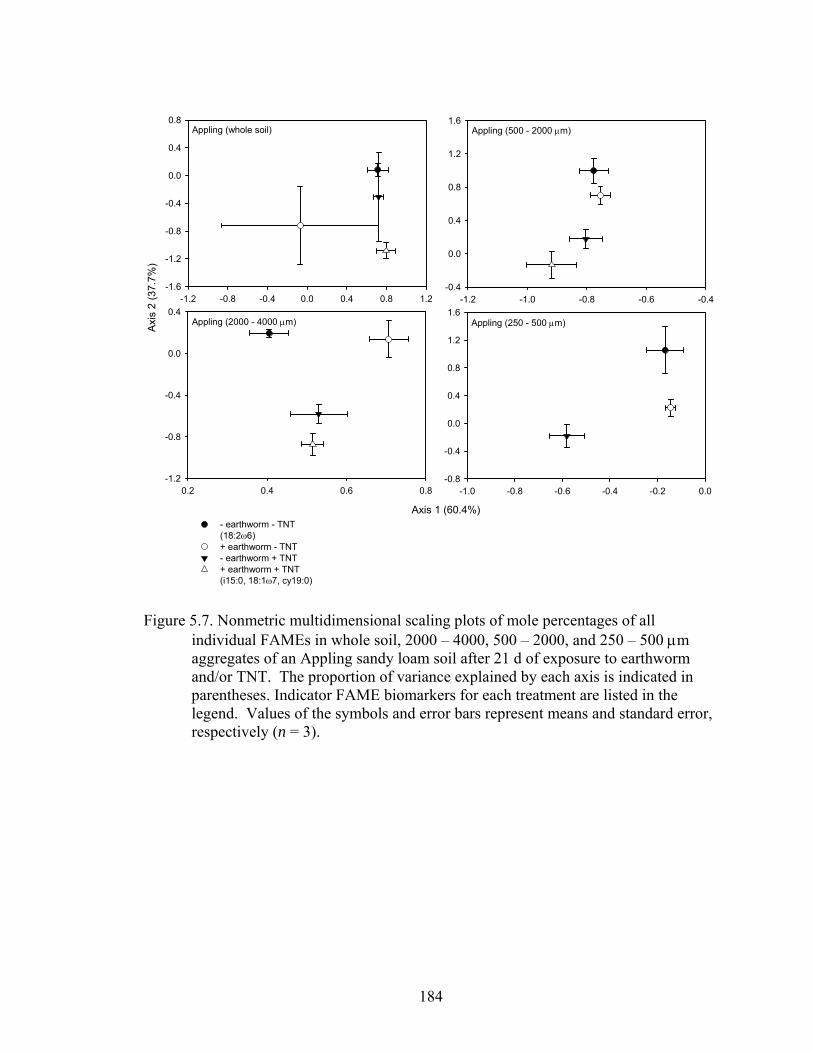
184
-1.2 -0.8 -0.4 0.0 0.4 0.8 1.2-1.6
-1.2
-0.8
-0.4
0.0
0.4
0.8Appling (whole soil)
Axis 1 (60.4%)
0.2 0.4 0.6 0.8
Axis
2 (3
7.7%
)
-1.2
-0.8
-0.4
0.0
0.4
- earthworm - TNT(18:2ω6)+ earthworm - TNT- earthworm + TNT+ earthworm + TNT(i15:0, 18:1ω7, cy19:0)
Appling (2000 - 4000 μm)
-1.2 -1.0 -0.8 -0.6 -0.4-0.4
0.0
0.4
0.8
1.2
1.6Appling (500 - 2000 μm)
-1.0 -0.8 -0.6 -0.4 -0.2 0.0-0.8
-0.4
0.0
0.4
0.8
1.2
1.6Appling (250 - 500 μm)
Figure 5.7. Nonmetric multidimensional scaling plots of mole percentages of all individual FAMEs in whole soil, 2000 – 4000, 500 – 2000, and 250 – 500 μm aggregates of an Appling sandy loam soil after 21 d of exposure to earthworm and/or TNT. The proportion of variance explained by each axis is indicated in parentheses. Indicator FAME biomarkers for each treatment are listed in the legend. Values of the symbols and error bars represent means and standard error, respectively (n = 3).
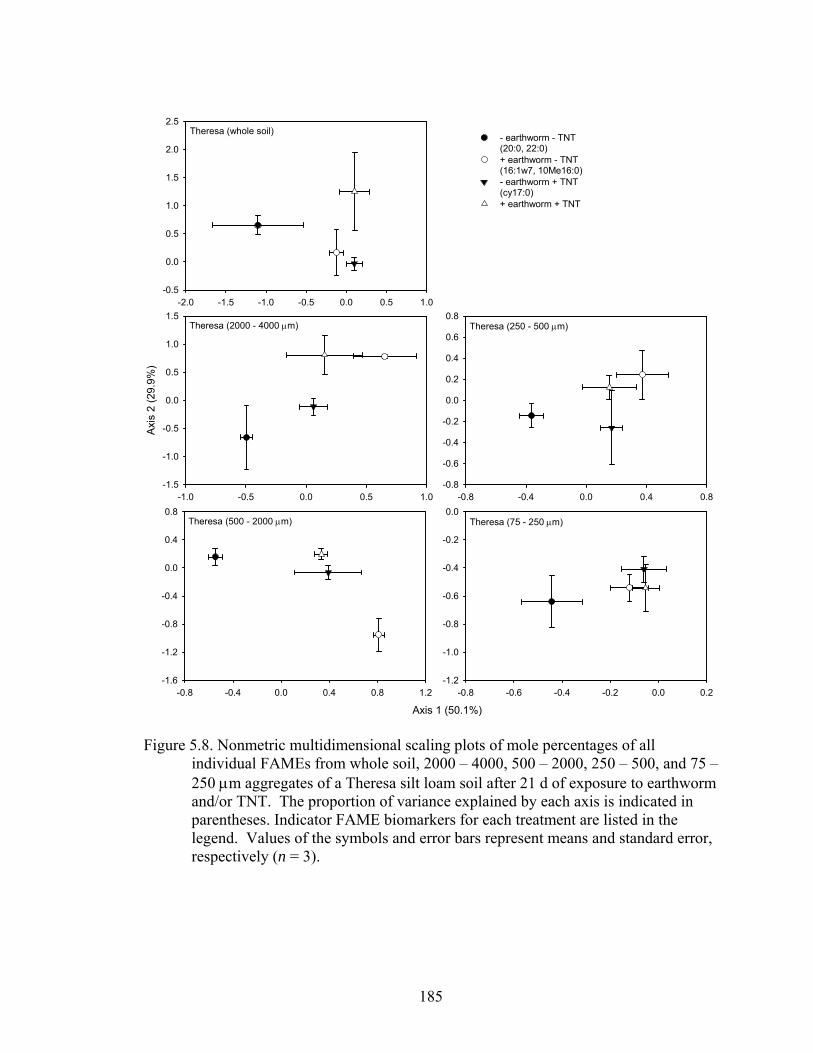
185
-2.0 -1.5 -1.0 -0.5 0.0 0.5 1.0-0.5
0.0
0.5
1.0
1.5
2.0
2.5
- earthworm - TNT(20:0, 22:0)+ earthworm - TNT(16:1w7, 10Me16:0)- earthworm + TNT(cy17:0)+ earthworm + TNT
Theresa (whole soil)
Axis 1 (50.1%)
-0.8 -0.4 0.0 0.4 0.8 1.2-1.6
-1.2
-0.8
-0.4
0.0
0.4
0.8Theresa (500 - 2000 μm)
-1.0 -0.5 0.0 0.5 1.0
Axis
2 (2
9.9%
)
-1.5
-1.0
-0.5
0.0
0.5
1.0
1.5Theresa (2000 - 4000 μm)
-0.8 -0.4 0.0 0.4 0.8-0.8
-0.6
-0.4
-0.2
0.0
0.2
0.4
0.6
0.8Theresa (250 - 500 μm)
-0.8 -0.6 -0.4 -0.2 0.0 0.2-1.2
-1.0
-0.8
-0.6
-0.4
-0.2
0.0Theresa (75 - 250 μm)
Figure 5.8. Nonmetric multidimensional scaling plots of mole percentages of all individual FAMEs from whole soil, 2000 – 4000, 500 – 2000, 250 – 500, and 75 – 250 μm aggregates of a Theresa silt loam soil after 21 d of exposure to earthworm and/or TNT. The proportion of variance explained by each axis is indicated in parentheses. Indicator FAME biomarkers for each treatment are listed in the legend. Values of the symbols and error bars represent means and standard error, respectively (n = 3).
186
CHAPTER 6
SUMMARY AND CONCLUSION
187
Across the US and around the world there are many examples and situations
where our natural resources are being polluted and require urgent attention in order to
maintain and sustain all forms of life. Every day we are faced with a need to develop
innovative and effective methods to handle environmental issues whether they are
accidental or natural disasters. A typical approach to assess and remediate contaminated
soil is to look at general processes and interactions of the soil as a whole. However,
taking a scaled-down approach and focusing on specific soil components may provide a
better understanding of what has happened and what can be done. The research
presented in this dissertation demonstrated that focusing on the interactions between
organic contaminants and soil aggregates or soil particles (i.e. clay, humic-clay
complexes) is an effective method to characterize environmental fate processes (i.e.
sorption, desorption, transformation, etc). Additionally, it is important to consider the
method used to obtain soil aggregates as it may influence measurements and assessment
of processes and properties specific to soil aggregates.
In chapter 3, experiments performed clearly demonstrated the role of natural
organic matter in the retention of TNT by clay minerals. In general TNT sorption to clay
minerals and humic-clay complexes was dependent on the prevailing exchangeable cation
and the associated energy of hydration. Sorption to K-saturated clays and humic-clay
complexes were greater than to Ca-saturated minerals because K+ has a low energy of
hydration, thus making it easier for TNT to form inner-sphere complexes and/or replace
K on the clay surface, depending on which sorption mechanism is taking place (i.e. EDA
complex vs inner-sphere interactions). TNT sorption to humic acid was significant and
increased with a decrease in humic acid concentration. Additionally, humic acid
188
associated with prepared minerals such as smectite (Ca-HA-SAz, K-HA-SAz, K-HA-
SWy) and kaolinite (K-HA-KGa) enhanced TNT sorption compared to their
corresponding homoionic clay, while TNT sorption to hectorite (K-HA-SHCa) was
inhibited. Previous studies have noted the possibility of TNT, which has a moderately
low solubility, participating in hydrophobic interactions with neutral siloxane sites on
clay minerals such as kaolinite and some smectites. Although not confirmed, humic acid
associated with K-SHCa may have prevented TNT from interacting with neutral siloxane
sites on K-SHCa which has been characterized as exhibiting hydrophobic characteristics.
Humic acid increased sorption to K-HA-SWy compared to K-SWy, however, based on
XRD analysis, both had similar d-spacings when exposed to 60 μg mL-1 TNT. Thus, the
increase in TNT sorption to K-HA-SWy over K-SWy may be due to enhanced sorption to
the clay mineral surface, as the degree of interlayer association between the two
(sorption) are similar. Finally, the sequential preparation of humic-clay complexes using
K-SWy and the same humic acid solution supported the findings of previous studies
indicating the fractionation and preferential sorption of humic acid with clay minerals.
TNT sorption decreased with each additional sequentially prepared humic-clay complex,
thus indicating that the properties and nature of the humic-acid associated with the clay
mineral had changed.
Clay minerals, soil organic matter, and their interactions are not only important in
the retention of contaminants such as TNT, but they are also the main factors governing
soil aggregation. In chapter 4, experiments focused on how soil fractionation methods
may influence characterization of properties and processes associated with soil
aggregates. Three different soils with contrasting clay mineralogy and soil organic
189
matter were exposed to wet- and dry-sieving methods. As was expected, dry- and wet-
sieving resulted in different aggregate size distributions for all three soils. Wet-sieving
yielded a greater distribution of soil aggregates less than 250 μm and a significant
reduction in the 500 – 2000 μm sized aggregates for all three soils tested. Although
differences in total carbon within soil aggregates were not as profound, observed
significant differences in the CEC, microbial biomass, and microbial community
structure between the two sieving methods could be explained based on the clay
mineralogy and dominant aggregate stabilization mechanism for each soil. FAME
analysis used to characterize the microbial community structure indicated that wet
sieving had the most significant impact on the 75 – 250 μm aggregate size fraction
regardless of soil type. This was due largely to the redistribution of soil particles
including fine sand from large aggregates (i.e. > 500 μm) into smaller size fractions (<
250 μm). These results do not necessarily imply that research focused on aggregate
specific interactions or associations in soil is fruitless, however. In instances where
inherent aggregate stability is the key question of an experiment, the tendency for
aggregates to break down into smaller sized fractions, as with wet-sieving, might provide
consistent data. On the other hand, when researchers intend to study the natural
associations found within aggregate hierarchies, or need to extract biological or chemical
information that is sensitive to the effects of sieving, then careful consideration of the
likelihood of artifacts should be used to select the best aggregate separation method.
The first two studies build up to the third and final study presented in chapter 5.
This study focused on how earthworms could influence the fate of TNT within soil and
soil aggregates of two contrasting soil types. Additionally, the impact of earthworms and
190
TNT on the soil microbial community structure was characterized by FAME analysis.
Although both soils were exposed to similar levels of TNT, the inherent bioavailability of
TNT in each soil was different. Analysis of earthworm tissue and soil extractions
indicated that TNT was more bioavailable in the Appling sandy loam (GA) compared to
the Theresa silt loam (WI). Earthworms in the Appling soil experienced a reduction in
biomass as a result of TNT exposure and accumulated high levels of the metabolites 2-
ADNT and 4-ADNT. In contrast, earthworms in the Theresa soil accumulated much
lower amounts of 2-ADNT and 4-ADNT and had no significant loss in biomass
compared to earthworms not exposed to TNT. Additionally, in the Appling soil,
exposure to TNT reduced the impact earthworms had on soil aggregation. However, a
similar observation was observed in the Theresa soil indicating that TNT may influence
soil aggregation by altering the nature of humic-clay complexes. This effect may be
more profound due to the breakdown of ingested soil material by earthworms which is
then excreted as a cast and contributes to the formation of stable aggregates. Earthworms
demonstrated the ability to enhance TNT disappearance, particularly during the first 7 d
and the extraction of metabolites after 14 d in the Appling soil. However, the low
bioavailability of TNT in the Theresa soil resulted in earthworms having no effect on the
disappearance of TNT. However, similarly to the Appling soil, earthworms did result in
greater amounts of extracted 2-ADNT and 4-ADNT. Furthermore, the ability of
earthworms to influence the disappearance of TNT diminishes with time due to the
formation of irreversibly bound residues. Regardless of soil type, however, earthworms
demonstrated the ability to influence the distribution of TNT and metabolites within soil
aggregates. For example, earthworms reduced the levels of TNT in the 2000 – 4000 μm
191
size fraction of the Appling soil compared to smaller size fractions. However, in the
Theresa soil, it appears earthworms redistributed TNT from smaller soil aggregates into
larger soil aggregates by ingestion of soil material and release in earthworm casts.
Earthworms and TNT influenced the microbial community structure in both soils. In
particular the presence of TNT and earthworms increased the mol % of fatty acids
indicative of gram-negative bacteria, indicating that favorable conditions or the ability to
tolerate these factors to a better extent then other soil organisms (such as actinomycetes
or gram-positive bacteria). Overall, earthworms had the biggest impact on TNT
disappearance, metabolite extraction, and microbial community structure of soil
macroaggregates > 2000 μm.
In the end, the work presented in this dissertation resulted in some interesting
discoveries and theories related to the dynamics of TNT fate in soil aggregates.
However, many of them require further validation to prove if they are true. For example,
without using some form of a tracer we do not know for sure to what extent earthworms
are redistributing TNT in the Theresa soil. Based on the changes in the amount of TNT
extracted from each size fraction between treatments, we have indirect rather than direct
evidence. In a situation where resources are not limited I feel that closer examination and
revisiting of these studies using radio-labeled compounds (TNT, 2-ADNT, 4-ADNT) and
use of molecular chemistry and instrumentation (FTIR, NMR, IR, etc) would be useful.
192
APPENDIX A
SUPPLEMENTAL DATA FROM CHAPTER 3
INTERACTION OF 2,4,6-TRINITROTOLUENE WITH HUMIC ACID, CLAY
MINERALS, AND HUMIC-CLAY COMPLEXES

193
2 θ
4 6 8 10 12
Inte
nsity
CS = 5.9 mg/gCS = 11.1 mg/g
CS = 12.5 mg/gCS = 14.4 mg/gCS = 16.1 mg/gCS = 17.4 mg/g
CS = 20.0 mg/gCS = 22.2 mg/g
CS = 0 mg/g
K-SWy
Figure A.1 X-ray diffraction patterns of K-SWy as a function of TNT sorption (Cu-Κα
radiation, 0% humidity).
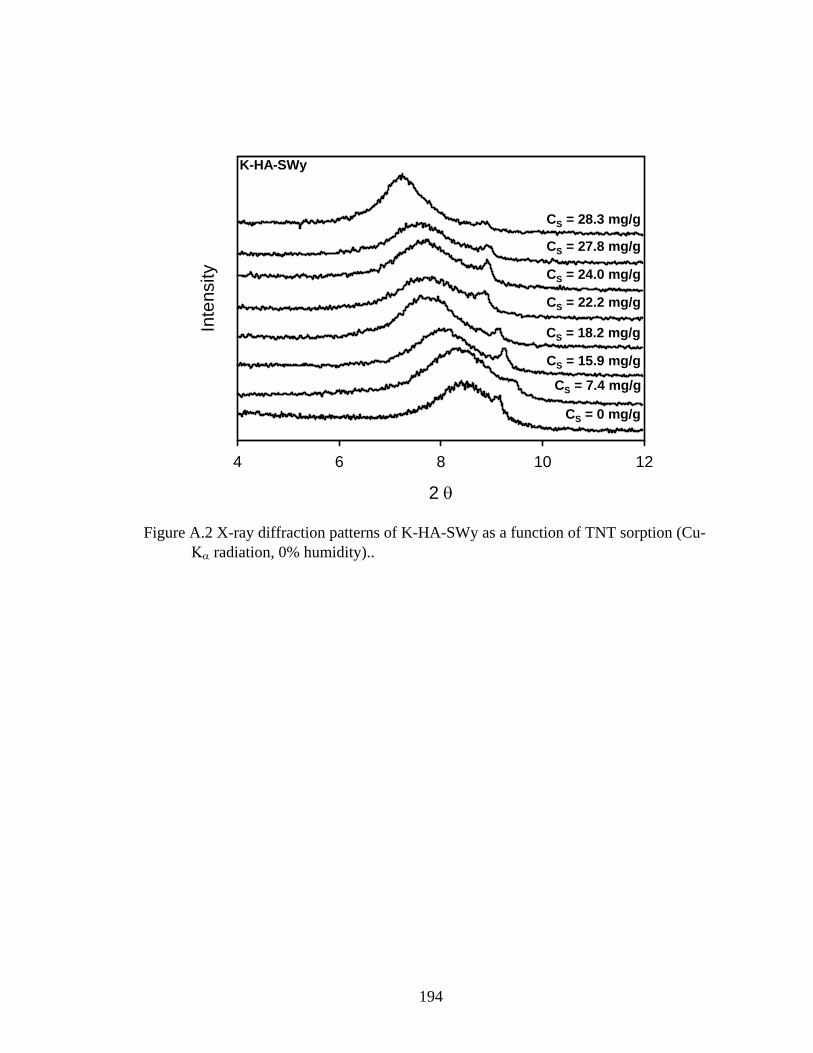
194
2 θ
4 6 8 10 12
Inte
nsity
CS = 7.4 mg/g
CS = 15.9 mg/g
CS = 18.2 mg/g
CS = 22.2 mg/g
CS = 24.0 mg/g
CS = 27.8 mg/g
CS = 28.3 mg/g
CS = 0 mg/g
K-HA-SWy
Figure A.2 X-ray diffraction patterns of K-HA-SWy as a function of TNT sorption (Cu-
Κα radiation, 0% humidity)..
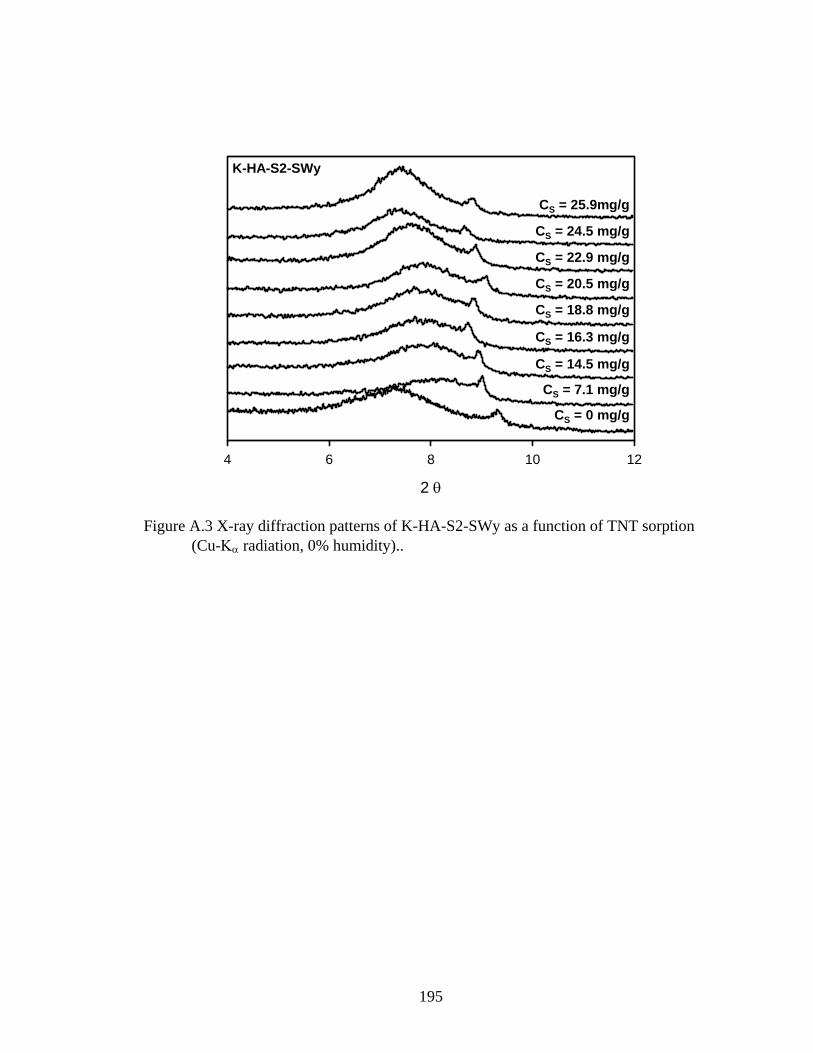
195
2 θ
4 6 8 10 12
CS = 7.1 mg/g
CS = 14.5 mg/g
CS = 16.3 mg/g
CS = 18.8 mg/g
CS = 20.5 mg/g
CS = 22.9 mg/g
CS = 24.5 mg/g
CS = 25.9mg/g
CS = 0 mg/g
K-HA-S2-SWy
Figure A.3 X-ray diffraction patterns of K-HA-S2-SWy as a function of TNT sorption
(Cu-Κα radiation, 0% humidity)..
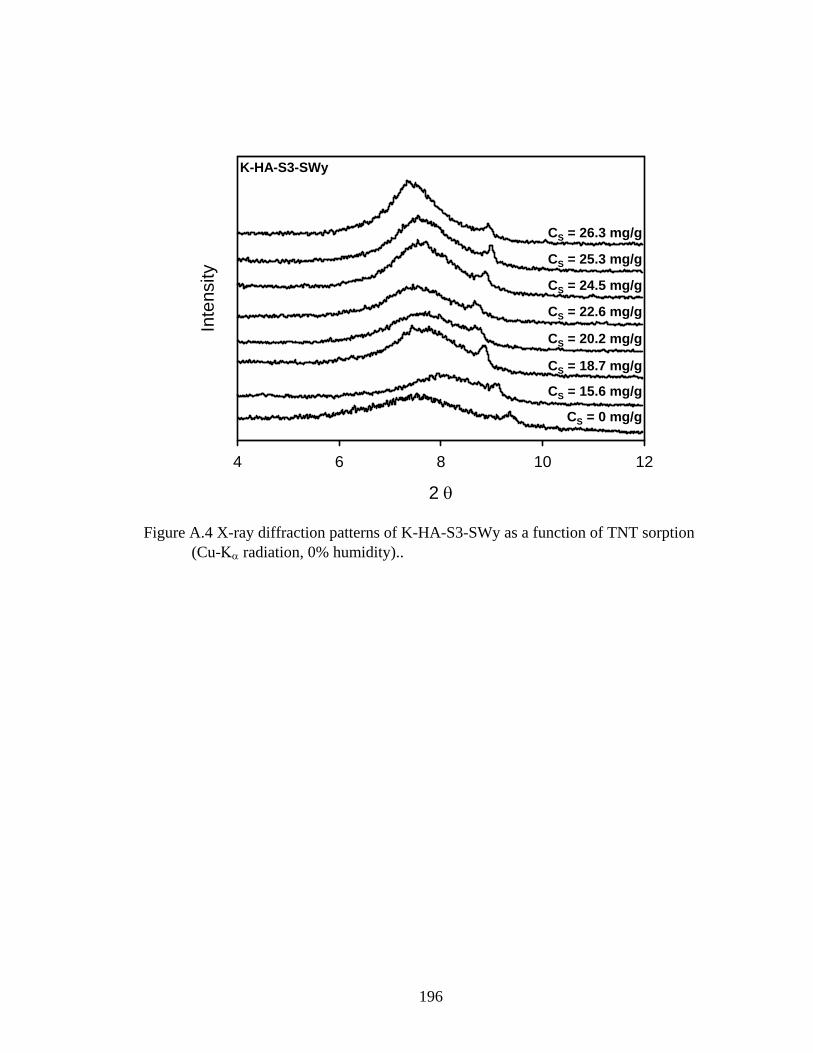
196
2 θ
4 6 8 10 12
Inte
nsity
CS = 15.6 mg/g
CS = 18.7 mg/g
CS = 20.2 mg/g
CS = 22.6 mg/g
CS = 24.5 mg/g
CS = 25.3 mg/g
CS = 26.3 mg/g
CS = 0 mg/g
K-HA-S3-SWy
Figure A.4 X-ray diffraction patterns of K-HA-S3-SWy as a function of TNT sorption
(Cu-Κα radiation, 0% humidity)..
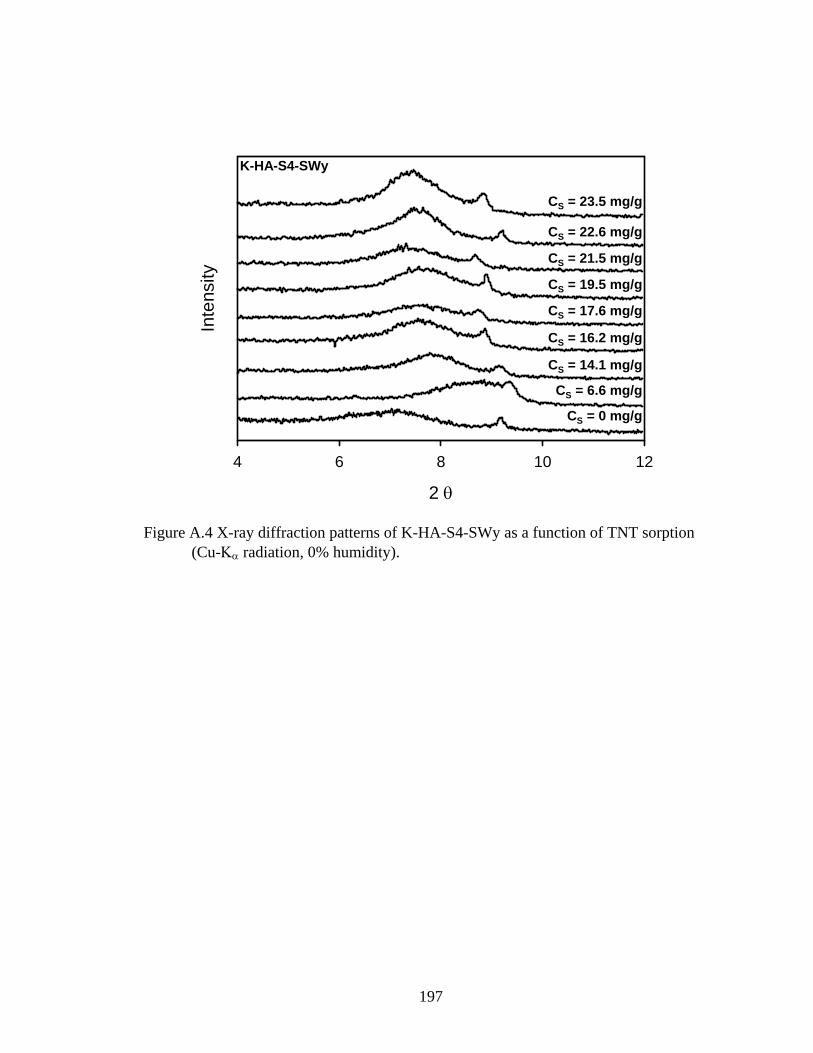
197
2 θ
4 6 8 10 12
Inte
nsity
CS = 6.6 mg/g
CS = 14.1 mg/g
CS = 16.2 mg/g
CS = 17.6 mg/g
CS = 19.5 mg/g
CS = 21.5 mg/g
CS = 22.6 mg/g
CS = 0 mg/g
K-HA-S4-SWy
CS = 23.5 mg/g
Figure A.4 X-ray diffraction patterns of K-HA-S4-SWy as a function of TNT sorption
(Cu-Κα radiation, 0% humidity).
198
APPENDIX B
SUPPLEMENTAL DATA FROM CHAPTER 4
IMPACT OF SIZE FRACTIONATION METHODS ON
PROPERTIES OF SOIL AGGREGATES
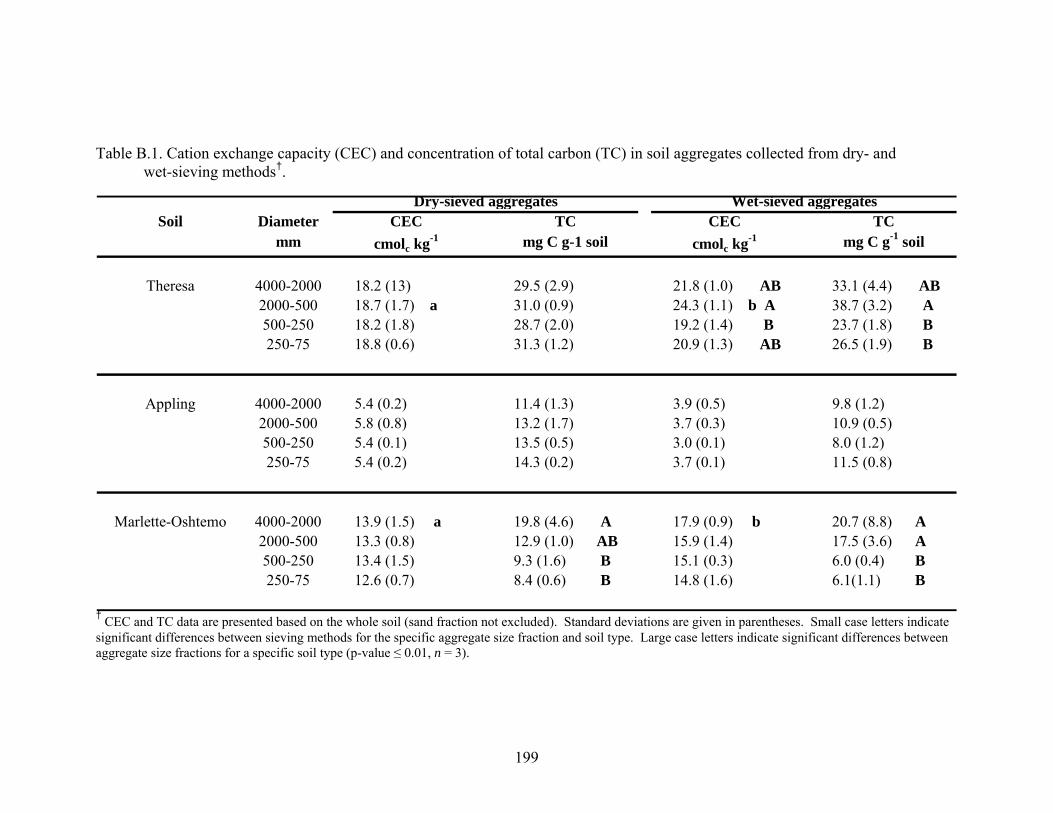
199
Table B.1. Cation exchange capacity (CEC) and concentration of total carbon (TC) in soil aggregates collected from dry- and wet-sieving methods†.
Soil Diameter CEC TC CEC TCmm cmolc kg-1 mg C g-1 soil cmolc kg-1 mg C g-1 soil
Theresa 4000-2000 18.2 (13) 29.5 (2.9) 21.8 (1.0) AB 33.1 (4.4) AB2000-500 18.7 (1.7) a 31.0 (0.9) 24.3 (1.1) b A 38.7 (3.2) A500-250 18.2 (1.8) 28.7 (2.0) 19.2 (1.4) B 23.7 (1.8) B250-75 18.8 (0.6) 31.3 (1.2) 20.9 (1.3) AB 26.5 (1.9) B
Appling 4000-2000 5.4 (0.2) 11.4 (1.3) 3.9 (0.5) 9.8 (1.2) 2000-500 5.8 (0.8) 13.2 (1.7) 3.7 (0.3) 10.9 (0.5) 500-250 5.4 (0.1) 13.5 (0.5) 3.0 (0.1) 8.0 (1.2) 250-75 5.4 (0.2) 14.3 (0.2) 3.7 (0.1) 11.5 (0.8)
Marlette-Oshtemo 4000-2000 13.9 (1.5) a 19.8 (4.6) A 17.9 (0.9) b 20.7 (8.8) A2000-500 13.3 (0.8) 12.9 (1.0) AB 15.9 (1.4) 17.5 (3.6) A500-250 13.4 (1.5) 9.3 (1.6) B 15.1 (0.3) 6.0 (0.4) B250-75 12.6 (0.7) 8.4 (0.6) B 14.8 (1.6) 6.1(1.1) B
Dry-sieved aggregates Wet-sieved aggregates
† CEC and TC data are presented based on the whole soil (sand fraction not excluded). Standard deviations are given in parentheses. Small case letters indicate significant differences between sieving methods for the specific aggregate size fraction and soil type. Large case letters indicate significant differences between aggregate size fractions for a specific soil type (p-value ≤ 0.01, n = 3).
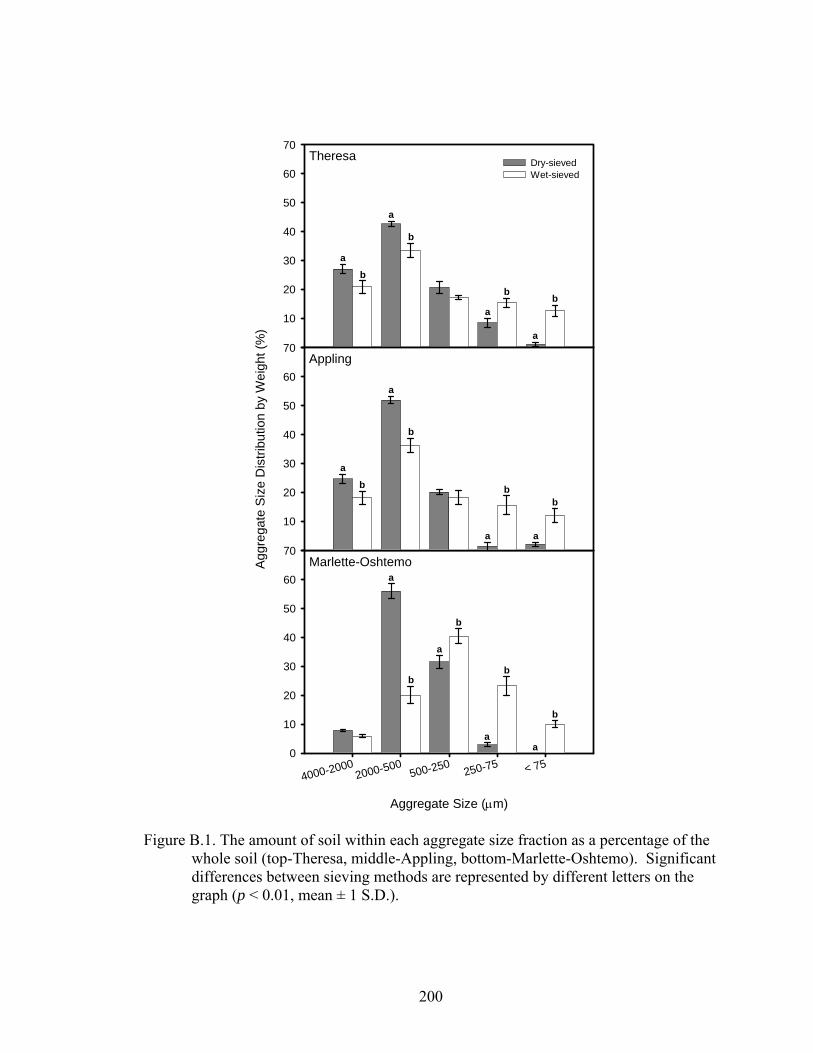
200
Dry-sievedWet-sieved
Aggregate Size (μm)
4000-20002000-500
500-250 250-75 < 750
10
20
30
40
50
60
70
Agg
rega
te S
ize
Dis
tribu
tion
by W
eigh
t (%
)a
b
a
b
a
b
a
b
a
b
a
b
a
b
a
b
a
b
a
b
a
b
a
b
10
20
30
40
50
60
70
10
20
30
40
50
60
70Theresa
Appling
Marlette-Oshtemo
Figure B.1. The amount of soil within each aggregate size fraction as a percentage of the whole soil (top-Theresa, middle-Appling, bottom-Marlette-Oshtemo). Significant differences between sieving methods are represented by different letters on the graph (p < 0.01, mean ± 1 S.D.).
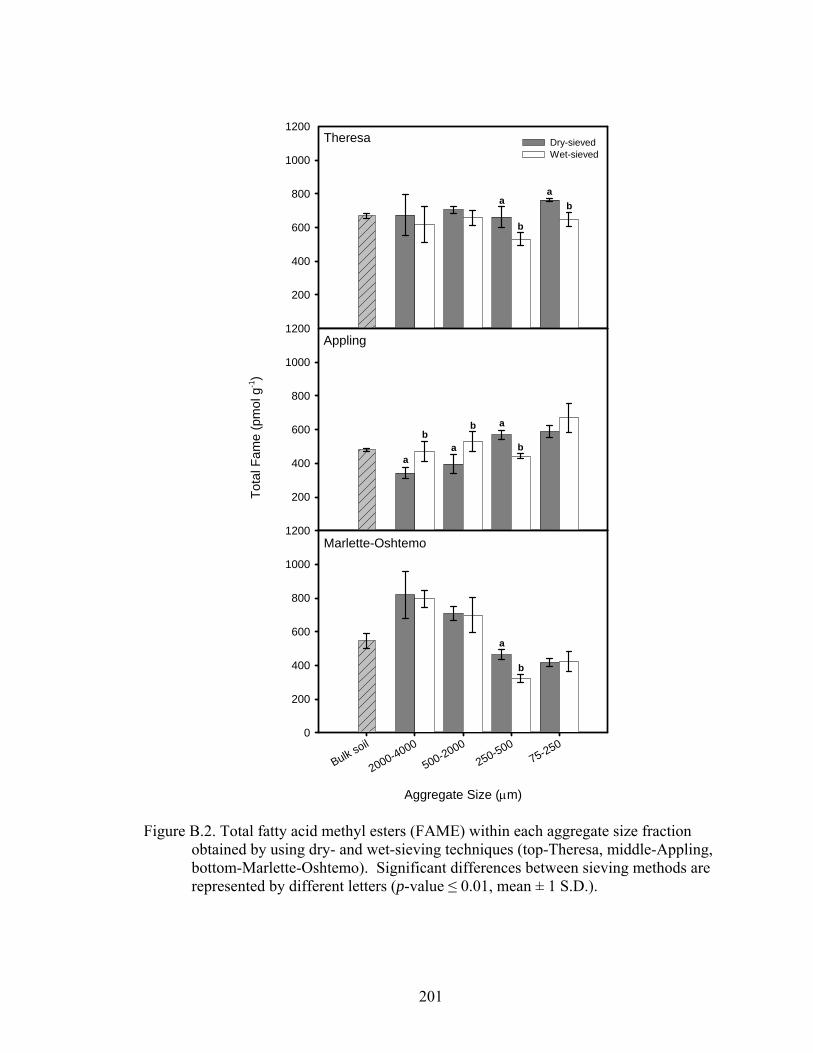
201
Tota
l Fam
e (p
mol
g-1
)
200
400
600
800
1000
1200Dry-sievedWet-sieved
200
400
600
800
1000
1200
Aggregate Size (μm)
Bulk soil
2000-4000
500-2000250-500
75-2500
200
400
600
800
1000
1200
a
ba
b a
b
a
b
ab
a
b
Theresa
Appling
Marlette-Oshtemo
Figure B.2. Total fatty acid methyl esters (FAME) within each aggregate size fraction obtained by using dry- and wet-sieving techniques (top-Theresa, middle-Appling, bottom-Marlette-Oshtemo). Significant differences between sieving methods are represented by different letters (p-value ≤ 0.01, mean ± 1 S.D.).
202
APPENDIX C
SUPPLEMENTAL DATA FROM CHAPTER 5
FATE OF 2,4,6-TRINITROTOLUENE (TNT) AND MICROBIAL COMMUNITY
STRUCTURE WITHIN SOIL AGGREGATES IN THE PRESENCE OF
EARTHWORMS
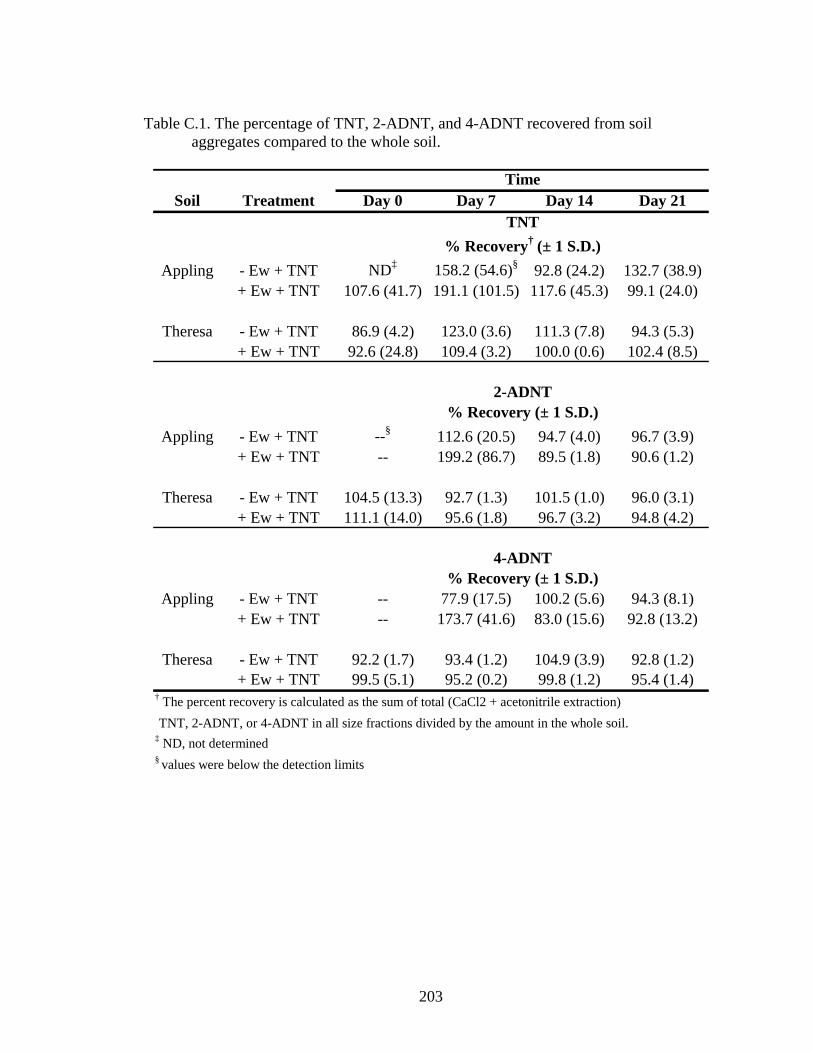
203
Table C.1. The percentage of TNT, 2-ADNT, and 4-ADNT recovered from soil
aggregates compared to the whole soil.
Soil Treatment Day 0 Day 7 Day 14 Day 21
Appling - Ew + TNT ND‡ 158.2 (54.6)§ 92.8 (24.2) 132.7 (38.9)+ Ew + TNT 107.6 (41.7) 191.1 (101.5) 117.6 (45.3) 99.1 (24.0)
Theresa - Ew + TNT 86.9 (4.2) 123.0 (3.6) 111.3 (7.8) 94.3 (5.3)+ Ew + TNT 92.6 (24.8) 109.4 (3.2) 100.0 (0.6) 102.4 (8.5)
Appling - Ew + TNT --§ 112.6 (20.5) 94.7 (4.0) 96.7 (3.9)+ Ew + TNT -- 199.2 (86.7) 89.5 (1.8) 90.6 (1.2)
Theresa - Ew + TNT 104.5 (13.3) 92.7 (1.3) 101.5 (1.0) 96.0 (3.1)+ Ew + TNT 111.1 (14.0) 95.6 (1.8) 96.7 (3.2) 94.8 (4.2)
Appling - Ew + TNT -- 77.9 (17.5) 100.2 (5.6) 94.3 (8.1)+ Ew + TNT -- 173.7 (41.6) 83.0 (15.6) 92.8 (13.2)
Theresa - Ew + TNT 92.2 (1.7) 93.4 (1.2) 104.9 (3.9) 92.8 (1.2)+ Ew + TNT 99.5 (5.1) 95.2 (0.2) 99.8 (1.2) 95.4 (1.4)
† The percent recovery is calculated as the sum of total (CaCl2 + acetonitrile extraction) TNT, 2-ADNT, or 4-ADNT in all size fractions divided by the amount in the whole soil.‡ ND, not determined§ values were below the detection limits
4-ADNT% Recovery (± 1 S.D.)
Time
2-ADNT% Recovery (± 1 S.D.)
TNT% Recovery† (± 1 S.D.)
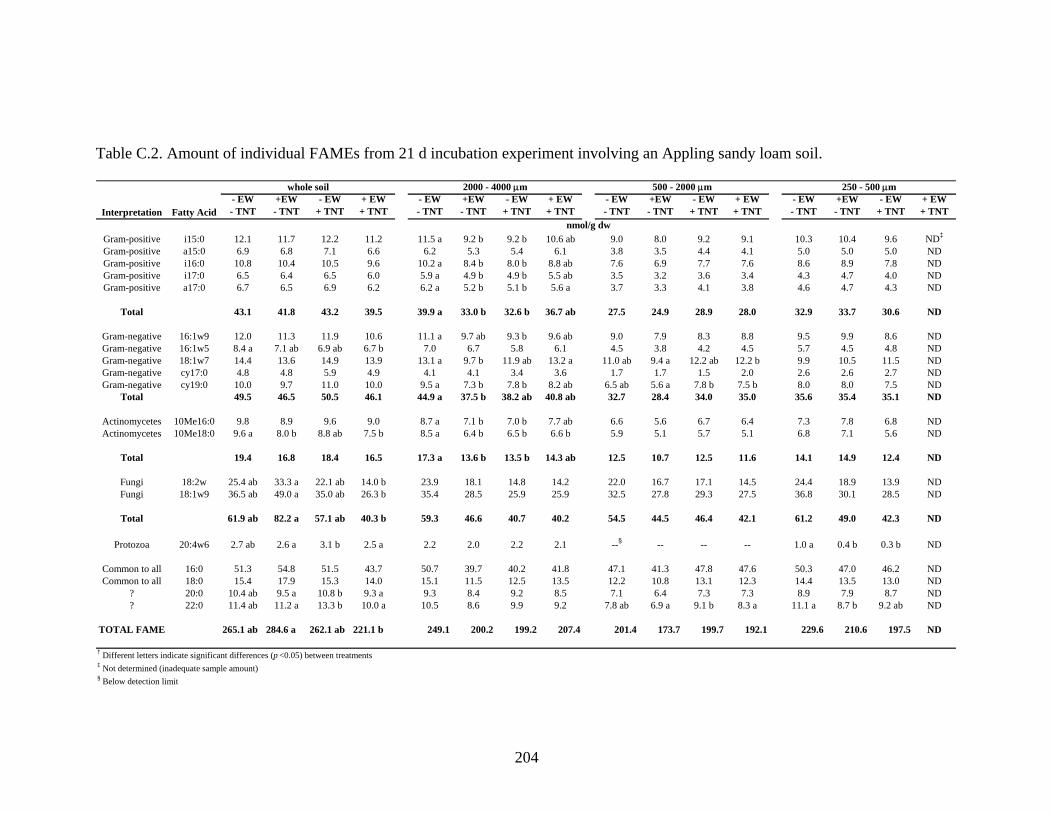
204
Table C.2. Amount of individual FAMEs from 21 d incubation experiment involving an Appling sandy loam soil.
Interpretation Fatty Acid- EW - TNT
+EW - TNT
- EW + TNT
+ EW + TNT
- EW - TNT
+EW - TNT
- EW + TNT
+ EW + TNT
- EW - TNT
+EW - TNT
- EW + TNT
+ EW + TNT
- EW - TNT
+EW - TNT
- EW + TNT
+ EW + TNT
Gram-positive i15:0 12.1 11.7 12.2 11.2 11.5 a 9.2 b 9.2 b 10.6 ab 9.0 8.0 9.2 9.1 10.3 10.4 9.6 ND‡
Gram-positive a15:0 6.9 6.8 7.1 6.6 6.2 5.3 5.4 6.1 3.8 3.5 4.4 4.1 5.0 5.0 5.0 NDGram-positive i16:0 10.8 10.4 10.5 9.6 10.2 a 8.4 b 8.0 b 8.8 ab 7.6 6.9 7.7 7.6 8.6 8.9 7.8 NDGram-positive i17:0 6.5 6.4 6.5 6.0 5.9 a 4.9 b 4.9 b 5.5 ab 3.5 3.2 3.6 3.4 4.3 4.7 4.0 NDGram-positive a17:0 6.7 6.5 6.9 6.2 6.2 a 5.2 b 5.1 b 5.6 a 3.7 3.3 4.1 3.8 4.6 4.7 4.3 ND
Total 43.1 41.8 43.2 39.5 39.9 a 33.0 b 32.6 b 36.7 ab 27.5 24.9 28.9 28.0 32.9 33.7 30.6 ND
Gram-negative 16:1w9 12.0 11.3 11.9 10.6 11.1 a 9.7 ab 9.3 b 9.6 ab 9.0 7.9 8.3 8.8 9.5 9.9 8.6 NDGram-negative 16:1w5 8.4 a 7.1 ab 6.9 ab 6.7 b 7.0 6.7 5.8 6.1 4.5 3.8 4.2 4.5 5.7 4.5 4.8 NDGram-negative 18:1w7 14.4 13.6 14.9 13.9 13.1 a 9.7 b 11.9 ab 13.2 a 11.0 ab 9.4 a 12.2 ab 12.2 b 9.9 10.5 11.5 NDGram-negative cy17:0 4.8 4.8 5.9 4.9 4.1 4.1 3.4 3.6 1.7 1.7 1.5 2.0 2.6 2.6 2.7 NDGram-negative cy19:0 10.0 9.7 11.0 10.0 9.5 a 7.3 b 7.8 b 8.2 ab 6.5 ab 5.6 a 7.8 b 7.5 b 8.0 8.0 7.5 ND
Total 49.5 46.5 50.5 46.1 44.9 a 37.5 b 38.2 ab 40.8 ab 32.7 28.4 34.0 35.0 35.6 35.4 35.1 ND
Actinomycetes 10Me16:0 9.8 8.9 9.6 9.0 8.7 a 7.1 b 7.0 b 7.7 ab 6.6 5.6 6.7 6.4 7.3 7.8 6.8 NDActinomycetes 10Me18:0 9.6 a 8.0 b 8.8 ab 7.5 b 8.5 a 6.4 b 6.5 b 6.6 b 5.9 5.1 5.7 5.1 6.8 7.1 5.6 ND
Total 19.4 16.8 18.4 16.5 17.3 a 13.6 b 13.5 b 14.3 ab 12.5 10.7 12.5 11.6 14.1 14.9 12.4 ND
Fungi 18:2w 25.4 ab 33.3 a 22.1 ab 14.0 b 23.9 18.1 14.8 14.2 22.0 16.7 17.1 14.5 24.4 18.9 13.9 NDFungi 18:1w9 36.5 ab 49.0 a 35.0 ab 26.3 b 35.4 28.5 25.9 25.9 32.5 27.8 29.3 27.5 36.8 30.1 28.5 ND
Total 61.9 ab 82.2 a 57.1 ab 40.3 b 59.3 46.6 40.7 40.2 54.5 44.5 46.4 42.1 61.2 49.0 42.3 ND
Protozoa 20:4w6 2.7 ab 2.6 a 3.1 b 2.5 a 2.2 2.0 2.2 2.1 --§ -- -- -- 1.0 a 0.4 b 0.3 b ND
Common to all 16:0 51.3 54.8 51.5 43.7 50.7 39.7 40.2 41.8 47.1 41.3 47.8 47.6 50.3 47.0 46.2 NDCommon to all 18:0 15.4 17.9 15.3 14.0 15.1 11.5 12.5 13.5 12.2 10.8 13.1 12.3 14.4 13.5 13.0 ND
? 20:0 10.4 ab 9.5 a 10.8 b 9.3 a 9.3 8.4 9.2 8.5 7.1 6.4 7.3 7.3 8.9 7.9 8.7 ND? 22:0 11.4 ab 11.2 a 13.3 b 10.0 a 10.5 8.6 9.9 9.2 7.8 ab 6.9 a 9.1 b 8.3 a 11.1 a 8.7 b 9.2 ab ND
TOTAL FAME 265.1 ab 284.6 a 262.1 ab 221.1 b 249.1 200.2 199.2 207.4 201.4 173.7 199.7 192.1 229.6 210.6 197.5 ND
† Different letters indicate significant differences (p <0.05) between treatments‡ Not determined (inadequate sample amount)§ Below detection limit
nmol/g dw
whole soil 2000 - 4000 μm 500 - 2000 μm 250 - 500 μm
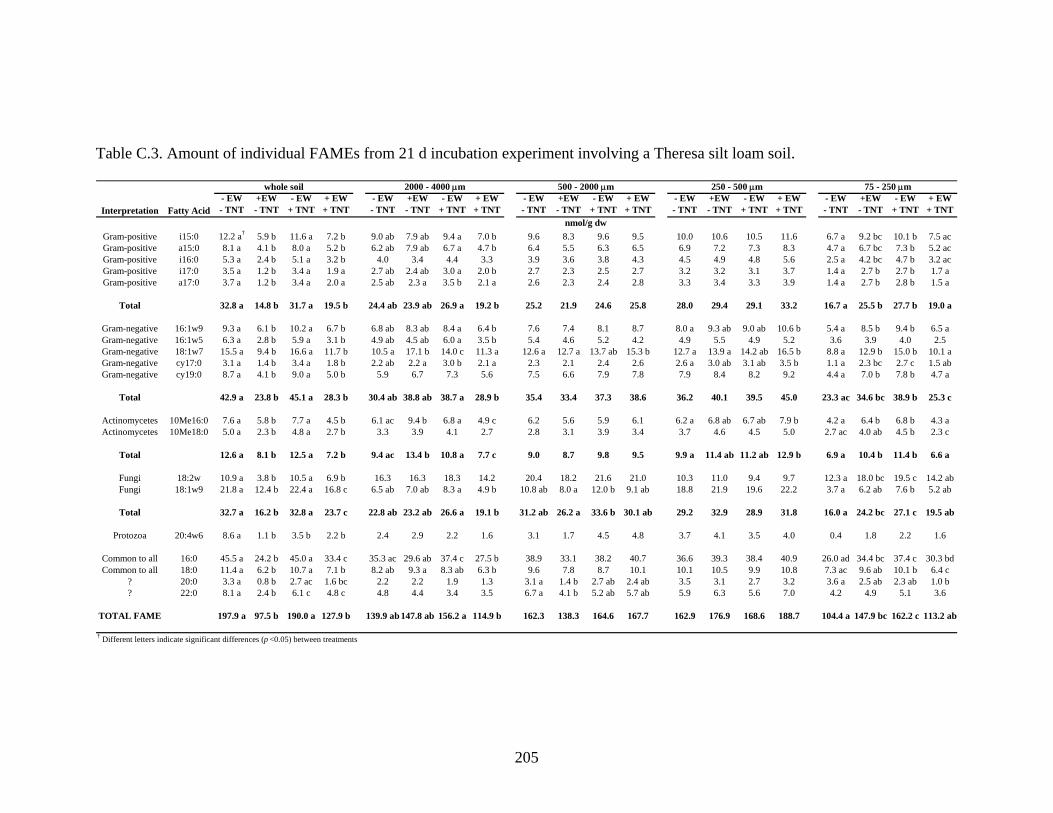
205
Table C.3. Amount of individual FAMEs from 21 d incubation experiment involving a Theresa silt loam soil.
Interpretation Fatty Acid- EW - TNT
+EW - TNT
- EW + TNT
+ EW + TNT
- EW - TNT
+EW - TNT
- EW + TNT
+ EW + TNT
- EW - TNT
+EW - TNT
- EW + TNT
+ EW + TNT
- EW - TNT
+EW - TNT
- EW + TNT
+ EW + TNT
- EW - TNT
+EW - TNT
- EW + TNT
+ EW + TNT
Gram-positive i15:0 12.2 a† 5.9 b 11.6 a 7.2 b 9.0 ab 7.9 ab 9.4 a 7.0 b 9.6 8.3 9.6 9.5 10.0 10.6 10.5 11.6 6.7 a 9.2 bc 10.1 b 7.5 acGram-positive a15:0 8.1 a 4.1 b 8.0 a 5.2 b 6.2 ab 7.9 ab 6.7 a 4.7 b 6.4 5.5 6.3 6.5 6.9 7.2 7.3 8.3 4.7 a 6.7 bc 7.3 b 5.2 acGram-positive i16:0 5.3 a 2.4 b 5.1 a 3.2 b 4.0 3.4 4.4 3.3 3.9 3.6 3.8 4.3 4.5 4.9 4.8 5.6 2.5 a 4.2 bc 4.7 b 3.2 acGram-positive i17:0 3.5 a 1.2 b 3.4 a 1.9 a 2.7 ab 2.4 ab 3.0 a 2.0 b 2.7 2.3 2.5 2.7 3.2 3.2 3.1 3.7 1.4 a 2.7 b 2.7 b 1.7 aGram-positive a17:0 3.7 a 1.2 b 3.4 a 2.0 a 2.5 ab 2.3 a 3.5 b 2.1 a 2.6 2.3 2.4 2.8 3.3 3.4 3.3 3.9 1.4 a 2.7 b 2.8 b 1.5 a
Total 32.8 a 14.8 b 31.7 a 19.5 b 24.4 ab 23.9 ab 26.9 a 19.2 b 25.2 21.9 24.6 25.8 28.0 29.4 29.1 33.2 16.7 a 25.5 b 27.7 b 19.0 a
Gram-negative 16:1w9 9.3 a 6.1 b 10.2 a 6.7 b 6.8 ab 8.3 ab 8.4 a 6.4 b 7.6 7.4 8.1 8.7 8.0 a 9.3 ab 9.0 ab 10.6 b 5.4 a 8.5 b 9.4 b 6.5 aGram-negative 16:1w5 6.3 a 2.8 b 5.9 a 3.1 b 4.9 ab 4.5 ab 6.0 a 3.5 b 5.4 4.6 5.2 4.2 4.9 5.5 4.9 5.2 3.6 3.9 4.0 2.5Gram-negative 18:1w7 15.5 a 9.4 b 16.6 a 11.7 b 10.5 a 17.1 b 14.0 c 11.3 a 12.6 a 12.7 a 13.7 ab 15.3 b 12.7 a 13.9 a 14.2 ab 16.5 b 8.8 a 12.9 b 15.0 b 10.1 aGram-negative cy17:0 3.1 a 1.4 b 3.4 a 1.8 b 2.2 ab 2.2 a 3.0 b 2.1 a 2.3 2.1 2.4 2.6 2.6 a 3.0 ab 3.1 ab 3.5 b 1.1 a 2.3 bc 2.7 c 1.5 abGram-negative cy19:0 8.7 a 4.1 b 9.0 a 5.0 b 5.9 6.7 7.3 5.6 7.5 6.6 7.9 7.8 7.9 8.4 8.2 9.2 4.4 a 7.0 b 7.8 b 4.7 a
Total 42.9 a 23.8 b 45.1 a 28.3 b 30.4 ab 38.8 ab 38.7 a 28.9 b 35.4 33.4 37.3 38.6 36.2 40.1 39.5 45.0 23.3 ac 34.6 bc 38.9 b 25.3 c
Actinomycetes 10Me16:0 7.6 a 5.8 b 7.7 a 4.5 b 6.1 ac 9.4 b 6.8 a 4.9 c 6.2 5.6 5.9 6.1 6.2 a 6.8 ab 6.7 ab 7.9 b 4.2 a 6.4 b 6.8 b 4.3 aActinomycetes 10Me18:0 5.0 a 2.3 b 4.8 a 2.7 b 3.3 3.9 4.1 2.7 2.8 3.1 3.9 3.4 3.7 4.6 4.5 5.0 2.7 ac 4.0 ab 4.5 b 2.3 c
Total 12.6 a 8.1 b 12.5 a 7.2 b 9.4 ac 13.4 b 10.8 a 7.7 c 9.0 8.7 9.8 9.5 9.9 a 11.4 ab 11.2 ab 12.9 b 6.9 a 10.4 b 11.4 b 6.6 a
Fungi 18:2w 10.9 a 3.8 b 10.5 a 6.9 b 16.3 16.3 18.3 14.2 20.4 18.2 21.6 21.0 10.3 11.0 9.4 9.7 12.3 a 18.0 bc 19.5 c 14.2 abFungi 18:1w9 21.8 a 12.4 b 22.4 a 16.8 c 6.5 ab 7.0 ab 8.3 a 4.9 b 10.8 ab 8.0 a 12.0 b 9.1 ab 18.8 21.9 19.6 22.2 3.7 a 6.2 ab 7.6 b 5.2 ab
Total 32.7 a 16.2 b 32.8 a 23.7 c 22.8 ab 23.2 ab 26.6 a 19.1 b 31.2 ab 26.2 a 33.6 b 30.1 ab 29.2 32.9 28.9 31.8 16.0 a 24.2 bc 27.1 c 19.5 ab
Protozoa 20:4w6 8.6 a 1.1 b 3.5 b 2.2 b 2.4 2.9 2.2 1.6 3.1 1.7 4.5 4.8 3.7 4.1 3.5 4.0 0.4 1.8 2.2 1.6
Common to all 16:0 45.5 a 24.2 b 45.0 a 33.4 c 35.3 ac 29.6 ab 37.4 c 27.5 b 38.9 33.1 38.2 40.7 36.6 39.3 38.4 40.9 26.0 ad 34.4 bc 37.4 c 30.3 bdCommon to all 18:0 11.4 a 6.2 b 10.7 a 7.1 b 8.2 ab 9.3 a 8.3 ab 6.3 b 9.6 7.8 8.7 10.1 10.1 10.5 9.9 10.8 7.3 ac 9.6 ab 10.1 b 6.4 c
? 20:0 3.3 a 0.8 b 2.7 ac 1.6 bc 2.2 2.2 1.9 1.3 3.1 a 1.4 b 2.7 ab 2.4 ab 3.5 3.1 2.7 3.2 3.6 a 2.5 ab 2.3 ab 1.0 b? 22:0 8.1 a 2.4 b 6.1 c 4.8 c 4.8 4.4 3.4 3.5 6.7 a 4.1 b 5.2 ab 5.7 ab 5.9 6.3 5.6 7.0 4.2 4.9 5.1 3.6
TOTAL FAME 197.9 a 97.5 b 190.0 a 127.9 b 139.9 ab 147.8 ab 156.2 a 114.9 b 162.3 138.3 164.6 167.7 162.9 176.9 168.6 188.7 104.4 a 147.9 bc 162.2 c 113.2 ab
† Different letters indicate significant differences (p <0.05) between treatments
75 - 250 μm250 - 500 μm
nmol/g dw
whole soil 2000 - 4000 μm 500 - 2000 μm
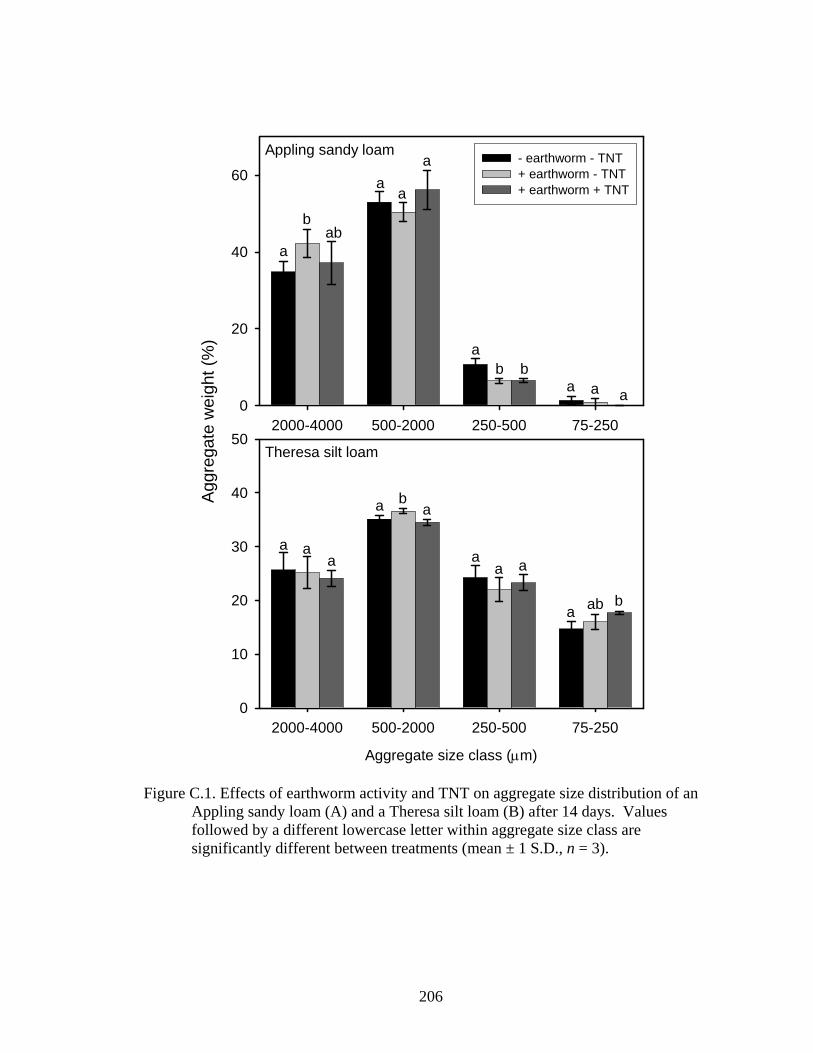
206
2000-4000 500-2000 250-500 75-2500
20
40
60- earthworm - TNT+ earthworm - TNT+ earthworm + TNT
Appling sandy loam
aab
b
a
a
ab b
Aggregate size class (μm)
2000-4000 500-2000 250-500 75-250
Aggr
egat
e w
eigh
t (%
)
0
10
20
30
40
50Theresa silt loam
a aa
a ba
aa a
a ab b
a
a aa
Figure C.1. Effects of earthworm activity and TNT on aggregate size distribution of an Appling sandy loam (A) and a Theresa silt loam (B) after 14 days. Values followed by a different lowercase letter within aggregate size class are significantly different between treatments (mean ± 1 S.D., n = 3).
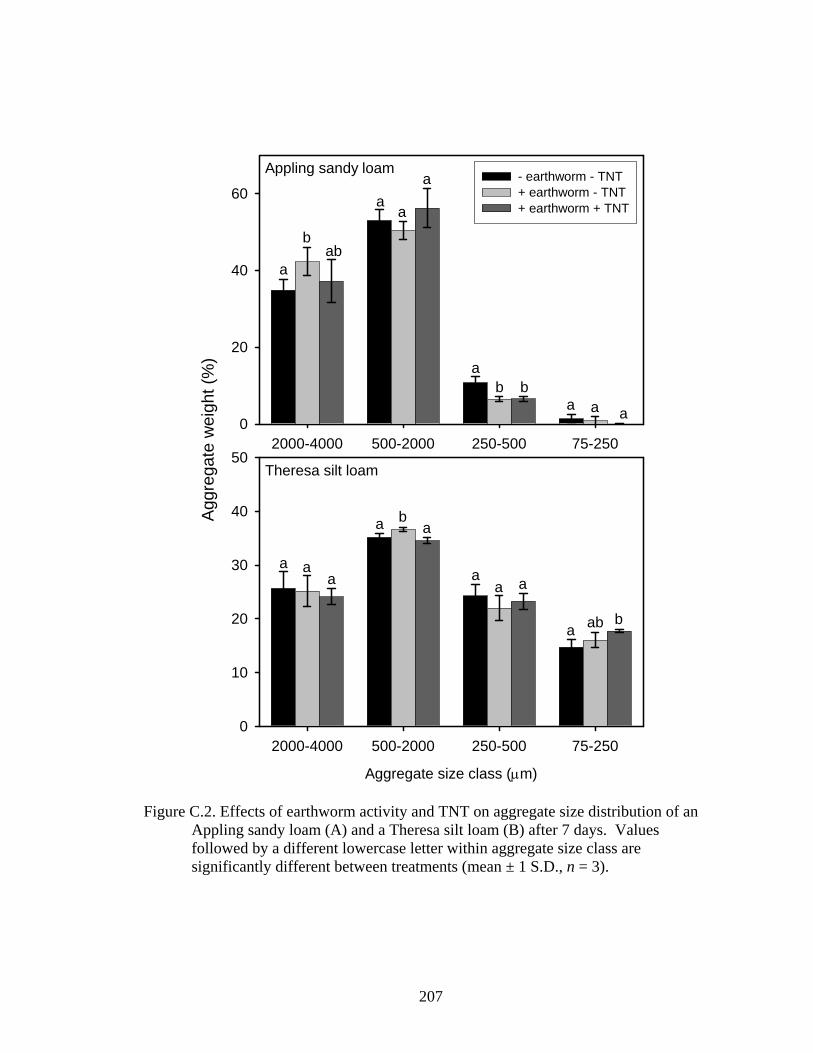
207
2000-4000 500-2000 250-500 75-2500
20
40
60- earthworm - TNT+ earthworm - TNT+ earthworm + TNT
Appling sandy loam
aab
b
a
a
ab b
Aggregate size class (μm)
2000-4000 500-2000 250-500 75-250
Aggr
egat
e w
eigh
t (%
)
0
10
20
30
40
50Theresa silt loam
a aa
a ba
aa a
a ab b
a
a aa
Figure C.2. Effects of earthworm activity and TNT on aggregate size distribution of an Appling sandy loam (A) and a Theresa silt loam (B) after 7 days. Values followed by a different lowercase letter within aggregate size class are significantly different between treatments (mean ± 1 S.D., n = 3).
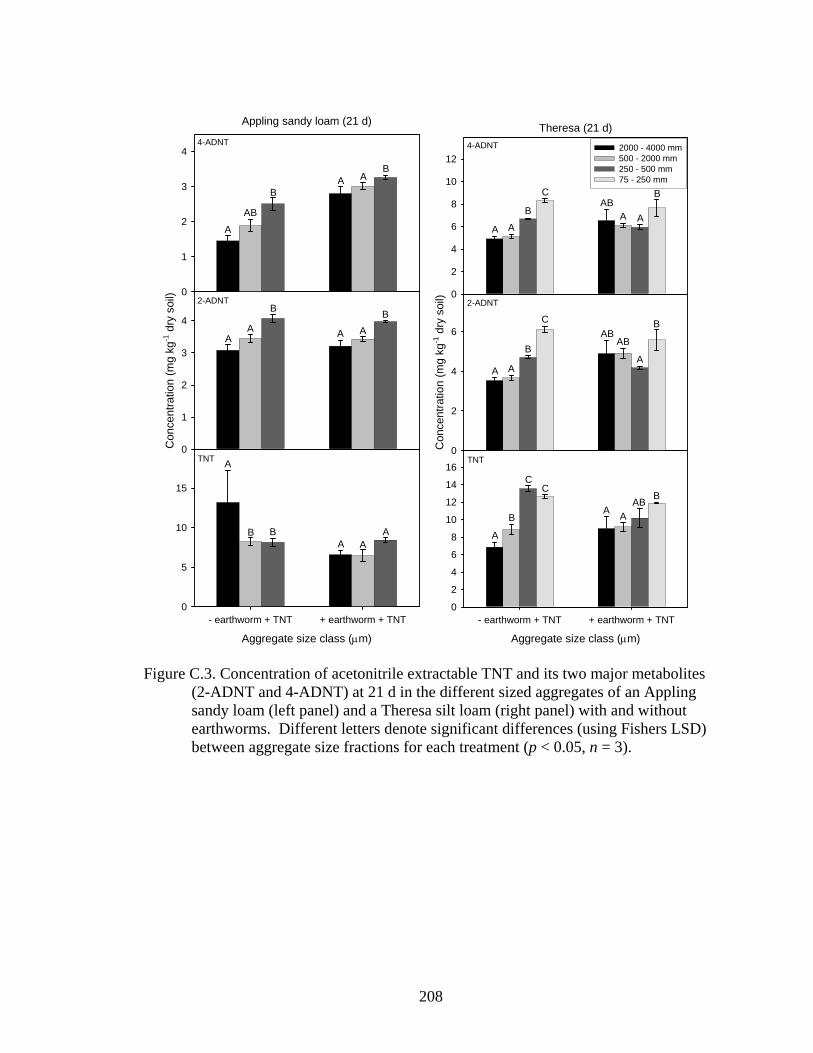
208
Aggregate size class (μm)
- earthworm + TNT + earthworm + TNT0
5
10
15
Con
cent
ratio
n (m
g kg
-1 d
ry s
oil)
0
1
2
3
4
Appling sandy loam (21 d)
0
1
2
3
4
TNT
2-ADNT
4-ADNT
A
B BA A
A
AA
B B
A A
A
AB
B
BA A
Aggregate size class (μm)
- earthworm + TNT + earthworm + TNT0
2
4
6
8
10
12
14
16
Con
cent
ratio
n (m
g kg
-1 d
ry s
oil)
0
2
4
6
Theresa (21 d)
0
2
4
6
8
10
122000 - 4000 mm500 - 2000 mm250 - 500 mm75 - 250 mm
TNT
2-ADNT
4-ADNT
B
A
CC
A AAB B
A A
B
CAB
AB
A
B
A A
B
CAB
A A
B
Figure C.3. Concentration of acetonitrile extractable TNT and its two major metabolites (2-ADNT and 4-ADNT) at 21 d in the different sized aggregates of an Appling sandy loam (left panel) and a Theresa silt loam (right panel) with and without earthworms. Different letters denote significant differences (using Fishers LSD) between aggregate size fractions for each treatment (p < 0.05, n = 3).
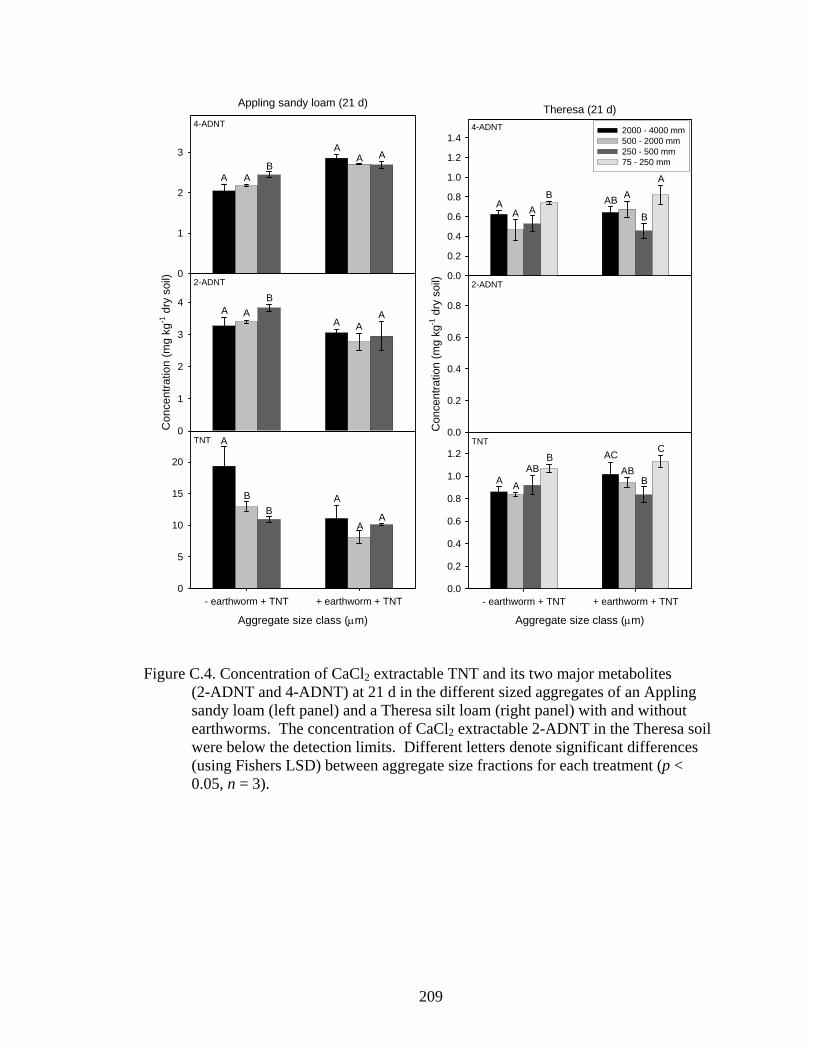
209
Aggregate size class (μm)
- earthworm + TNT + earthworm + TNT0
5
10
15
20
Con
cent
ratio
n (m
g kg
-1 d
ry s
oil)
0
1
2
3
4
Appling sandy loam (21 d)
0
1
2
3
TNT
2-ADNT
4-ADNT
A
BB
A
AA
A AB
AA A
A AB
AA
A
Aggregate size class (μm)
- earthworm + TNT + earthworm + TNT0.0
0.2
0.4
0.6
0.8
1.0
1.2
Con
cent
ratio
n (m
g kg
-1 d
ry s
oil)
0.0
0.2
0.4
0.6
0.8
Theresa (21 d)
0.0
0.2
0.4
0.6
0.8
1.0
1.2
1.42000 - 4000 mm500 - 2000 mm250 - 500 mm75 - 250 mm
TNT
2-ADNT
4-ADNT
AA
BAB
ACAB
B
C
AA A
B AB A
B
A
Figure C.4. Concentration of CaCl2 extractable TNT and its two major metabolites (2-ADNT and 4-ADNT) at 21 d in the different sized aggregates of an Appling sandy loam (left panel) and a Theresa silt loam (right panel) with and without earthworms. The concentration of CaCl2 extractable 2-ADNT in the Theresa soil were below the detection limits. Different letters denote significant differences (using Fishers LSD) between aggregate size fractions for each treatment (p < 0.05, n = 3).
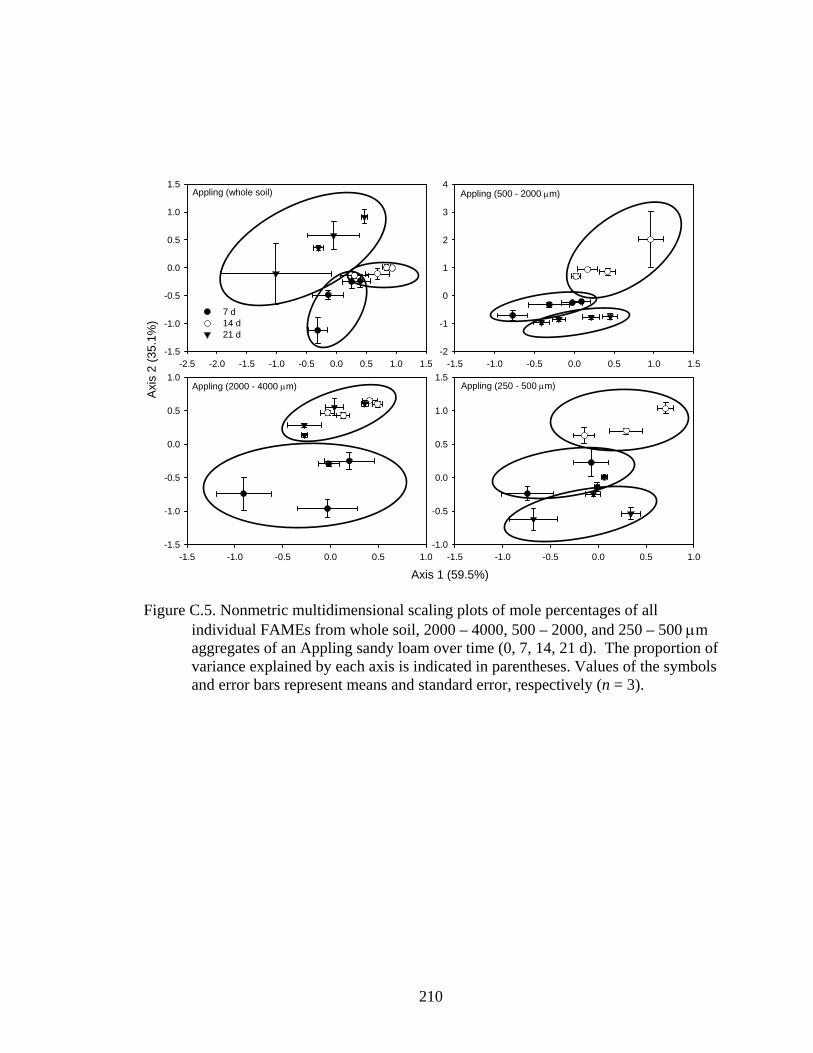
210
-2.5 -2.0 -1.5 -1.0 -0.5 0.0 0.5 1.0 1.5-1.5
-1.0
-0.5
0.0
0.5
1.0
1.5
7 d14 d21 d
Axis 1 (59.5%)-1.5 -1.0 -0.5 0.0 0.5 1.0
Axi
s 2
(35.
1%)
-1.5
-1.0
-0.5
0.0
0.5
1.0-1.5 -1.0 -0.5 0.0 0.5 1.0 1.5
-2
-1
0
1
2
3
4
-1.5 -1.0 -0.5 0.0 0.5 1.0-1.0
-0.5
0.0
0.5
1.0
1.5
Appling (whole soil)
Appling (2000 - 4000 μm)
Appling (500 - 2000 μm)
Appling (250 - 500 μm)
Figure C.5. Nonmetric multidimensional scaling plots of mole percentages of all
individual FAMEs from whole soil, 2000 – 4000, 500 – 2000, and 250 – 500 μm aggregates of an Appling sandy loam over time (0, 7, 14, 21 d). The proportion of variance explained by each axis is indicated in parentheses. Values of the symbols and error bars represent means and standard error, respectively (n = 3).
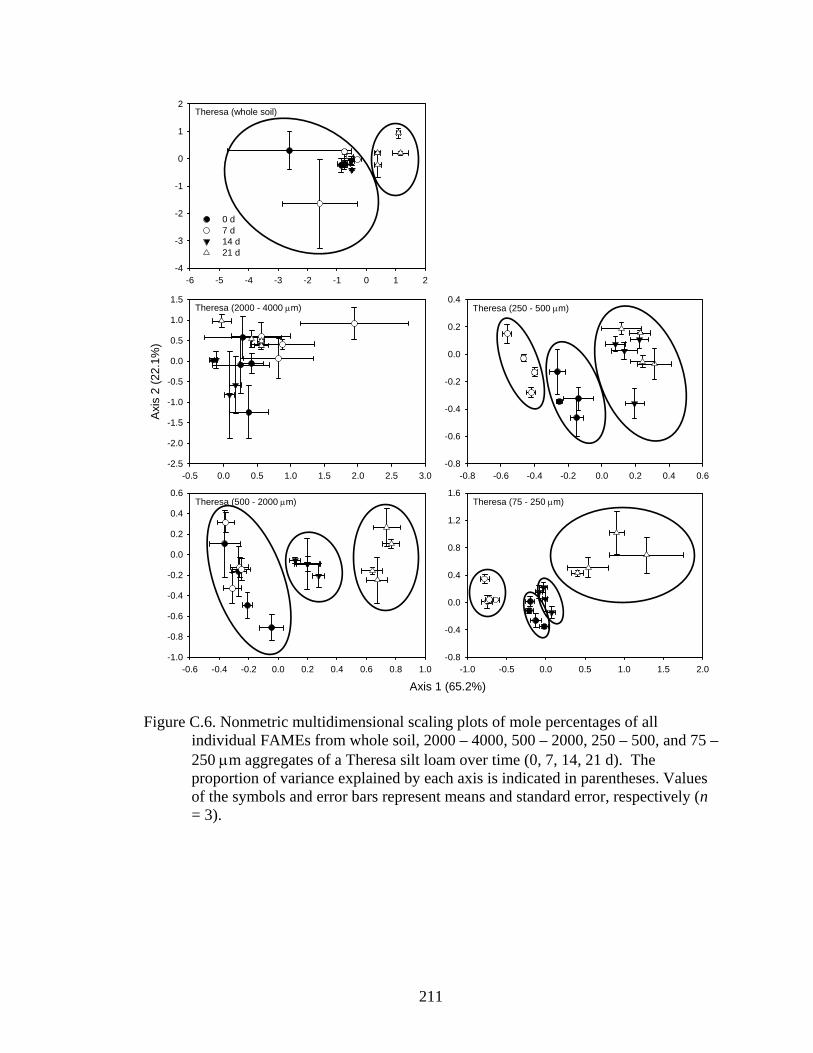
211
-6 -5 -4 -3 -2 -1 0 1 2-4
-3
-2
-1
0
1
2
0 d7 d14 d21 d
-0.5 0.0 0.5 1.0 1.5 2.0 2.5 3.0
Axis
2 (2
2.1%
)
-2.5
-2.0
-1.5
-1.0
-0.5
0.0
0.5
1.0
1.5
-0.8 -0.6 -0.4 -0.2 0.0 0.2 0.4 0.6-0.8
-0.6
-0.4
-0.2
0.0
0.2
0.4
-1.0 -0.5 0.0 0.5 1.0 1.5 2.0-0.8
-0.4
0.0
0.4
0.8
1.2
1.6
Axis 1 (65.2%)-0.6 -0.4 -0.2 0.0 0.2 0.4 0.6 0.8 1.0
-1.0
-0.8
-0.6
-0.4
-0.2
0.0
0.2
0.4
0.6
Theresa (whole soil)
Theresa (2000 - 4000 μm)
Theresa (500 - 2000 μm)
Theresa (250 - 500 μm)
Theresa (75 - 250 μm)
Figure C.6. Nonmetric multidimensional scaling plots of mole percentages of all individual FAMEs from whole soil, 2000 – 4000, 500 – 2000, 250 – 500, and 75 – 250 μm aggregates of a Theresa silt loam over time (0, 7, 14, 21 d). The proportion of variance explained by each axis is indicated in parentheses. Values of the symbols and error bars represent means and standard error, respectively (n = 3).
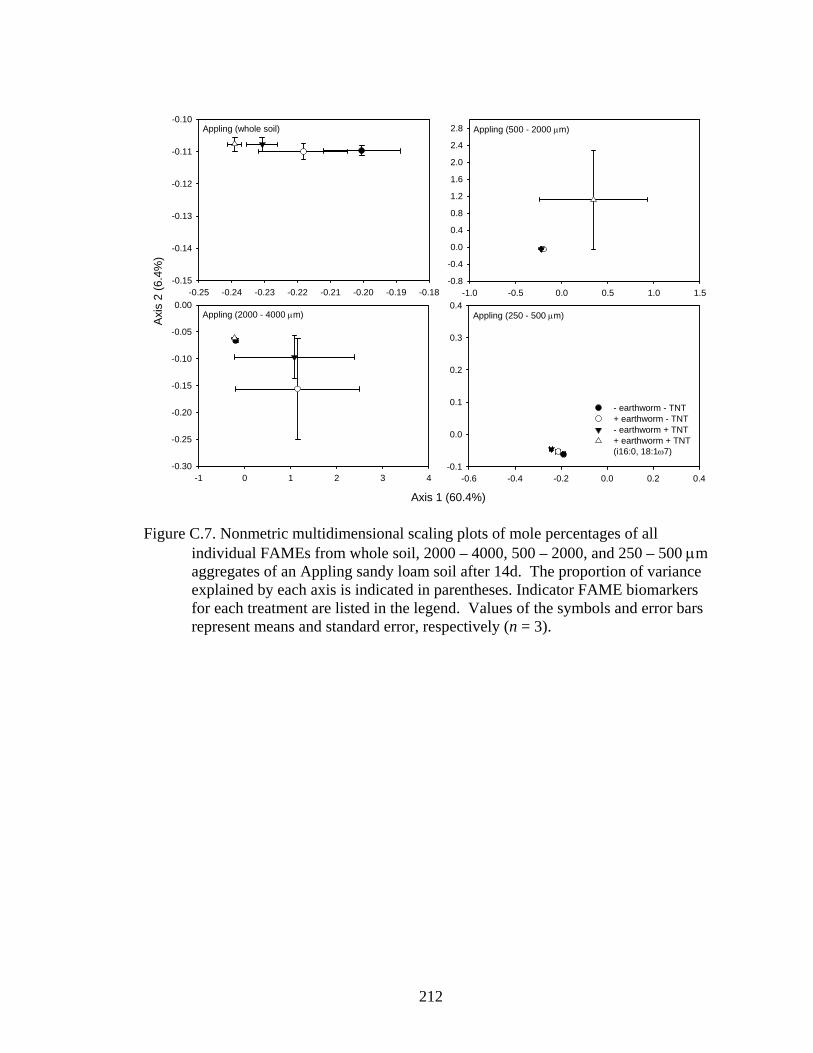
212
-0.6 -0.4 -0.2 0.0 0.2 0.4-0.1
0.0
0.1
0.2
0.3
0.4-0.25 -0.24 -0.23 -0.22 -0.21 -0.20 -0.19 -0.18
-0.15
-0.14
-0.13
-0.12
-0.11
-0.10Appling (whole soil)
Axis 1 (60.4%)
-1 0 1 2 3 4
Axi
s 2
(6.4
%)
-0.30
-0.25
-0.20
-0.15
-0.10
-0.05
0.00
- earthworm - TNT+ earthworm - TNT- earthworm + TNT+ earthworm + TNT(i16:0, 18:1ω7)
Appling (2000 - 4000 μm)
-1.0 -0.5 0.0 0.5 1.0 1.5-0.8
-0.4
0.0
0.4
0.8
1.2
1.6
2.0
2.4
2.8 Appling (500 - 2000 μm)
Appling (250 - 500 μm)
Figure C.7. Nonmetric multidimensional scaling plots of mole percentages of all individual FAMEs from whole soil, 2000 – 4000, 500 – 2000, and 250 – 500 μm aggregates of an Appling sandy loam soil after 14d. The proportion of variance explained by each axis is indicated in parentheses. Indicator FAME biomarkers for each treatment are listed in the legend. Values of the symbols and error bars represent means and standard error, respectively (n = 3).
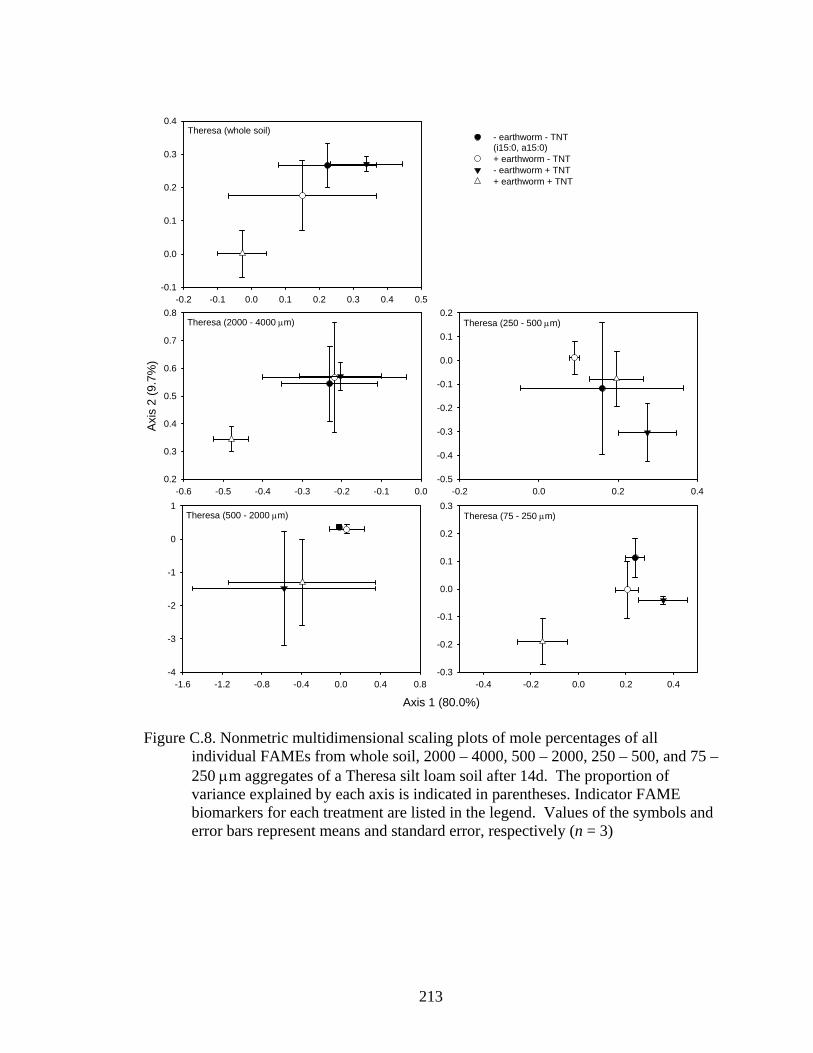
213
-0.2 -0.1 0.0 0.1 0.2 0.3 0.4 0.5-0.1
0.0
0.1
0.2
0.3
0.4
- earthworm - TNT(i15:0, a15:0)+ earthworm - TNT- earthworm + TNT+ earthworm + TNT
Theresa (whole soil)
Axis 1 (80.0%)-1.6 -1.2 -0.8 -0.4 0.0 0.4 0.8
-4
-3
-2
-1
0
1Theresa (500 - 2000 μm)
-0.6 -0.5 -0.4 -0.3 -0.2 -0.1 0.0
Axis
2 (9
.7%
)
0.2
0.3
0.4
0.5
0.6
0.7
0.8Theresa (2000 - 4000 μm)
-0.2 0.0 0.2 0.4-0.5
-0.4
-0.3
-0.2
-0.1
0.0
0.1
0.2Theresa (250 - 500 μm)
-0.4 -0.2 0.0 0.2 0.4-0.3
-0.2
-0.1
0.0
0.1
0.2
0.3Theresa (75 - 250 μm)
Figure C.8. Nonmetric multidimensional scaling plots of mole percentages of all individual FAMEs from whole soil, 2000 – 4000, 500 – 2000, 250 – 500, and 75 – 250 μm aggregates of a Theresa silt loam soil after 14d. The proportion of variance explained by each axis is indicated in parentheses. Indicator FAME biomarkers for each treatment are listed in the legend. Values of the symbols and error bars represent means and standard error, respectively (n = 3)
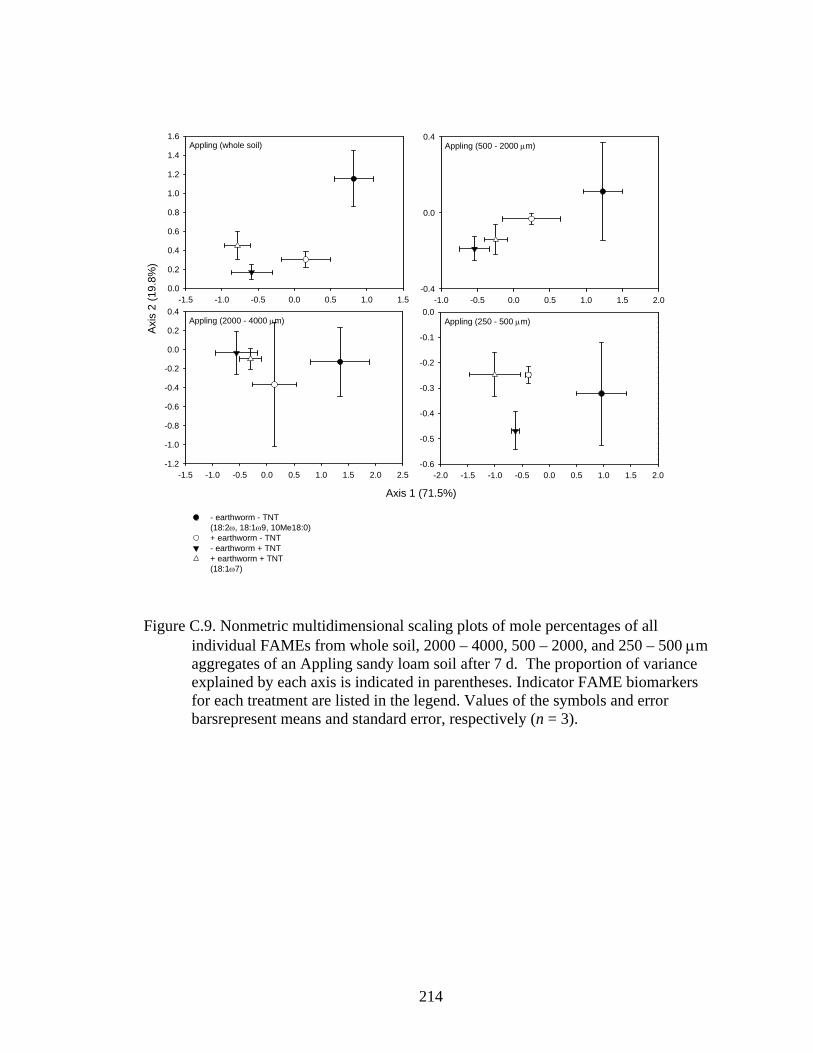
214
-2.0 -1.5 -1.0 -0.5 0.0 0.5 1.0 1.5 2.0-0.6
-0.5
-0.4
-0.3
-0.2
-0.1
0.0-1.5 -1.0 -0.5 0.0 0.5 1.0 1.5
0.0
0.2
0.4
0.6
0.8
1.0
1.2
1.4
1.6Appling (whole soil)
Axis 1 (71.5%)
-1.5 -1.0 -0.5 0.0 0.5 1.0 1.5 2.0 2.5
Axi
s 2
(19.
8%)
-1.2
-1.0
-0.8
-0.6
-0.4
-0.2
0.0
0.2
0.4
- earthworm - TNT(18:2ω, 18:1ω9, 10Me18:0)+ earthworm - TNT- earthworm + TNT+ earthworm + TNT(18:1ω7)
Appling (2000 - 4000 μm)
-1.0 -0.5 0.0 0.5 1.0 1.5 2.0-0.4
0.0
0.4Appling (500 - 2000 μm)
Appling (250 - 500 μm)
Figure C.9. Nonmetric multidimensional scaling plots of mole percentages of all
individual FAMEs from whole soil, 2000 – 4000, 500 – 2000, and 250 – 500 μm aggregates of an Appling sandy loam soil after 7 d. The proportion of variance explained by each axis is indicated in parentheses. Indicator FAME biomarkers for each treatment are listed in the legend. Values of the symbols and error barsrepresent means and standard error, respectively (n = 3).
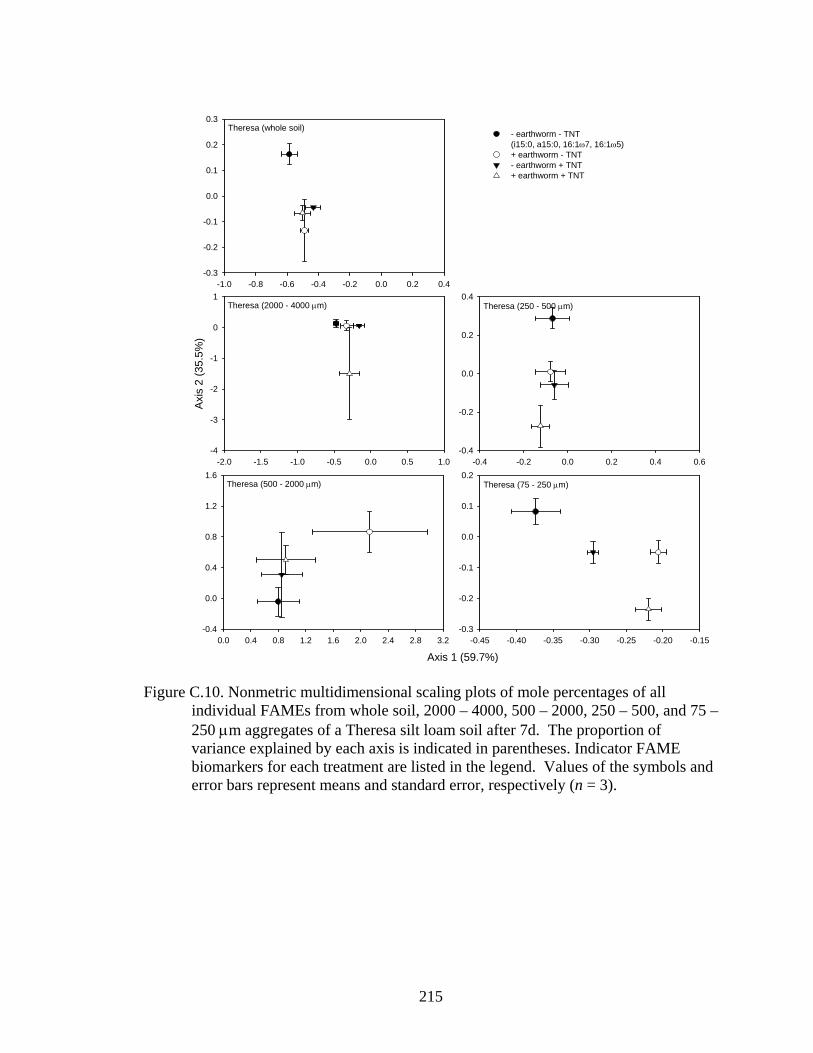
215
-1.0 -0.8 -0.6 -0.4 -0.2 0.0 0.2 0.4-0.3
-0.2
-0.1
0.0
0.1
0.2
0.3
- earthworm - TNT(i15:0, a15:0, 16:1ω7, 16:1ω5)+ earthworm - TNT- earthworm + TNT+ earthworm + TNT
Theresa (whole soil)
Axis 1 (59.7%)0.0 0.4 0.8 1.2 1.6 2.0 2.4 2.8 3.2
-0.4
0.0
0.4
0.8
1.2
1.6Theresa (500 - 2000 μm)
-2.0 -1.5 -1.0 -0.5 0.0 0.5 1.0
Axi
s 2
(35.
5%)
-4
-3
-2
-1
0
1Theresa (2000 - 4000 μm)
-0.4 -0.2 0.0 0.2 0.4 0.6-0.4
-0.2
0.0
0.2
0.4Theresa (250 - 500 μm)
-0.45 -0.40 -0.35 -0.30 -0.25 -0.20 -0.15-0.3
-0.2
-0.1
0.0
0.1
0.2Theresa (75 - 250 μm)
Figure C.10. Nonmetric multidimensional scaling plots of mole percentages of all
individual FAMEs from whole soil, 2000 – 4000, 500 – 2000, 250 – 500, and 75 – 250 μm aggregates of a Theresa silt loam soil after 7d. The proportion of variance explained by each axis is indicated in parentheses. Indicator FAME biomarkers for each treatment are listed in the legend. Values of the symbols and error bars represent means and standard error, respectively (n = 3).