Embed Size (px)
Citation preview
© 2020 Social Finance, Inc. Confidential Information. Do not copy or distribute. Advisory services offered through SoFi Wealth LLC. SoFi Money® is offered through SoFi Securities LLC. SoFi Lending Corp., CFL #6054612. NMLS #1121636.
Get Your Money RightBorrow, Save, Spend, Invest and Protect
© 2020 Social Finance, Inc. Confidential Information. Do not copy or distribute. Advisory services offered through SoFi Wealth LLC. SoFi Money® is offered through SoFi Securities LLC. SoFi Lending Corp., CFL #6054612. NMLS #1121636.
DisclaimerConfidentiality and DisclosuresThis presentation has been prepared for use by Social Capital Hedosophia Holdings Corp. V (“Social Capital”) and Social Finance, Inc. (“SoFi”) in connection with their proposed business combination. This presentation is for information purposes only and is being provided to you solely in your capacity as a potential investor in considering an investment in Social Capital and may not be reproduced or redistributed, in whole or in part, without the prior written consent of Social Capital and SoFi. Neither Social Capital nor SoFi makes any representation or warranty as to the accuracy or completeness of the information contained in this presentation. The information in this presentation and any oral statements made in connection with this presentation is subject to change and is not intended to be all-inclusive or to contain all the information that a person may desire in considering an investment in Social Capital and is not intended to form the basis of any investments decision in Social Capital. This presentation does not constitute either advise or a recommendation regarding any securities. You should consult your own legal, regulatory, tax, business, financial and accounting advisors to the extent you deem necessary, and must make your own decisions and perform your own independent investment and analysis of an investment in Social Capital and the transactions contemplated in this presentation.This presentation and any oral statements made in connection with this presentation shall neither constitute an offer to sell nor the solicitation of an offer to buy any securities, or the solicitation of any proxy, vote, consent or approval in any jurisdiction in connection with the proposed business combination, nor shall there be any sale of securities in any jurisdiction in which the offer, solicitation or sale would be unlawful prior to the registration or qualification under the securities laws of any such jurisdictions. This communication is restricted by law; it is not intended for distribution to, or use by any person in, any jurisdiction where such distribution or use would be contrary to local law or regulation.Forward-Looking StatementsCertain statements in this presentation may constitute “ forward-looking statements” within the meaning of the federal securities laws. Forward-looking statements include, but are not limited to, statements regarding Social Capital’s or SoFi’s expectations, hopes, beliefs, intentions or strategies regarding the future including, without limitation, statements regarding: (i) the size, demand and growth potential of the markets for SoFi’s products and SoFi’s ability to serve those markets, (ii) the degree of market acceptance and adoption of SoFi’s products, (iii) SoFi’s ability to develop innovative products and compete with other companies engaged in the financial services and technology industry and (iv) SoFi’s ability to attract and retain members. In addition, any statements that refer to projections, forecasts, or other characterizations of future events or circumstances, including any underlying assumptions, are forward-looking statements. The words “ anticipate,” “believe,” continue,” “ could,” “ estimate,” “ expect,” “ intend,” “may,” “might,” “plan,” “possible,” “potential,” “predict,” “project,” “ should,” “ strive,” “would” and similar expressions may identify forward-looking statements, but the absence of these words does not mean that statement is not forward looking. Forward-looking statements are predictions, projections and other statements about future events that are based on current expectations and assumptions and, as a result, are subject to risks and uncertainties. You should carefully consider the risks and uncertainties described in the “Risk Factors” section of Social Capital’s registration statement on Form S-1, the proxy statement/prospectus on Form S-4 relating to the business combination, which is expected to be filed by Social Capital with the Securities and Exchange Commission (the “SEC”) and other documents filed by Social Capital from time to time with the SEC. These filings identify and address other important risks and uncertainties that could cause actual events and results to differ materially from those contained in the forward-looking statements. Forward-looking statements speak only as of the date they are made. Readers are cautioned not to put undue reliance on forward-looking statements, and Social Capital and SoFi assume no obligation and do not intend to update or revise these forward-looking statements, whether as a result of new information, future events, or otherwise. Neither Social Capital nor SoFi gives any assurance that either Social Capital or SoFi will achieve its expectations.Use of Projections and Illustrative PresentationsThe financial projections, estimates, targets and illustrative presentations in this presentation are forward-looking statements that are based on assumptions that are inherently subject to significant uncertainties and contingencies, many of which are beyond Social Capital’s and SoFi’s control. While all financial projections, estimates, targets and illustrative presentations are necessarily speculative, Social Capital and SoFi believe that the preparation of prospective or illustrative financial information involves increasingly higher levels of uncertainty the further out the projection, estimate, target or illustrative presentation extends from the date of preparation. The assumptions and estimates underlying the projected, expected or target results are inherently uncertain and are subject to a wide variety of significant business, economic and competitive risks and uncertainties that could cause actual results to differ materially from those contained in the financial projections, estimates and targets. The inclusion of financial projections, estimates, targets and and illustrative presentations in this presentation should not be regarded as an indication that Social Capital and SoFi, or their representatives, considered or consider the financial projections, estimates, targets and illustrative presentation to be a reliable predictions of future events. Further, illustrative presentations are not necessarily based on management projections, estimates, expectations or targets but are presented for illustrative purposes only.Use of DataThe data contained herein is derived from various internal and external sources. All of the market data in the presentation involves a number of assumptions and limitations, and there can be no guarantee as to the accuracy or reliability of such assumptions. Further, no representation is made as to the reasonableness of the assumptions made within or the accuracy or completeness of any projections or modeling or any other information contained herein. Any data on past performance or modeling contained herein is not an indication as to future performance. Social Capital and SoFi assume no obligation to update the information in this presentation . Further, the historical financial data included in this presentation were audited by the Company in accordance with private Company AICPA standards. Accordingly, such information and data may not be included in, may be adjusted or may be presented differently in any proxy statement/prospectus to be filed with the SEC. In addition, this presentation includes estimates of certain financial metrics of SoFi that may differ from SoFi’s actual financial metrics presented in any such proxy statement/prospectus. The Company is currently in the process of uplifting its financials to comply with public company and SEC requirements.Use of Non-GAAP Financial MetricsThis presentation includes certain non-GAAP financial measures (including on a forward-looking basis) such as Adjusted Net Revenue, Adjusted EBITDA and Adjusted EBITDA Margin. These non-GAAP measures are an addition to, and not a substitute for or superior to, measures of financial performance prepared in accordance with GAAP and should not be considered as an alternative to net income, operating income or any other performance measures derived in accordance with GAAP. Reconciliations of non-GAAP measures to their most directly comparable GAAP counterparts are included in the Appendix to this presentation. SoFi believes that these non-GAAP measures of financial results (including on a forward-looking basis) provide useful supplemental information to investors about SoFi. SoFi’s management uses forward-looking non-GAAP measures to evaluate SoFi’s projected financials and operating performance. However, there are a number of limitations related to the use of these non-GAAP measures and their nearest GAAP equivalents, including that they exclude significant expenses that are required by GAAP to be recorded in SoFi’s financial measures.. In addition, other companies may calculate non-GAAP measures differently, or may use other measures to calculate their financial performance, and therefore, SoFi’s non-GAAP measures may not be directly comparable to similarly titled measures of other companies. Additionally, to the extent that forward-looking non-GAAP financial measures are provided, they are presented on a non-GAAP basis without reconciliations of such forward-looking non-GAAP measures due to the inherent difficulty in forecasting and quantifying certain amounts that are necessary for such reconciliations.Participation in SolicitationSocial Capital and SoFi and their respective directors and executive officers, under SEC rules, may be deemed to be participants in the solicitation of proxies of Social Capital’s shareholders in connection with the proposed business combination. Investors and security holders may obtain more detailed information regarding the names and interests in the proposed business combination of Social Capital’s directors and officers in Social Capital’s filings with the SEC, including Social Capital’s registration statement on Form S-1, which was originally filed with the SEC on September 18, 2020. To the extent that holdings of Social Capital’s securities have changed from the amounts reported in Social Capital’s registration statement on Form S-1, such changes have been or will be reflected on Statements of Change in Ownership on Form 4 filed with the SEC. Information regarding the persons who may, under SEC rules, be deemed participants in the solicitation of proxies to Social Capital’s shareholders in connection with the proposed business combination is set forth in the proxy statement/prospectus on Form S-4 for the proposed business combination, which is expected to be filed by Social Capital with the SEC.Investors and security holders of Social Capital and SoFi are urged to read the proxy statement/prospectus and other relevant documents that will be filed with the SEC carefully and in their entirely when they become available because they will contain important information about the proposed business combinationInvestors and security holders will be able to obtain free copies of the proxy statement and other documents containing important information about Social Capital and SoFi through the website maintained by the SEC at www.sec.gov. Copies of the documents filed with the SEC by Social Capital can be obtained free of charge by directing a written request to Social Capital Hedosophia Holdings Corp. V, 317 University Ave., Suite 200, Palo Alto, California 94301.
PRIVATE AND CONFIDENTIAL INFORMATION | FOR INTERNAL USE ONLY | DO NOT DISTRIBUTE©2020 Social Finance Inc. 6
SoFi's Mission
To help our members (HENWS) achieve financial independence to realize their ambitions
Note: HENWS stands for High Earners not Well Served who represent a significant portion of SoFi’s member base.
© 2020 Social Finance, Inc. Confidential Information. Do not copy or distribute. Advisory services offered through SoFi Wealth LLC. SoFi Money® is offered through SoFi Securities LLC. SoFi Lending Corp., CFL #6054612. NMLS #1121636.
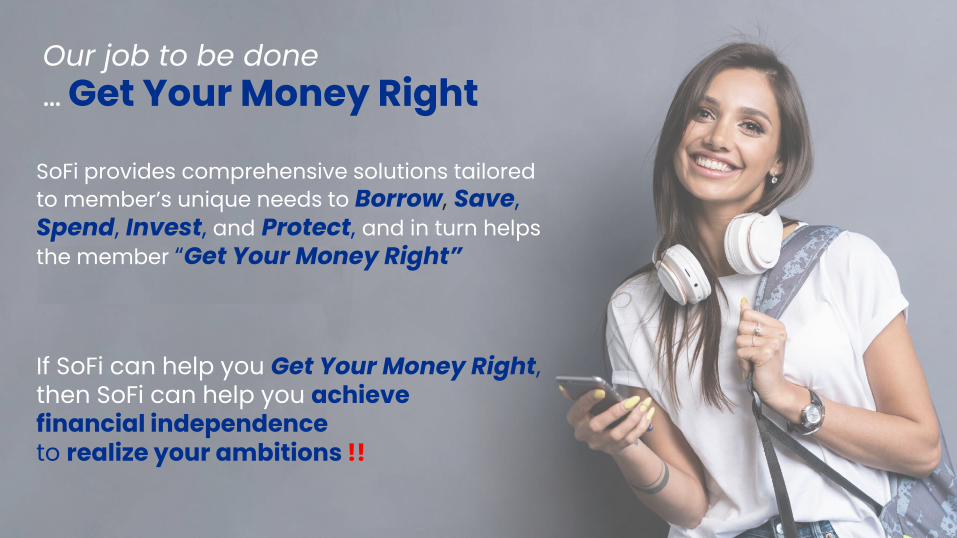
SoFi provides comprehensive solutions tailored to member’s unique needs to Borrow, Save, Spend, Invest, and Protect, and in turn helps the member “Get Your Money Right”
If SoFi can help you Get Your Money Right,then SoFi can help you achieve financial independence to realize your ambitions !!
Our job to be done… Get Your Money Right
© 2020 Social Finance, Inc. Confidential Information. Do not copy or distribute. Advisory services offered through SoFi Wealth LLC. SoFi Money® is offered through SoFi Securities LLC. SoFi Lending Corp., CFL #6054612. NMLS #1121636.
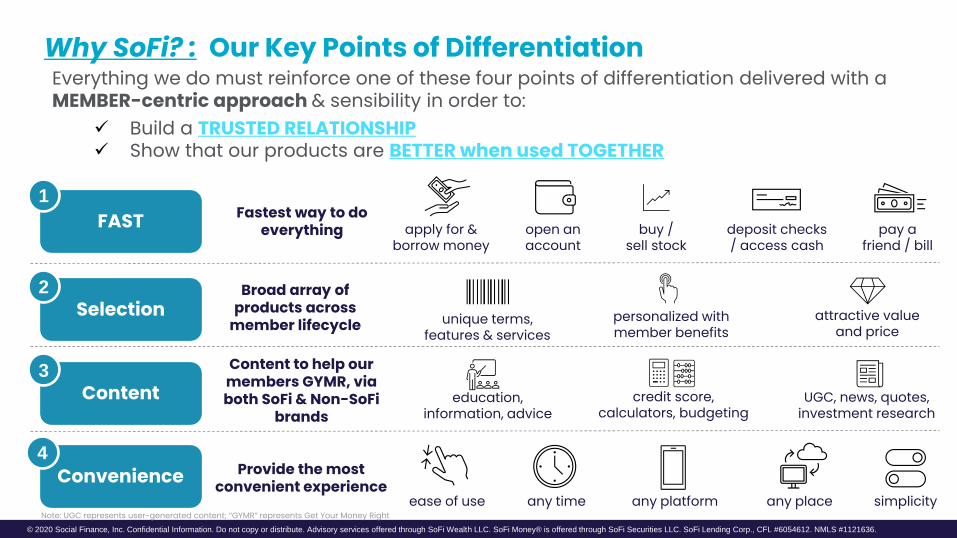
Why SoFi? : Our Key Points of Differentiation
Provide the most convenient experience
FAST1
Selection2
Content3
Convenience4
Everything we do must reinforce one of these four points of differentiation delivered with a MEMBER-centric approach & sensibility in order to:
✓ Build a TRUSTED RELATIONSHIP✓ Show that our products are BETTER when used TOGETHER
ease of use any time any platform any place
Broad array of products across
member lifecycle attractive value and price
personalized with member benefits
unique terms, features & services
Content to help our members GYMR, via both SoFi & Non-SoFi
brandscredit score,
calculators, budgetingUGC, news, quotes,
investment research
simplicity
education, information, advice
Fastest way to do everything deposit checks
/ access cashapply for &
borrow moneypay a
friend / billopen an account
buy / sell stock
Note: UGC represents user-generated content; “GYMR” represents Get Your Money Right
© 2020 Social Finance, Inc. Confidential Information. Do not copy or distribute. Advisory services offered through SoFi Wealth LLC. SoFi Money® is offered through SoFi Securities LLC. SoFi Lending Corp., CFL #6054612. NMLS #1121636.
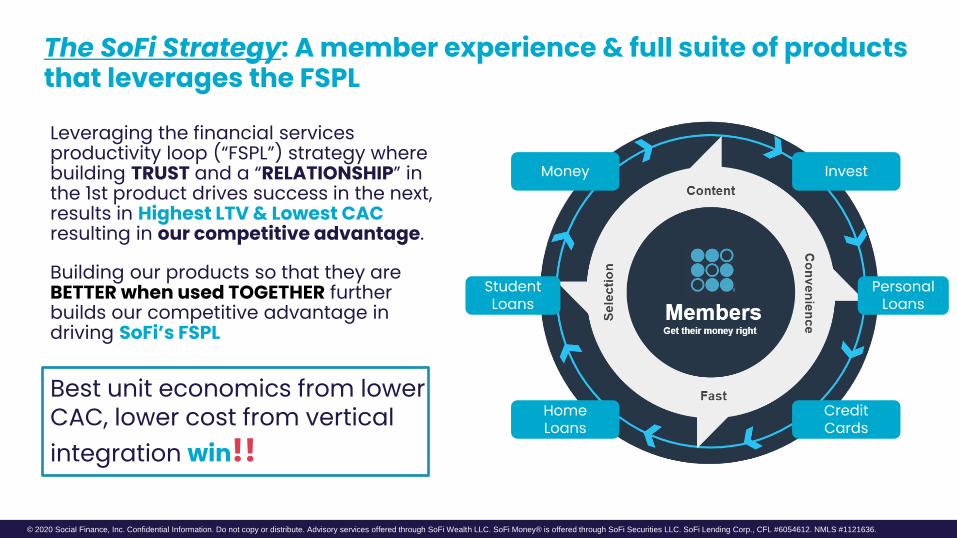
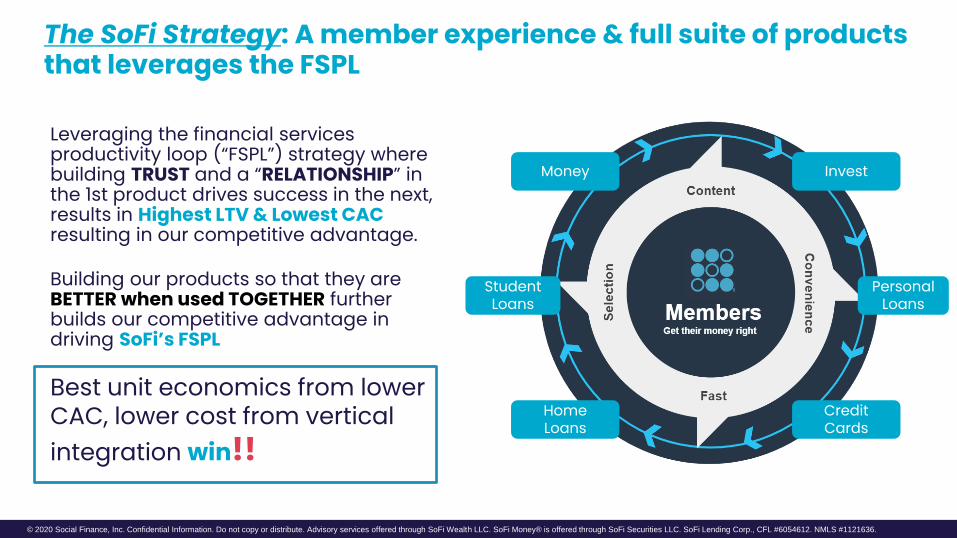
The SoFi Strategy: A member experience & full suite of products that leverages the FSPL
Leveraging the financial services productivity loop (“FSPL”) strategy where building TRUST and a “RELATIONSHIP” in the 1st product drives success in the next, results in Highest LTV & Lowest CACresulting in our competitive advantage.
Building our products so that they are BETTER when used TOGETHER further builds our competitive advantage in driving SoFi’s FSPL
Best unit economics from lower CAC, lower cost from vertical integration win!!
Personal Loans
Invest
Credit Cards
Money
Home Loans
Student Loans
© 2020 Social Finance, Inc. Confidential Information. Do not copy or distribute. Advisory services offered through SoFi Wealth LLC. SoFi Money® is offered through SoFi Securities LLC. SoFi Lending Corp., CFL #6054612. NMLS #1121636.
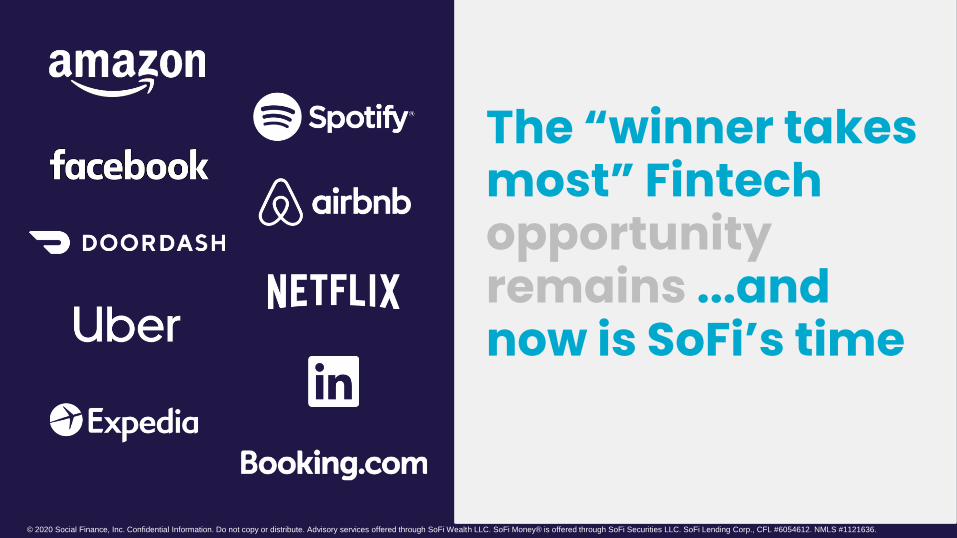
The “winner takes most” Fintech opportunity remains ...and now is SoFi’s time
© 2020 Social Finance, Inc. Confidential Information. Do not copy or distribute. Advisory services offered through SoFi Wealth LLC. SoFi Money® is offered through SoFi Securities LLC. SoFi Lending Corp., CFL #6054612. NMLS #1121636.
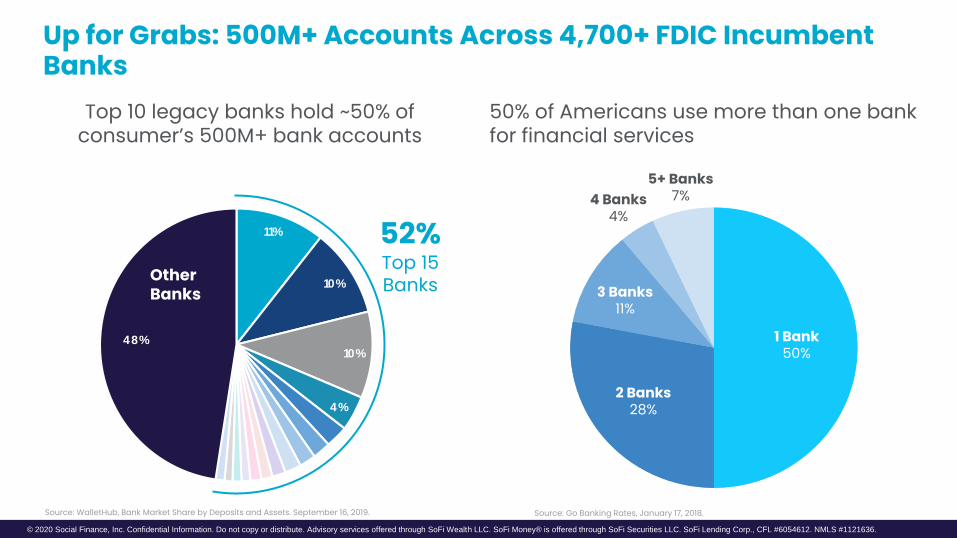
11%
10%
10%
4%
48%
Source: WalletHub, Bank Market Share by Deposits and Assets. September 16, 2019. Source: Go Banking Rates, January 17, 2018.
50% of Americans use more than one bank for financial services
1 Bank50%
2 Banks28%
3 Banks11%
4 Banks4%
5+ Banks7%
Top 10 legacy banks hold ~50% of consumer’s 500M+ bank accounts
Other Banks
52%Top 15 Banks
Up for Grabs: 500M+ Accounts Across 4,700+ FDIC Incumbent Banks
© 2020 Social Finance, Inc. Confidential Information. Do not copy or distribute. Advisory services offered through SoFi Wealth LLC. SoFi Money® is offered through SoFi Securities LLC. SoFi Lending Corp., CFL #6054612. NMLS #1121636.
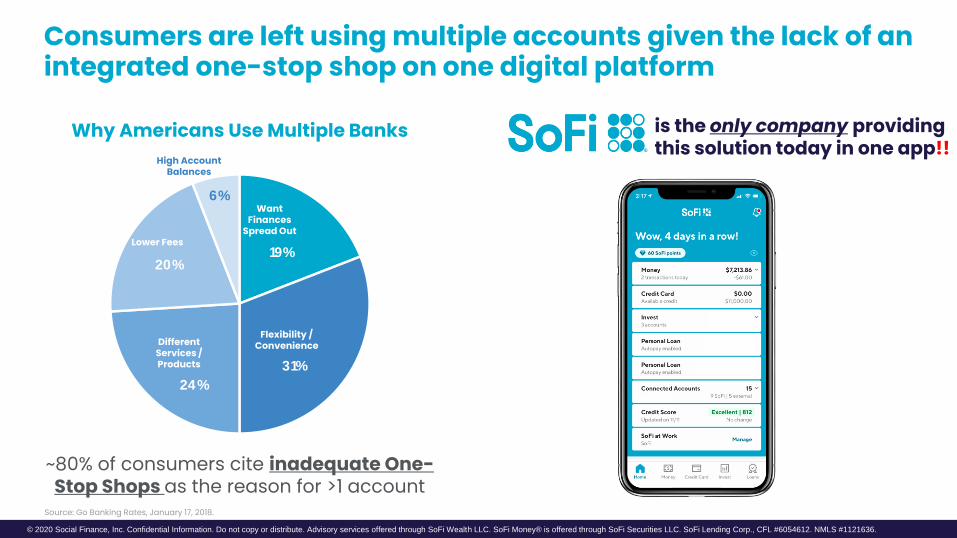
Consumers are left using multiple accounts given the lack of an integrated one-stop shop on one digital platform
Why Americans Use Multiple Banks is the only company providing this solution today in one app!!
Want Finances
Spread Out
~80% of consumers cite inadequate One-Stop Shops as the reason for >1 account
19%
31%
24%
20%
6%
Flexibility / Convenience
Lower Fees
Different Services / Products
High Account Balances
Want Finances
Spread Out
Source: Go Banking Rates, January 17, 2018.
© 2020 Social Finance, Inc. Confidential Information. Do not copy or distribute. Advisory services offered through SoFi Wealth LLC. SoFi Money® is offered through SoFi Securities LLC. SoFi Lending Corp., CFL #6054612. NMLS #1121636.
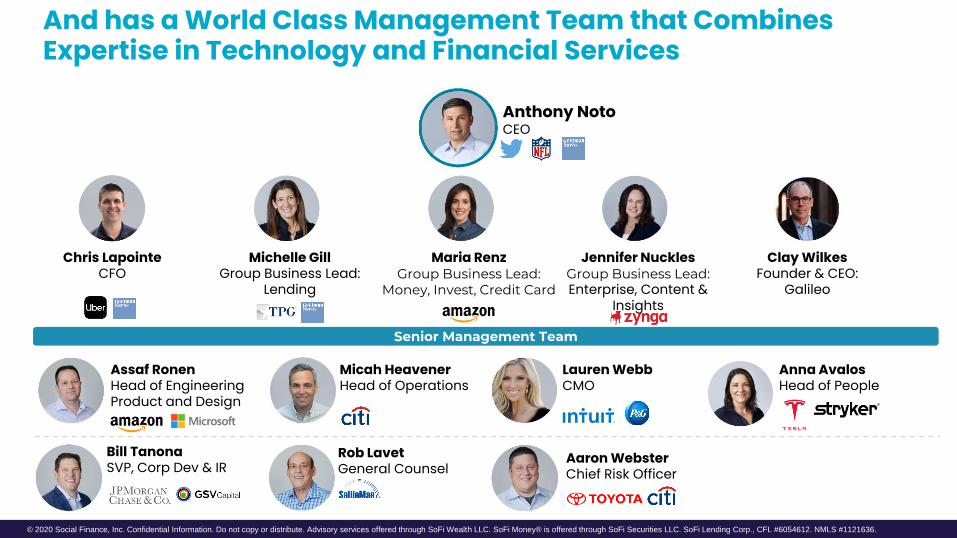
Lauren WebbCMO
And has a World Class Management Team that Combines Expertise in Technology and Financial Services
Anthony NotoCEO
Chris LapointeCFO
Senior Management Team
Maria RenzGroup Business Lead:
Money, Invest, Credit Card
Jennifer NucklesGroup Business Lead:Enterprise, Content &
Insights
Michelle GillGroup Business Lead:
Lending
Rob LavetGeneral Counsel
Aaron WebsterChief Risk Officer
Assaf RonenHead of Engineering Product and Design
Anna AvalosHead of People
Bill TanonaSVP, Corp Dev & IR
Micah HeavenerHead of Operations
Clay WilkesFounder & CEO:
Galileo
© 2020 Social Finance, Inc. Confidential Information. Do not copy or distribute. Advisory services offered through SoFi Wealth LLC. SoFi Money® is offered through SoFi Securities LLC. SoFi Lending Corp., CFL #6054612. NMLS #1121636.
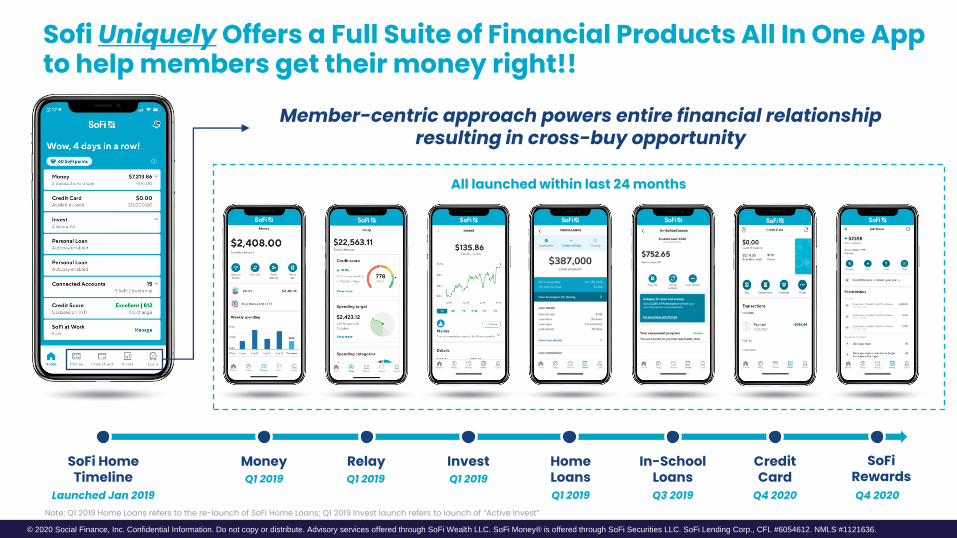
Sofi Uniquely Offers a Full Suite of Financial Products All In One App to help members get their money right!!
Member-centric approach powers entire financial relationship resulting in cross-buy opportunity
SoFi Home Timeline
Launched Jan 2019
SoFiRewardsQ4 2020
InvestQ1 2019
MoneyQ1 2019
RelayQ1 2019
All launched within last 24 months
Home LoansQ1 2019
Credit Card
Q4 2020
In-SchoolLoansQ3 2019
Invest LoansIn-School LoansHome Loans
Note: Q1 2019 Home Loans refers to the re-launch of SoFi Home Loans; Q1 2019 Invest launch refers to launch of “Active Invest”
© 2020 Social Finance, Inc. Confidential Information. Do not copy or distribute. Advisory services offered through SoFi Wealth LLC. SoFi Money® is offered through SoFi Securities LLC. SoFi Lending Corp., CFL #6054612. NMLS #1121636.
Member growth is Accelerating & FSPL is working
© 2020 Social Finance, Inc. Confidential Information. Do not copy or distribute. Advisory services offered through SoFi Wealth LLC. SoFi Money® is offered through SoFi Securities LLC. SoFi Lending Corp., CFL #6054612. NMLS #1121636.
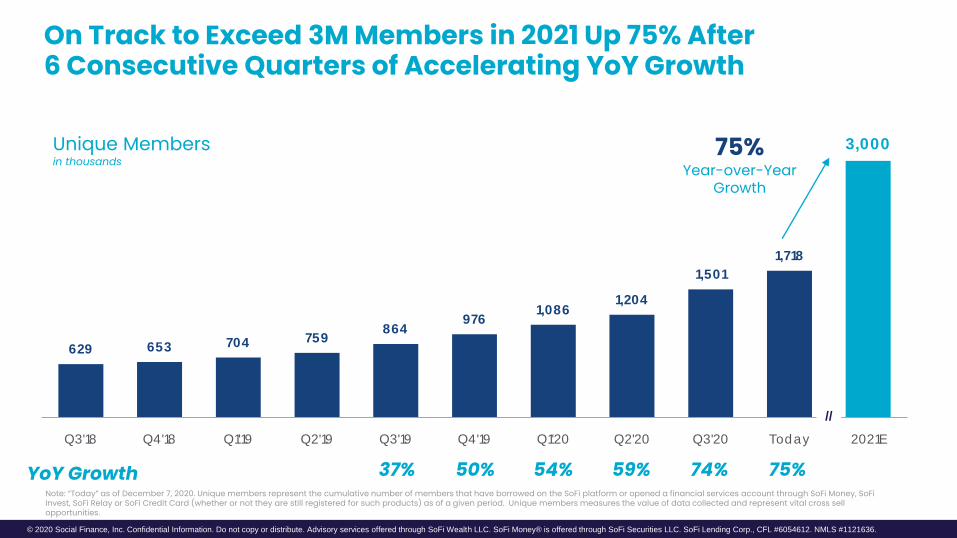
3,000
1,718
1,501
1,204 1,086
976 864
759 704 653 629
2021ETodayQ3'20Q2'20Q1'20Q4'19Q3'19Q2'19Q1'19Q4'18Q3'18
On Track to Exceed 3M Members in 2021 Up 75% After6 Consecutive Quarters of Accelerating YoY Growth
Unique Membersin thousands
75%Year-over-Year
Growth
37% 59% 74%54%50% 75%YoY GrowthNote: “Today” as of December 7, 2020. Unique members represent the cumulative number of members that have borrowed on the SoFi platform or opened a financial services account through SoFi Money, SoFi Invest, SoFi Relay or SoFi Credit Card (whether or not they are still registered for such products) as of a given period. Unique members measures the value of data collected and represent vital cross sell opportunities.
//
© 2020 Social Finance, Inc. Confidential Information. Do not copy or distribute. Advisory services offered through SoFi Wealth LLC. SoFi Money® is offered through SoFi Securities LLC. SoFi Lending Corp., CFL #6054612. NMLS #1121636.
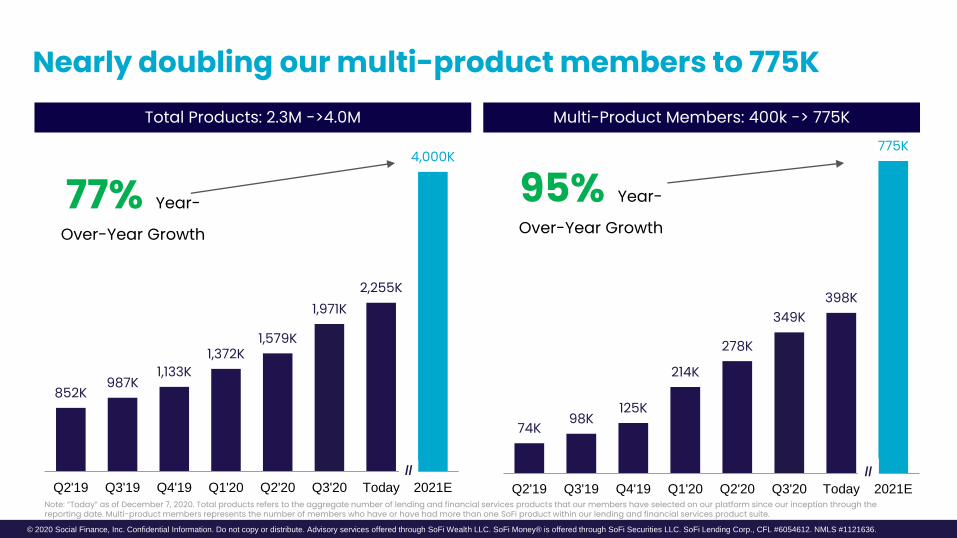
852K987K
1,133K1,372K
1,579K
1,971K2,255K
4,000K
Q2'19 Q3'19 Q4'19 Q1'20 Q2'20 Q3'20 Today 2021E
74K98K
125K
214K
278K
349K398K
775K
Q2'19 Q3'19 Q4'19 Q1'20 Q2'20 Q3'20 Today 2021E
Multi-Product Members: 400k -> 775KTotal Products: 2.3M ->4.0M
77% Year-
Over-Year Growth
95% Year-
Over-Year Growth
Nearly doubling our multi-product members to 775K
Note: “Today” as of December 7, 2020. Total products refers to the aggregate number of lending and financial services products that our members have selected on our platform since our inception through the reporting date. Multi-product members represents the number of members who have or have had more than one SoFi product within our lending and financial services product suite.
////
© 2020 Social Finance, Inc. Confidential Information. Do not copy or distribute. Advisory services offered through SoFi Wealth LLC. SoFi Money® is offered through SoFi Securities LLC. SoFi Lending Corp., CFL #6054612. NMLS #1121636.
The SoFi Strategy: A member experience & full suite of products that leverages the FSPL
Leveraging the financial services productivity loop (“FSPL”) strategy where building TRUST and a “RELATIONSHIP” in the 1st product drives success in the next, results in Highest LTV & Lowest CACresulting in our competitive advantage.
Building our products so that they are BETTER when used TOGETHER further builds our competitive advantage in driving SoFi’s FSPL
Best unit economics from lower CAC, lower cost from vertical integration win!!
Personal Loans
Invest
Credit Cards
Money
Home Loans
Student Loans
© 2020 Social Finance, Inc. Confidential Information. Do not copy or distribute. Advisory services offered through SoFi Wealth LLC. SoFi Money® is offered through SoFi Securities LLC. SoFi Lending Corp., CFL #6054612. NMLS #1121636.
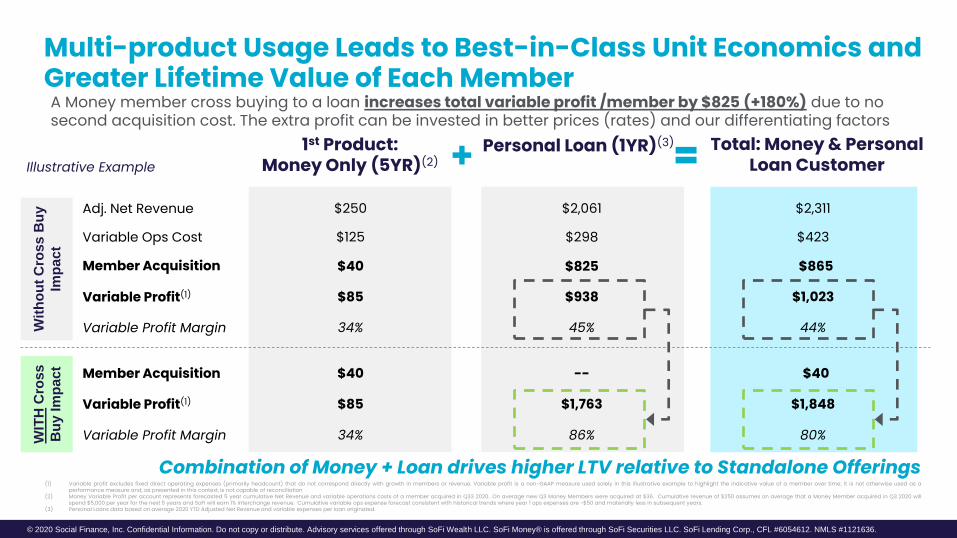
1st Product:Money Only (5YR)(2)
Total: Money & Personal Loan Customer
Combination of Money + Loan drives higher LTV relative to Standalone Offerings
Personal Loan (1YR)(3)
Adj. Net Revenue $250 $2,311$2,061
Variable Profit Margin 34% 44%45%
Member Acquisition $40 $865$825
Variable Profit(1) $85 $1,023$938
Multi-product Usage Leads to Best-in-Class Unit Economics and Greater Lifetime Value of Each Member
Variable Ops Cost $125 $423$298
A Money member cross buying to a loan increases total variable profit /member by $825 (+180%) due to no second acquisition cost. The extra profit can be invested in better prices (rates) and our differentiating factors
Wit
ho
ut
Cro
ss B
uy
Imp
act
WIT
HC
ross
Bu
y I
mp
act Member Acquisition $40 $40--
Variable Profit(1) $85 $1,848$1,763
Variable Profit Margin 34% 80%86%
(1) Variable profit excludes fixed direct operating expenses (primarily headcount) that do not correspond directly with growth in members or revenue. Variable profit is a non-GAAP measure used solely in this illustrative example to highlight the indicative value of a member over time; it is not otherwise used as aperformance measure and, as presented in this context, is not capable of reconciliation
(2) Money Variable Profit per account represents forecasted 5 year cumulative Net Revenue and variable operations costs of a member acquired in Q33 2020.. On average new Q3 Money Members were acquired at $36. Cumulative revenue of $250 assumes on average that a Money Member acquired in Q3 2020 willspend $5,000 per year for the next 5 years and SoFi will earn 1% interchange revenue. Cumulative variable ops expense forecast consistent with historical trends where year 1 ops expenses are ~$50 and materially less in subsequent years.
(3) Personal Loans data based on average 2020 YTD Adjusted Net Revenue and variable expenses per loan originated.
Illustrative Example
21© 2020 Social Finance, Inc. Confidential Information. Do not copy or distribute. Advisory services offered through SoFi Wealth LLC. SoFi Money® is offered through SoFi Securities LLC. SoFi Lending Corp., CFL #6054612. NMLS #1121636.
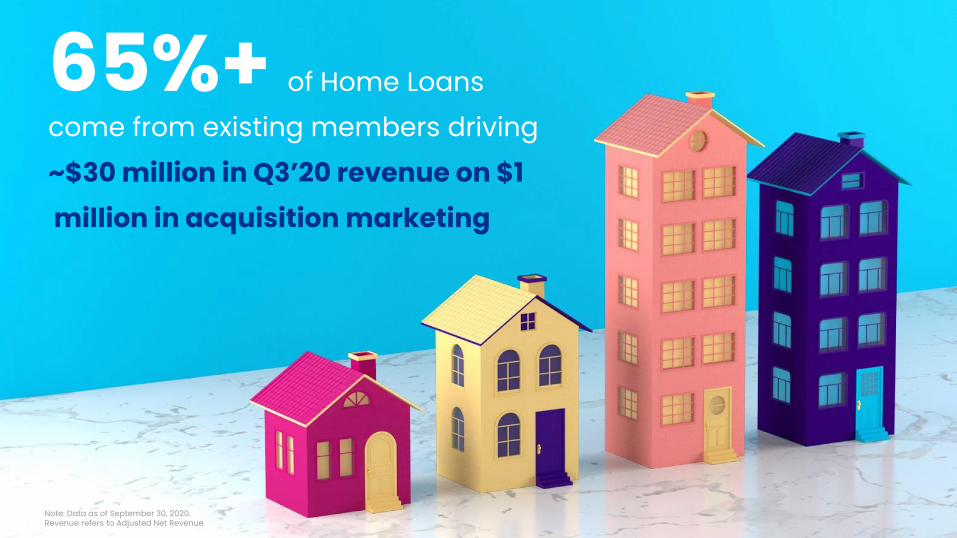
65%+ of Home Loans come from existing members driving ~$30 million in Q3’20 revenue on $1million in acquisition marketing
Note: Data as of September 30, 2020. Revenue refers to Adjusted Net Revenue
22© 2020 Social Finance, Inc. Confidential Information. Do not copy or distribute. Advisory services offered through SoFi Wealth LLC. SoFi Money® is offered through SoFi Securities LLC. SoFi Lending Corp., CFL #6054612. NMLS #1121636.
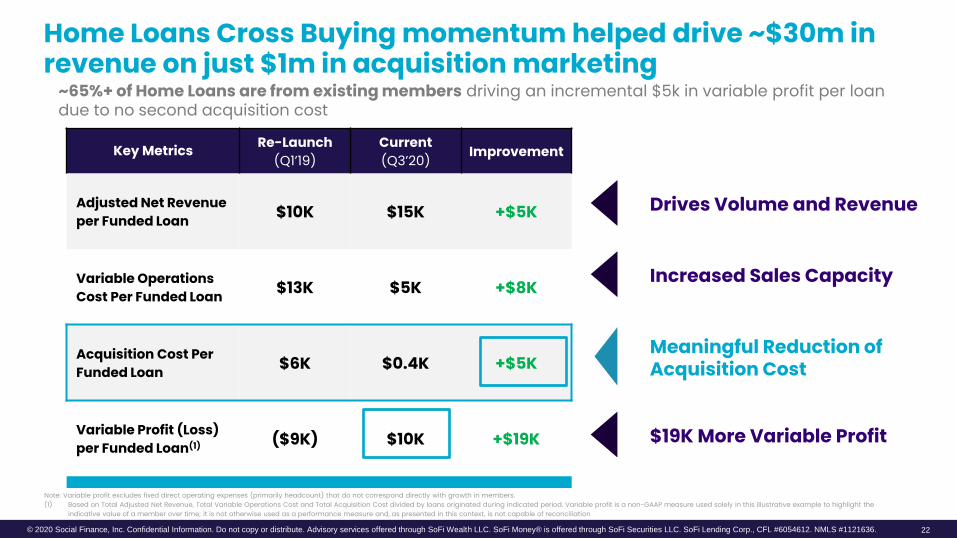
Key Metrics Re-Launch(Q1’19)
Current(Q3’20) Improvement
Adjusted Net Revenue per Funded Loan $10K $15K +$5K
Variable OperationsCost Per Funded Loan $13K $5K +$8K
Acquisition Cost Per Funded Loan $6K $0.4K +$5K
Variable Profit (Loss) per Funded Loan(1) ($9K) $10K +$19K $19K More Variable Profit
Meaningful Reduction of Acquisition Cost
Home Loans Cross Buying momentum helped drive ~$30m in revenue on just $1m in acquisition marketing
~65%+ of Home Loans are from existing members driving an incremental $5k in variable profit per loan due to no second acquisition cost
Drives Volume and Revenue
Increased Sales Capacity
Note: Variable profit excludes fixed direct operating expenses (primarily headcount) that do not correspond directly with growth in members. (1) Based on Total Adjusted Net Revenue, Total Variable Operations Cost and Total Acquisition Cost divided by loans originated during indicated period. Variable profit is a non-GAAP measure used solely in this illustrative example to highlight the
indicative value of a member over time; it is not otherwise used as a performance measure and, as presented in this context, is not capable of reconciliation
© 2020 Social Finance, Inc. Confidential Information. Do not copy or distribute. Advisory services offered through SoFi Wealth LLC. SoFi Money® is offered through SoFi Securities LLC. SoFi Lending Corp., CFL #6054612. NMLS #1121636.
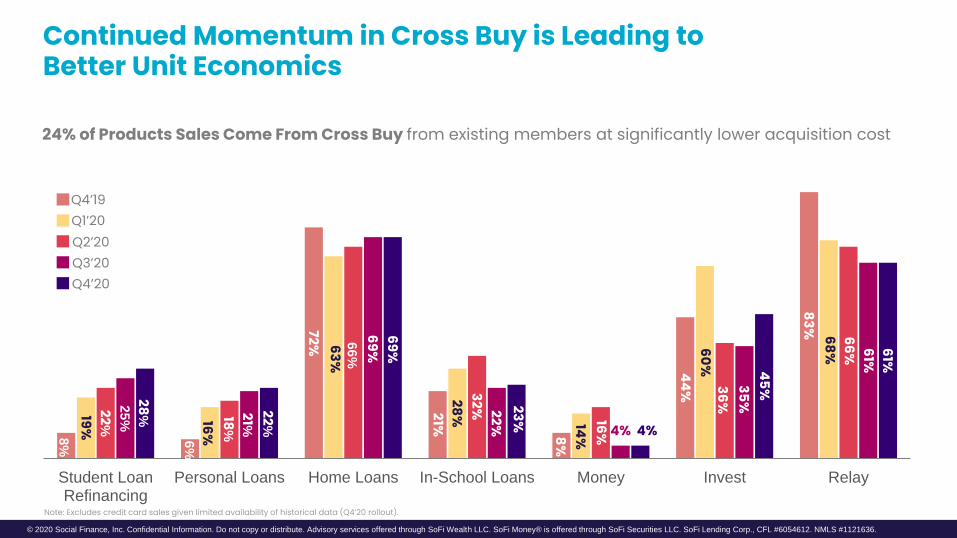
Continued Momentum in Cross Buy is Leading to Better Unit Economics
24% of Products Sales Come From Cross Buy from existing members at significantly lower acquisition cost
4% 4%
Student LoanRefinancing
Personal Loans Home Loans In-School Loans Money Invest Relay
8%
19%22
%
25
%
28%
6%
16%18
%
21%22
%
72% 63%6
6%
69%69%
21%28%
32% 22%23%
8%14%
16%
44%60%
36%35%
45%
83% 68%66% 61%
61%
Q4’19Q1’20Q2’20Q3’20Q4’20
Note: Excludes credit card sales given limited availability of historical data (Q4’20 rollout).
© 2020 Social Finance, Inc. Confidential Information. Do not copy or distribute. Advisory services offered through SoFi Wealth LLC. SoFi Money® is offered through SoFi Securities LLC. SoFi Lending Corp., CFL #6054612. NMLS #1121636.
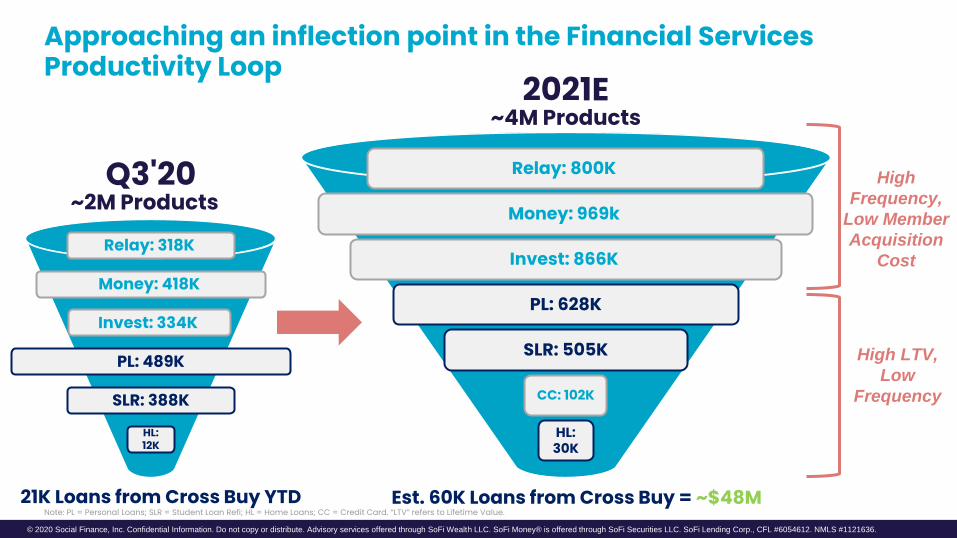
Approaching an inflection point in the Financial Services Productivity Loop
~2M ProductsQ3'20
HL: 12K
SLR: 388K
PL: 489K
Invest: 334K
Money: 418K
Relay: 318K
~4M Products2021E
HL: 30K
SLR: 505K
PL: 628K
Invest: 866K
Relay: 800K
CC: 102K
Money: 969k
21K Loans from Cross Buy YTD Est. 60K Loans from Cross Buy = ~$48M
High
Frequency,
Low Member
Acquisition
Cost
High LTV,
Low
Frequency
Note: PL = Personal Loans; SLR = Student Loan Refi; HL = Home Loans; CC = Credit Card. “LTV” refers to Lifetime Value.
© 2020 Social Finance, Inc. Confidential Information. Do not copy or distribute. Advisory services offered through SoFi Wealth LLC. SoFi Money® is offered through SoFi Securities LLC. SoFi Lending Corp., CFL #6054612. NMLS #1121636.
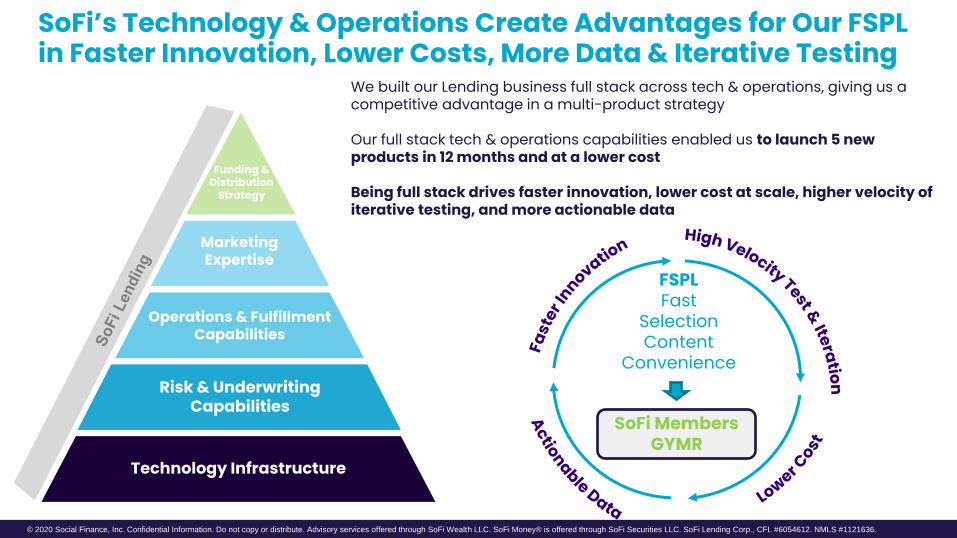
SoFi’s Technology & Operations Create Advantages for Our FSPL in Faster Innovation, Lower Costs, More Data & Iterative Testing
We built our Lending business full stack across tech & operations, giving us a competitive advantage in a multi-product strategy
Our full stack tech & operations capabilities enabled us to launch 5 new products in 12 months and at a lower cost
Being full stack drives faster innovation, lower cost at scale, higher velocity of iterative testing, and more actionable data
FSPLFast
SelectionContent
Convenience
SoFi Members GYMR
Risk & Underwriting Capabilities
Operations & Fulfillment Capabilities
Marketing Expertise
Funding & Distribution
Strategy
Technology Infrastructure
© 2020 Social Finance, Inc. Confidential Information. Do not copy or distribute. Advisory services offered through SoFi Wealth LLC. SoFi Money® is offered through SoFi Securities LLC. SoFi Lending Corp., CFL #6054612. NMLS #1121636.
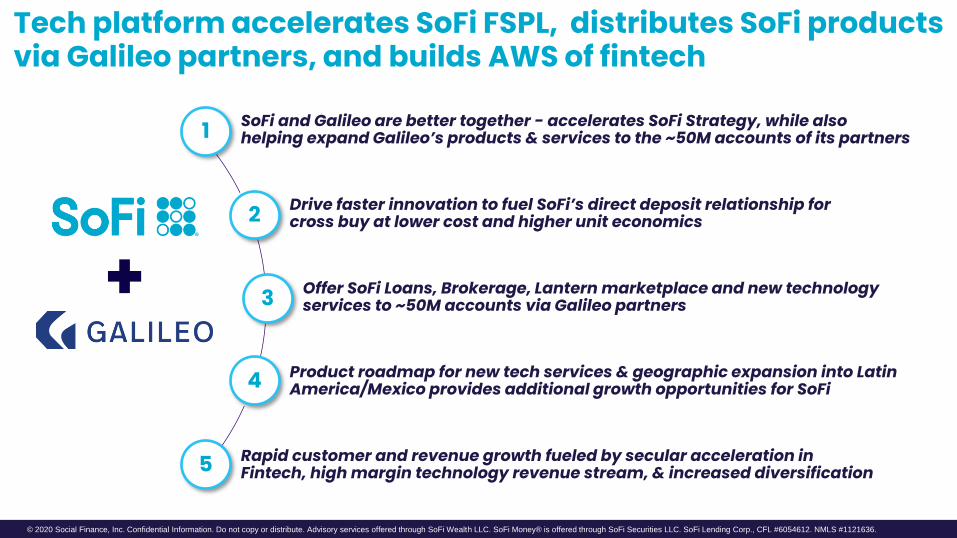
Tech platform accelerates SoFi FSPL, distributes SoFi products via Galileo partners, and builds AWS of fintech
Offer SoFi Loans, Brokerage, Lantern marketplace and new technology services to ~50M accounts via Galileo partners
Rapid customer and revenue growth fueled by secular acceleration in Fintech, high margin technology revenue stream, & increased diversification
SoFi and Galileo are better together - accelerates SoFi Strategy, while also helping expand Galileo’s products & services to the ~50M accounts of its partners1
Drive faster innovation to fuel SoFi’s direct deposit relationship for cross buy at lower cost and higher unit economics2
3
5
Product roadmap for new tech services & geographic expansion into Latin America/Mexico provides additional growth opportunities for SoFi4
© 2020 Social Finance, Inc. Confidential Information. Do not copy or distribute. Advisory services offered through SoFi Wealth LLC. SoFi Money® is offered through SoFi Securities LLC. SoFi Lending Corp., CFL #6054612. NMLS #1121636.
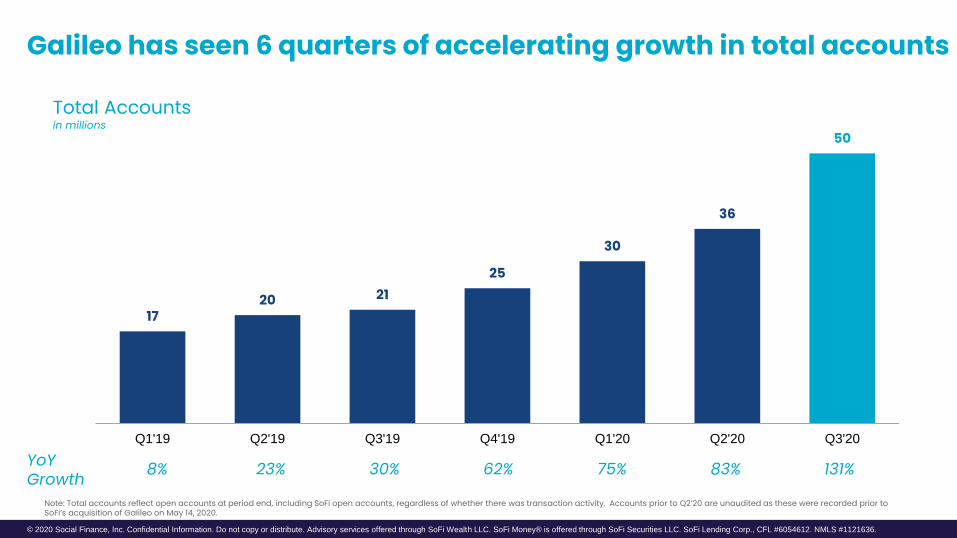
50
36
30
252120
17
Q3'20Q2'20Q1'20Q4'19Q3'19Q2'19Q1'19
Galileo has seen 6 quarters of accelerating growth in total accounts
Total Accountsin millions
23% 83% 131%75%62%YoY Growth 30%8%
Note: Total accounts reflect open accounts at period end, including SoFi open accounts, regardless of whether there was transaction activity. Accounts prior to Q2’20 are unaudited as these were recorded prior to SoFi’s acquisition of Galileo on May 14, 2020.
© 2020 Social Finance, Inc. Confidential Information. Do not copy or distribute. Advisory services offered through SoFi Wealth LLC. SoFi Money® is offered through SoFi Securities LLC. SoFi Lending Corp., CFL #6054612. NMLS #1121636.
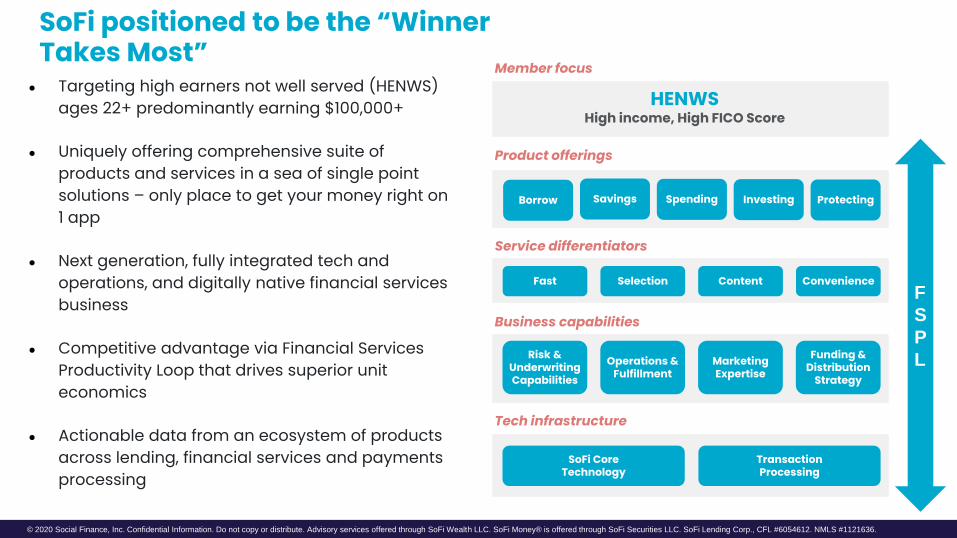
SoFi positioned to be the “Winner Takes Most”
● Targeting high earners not well served (HENWS) ages 22+ predominantly earning $100,000+
● Uniquely offering comprehensive suite of products and services in a sea of single point solutions – only place to get your money right on 1 app
● Next generation, fully integrated tech and operations, and digitally native financial services business
● Competitive advantage via Financial Services Productivity Loop that drives superior unit economics
● Actionable data from an ecosystem of products across lending, financial services and payments processing
Member focus
Product offerings
Business capabilities
Tech infrastructure
HENWSHigh income, High FICO Score
Borrow Savings Spending Investing Protecting
Risk &UnderwritingCapabilities
Funding &Distribution
Strategy
Operations &Fulfillment
MarketingExpertise
SoFi CoreTechnology
TransactionProcessing
Service differentiators
Fast ConvenienceSelection ContentF
S
P
L
© 2020 Social Finance, Inc. Confidential Information. Do not copy or distribute. Advisory services offered through SoFi Wealth LLC. SoFi Money® is offered through SoFi Securities LLC. SoFi Lending Corp., CFL #6054612. NMLS #1121636.
FinancialsDriving accelerating revenue growth and margin expansion
© 2020 Social Finance, Inc. Confidential Information. Do not copy or distribute. Advisory services offered through SoFi Wealth LLC. SoFi Money® is offered through SoFi Securities LLC. SoFi Lending Corp., CFL #6054612. NMLS #1121636.
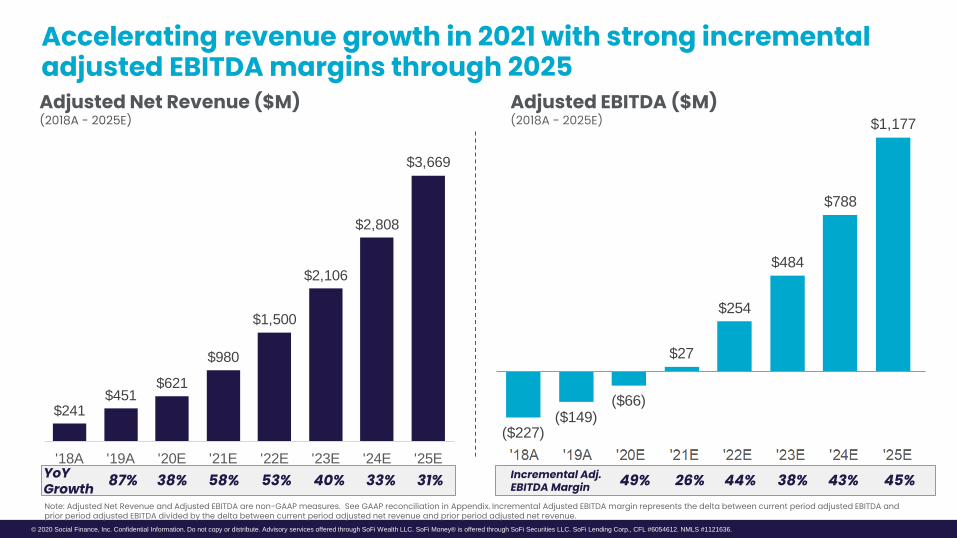
($227)($149)
($66)
$27
$254
$484
$788
$1,177
Adjusted Net Revenue ($M)(2018A - 2025E)
Adjusted EBITDA ($M)(2018A - 2025E)
Accelerating revenue growth in 2021 with strong incremental adjusted EBITDA margins through 2025
YoY Growth 38% 58% 53% Incremental Adj.
EBITDA Margin 26% 44%49%40% 33% 31% 38% 43% 45%
$241 $451
$621
$980
$1,500
$2,106
$2,808
$3,669
'18A '19A '20E '21E '22E '23E '24E '25E
Note: Adjusted Net Revenue and Adjusted EBITDA are non-GAAP measures. See GAAP reconciliation in Appendix. Incremental Adjusted EBITDA margin represents the delta between current period adjusted EBITDA and prior period adjusted EBITDA divided by the delta between current period adjusted net revenue and prior period adjusted net revenue.
87%
© 2020 Social Finance, Inc. Confidential Information. Do not copy or distribute. Advisory services offered through SoFi Wealth LLC. SoFi Money® is offered through SoFi Securities LLC. SoFi Lending Corp., CFL #6054612. NMLS #1121636.
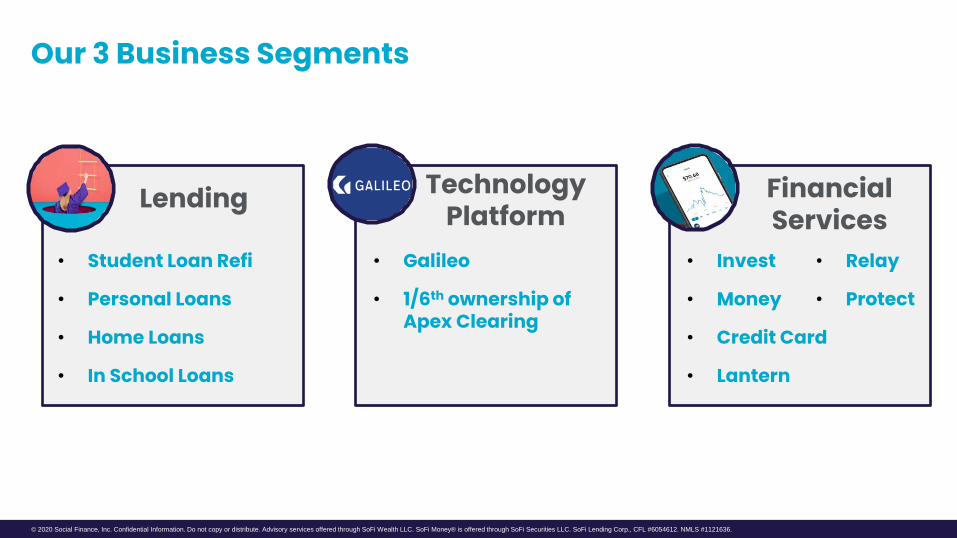
Our 3 Business Segments
Lending Technology Platform
Financial Services
• Student Loan Refi
• Personal Loans
• Home Loans
• In School Loans
• Galileo
• 1/6th ownership of Apex Clearing
• Invest
• Money
• Credit Card
• Lantern
• Relay
• Protect
© 2020 Social Finance, Inc. Confidential Information. Do not copy or distribute. Advisory services offered through SoFi Wealth LLC. SoFi Money® is offered through SoFi Securities LLC. SoFi Lending Corp., CFL #6054612. NMLS #1121636.
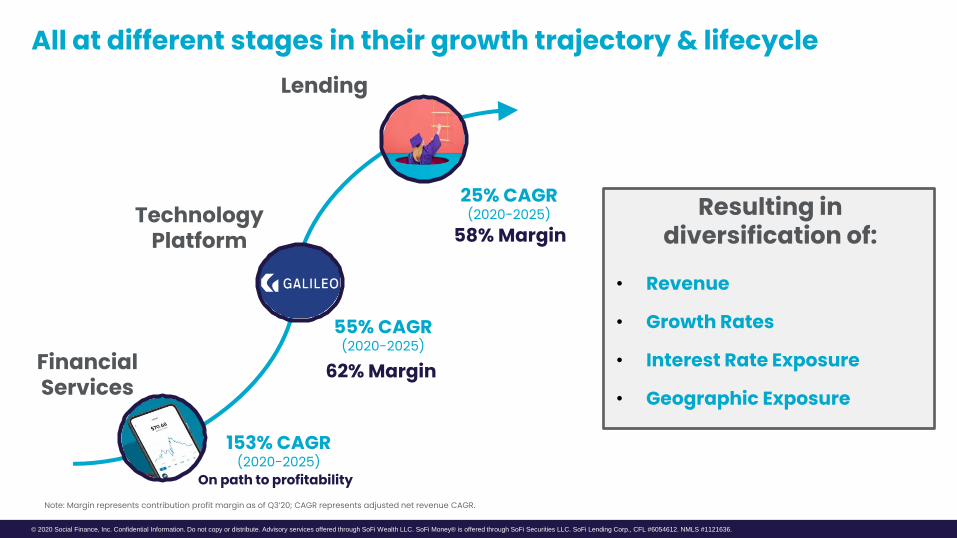
All at different stages in their growth trajectory & lifecycle
Resulting in diversification of:
• Revenue
• Growth Rates
• Interest Rate Exposure
• Geographic Exposure
25% CAGR(2020-2025)
Lending
58% MarginTechnology
Platform
55% CAGR(2020-2025)
62% MarginFinancial Services
153% CAGR(2020-2025)
On path to profitability
Note: Margin represents contribution profit margin as of Q3’20; CAGR represents adjusted net revenue CAGR.
© 2020 Social Finance, Inc. Confidential Information. Do not copy or distribute. Advisory services offered through SoFi Wealth LLC. SoFi Money® is offered through SoFi Securities LLC. SoFi Lending Corp., CFL #6054612. NMLS #1121636.
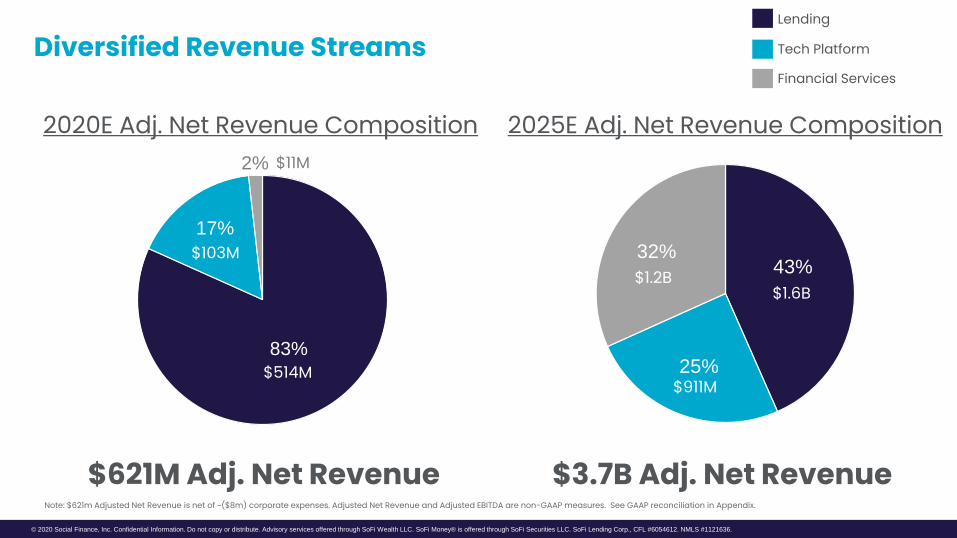
Diversified Revenue Streams
83%
17%
2%
2020E Adj. Net Revenue Composition 2025E Adj. Net Revenue Composition
43%
25%
32%
Lending
Tech Platform
Financial Services
$621M Adj. Net Revenue $3.7B Adj. Net Revenue
$514M
$103M
$911M
$1.6B$1.2B
$11M
Note: $621m Adjusted Net Revenue is net of ~($8m) corporate expenses. Adjusted Net Revenue and Adjusted EBITDA are non-GAAP measures. See GAAP reconciliation in Appendix.
© 2020 Social Finance, Inc. Confidential Information. Do not copy or distribute. Advisory services offered through SoFi Wealth LLC. SoFi Money® is offered through SoFi Securities LLC. SoFi Lending Corp., CFL #6054612. NMLS #1121636.
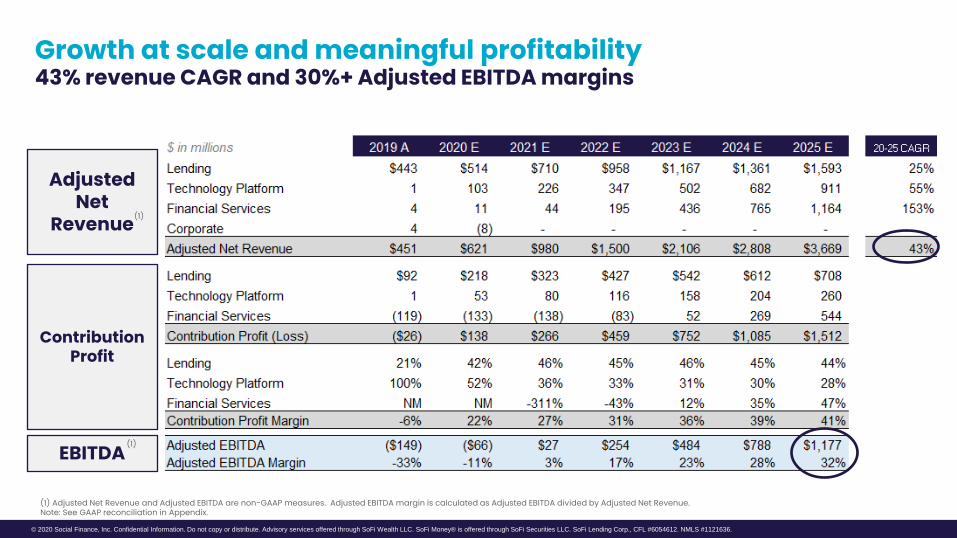
Growth at scale and meaningful profitability43% revenue CAGR and 30%+ Adjusted EBITDA margins
AdjustedNet
Revenue
Contribution Profit
EBITDA
(1) Adjusted Net Revenue and Adjusted EBITDA are non-GAAP measures. Adjusted EBITDA margin is calculated as Adjusted EBITDA divided by Adjusted Net Revenue. Note: See GAAP reconciliation in Appendix.
(1)
(1)
© 2020 Social Finance, Inc. Confidential Information. Do not copy or distribute. Advisory services offered through SoFi Wealth LLC. SoFi Money® is offered through SoFi Securities LLC. SoFi Lending Corp., CFL #6054612. NMLS #1121636.
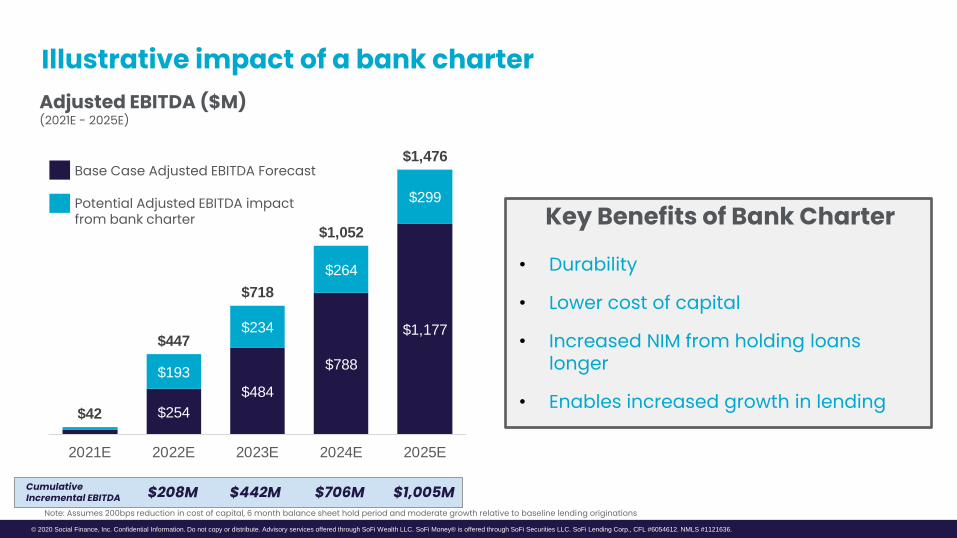
$254
$484
$788
$1,177
$193
$234
$264
$299
$42
$447
$718
$1,052
$1,476
2021E 2022E 2023E 2024E 2025E
Adjusted EBITDA ($M)(2021E - 2025E)
Cumulative Incremental EBITDA $442M $706M
Illustrative impact of a bank charter
$1,005M$208M
Base Case Adjusted EBITDA Forecast
Potential Adjusted EBITDA impact from bank charter Key Benefits of Bank Charter
• Durability
• Lower cost of capital
• Increased NIM from holding loans longer
• Enables increased growth in lending
Note: Assumes 200bps reduction in cost of capital, 6 month balance sheet hold period and moderate growth relative to baseline lending originations
Advisory services offered through SoFi Wealth, LLC. SoFi Lending Corp., CFL #6054612. NMLS #1121636. ©2018 Social Finance, Inc. Confidential Information. Do not copy or distribute.
Transaction OverviewSubhead sectionAppendix
© 2020 Social Finance, Inc. Confidential Information. Do not copy or distribute. Advisory services offered through SoFi Wealth LLC. SoFi Money® is offered through SoFi Securities LLC. SoFi Lending Corp., CFL #6054612. NMLS #1121636.
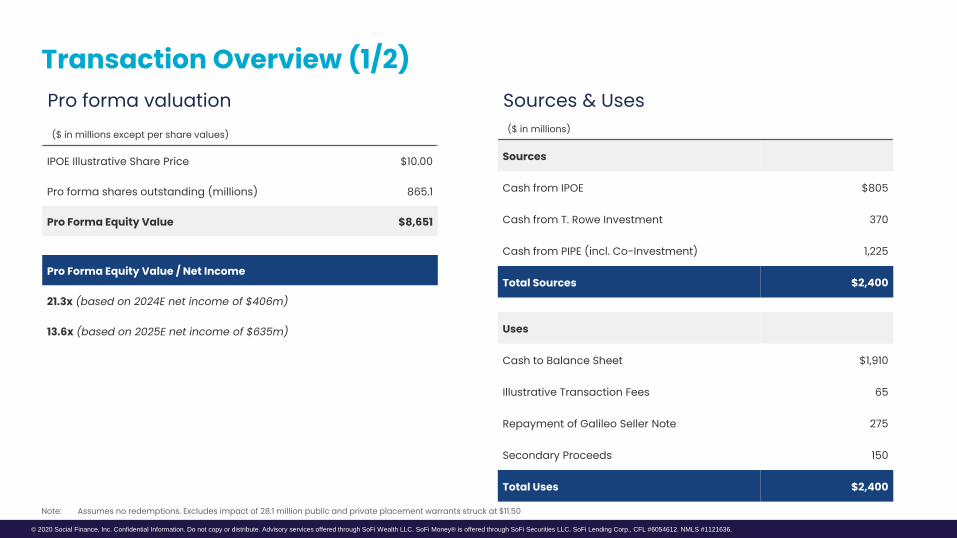
Transaction Overview (1/2)
($ in millions except per share values)
IPOE Illustrative Share Price $10.00
Pro forma shares outstanding (millions) 865.1
Pro Forma Equity Value $8,651
Pro Forma Equity Value / Net Income
21.3x (based on 2024E net income of $406m)
13.6x (based on 2025E net income of $635m)
($ in millions)
Sources
Cash from IPOE $805
Cash from T. Rowe Investment 370
Cash from PIPE (incl. Co-Investment) 1,225
Total Sources $2,400
Uses
Cash to Balance Sheet $1,910
Illustrative Transaction Fees 65
Repayment of Galileo Seller Note 275
Secondary Proceeds 150
Total Uses $2,400
Pro forma valuation Sources & Uses
Note: Assumes no redemptions. Excludes impact of 28.1 million public and private placement warrants struck at $11.50
© 2020 Social Finance, Inc. Confidential Information. Do not copy or distribute. Advisory services offered through SoFi Wealth LLC. SoFi Money® is offered through SoFi Securities LLC. SoFi Lending Corp., CFL #6054612. NMLS #1121636.
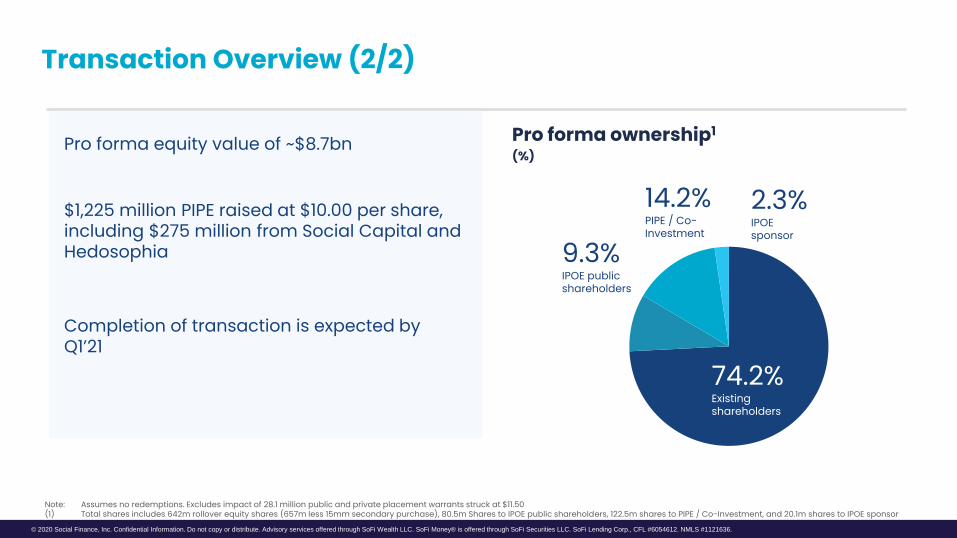
Transaction Overview (2/2)
Pro forma equity value of ~$8.7bn
$1,225 million PIPE raised at $10.00 per share, including $275 million from Social Capital and Hedosophia
Completion of transaction is expected by Q1’21
9.3%IPOE publicshareholders
14.2%PIPE / Co-Investment
2.3%IPOEsponsor
Pro forma ownership1
(%)
74.2%Existing shareholders
Note: Assumes no redemptions. Excludes impact of 28.1 million public and private placement warrants struck at $11.50(1) Total shares includes 642m rollover equity shares (657m less 15mm secondary purchase), 80.5m Shares to IPOE public shareholders, 122.5m shares to PIPE / Co-Investment, and 20.1m shares to IPOE sponsor
© 2020 Social Finance, Inc. Confidential Information. Do not copy or distribute. Advisory services offered through SoFi Wealth LLC. SoFi Money® is offered through SoFi Securities LLC. SoFi Lending Corp., CFL #6054612. NMLS #1121636.
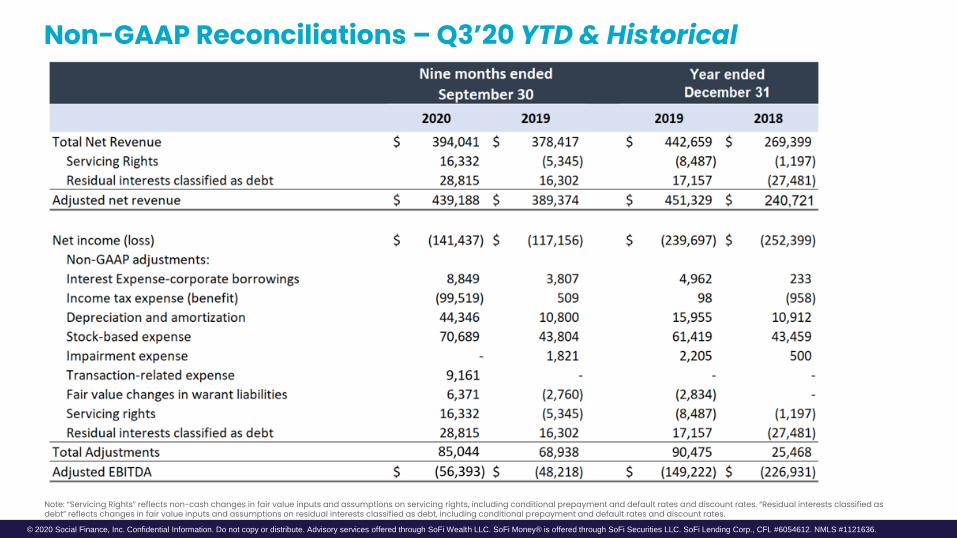
Non-GAAP Reconciliations – Q3’20 YTD & Historical
Note: “Servicing Rights” reflects non-cash changes in fair value inputs and assumptions on servicing rights, including conditional prepayment and default rates and discount rates. “Residual interests classified as debt” reflects changes in fair value inputs and assumptions on residual interests classified as debt, including conditional prepayment and default rates and discount rates.
© 2020 Social Finance, Inc. Confidential Information. Do not copy or distribute. Advisory services offered through SoFi Wealth LLC. SoFi Money® is offered through SoFi Securities LLC. SoFi Lending Corp., CFL #6054612. NMLS #1121636.
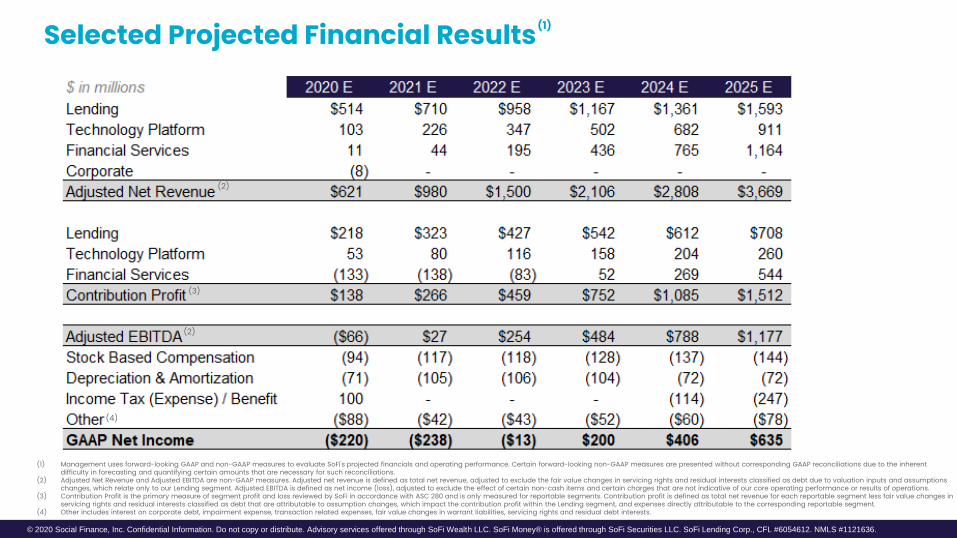
Selected Projected Financial Results
(1) Management uses forward-looking GAAP and non-GAAP measures to evaluate SoFi's projected financials and operating performance. Certain forward-looking non-GAAP measures are presented without corresponding GAAP reconciliations due to the inherent difficulty in forecasting and quantifying certain amounts that are necessary for such reconciliations.
(2) Adjusted Net Revenue and Adjusted EBITDA are non-GAAP measures. Adjusted net revenue is defined as total net revenue, adjusted to exclude the fair value changes in servicing rights and residual interests classified as debt due to valuation inputs and assumptions changes, which relate only to our Lending segment. Adjusted EBITDA is defined as net income (loss), adjusted to exclude the effect of certain non-cash items and certain charges that are not indicative of our core operating performance or results of operations.
(3) Contribution Profit is the primary measure of segment profit and loss reviewed by SoFi in accordance with ASC 280 and is only measured for reportable segments. Contribution profit is defined as total net revenue for each reportable segment less fair value changes in servicing rights and residual interests classified as debt that are attributable to assumption changes, which impact the contribution profit within the Lending segment, and expenses directly attributable to the corresponding reportable segment.
(4) Other includes interest on corporate debt, impairment expense, transaction related expenses, fair value changes in warrant liabilities, servicing rights and residual debt interests.
(1)
(2)
(2)
(3)
(4)