Embed Size (px)
Citation preview

#4Business imperatives for a prosperous Australia
Building the Lucky Country
Get out of your own wayUnleashing productivity

BUILDING THE LUCKY COUNT
RY
Ownway

ContentsCEO LETTER
Let’s unlock our potential 1
PART I 2
The story in a nutshell 4
PART II 8
The threat to Australia’s living standards 10
Part III 16
The rise of rules 18
PART IV 32
Calculating the cost of rules 34
PART V 44
How to get out of your own way 46
The next steps for government and business 51
Appendix I 52
Growth in compliance workers by sector and state 53
Appendix II 58
Costing methodology 59
Appendix III 64
Survey methodology 65
About the authors 67
Contact us 68

Get out of your own way | Unleashing productivity 1
Deloitte is passionate about building Australia – our Lucky Country.
The ‘prosperity equation’ required to do just that is pretty simple: either we get a bigger share of Australia’s population working, or we help our workers become more productive.
That’s why our Building the Lucky Country series to date has focused on these two key drivers.
Our first edition, Where is your next worker?, looked at ways of helping people get or stay in work, and where business and government could look for new sources of labour. Then Digital disruption – Short fuse, big bang? looked at how organisations could get ahead of digital trends. That’s important, because technological change is a big driver of workplace productivity.
Our most recent paper, Positioning for prosperity? Catching the next wave, looked at ways to help businesses get into future growth hotspots, and sparked a national debate about existing and untapped sources of prosperity. Such structural changes have always been the largest single driver of productivity gains – and hence of prosperity.
But we also said that the growth potential we identified in Positioning for prosperity? wouldn’t just fall into our lap – that Australia would first need to overcome a range of regulatory and cost challenges. So, this latest edition focuses on the biggest single drag on our nation’s productivity: red tape.
We’ve discovered that we’re not only dramatically increasing the cost of governing our economy, but that – worryingly – the largest source of growth in rules and regulations is actually the private sector. We tend to blame government for bureaucracy’s drag on our productivity, but the dollars locked up by businesses in complying with self-imposed red tape are double those associated with government regulations.
That’s why we’ve called this report Get out of your own way – Unleashing productivity. While governments can do much to streamline Australia’s regulatory environment, there is a bigger opportunity – and need – for business to slash the red tape it imposes on itself.
Remember when you could actually do work when you were at work? We want to make sure that you can do so once again.
Taking a long, hard look at the rules that individual organisations operate within will reduce the cost and complexity of doing business in Australia. It will also free millions of individuals to innovate more, encourage them to take the risks needed to build wealth, and allow us to say as a nation that we’re truly ‘open for business’.
Getting out of our own way won’t just unleash business productivity – it will unleash Australia.
Giam Swiegers CEO, Deloitte Australia
Let’s unlock our potential

Australia has a problem –and its colour is red ...Red tape, that is.
We need to free our economy from the stranglehold it has on Australian productivity.
Part I

4 Get out of your own way | Unleashing productivity
The story in a nutshell
Australia has a problem. A rising retirement rate among baby boomers and falling export prices have Federal Treasury warning that, unless things change, growth in the nation’s living standards will halve compared with decades past.
The good news is that there is a rich source of barely tapped efficiency savings we can turn to: setting better rules for ourselves. The even better news is that this bucket of productivity potential is much bigger than most people realise.
A $249 billion cost
Red tape can be a great power for good. After all, a world without rules would be anarchy.
Yet past decades have seen new rules proliferate. Not even the federal government knows how many rules you are meant to obey. In fact, we don’t even know how many government bodies currently have the ability to set rules in the first place, let alone the number of rules those agencies have laid down.
As discussed in detail in Part IV and Appendix II, we conservatively cost this burden to the Australian economy at around $94 billion a year.
And that is just the cost of public sector rules. The private sector also imposes many rules and regulations of its own, and they carry a cost too. Such ‘self-imposed rules’ achieve much good. But we’ve overdone it, spawning an entire industry.
Businesses, like governments, want to reduce risks. We manage uncertainty and volatility by laying down the law – imposing rules on ourselves – in areas as diverse as human resources (HR), information technology (IT), finance, legal, marketing and executive governance.
Yet time is money, and our survey of public and private businesses, not-for-profits and government agencies shows that the time required for employees to comply with self-imposed rules has become a crippling burden. Middle managers and senior executives are chalking up 8.9 hours a week complying with the rules corporates set for themselves, with other staff spending 6.4 hours.
Ouch.
All up, self-imposed rules cost $21 billion a year to administer, and generate a stunning $134 billion a year in compliance costs. When combined, the costs of administering and complying with public and private sector rules equate to a quarter of a trillion dollars a year.
Those dollars are massive. A cost saving of just 10 per cent of that total (without a net loss of the matching benefits of rules) would equal 1.6 per cent of national income, ranking its impact with some of the largest reforms Australia has ever seen.
Yet even those dollars are a considerable underestimate. Economists have long agreed that the biggest burden of rules and regulations comes because an excess of rules saps incentive, enterprise and innovation across our economy.
The real annual cost of rules
• $94 billion to administer and comply with public sector rules• $155 billion to administer and comply with self-imposed rules and regulations• Unquantifiable losses from forgone incentives, enterprise and innovation • At least eight weeks of work just to cover the cost of administering and complying with rules
“Hell, there are no rules here … we’re trying to accomplish something” Thomas Edison, inventor and founder of General Electric

Get out of your own way | Unleashing productivity 5
Working for the rule-makers
A total cost of $249 billion a year means that Australians have to work for eight weeks every year just to pay for the administration and compliance costs of the rules we set ourselves.
The cost of our rules is much bigger than it needs to be because our rule-makers – both government and business – often try to achieve the unachievable. They set rules that are too prescriptive, overreact to momentary crises, let new rules overlap with existing rules, don’t listen to those most affected, and don’t go back later to check how well – or how badly – their rules are working.
We regulate in haste and repent at leisure, with each additional rule ratcheting up the pressure on our economy.
Worse still, bureaucracies have babies: they multiply fast. Corporates want to reduce risks, but they often don’t do so cost-effectively. So we’ve bulked up, employing many people whose role is to create and then enforce a whole bunch of rules and regulations. That doesn’t just mean
some lawyers and accountants. It also includes some people in finance, IT and HR functions, as well as in fast-growing governance and security roles. As a result there are already more ‘compliance workers’ across Australia than there are people working in the construction, manufacturing or education sectors.
In fact, one in every 11 employed Australians now works in the compliance sector.
Crushing our productivity gains
The pace at which we are employing new ‘compliance workers’ is a key reason why Australian productivity growth has been in low gear. New technologies are delivering a huge dividend but we’re not seeing the gains. The chart below shows how ‘back-office’ workers such as switchboard operators, mail sorters and library assistants have been rapidly shrinking as a share of the workforce, yet those productivity savings have been swallowed up amid the rising cost of Australia’s compliance culture.
0%
2%
4%
6%
8%
10%
12%
14%
1996 1998 2000 2002 2004 2006 2008 2010 2012
Back-office workers Compliance-centric workers
Year
Shar
e of
wor
kfor
ce
2014
Source: Deloitte Access Economics
Chart 1: The combined compliance and back-office sectors

6 Get out of your own way | Unleashing productivity
Why have we done it?
Rather than weighing up costs and benefits, organisations often institute new rules with little or no thought as to whether those rules are really needed, or even whether they are consistent with other rules they already have in place. Their goal is to avoid being seen to stuff up, rather than assessing just how much that ‘stuff-up insurance’ costs.
Ex-UK Prime Minister Tony Blair once noted the pointlessness and cost of trying to “eliminate risk in a way that is out of all proportion to the potential damage” and said the result was “a plethora of rules, guidelines, responses to ‘scandals’ of one nature or another that ends up having utterly perverse consequences”.1
So why has corporate Australia let its compliance culture grow to the extent it has, if its costs are high relative to its benefits? In part it is because, as organisations, we overestimate the extent to which we can insulate ourselves from costs (a rogue employee, a nasty story in a tabloid, a grumpy customer). And, in part, it is because we are bad at estimating risks – you’re more likely to be killed by a dog than a shark, for instance, yet people fear sharks more.
Where rules don’t exist, we create them. Where they already do, we make more. They overlap, they contradict, they eat our time and they weigh us down
1 Tony Blair, speech to the Institute for Public Policy Research, 27 May 2005, reproduced by The Guardian, 27 May 2005.

Get out of your own way | Unleashing productivity 7
Escaping the mess
It’s a mess. But it needn’t be.
We’ve long known how to set good rules, as well as which traps to avoid.
The public sector has a tradition of thinking about its rule-making, and has an awareness that it can do better. Yes, you read that right – government is trying. Indeed, this year Australia saw its first regulation repeal day at the federal level, which did away with more than 9,500 rules.
According to the government’s deregulatory champion, Josh Frydenberg MP, these repealed rules included regulations requiring universities – which already face a $280-million-a-year compliance burden – having to report in detail to the federal government about how they use their lecture theatres, tutorial halls and academic offices. Job service providers will also be freed from keeping paper records of job applications, a process that had filled 336 cabinets at one organisation.
In contrast, the last decade saw private sector organisations do to themselves what they often complain about governments doing – piling on extra bureaucratic pounds without taking a close look at the costs and benefits of those new rules.
Our research uncovered a wealth of examples:
• The small taxi fares that have to await approvalfrom the weekly executive team meeting
• The firm that rejects application forms frompotential customers if they are completed inblue ink
• The business insisting its engineers sign off onnew parts at a fixed location, making them walkup to 15 kilometres a day around the workplace(see page 29)
• The rules that say receptionists must record everycoffee made for a guest or letter received, but canorder as much alcohol as they like
• The firm that insisted staff complete an ergonomicchecklist and declaration when they moved desks,then introduced ‘hot desking’ such that everyonespent 20 minutes a day filling out forms.
This report identifies the many ways in which self-imposed bureaucracy hurts corporate Australia’s efficiency, its profits and ultimately the nation’s families.
For the nation to be truly ‘open for business’, individual organisations need to unlock the profit potential they have tied up in their own red tape. Remember when you could actually do work when you were at work? That’s why we conclude this report by discussing some concrete steps businesses can take to unleash their people, and hence their productivity.
These five steps – the 5C’s – encourage companies to:
1. Cleanse: Slash the stupidity – ask staff to list thedumbest things they are required to do as a resultof the business’s own rules, then stop doing them.
2. Challenge: Businesses should stop asking “Whatcould go wrong?” and focus on “What must goright?”, then challenge their rules in that light.What are their rules really trying to achieve, couldthey be improved and are they cost-effective? If not,there may be more to dump.
3. Create: Foster a culture focused on performancerather than compliance, and ensure the organisation’srule-makers are aligned to its business goals.
4. Change: Businesses and others should change theway they set new rules and audit old ones to betterlink rules with strategy and risk appetite.
5. Capitalise: Make the most of these changes torealise the business’s full potential.
Following these steps will allow your staff to generate extra profits while better controlling the risks that matter. In other words, we need to get out of our own way.

Part II
The threat to Australia’s living standards
10 Get out of your own way | Unleashing productivity
Our living standards comprise everything from our income to our ability to take holidays, as well as factors such as health, life expectancy, religious freedom and air pollution.
In short, almost everything you care about on a daily basis.
For you and your family, your living standards depend on how much work you do, how much you already earn for that work, and whether you’ve received a pay rise.
Yet this isn’t just the case for families. Much the same can be said for entire nations.
There are only three drivers that can effect big changes in Australia’s living standards:
• The world gives us a pay rise• A bigger share of our population works• Our workers become more productive.
So, what has been happening to Australia’s living standards? Until now, the news has been really good – while the rest of the world has struggled, our living standards have continued to power ahead.
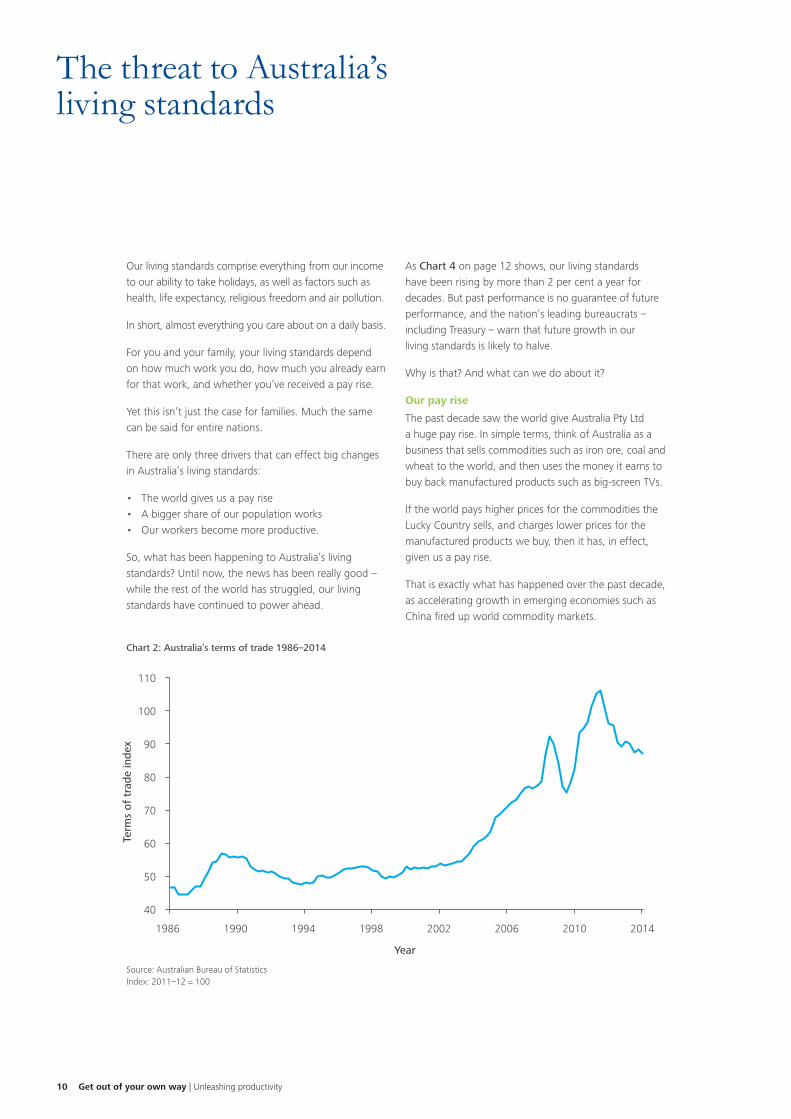
As Chart 4 on page 12 shows, our living standards have been rising by more than 2 per cent a year for decades. But past performance is no guarantee of future performance, and the nation’s leading bureaucrats – including Treasury – warn that future growth in our living standards is likely to halve.
Why is that? And what can we do about it?
Our pay rise
The past decade saw the world give Australia Pty Ltd a huge pay rise. In simple terms, think of Australia as a business that sells commodities such as iron ore, coal and wheat to the world, and then uses the money it earns to buy back manufactured products such as big-screen TVs.
If the world pays higher prices for the commodities the Lucky Country sells, and charges lower prices for the manufactured products we buy, then it has, in effect, given us a pay rise.
That is exactly what has happened over the past decade, as accelerating growth in emerging economies such as China fired up world commodity markets.
The threat to Australia’s living standards
Chart 2: Australia’s terms of trade 1986–2014
40
50
60
70
80
90
100
110
1986 1990 1994 1998 2002 2006 2010 2014
Year
Ter
ms
of t
rade
inde
x
Source: Australian Bureau of Statistics Index: 2011–12 = 100

Get out of your own way | Unleashing productivity 11
Chart 2 shows Australia’s terms of trade – a measure of export versus import prices – which increase when the world gives us a pay rise, and fall when our pay is cut.
Having risen enormously as the emerging economy boom roared ahead, commodity prices fell in recent years as Chinese growth eased and the pace of world mineral production lifted.
More challenging still, Treasury expects that the decade to come will see those trends – changing patterns of Chinese growth and rising global mineral supply – lead to further falls in the terms of trade.
In other words, what has been a tailwind for Australian living standards has become a headwind.
Demography is destiny
Ditto for demography. The large number of people born in the aftermath of World War II and through to the start of the 1960s are collectively called ‘baby boomers’.
And boom they did – when this group moved into the workforce in the 1970s and 1980s, the share of the nation’s population in the workforce hit new highs.
Even better, those two decades also saw Australian women move into the paid workforce in massive numbers, which is reflected in the overall improvement in the employment-to-population ratio shown in Chart 3.
However, the share of the population working peaked in late 2010. And with more baby boomers taking the handshake and gold watch, this demographic-driven boost to Australian living standards has become a drag.
So, as was true of world commodity prices, what has been a tailwind for Australian living standards has become a headwind.
Chart 3: Employment-to-population ratio 1986–2014
Source: Australian Bureau of Statistics
42%
44%
46%
48%
50%
52%
1986 1990 1994 1998 2002 2006 2010 2014
Year
Empl
oym
ent-
to-p
opul
atio
n ra
tio

12 Get out of your own way | Unleashing productivity
Why productivity is so important
The final driver of living standards is the extent to which our workers become more efficient. However, Australia’s productivity performance over the past decade has been pretty poor.
Accordingly, Treasury and others in the ‘official family’ – the Reserve Bank and the Productivity Commission – have been spelling out a compelling message: with export prices easing and baby boomers retiring, either productivity must boom or our growth in living standards will trail well behind our past performance.
Chart 4 lays that out. Demography – labelled as ‘participation’ in the chart – added to our living standards in the 1980s. It was mildly positive thereafter, but it is expected to go the other way in the years ahead.
The same is true of what the world pays us. Australia’s terms of trade hurt the national standard of living in the 1980s and 1990s, but not substantially so. Then the period from 2000 to 2013 proved to be a bonanza as coal and iron ore prices surged. However, here too the
glory days have passed, and the current decade may bring some rather bad news. Indeed, it already is.
As a result, much rides on a sharp improvement in productivity gains.
Chart 4 assumes Australia can improve its recent productivity performance, with gains in the coming decade matching the average of the last 30 years. That of itself would be an improvement on the past decade. Yet, even with that lift in productivity performance, we would see overall growth in living standards fall to less than half of what we have been used to.
As the Deputy Governor of the Reserve Bank, Philip Lowe, recently noted:
“Productivity growth over the past decade has been lower than it was in the 1990s, commodity prices are high but no longer rising, and the share of the population in employment has fallen recently. If these trends continue, we face the prospect of considerably slower growth in our living standards than we have become accustomed to.”2
Chart 4: Drivers of living standards – component contributions to growth in national income per head, by decade
Source: Dr Martin Parkinson, Secretary to the Treasury, ‘The 2014–15 Budget and sustaining broad-based growth in living standards’ speech, 20 May 2014; Deloitte Access Economics
-1.1%
-0.5%
0.0%
0.5%
1.0%
1.5%
2.0%
2.5%
1980s 1990s 2000 to 2013 Decade to 2023
Productvity and other Participation Terms of trade Total living standards
Year
Ave
rage
ann
ual n
atio
nal
inco
me
grow
th p
er c
apit
a
2 Philip Lowe, Deputy Governor, Reserve Bank of Australia, ‘Demographics, Productivity and Innovation’, speech to The Sydney Institute, 12 March 2014.
Get out of your own way | Unleashing productivity 13
Searching for productivity
So, we need a boost in productivity. Where can we find it?
Productivity has a few components. One may be thought of as ‘bought productivity’, where taxpayers’ money is spent on performance-enhancing infrastructure. This approach brought us the Snowy Mountains Scheme and ‘free’ university education in times past, and more recently has poured money into the National Broadband Network (NBN), universities and vocational training.
Yet public sector budgets are under a lot of pressure, and the high-tide mark of taxpayer funding for the NBN, universities and vocational training would appear to have already been passed. This means that not only will we be heavily reliant on productivity growth for future gains in living standards, but that taxpayers won’t be footing the bill.
Other drivers
So, what else drives productivity gains? Those drivers are pretty varied, but an important one is our use of new technologies.
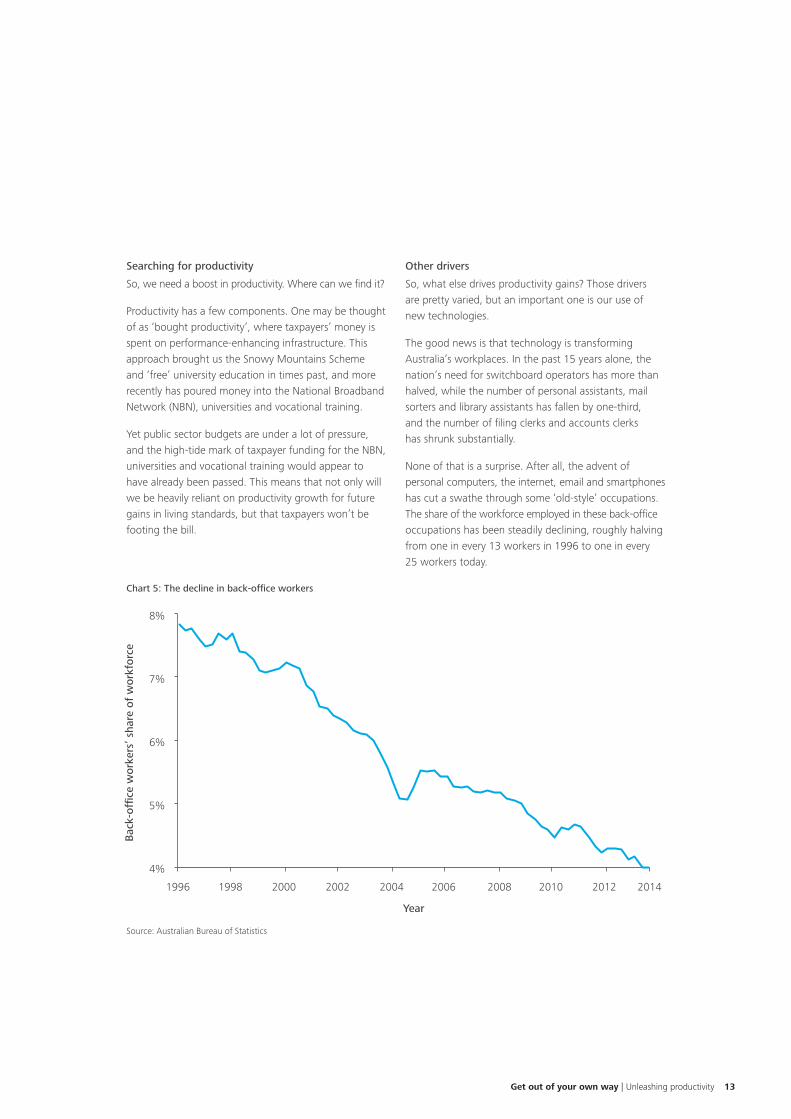
The good news is that technology is transforming Australia’s workplaces. In the past 15 years alone, the nation’s need for switchboard operators has more than halved, while the number of personal assistants, mail sorters and library assistants has fallen by one-third, and the number of filing clerks and accounts clerks has shrunk substantially.
None of that is a surprise. After all, the advent of personal computers, the internet, email and smartphones has cut a swathe through some ‘old-style’ occupations. The share of the workforce employed in these back-office occupations has been steadily declining, roughly halving from one in every 13 workers in 1996 to one in every 25 workers today.
Chart 5: The decline in back-office workers
Source: Australian Bureau of Statistics
4%
5%
6%
7%
8%
1996 20001998 2002 2006 20102004 2008 2012 2014
Year
Bac
k-of
fice
wor
kers
’ sha
re o
f w
orkf
orce

14 Get out of your own way | Unleashing productivity
However, there is a sting in the tail. Not only have we replaced many of those former clerks and back-office workers with our new army of compliance workers, it turns out that many of the new technologies we’ve come to love are also time thieves, stealing the modern corporation’s most valuable resource: workers’ hours.
For instance, more than 100 billion business emails were sent and received each day in 2013, only one in seven of which was critically important.3 In fact, McKinsey and the Radicati Group have estimated the average
worker now spends more than one-quarter of their day answering and reading emails.4
Add in social media, teleconferences, instant messages and endless internet browsing, and we risk being seriously unproductive.
That makes the need to find productivity in other quarters all the more critical. For example, if we can cull the rules we need to follow, we may also be able to reduce the number of emails, meetings and other interactions that directly relate to compliance activities.
3 Dr Sara Radicati and Justin Levenstein, Email Statistics Report, 2013–2017, The Radicati Group, April 2013.
4 Todd Wasserman, ‘Email Takes Up 28% of Workers’ Time’, Mashable.com, 1 August 2012.
Lost opportunity: how Australia replaced back-office workers with compliance workers
The lack of a high productivity dividend from the take-up of new technologies becomes much more understandable in the context of Chart 6. In effect, technology is giving us a regular digital dividend in terms of a relative reduction in the share of workers tied up in back-office functions, but those savings have been more or less exactly offset by the rising cost of Australia’s ‘compliance culture’. Easy come, easy go.
Chart 6: The combined compliance and back-office sectors
0%
2%
4%
6%
8%
10%
12%
14%
1996 1998 2000 2002 2004 2006 2008 2010 2012
Back-office workers Compliance-centric workers
Year
Shar
e of
wor
kfor
ce
2014
Source: Deloitte Access Economics

Get out of your own way | Unleashing productivity 15
Earned productivity
This report concentrates on what we will term old-fashioned ‘earned productivity’, where leaders fight for reform – and better rules – despite the unpopularity of doing so.
Creating and implementing improved rules isn’t merely a task for governments. The even bigger responsibility – because the dollars involved are bigger too – lies with businesses themselves.
Unfortunately, one of the stand-out stupidities of the past decade was that governments talked about
deregulation while adding new layers of rules affecting businesses and families. That extra bureaucracy didn’t hurt so much when the resources boom was in full swing and corporate profits were high. But now the boom is less robust, the cost penalties are more evident.
So our message is even more pointed than that of the Federal Treasury: Australians will experience little growth in living standards until we see politicians who are willing to tackle some much-needed economic reforms, and until corporate Australia stops tying itself up in unnecessary red tape.
Our message is even more pointed than that of the Federal Treasury: Australians will experience little growth in living standards until we see politicians who are willing to tackle some much-needed economic reforms, and until corporate Australia stops tying itself up in unnecessary red tape

Part III
The rise of rules

18 Get out of your own way | Unleashing productivity
The rise of rules
Why we have rules
Regulations are a way in which society sets rules for itself – everything from ‘thou shalt not kill’ to ‘thou shalt not put fresh cream on cakes baked for the school fete’.
Why do we impose rules on ourselves? As the Productivity Commission has noted:
“Regulation serves a vital role in improving social, environmental and economic standards for Australians. At their most fundamental level, laws – merely a form of regulation – define and enforce property rights, which are the basis for economic exchange. [And] uninhibited markets can produce undesirable outcomes, such as environmental degradation, unnecessary health hazards, excessive prices and ‘unfairness’. By shaping incentives and influencing how people behave and interact, regulation can help societies deal with otherwise intractable problems. At their best, regulations create order, preserve norms and provide a basis for stable progress.”5
Businesses and governments alike are therefore correct to value rules. After all, rules make life more predictable,
and predictability helps organisations do all sorts of things, including:
• Plan amid complexity and uncertainty• Ensure consistency across geographically
dispersed offices• Improve the health and safety of workplaces • Reduce the risks of incompetence and corruption • Ensure all employees are treated fairly • Reduce legal exposure• Reduce risks to systems and processes.
These are important goals for business leaders. After all, the key currency of any business is not dollars, but trust. And the bigger the business, the harder it is for its leaders to monitor what’s going on, and hence to trust that people are acting appropriately.
When surveyed for this report6, business leaders noted that some of their main motivations for adopting internal rules were to minimise corporate risk, improve health and safety, collect data, meet best practice and fall into line with global requirements (see Chart 7).
5 Gary Banks, ‘Regulation and Competition as Drivers of Performance’, in An Economy-wide View: Speeches on Structural Reform, Productivity Commission, Australian Government, 2010.
6 See Appendix III for survey methodology.
Chart 7: Main motivations for adopting internal rules
Oth
er
Mon
itor a
ctivi
ty d
ue to
em
ploy
ees w
orkin
g aw
ay fr
om
prim
ary
offic
es/fa
ctor
ies/m
ines
Mon
itor e
mpl
oyee
act
ivity
due
to g
eogr
aphi
cal s
epar
atio
n
Conf
orm
with
glo
bal
HQ re
quire
men
ts
Mee
t bes
t pra
ctice
Colle
ct b
usin
ess d
ata
for m
anag
emen
t
Ensu
re h
ealth
and
safe
ty
Min
imise
cor
pora
te ri
sk
0
5
10
15
20
25
Prop
orti
on o
f in
tern
al r
ules
(%)

Get out of your own way | Unleashing productivity 19
The explosion in government rule-making
So, rules are important. But it is possible to have too much of a good thing, and it’s no surprise we all whinge about red tape: the volume of public sector–driven regulation has grown at an unprecedented pace in recent years. Indeed, The Centre for Independent Studies estimates a further 21,000 new federal regulations were added under the last government alone.7
How many rules have Australian governments imposed on their citizens and businesses? The Business Council estimates Australia has “well over half a million pages of regulation”, but no-one knows just how many individual rules that really means.8
In fact, we don’t even know how many government bodies there are that can set rules in the first place, let alone the number of rules those agencies have laid down. Finance Minister Mathias Cormann recently said the number of Commonwealth bodies has “grown out of control” to the extent there is “no actual authoritative and definitive figure of how many existed”.9
Yes, that’s right – we can’t even count the rule-makers, let alone the rules.
As Chart 8 shows, what we do know is that the growth in rules has been explosive. In fact, the pages of legislation flooding in from Federal Parliament have roughly doubled every 15 years since Federation.
7 Cassandra Wilkinson, ‘Slashing red tape requires a broader view of social costs’, The Centre for Independent Studies, 31 May 2014.
8 Business Council of Australia, Improving Australia’s Regulatory System, 2013.9 Rick Wallace, ‘Government agencies cut, merged in $500 million efficiency
drive’, The Australian, 14 May 2014.
Chart 8: Pages of new Federal Parliament legislation by decade
Source: Institute of Public Affairs, Deloitte Access Economics
0
10,000
20,000
30,000
40,000
50,000
60,000
70,000
1900 1910s 1920s 1930s 1940s 1950s 1960s 1970s 1980s 1990s 2000s
Decade
New
pag
es o
f le
gisl
atio
n
20 Get out of your own way | Unleashing productivity
The explosion in private sector rules and compliance
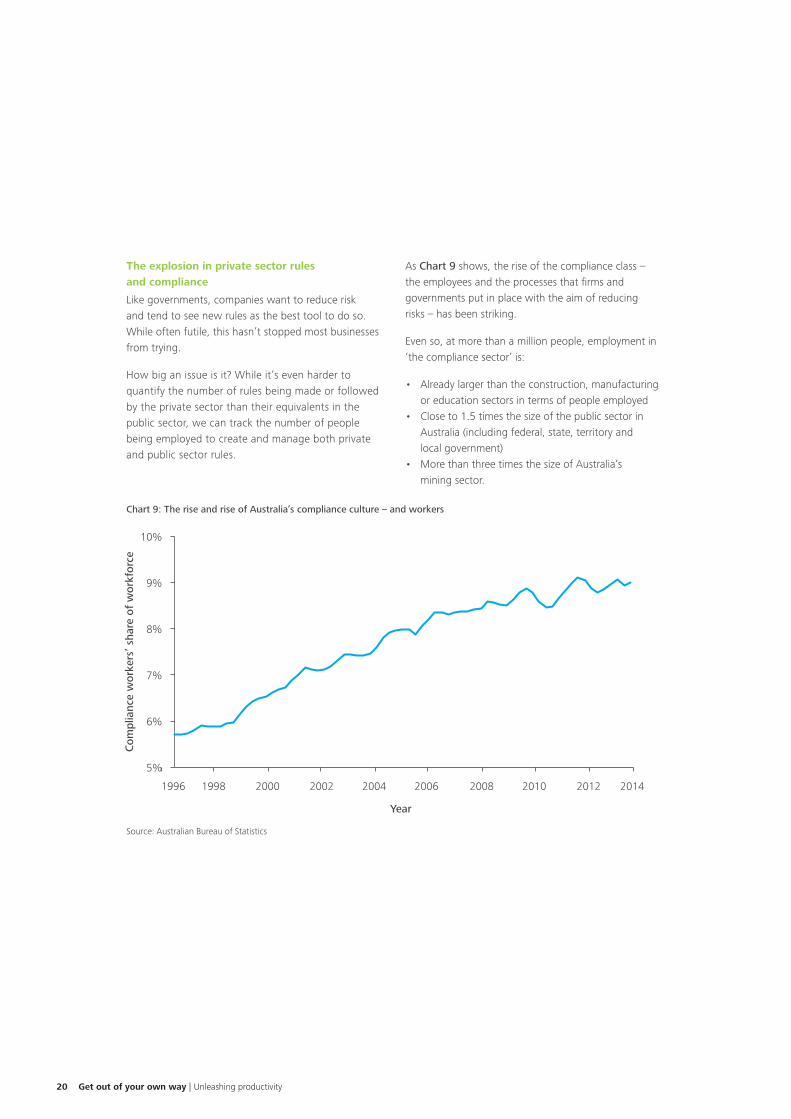
Like governments, companies want to reduce risk and tend to see new rules as the best tool to do so. While often futile, this hasn’t stopped most businesses from trying.
How big an issue is it? While it’s even harder to quantify the number of rules being made or followed by the private sector than their equivalents in the public sector, we can track the number of people being employed to create and manage both private and public sector rules.
As Chart 9 shows, the rise of the compliance class – the employees and the processes that firms and governments put in place with the aim of reducing risks – has been striking.
Even so, at more than a million people, employment in ‘the compliance sector’ is:
• Already larger than the construction, manufacturing or education sectors in terms of people employed
• Close to 1.5 times the size of the public sector in Australia (including federal, state, territory and local government)
• More than three times the size of Australia’s mining sector.
Chart 9: The rise and rise of Australia’s compliance culture – and workers
5%
6%
7%
8%
9%
10%
1996 2000 2004 2008 2012 20142010200620021998
Year
Com
plia
nce
wor
kers
’ sha
re o
f w
orkf
orce
Source: Australian Bureau of Statistics

Get out of your own way | Unleashing productivity 21
Indeed, as noted earlier, one in every 11 employed Australians now works in the compliance sector.
The Australian Bureau of Statistics estimates that since the late 1990s, there has been:
• A doubling in numbers of ‘Inspectors and Regulatory Officers’, ‘Office Managers’ and ‘Public Relations Professionals’
• A tripling in ‘Other Information and Organisation Professionals’, ‘Practice Managers’ and ‘Intelligence and Policy Analysts’
• A quadrupling in numbers of ‘Occupational and Environmental Health Professionals’.
And the gold medal? That goes to ‘Contract, Program and Project Administrators’, whose ranks – today numbering some 120,000 people – have gone up by a factor of five.
10 Schumpeter, ‘Fighting the flab’, The Economist, 22 March 2014.
Case study: Cutting complexity at GE
In a recent letter to shareholders, Jeffrey Immelt, the CEO of GE, confessed that his company had become bogged down in attempts to control risk through rules and bureaucracy.
“We attempted to manage volatility through layers and reviewers. Like many companies we were guilty of countering complexity with complexity ... more inspectors, multiple reviewers,” he said. The result was a “higher cost structure, an artificial sense of risk management, and we were insulating our people from the heat of the market”.
According to The Economist, GE has now reversed course. Immelt has launched a simplification strategy with a goal of cutting overheads to 12 per cent of sales from 16 per cent by 2016, including a 45 per cent reduction in the cost of the corporate headquarters.10
Like governments, companies want to reduce risk and tend to see new rules as the best tool to do so. While often futile, this hasn’t stopped most businesses from trying

22 Get out of your own way | Unleashing productivity
Growth in compliance workers by sector
We’ve used detailed Census and labour force data to map out where Australia’s compliance employees work, and just how fast their ranks have been growing. Chart 10 identifies sectors by:
• The share of compliance workers in that industry• The growth in compliance workers relative to overall
workforce growth• The relative size of the sector (indicated by the size
of the bubbles).
It’s no surprise that more than one in four people employed by the public sector work in occupations involved in administering, enforcing and complying with rules.
The chart also shows that, in the five years to 2011, the public sector compliance workforce grew
faster (16.0 per cent) than did overall public sector employment (13.1 per cent) – a gap of 2.5 per cent. (The maths here is (1+16.0 per cent)/(1+13.1 per cent) – 1 = 2.5 per cent.)
In contrast, the private sector has a relatively smaller share of its workforce in the compliance sector (about one in every 13 employees), but much faster relative growth. Whereas the total private sector workforce grew by 10.4 per cent over that same five-year period, its compliance workers grew by 17.4 per cent – a gap of 6.3 per cent.
So the pattern of growth momentum is different – both the public and private sector are beefing up in compliance, but the private sector is now moving significantly faster.
Chart 10: Compliance workers – importance, growth and size of sector
Private sector
Public sector
0%
5%
10%
15%
20%
25%
30%
2% 3% 4% 5% 6% 7%
Growth in compliance workers’ share of workforce 2006–11
Com
plia
nce
wor
kers
sha
re o
f w
orkf
orce
, 201
1
The higher a sector is on the chart, the larger the share of compliance occupations in its total workforce. The further to the right on the chart, the faster the growth in the share of compliance occupations. Bubble size reflects the size of the sector in terms of output.

Get out of your own way | Unleashing productivity 23
Where’s the growth in private sector compliance workers?
Exactly where are the compliance workers in the private sector, and how fast is that burden growing?
To see that, we need to break the private sector into its major component industries, as we do in Chart 11. The position of each sector is important:
• The top-right quadrant is the ‘Valley of Death’, in which compliance costs (related to both public and private rules) are both high and rising
• The top-left quadrant has a high share of compliance workers but lower relative growth
• The bottom-right quadrant contains different dangers – although compliance costs aren’t high relative to other sectors, they are growing fast
• The bottom-left quadrant is safer – compliance costs are lower, and their relative growth is lower too.
Chart 11: Compliance workers – importance, growth and size of sector
The higher a sector is on the chart, the larger the share of compliance occupations in its total workforce. The further to the right on the chart, the faster the growth in the share of compliance occupations. Bubble size reflects the size of the sector in terms of output.
0%
5%
10%
15%
20%
25%
0% 5% 10% 15% 20%
Com
plia
nce
wor
kers
’ sha
re o
f w
orkf
orce
, 201
1
Growth in compliance workers’ share of workforce, 2006–11
Agriculture
Manufacturing
Utilities
Construction
ICT
Property
Professionalservices
Health
Wholesale
Mining
Finance
Education
Transport

24 Get out of your own way | Unleashing productivity
Luckily, the Valley of Death is empty.
However, the top-left quadrant is home to some significant sectors: finance, professional services, utilities and ICT. As many as one in every five workers in those industries works in a compliance-related occupation.
Interestingly, several industries that are the most overloaded with rules – think of the likes of finance, professional services, and indeed the public sector itself – have also left themselves even more vulnerable to digital disruption. The latter was the theme of the second in Deloitte’s Building the Lucky Country series (Digital disruption – Short fuse, big bang?), and perhaps it is no surprise that organisations labouring under a heavy load of rules are less agile and well equipped to handle upstart competitors who don’t have the same lead in their saddlebags.
The bottom-right quadrant, where compliance burdens aren’t currently high, but are rising fast, includes mining and construction. Given how fast the total number of mining jobs was growing in recent years, it says something that the number of compliance jobs within mining was growing faster still.
That increase in mining and construction compliance jobs has generated a bunch of benefits. To pick an obvious one, these sectors have engineered considerable success on the safety front for their workers. Yet that isn’t all that’s happening here.
Mining and construction grew faster than the average sector from 2006 to 2011 and also enjoyed
faster-than-average profit gains. Other things being equal, that made those sectors more vulnerable to regulation risks. Governments saw cashed-up companies and added a bundle of new rules.
See Appendix I for further discussion of selected sectors, as well as state and territory trends.
Are these rules and compliance workers adding value?
The big question is whether all these new rules and compliance workers will make Australia more productive and ultimately benefit our standard of living. Here, there is room for concern.
Listen again to the Productivity Commission talking about the costs of public sector regulation:
“Excessive coverage, extensive and variable reporting requirements, inconsistent and overlapping regulations, and redundant and ineffective regulation can all impose undue compliance burdens on business. Unintended consequences, such as distorted incentives for investment or innovation, can impose longer-term and potentially higher costs and result in poorer social and environmental outcomes. Even regulation that is initially well made and cost-effective can require subsequent amendment as costs and benefits change over time due to changes in technology, demographics, preferences, relative prices and resource ownership – and the accumulation and interaction of regulations.”11
And now remember the exact same things could be said of the rules that businesses impose on themselves.
11 Productivity Commission, Identifying and Evaluating Regulation Reforms, December 2011.
12 Lucille Keen, ‘NAB says compliance costs unsustainable’, The Australian Financial Review, 14 July 2014.
Case study: NAB sees its compliance costs triple in three years
NAB notes its costs of complying with regulation tripled to $265 million in the past three years. “Continued growth in costs of this scale is not sustainable,” the bank warned, adding that the opportunity cost of spending on compliance instead of on more productive areas “looms large”.
NAB submitted 3,150 external reports totalling 80,000 pages at a cost of $50 million as part of its compliance work in 2012, while the growing burden of obligations on directors meant the demarcation between management and the board was “progressively less distinct”.
A mooted G20 push for banks to swap customer tax data between countries could also cost at least $100 million in system upgrades.12

Get out of your own way | Unleashing productivity 25
Indeed, there are many examples of regulations that aren’t tested using cost-benefit analysis. Would you be surprised to hear that the chairman of British Airways says that removing shoes and taking laptops out of briefcases for pre-flight security procedures are “completely redundant” security measures?13
Similarly, corporations often set rules in reaction to the wrong risks – and do so without a sufficient sense of costs and benefits, or even how the new rules will interact with those already in place.
We surveyed Australian business and not-for-profit leaders to ask just how much time key corporate functions spend in response to self-imposed rules – as opposed to requirements foisted on organisations by governments.14
Those results were revealing. Chart 12 shows that more than 80 per cent of the time spent complying with IT regulation was due to self-imposed rules, while governance-related compliance was split equally between self-imposed and public sector rules.
In our survey, we also asked which functions had ‘unnecessary or low-value processes’ – internal rules that our respondents thought delivered little or no value to their organisation. Notably, these problematic rules show up more in governance and compliance functions, and are seen as less of an issue in the finance function (see Chart 13).
13 Saul Eslake, ‘In the name of security’, published in The Sydney Morning Herald, 16 February 2011.
14 Our survey is detailed in Appendix III.
Chart 13: Share of internal rules with ‘unnecessary or low-value processes’
Chart 12: Share of time spent on internal rules (rather than government rules)
IT
Fina
nce
Lega
l/mar
ketin
g/ex
ecut
ive HRG
over
nanc
e an
d co
mpl
ianc
e
0
30
60
90
Shar
e o
f ti
me
spen
t o
n in
tern
al r
ules
(%
)
Corporate function
IT
Fina
nce
Lega
l/mar
ketin
g/ex
ecut
ive HRG
over
nanc
e an
d co
mpl
ianc
e
0
30
60
90
Shar
e o
f ti
me
spen
t o
n in
tern
al r
ules
(%
)
Corporate function
0
5
10
15
20
25
IT
Fina
nce
Lega
l/mar
ketin
g/ex
ecut
iveHR
Gov
erna
nce
and
com
plia
nce
Shar
e o
f in
tern
al r
ules
(%
)
Corporate function
IT
Fina
nce
Lega
l/mar
ketin
g/ex
ecut
ive HRG
over
nanc
e an
d co
mpl
ianc
e
0
30
60
90
Shar
e o
f ti
me
spen
t o
n in
tern
al r
ules
(%
)
Corporate function

26 Get out of your own way | Unleashing productivity
It is worth pausing to remember that our survey respondents were mostly CEOs and CFOs – so it is all the more revealing that those at the top of businesses are frustrated by the self-imposed rules they and their employees have to grapple with.
And no wonder. Time is money, and our survey showed the crippling burden of the time staff spend complying with self-imposed rules. Worse still, this burden falls most heavily on the engine room of any organisation – middle management.
Both middle managers and senior executives are chalking up 8.9 hours a week complying with the rules corporates set for themselves, with other staff spending 6.4 hours complying (Chart 14).
Seniorexecutives
Middlemanagement
Role
Other non-administrative
staff
0
2
4
6
8
10
Hou
rs
Chart 14: Hours per week spent complying with internal rules – by seniority
CEOs and CFOs don’t think much of their own rules, labelling many of the rules and processes that their own organisations insist on as ‘unnecessary’ or ‘low value’

Get out of your own way | Unleashing productivity 27
Further, you may not be surprised to hear that while most surveys find that government rules loom largest for smaller businesses, the exact opposite is true for self-imposed rules. In fact, as Chart 15 shows, the bigger they come, the harder that compliance costs fall on their employees. Our survey indicates that the typical staff member in a big business spends 67 per cent
more time complying with self-imposed rules as their counterparts in small businesses. Fascinatingly, the staff time locked up in these processes is biggest in the public sector (yes, the public sector has many self-imposed rules of its own), and weighs more heavily on not-for-profits and on private businesses than it does on listed corporates – see Chart 16.
Chart 15: Hours per week spent complying with internal rules – by size of organisation
Large Medium
Organisation size
Hou
rs
Small
0
2
4
6
8
10
Chart 16: Hours per week spent complying with internal rules – by type of organisation
Publicsector
Privatebusinesses
Organisation type
Hou
rs
Not-for-profits/NGOs
Listedcorporations
0
2
4
6
8
10

28 Get out of your own way | Unleashing productivity
The impact of enforcement
It isn’t only our rules that matter. How we set and enforce them is also vital.
Poorly conceived rules can disenfranchise those who know best. They can reduce flexibility and choke innovation. And they are often aimed at moving targets, meaning that outdated and ineffective rules are left littering the corporate cost landscape long after they’ve served their purpose.
Disenfranchising
Economists, political scientists and the Catholic Church all call it the ‘subsidiarity principle’ – the idea that nothing should be done by a bigger or more complex body that can be done just as well by a smaller, simpler or more local organisation.
In other words, rules and responsibilities should allow for local knowledge and local conditions. To do so maximises the potential for individual and group initiative, and minimises the resentment Big Brother engenders.
One-size-fits-all rules – applying to everyone, regardless of geography or seniority – can mean that employees are asked to do silly things. Even worse, to do things that they know are silly: procurement policies that insist on the more expensive and less-reliable supplier, HR policies that push you away from the better candidate, and so on.
Indeed, belief in the advantages of subsidiarity, and in its decentralised sharing of power, is why Australia is a federation. And the failure to observe subsidiarity was a key reason why the old Soviet Union – geographically the largest nation on earth, spanning a remarkable 11 time zones – ended up on the scrap heap of history.
Yet most corporate rule-making is centralist rather than federalist. Our rules are typically one size fits all, regardless of whether that is appropriate or not. In effect, our rules assume that corporate HQ knows best, even when it demonstrably doesn’t.
Limiting flexibility
Corporate rule-making is not merely centralist – it is often absolutist too. By definition, rules lack flexibility.
Firms with a lack of trust in their employees limit their use of judgement or discretion. Large organisations, in particular, tend to frown on discretion, meaning that many employees – when faced with a divergent choice between doing the right thing and doing what the rule says – will opt for the latter. They prefer the quiet life of ‘going by the book’, even if they doubt the book’s wisdom.
Moreover, almost every infringement is treated as a hanging offence – in part because those enforcing the rules have a vested interest in interpreting everything they do as important, and hence any infringement as equally important.
Finally, it is worth noting that this lack of flexibility has three other components:
• As more and more rules overlap, they are increasingly likely to contradict each other. If we don’t allow flexibility (‘this rule is more important than that rule’), then costs become higher still
• Bureaucracies don’t merely have babies, they have cousins – meaning there is a tendency for a given rule to be applied to more victims over time
• There is a rule for every requirement and business group (such as HR, contracting, finance, IT and legal), rather than common frameworks, forms and procedures designed to make it possible to standardise and re-use rules and related compliance processes.
Aiming at moving targets
All rules have their weaknesses or blind spots. Indeed, almost all rules can be gamed, which is what increasingly tends to happen over time.
Kids figure out fast who is the softer touch when they are asking for something – Mum or Dad. So do employees. They know which time and cost codes get them into less trouble, or what to do once a particular rule gets in the way of something they want to do.

Get out of your own way | Unleashing productivity 29
15 Bruce Schneier, ‘A Waste of Money and Time’, The New York Times, 17 October 2012.
Case studies
Rules are often designed to keep organisations running efficiently and effectively. However, many are illogical or serve no end beyond themselves, instead creating unnecessary work.
More walking than working
An aviation business had strong internal controls in place to manage access to its expensive spare parts inventory, including a central control point to check out parts. Although this process appeared reasonable, it meant the maintenance and engineering staff were walking rather than working; taking up to four hours per day to walk 15.5 kilometres to collect these important parts vital to their work. To address this inefficiency, a thorough review of the process and workflow resulted in the introduction of a range of measures including electronic hand-held ordering devices, a centrally controlled delivery process and a ‘standard’ cart of materials that provided the base materials that could be ‘restocked’ based on logged usage. This reduced non-productive ‘walking’ time by more than 75 per cent.
Death by approval
To reduce major project overruns, a large organisation implemented significant new controls, systems and processes. Yet while all the steps in isolation looked sensible, the process changes created over 200 steps and handoffs in the approval processes. The result was that it took up to 270 days to obtain ‘approval for approval’, meaning that information became dated and parts of the process had to be revisited. The cost of people’s time skyrocketed as the costs of going through the approval processes were significantly higher than the ‘overruns’ that the organisation was trying to address in the first place. By re-engineering and simplifying the approval process, the organisation both increased efficiency in its approvals and successfully addressed overruns.
That is no great surprise. After all, rules are aimed at moving targets. And those targets are pretty smart.
Take airport security again. Security technologist Bruce Schneier sees much of it as a waste of time and money:
“We screen for guns and bombs, so the terrorists use box cutters. We confiscate box cutters and corkscrews, so they put explosives in their sneakers. We screen footwear, so they try to use liquids.
We confiscate liquids, so they put PETN bombs in their underwear. We roll out full-body scanners, even though they wouldn’t have caught the Underwear Bomber, so they put a bomb in a printer cartridge. We ban printer cartridges over 16 ounces – the level of magical thinking here is amazing – and they’re going to do something else.
“This is a stupid game, and we should stop playing it.”15
30 Get out of your own way | Unleashing productivity
16 Michael Mankins, Chris Brahm and Gregory Caimi, ‘Your Scarcest Resource’, Harvard Business Review, May 2014.
17 Michael Mandel and Diana Carew, ‘Regulatory Improvement Commission: A Politically-Viable Approach to U.S. Regulatory Reform’, Progressive Policy Institute Policy Memo, May 2013.
Creating a false sense of security
A final problem is that spending time and effort complying with rules can distract decision-makers from spotting other potentially disastrous risks.
A good example is the way financial institutions were caught out during the global financial crisis. Before the crisis, lenders were intently focused on maintaining credit quality and following rules associated with obtaining certain credit ratings for securitised issues. However, lenders’ risk managers generally failed to fully realise that they were also vulnerable to a systematic withdrawal of liquidity by investors. Instead, many believed that if they followed the rules then funding and liquidity would be available.
This failure of imagination cost many lenders dearly and suggests there is always a place for contrary thinking and independent mindedness.
Most academic assessments indicate that well-intentioned attempts to make air travellers safer have failed. Moreover, they have failed at enormous expense to the public sector, and they inflict even bigger costs on businesses and families. That is because these security measures create a comet trail of queues and lost productivity, but little added security.
Now think about the rules that businesses place on themselves in that same light.
Every rule creates incentives to circumvent itself.
That creates obvious problems, because it means that – to be as effective as it can be – rule-making needs to be as dynamic as the behaviour it seeks to channel.
Yet that’s exactly what rules aren’t – dynamic. We lack the sunset clauses that would see the public sector periodically test the sense and sensibility of its rules.
Moreover, employees tend not to challenge longstanding practices, meaning that systems can persist long after their validity has expired, and rules often outlast the person or group that implemented them.
In turn, businesses often labour under rules that may make little or no sense. Indeed, the relevant definition of ‘rules’ is pretty wide here. For example, in 2014 Harvard Business Review ran an article noting that:
“... leaders at one large manufacturing company recently discovered that a regularly scheduled 90-minute meeting of mid-level managers cost more than $15 million annually. When asked “Who is responsible for approving this meeting?” the managers were at a loss. “No-one,” they replied. “Tom’s assistant just schedules it and the team attends.” In effect, a junior VP’s administrative assistant was permitted to invest $15 million without supervisor approval. No such thing would ever happen with the company’s financial capital.”16
The snowball effect
The passing of years can weigh heavily on the profitability of a business. That is because the likelihood of rules conflicting or overlapping rises exponentially, rather than linearly.
This concept of ‘accumulated regulation’ is usually discussed in relation to public sector regulation, but the same concepts apply to self-imposed rules.17 Further, cost-benefit analysis – the traditional tool for figuring out whether something makes sense – is great for looking at each rule in isolation, but tends to increasingly underestimate the burdens associated with interacting rules.
With that in mind, our next section seeks to put a cost on Australia’s rules.

Get out of your own way | Unleashing productivity 31
18 We would like to credit the 2006 Regulation Taskforce for identifying some of these items. www.pc.gov.au/research/regulation-taskforce/report.
You’re doing it wrong
The definition of ‘bad’ rules is simple – they are the ones that cost you time and money but don’t help to control your risks. Bad rules are typically the result of the following sins.18
Overlaps: Overlapping or conflicting rules can create ‘regulatory cocktails’ that result in compliance disasters. A rule shouldn’t look at a risk in isolation.
Too many cooks: Australian organisations have many small rule-makers, creating risk management silos that don’t talk to each other – adding to overlaps, inconsistencies and additional costs.
Lack of independence: Rule-making and rule enforcement get jumbled together. Some areas within firms make the rules and enforce them. This mix tends to favour special interests and backroom deals. It also helps to explain why corporate bureaucracies burgeon over time.
Micro-management: Many rules are unnecessarily detailed. Results are almost always what truly matters, rather than how you get there. Yet the rules we set ourselves are typically overly prescriptive, specifying inputs rather than outcomes.
Irrelevance: Rules can become outdated or less cost-effective as new technologies revolutionise what we can do. So we should never set and forget rules.
Creepiness: Rules can creep in scope to influence more activity than originally intended or warranted, or their reach can become more extensive over time.
Excessive reporting or recording requirements and a lack of standardisation: Some rules demand excessive information, especially where requests are uncoordinated or duplicated and where the compliance cost is compounded by variation in definitions and reporting requirements.
Poor consultation: The subjects of rules have an incentive to ensure that those rules have low compliance costs. Moreover, enforcing compliance is easier where rule-makers have consulted those subjects up front.
One size fits all: Rule-makers want the world to be a simple place, but one-size-fits-all regulation isn’t always appropriate. We need flexible, risk-based approaches. If the risks are low, approval should be automatic unless rule-makers specifically say ‘no’, rather than waiting for them to specifically say ‘yes’.
Overreactions: Rule-makers often face pressure to react to high-profile problems, which can see the proper consideration of costs and benefits thrown out the window.
Slowness: Time is money, but rule-makers can take too long to grant approvals. Delay makes their life easier and less risky, but it increases costs and cuts into incentives for innovation.
Rigidity: A rule-maker’s say is often final and a lack of appeal mechanisms means poor decisions can’t be challenged. That stifles innovation.

Part IV
Calculating the cost of rules

34 Get out of your own way | Unleashing productivity
Calculating the cost of rules
Calculating the cost of rules
What are rules really costing Australian businesses and families? In this section, we dive more deeply into our cost calculations, and come up with some truly startling figures.
Five key categories
In brief, there are five key categories of costs involved in rules (as shown and tallied in Figure 1):
Public sector rules:
1. The cost to taxpayers of creating, administering and enforcing public sector regulation.
2. The cost to individuals, businesses and the public sector of complying with public sector regulation.
Self-imposed rules:
3. The cost to businesses and the public sector of creating, administering and enforcing regulations imposed on themselves.
4. The cost to businesses and the public sector of complying with their own rules and procedures.
Efficiency costs:
5. The costs imposed on the economy from businesses and individuals reacting to government or self-imposed rules by making less-than-optimal choices from an economic perspective – such as the reduced rates of innovation found in an overly (or badly) regulated industry.
Figure 1: The annual cost of rules to Australian businesses and families
0
50
100
150
200
250
Public sector regulation
Cos
t in
$ b
illio
ns
Admin cost
Admin cost
Compliancecost
Compliancecost
Self-imposed regulation Efficiency costof regulation
Bene
fits
need
ed t
o ju
stify
cos
tsEfficiencycost
Category
Source: Deloitte Access Economics

Get out of your own way | Unleashing productivity 35
As summarised earlier, Deloitte Access Economics estimates that rules and regulations cost Australia $249 billion per year, every year.
That means, of all the resources available to the Australian economy, we allocate a scary 16 per cent to administering and complying with rules and regulations.
That figure is enormous. Yet it is a conservative understatement, as we’ve excluded the cost of capital equipment (machinery and equipment purchased to comply with regulation). As the latter typically makes up around half of all costs in the Australian economy, that suggests the cost of complying with regulation may be substantially higher than our estimates show.
We have also excluded the cost of compliance borne by consumers, as well as efficiency costs to consumers and businesses.
These five cost categories are shown in Table 1. We describe each in further detail in the remainder of this chapter, while Appendix II contains technical information around the data and methodology.
We will now discuss these figures, but it is worth pausing to note that the compliance cost of self-imposed regulation (at $134 billion a year) is twice as large as that of public sector regulation (at $67 billion). It is almost as though Australia, faced with an open track, sets itself as many obstacles to prosperity as it can.
That’s why we called this report Get out of your own way!
Table 1: Annual cost of Australia’s rules and regulations
Type of regulation Type of cost Annual cost (billions)
Cost as share of national income
Data source
Public sector regulations
Administration costs $27 1.7% Budget Papers, Bureau of Statistics
Compliance costs $67 4.2% Deloitte survey and Productivity Commission
Self-imposed regulations
Administration costs $21 1.3% ABS Labour Force Survey and 2011 Census
Compliance costs $134 8.4% Deloitte survey
Efficiency costs Efficiency costs Not quantified Not quantified n/a
Total $249 15.6%
Source: Deloitte Access Economics

36 Get out of your own way | Unleashing productivity
The cost of administering public sector red tape
Back in 2005, the Productivity Commission had a stab at estimating the cost of administering public sector red tape by adding together the administration expenses of 15 federal government regulatory agencies (close to $2 billion in 2003–04) and the Australian Taxation Office (a further $2.3 billion in the same year). That cost of $4.3 billion a decade ago represented 0.5 per cent of national income at that time.
However, public sector regulatory creep has continued. And the Productivity Commission was only looking at federal regulatory costs, whereas our lens is wider – at the very least, there should be a matching allowance for administrative costs at the state, territory and local level.
To take the federal sphere as an example, the 2014 Commission of Audit identified 194 Commonwealth bodies operating under the Financial Management and Accountability Act 1997 and the Commonwealth Authorities and Companies Act 1997, and recommended that 99 of these be abolished, merged with other bodies, consolidated into related departments or privatised.
But the Commission went on to note that, in addition to these 194 bodies, the federal government also supported around 700 other bodies. More than 120 bodies and committees existed within departments and agencies, while some 600 more boards, councils and committees had been established on an administrative basis.
So what are the costs here? We examined the 2014–15 Federal Budget papers, and attributed a portion of the costs of 49 different departments and agencies to the cost of administering public sector red tape.
For example, the majority of the costs of the likes of the Australian Securities and Investments Commission, the Department of Parliamentary Services and the Clean Energy Regulator were attributed to the administrative and compliance costs of implementing federal regulation or internal department regulation, whereas small or zero shares were applied to the running costs of the likes of the Bureau of Meteorology, the Australian War Memorial and the Department of Veterans’ Affairs.
Our estimates suggest the current cost of administering federal regulations weighs in at 0.85 per cent of national income, with the 16 largest contributors to that figure noted in Chart 17.
Our estimates suggest the current cost of administering federal regulations weighs in at 0.85 per cent of national income

Get out of your own way | Unleashing productivity 37
Chart 17: The 16 biggest contributors to the cost of administering federal red tape
0
500
1,000
1,500
2,000
2,500
3,000
3,500
4,000
$m e
xpen
dit
ure
in 2
013–
14Au
stra
lian
Taxa
tion
Offi
ceAu
stra
lian
Cust
oms a
nd B
orde
r Pro
tect
ion
Serv
ice
Depa
rtmen
t of t
he E
nviro
nmen
t
Defe
nce
Mat
erie
l Org
anisa
tion
Aust
ralia
n Se
curit
ies a
nd In
vest
men
ts C
omm
issio
nAu
stra
lian
Secu
rity
Inte
lligen
ce O
rgan
isatio
n
Com
care
Smal
l age
ncie
s
Depa
rtmen
t of I
mm
igra
tion
and
Bord
er P
rote
ctio
n
Depa
rtmen
t of H
ealth
Depa
rtmen
t of t
he P
rime
Min
ister
and
Cab
inet
Aust
ralia
n Fe
dera
l Pol
ice
Atto
rney
-Gen
eral
’s De
partm
ent
Depa
rtmen
t of H
uman
Ser
vices
Fam
ily C
ourt
and
Fede
ral C
ircui
t Cou
rt
Depa
rtmen
t of D
efen
ce
As was true of the Productivity Commission’s estimates back in 2005, the single largest red tape administration cost lies with the Australian Taxation Office, though border protection activities and a proliferation of small agencies now make up a bigger part of the total than previously.
The current federal government’s deregulatory push is also evident in cost savings. Using the same methodology, we estimate that by 2017–18, the cost of administering federal rules will fall to 0.72 per cent of national income, a saving of $2 billion a year in today’s dollars.

38 Get out of your own way | Unleashing productivity
As a simple example, total government spending on ‘public order and safety’ has increased a lot over time. This group includes police, law courts and legal services, as well as prisons and corrective services. Spending in this area had been falling before the September 11 terrorist attacks and the Bali bombings, but subsequently soared, as shown in Chart 18.
Spending on public order and safety is now 0.28 per cent of Australia’s gross domestic product (GDP), seven times what we spent in the 1960s.
But what about the rest of the public sector – state and territory governments, local governments and multi-jurisdictional agencies? Taking:
• The employee expenses of the rest of the public sector • The same portion of their other operating expenses
as we’ve examined federally • And assuming that local government is only half
as admin-intensive as federal government, and that states and territories are only one-third as admin-intensive …
… then that implies that the total cost of administering Australian public sector regulations in 2013–14 was $27 billion, or 1.7 per cent of national income.
But just how big is that? It says, for example, that the administration costs of our public sector regulatory systems chew up half the revenue raised by the GST, or more than the annual profits of all four of Australia’s biggest banks added together.
This costing, moreover, is very conservative. As above, it assumes that, dollar for dollar, state and territory governments spend just one-third as much as the federal government on administrating regulation. This could well be optimistic. According to the Institute of Public Affairs, for instance, “there remain significant numbers of non-frontline state government jobs, representing up to 35 per cent of total state public sector employment”.19
Chart 18: Federal spending on public order and safety as a share of national income
0.00%
0.05%
0.10%
0.15%
0.20%
0.25%
0.30%
0.35%
1961–62 1971–72 1981–82 1991–92 2001–02 2011–12
Year
Shar
e of
nat
iona
l inc
ome
19 Dr Julie Novak, ‘Bureaucracy Overload State Government Employment Since the GST Reforms’, Institute of Public Affairs, May 2014.

Get out of your own way | Unleashing productivity 39
The cost of complying with public sector red tape
But wait, there’s more.
While it costs taxpayers to administer a given set of government rules, it costs businesses and consumers to comply with those rules.
The Productivity Commission notes that compliance costs can be unnecessarily high due to:
• Excessive coverage, including ‘regulatory creep’ • Redundant regulation • Excessive reporting requirements • Variation in definitions and reporting requirements • Inconsistent and overlapping rules.
Most estimates suggest that compliance costs are a multiple of the matching administration costs.
Part of the reason these costs are so high is that there are flaws in the rules themselves. For example, the academic verdict on Australia’s Corporations Act 2001 is simply scathing:
“Complex, ungainly, badly drafted, internally inconsistent and conceptually troubled; it is a mishmash of old law, ad hoc amendments, provisions pulled willy-nilly from different legal systems, statements which are not law at all, ideological posturing, and drafting styles that swing wildly from the colloquial to the technical ... Despite massive efforts at law reform in the last 15 years, and continuous tweaking, the Corporations Act remains … ‘indigestible and incomprehensible’.“20
Surely we can do better than that?
In 2001, the Productivity Commission released a paper estimating that the compliance costs of regulation could be as high as 4 per cent of Australia’s GDP, or up to $35 billion in 2005–06. It has also cited other estimates that the average business in New South Wales, for instance, spent 400 hours a year complying with regulations or meeting legal obligations.21
Looking internationally, the Productivity Commission added:
“In 2005, the UK Government estimated total administrative burdens associated with their regulation
to be £20–40 billion (1.6 to 3.2 per cent of GDP), while that in the Netherlands was estimated at €16 billion (3.6 per cent of GDP) in 2002. Denmark and Belgium have estimated total administrative burdens to be around 2 per cent of GDP (PC 2006c).”22
So, regulatory costs might range from 1.6 per cent of national income (the bottom end of the UK result noted above) to 4 per cent of national income.23
Moreover, most of these estimates are trying to identify costs to businesses rather than to consumers as well. In part, that is because these costs are typically passed on to consumers. However, consumers are also directly affected: families and individuals are as familiar as businesses with the time involved in filling out forms and the like.
Given that many of the existing compliance cost estimates are old and that we have recently experienced a significant rise in regulation, we reached out to business leaders to get a glimpse of the view from the front lines. As we suspected, it’s tough out there.
Based on Deloitte’s survey of corporate Australia, workers spend about 9 per cent of their week complying with public sector regulation. That’s almost half a day a week!
Yet that’s not the same as a cost of 9 per cent of national income – as the latter is derived not merely from the time spent by workers, but also from the national asset base of roads, computers, office blocks, shopping centres, factories and ports. Taking the very conservative approach of adjusting for labour’s share of the Australian economy’s resource base (trimming the resultant cost by about a half), that brings the total estimate of Australia’s cost of complying with public sector regulation to 4.4 per cent of national income.
Given that the highest publicly available estimate of 4 per cent of national income quoted by the Productivity Commission is relatively dated, we’ve decided to meet in the middle to estimate that the cost of complying with public sector regulation is 4.2 per cent of national income – or around $67 billion per year.
20 Cally Jordan, University of Melbourne, ‘Unlovely and Unloved: Corporate Law Reform’s Progeny’, Melbourne University Law Review, Vol. 33, 2009.
21 NSW Chamber of Commerce, cited in ‘Identifying and Evaluating Regulation Reforms’, Productivity Commission, December 2011.
22 Productivity Commission, ‘Identifying and Evaluating Regulation Reforms’, December 2011.
23 Linked to a 2001 Organisation for Economic Co-operation and Development survey used by the Productivity Commission and, subject to some scope, coverage and definitional issues, a 2011 survey by the Australian Industry Group, also cited by the Productivity Commission.
40 Get out of your own way | Unleashing productivity
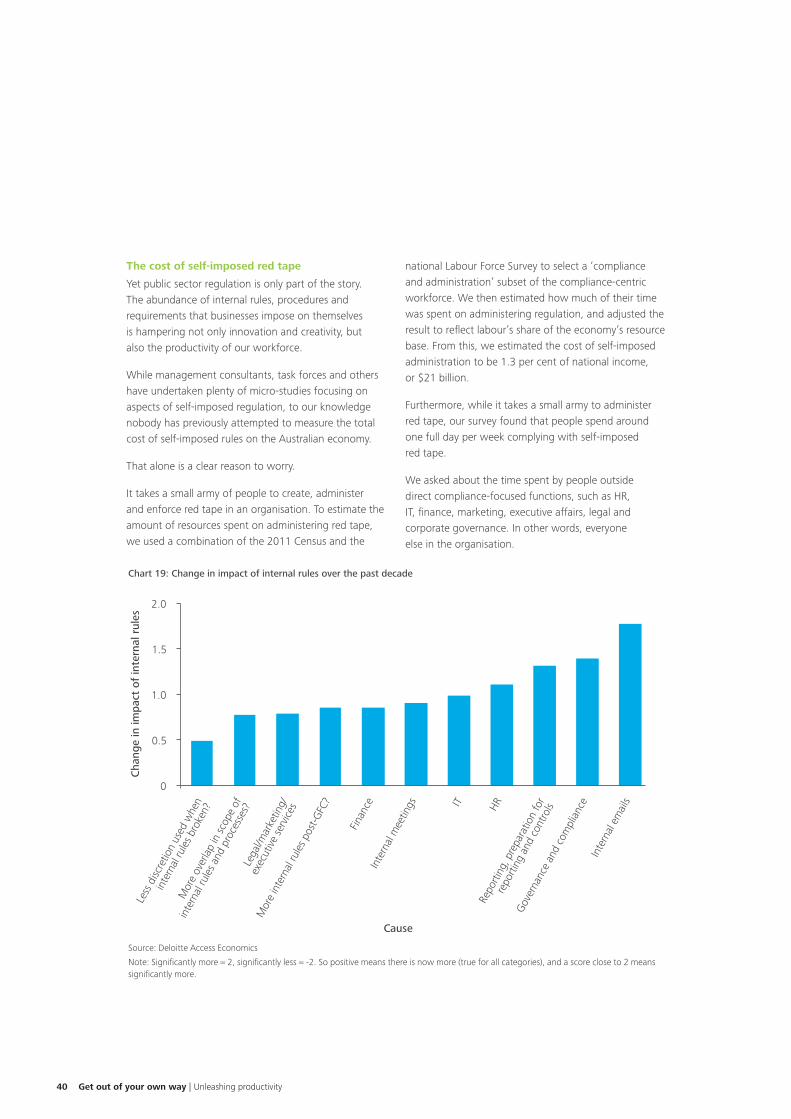
Chart 19: Change in impact of internal rules over the past decade
0
0.5
1.0
1.5
2.0
Less
disc
retio
n us
ed w
hen
inte
rnal
rule
s bro
ken?
Mor
e ov
erla
p in
scop
e of
inte
rnal
rule
s and
pro
cess
es?
Lega
l/mar
ketin
g/
exec
utive
serv
ices
Mor
e in
tern
al ru
les p
ost‐G
FC?
Finan
ceIn
tern
al m
eetin
gs IT HRRe
porti
ng, p
repa
ratio
n fo
r
repo
rting
and
con
trols
Gov
erna
nce
and
com
plia
nce
Inte
rnal
em
ails
Cha
nge
in im
pact
of
inte
rnal
rul
es
Cause
Note: Significantly more = 2, significantly less = -2. So positive means there is now more (true for all categories), and a score close to 2 means significantly more.
Source: Deloitte Access Economics
The cost of self-imposed red tape
Yet public sector regulation is only part of the story. The abundance of internal rules, procedures and requirements that businesses impose on themselves is hampering not only innovation and creativity, but also the productivity of our workforce.
While management consultants, task forces and others have undertaken plenty of micro-studies focusing on aspects of self-imposed regulation, to our knowledge nobody has previously attempted to measure the total cost of self-imposed rules on the Australian economy.
That alone is a clear reason to worry.
It takes a small army of people to create, administer and enforce red tape in an organisation. To estimate the amount of resources spent on administering red tape, we used a combination of the 2011 Census and the
national Labour Force Survey to select a ‘compliance and administration’ subset of the compliance-centric workforce. We then estimated how much of their time was spent on administering regulation, and adjusted the result to reflect labour’s share of the economy’s resource base. From this, we estimated the cost of self-imposed administration to be 1.3 per cent of national income, or $21 billion.
Furthermore, while it takes a small army to administer red tape, our survey found that people spend around one full day per week complying with self-imposed red tape.
We asked about the time spent by people outside direct compliance-focused functions, such as HR, IT, finance, marketing, executive affairs, legal and corporate governance. In other words, everyone else in the organisation.

Get out of your own way | Unleashing productivity 41
As summarised earlier in this report, the results showed middle managers and senior executives spend 8.9 hours a week complying with the rules that organisations set themselves, with the remainder of the workforce spending 6.4 hours complying.
Accounting for the share of labour in the Australian resource base – and thereby notably and conservatively reducing the size of our estimate – this translates into a cost to the economy of 8.4 per cent of national income, or a simply stunning $134 billion every year.
What is that time spent on? The survey indicated that there have been increases in every single one of the areas we asked about. Chart 19 depicts how the time spent on a variety of internal functions has changed over time. The chart is set to an index score of zero equalling ‘no change’, and all the functions show up as positive, meaning that their burden has risen over time.
There’s a monster out there.
Efficiency costs of red tape
In case you’ve lost count, the costs we’ve estimated so far amount to a staggering quarter of a trillion dollars a year.
This means Australians have to work for eight weeks each and every year just to pay for the administration and compliance costs of the rules we set ourselves.
To be clear, these rules – both those set by governments and those self-imposed by organisations – come with big benefits too. Yet the cost bucket has grown incredibly fast, and Australia isn’t getting good value from the cost of its rules.
A cost saving of just 10 per cent of that total (without a net loss of the matching benefits of rules) would equal 1.6 per cent of national income, ranking its impact with some of the largest reforms Australia has ever seen.
Yet even that is a considerable underestimate, because we’ve left the worst cost to last.
Every extra rule comes with a hidden cost. As we’ve touched on earlier, rules don’t simply cost money to administer and comply with. Rules also sap incentive, innovation and enterprise.
The Productivity Commission’s 2011 summary is that:
“The costs arising from the effects of regulation on incentives and other distortions are harder to estimate. However, limited evidence suggests that these costs can be larger than compliance costs. Based on a regression analysis of a World Bank indicator of regulatory quality, the United States Small Business Administration estimated the total cost of US regulations at US$1.2 trillion in 2008 (around 8.5 per cent of GDP) (Crain and Crain 2010). In addition, estimates of efficiency benefits from previous reforms of regulation have been large – for example, the Commission has estimated that real GDP was about 2.5 per cent higher as a result of National Competition Policy (NCP) reforms to utilities and infrastructure (PC 2005b).”24
This drag on efficiency – and its corresponding erosion of potential – is probably the biggest single cost bucket of all.
It is nearly impossible to accurately estimate the efficiency cost of regulation, so we haven’t tried.
To be clear, however, the dollars we’ve already conservatively identified are of a scale that make the fundamental point anyway – that Australia has a big problem, and that businesses, families and governments can make huge savings if we check the sense and sensibility of the rules we’ve set ourselves.
24 Productivity Commission, ‘Identifying and Evaluating Regulation Reforms’, December 2011.
The abundance of internal rules, procedures and requirements that businesses impose on themselves is hampering not only innovation and creativity, but also the productivity of our workforce

42 Get out of your own way | Unleashing productivity
Yet we haven’t ignored efficiency costs, and you shouldn’t either. Although they may be hard to quantify – and although that is even more true of self-imposed rules – we’d agree with the Productivity Commission that this is the largest single source of costs associated with rules and rule-making – whether those rules are being set by governments, or are self-imposed by corporates.
Some of these efficiency costs are a result of specific regulations that stifle incentives and restrict efficiency. For example, employers taking on apprentices face unnecessary regulation when rules differ between jurisdictions, or responsibilities overlap between federal and state and territory governments. Such costs impede employers’ abilities to take on additional apprentices, causing an under-investment in the vital skills needed to underpin national income now and in the future.
Another example involves restrictions on retailers. The retail sector is one of the largest single contributors to our economy, yet trading hour and product restrictions directly affect business costs, innovation, and the choice and convenience retailers can offer their customers. The direct impact of trading hour restrictions is becoming increasingly worse now that stores compete against online retailers from which customers can purchase products at any time.
But the bigger issue here is those costs that are harder to see. By removing unnecessary rules and regulations, the right incentives can enable both businesses and individuals to unleash the productivity and innovation needed to drive growth.
In some cases, that means pursuing specific reforms to take advantage of the benefits on offer. For example, in 2013, Deloitte Access Economics reviewed the regulatory burden faced by the food and groceries manufacturing sector. By implementing what were judged to be some of the more readily achievable reforms, we calculated that Australia could recover $243 million of national income in that industry alone.25
More broadly, less red tape can mean more flexible and dynamic businesses and a stronger Australian economy. Too many rules mean less innovative products, business models and approaches to service delivery, limiting the
behaviour and ambitions of businesses and workers. It is these creative innovations that lie at the heart of growth in incomes and living standards over time.
Simply allowing enterprise and imagination to shine can produce the kind of outcomes that can seem impossible to those mired in overbearing rules.
Not only does deregulation help to foster growth, but the flexibility it provides can make businesses and the economy more resilient in times of trouble, and better placed to capitalise on the waves of opportunity that are already emerging. It also supports the development of the right skills, so Australia has the labour force it needs to be globally cost competitive.
However, to properly capitalise on this opportunity and make Australia truly ‘open for business’, we need to remove excessive regulation and create an environment that develops the right skills and is competitive enough to seize the global opportunities on offer.
Reducing risks and returns in the boardroom
Arguably, the biggest increase over time in regulatory burdens has been on Australia’s board members and senior executives.
The much-maligned Corporations Act 2001 runs to a remarkable 2,500 pages, and company directors face thousands of offences under liability provisions. And that’s just at the federal level: some states can’t say how many offences apply to directors in their legislation.
The Business Council of Australia has estimated that directors are exposed to liability under more than 560 laws.26 Some of these laws cover areas in which directors can make a big difference, such as their duty to prevent insolvent trading or insider trading. Yet in other cases, notably work health and safety provisions, directors may be liable regardless of whether they could have done anything to prevent the damage or loss. Furthermore, the law offers few defences or ‘safe harbours’ against allegations of director liability.
25 Deloitte Access Economics, Reforming regulation of the Australian food and grocery sector, 2013.
26 Australian Institute of Company Directors, ‘AICD welcomes progress on review of directors’ liabilities’, media release, 18 December 2008.

Get out of your own way | Unleashing productivity 43
Directors can now be found jointly and individually liable for a broad number of breaches. In addition, the required standard of conduct has been raised: directors are now held to the standard of ‘a reasonable person in their position’ rather than merely ‘a reasonable person’, while the protection afforded by a limited-liability corporate structure has been eroded.
The business environment has also become increasingly litigious, more competitive, less collaborative and more marked by the activities of litigation funders.
This isn’t just a hard luck story – there is an important balance here that affects the welfare of all Australians. When you change incentives, you change behaviours.
A 2008 survey of company directors found that two-thirds of respondents believed heightened personal liability had seen boards become overly cautious, with obvious implications for risk-taking and entrepreneurship in Australia’s economy.27
Simply put, if company boards and directors have to bear too much risk, they will cut back on their entrepreneurial activities and reduce their appetite for innovation within the organisations they oversee. Multiply that across the Australian economy as a whole, and the resultant reduced returns – lower wages and profits – are likely to be substantial. There are also hidden costs here: too much time spent on corporate governance means that not enough time is spent on corporate strategy.
27 Survey, Treasury, Australian Government, see: http://archive.treasury.gov.au/content/Company_Directors_Survey/SurveySummary.html.
28 Edmund Phelps, Mass Flourishing, Princeton University Press, 2013.
29 Philip Lowe, Deputy Governor, Reserve Bank of Australia, ‘Demographics, Productivity and Innovation’, speech to The Sydney Institute, 12 March 2014.
Edmund Phelps and the Reserve Bank: rules are stifling innovation
Nobel Prize–winning economist Edmund Phelps blames the slowdown in productivity growth in Australia and around the world on governments and corporations which are setting rules – and a culture – that stifles the desire and incentives for innovation.28
Similarly, Philip Lowe of the Reserve Bank of Australia, recently said:
“... innovation requires someone to take a risk … [Yet] we increasingly focus on risk mitigation and risk control [in] the nature of the legislation that parliaments pass, to the increase in compliance activities in the nation’s boardrooms, to the amount of money we are prepared to spend to limit the probability of blackouts and even to our attitudes about the design of children’s playgrounds.
“… I am not saying that this is necessarily a bad thing … But, at least in my opinion, it is appropriate occasionally to ask whether we have got the balance right. Reducing risks is not always cost-free – resources need to be devoted to the task and this means that these resources cannot be used for other tasks. And perhaps even more importantly, it might also be the case that a more risk-averse society is naturally less inclined to support and finance innovation, to implement new processes and to apply new technologies. If this is indeed the case, it has implications for future productivity growth.
“… [In addition] it is not yet possible to know what the net effect of ageing will be on our attitude to risk and innovation. But, if ageing societies do become inherently more risk averse and less supportive of innovation – as I suspect they might – then we are likely to face a greater challenge than we have to date in generating productivity growth.”29

Part V
How to get out of your own way

46 Get out of your own way | Unleashing productivity
How to get out of your own way
All organisations want to maximise their returns for a given level of risk.
If they succeed, then so does Australia, because increased returns lift productivity and generate the growth in living standards to which we’ve become accustomed.
Similarly, if corporate Australia sets itself the right rules, our economy will become more flexible and better equipped to deal with important risks.
Given that our public and private sector rules and regulations cost a quarter of a trillion dollars a year in administration and compliance expenses alone, there are huge potential pay-offs here. Yet they’ll have to come one organisation at a time. After all, where individual organisations are today on their risk-return trade-offs is very much a result of the rules they’ve imposed on themselves.
Those rules aren’t usually a triumph of carefully thought-through business strategies. Rather, they’re typically just the mess left over from many years of coincidence, compromise, convenience and regulatory power plays. Even good rules can get buried under ever-deeper layers of past practice.
We can do better than that. In this final section, we discuss how all organisations can streamline and sharpen their rules to cut administrative and compliance costs while boosting their capacity to take risks in pursuit of better returns.
To be clear, we don’t advocate that organisations operate without rules. Rather, we’re advocating using the right rules to keep organisations safe and on track, while preserving the resources and freedom to do the things they want and need to do to achieve their goals.
Getting your rules right
There are five practical steps – the 5C’s – that any organisation can take to address the problems we’ve identified in this research.
But before we can take these practical steps, it has to become personal. Executives and boards need to understand why they want to embark on this process. Is it merely to cut costs? Or is it more fundamental, such as overcoming key constraints to growth, deconstructing
initiatives designed to create a false sense of stability – or even as fundamental as ensuring the survival of the organisation? The real reasons will determine the level of resolve to do something about the rules. It will be a long and hard journey, but a valuable one.
1. Cleanse
Start by slashing the stupidity. Like tidying up after a party, walk around the business with a garbage bag and throw out all the obviously pointless or destructive rules.
Look first for those that generate high compliance costs while delivering little business value. To discover those, just ask the people who are most affected – your staff, especially those on the front lines – by running a campaign to ask “What are the dumbest things we do?”.
Case management creates more costs
In something of a rules double whammy, companies that find themselves in the courts are not only paying a price for the complexity of the legal system but also the administrative overhead that comes with managing their involvement in it.
The Chief Justice of the Federal Court James Allsop recently said that the trend towards case management – using software tools and processes designed to help law firms and companies manage litigation – may actually be adding more to costs than they’re saving.
“There is a particularly bitter irony where case management undertaken specifically to curb costs in fact adds to them,” the Chief Justice has said.30
On the one hand, some case management is simply being handled poorly and not helping litigants to streamline their approaches. More subtly, the Chief Justice suggests the excessive use of case management can see lawyers “abdicate their statutorily mandated responsibility to resolve disputes in a cost-effective manner for their clients”.
30 Hanna Low, ‘Professionals to blame as legal expenses soar’, The Australian Financial Review, 19 September 2014.

Get out of your own way | Unleashing productivity 47
Acting on the answers should provide quick wins that staff members will appreciate while signalling that your organisation is serious about unleashing productivity, innovation and enterprise.
Once that’s done, it’s time to embark on a more systematic analysis of what’s going on in your organisation.
2. Challenge
Challenge your current rules. Stop asking “What could go wrong?” and instead ask “What must go right?”
Many organisations get themselves in a pickle over rules as they focus on what could possibly go wrong, and then seek to impose rules to control every one of those potential issues. Given so much can go wrong, this can lead to a lot of rules – and it is often the sheer accumulation of those rules that creates the most problems. Focusing instead on what must go right allows for a dramatic reduction and simplification of any organisation’s rules (see Figure 2).
That simple change in focus allows you to challenge the way you think about the entire role of rules.
The following ‘rules for rules’ present a group of basic questions to ask to determine if a given rule is worth what it is costing your organisation in employee time and money. If not – if the costs of some of your rules still don’t match their benefits – then dump those ones too.
Rules for rules
• Why do we need this rule?• Is there a better way?• Does the rule overlap with others?• Are staff unclear about which rule has
the higher priority?• Is the rule easy to understand and follow?• Are there opportunities to standardise our
processes and forms?• Is the rule still relevant and worth enforcing?• How much flexibility is available? • Is there a better way to get the same or a
better outcome?
These basic questions will be contextual and depend on the real reasons for embarking on this journey. Start with the questions that best reflect the situation of your organisation: is it growth challenged, capacity challenged, survival challenged or externally challenged? External rules and regulations are normally the same for all competing organisations. The real issue is often how these are interpreted and applied.
3. Create
So you have ‘cleansed’ and ‘challenged’. The next step is to create a culture and behaviours that are focused on both performance and compliance – aligning your organisation’s rules with its business objectives.
Figure 2: Focus on what must go right, instead of what could go wrong
What must go right (objective-based)
Objective 1 Objective 2 Objective 3 Objective 4
Rule 1 Rule 2 Rule 3
Rule 4 Rule 5
Rule 6 Rule 7
Rule 8 Rule 9
Rule 10
Everything that can go wrong (risk-based)
Risk 1 Rule 1 Rule 2
Risk 2 Rule 3 Rule 4 Rule 5
Risk 3 Rule 6 Rule 7 Rule 8
Risk 4 Rule 9
Risk 5 Rule 10 Rule 11 Rule 12
Risk 6 Rule 13 Rule 14

48 Get out of your own way | Unleashing productivity
Think of rules as tools that help any organisation pursue maximum return for minimum risk with current capacity. That means the key to successfully managing your rules is to identify both excess red tape and areas of exposure – striking a balance between having too many rules and too few, while also focusing on quality.
Simplify for a moment. Imagine you’ve decided how much risk your organisation is willing to take. That reduces the ‘rules equation’ to simply striking the right balance between rules and returns, as shown in Figure 3.
For a given level of risk, if firms have ‘too few’ rules – that is, they are on the left-hand side of this chart – then that Wild West approach exposes them to problems that may reduce their returns.
Equally, if they are on the right-hand side of the chart, then the rules themselves have become part of the problem rather than part of the solution, and they potentially choke their rate of return.
A key point of this report is that the last decade saw more and more Australian organisations smother themselves in new rules – entrenching themselves firmly on the right-hand side of this chart.
By taking risk out of the equation, the above simplifies to a message of ‘getting the balance right’ on your self-imposed rules. Yet that balance will differ depending on the risks your organisation faces, and how you want to approach them:
• Risk appetite: More risk-averse organisations will generally have more or tighter rules, whereas more entrepreneurial outfits will have the opposite
• Business environment: Businesses that operate in inherently riskier markets usually require more rules. That’s why airlines require more rules than bus lines
• Rule quality: The quality of rules matters vitally. The better the rules, the greater the returns an organisation can unleash for a given degree of risk
• Capability: Prior strategies and development activities should have created a higher organisational capability and capacity to take risk, not left it crippled or frustrated by old rules. Understand what you have today.
Case study: Cutting the cost of IT-related rules
The rules environment that a business had developed over time to manage risk in its IT systems had grown like ivy over a number of years. Deloitte worked with the company to move from focusing on 64 things that could go wrong to 12 things that must go right.
This included identifying 29 rules that mapped critical risks to the organisation’s core objectives, then eliminating or streamlining the rest.
With the new environment in place, the time required for internal and external audit to scope the company’s audit activities fell by 80 per cent in the first year. The time taken to complete those audits dropped by one-third, freeing up management staff to focus on operational activities.
This change to a rules establishment culture has seen the business apply the same thinking to other processes where there is an opportunity to maximise productivity potential.
Figure 3: The trade-off between returns and rules
Rules
Ret
urns
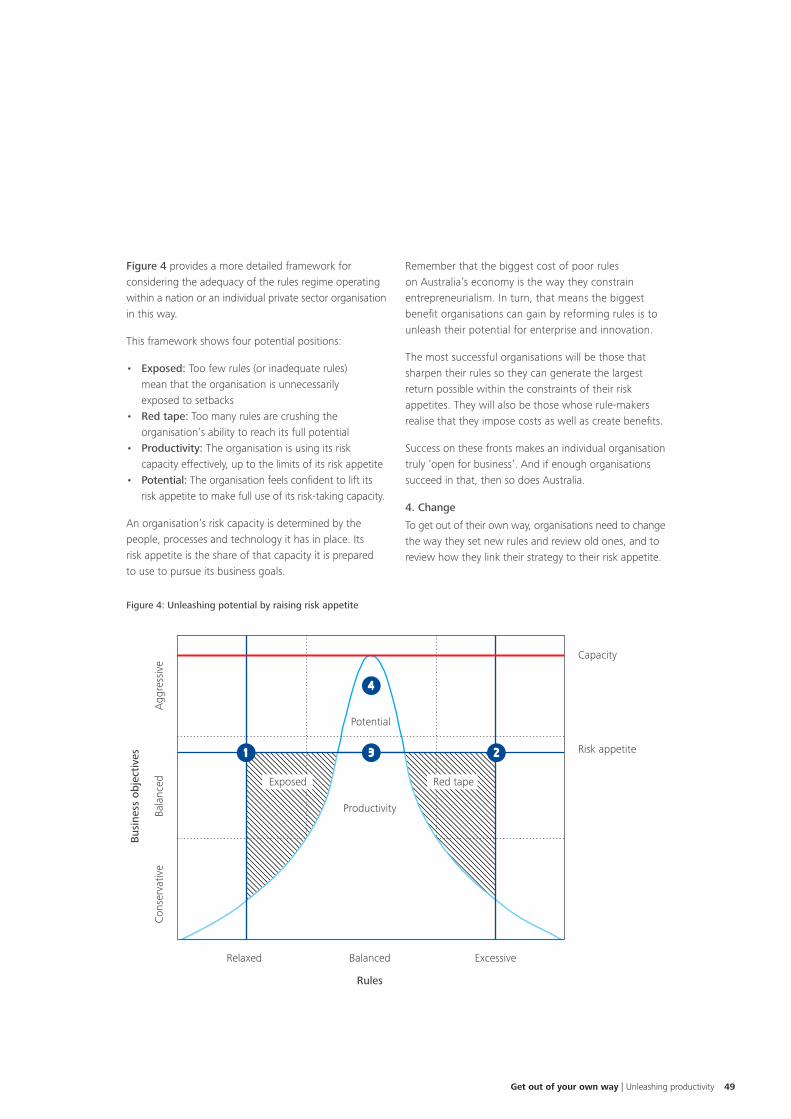
Get out of your own way | Unleashing productivity 49
Figure 4 provides a more detailed framework for considering the adequacy of the rules regime operating within a nation or an individual private sector organisation in this way.
This framework shows four potential positions:
• Exposed: Too few rules (or inadequate rules) mean that the organisation is unnecessarily exposed to setbacks
• Red tape: Too many rules are crushing the organisation’s ability to reach its full potential
• Productivity: The organisation is using its risk capacity effectively, up to the limits of its risk appetite
• Potential: The organisation feels confident to lift its risk appetite to make full use of its risk-taking capacity.
An organisation’s risk capacity is determined by the people, processes and technology it has in place. Its risk appetite is the share of that capacity it is prepared to use to pursue its business goals.
Remember that the biggest cost of poor rules on Australia’s economy is the way they constrain entrepreneurialism. In turn, that means the biggest benefit organisations can gain by reforming rules is to unleash their potential for enterprise and innovation.
The most successful organisations will be those that sharpen their rules so they can generate the largest return possible within the constraints of their risk appetites. They will also be those whose rule-makers realise that they impose costs as well as create benefits.
Success on these fronts makes an individual organisation truly ‘open for business’. And if enough organisations succeed in that, then so does Australia.
4. Change
To get out of their own way, organisations need to change the way they set new rules and review old ones, and to review how they link their strategy to their risk appetite.
Figure 4: Unleashing potential by raising risk appetite
3
4
1
Capacity
Risk appetite
Rules
Balanced
Bala
nced
Bus
ines
s ob
ject
ives
Agg
ress
ive
Con
serv
ativ
e
ExcessiveRelaxed
Productivity
Potential
2
Red tapeExposed

50 Get out of your own way | Unleashing productivity
When it comes to reinventing your rule-setting regime to ensure the organisation can maintain the right balance, you need to run through a simple checklist:
• Has our attitude to risk changed? If so, new rules might be needed to manage existing risks
• Are we facing greater risk? When risks are on the rise, it can be useful to carefully alter or add to your mix of rules
• Are we facing new risks? Changes in the business environment and developments in technology can mean new rules are needed to cover new risks, or that existing rules have become outdated or in need of a spring clean – their costs now outweigh their benefits and they are past their use-by date.
As Thomas Jefferson so succinctly put it, the price of liberty is eternal vigilance. Don’t let today’s good rules morph into tomorrow’s problems.
5. Capitalise
You are now ready to capitalise on all your work.
You’ve cleansed the existing rule book, challenged and improved those rules that remain, created a culture of performance rather than compliance by ensuring rule-makers are aware they generate costs as well as benefits, and changed the way you set new rules and review old ones.
Doing all that has unleashed new productivity potential – your staff can now generate extra profits while better controlling the risks that matter.
Figure 5 brings these five steps – the 5C’s – together, setting out the specific actions required across three levels:
• Tactical: Identifying and removing or improving day-to-day rules
• Functional: Looking for opportunities to streamline processes and cut compliance costs in functions such as HR, finance and IT
• Strategic: Addressing the key drivers of future compliance costs and productivity.
Figure 5: Reforming rules at a tactical, functional and strategic level
Cleanse Challenge Create Change Capitalise
Objectives
Slash the stupidity: remove your worst rules
Switch to ‘what must go right’ from ‘what could go wrong’
Focus culture on performance, not compliance
Change the way new rules are set and old ones audited
Use your new capacity to unleash productive potential
Strategic
Let employees know you want to get out of their way
Address key drivers of future compliance and productivity
Align risk appetite and risk capacity
Influence industry and government regulations
Grow and perform
Functional
Clarify who is responsible for which rules
Streamline processes and rules and address overlaps
Align process efficiency and generational excellence
Influence your ecosystem
Boost productivity
TacticalAsk what are the ‘dumbest things’ we do
Identify and exit low-value rules
Align existing rules
Influence internal rule setting
Focus on administration and compliance

Get out of your own way | Unleashing productivity 51
The next steps for government and business
This report largely merges our discussion of government and business.
And so we should. Even though the former imposes rules on the latter, both sides face the same issues and strategic choices, and both are – hopefully – working towards the same ultimate goal of making Australia more prosperous.
However, there are three vital areas where government is in a unique position to make a difference:
• First, it can get its own house in order by improving Australia’s current regulatory regime. That should include robust steps to identify rules and rule-making bodies, assess their value, and then streamline and improve regulatory arrangements
• Second, government can help business to get out of its own way. Although governments can directly help to make Australia ‘open for business’, much of that task has to fall to individual businesses. So we believe government can encourage Australian corporates to
unlock serious international competitive advantage by focusing on the not-so-sexy but super-expensive problem of red tape
• Third, it can apply the 5C’s set out above to the way it operates. By challenging its own internal rules, government can generate the same productivity benefits as businesses.
As a nation, we’re wrapped up in red tape. Something must be done, and government – as rule-maker in chief – is in a strong position to fix the backyard we all share, set an example, and promote best practice in its own operations and across the economy.
Yet that doesn’t let businesses and other non-government organisations off the hook. As we’ve shown in this research, the largest part of Australia’s annual compliance cost comes from the rules private sector organisations impose on themselves rather than those from governments.
If those organisations really want to get ahead, they could start by getting out of their own way.
Both sides face the same issues and strategic choices, and both are – hopefully – working towards the same ultimate goal of making Australia more prosperous

Appendix I

Get out of your own way | Unleashing productivity 53
Growth in compliance workers by sector and state
Chart A1: Compliance workers – importance, growth and size of sector
The higher a sector is on the chart, the larger the share of compliance occupations in its total workforce. The further to the right on the chart, the faster the growth in the share of compliance occupations. Bubble size reflects the size of the sector in terms of output.
0%
5%
10%
15%
20%
25%
0% 5% 10% 15% 20%
Com
plia
nce
wor
kers
’ sha
re o
f w
orkf
orce
, 201
1
Growth in compliance workers’ share of workforce, 2006–11
Agriculture
Manufacturing
Utilities
Construction
ICT
Property
Professionalservices
Health
Wholesale
Mining
Finance
Education
Transport
This appendix discusses in greater detail some of the sectoral trends noted in the main body of the report, and also includes differences found at the state level.
Finance
The rapidly rising compliance burden in the finance sector won’t come as a surprise to those at the coalface. This sector is tightly regulated, through public sector rules and its own internal checks and balances.
But it is the pace of increase in this burden that particularly stands out. In fact, one-third of all employment growth in the finance sector from 2006 to 2011 was made up of compliance workers.
This has created an enormous cost for banks and other financial institutions. As discussed in this report, NAB estimates that it will spend $265 million complying with regulation in 2014 – a figure that has tripled over the past three years.
Worse still, the scale of the problem has leapt further since the 2011 data highlighted in Chart A1, and the legislative and regulatory tinkering currently underway suggests that there’s worse to come.
Then again, that’s just the impact of public sector rules. Here too, self-imposed rules are biting. Indeed, big organisations – whether public or private – tend to have the most rules, and the finance sector includes some pretty big players.

54 Get out of your own way | Unleashing productivity
Professional services
The professional services sector encompasses a very diverse bunch, including lawyers, accountants, management consultants, tax advisers, advertisers, IT workers and marketers. This sector has an added layer of complexity because many members of this group (for example, the lawyers and accountants) also provide compliance services for others (as does the administrative services sector).
In other words, one facet of the success of this sector has been its ability to efficiently handle the compliance needs of corporates – otherwise many of these costs would weigh even more heavily on the living standards of Australians.
Remember that international requirements are also important here. For example, US public sector rules (think Sarbanes-Oxley and the various requirements of the Securities Exchange Commission) have a big impact. Many of the large players in this sector are in international alliances or are subsidiaries of global companies, meaning that many professional services providers in Australia have to follow rules written by governments or corporates elsewhere.
It’s no wonder then that almost one in every four new workers in the professional services sector from 2006 to 2011 was a compliance worker.
Utilities
Carbon pricing. Mandatory targets for renewable energy. Submitting requested price increases for regulatory review. Requirements to avoid blackout risks that have led to the ‘gold plating’ of infrastructure – with attendant costs for families and businesses.
The costs of the rules we apply to the utilities sector are huge and well known, and the source of regular front-page news. These are mostly efficiency costs. It is also unsurprising that Chart A1 shows this sector has an above-average regulatory compliance burden, placing it into the top-left quadrant.
The good news is that the sector’s regulatory burden grew more slowly in recent years and, regardless of views on the carbon tax, its abolition brought a compliance dividend. Yet that dividend will be smaller than imagined, in part because key players have just been handed new obligations to justify pricing changes around the carbon tax’s removal.31
31 Mark Ludlow, ‘Electricity and gas companies facing more red tape’, The Australian Financial Review, 15 July 2014.
Health and safety: from ticking boxes to changing cultures
Few issues are more vital than safety, so there’s a clear role for both public regulation and private rules to ensure the right outcomes. But are we doing it right?
Many businesses blame official regulators for creating unnecessary barriers that impede production and profits. These flow on to a plethora of safety ‘activities’ including hazard reporting, health and safety committee meetings, risk assessments, setting targets to reduce lost time injuries and collecting data to comply with audit requirements.
Yet, while many organisations are busy ‘doing’ safety, all too often they are just ticking boxes. Deloitte’s experience suggests that it is the cumbersome and voluminous nature of an organisation’s own systems and internal rules that create the biggest problems.
Instead of becoming their own worst enemies, organisations should stop compliance regimes driving their safety goals and instead work the other way around: promoting a collaborative culture that aims to send workers home safely at the end of each day.
The proactive management of health and safety at work is a true business driver, rather than something separate to it, and doing it right – setting the right internal rules – can often both improve safety and cut costs relative to current practice.

Get out of your own way | Unleashing productivity 55
Mining and construction
The bottom-right quadrant of Chart A1 displays sectors where compliance burdens aren’t currently high, but are rising fast. The chart shows that there have been massive increases in the relative size of the compliance workforce in the mining and construction sectors in recent years.
Note that this is a relative measure. Yes, mining jobs leapt in the five years to 2011, and job gains were above average in construction too. But Chart A1 measures relative gains – in 2006 some 7.6 per cent of the mining workforce were compliance workers, but that rose to an 8.9 per cent share by 2011. The relative gain in that share is the 16 per cent mapped in the chart.
That increase in the compliance load in mining and construction has generated many benefits. To pick an obvious one, these sectors have engineered considerable success on the safety front for their workers.
Yet that isn’t all that’s going on here. Mining and construction grew faster than the average sector from 2006 to 2011, and also enjoyed faster-than-average
profit gains. Other things being equal, that made these sectors more vulnerable to regulation risks. Governments saw cashed-up companies and added a bunch of new rules, such as the sector-specific ‘water trigger’ now in federal environmental legislation.
Governments also rewrote the rulebook around the hurdles mining businesses must clear to hire temporary workforces to meet temporary construction booms in remote Australia, and added new red tape on sourcing decisions for major projects. As the Minerals Council of Australia notes, an example of the resultant compliance impact is that the average Australian thermal coal project experiences an extra 1.3 years in approval delays relative to similar projects elsewhere.32
There are also examples of rules overload in the construction industry, which has long complained (and with good reason) of burdensome regulation. While the Productivity Commission has previously investigated the excessive and varied planning laws across the country, the industry is also beset with costly reporting requirements.
32 Minerals Council of Australia, Opportunity at Risk: Regaining our Competitive Edge in Minerals Resources, 2012.
It’s no wonder then that almost one in every four new workers in the professional services sector from 2006 to 2011 was a compliance worker

56 Get out of your own way | Unleashing productivity
Trends in the ‘safe zone’
We’ve dubbed the bottom-left quadrant in our analysis the ‘safe zone’ – where compliance costs are lower than average, and so too is the relative growth in those costs.
However, there’s an important point to make up front. Ignoring the catch-all group of ‘other services’, we examined 18 sectors in detail. Only four of those 18 saw the share of their workforces in compliance roles shrink in the five years to 2011: accommodation and food, administrative services, arts and recreation, and retail. And in all four of those cases, the declines were marginal.
In other words, if a sector shows up at all in Chart A1 – even in the ‘safe zone’ – then that means a rising share of the sector’s staffing is in compliance workers.
Moreover, to note the compliance burden is easing marginally in sectors such as retail isn’t to say that there are no issues there. Rather, the biggest issues aren’t ones of compliance but of efficiency: the buckets of costs that we know to be big but can’t readily quantify.
For example, retail tenancies and trading hours continue to be excessively regulated by Productivity Commission standards and severely over-regulated by international standards. The Commission found:
“The regulations and agencies involved in planning, zoning and development assessments constitute one of the most complex regulatory regimes operating in Australia. This regulatory system is not like most other regimes which have a clearer delineation between policymaking, regulation writing and administration.”33
Similarly, the Business Council of Australia’s submission to the current Harper Review of competition laws and policy notes that, in Western Australia:
“Hardware stores cannot open before 11:00am on Sundays if they stock both light bulbs and light fittings ... Light bulbs, yes, light fittings, no. A petrol station can sell pantyhose after 9:00pm on Thursdays – but it is illegal to sell underpants. A petrol station can sell film and flash bulbs on Sundays before 11:00am – but not a digital camera’s memory card.”
The accommodation and food sector also suffers greatly from the shape-shifting labyrinth that is Australia’s food labelling and marketing regulations.
33 Productivity Commission, ‘Performance Benchmarking of Australian Business Regulation: Planning, Zoning and Development Assessments’, April 2011.
Chart A2: State and territory compliance sector intensity
50%
100%
150%
200%
250%
Index: Australia = 100%
Tas SA Qld WA
State
Vic NSW NT ACT
Com
plia
nce
inte
nsit
y

Get out of your own way | Unleashing productivity 57
State and territory trends
Another way to look at the growth in our burgeoning compliance industry is by state and territory.
There’s no surprise that Canberra is Australia’s compliance capital. Chart A2 shows Canberrans are 2.5 times more likely to be working in compliance roles than is true of the nation as a whole.
Both NSW and Victoria are on the national average, with NSW boosted by its strong finance sector (an industry with a number of compliance functions) and Victoria boosted by its relatively strong professional services sector (including accountants and lawyers).
Like the ACT, the Northern Territory is above the average. However, the underlying reason isn’t that both are relatively small jurisdictions, as the next two smallest – Tasmania and South Australia – are at the other end of the scale.
Although the ACT is Australia’s compliance capital, the compliance burden is on the rise in other parts of Australia. That increase (displayed in Chart A3, where the bubble size reflects the size of state and territory economies) has been notable in the Northern Territory (where the federal intervention that began in 2007 is likely to have played a role) and in Queensland and Western Australia (our data looks at changes between 2006 and 2011).
Those state patterns are also consistent with the industry findings noted above. With compliance employment growing particularly rapidly in the likes of construction and mining, it is no surprise that Western Australia and Queensland (two states where mining and related construction grew fast in the five years to 2011) have also seen their compliance load climbing – as Chart A3 shows.
Chart A3: State compliance sectors (excluding the ACT)
7%
8%
9%
Com
plia
nce
wor
kers
’ sha
re o
f w
orkf
orce
, 201
1
Growth in compliance workers’ share of workforce, 2006–11
10%
11%
2% 4%
TasSA
NSW
Vic
WAQld
NT
6% 8% 10% 12%
The higher a state or territory is on the chart, the larger the share of compliance occupations in its total workforce.The further to the right on the chart, the faster the growth in the share of compliance occupations.Bubble size reflects the size of the state or territory in terms of output.

Appendix II

This appendix describes how Deloitte Access Economics estimated the cost of regulation for each of the four key cost categories we have estimated.
Public sector rules:
1. The cost to taxpayers of creating, administering and enforcing public sector regulation.
2. The costs to individuals, businesses and the public sector of complying with public sector regulation.
Self-imposed rules:
3. The cost to businesses and the public sector of creating, administering and enforcing regulations imposed on themselves.
4. The cost to businesses and the public sector of complying with their own rules and procedures.
Administrative cost of public sector regulation
The administration cost associated with public sector regulation represents how much it costs the government
to administer and enforce public sector rules. This estimate is based on the share of the total expenditure that 49 different federal government departments and agencies are expected to spend on administering public sector regulation.
For example, we have allocated all of the expenditure of the likes of the Australian Securities and Investments Commission, the Department of Parliamentary Services and the Clean Energy Regulator to administrative costs of implementing federal regulation, whereas small or zero shares were applied to the running costs of the likes of the Bureau of Meteorology, the Australian War Memorial and the Department of Veterans’ Affairs.
The list of departments and agencies and their allocated administration weights are presented in Table A1.
Costing methodology
Get out of your own way | Unleashing productivity 59
Table A1: Administrative burden of regulation by federal departments and agencies
Department Administrative weight
Department of Agriculture 20%
Grains Research and Development Corporation 0%
Attorney-General’s Department 75%
Australian Federal Police 20%
Australian Security Intelligence Organisation 75%
Family Court and Federal Circuit Court 90%
High Court of Australia 90%
National Archives of Australia 0%
National Gallery of Australia 0%
National Library of Australia 5%
National Museum of Australia 0%
Australian Broadcasting Corporation 0%

60 Get out of your own way | Unleashing productivity
Department Administration weight
Australian Communications and Media Authority 100%
Department of Communications 50%
Special Broadcasting Service Corporation 0%
Australian War Memorial 0%
Defence Housing Australia 0%
Defence Materiel Organisation 5%
Department of Defence 5%
Department of Veterans’ Affairs 5%
Australian Research Council 100%
Department of Education 75%
Department of Education, Employment and Workplace Relations 50%
Comcare 80%
Department of Employment 50%
Bureau of Meteorology 0%
Clean Energy Regulator 100%
Department of the Environment 80%
Australian Electoral Commission 50%
Department of Finance 25%
Future Fund Management Agency 5%
Australian Trade Commission 50%
Department of Foreign Affairs and Trade 5%
Australian Sports Commission 10%
Department of Health 50%
National Blood Authority 50%
National Health and Medical Research Council 50%

Get out of your own way | Unleashing productivity 61
Department Administration weight
Australian Customs and Border Protection Service 100%
Department of Immigration and Border Protection 100%
Australian Nuclear Science and Technology Organisation 25%
Australian Renewable Energy Agency 25%
Commonwealth Scientific and Industrial Research Organisation 10%
Department of Industry 20%
Department of Infrastructure and Regional Development 5%
National Capital Authority 70%
Department of Parliamentary Services 100%
Department of the Prime Minister and Cabinet 80%
Indigenous Business Australia 50%
Department of Human Services 5%
Department of Social Services 15%
Australian Bureau of Statistics 30%
Australian Office of Financial Management 0%
Australian Securities and Investments Commission 100%
Australian Taxation Office 100%
Clean Energy Finance Corporation 30%
Department of the Treasury 20%
Small agencies 40%

62 Get out of your own way | Unleashing productivity
The sum of this expenditure indicates that the federal government spends approximately $13.5 billion a year administering and enforcing regulation. But what of the rest of the public sector – state governments, local governments and multi-jurisdictional agencies?
Our estimates there started from Australian Bureau of Statistics Government Financial Estimates 2013–14.34 We then:
• Took the employee expenses of the rest of the public sector
• Took the same portion of their other operating expenses as we’d examined federally
• Assumed that local government is only half as administration-intensive as federal government
• Assumed that states and territories are one-third as administration-intensive.
That methodology implies the total 2013–14 cost of administering Australian public sector regulations was $27 billion, or 1.7 per cent of national income.
Self-imposed and public sector compliance costs
Compliance costs are derived from an estimate of how much time employees spend complying with public and internal regulation. The underlying data was gathered from Deloitte’s survey – details of which are provided in Appendix III.
Representatives of 137 Australian businesses responded to the following questions:
1. How much time is spent by a typical external-facing employee on managing internal processes and requirements per week?
2. What proportion of time spent by all employees on regulation is devoted to internal regulation?
For Question 1, the respondents gave answers for three employee levels: senior executives, middle management and other non-administrative staff. The resulting 411 observations (three employment levels multiplied by 137 respondents) were adjusted to reflect the proportion of workers in the labour force for each of the three employment levels.35
This provided Deloitte Access Economics with an estimate of the proportion of time spent complying with internal regulation across the labour force of 18 per cent per week.
Furthermore, in Question 2, these respondents indicated that they spent 66 per cent of their total compliance time on internal regulation and 33 per cent on external regulation. Based on this observation and the calculation above, employees spend 9 per cent of their time every week complying with public sector regulation.
Labour represents approximately half (48 per cent) of the resources available to the Australian economy. As such, Deloitte Access Economics adjusted the time results above to estimate what share of the economy’s resource base is used for complying with regulation. This approach is deliberately conservative. As an example, it excludes capital costs associated with regulation compliance.
Using this approach, the 9 per cent of time spent complying with public sector regulation is equivalent to 4.4 per cent of nominal gross domestic product (GDP). Previously, the highest publicly available estimate of regulatory compliance, published by the Productivity Commission, was 4 per cent of GDP. Considering this estimate is relatively dated and that public sector regulation has risen since that time, Deloitte Access Economics decided to meet in the middle, estimating that the cost of complying with public sector regulation is 4.2 per cent of GDP – or $67 billion per year.
Applying an identical approach to self-imposed regulation, the initial estimate of 18 per cent of employee time represented an estimated cost of 8.5 per cent of GDP. This result was further adjusted to avoid double-counting the cost of public sector employees.
As a result, Deloitte Access Economics estimates the cost of compliance with self-imposed rules and regulations to be 8.4 per cent of GDP, or $134 billion per annum.
Coincidentally, that is exactly double the cost of complying with public sector regulations.
34 ABS catalogue 5501.0.55.001 – Government Financial Estimates, Australia 2013–14.
35 ABS catalogue 6291.0.55.003 – Labour Force, Australia, Detailed, Quarterly, May 2014.

Get out of your own way | Unleashing productivity 63
Administration cost of internal regulation
Deloitte Access Economics selected an administration-intensive subset of the Australian workforce to estimate the cost of administering self-imposed regulation. These occupations, and the proportion of their time judged to be spent on administering self-imposed rules and regulations, are listed in Table A2.
Based on the weights above and labour force data from the Australian Bureau of Statistics, some 313,000 people are devoted to administering regulation (2.8 per cent of the total workforce).36 Once again using the
conservative approach of factoring that figure down by labour’s share of Australia’s economic resources, this is equivalent to 1.4 per cent of GDP. To avoid double-counting public sector employees’ costs, Deloitte Access Economics further reduced this estimate by 0.1 per cent to 1.3 per cent of GDP, or $21 billion.
While Deloitte Access Economics is confident with the approach outlined in this appendix, we also recognise that there are some necessary limitations to our research. Such limitations are no surprise, given that we are breaking new ground in attempting to estimate the nationwide costs of self-imposed rules.
36 ABS catalogue 6291.0.55.003 – Labour Force, Australia, Detailed, Quarterly, May 2014.
Table A2: Proportion of occupation working in internal administration
Occupation Time spent on administering self-imposed rules
Contract, program and project administrators 40%
Practice managers 40%
Archivists, curators and records managers 40%
Corporate services managers 40%
Inspectors and regulatory officers 40%
Other miscellaneous clerical and administrative workers 40%
Payroll clerks 30%
Office managers 25%
Inquiry clerks 20%
General clerks 15%
Finance managers 10%
Receptionists 10%
Other clerical and office support workers 40%
Accounting clerks 40%
Human resource clerks 40%
Personal assistants 40%
Secretaries 40%

Appendix III

Get out of your own way | Unleashing productivity 65
Survey methodology
Given there appears to be a scarcity of Australian and international data assessing in a holistic way the costs of self-imposed rules and regulations, a number of key findings presented in this report are based on a survey conducted by Deloitte expressly for the purpose of this report.
This survey was addressed to senior executives, and asked them to consider their current regulatory burden and perceived changes in regulatory burden for their company over time.
Deloitte received 137 survey responses from across the Australian business and non-profit landscape. Some 27 per cent of responses were from firms with over 1,000 employees, 40 per cent of responses were from firms with 100 to 1,000 employees, and the remaining 33 per cent of responses were from firms with fewer than 100 employees.
These responses represented a broad range of industries, listed in Table A3.
Although the respondent patterns above differ from those in the wider Australian economy, re-weighting the responses to reflect national industry weights did not have any notable impact on the results.
While the survey provided a host of insights, key questions are considered below.
Change in the impact of internal rules over the past decade
Respondents were asked to rate the following factors for a ‘typical employee’ in their organisation:
• Compared to 10 years ago, are there more or less emails received from others in your organisation?
• Compared to 10 years ago, is there more or less time spent in internal meetings?
• Compared to 10 years ago, is there more or less time spent on reporting, preparation for reporting and controls?
• Is there now more or less overlap in the scope of internal rules and processes?
• Is there now more or less discretion used (responses to breach, penalties applied etc.) when internal rules are broken?
• Is there more or less adoption of internal rules and regulations post-GFC and its aftermath?
• Compared to 10 years ago, how has the time spent by the average external-facing employee on HR functions (performance reviews, career plans, pay negotiation, as well as management-related functions such as assessing the performance of other staff and exiting poor performers) changed?
Table A3: Proportion of response to Deloitte client survey by industry
Industry Proportion of respondents
Business services 2%
Construction 4%
Education (universities/TAFE) 5%
Farming/agribusiness 1%
Finance and insurance 18%
Health 5%
Information services 1%
Manufacturing 4%
Media 1%
Mining 10%
Other (including not-for-profits) 22%
Property services 2%
Public administration 4%
Recreational services 1%
Technology 3%
Transport and storage 7%
Utilities 2%
Wholesale and retail trade 7%

66 Get out of your own way | Unleashing productivity
• Compared to 10 years ago, how has the time spent by the average external-facing employee on finance matters (setting plans, billing, management reporting, chasing debtors, cash management) changed?
• Compared to 10 years ago, how has the time spent by the average external-facing employee on IT matters (training, changing templates, installing applications, lodging requests to IT specialists) changed?
• Compared to 10 years ago, how has the time spent by the average external-facing employee on internal functions (such as legal/marketing and executive services) changed?
• Compared to 10 years ago, how has the time spent by the average external-facing employee on governance and compliance matters (reporting, preparation for reporting and controls) changed?
Respondents could give an answer of significantly more, somewhat more, same, somewhat less or significantly less. Responses were coded on a five-point scale, where significantly more = 2 and significantly less = -2.
As such, a positive value meant that more time was spent by a typical employee on a given activity compared to 10 years ago, while a score close to 2 meant that significantly more time was spent on the given activity.
Main motivations for adopting internal rules
Respondents were asked to assign a percentage share of motivation for internal rules and processes across the following categories:
• Improving health and safety of employees• Limiting scope of activity to minimise corporate
risk (e.g. only a senior executive can sign off on procurement above a given dollar threshold)
• Collecting business data for the information of management
• Monitoring employee activity due to geographical separation
• Monitoring activity due to employees working away from primary offices/factories/mines etc.
• Responding to the requirements set by global head office
• Meeting best practice/industry standards• Other (please give examples).
Share of time spent by all employees on government rules compared to internal rules
Respondents were asked what proportion of time was spent by all employees on government rules compared to internal rules for the following functions:
• IT internal• Finance internal• HR internal• Governance and compliance internal• Other internal (such as legal, marketing and
executive services).
Respondents provided a percentage figure for internal rules and external rules, with the internal and external rule weightings summing to 100 per cent for each procedure. For example, for IT internal procedures a respondent might estimate that 20 per cent of all employees’ time was spent complying with public regulation, with 80 per cent of that compliance time spent complying with internal rules.
Share of internal rules with ‘unnecessary or low-value processes’
For each of the following internal functions, respondents were also asked to indicate which proportion of the processes were unnecessary or low value; mostly worthwhile but not well implemented; and worthwhile and well implemented:
• IT • Finance • HR • Governance and compliance • Other (such as legal, marketing and executive services).

Get out of your own way | Unleashing productivity 67
About the authors
For further information please visit:
www.buildingtheluckycountry.com.auor email [email protected]
Building the Lucky CountrySeries authors
Gerhard VorsterChief Strategy Officer
David RedhillChief Marketing Officer
Chris RichardsonPartner Deloitte Access Economics
Get out of your own way – Unleashing productivityEdition authors
Matt PieroniPartner Consulting
John MeacockManaging Partner NSW
Matt SainesPartner Risk Services
Martyn StricklandPartner Financial Advisory Services
Kristian KoldingDirector Financial Advisory Services
Nazia NurSenior Analyst Financial Advisory Services
Suzie GoughPartnerProfessional Services Risk

This publication contains general information only, and none of Deloitte Touche Tohmatsu Limited, its member firms, or their related entities (collectively the ‘Deloitte Network’) is, by means of this publication, rendering professional advice or services.
Before making any decision or taking any action that may affect your finances or your business, you should consult a qualified professional adviser. No entity in the Deloitte Network shall be responsible for any loss whatsoever sustained by any person who relies on this publication.
About Deloitte
Deloitte refers to one or more of Deloitte Touche Tohmatsu Limited, a UK private company limited by guarantee, and its network of member firms, each of which is a legally separate and independent entity. Please see www.deloitte.com/au/about for a detailed description of the legal structure of Deloitte Touche Tohmatsu Limited and its member firms.
Deloitte provides audit, tax, consulting, and financial advisory services to public and private clients spanning multiple industries. With a globally connected network of member firms in more than 150 countries, Deloitte brings world-class capabilities and high-quality service to clients, delivering the insights they need to address their most complex business challenges. Deloitte has in the region of 200,000 professionals, all committed to becoming the standard of excellence.
About Deloitte Australia
In Australia, the member firm is the Australian partnership of Deloitte Touche Tohmatsu. As one of Australia’s leading professional services firms, Deloitte Touche Tohmatsu and its affiliates provide audit, tax, consulting, and financial advisory services through approximately 6,000 people across the country. Focused on the creation of value and growth, and known as an employer of choice for innovative human resources programs, we are dedicated to helping our clients and our people excel. For more information, please visit Deloitte’s web site at www.deloitte.com.au.
Liability limited by a scheme approved under Professional Standards Legislation.
Member of Deloitte Touche Tohmatsu Limited
© 2014 Deloitte Touche Tohmatsu.
MCBD_SYD_09/14_050466
Adelaide 11 Waymouth Street Adelaide SA 5000 Tel: +61 8 8407 7000
Alice Springs 9 Parsons Street Alice Springs NT 0870 Tel: +61 8 8950 7000
Brisbane Riverside Centre Level 26, 123 Eagle Street Brisbane Qld 4001 Tel: +61 7 3308 7000
Canberra Brindabella Business Park Level 2, 8 Brindabella Circuit Canberra Airport ACT 2609 Tel: +61 2 6263 7000
Darwin Level 11, 24 Mitchell Street Darwin NT 0800 Tel: +61 8 8980 3000
Hobart ANZ Centre Level 8, 22 Elizabeth Street Hobart Tas 7000 Tel: +61 3 6237 7000
Launceston 117 Cimitiere Street Launceston Tas 7250 Tel: +61 3 6337 7000
Melbourne 550 Bourke Street Melbourne Vic 3000 Tel: +61 3 9671 7000
Perth Woodside Plaza Level 14, 240 St Georges Terrace Perth WA 6000 Tel: +61 8 9365 7000
Sydney Grosvenor Place 225 George Street Sydney NSW 2000 Tel: +61 2 9322 7000
Western Sydney Eclipse Tower 60 Station Street Parramatta NSW 2150 Tel: +61 2 9840 7000
Deloitte offices