Embed Size (px)
Citation preview

Geriatrics Peer Review
Th Pepersack, President F Schildermans, Vice-President JP Baeyens, Secretaire
Peer Review, Geriatrics 2000-2001
OUTCOMES OF CONTINUOUS PROCESS IMPROVEMENT
OF NUTRITIONAL CARE PROGRAM AMONG GERIATRIC
UNITS IN BELGIUM
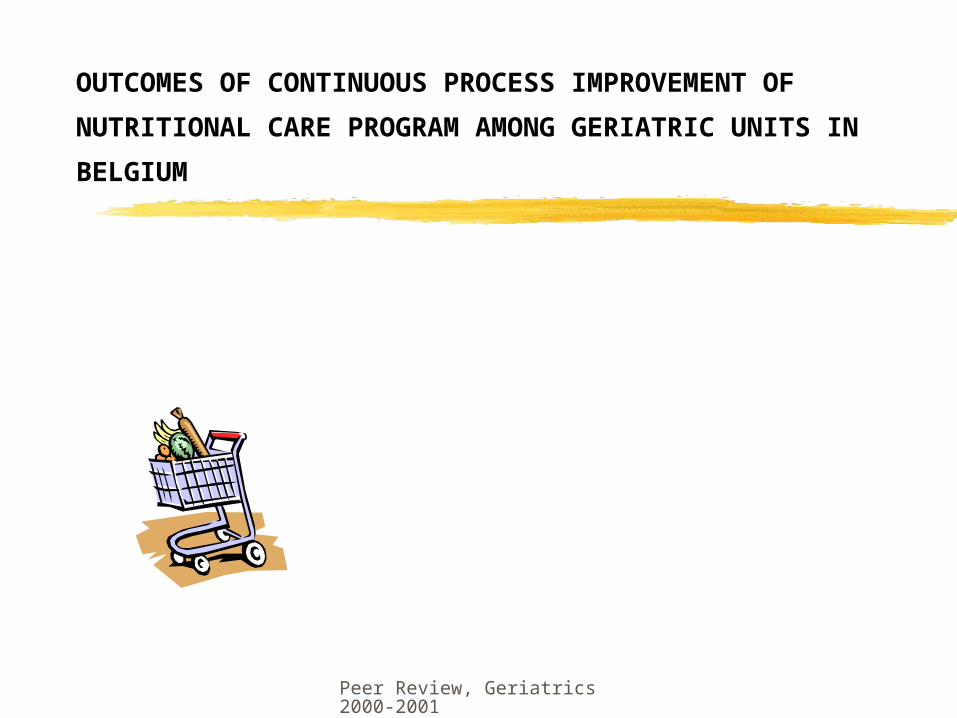
Introduction
Up to 65% of elderly patients are protein-energy undernourished (PEU) at admission or acquire nutritional deficits while hospitalised
PEU is associated with: high hospitalisation stay high morbidity and mortality high rehospitalisation rate

Aims
to assess the quality of care concerning nutrition among Belgian geriatric units
to include more routinely nutritional assessments and interventions into comprehensive geriatric assessment
to assess the impact of nutritional recommendations on nutritional status an on the length of hospitalisation
Methodology
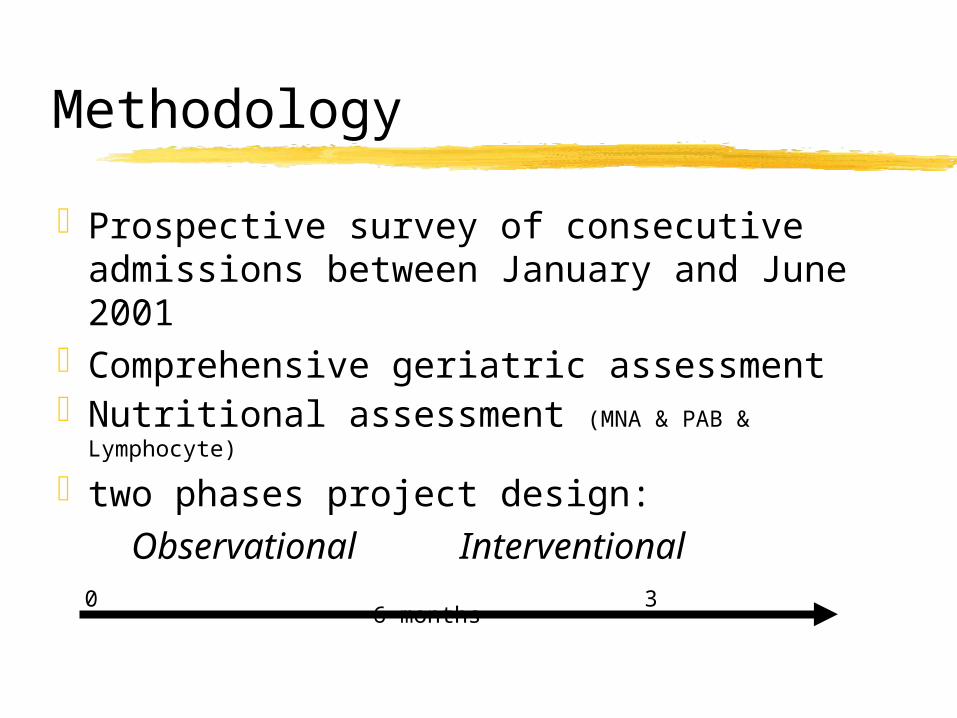
Prospective survey of consecutive admissions between January and June 2001
Comprehensive geriatric assessmentNutritional assessment (MNA & PAB &
Lymphocyte)
two phases project design: Observational Interventional
0 3 6 months
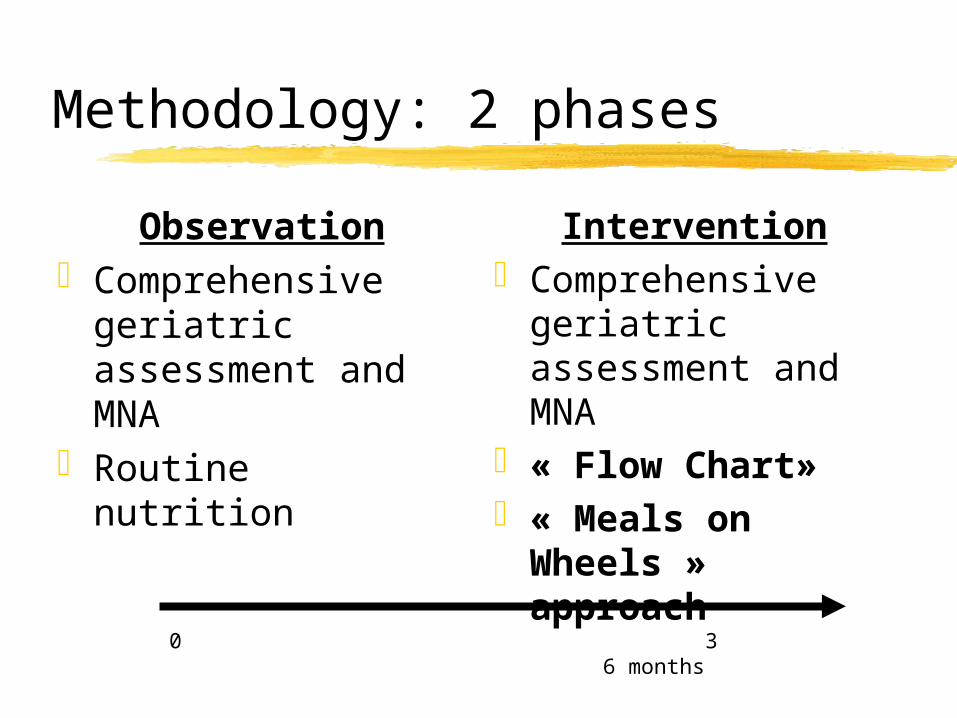
Methodology: 2 phases
ObservationComprehensive
geriatric assessment and MNA
Routine nutrition
InterventionComprehensive
geriatric assessment and MNA
« Flow Chart»« Meals on
Wheels » approach
0 3 6 months
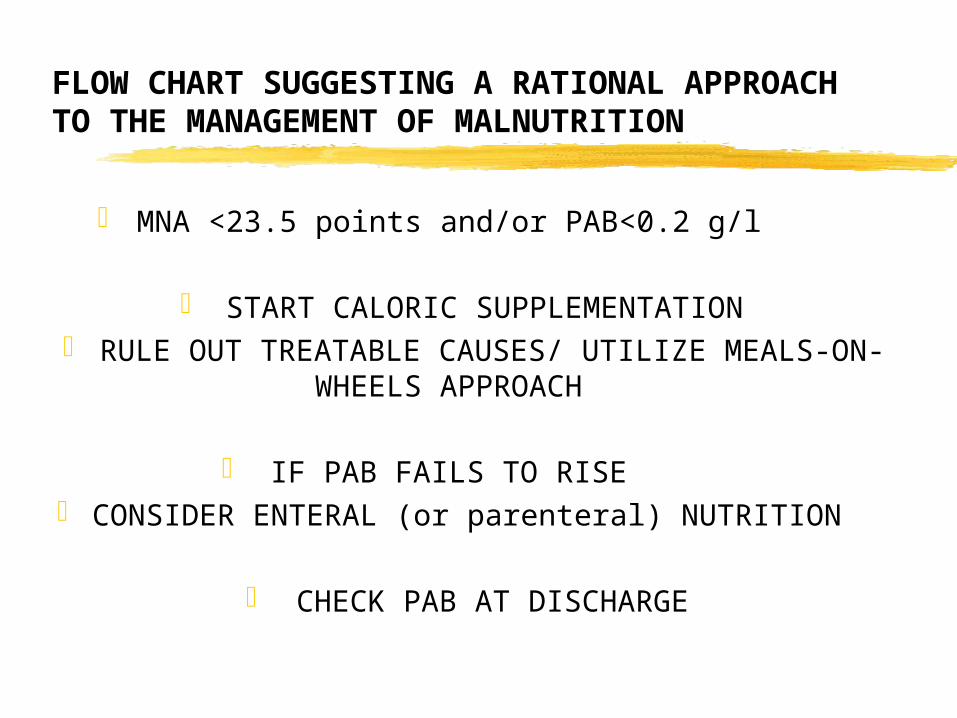
FLOW CHART SUGGESTING A RATIONAL APPROACH TO THE MANAGEMENT OF MALNUTRITION
MNA <23.5 points and/or PAB<0.2 g/l
START CALORIC SUPPLEMENTATION RULE OUT TREATABLE CAUSES/ UTILIZE MEALS-
ON-WHEELS APPROACH
IF PAB FAILS TO RISE CONSIDER ENTERAL (or parenteral) NUTRITION
CHECK PAB AT DISCHARGE
Morley 1994
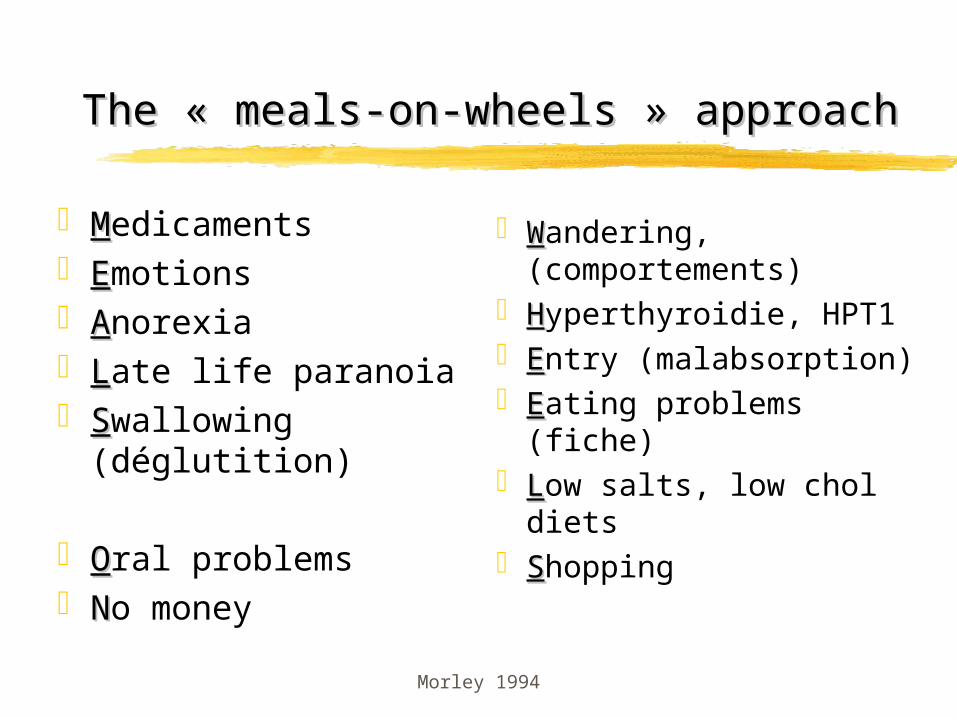
The « meals-on-wheels » approachThe « meals-on-wheels » approach
MMedicaments EEmotions AAnorexia LLate life paranoia SSwallowing
(déglutition)
OOral problems NNo money
WWandering, (comportements)
HHyperthyroidie, HPT1 EEntry (malabsorption) EEating problems
(fiche) LLow salts, low chol
diets SShopping

Outcomes
to assess the quality of care concerning nutrition among Belgian geriatric units descriptive statistics of nutritional status during phase 1
to include more routinely nutritional assessments and interventions into comprehensive geriatric assessment sensitize the teams to nutritional aspect of the comprehensive
geriatric assessment
to assess the impact of nutritional recommendations on nutritional status an on the length of hospitalisation comparison of nutritional parameters and hospitalisation
stays between phase 1 and phase 2

Statistics
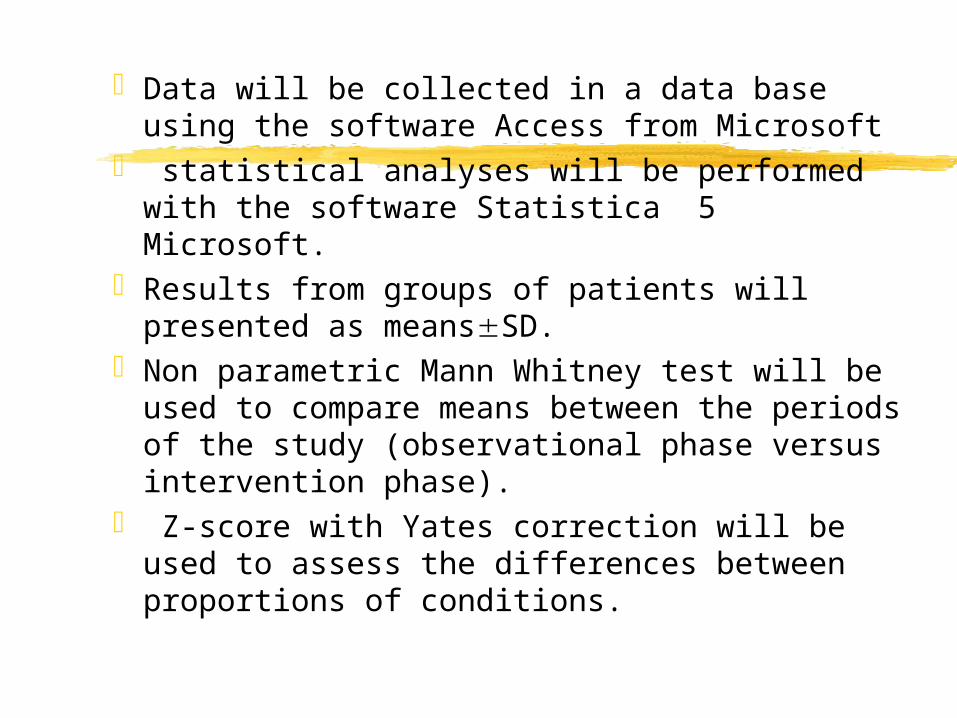
Data will be collected in a data base using the software Access from Microsoft
statistical analyses will be performed with the software Statistica 5 Microsoft.
Results from groups of patients will presented as meansSD.
Non parametric Mann Whitney test will be used to compare means between the periods of the study (observational phase versus intervention phase).
Z-score with Yates correction will be used to assess the differences between proportions of conditions.

References
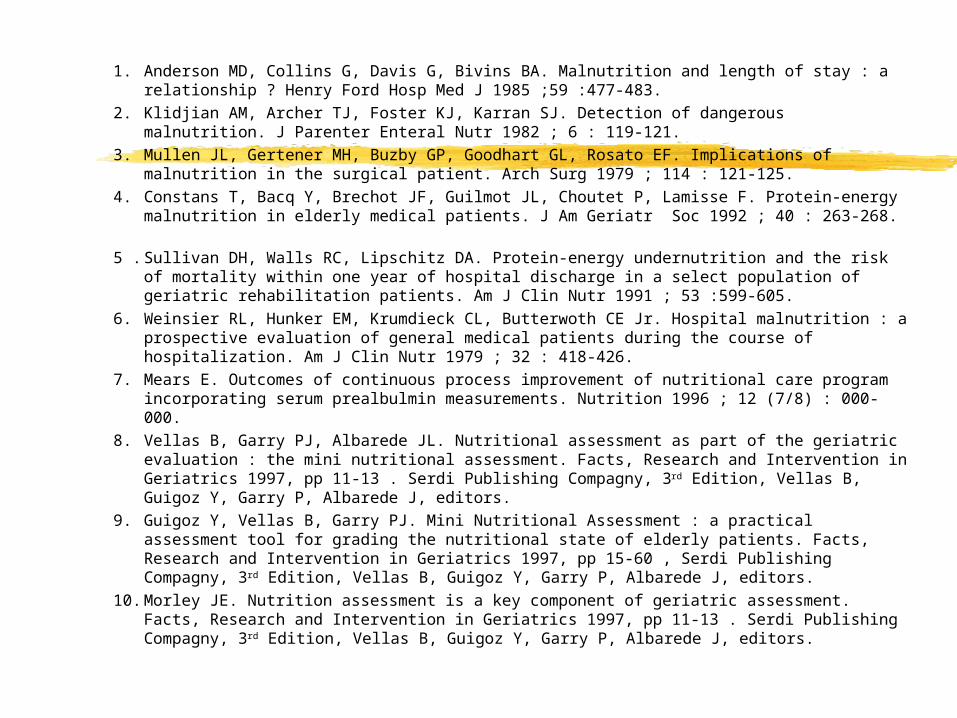
1. Anderson MD, Collins G, Davis G, Bivins BA. Malnutrition and length of stay : a relationship ? Henry Ford Hosp Med J 1985 ;59 :477-483.
2. Klidjian AM, Archer TJ, Foster KJ, Karran SJ. Detection of dangerous malnutrition. J Parenter Enteral Nutr 1982 ; 6 : 119-121.
3. Mullen JL, Gertener MH, Buzby GP, Goodhart GL, Rosato EF. Implications of malnutrition in the surgical patient. Arch Surg 1979 ; 114 : 121-125.
4. Constans T, Bacq Y, Brechot JF, Guilmot JL, Choutet P, Lamisse F. Protein-energy malnutrition in elderly medical patients. J Am Geriatr Soc 1992 ; 40 : 263-268.
5 . Sullivan DH, Walls RC, Lipschitz DA. Protein-energy undernutrition and the risk of mortality within one year of hospital discharge in a select population of geriatric rehabilitation patients. Am J Clin Nutr 1991 ; 53 :599-605.
6. Weinsier RL, Hunker EM, Krumdieck CL, Butterwoth CE Jr. Hospital malnutrition : a prospective evaluation of general medical patients during the course of hospitalization. Am J Clin Nutr 1979 ; 32 : 418-426.
7. Mears E. Outcomes of continuous process improvement of nutritional care program incorporating serum prealbulmin measurements. Nutrition 1996 ; 12 (7/8) : 000-000.
8. Vellas B, Garry PJ, Albarede JL. Nutritional assessment as part of the geriatric evaluation : the mini nutritional assessment. Facts, Research and Intervention in Geriatrics 1997, pp 11-13 . Serdi Publishing Compagny, 3rd Edition, Vellas B, Guigoz Y, Garry P, Albarede J, editors.
9. Guigoz Y, Vellas B, Garry PJ. Mini Nutritional Assessment : a practical assessment tool for grading the nutritional state of elderly patients. Facts, Research and Intervention in Geriatrics 1997, pp 15-60 , Serdi Publishing Compagny, 3rd Edition, Vellas B, Guigoz Y, Garry P, Albarede J, editors.
10. Morley JE. Nutrition assessment is a key component of geriatric assessment. Facts, Research and Intervention in Geriatrics 1997, pp 11-13 . Serdi Publishing Compagny, 3rd Edition, Vellas B, Guigoz Y, Garry P, Albarede J, editors.

annexes
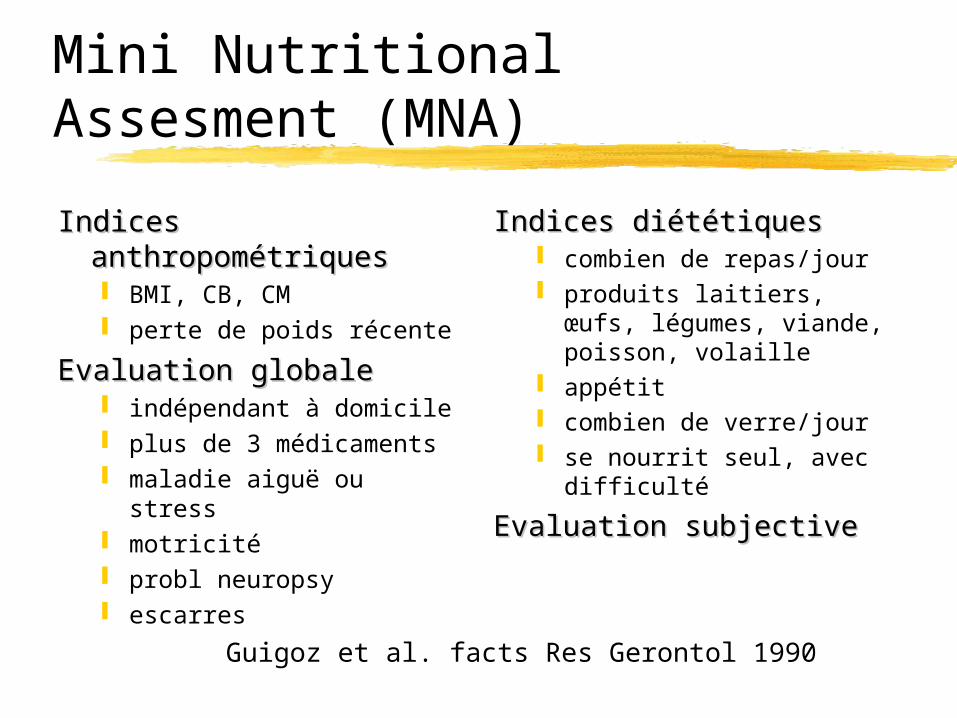
Mini Nutritional Assesment (MNA)
Indices Indices anthropométriquesanthropométriques BMI, CB, CM perte de poids récente
Evaluation globaleEvaluation globale indépendant à domicile plus de 3 médicaments maladie aiguë ou stress motricité probl neuropsy escarres
Indices diététiquesIndices diététiques combien de repas/jour produits laitiers, œufs,
légumes, viande, poisson, volaille
appétit combien de verre/jour se nourrit seul, avec
difficulté
Evaluation subjectiveEvaluation subjective
Guigoz et al. facts Res Gerontol 1990

Project Management
ActionsPresentation
(2000)protocol sendingSoftware creation
for registrationcentre recruitment
Implementations Data collect 1srt phase Mail for the 2nd phase
(March, 2001) Data collect 2nd phase
(July 2001) Preliminary report (July
2001) Feed back Questionnaire

Project presentation
SBGG meeting Liège,
News-groupSBGG mailing G-NewsRepeated Mails
Octobre 2000250 participants
November 2000
December 2000400 members

protocole sending
December 2000Including:
protocole Word Encoding Software
Access Numeric Scales
Word Presentation Power
Point 33 centres answered
Results
12 centers presented evaluable dataN=1139 admissions

Characteristics of 1140 consecutive admissions between January and June 2001.
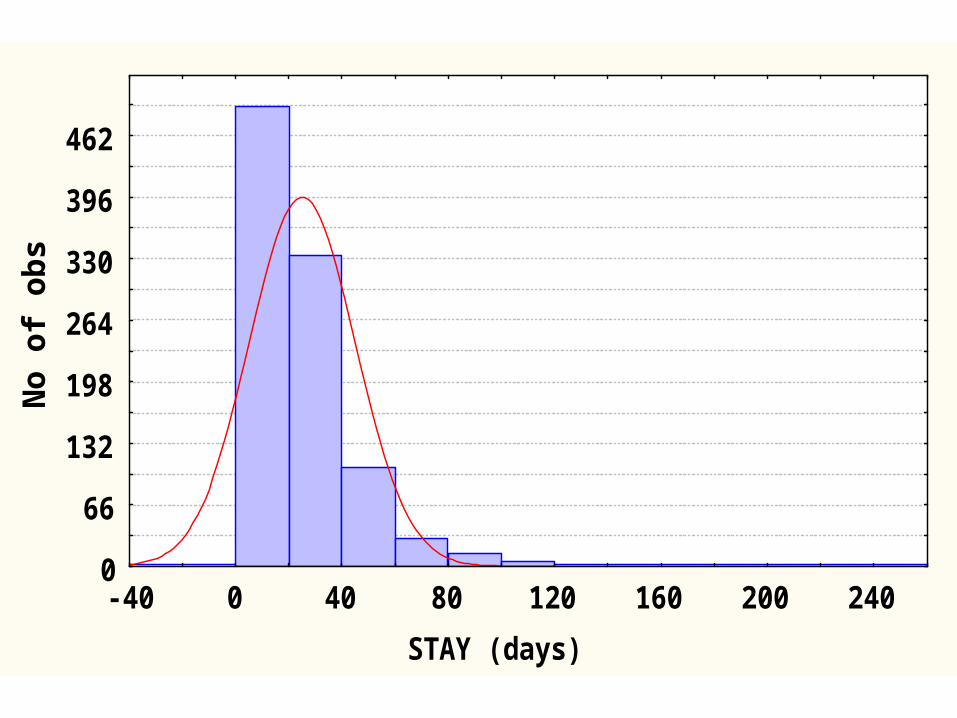
STAY (days)
No
of
ob
s
0
66
132
198
264
330
396
462
-40 0 40 80 120 160 200 240
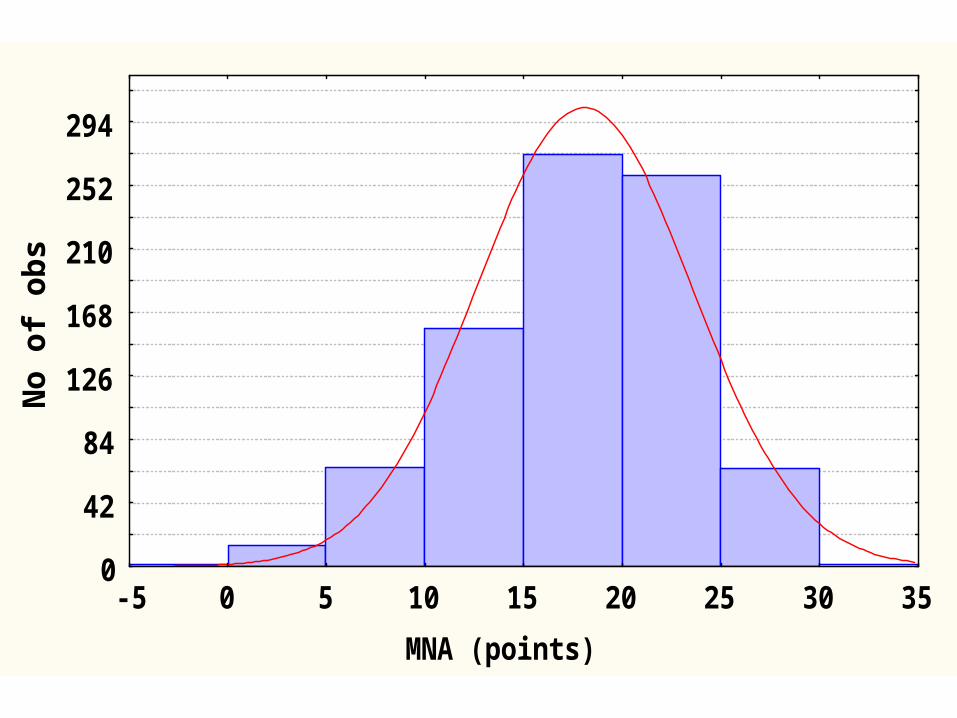
MNA (points)
No
of
ob
s
0
42
84
126
168
210
252
294
-5 0 5 10 15 20 25 30 35
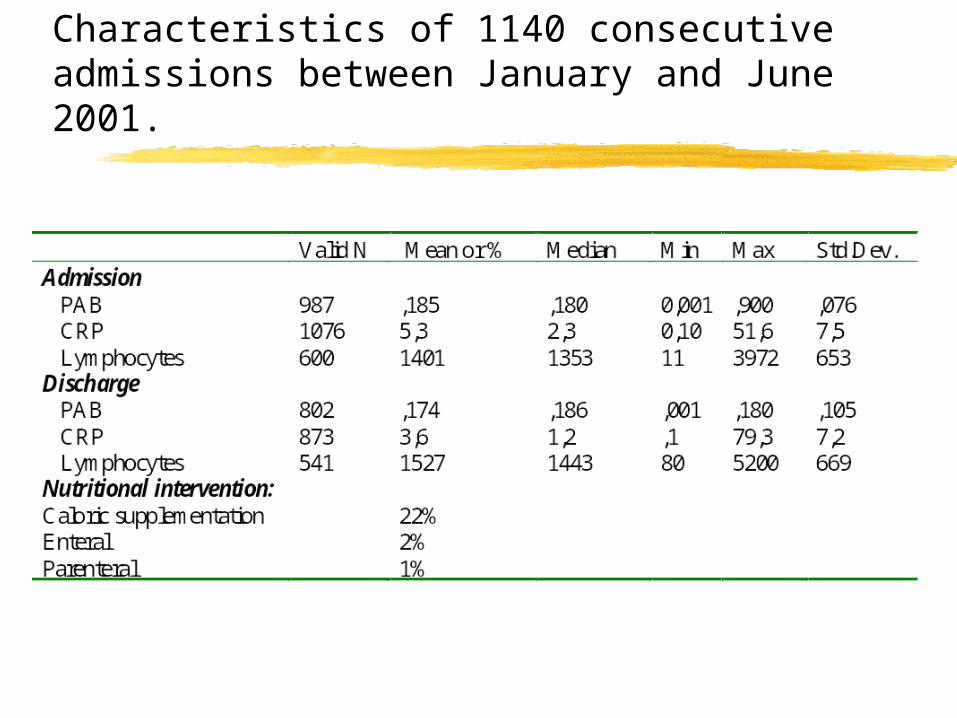
Characteristics of 1140 consecutive admissions between January and June 2001.
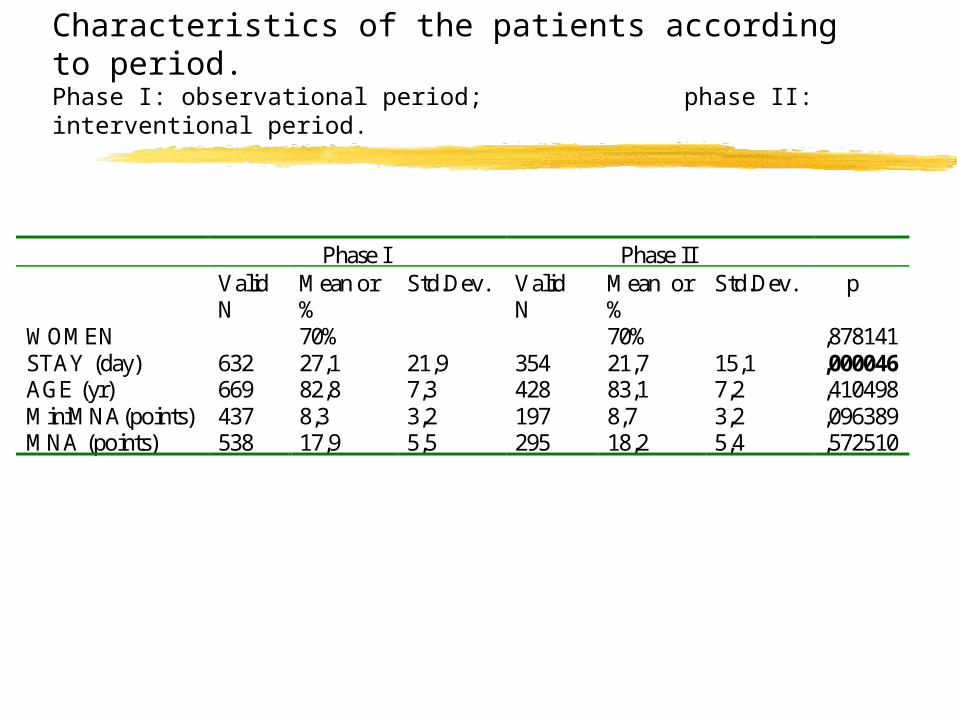
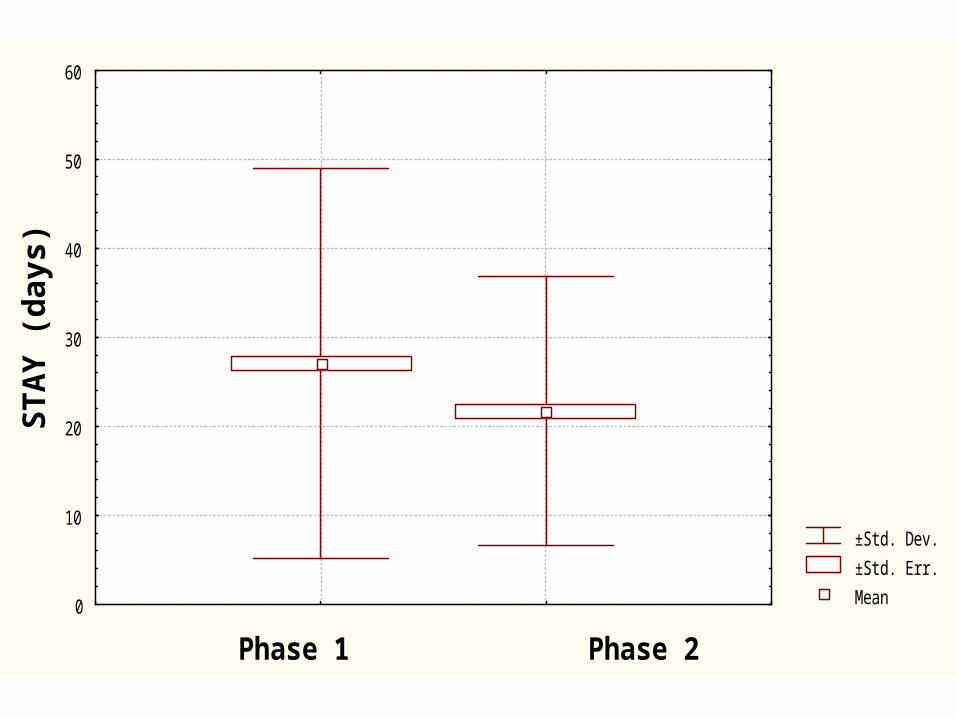
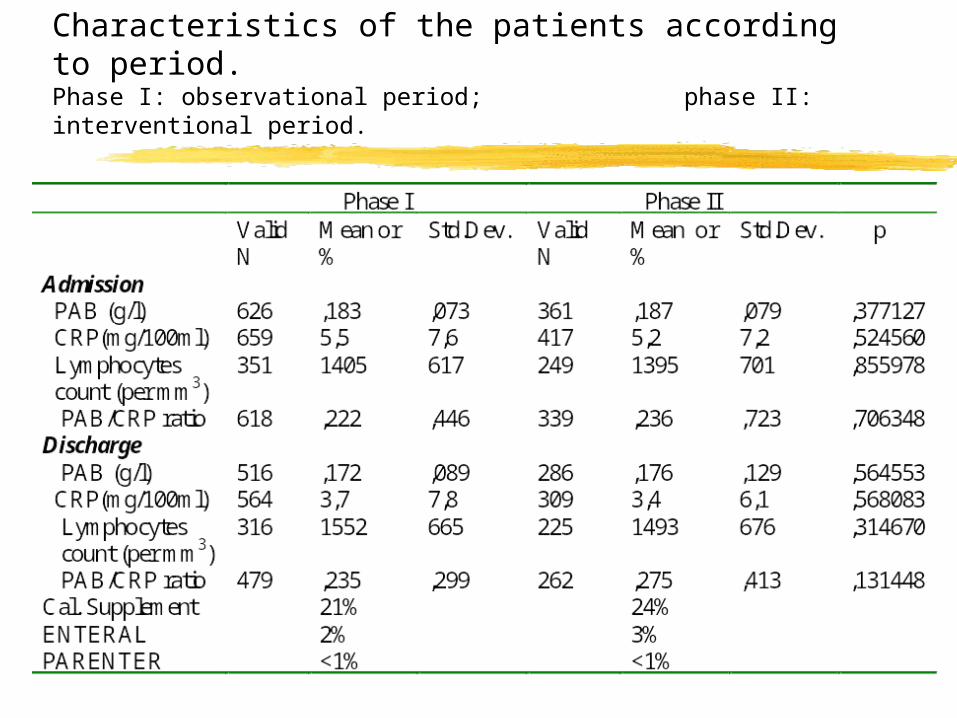
Characteristics of the patients according to period.Phase I: observational period; phase II: interventional period.
Phase I Phase II Valid
N Mean or %
Std.Dev. Valid N
Mean or %
Std.Dev. p
WOMEN 70% 70% ,878141 STAY (day) 632 27,1 21,9 354 21,7 15,1 ,000046 AGE (yr) 669 82,8 7,3 428 83,1 7,2 ,410498 MiniMNA(points) 437 8,3 3,2 197 8,7 3,2 ,096389 MNA (points) 538 17,9 5,5 295 18,2 5,4 ,572510
±Std. Dev.
±Std. Err.
Mean
Phase 1 Phase 2
STA
Y (
da
ys
)
0
10
20
30
40
50
60
Characteristics of the patients according to period.Phase I: observational period; phase II: interventional period.
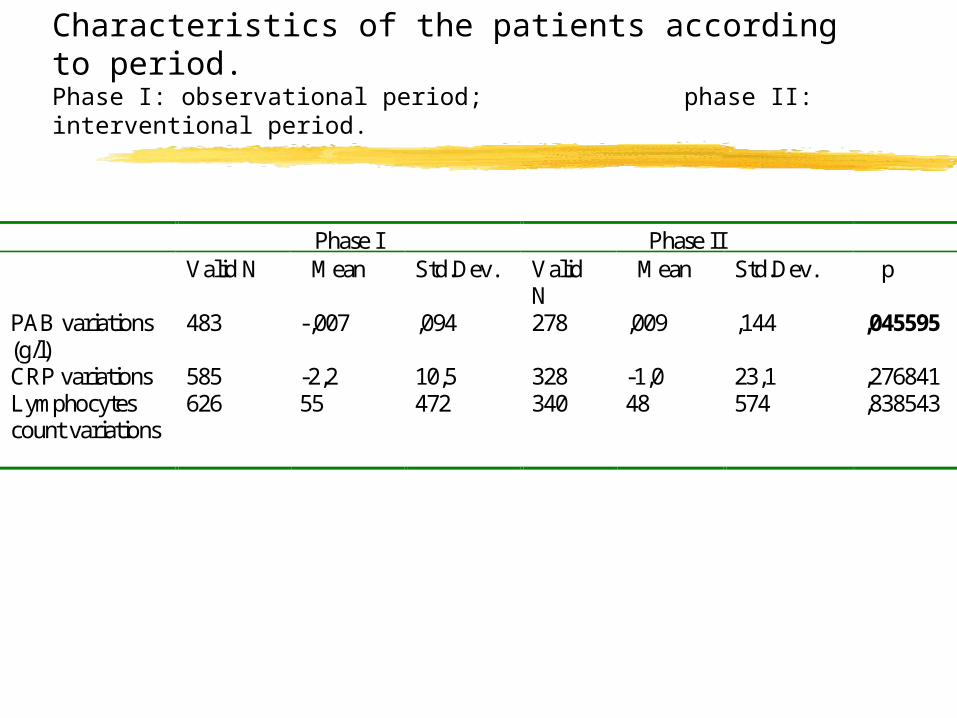
Characteristics of the patients according to period.Phase I: observational period; phase II: interventional period.
Phase I Phase II Valid N Mean Std.Dev. Valid
N Mean Std.Dev. p
PAB variations (g/l)
483 -,007 ,094 278 ,009 ,144 ,045595
CRP variations 585 -2,2 10,5 328 -1,0 23,1 ,276841 Lymphocytes count variations
626 55 472 340 48 574 ,838543
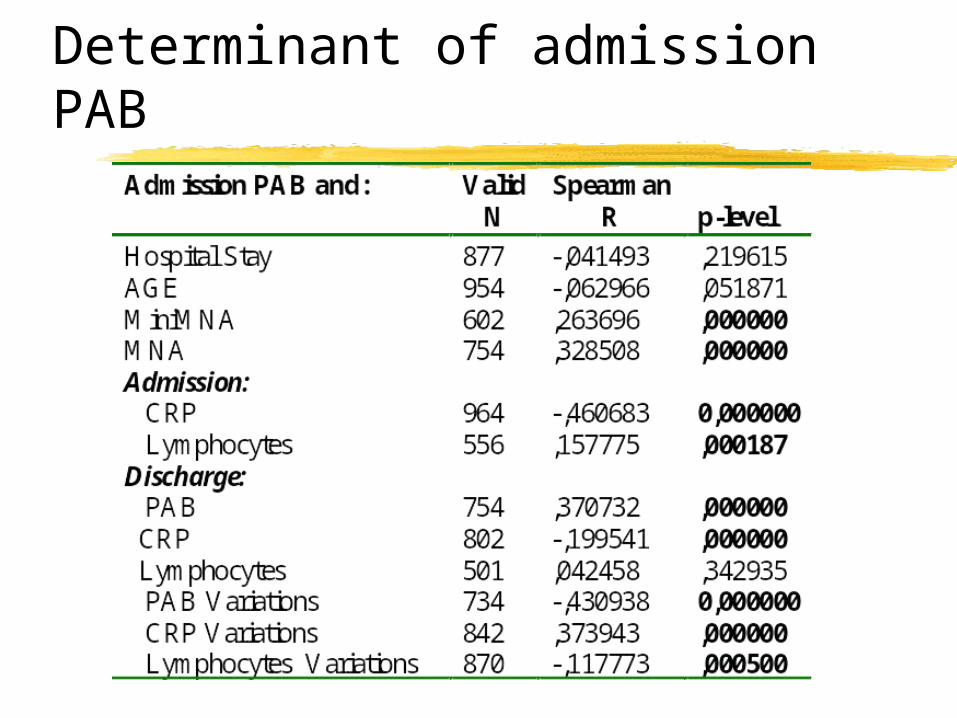
Determinant of admission PAB
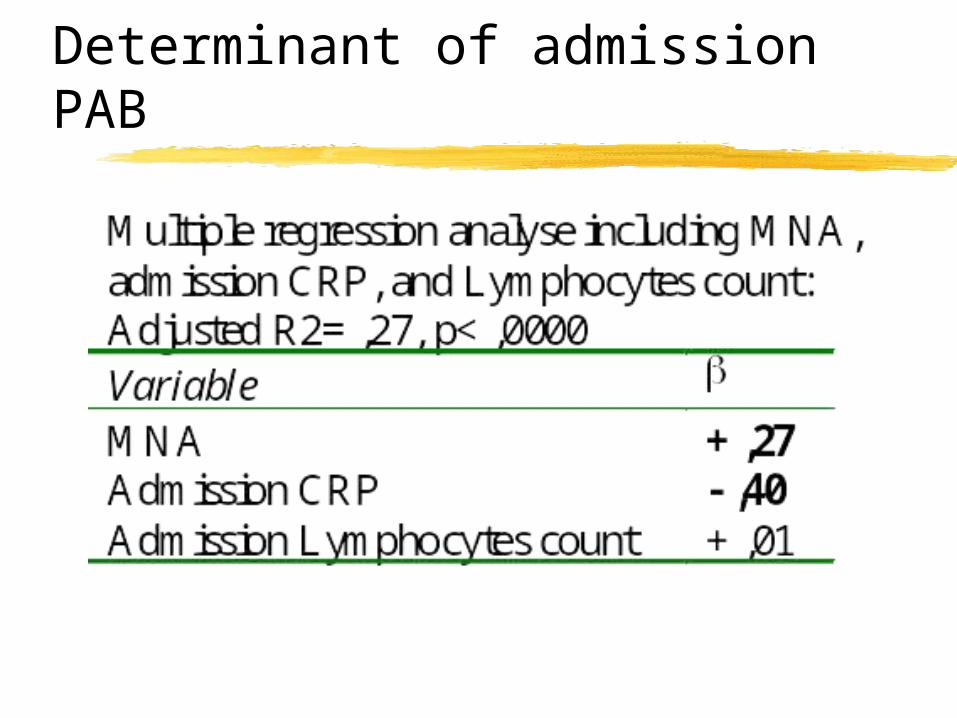
Determinant of admission PAB
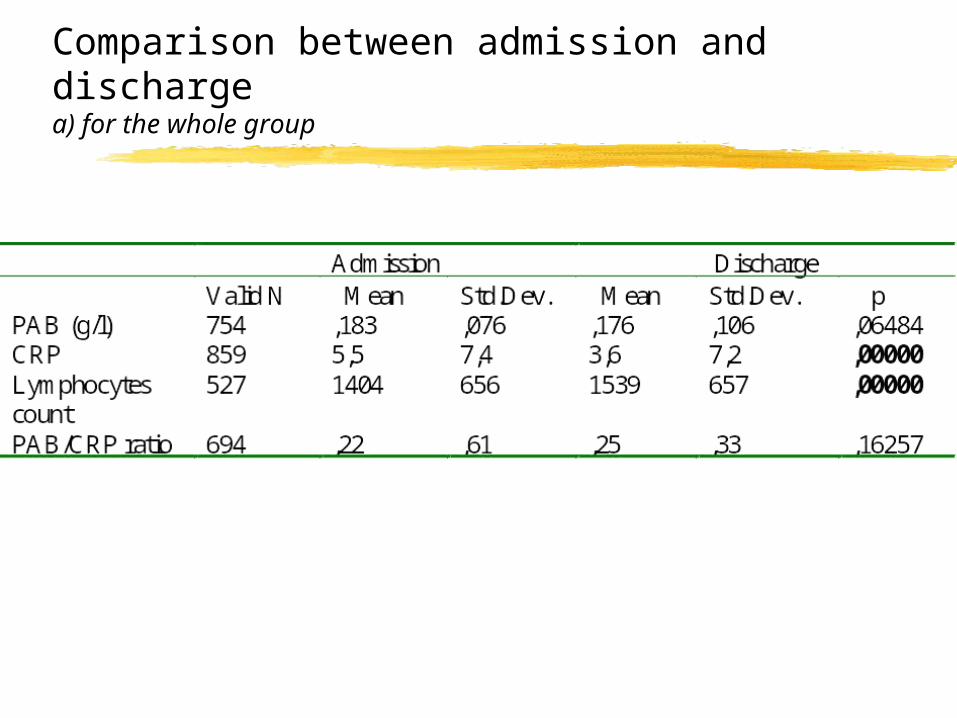
Comparison between admission and discharge a) for the whole group
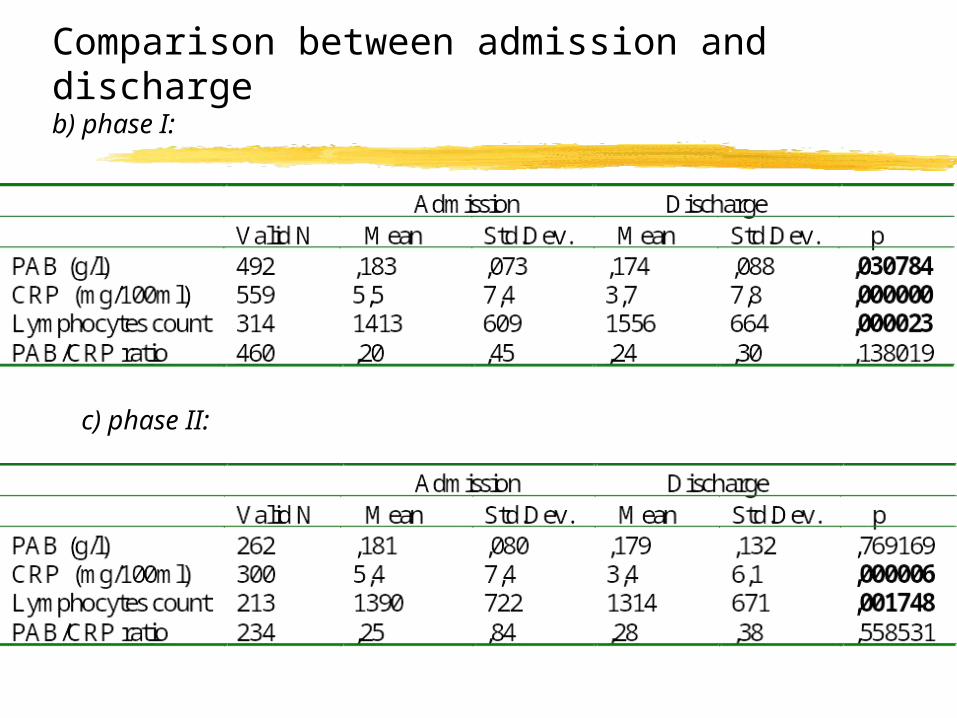
Comparison between admission and discharge b) phase I:
c) phase II:
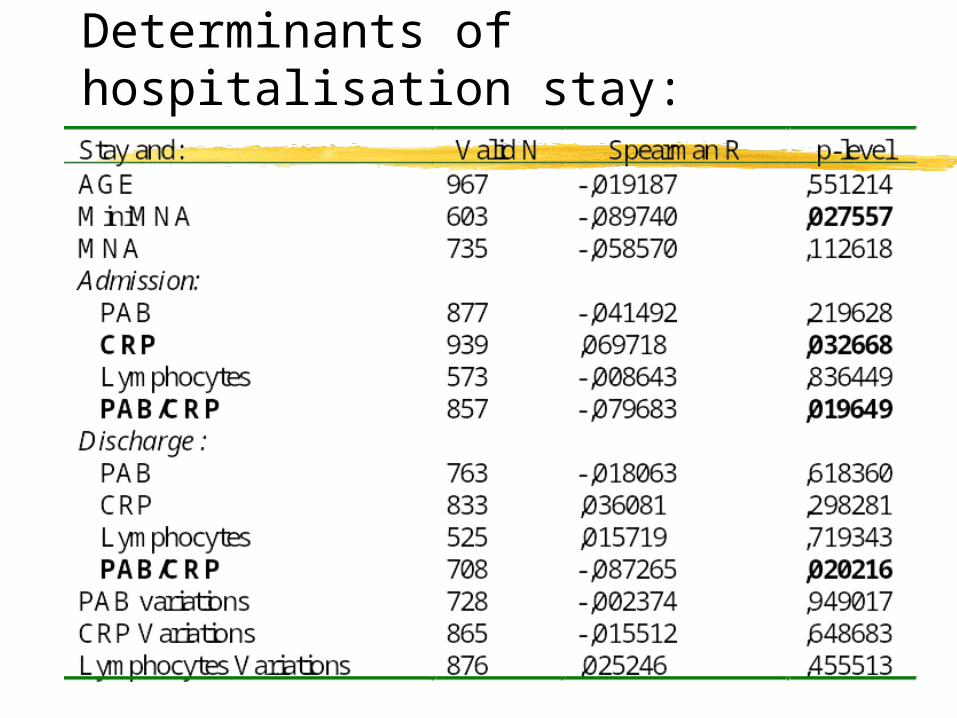
Determinants of hospitalisation stay:
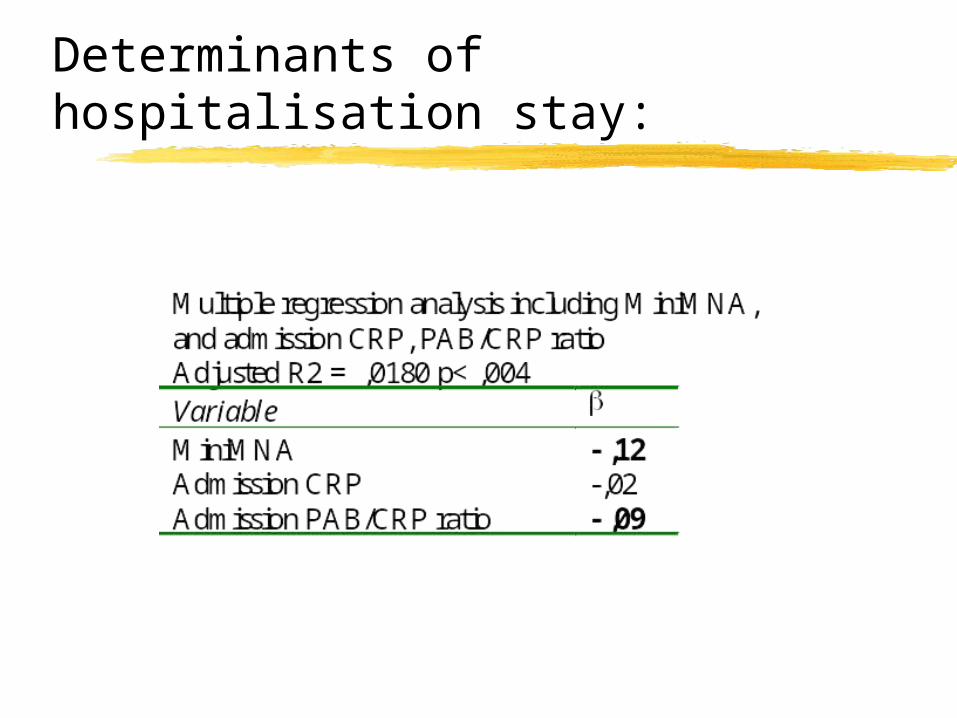
Determinants of hospitalisation stay:
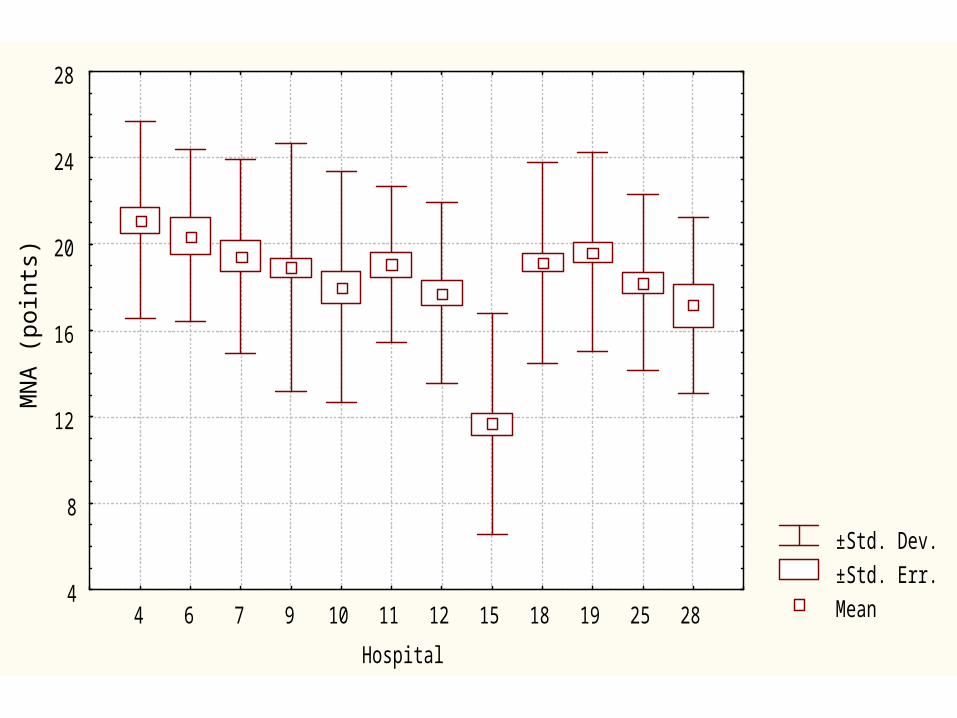
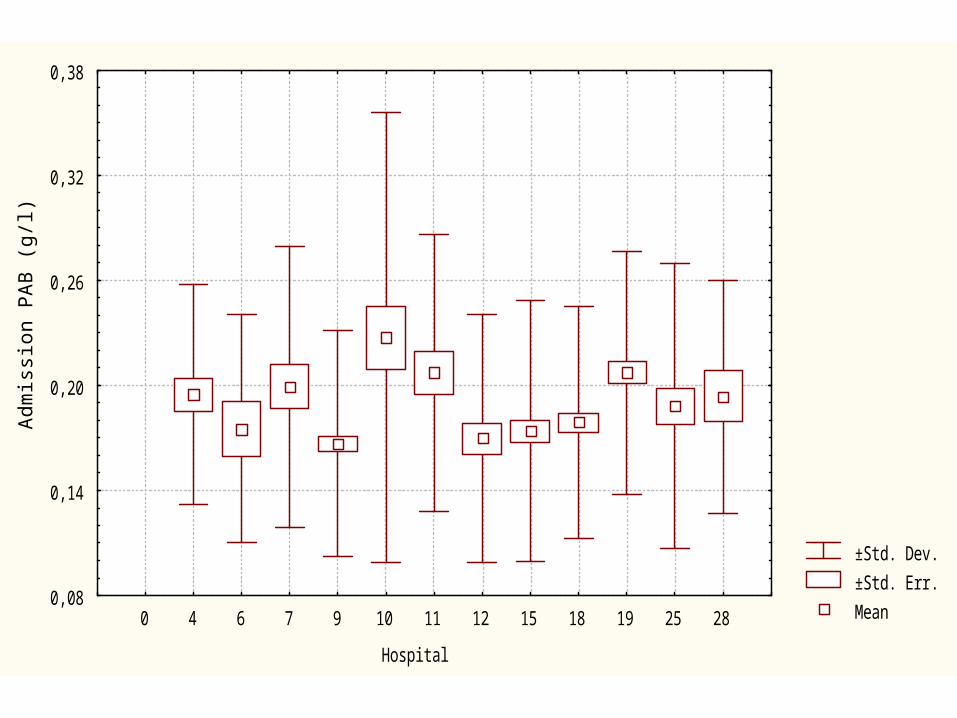
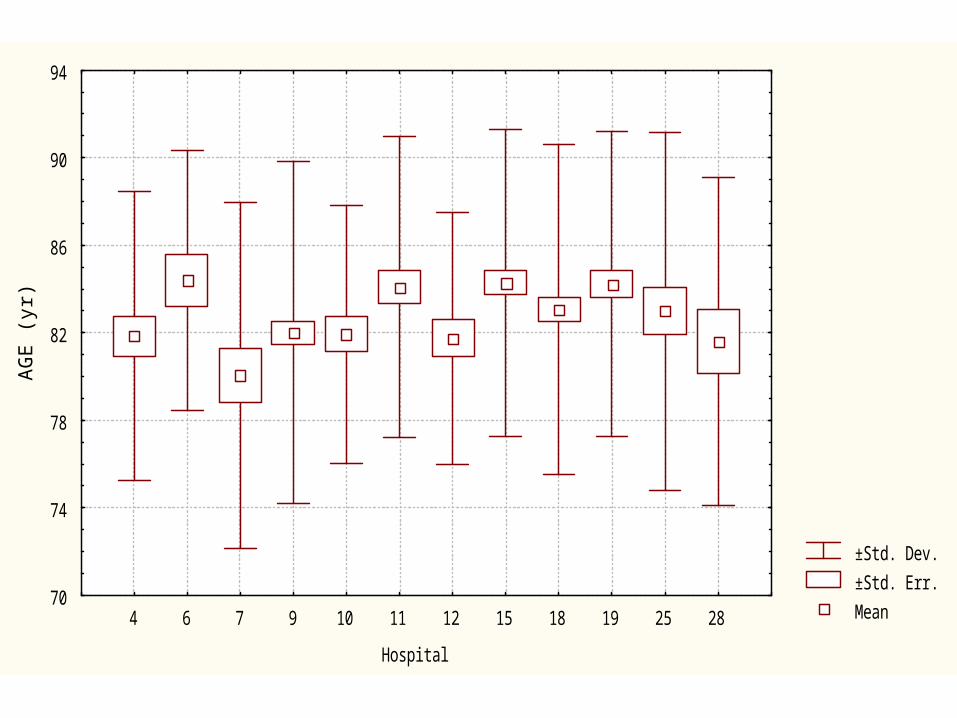
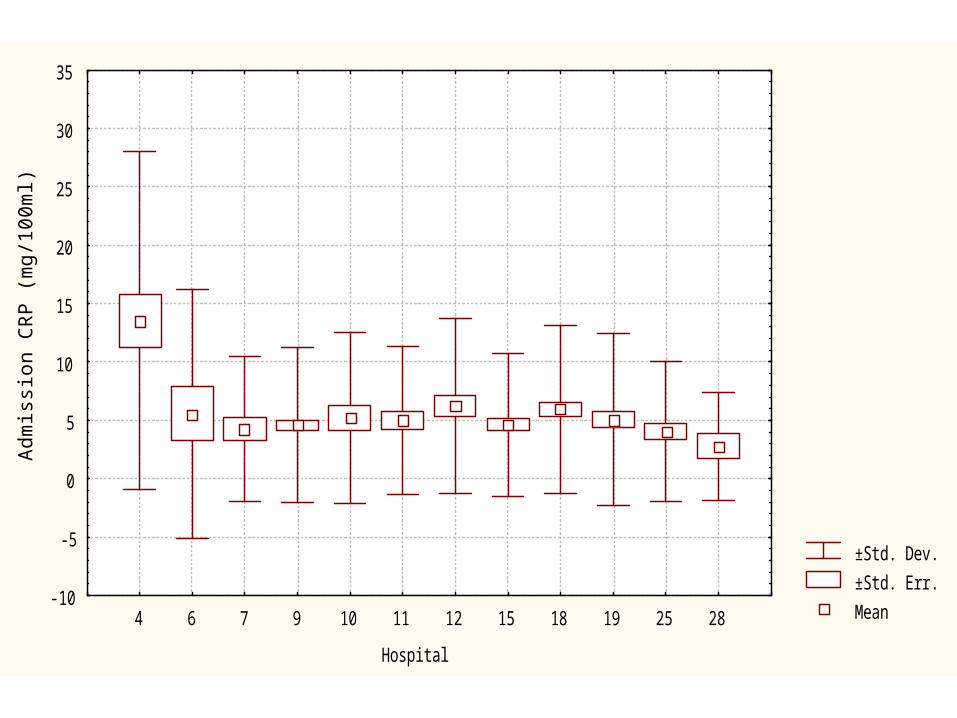
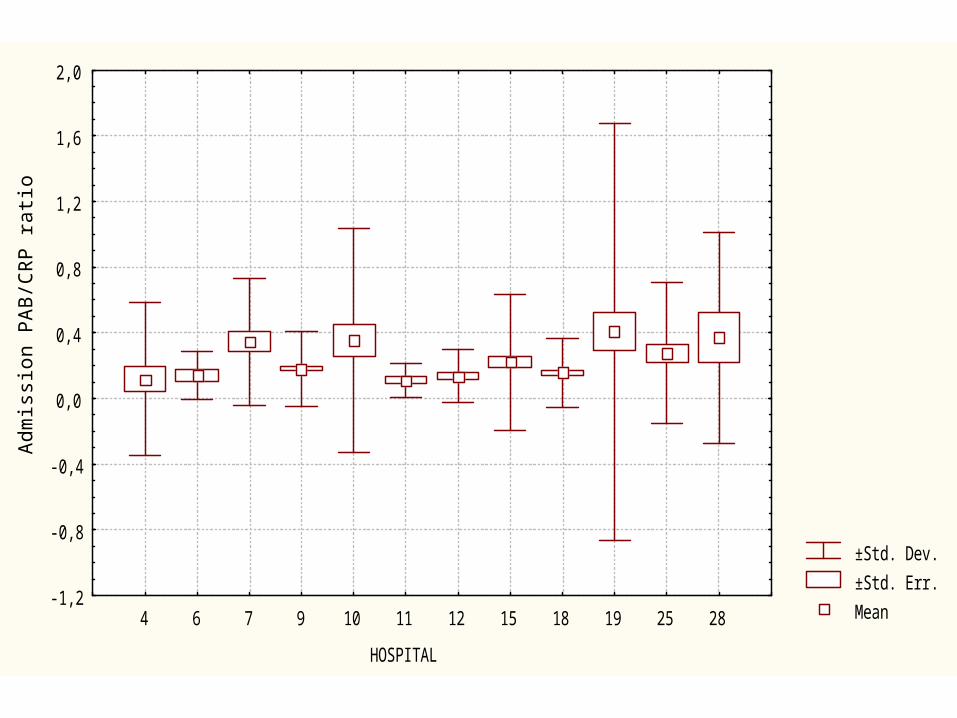
Hospital comparisons
±Std. Dev.
±Std. Err.
Mean
Hospital
MN
A (
poin
ts)
4
8
12
16
20
24
28
4 6 7 9 10 11 12 15 18 19 25 28
±Std. Dev.
±Std. Err.
Mean
Hospital
Ad
mis
sio
n P
AB
(g
/l)
0,08
0,14
0,20
0,26
0,32
0,38
0 4 6 7 9 10 11 12 15 18 19 25 28
±Std. Dev.
±Std. Err.
Mean
Hospital
AG
E (
yr)
70
74
78
82
86
90
94
4 6 7 9 10 11 12 15 18 19 25 28
±Std. Dev.
±Std. Err.
Mean
Hospital
Ad
mis
sio
n C
RP
(m
g/1
00
ml)
-10
-5
0
5
10
15
20
25
30
35
4 6 7 9 10 11 12 15 18 19 25 28

±Std. Dev.
±Std. Err.
Mean
HOSPITAL
Ad
mis
sio
n L
ymp
ho
cyte
s co
un
t (p
er
mm3
)
200
600
1000
1400
1800
2200
2600
4 6 7 9 10 11 12 15 18 19 25 28

±Std. Dev.
±Std. Err.
Mean
HOSPITAL
STA
Y (
da
ys)
-10
10
30
50
70
90
4 6 7 9 10 11 12 15 18 19 25 28
±Std. Dev.
±Std. Err.
Mean
HOSPITAL
Ad
mis
sio
n P
AB
/CR
P r
atio
-1,2
-0,8
-0,4
0,0
0,4
0,8
1,2
1,6
2,0
4 6 7 9 10 11 12 15 18 19 25 28
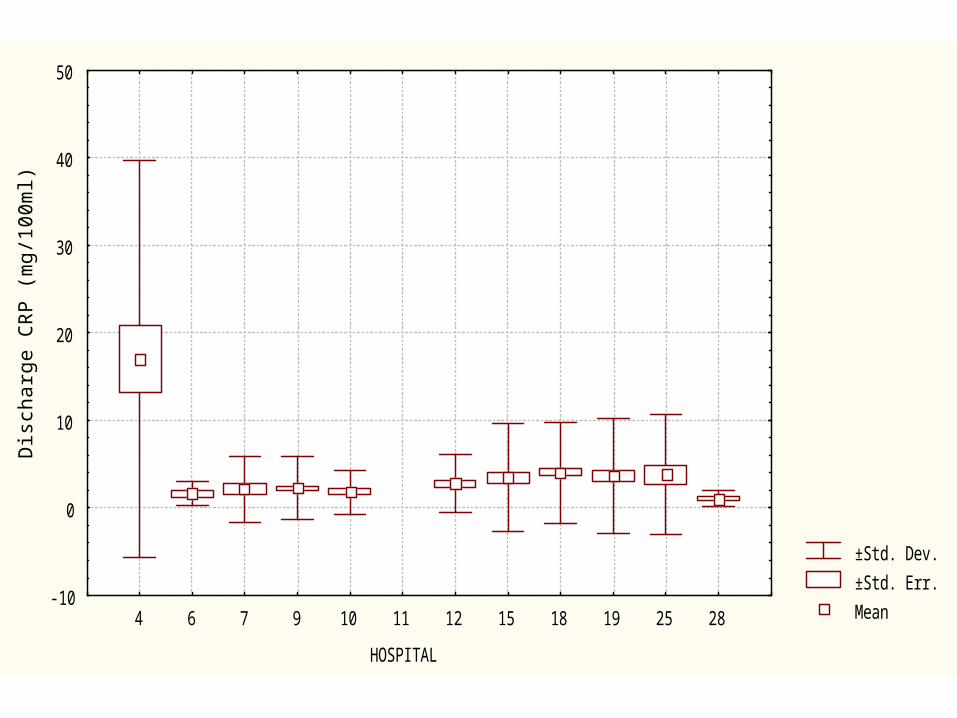
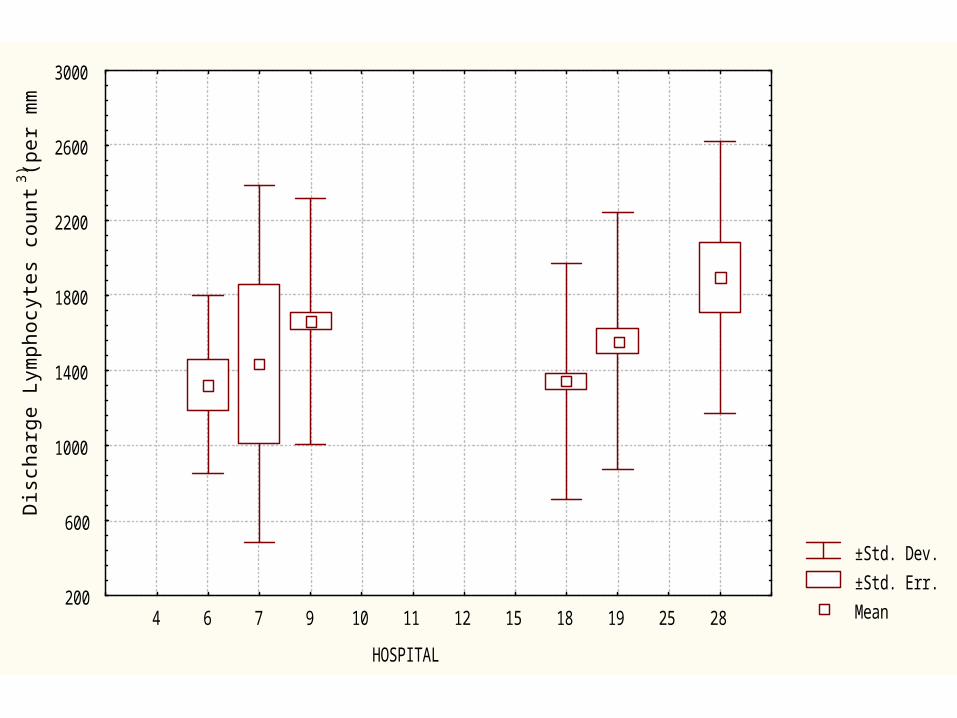
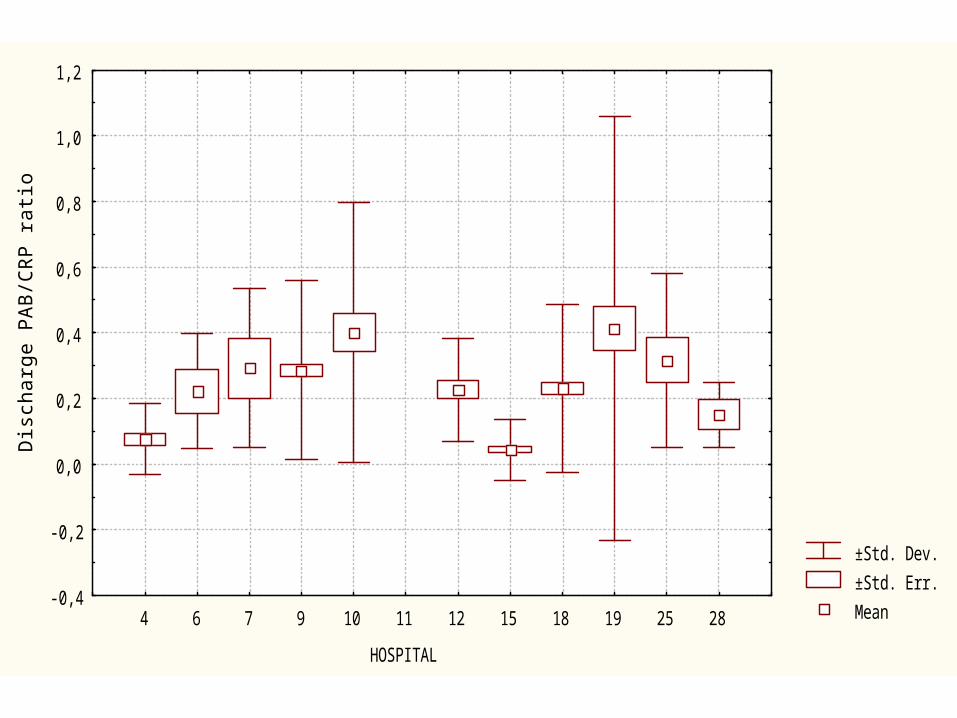
Discharge parameters

±Std. Dev.
±Std. Err.
Mean
HOSPITAL
Dis
cha
rge
PA
B (
g/l)
-0,05
0,00
0,05
0,10
0,15
0,20
0,25
0,30
0,35
0,40
4 6 7 9 10 11 12 15 18 19 25 28
±Std. Dev.
±Std. Err.
Mean
HOSPITAL
Dis
cha
rge
CR
P (
mg
/10
0m
l)
-10
0
10
20
30
40
50
4 6 7 9 10 11 12 15 18 19 25 28
±Std. Dev.
±Std. Err.
Mean
HOSPITAL
Dis
cha
rge
Lym
ph
ocy
tes
cou
nt
(pe
r m
m3)
200
600
1000
1400
1800
2200
2600
3000
4 6 7 9 10 11 12 15 18 19 25 28
±Std. Dev.
±Std. Err.
Mean
HOSPITAL
Dis
cha
rge
PA
B/C
RP
ra
tio
-0,4
-0,2
0,0
0,2
0,4
0,6
0,8
1,0
1,2
4 6 7 9 10 11 12 15 18 19 25 28
Parameters variations
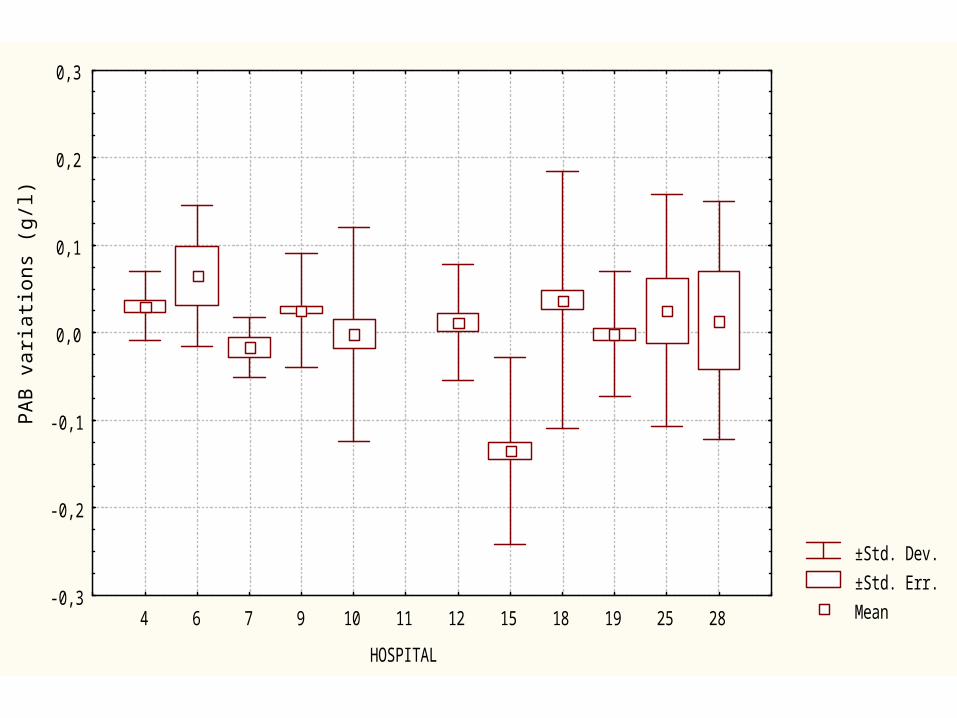
±Std. Dev.
±Std. Err.
Mean
HOSPITAL
PA
B v
ari
atio
ns
(g/l)
-0,3
-0,2
-0,1
0,0
0,1
0,2
0,3
4 6 7 9 10 11 12 15 18 19 25 28
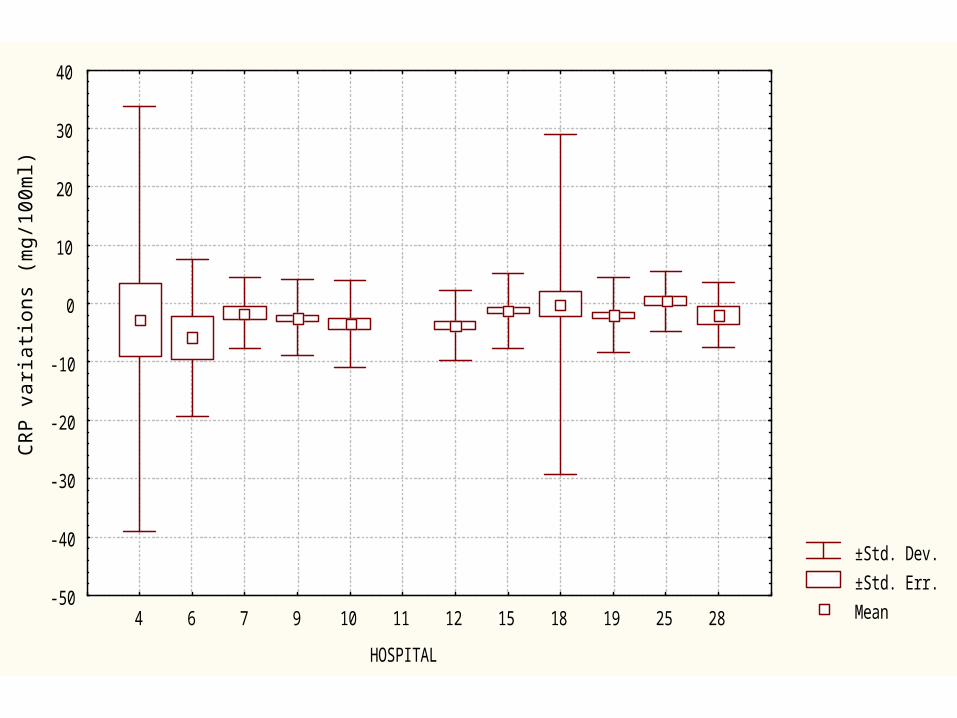
±Std. Dev.
±Std. Err.
Mean
HOSPITAL
CR
P v
ari
atio
ns
(mg
/10
0m
l)
-50
-40
-30
-20
-10
0
10
20
30
40
4 6 7 9 10 11 12 15 18 19 25 28
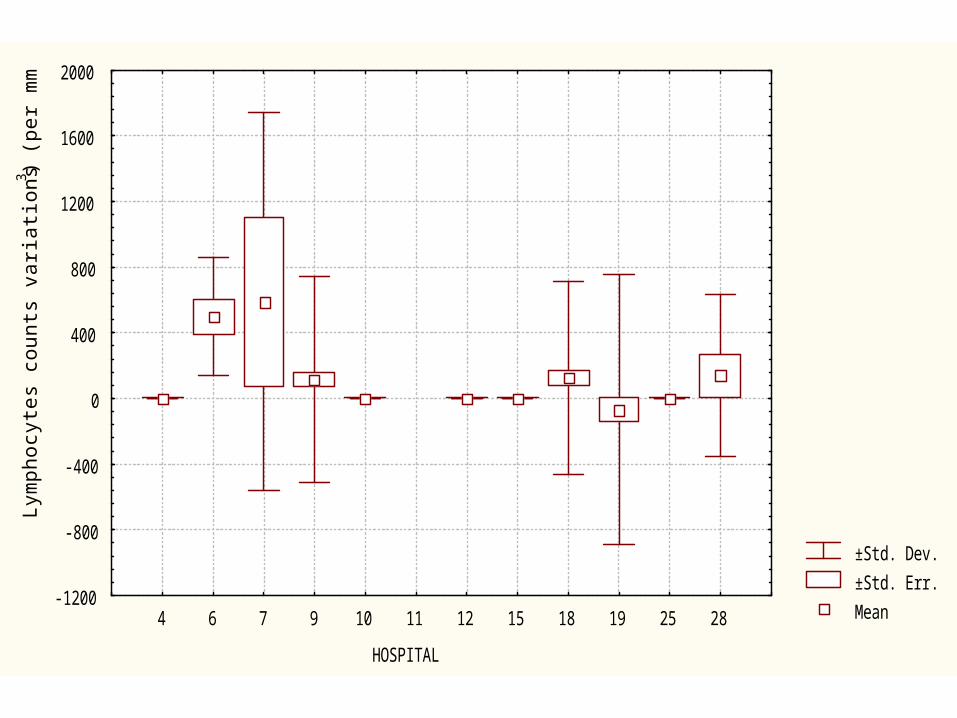
±Std. Dev.
±Std. Err.
Mean
HOSPITAL
Lym
ph
ocy
tes
cou
nts
va
ria
tion
s (p
er
mm3 )
-1200
-800
-400
0
400
800
1200
1600
2000
4 6 7 9 10 11 12 15 18 19 25 28
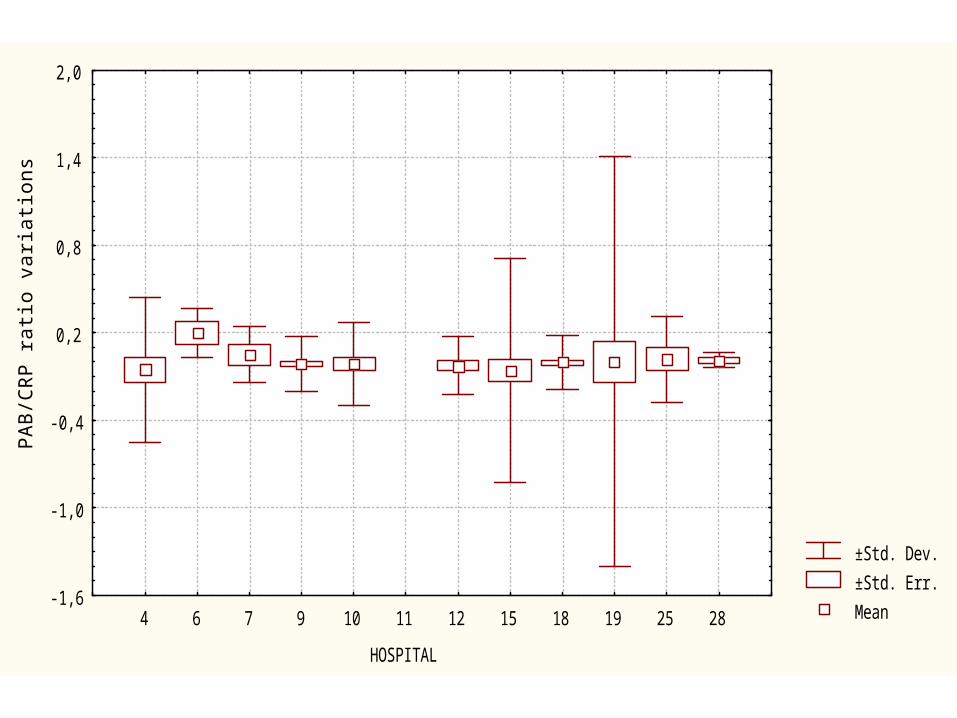
±Std. Dev.
±Std. Err.
Mean
HOSPITAL
PA
B/C
RP
ra
tio v
ari
atio
ns
-1,6
-1,0
-0,4
0,2
0,8
1,4
2,0
4 6 7 9 10 11 12 15 18 19 25 28

Conclusions
Conclusions
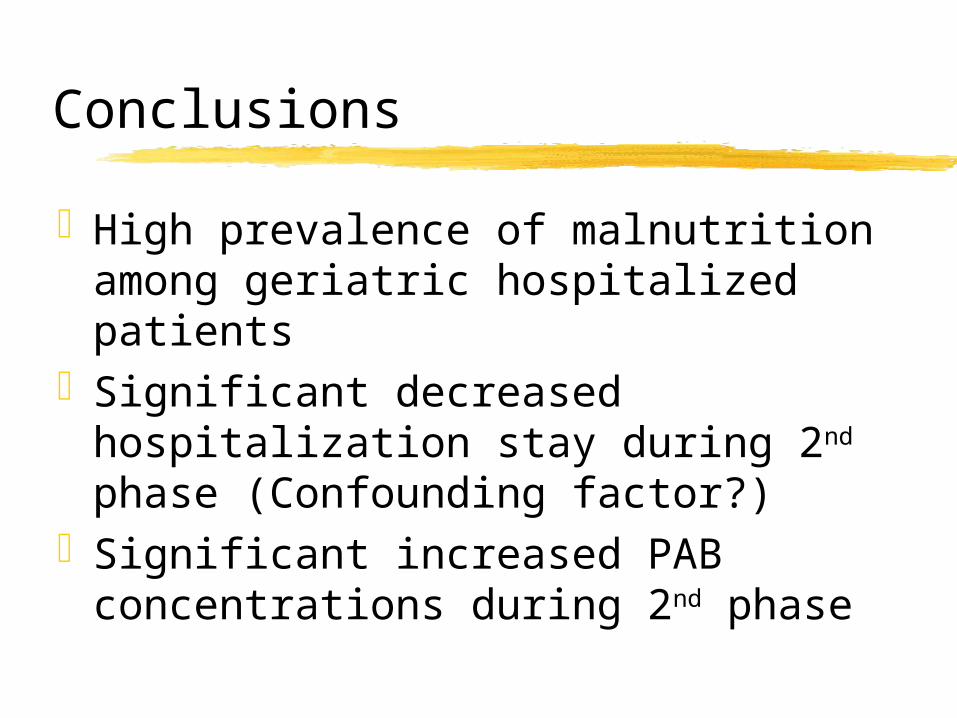
High prevalence of malnutrition among geriatric hospitalized patients
Significant decreased hospitalization stay during 2nd phase (Confounding factor?)
Significant increased PAB concentrations during 2nd phase
Conclusions
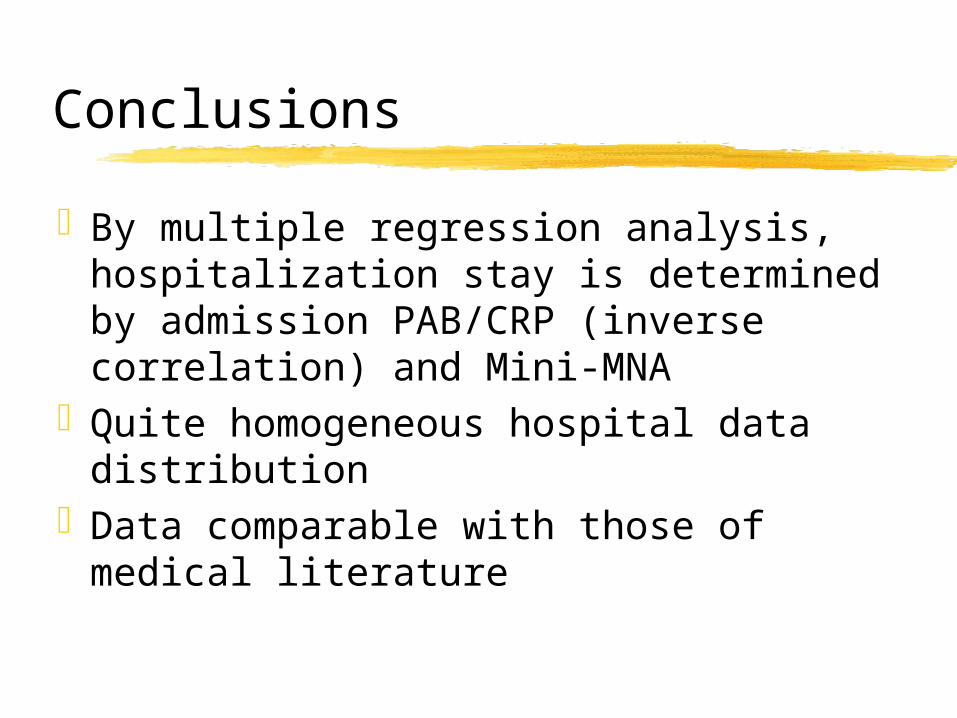
By multiple regression analysis, hospitalization stay is determined by admission PAB/CRP (inverse correlation) and Mini-MNA
Quite homogeneous hospital data distribution
Data comparable with those of medical literature
![Invitation to Bid Digital Radio System #1920-006.../ v À ] ] } v } ] ] P ] o Z ] } ^ Ç u } ( / µ W D Z î U î ì î ì z z z z z z z z z z z z z z z z z z z z z z z z z z z z z](https://img.pdfslide.us/doc/110x75/5e9191fb6404a73f3b6c3c72/invitation-to-bid-digital-radio-system-1920-006-v-v-p-o.jpg)
![Home | Volusia County Schools...î ó X , ^ zKhZ ,/> s Z E Z d /E M z ^ EK / ( Ç U ] v Á Z P M z z z z z z z z z z z z z z z z z z z z z z z z z z î ô X , ^ zKhZ ,/> s Z dd E &>KZ](https://img.pdfslide.us/doc/110x75/5f982e47f95c66613d430406/home-volusia-county-schools-x-zkhz-s-z-e-z-d-e-m-z-ek.jpg)